Attached files
| file | filename |
|---|---|
| 8-K - FORM 8-K - PNC FINANCIAL SERVICES GROUP, INC. | d331502d8k.htm |
| EX-99.1 - FINANCIAL SUPPLEMENT (UNAUDITED) FOR FIRST QUARTER 2012 - PNC FINANCIAL SERVICES GROUP, INC. | d331502dex991.htm |
 The PNC
Financial Services Group, Inc. First Quarter 2012
Earnings Conference Call
April 18, 2012
Exhibit 99.2 |
 2
Cautionary Statement Regarding Forward-Looking
Information and Adjusted Information
This presentation includes “snapshot” information about PNC used by way of
illustration. It is not intended as a full business or financial review and
should be viewed in the context of all of the information made available by PNC in its SEC
filings. The presentation also contains forward-looking statements regarding
our outlook for earnings, revenues, expenses, capital levels and ratios, liquidity levels, asset levels, asset quality and other
matters regarding or affecting PNC and its future business and operations.
Forward-looking statements are necessarily subject to numerous assumptions, risks
and uncertainties, which change over time. The forward-looking statements in this presentation are qualified by the factors affecting
forward-looking statements identified in the more detailed Cautionary Statement
included in the Appendix, which is included in the version of the presentation materials posted on our corporate website at
www.pnc.com/investorevents. We provide greater detail regarding some of these factors in
our 2011 Form 10-K as amended, including in the Risk Factors and Risk Management
sections and in the Legal Proceedings and Commitments and Guarantees Notes of the Notes to Consolidated Financial
Statements in that report, and in our subsequent SEC filings. Our forward-looking
statements may also be subject to other risks and uncertainties, including those we may
discuss in this presentation or in SEC filings, accessible on the SEC’s website at www.sec.gov and on PNC’s corporate website
at www.pnc.com/secfilings. We have included web addresses in this presentation as
inactive textual references only. Information on these websites is not part of
this presentation. Future events or circumstances may change our outlook and may also affect the nature of the
assumptions, risks and uncertainties to which our forward-looking statements are
subject. Forward-looking statements in this presentation speak only as of the date of this presentation. We do not
assume any duty and do not undertake to update those statements. Actual results or
future events could differ, possibly materially, from those anticipated in
forward-looking statements, as well as from historical performance.
In this presentation, we sometimes refer to adjusted results to help illustrate the impact of
certain types of items. This information supplements our results as reported in
accordance with GAAP and should not be viewed in isolation from, or as a substitute for, our GAAP results. We believe that this
additional information and the reconciliations we provide may be useful to investors,
analysts, regulators and others as they evaluate the impact of these respective items
on our results for the periods presented due to the extent to which the items may not be indicative of our ongoing operations.
We may also provide information on pretax pre-provision earnings (total revenue less
noninterest expense), a non-GAAP measure that we believe is useful as a tool to
help evaluate our earnings created by operating leverage. Where applicable, we provide GAAP reconciliations for such additional
information, including in the Appendix and on our corporate website at
www.pnc.com/investorevents. In certain discussions, we may also provide information on yields and margins for all
interest-earning assets calculated using net interest income on a
taxable-equivalent basis by increasing the interest income earned on tax-exempt assets
to make it fully equivalent to interest income earned on taxable investments. We
believe this adjustment may be useful when comparing yields and margins for all earning assets. We may also use
annualized, proforma, estimated or third party numbers for illustrative or comparative
purposes only. These may not reflect actual results. This presentation may also include discussion of other non-GAAP financial measures,
which, to the extent not so qualified therein or in the Appendix, is qualified by GAAP
reconciliation information available on our corporate website at www.pnc.com under “About PNC–Investor Relations.”
|
 3
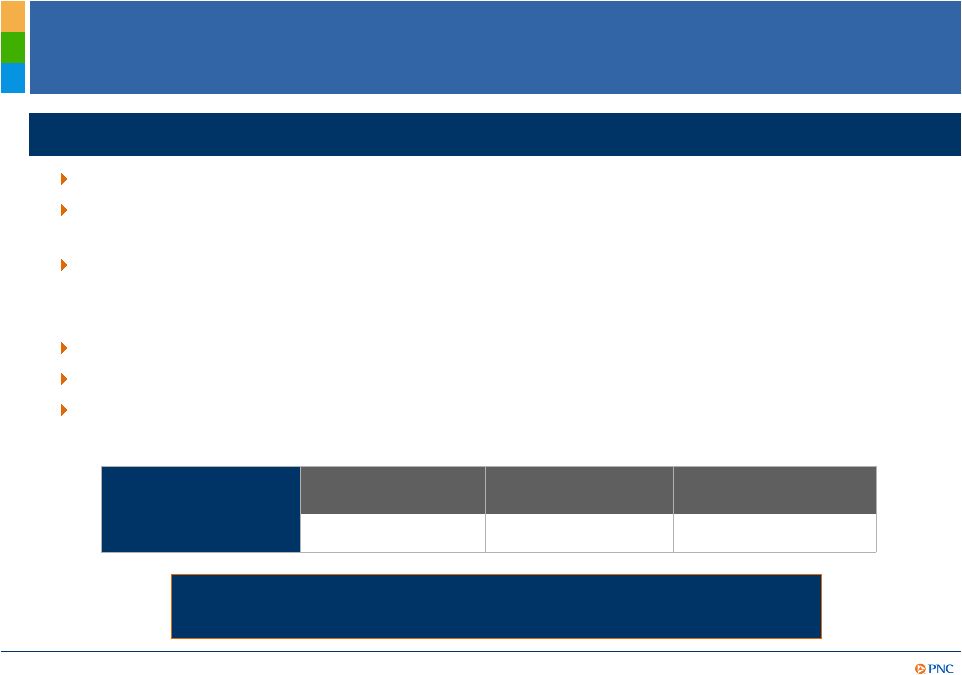
Significant 1Q12 Achievements
PNC Is Positioned to Deliver Even Greater Shareholder Value.
PNC Is Positioned to Deliver Even Greater Shareholder Value.
1Q12 financial
summary
Net income
Diluted EPS from
net income
Return on
average assets
$811 million
$1.44
1.16%
Delivered excellent financial results driven by customer, loan and revenue growth
Successfully
completed
conversion
of
RBC
Bank
(USA)
–
integration
costs
of
$0.18
per
diluted common share¹
Capital actions reflect balance sheet strength
–
Increased
quarterly
common
stock
dividend
14%
to
$0.40
per
share
for
2Q12
–
Plan to repurchase up to $250 million of common stock in 2012²
Grew commercial and consumer loans
Remained core-funded and liquid
Stable overall credit quality and disciplined expense management
1Q12 highlights
(1) Additional information is provided in Appendix. (2) Subject to factors such as market and
general economic conditions, economic and regulatory capital conditions, alternative
uses of capital, regulatory and contractual limitations, and the potential impact on credit ratings. |
 4
RBC Bank (USA): Closed, Converted and Accretive
Expanded into faster growing
regions with attractive market
demographics while adding:
–
900,000 customers
–
Over 400 branches
–
Approximately $15 billion loans
–
Approximately $18 billion
deposits
Attractive pricing
–
Immediately accretive to 1Q12
earnings¹
–
Acquired for less than tangible
book value
(1) Excluding integration costs. (2) Source: Nielsen annual population forecasts based on five
year projections from 2011 to 2016. (3) Moody’s annual forecast based on real GDP
(2005 chained dollars) five year projections from December 2011 to December 2016. (4)
IXI Services December 2010. Net worth is the household’s total investable assets excluding primary residence.
Five year growth
forecast (CAGR):
HH >1MM
Net Worth
4
Annual
population²
Annual
GDP³
Atlanta
2.0%
4.0%
65,296
Charlotte
2.2%
3.7%
21,697
Raleigh
2.7%
3.8%
14,246
Mobile
0.3%
3.4%
2,035
Birmingham
0.6%
3.6%
10,559
National Average
0.8%
3.2%
N/A
Attractive market demographics |
 5
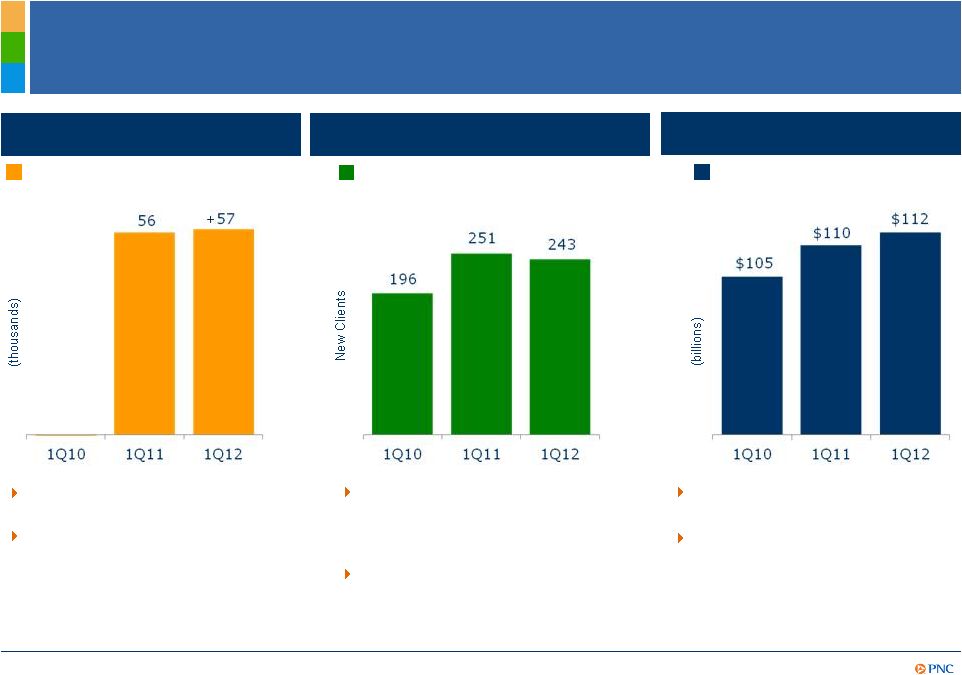
Focused on Growing Client Relationships
Asset Management Group
Retail Banking
Corporate & Institutional Banking
Discretionary assets under
management³
1Q12 referral sales
up 38% vs.
1Q11
Total sales have increased by 35%
for 1Q12 vs. 1Q11
Growth markets (Florida, Milwaukee,
Chicago, St. Louis) combined added
24% more new clients compared to
1Q11
All legacy C&IB business segments
ahead of 1Q11 sales
61% of checking accounts opened in
1Q12 were relationship accounts
Active online bill payment customers
increased 13% from 1Q11, 5% from
4Q11
Corporate Banking new primary
clients²
4
5
Net organic checking relationship
growth¹
(11)
+
(1) Net organic checking relationship growth refers to consumer and small business accounts
exclusive of accounts acquired through acquisition. (2) A Corporate Banking
primary client is defined as a corporate banking relationship with annual revenue generation of $50,000 or more or, within corporate
banking, a commercial banking client relationship with annual revenue generation of $10,000 or
more. (3) Discretionary assets under management are assets over which we have
sole or shared investment authority for our customers/clients. (4) Relationship checking accounts refer to accounts with a
committed balance level of self service accounts with lower cost of servicing. (5) New client
sales referred to AMG by Retail banking or C&IB. |
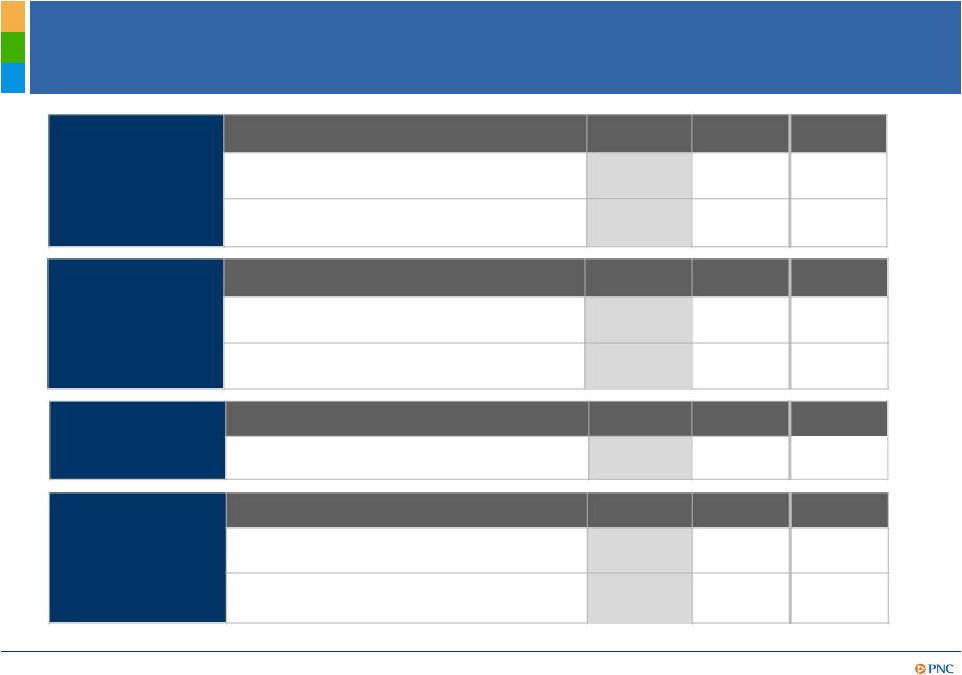 6
Strong Financial Performance
(1) Tier 1 common capital ratio is period-end Tier 1 common capital divided by
period-end risk weighted assets and is estimated for 1Q12. (2) Return on Tier 1
common capital is calculated as annualized net income divided by period-end Tier 1 common capital and is estimated
for 1Q12. Further information is provided in the Appendix.
$159
$149
$206
$188
$182
Performance
Measures
1Q12
4Q11
Return on average assets
1.16%
0.72%
1.29%
Return on Tier 1 common capital
14.0%
8.2%
15.4%
Strong Earnings
Net income
$811
$493
$832
Earnings per diluted common share
$1.44
$.85
$1.57
Capital Adequacy
1Q12
4Q11
1Q11
Tier 1 common capital ratio
9.3%
10.3%
10.3%
1,2
1
1Q11
$176
1Q12
4Q11
1Q11
Balance Sheet
Growth
Loans
Deposits
1Q12
4Q11
1Q11
($ billions)
($ billions)
($ millions) |
 7
A Higher Quality, Differentiated Balance Sheet
Change from:
Category (billions)
Mar. 31, 2012
Dec. 31, 2011
Total investment securities
$64.6
$3.9
Commercial lending
100.6
12.3
Consumer lending
75.6
4.9
Total loans
176.2
17.2
Other assets
55.1
3.6
Total assets
$295.9
$24.7
Transaction deposits
$164.6
$16.9
Retail CDs
29.3
(0.2)
Other
12.2
1.5
Total deposits
206.1
18.2
Borrowed funds, other
54.8
5.5
Shareholders’
equity
35.0
1.0
Total liabilities and equity
$295.9
$24.7
Loans increased $17 billion or 11% from
4Q11 driven by organic commercial loan
growth and approximately $15 billion
from RBC Bank (USA) transaction
Overall credit quality remained stable
Transaction deposits increased nearly
$17 billion or 12% from 4Q11 reflecting
increased commercial and consumer
liquidity and $10 billion from RBC Bank
(USA) acquisition
Retail CDs declined $.2 billion from
4Q11, reflecting expected run-off of $4.2
billion of PNC’s higher cost CDs, offset
by $4 billion of RBC Bank (USA) CDs
Equity increased $1 billion primarily due
to retained earnings
1Q12 highlights |
 Loan Growth
Driving Net Interest Income (millions)
1Q12
4Q11
3Q11
2Q11
1Q11
Interest income -
loans
$1,951
$1,902
$1,904
$1,905
$1,884
Total interest income
2,597
2,534
2,530
2,547
2,583
Total interest expense
306
335
355
397
407
Total net interest income
$2,291
$2,199
$2,175
$2,150
$2,176
1Q12 highlights
Average earning assets grew by
$9 billion or 4% from 4Q11 and
6% from 1Q11 with RBC Bank
(USA) contributing $4 billion
Net interest margin remained
relatively stable
Total net interest income grew 4%
from 4Q11 and 5% from 1Q11;
included $91 million from RBC
Bank (USA) acquisition
Balance sheet positioned to
benefit from an increase in rates
(1) Calculated as annualized taxable-equivalent net interest income divided by average
earning assets. See Appendix for additional information.
1Q12
4Q11
3Q11
2Q11
1Q11
Average interest earning
assets (in billions)
$237.7
$228.4
$224.1
$220.7
$224.1
Average yields/rate:
Interest-earning assets
4.41%
4.44%
4.52%
4.64%
4.67%
Interest-bearing liabilities
.70
.80
.86
.95
.95
Interest rate spread
3.71
3.64
3.66
3.69
3.72
Net interest margin
1
3.90%
3.86%
3.89%
3.93%
3.94%
8
–
Higher loan balances
–
Lower funding costs
–
Purchase accounting accretion
remained stable |
 9
Client Growth and Sales Driving Noninterest Revenue
1Q12 highlights
(millions)
1Q12
4Q11
3Q11
2Q11
1Q11
Asset management¹
$284
$250
$287
$288
$263
Consumer services
264
269
330
333
311
Corporate services²
232
266
187
228
217
Residential
mortgage
230
157
198
163
195
Deposit service
charges
127
140
140
131
123
Client fee income
$1,137
$1,082
$1,142
$1,143
$1,109
Net gains on sales of
securities
less net OTTI
19
18
33
43
3
Other
285
250
194
266
343
Total noninterest
income
$1,441
$1,350
$1,369
$1,452
$1,455
(1) Asset management includes the Asset Management Group and BlackRock. (2) Corporate services
include impairment charges/recoveries related
to
commercial
mortgage
servicing
rights.
Noninterest income increased 7%
from 4Q11
Asset management increased 14%
due to improved equity markets
Corporate services declined
primarily due to lower commercial
mortgage banking revenue and
merger and acquisition advisory
fees
Residential mortgage increased
primarily due to higher MSR
hedging gains and loan sales
revenue
Consumer services and deposit
service charges declined primarily
due to seasonally lower transaction
volumes
Other increased largely as a result
of higher revenue from equity
investments
Noninterest income
increased 7% |
 10
Disciplined Expense Management While Investing for
Growth
(millions)
1Q12
4Q11
3Q11
2Q11
1Q11
Core :
Personnel
$1,067
$1,050
$948
$975
$989
Occupancy
178
197
171
176
193
Equipment
168
173
159
158
167
Marketing
54
73
70
61
40
Other
843
1,000
784
801
681
Total core noninterest
expense
$2,310
$2,493
$2,132
$2,171
$2,070
Selected items:
Integration costs
145
28
8
5
1
Trust preferred securities
redemption charges
-
198
-
-
-
Total noninterest
expense
$2,455
$2,719
$2,140
$2,176
$2,071
1Q12 highlights
Total noninterest expense declined
$264 million
Core noninterest expense
impacted by:
–
RBC Bank (USA) operating
costs of $40 million
–
Residential mortgage
foreclosure-related expenses of
$38 million ($240 million in
4Q11)
–
Additions to legal reserves of
$72 million
(1) Core noninterest expense items do not include the impact of integration costs and trust
preferred securities redemption charges, which are listed separately in the table
above, but do include the impact of RBC Bank (USA) operating expenses. See the Appendix for the impact
of integration costs and trust preferred securities redemption charges for unamortized
discount on each category of noninterest expense. 1
1
Progressing well towards
continuous improvement goals |
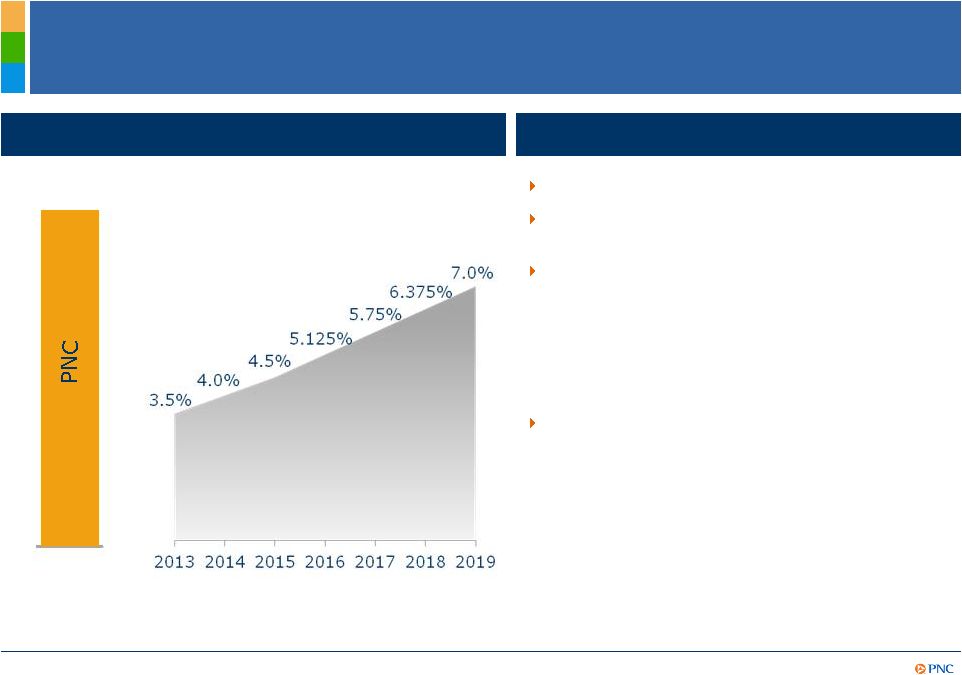 11
Strong Capital and Liquidity Position
1Q12 highlights
Basel III Tier 1 common ratio
Basel III requirements
8.0% -
8.5%
2013 Target
Basel III
Basel I Tier 1 common ratio of 9.3%
Target Basel III Tier 1 common ratio estimated to
be between 8.0-8.5% by year-end 2013
Capital priorities:
–
Build capital to support client growth and
business investment
–
Maintain appropriate capital in light of
economic uncertainty
–
Return excess capital to shareholders
Strong liquidity position
–
Loan-to-deposit ratio of 85%
–
Parent company two year liquidity coverage
4
of 114%
(1) Proforma estimate is based on PNC’s estimated Basel I Tier 1 common ratio of 9.3% as
of 3/31/12, adjusted by 1.6% to reflect projected retained earnings using First Call 2012 and 2013 estimates and the current
dividend payout, and a decrease of 2.5%-3.0% primarily representing the estimated increase
in risk weighted assets due to Basel II methodology regarding credit, operational and market risks. This includes the assumed
treatment of our investment in BlackRock and sub-investment grade securities (assuming no
AOCI double counting) in accordance with Basel II. This estimate is subject to further regulatory guidance and clarity, and is
based on the phase-in (beginning in 2013) of the Basel III framework in effect as of
3/31/12. (2) Regulatory requirements are inclusive of the capital conservation buffer and subject to further regulatory guidance and
clarity. (3) Estimated. (4) Parent company liquidity coverage defined as liquid assets divided
by funding obligations within a two year period.
1
2
3
1 |
 12
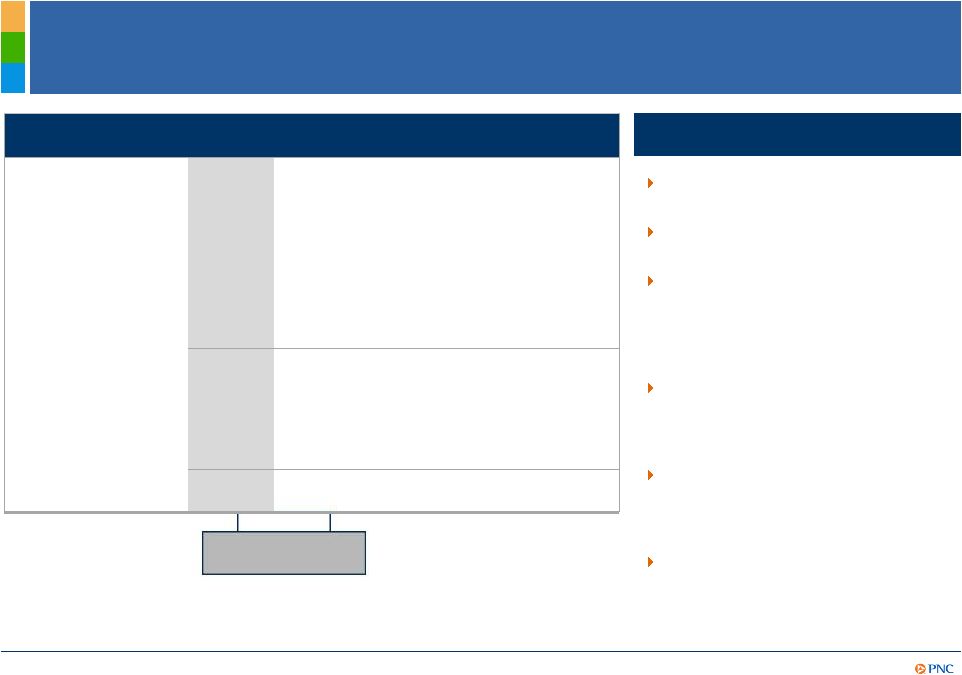
Improving Outlook
1
–
Full Year 2012 vs. 2011
(1)
Refer
to
the
Cautionary
Statement
in
the
Appendix,
including
assumptions.
(2)
Reflects
combined
PNC
and
RBC
Bank
(USA).
(3)
Estimated
change for 2012 is based on comparable 2011 results. (4) Bold items reflect revision to
previous guidance. (5) Excluding legal and regulatory related contingencies,
integration costs and capital actions related to TPS redemptions for 2011 and 2012. (6) Excluding legal and regulatory
related contingencies.
PNC is Positioned to Deliver Strong Results in 2012.
PNC is Positioned to Deliver Strong Results in 2012.
Estimated % Change³
Combined
2
Balance sheet
Loans
Increase mid to high teens
Total revenue
Increase
high
single
digits
4
Combined
2
Income
statement
Net interest income
Increase
high
single
digits
4
Noninterest income
Increase mid single digits
Noninterest expense
Increase
mid
to
high
single
digits
4,5
Loan loss provision
Improving
4,6
Strong balance sheet and revenue growth expected to drive positive
operating leverage
Credit costs expected to improve
RBC Bank (USA) acquisition expected to be accretive in 2012 |
 13
Cautionary Statement Regarding Forward-Looking
Information
Appendix
This presentation includes “snapshot” information about PNC used by way of
illustration and is not intended as a full business or financial review. It
should not be viewed in isolation but rather in the context of all of the information made available by PNC in its SEC filings.
We also make statements in this presentation, and we may from time to time make other
statements, regarding our outlook for earnings, revenues, expenses, capital levels and
ratios, liquidity levels, asset levels, asset quality and other matters regarding or affecting PNC and its
future business and operations that are forward-looking statements within the meaning of
the Private Securities Litigation Reform Act. Forward- looking statements are
typically identified by words such as “believe,” “plan,” “expect,” “anticipate,” “see,” “look,” “intend,” “outlook,” “project,”
“forecast,” “estimate,” “goal,” “will,”
“should” and other similar words and expressions. Forward-looking statements are subject to numerous
assumptions, risks and uncertainties, which change over time.
Forward-looking statements speak only as of the date made. We do not assume any duty
and do not undertake to update forward-looking statements. Actual results or
future events could differ, possibly materially, from those anticipated in forward-looking statements, as well as from
historical performance.
Our forward-looking statements are subject to the following principal risks and
uncertainties. Our businesses, financial results and balance sheet values are affected by business and
economic conditions, including the following::
o
Changes in interest rates and valuations in debt, equity and other financial markets.
o
Disruptions in the liquidity and other functioning of U.S. and global financial
markets.
o
The impact on financial markets and the economy of the downgrade by Standard & Poor’s
of U.S. Treasury obligations and other U.S. government-backed debt, as well as
issues surrounding the level of U.S. and European government debt and concerns regarding the
creditworthiness of certain sovereign governments, supranationals and financial institutions
in Europe.
o
Actions by Federal Reserve, U.S. Treasury and other government agencies, including those that
impact money supply and market interest rates.
o
Changes in customers’, suppliers’ and other counterparties’ performance and
creditworthiness.
o
Slowing or failure of the current moderate economic recovery.
o
Continued effects of aftermath of recessionary conditions and uneven spread of positive
impacts of recovery on the economy and our counterparties, including adverse impacts on
levels of unemployment, loan utilization rates, delinquencies, defaults and counterparty ability
to meet credit and other obligations.
o
Changes in customer preferences and behavior, whether due to changing business and economic
conditions, legislative and regulatory initiatives, or other factors.
Our forward-looking financial statements are subject to the risk that economic and
financial market conditions will be substantially different than we are currently
expecting. These statements are based on our current view that the moderate economic expansion will persist in 2012 and
interest rates will remain very low.
|
 14
Cautionary Statement Regarding Forward-Looking
Information (continued)
Appendix
Legal and regulatory developments could have an impact on our ability to operate our
businesses, financial condition, results of operations, competitive position,
reputation, or pursuit of attractive acquisition opportunities. Reputational impacts could affect matters such as business
generation and retention, liquidity, funding, and ability to attract and retain
management. These developments could include:
o
Changes resulting from legislative and regulatory reforms, including major reform of the
regulatory oversight structure of the financial services industry and changes to laws
and regulations involving tax, pension, bankruptcy, consumer protection, and other industry
aspects, and changes in accounting policies and principles. We will be impacted by
extensive reforms provided for in the Dodd-Frank Wall Street Reform and Consumer
Protection Act and otherwise growing out of the recent financial crisis, the precise nature, extent and
timing of which, and their impact on us, remains uncertain.
o
Changes to regulations governing bank capital and liquidity standards, including due to the
Dodd-Frank Act and to Basel III initiatives.
o
Unfavorable resolution of legal proceedings or other claims and regulatory and other
governmental investigations or other inquiries. In addition to matters relating
to PNC’s business and activities, such matters may include proceedings, claims, investigations, or inquiries
relating to pre-acquisition business and activities of acquired companies, such as
National City. These matters may result in monetary judgments or settlements or
other remedies, including fines, penalties, restitution or alterations in our business practices and in
additional expenses and collateral costs, and may cause reputational harm to PNC.
o
Results of the regulatory examination and supervision process, including our failure to
satisfy requirements of agreements with governmental agencies.
o
Impact on business and operating results of any costs associated with obtaining rights in
intellectual property claimed by others and of adequacy of our intellectual property
protection in general.
Business and operating results are affected by our ability to identify and effectively
manage risks inherent in our businesses, including, where appropriate, through
effective use of third-party insurance, derivatives, and capital management techniques, and to meet evolving
regulatory capital standards. In particular, our results currently depend on our ability
to manage elevated levels of impaired assets. Business and operating results
also include impacts relating to our equity interest in BlackRock, Inc. and rely to a significant extent on
information provided to us by BlackRock. Risks and uncertainties that could affect
BlackRock are discussed in more detail by BlackRock in its SEC filings.
Our acquisition of RBC Bank (USA) presents us with risks and uncertainties related both
to the acquisition itself and to the integration of the acquired businesses into PNC,
including: o
Anticipated benefits of the transaction, including cost savings and strategic gains, may be
significantly harder or take longer to achieve than expected or may not be achieved in
their entirety as a result of unexpected factors or events.
o
Our ability to achieve anticipated results from this transaction is dependent also on the
extent of credit losses in the acquired loan portfolios and the extent of deposit
attrition, in part related to the state of economic and financial markets. Also, litigation and
regulatory and other governmental investigations that may be filed or commenced, as a result
of this transaction or otherwise, could impact the timing or realization of anticipated
benefits to PNC.
o
Integration of RBC Bank (USA)’s business and operations into PNC may take longer than
anticipated or be substantially more costly than anticipated or have unanticipated
adverse results relating to RBC Bank (USA)’s or PNC’s existing businesses. PNC’s ability to
integrate RBC Bank (USA) successfully may be adversely affected by the fact that this
transaction results in PNC entering several geographic markets where PNC did not
previously have any meaningful retail presence. |
 15
Cautionary Statement Regarding Forward-Looking
Information (continued)
Appendix
We provide greater detail regarding some of these factors in our 2011 Form 10-K as amended
by amendment no. 1 thereto, including in the Risk Factors and Risk Management sections
and the Legal Proceedings and Commitments and Guarantees Notes of the Notes to Consolidated
Financial Statements in that report, and our subsequent SEC filings. Our
forward-looking statements may also be subject to other risks and uncertainties,
including those we may discuss elsewhere in this presentation or in SEC filings, accessible on the SEC’s website at www.sec.gov
and on our corporate website at www.pnc.com/secfilings. We have included these web
addresses as inactive textual references only. Information on these websites is
not part of this document. Any annualized, proforma, estimated, third party or consensus numbers in this presentation are
used for illustrative or comparative purposes only and may not reflect actual
results. Any consensus earnings estimates are calculated based on the earnings projections made by analysts
who cover that company. The analysts’ opinions, estimates or forecasts (and
therefore the consensus earnings estimates) are theirs alone, are not those of PNC or
its management, and may not reflect PNC’s or other company’s actual or anticipated results.
Competition can have an impact on customer acquisition, growth and retention and on
credit spreads and product pricing, which can affect market share, deposits and
revenues. Industry restructuring in the current environment could also impact our business and financial
performance through changes in counterparty creditworthiness and performance and in the
competitive and regulatory landscape. Our ability to anticipate and respond to
technological changes can also impact our ability to respond to customer needs and meet competitive demands.
In addition to the RBC Bank (USA) transaction, we grow our business in part by
acquiring from time to time other financial services companies, financial services
assets and related deposits and other liabilities. These other acquisitions often present risks and uncertainties
analogous to those presented by the RBC Bank (USA) transaction. Acquisition risks
include those presented by the nature of the business acquired as well as risks and
uncertainties related to the acquisition transactions themselves, regulatory issues, and the integration of the
acquired businesses into PNC after closing.
Business and operating results can also be affected by widespread disasters,
dislocations, terrorist activities or international hostilities through impacts on the
economy and financial markets generally or on us or our counterparties specifically. |
 16
Non-GAAP to GAAP Reconcilement
Appendix
In millions, except per share data
Mar. 31, 2012
Dec. 31, 2011
Mar. 31, 2011
Integration costs, pretax
$145
$28
$1
Integration costs, after-tax
94
18
-
Integration costs impact on diluted earnings per share
$0.18
$0.04
$0.00
For the quarter ended
After-tax amounts were calculated using a marginal federal income tax rate of 35% and
include applicable income tax adjustments.
In millions
Mar. 31, 2012
Dec. 31, 2011
Mar. 31, 2011
Tier 1 common capital (1)
$23,322
$23,732
$21,976
Reported net income
811
493
832
Reported net income, if annualized
3,262
1,956
3,374
Return on tier 1 common capital
14.0%
8.2%
15.4%
(1) Estimated for Mar. 31, 2012.
As of or for the three months ended
PNC
believes
that
return
on
tier
1
common
capital
is
useful
as
a
tool
to
help
measure
and
assess
a
company's use of common equity. |
 17
Non-GAAP to GAAP Reconcilement
Appendix
Mar. 31, 2012
Dec. 31, 2011
Sep. 30, 2011
Jun. 30, 2011
Mar. 31, 2011
Average yields/rates
Yield on interest-earning assets
Loans
Commercial
4.51%
4.66%
4.86%
4.88%
5.04%
Commercial real estate
5.19
5.33
5.25
5.51
4.63
Equipment lease financing
4.74
4.84
5.11
4.86
5.00
Consumer
4.78
4.81
4.82
4.94
4.99
Residential real estate
5.59
5.35
5.90
6.22
6.15
Total loans
4.78
4.85
5.00
5.11
5.09
Investment securities
3.47
3.51
3.59
3.80
3.76
Other
4.17
3.68
3.14
3.04
4.16
Total yield on interest-earning assets
4.41
4.44
4.52
4.64
4.67
Rate on interest-bearing liabilities
Interest-bearing deposits
Money market
0.23
0.25
0.31
0.34
0.35
Demand
0.04
0.05
0.08
0.10
0.10
Savings
0.10
0.16
0.19
0.19
0.19
Retail certificates of deposit
0.80
1.16
1.26
1.32
1.28
Time deposits in foreign offices and other time
0.49
0.53
0.72
0.75
0.54
Total interest-bearing deposits
0.31
0.42
0.51
0.55
0.55
Borrowed funds
2.01
2.17
2.20
2.46
2.35
Total rate on interest-bearing liabilities
0.70
0.80
0.86
0.95
0.95
Interest rate spread
3.71
3.64
3.66
3.69
3.72
Impact of noninterest-bearing sources
0.19
0.22
0.23
0.24
0.22
Net interest margin
3.90%
3.86%
3.89%
3.93%
3.94%
Calculated as annualized taxable-equivalent net interest income divided by average earning
assets. The interest income earned on certain earning assets is completely or partially
exempt from federal income tax. As such, these tax-exempt instruments typically yield lower returns than taxable investments. To provide
more meaningful comparisons of yields and margins for all earning assets in calculating net
interest margins, in this table we use net interest income on a taxable- equivalent
basis by increasing the interest income earned on tax-exempt assets to make it fully equivalent to interest income earned on taxable investments. This
adjustment is not permitted under generally accepted accounting principles (GAAP) in the
Consolidated Income Statement. The taxable-equivalent adjustments to net interest
income for the three months ended March 31, 2012, December 31, 2011, September 30, 2011, June 30, 2011, and March 31, 2011, were $31 million, $28
million, $27 million, $25 million, and $24 million, respectively.
For the three months ended |
 18
Non-GAAP to GAAP Reconcilement
Appendix
In millions
Mar. 31, 2012
Dec. 31, 2011
Sep. 30, 2011
Jun. 30, 2011
Mar. 31, 2011
Personnel, as reported
$1,111
$1,052
$949
$976
$989
Integration costs
44
2
1
1
-
Core Personnel
1,067
1,050
948
975
989
Occupancy, as reported
190
198
171
176
193
Integration costs
12
1
-
-
-
Core Occupancy
178
197
171
176
193
Equipment, as reported
175
177
159
158
167
Integration costs
7
4
-
-
-
Core Equipment
168
173
159
158
167
Marketing, as reported
68
74
72
63
40
Integration costs
14
1
2
2
-
Core Marketing
54
73
70
61
40
Other, as reported
911
1,218
789
803
681
Integration costs
68
20
5
2
-
TPS redemption charges
-
198
-
-
-
Core Other
843
1,000
784
801
681
Total core noninterest expense
$2,310
$2,493
$2,132
$2,171
$2,070
Selected items:
Integration costs
$145
$28
$8
$5
$1
Trust preferred securities redemption charges
-
198
-
-
-
Total noninterest expense
$2,455
$2,719
$2,140
$2,176
$2,071
For the quarter ended |
 19
Peer Group of Banks
Appendix
The PNC Financial Services Group, Inc.
PNC
BB&T Corporation
BBT
Bank of America Corporation
BAC
Capital One Financial, Inc.
COF
Comerica Inc.
CMA
Fifth Third Bancorp
FITB
JPMorgan Chase
JPM
KeyCorp
KEY
M&T Bank
MTB
Regions Financial Corporation
RF
SunTrust Banks, Inc.
STI
U.S. Bancorp
USB
Wells Fargo & Co.
WFC
Ticker |