Attached files
| file | filename |
|---|---|
| 8-K - FORM 8-K - CONSUMERS ENERGY CO | d335966d8k.htm |
Exhibit 99.1
Investor Meetings
April 18, 2012
Zeeland 2007
Foote Hydro 1918 Lake Winds 2012
This presentation is made as of the date hereof and contains “forward? looking statements” as defined in Rule 3b? 6 of the Securities Exchange Act of 1934, as amended, Rule 175 of the Securities Act of 1933, as amended, and relevant legal decisions. The forward? looking statements are subject to risks and uncertainties. They should be read in conjunction with “FORWARD? LOOKING STATEMENTS AND
INFORMATION” and “RISK FACTORS” sections of CMS Energy’s and Consumers Energy’s Form 10? K for the year ended December 31 and as updated in subsequent 10? Qs. CMS Energy’s and Consumers Energy’s “FORWARD? LOOKING STATEMENTS AND
INFORMATION” and “RISK FACTORS” sections are incorporated herein by reference and discuss important factors that could cause CMS Energy’s and Consumers Energy’s results to differ materially from those anticipated in such statements. CMS Energy and Consumers Energy undertake no obligation to update any of the information presented herein to reflect facts, events or circumstances after the date hereof.
The presentation also includes non? GAAP measures when describing CMS Energy’s results of operations and financial performance. A reconciliation of each of these measures to the most directly comparable GAAP measure is included in the appendix and posted on our website at www.cmsenergy.com.
Reported earnings could vary because of several factors, such as legacy issues associated with prior asset sales. Because of those uncertainties, the company is not providing reported earnings guidance.
| 2 |
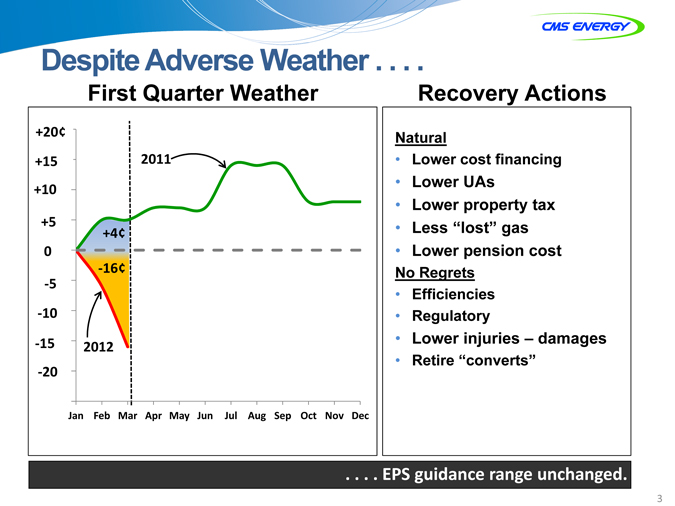
Despite Adverse Weather . . . .
First Quarter Weather Recovery Actions
+20¢ 1.75
Natural
+15 .70 2011 • Lower cost financing
• Lower UAs
+10 .65
• Lower property tax
1.60 +5
+4¢ • Less “lost” gas 1.55 0 • Lower pension cost ? 16¢ No Regrets
1.50 ? 5
• Efficiencies ? 1.45 10 • Regulatory
? 15 .40 • Lower injuries – damages 2012 • Retire “converts”
? 1.35 20
1.30
Jan Feb Mar Apr May Jun Jul Aug Sep Oct Nov Dec
. . . . EPS guidance range unchanged.
| 3 |
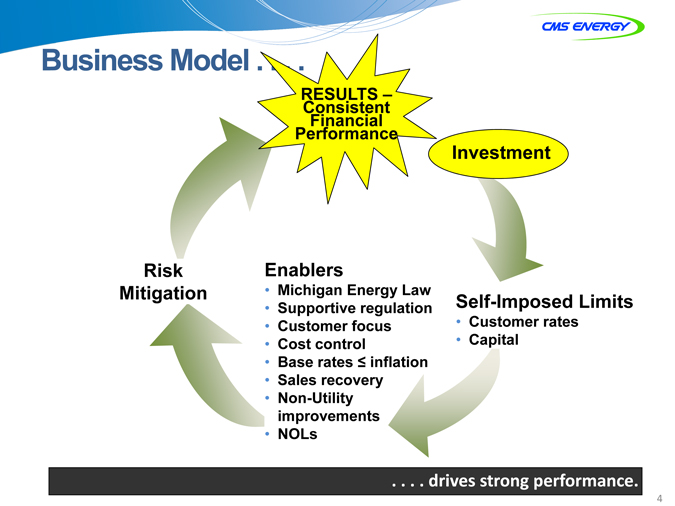
B u s in e s s M o d e l . . . .
RESULTS –Consistent Financial Performance
Investment
Risk Enablers
Mitigation • Michigan Energy Law
• Supportive regulation Self-Imposed Limits
• Customer focus • Customer rates
• Cost control • Capital
• Base rates inflation
• Sales recovery
• Non-Utility improvements
• NOLs
. . . . drivesrives strong performance.
| 4 |
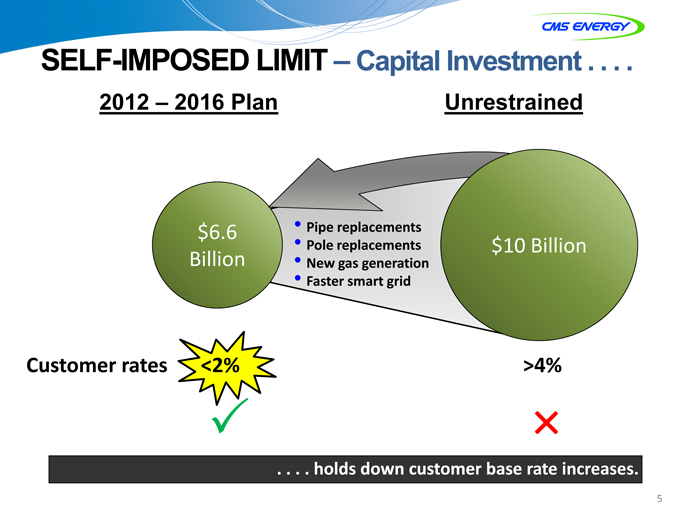
SELF-IMPOSED LIMIT – Capital Investment . . . .
2012 – 2016 Plan Unrestrained
$6.6 • Pipe replacements
• Pole replacements $10 Billion Billion • New gas generation
• Faster smart grid
Customer rates <2% >4%
| 3 |
× |
. . . . holdsolds down customer base rate increases.
| 5 |
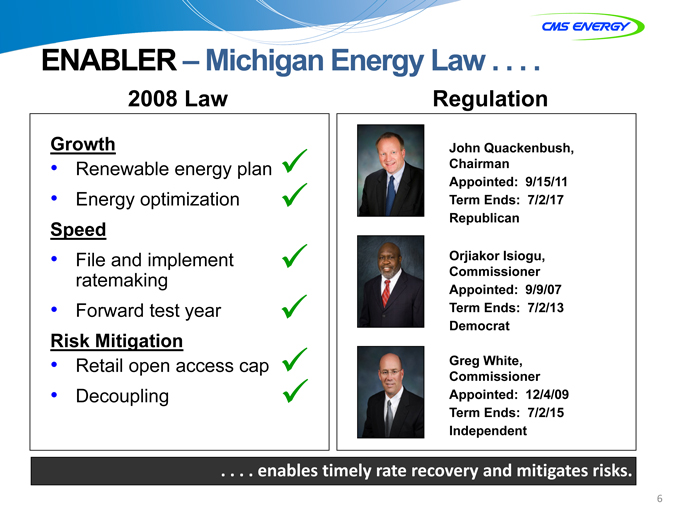
ENABLER – Michigan Energy Law . . . .
2008 Law Regulation
Growth
• Renewable energy plan
• Energy optimization
Speed
• File and implement ratemaking
• Forward test year
Risk Mitigation
• Retail open access cap
• Decoupling
John
Quackenbush, Chairman Appointed: 9/15/11 Term Ends: 7/2/17 Republican
Orjiakor
Isiogu, Commissioner Appointed: 9/9/07 Term Ends: 7/2/13 Democrat
Greg
White, Commissioner Appointed: 12/4/09 Term Ends: 7/2/15 Independent
. . . . enables timely rate recovery and mitigates risks.
| 6 |
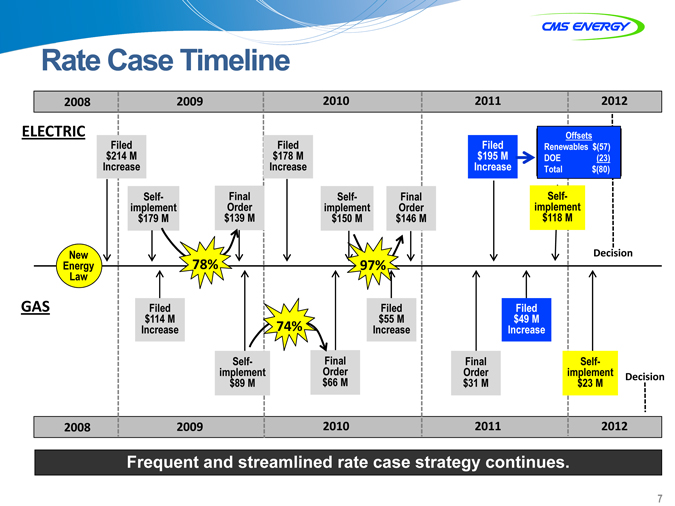
Rate Case Timeline
2008 2009 2010 2011 2012
ELECTRIC Offsets
$Filed 214 M $Filed 178 M $Filed 195 M Renewables $(57) DOE (23) Increase Increase Increase Total $(80)
Self- Final Self- Final implement Self- implement $Order 139 M implement Order $118 M $179 M $150 M $146 M
New Decision
Energy 78% 97%%
Law
GAS Filed Filed Filed $114 M $55 M $49 M
Increase 74% Increase Increase
Self- Order Final Final Self-implement $89 M $66 M $ Order 31 M implement $23 M Decision
2008 2009 2010 2011 2012
Frequent and streamlined rate case strategy continues.
| 7 |
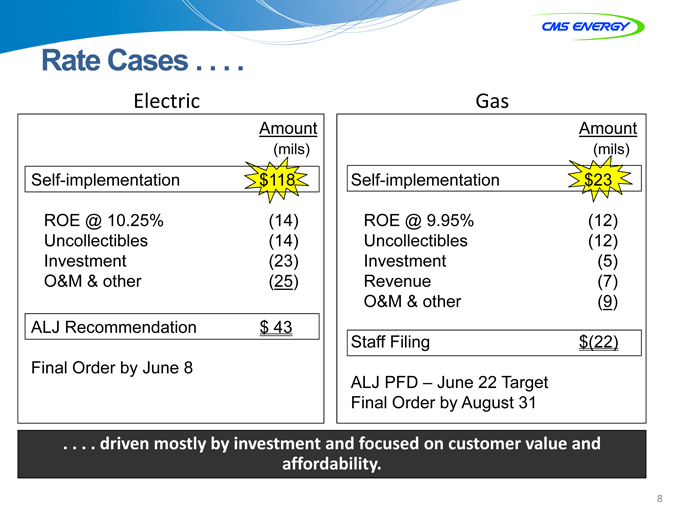
Rate Cases . . . .
Electric Gas
Amount Amount (mils) (mils) Self-implementation $118 Self-implementation $23
ROE @ 10.25% (14) ROE @ 9.95% (12) Uncollectibles (14) Uncollectibles (12) Investment (23) Investment (5) O&M & other (25) Revenue (7) O&M & other (9) ALJ Recommendation $ 43 Staff Filing $(22) Final Order by June 8 ALJ PFD – June 22 Target Final Order by August 31
. . . . driven mostly by investment and focused on customer value and affordability.
| 8 |
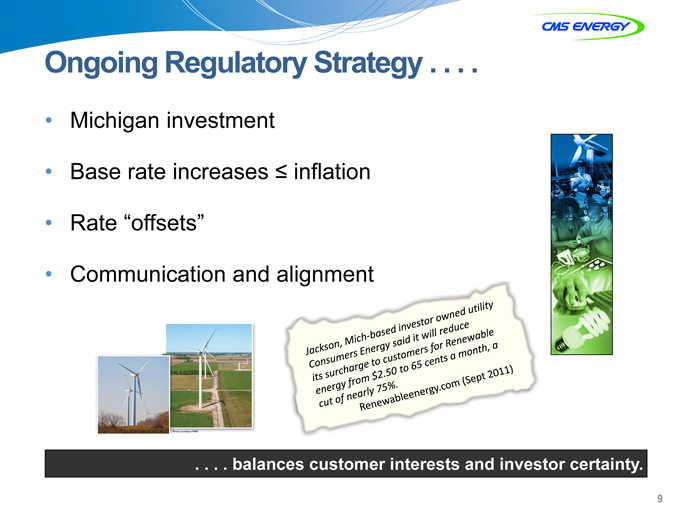
Ongoing Regulatory Strategy . . . .
• Michigan investment
• Base rate increases inflation
• Rate “offsets”
• Communication and alignment
Jackson, Mich-based investor owned utility Consumers Energy said it will reduce
its surcharge to customers for Renewable energy from $2.50 to 65 cents a month, a cut of nearly 75%.
Renewableenergy.com (Sept 2011)
. . . . balances customer interests and investor certainty.
9
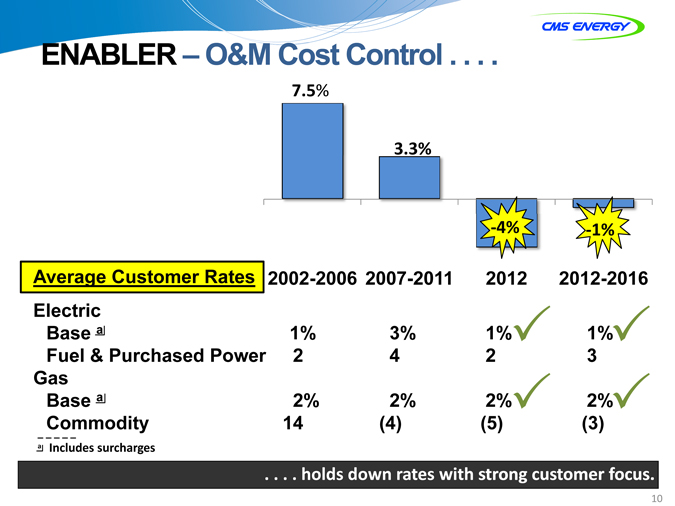
ENABLER – O&M Cost Control . . . .
7.5%
3.3%
? 4% ? 1%
Average Customer Rates 2002-2006 2007-2011 2012 2012-2016 Electric Base a 1% 3% 1%31% 3 Fuel & Purchased Power 2 4 2 3 Gas Base a 2% 2% 2%32% 3 Commodity 14 (4) (5) (3)
_ _ _ _ _ a Includes surcharges
. . . . holds down rates with strong customer focus.
10
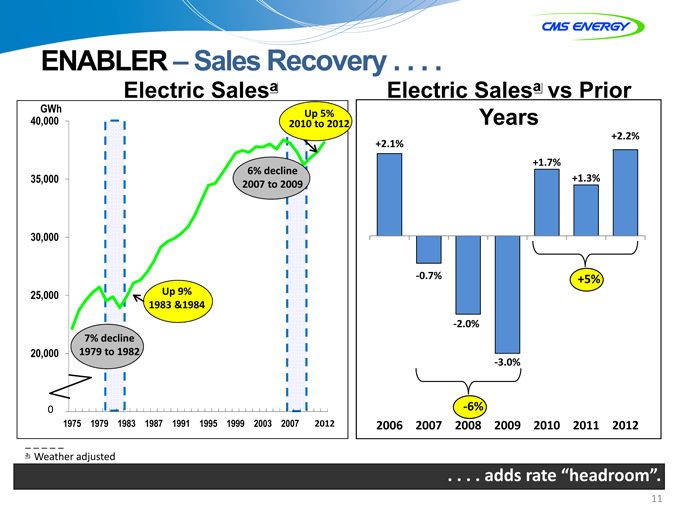
ENABLER – Sales Recovery . . . .
Electric Salesa Electric Salesa vs Prior
GWh
Up 5%
40,000 2010 to 2012 Years
+2.2% +2.1% +1.7% 6% decline 35,000 2007 to 2009 +1.3%
30,000
? 0.7%
+5%
25,000 Up 9% 1983 &1984
? 2.0%
7% decline 20,000 1979 to 1982
? 3.0%
15,000 0 ? 6%
1975 1979 1983 1987 1991 1995 1999 2003 2007 2012 2011 2006 2007 2008 2009 2010 2011 2012
_ _ _ _ _ a Weather adjusted
. . . . adds rate “headroom”.
11
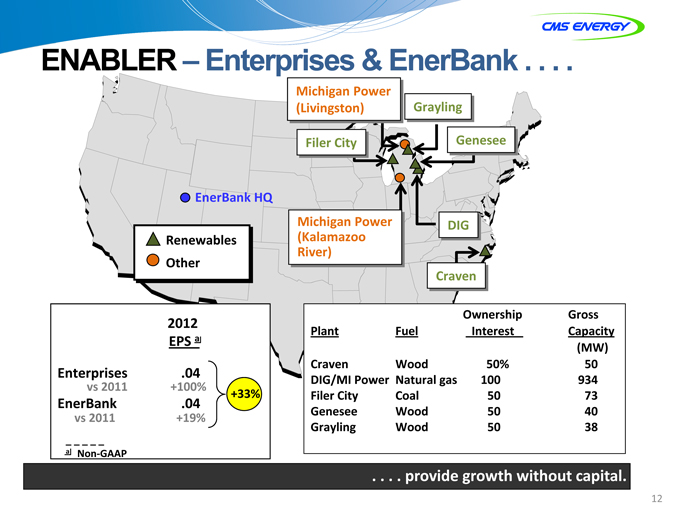
ENABLER – Enterprises & EnerBank . . . .
Michigan Power
(Livingston) Grayling
Filer City Genesee
EnerBank HQ
Michigan Power DIG Renewables (Kalamazoo Other River) Craven
Ownership Gross
2012
Plant Fuel Interest Capacity EPS a (MW) Craven Wood 50% 50
Enterprises .04
DIG/MI Power Natural gas 100 934 vs 2011 +100% +33% Filer City Coal 50 73
EnerBank .04
Genesee Wood 50 40 vs 2011 +19% Grayling Wood 50 38
_ _ _ _ _ a Non? GAAP
. . . . provide growth without capital.
12
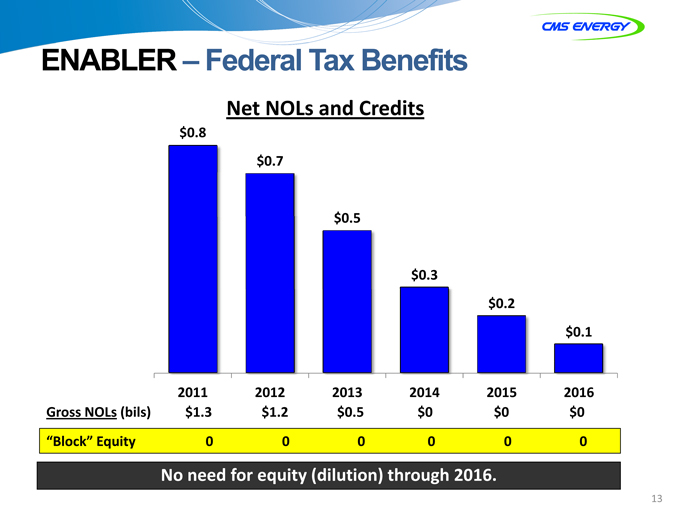
ENABLER – Federal Tax Benefits
Net NOLs and Credits
$0.8
$0.7
$0.5
$0.3 $0.2 $0.1
2011 2012 2013 2014 2015 2016 Gross NOLs (bils) $1.3 $1.2 $0.5 $0 $0 $0
“Block” Equity 0 0 0 0 0 0
No need for equity (dilution) through 2016.
13
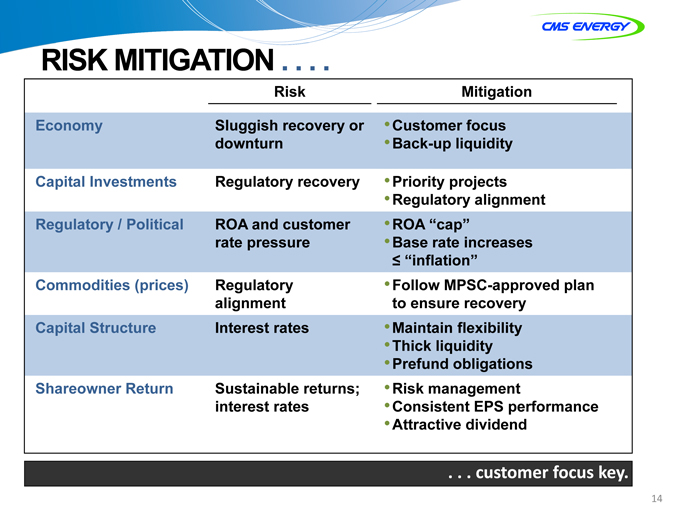
RISK MITIGATION . . . .
Risk Mitigation Economy Sluggish recovery or •Customer focus downturn •Back-up liquidity
Capital Investments Regulatory recovery •Priority projects •Regulatory alignment Regulatory / Political ROA and customer •ROA “cap” rate pressure •Base rate increases
“inflation”
Commodities (prices) Regulatory •Follow MPSC-approved plan alignment to ensure recovery Capital Structure Interest rates •Maintain flexibility •Thick liquidity •Prefund obligations Shareowner Return Sustainable returns; •Risk management interest rates •Consistent EPS performance •Attractive dividend
. . . customer focus key.
14
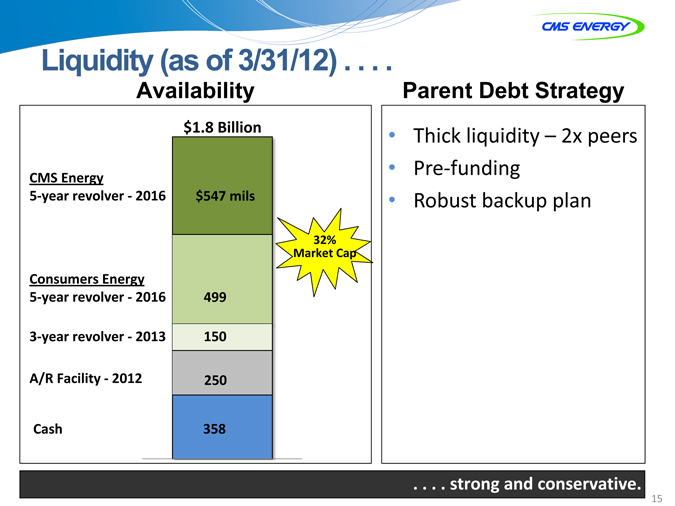
Liquidity (as of 3/31/12) . . . .
Availability Parent Debt Strategy $1.8 Billion • Thick liquidity – 2x peers
• Pre? funding
CMS Energy
5? year revolver 2016 ? $547 mils • Robust backup plan
32% Market Cap
Consumers Energy
5? year revolver 2016 ? 499 3? year revolver 2013 ? 150 A/R Facility 2012 ? 250 Cash 358
. . . . strong and conservative.
15
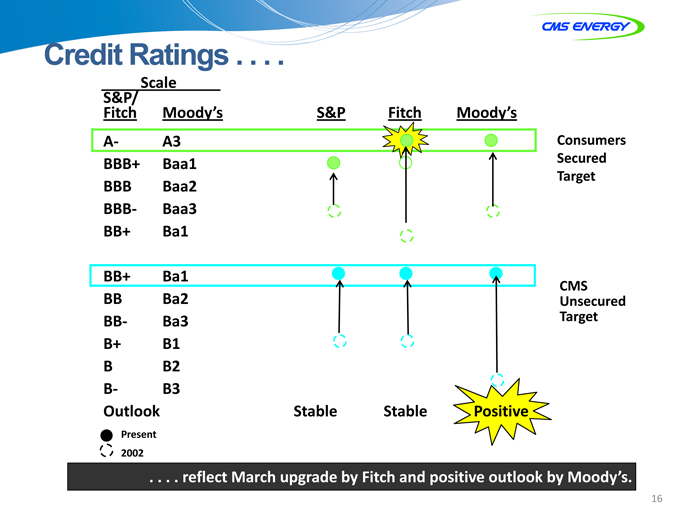
Credit Ratings . . . .
Scale
S&P/
Fitch Moody’s S&P Fitch Moody’s
A? A3 Consumers BBB+ Baa1 Secured Target BBB Baa2 BBB? Baa3 BB+ Ba1
BB+ Ba1
CMS BB Ba2 Unsecured BB? Ba3 Target B+ B1 B B2 B? B3 Outlook Stable Stable Positive
Present 2002
. . . . reflect March upgrade by Fitch and positive outlook by Moody’s.
16
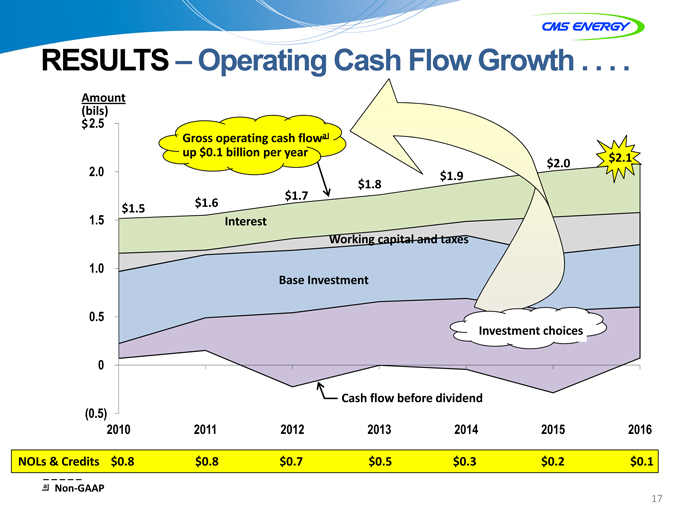
RESULTS – Operating Cash Flow Growth . . . .
Amount (bils) $2.5
Gross operating cash flowa up $0.1 billion per year $2.1 $2.0
2.0 $1.9 $1.8 $1.7 $1.6
1.5 $1.5
Interest
Working capital and taxes
1.0
Base Investment
0.5
Investment choices
0.0
Cash flow before dividend
(0.5)
2010 2011 2012 2013 2014 2015 2016
NOLs & Credits $0.8 $0.8 $0.7 $0.5 $0.3 $0.2 $0.1
_ _ _ _ _ a Non? GAAP
17
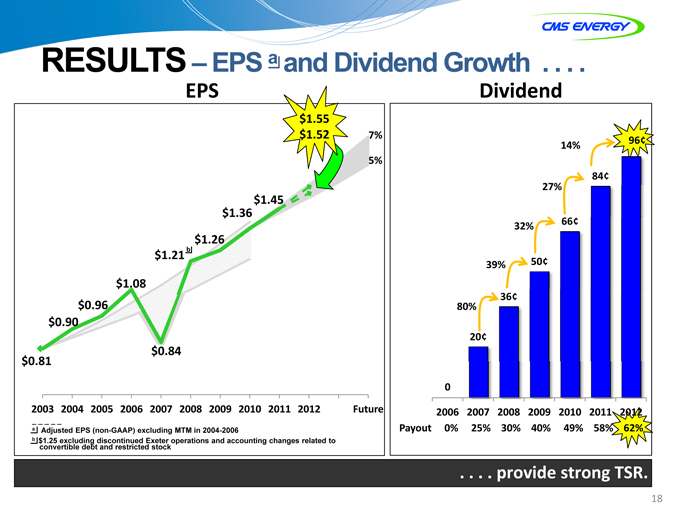
RESULTS– EPS a and Dividend Growth . . . .
EPS Dividend
$1.55 $1.52 7% 96¢ 14% 5% 84¢ 27% $1.45 $1.36 32% 66¢ $1.26 $1.21 b 50¢ $1.08 39% $0.96 36¢ $0.90 80% $0.84 20¢
$0.81
0
2006 2007 2008 2009 2010 2011 2012
_ _ _ _ _ a Adjusted EPS (non-GAAP) excluding MTM in 2004-2006 Payout 0% 25% 30% 40% 49% 58% 62% b $1.25 excluding discontinued Exeter operations and accounting changes related to convertible debt and restricted stock
. . . . provide strong TSR.
18
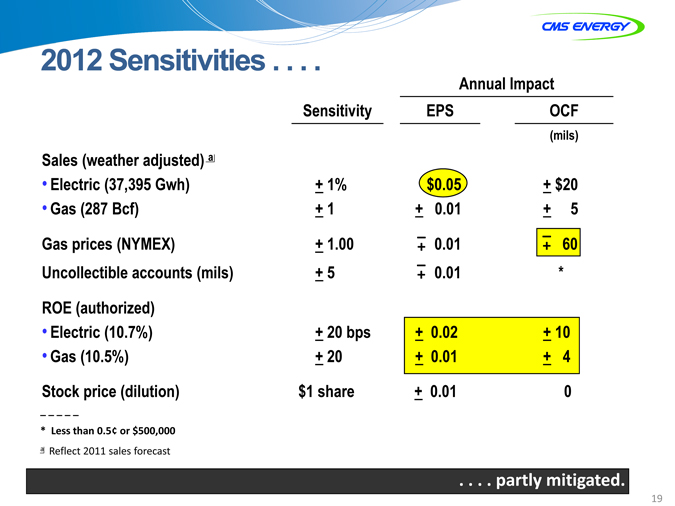
2012 Sensitivities . . . .
Annual Impact Sensitivity EPS OCF
(mils)
Sales (weather adjusted) a
• Electric (37,395 Gwh) + 1% $0.05 + $20
• Gas (287 Bcf) + 1 + 0.01 + 5 Gas prices (NYMEX) + 1.00 –+ 0.01 –+ 60 Uncollectible accounts (mils) + 5 –+ 0.01 * ROE (authorized)
• Electric (10.7%) + 20 bps + 0.02 + 10
• Gas (10.5%) + 20 + 0.01 + 4 Stock price (dilution) $1 share + 0.01 0
| * |
Less than 0.5¢ or $500,000 a Reflect 2011 sales forecast |
. . . . partly mitigated.
19
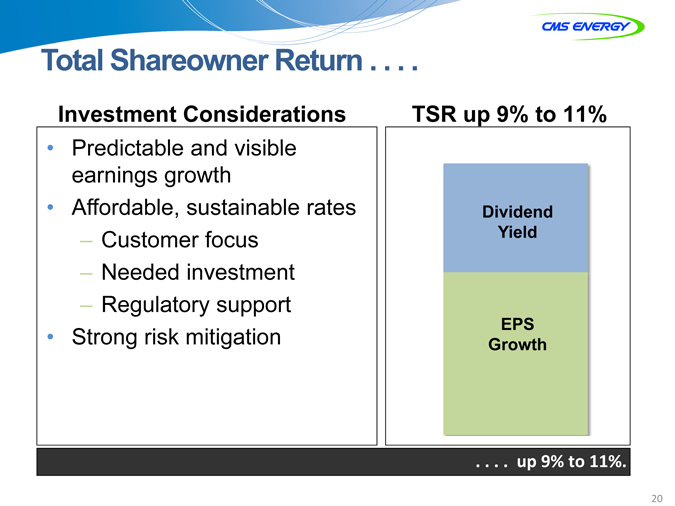
Total Shareowner Return . . . .
Investment Considerations TSR up 9% to 11%
• Predictable and visible earnings growth
• Affordable, sustainable rates Dividend
– Customer focus Yield
– Needed investment
– Regulatory support
EPS
• Strong risk mitigation Growth
. . . . upp 9% to 11%.
20

APPENDIX
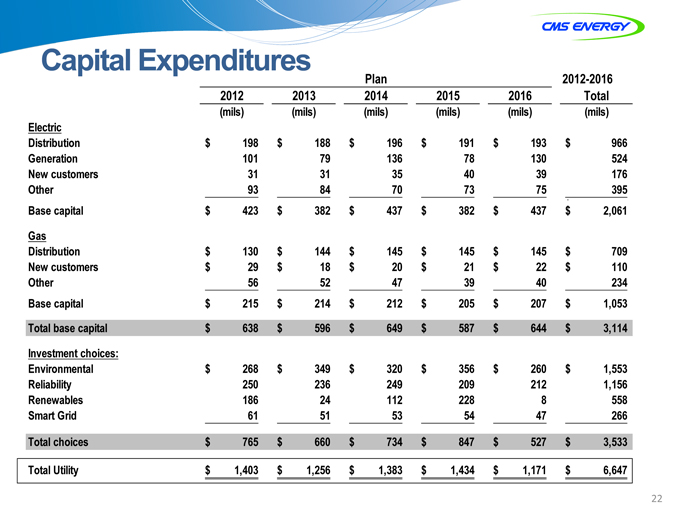
Capital Expenditures
Plan 2012-2016 2012 2013 2014 2015 2016 Total (mils) (mils) (mils) (mils) (mils) (mils) Electric Distribution $ 198 $ 188 $ 196 $ 191 $ 193 $ 966 Generation 101 79 136 78 130 524 New customers 31 31 35 40 39 176 Other 93 84 70 73 75 $ 395 Base capital $ 423 $ 382 $ 437 $ 382 $ 437 $ 2,061 Gas Distribution $ 130 $ 144 $ 145 $ 145 $ 145 $ 709 New customers $ 29 $ 18 $ 20 $ 21 $ 22 $ 110 Other 56 52 47 39 40 234 Base capital $ 215 $ 214 $ 212 $ 205 $ 207 $ 1,053 Total base capital $ 638 $ 596 $ 649 $ 587 $ 644 $ 3,114 Investment choices: Environmental $ 268 $ 349 $ 320 $ 356 $ 260 $ 1,553 Reliability 250 236 249 209 212 1,156 Renewables 186 24 112 228 8 558 Smart Grid 61 51 53 54 47 266
Total choices $ 765 $ 660 $ 734 $ 847 $ 527 $ 3,533
Total Utility $ 1,403 $ 1,256 $ 1,383 $ 1,434 $ 1,171 $ 6,647
22
GAAP RECONCILIATION
CMS ENERGY CORPORATION
Earnings Per Share By Year GAAP Reconciliation
(Unaudited)
| 2003 | 2004 | 2005 | 2006 | 2007 | 2008 | 2009 | 2010 | 2011 | ||||||||||||||||||||||||||||
| Reported earnings (loss) per share - GAAP |
($0.30 | ) | $0.64 | ($0.44 | ) | ($0.41 | ) | ($1.02 | ) | $ | 1.20 | $ | 0.91 | $ | 1.28 | $ | 1.58 | |||||||||||||||||||
|
|
|
|
|
|
|
|
|
|
|
|
|
|
|
|
|
|
|
|||||||||||||||||||
| After-tax items: |
||||||||||||||||||||||||||||||||||||
| Electric and gas utility |
0.21 | (0.39 | ) | — | — | (0.07 | ) | 0.05 | 0.33 | 0.03 | 0.00 | |||||||||||||||||||||||||
| Enterprises |
0.74 | 0.62 | 0.04 | (0.02 | ) | 1.25 | (0.02 | ) | 0.09 | (0.03 | ) | (0.11 | ) | |||||||||||||||||||||||
| Corporate interest and other |
0.16 | (0.03 | ) | 0.04 | 0.27 | (0.32 | ) | (0.02 | ) | 0.01 | * | (0.01 | ) | |||||||||||||||||||||||
| Discontinued operations (income) loss |
(0.16 | ) | 0.02 | (0.07 | ) | (0.03 | ) | 0.40 | (* | ) | (0.08 | ) | 0.08 | (0.01 | ) | |||||||||||||||||||||
| Asset impairment charges, net |
— | — | 1.82 | 0.76 | 0.60 | — | — | — | — | |||||||||||||||||||||||||||
| Cumulative accounting changes |
0.16 | 0.01 | — | — | — | — | — | — | — | |||||||||||||||||||||||||||
|
|
|
|
|
|
|
|
|
|
|
|
|
|
|
|
|
|
|
|||||||||||||||||||
| Adjusted earnings per share, including MTM - non-GAAP |
$ | 0.81 | $ | 0.87 | $ | 1.39 | $ | 0.57 | $ | 0.84 | $ | 1.21 | (a) | $ | 1.26 | $ | 1.36 | $ | 1.45 | |||||||||||||||||
| Mark-to-market impacts |
0.03 | (0.43 | ) | 0.51 | ||||||||||||||||||||||||||||||||
|
|
|
|
|
|
|
|
|
|
|
|
|
|
|
|
|
|
|
|||||||||||||||||||
| Adjusted earnings per share, excluding MTM - non-GAAP |
NA | $ | 0.90 | $ | 0.96 | $ | 1.08 | NA | NA | NA | NA | NA | ||||||||||||||||||||||||
|
|
|
|
|
|
|
|
|
|
|
|
|
|
|
|
|
|
|
|||||||||||||||||||
| * | Less than $500 thousand or $0.01 per share. |
| (a) | $1.25 excluding discontinued Exeter operations and accounting changes related to convertible debt and restricted stock. |
2003-11 EPS
CMS Energy
Reconciliation of Gross Operating Cash Flow to GAAP Operating Activities
(unaudited)
(mils)
| 2009 | 2010 | 2011 | 2012 | 2013 | 2014 | 2015 | 2016 | |||||||||||||||||||||||||
| Consumers Operating Income + Depreciation & Amortization |
$ | 1,248 | $ | 1,498 | $ | 1,527 | $ | 1,645 | $ | 1,735 | $ | 1,860 | $ | 1,976 | $ | 2,051 | ||||||||||||||||
| Enterprises Project Cash Flows |
16 | 39 | 24 | 25 | 27 | 33 | 35 | 35 | ||||||||||||||||||||||||
|
|
|
|
|
|
|
|
|
|
|
|
|
|
|
|
|
|||||||||||||||||
| Gross Operating Cash Flow |
$ | 1,264 | $ | 1,537 | $ | 1,551 | $ | 1,670 | $ | 1,762 | $ | 1,893 | $ | 2,011 | $ | 2,086 | ||||||||||||||||
| Other operating activities including taxes, interest payments and working capital |
(416 | ) | (578 | ) | (382 | ) | (420 | ) | (412 | ) | (443 | ) | (756 | ) | (776 | ) | ||||||||||||||||
|
|
|
|
|
|
|
|
|
|
|
|
|
|
|
|
|
|||||||||||||||||
| Net cash provided by operating activities |
$ | 848 | $ | 959 | $ | 1,169 | $ | 1,250 | $ | 1,350 | $ | 1,450 | $ | 1,255 | $ | 1,310 | ||||||||||||||||
|
|
|
|
|
|
|
|
|
|
|
|
|
|
|
|
|
|||||||||||||||||
2009-16 OCF