Attached files
| file | filename |
|---|---|
| 8-K - STATE STREET CORPORATION 8-K - STATE STREET CORP | a50240117.htm |
| EX-99.1 - EXHIBIT 99.1 - STATE STREET CORP | a50240117ex991.htm |
Exhibit 99.2

1 Investment Portfolio As of March 31, 2012
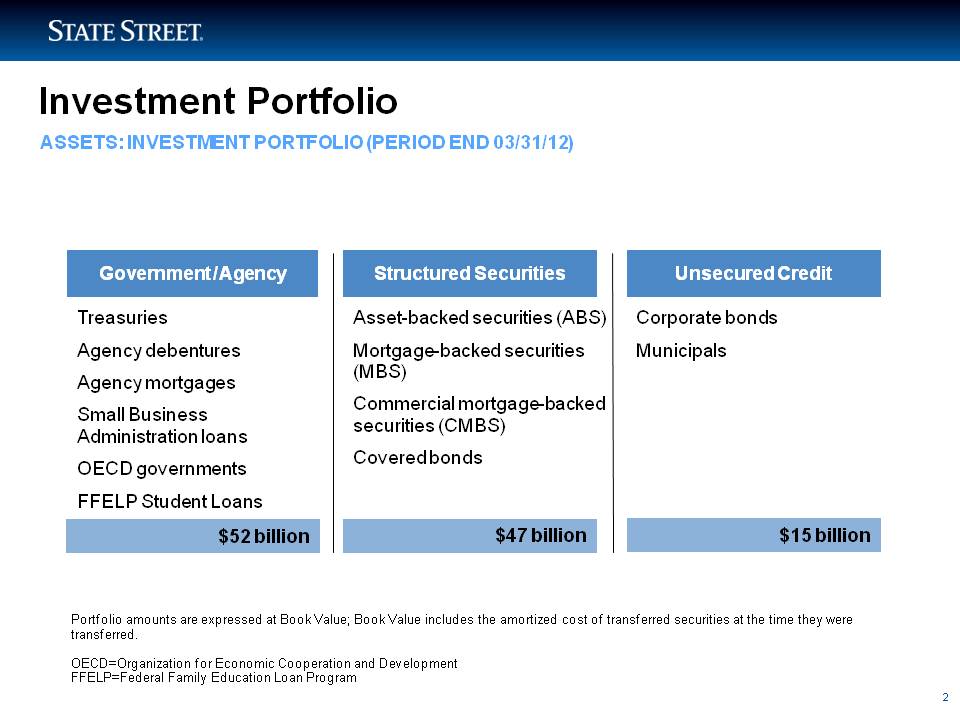
2 Asset-backed securities (ABS) Mortgage-backed securities (MBS) Commercial mortgage-backed securities (CMBS) Covered bonds $47 billion $15 billion Corporate bonds Municipals Treasuries Agency debentures Agency mortgages Small Business Administration loans OECD governments FFELP Student Loans Investment Portfolio Government / Agency Structured Securities Unsecured Credit Portfolio amounts are expressed at Book Value; Book Value includes the amortized cost of transferred securities at the time they were transferred. OECD=Organization for Economic Cooperation and Development FFELP=Federal Family Education Loan Program ASSETS: INVESTMENT PORTFOLIO (PERIOD END 03/31/12) $52 billion
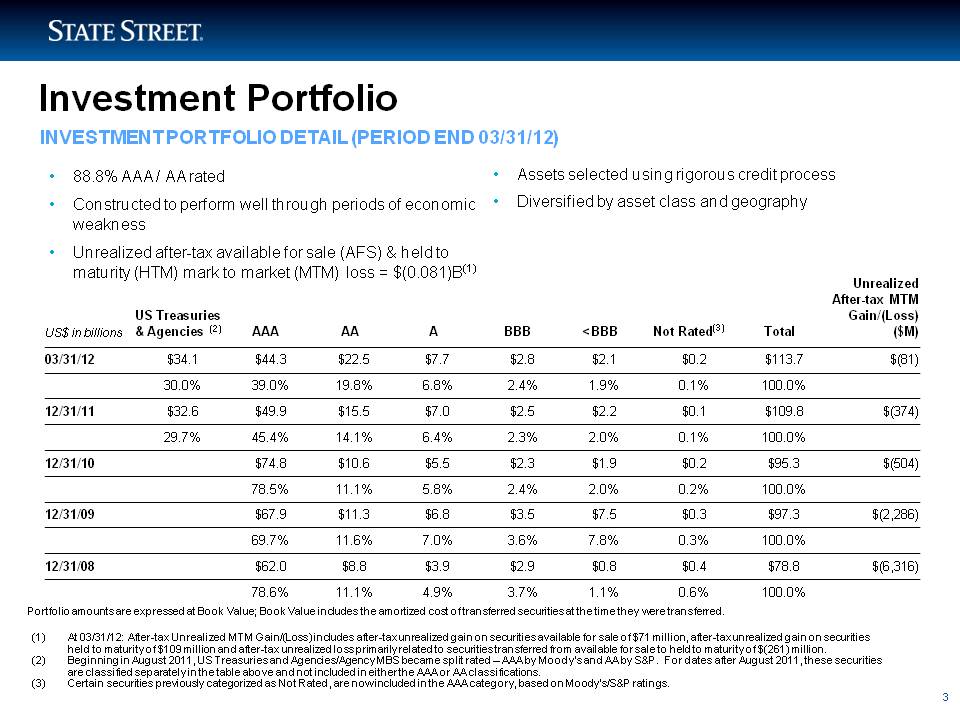
3 Assets selected using rigorous credit process Diversified by asset class and geography 88.8% AAA / AA rated Constructed to perform well through periods of economic weakness Unrealized after-tax available for sale (AFS) & held to maturity (HTM) mark to market (MTM) loss = $(0.081)B(1) INVESTMENT PORTFOLIO DETAIL (PERIOD END 03/31/12) Investment Portfolio Portfolio amounts are expressed at Book Value; Book Value includes the amortized cost of transferred securities at the time they were transferred. At 03/31/12: After-tax Unrealized MTM Gain/(Loss) includes after-tax unrealized gain on securities available for sale of $71 million, after-tax unrealized gain on securities held to maturity of $109 million and after-tax unrealized loss primarily related to securities transferred from available for sale to held to maturity of $(261) million. Beginning in August 2011, US Treasuries and Agencies/Agency MBS became split rated – AAA by Moody’s and AA by S&P. For dates after August 2011, these securities are classified separately in the table above and not included in either the AAA or AA classifications. Certain securities previously categorized as Not Rated, are now included in the AAA category, based on Moody’s/S&P ratings. US Treasuries & Agencies (2) US$ in billions AAA AA A BBB <BBB Not Rated(3) Total Unrealized After-tax MTM Gain/(Loss) ($M) 03/31/12 $34.1 $44.3 $22.5 $7.7 $2.8 $2.1 $0.2 $113.7 $(81) 30.0% 39.0% 19.8% 6.8% 2.4% 1.9% 0.1% 100.0% 12/31/11 $32.6 $49.9 $15.5 $7.0 $2.5 $2.2 $0.1 $109.8 $(374) 29.7% 45.4% 14.1% 6.4% 2.3% 2.0% 0.1% 100.0% 12/31/10 $74.8 $10.6 $5.5 $2.3 $1.9 $0.2 $95.3 $(504) 78.5% 11.1% 5.8% 2.4% 2.0% 0.2% 100.0% 12/31/09 $67.9 $11.3 $6.8 $3.5 $7.5 $0.3 $97.3 $(2,286) 69.7% 11.6% 7.0% 3.6% 7.8% 0.3% 100.0% 12/31/08 $62.0 $8.8 $3.9 $2.9 $0.8 $0.4 $78.8 $(6,316) 78.6% 11.1% 4.9% 3.7% 1.1% 0.6% 100.0%
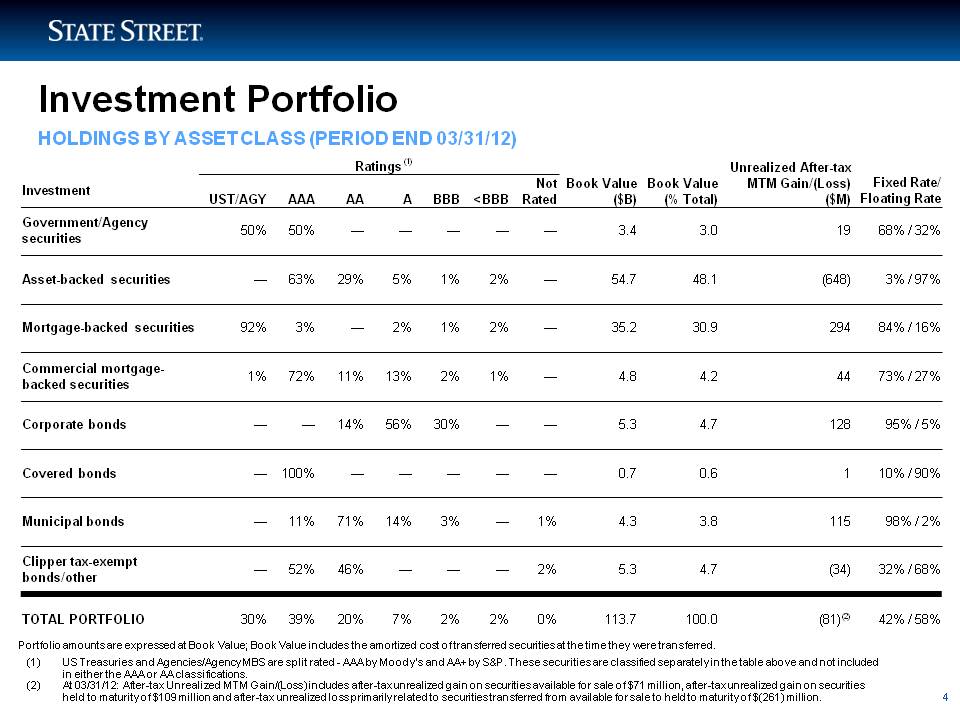
4 Investment Portfolio HOLDINGS BY ASSET CLASS (PERIOD END 03/31/12) Portfolio amounts are expressed at Book Value; Book Value includes the amortized cost of transferred securities at the time they were transferred. US Treasuries and Agencies/Agency MBS are split rated - AAA by Moody’s and AA+ by S&P. These securities are classified separately in the table above and not included in either the AAA or AA classifications. At 03/31/12: After-tax Unrealized MTM Gain/(Loss) includes after-tax unrealized gain on securities available for sale of $71 million, after-tax unrealized gain on securities held to maturity of $109 million and after-tax unrealized loss primarily related to securities transferred from available for sale to held to maturity of $(261) million. (1) Investment UST/AGY AAA AA A BBB BBB Not Rated Book Value ($B) Book Value (% Total) Unrealized After-tax MTM Gain/(Loss) ($M) Fixed Rate/ Floating Rate Ratings Government/Agency securities Asset-backed securities Mortgage-backed securities Commercial mortgage-backed securities Corporate bonds Covered bonds Municipal bonds Clipper tax-exempt bonds/other TOTAL PORTFOLIO 50% 50% ————— 3.4 3.0 19 68% / 32% —63% 29% 5% 1% 2% — 54.7 48.1 (648) 3% / 97% 92% 3% — 2% 1% 2% —35.2 30.9 294 84% / 16% 1% 72% 11% 13% 2% 1% — 4.8 4.2 44 73% / 27% — —14% 56% 30% — — 5.3 4.7 128 95% / 5% — 100% ————— 0.7 0.6 1 10% / 90% — 11% 71% 14% 3% — 1% 4.3 3.8 115 98% / 2% — 52% 46% ———2% 5.3 4.7 (34) 32% / 68% 30% 39% 20% 7% 2% 2% 0% 113.7 100.0 (81)(2) 42% / 58%
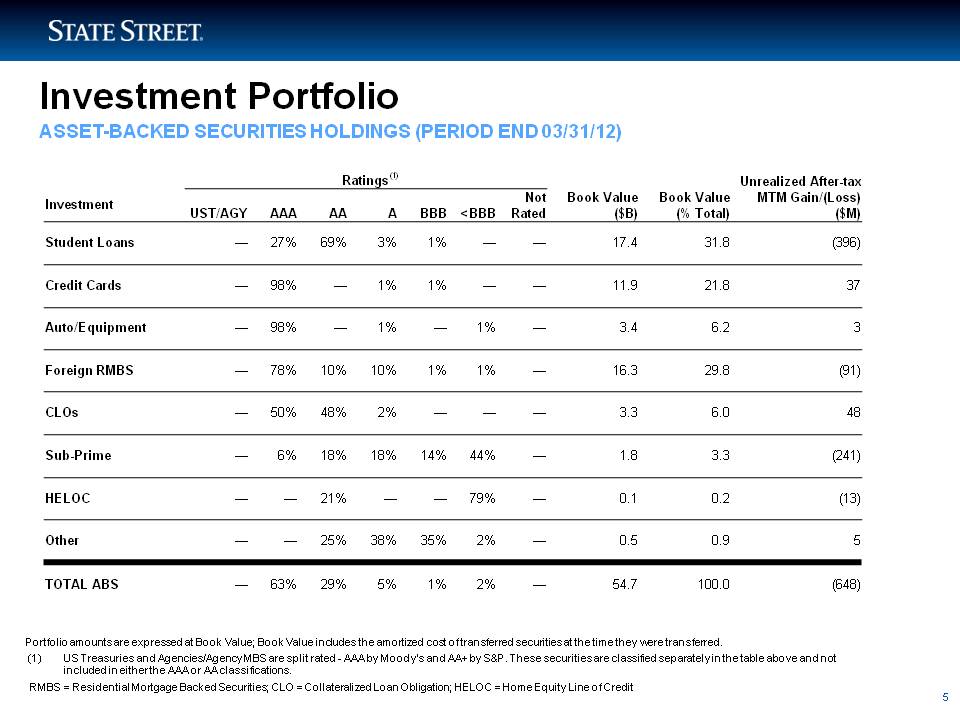
5 Investment Portfolio ASSET-BACKED SECURITIES HOLDINGS (PERIOD END 03/31/12) Ratings Book Value Book Value Unrealized After-tax MTM Gain/(Loss) Investment Not (1) ($B) (% Total) ($M) UST/AGY AAA AA A BBB <BBB Rated Student Loans — 27% 69% 3% 1% — — 17.4 31.8 (396) Credit Cards — 98% — 1% 1% — — 11.9 21.8 37 Auto/Equipment — 98% — 1% — 1% — 3.4 6.2 3 Foreign RMBS — 78% 10% 10% 1% 1% — 16.3 29.8 (91) CLOs 50% 48% 2% 3 3 6 0 48 — — — — 3.3 6.0 Sub-Prime — 6% 18% 18% 14% 44% — 1.8 3.3 (241) HELOC — — 21% — — 79% — 0.1 0.2 (13) Other — — 25% 38% 35% 2% — 0.5 0.9 5 TOTAL ABS — 63% 29% 5% 1% 2% — 54.7 100.0 (648) Portfolio amounts are expressed at Book Value; Book Value includes the amortized cost of transferred securities at the time they were transferred. (1) US Treasuries and Agencies/Agency MBS are split rated - AAA by Moody’s and AA+ by S&P. These securities are classified separately in the table above and not included in either the AAA or AA classifications. RMBS = Residential Mortgage Backed Securities; CLO = Collateralized Loan Obligation; HELOC = Home Equity Line of Credit
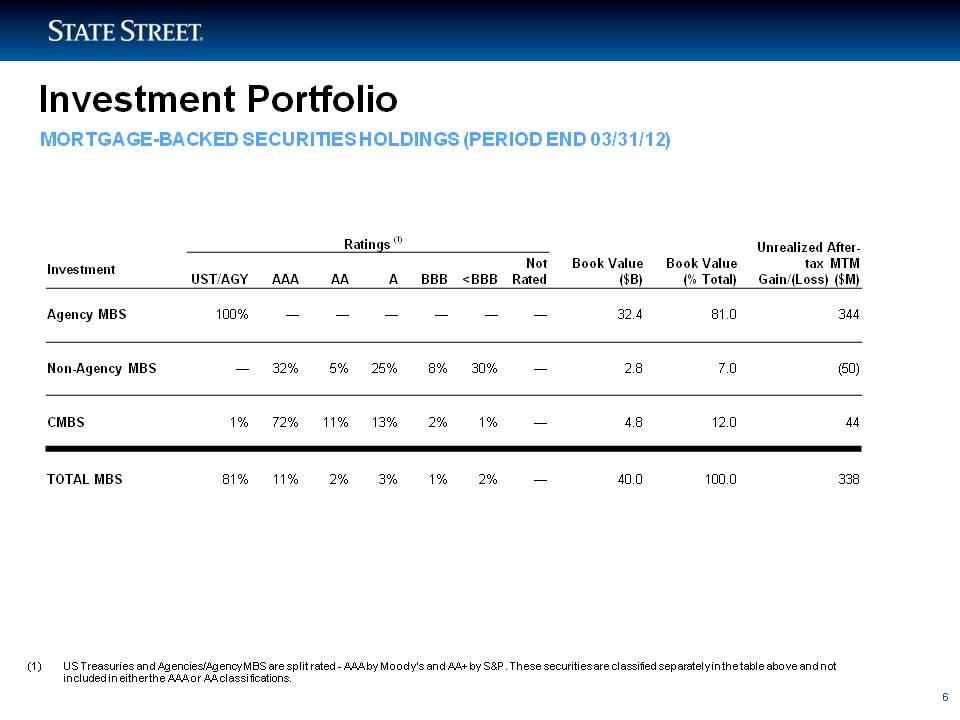
6 Investment Portfolio MORTGAGE-BACKED SECURITIES HOLDINGS (PERIOD END 03/31/12) Ratings Book Value ($B) Book Value (% Total) Unrealized Aftertax MTM Gain/(Loss) ($M) Investment UST/AGY AAA AA A BBB <BBB Not Rated (1) Agency MBS 100% — — — — — — 32.4 81.0 344 Non-Agency MBS — 32% 5% 25% 8% 30% — 2.8 7.0 (50) CMBS 1% 72% 11% 13% 2% 1% — 4.8 12.0 44 TOTAL MBS 81% 11% 2% 3% 1% 2% — 40.0 100.0 338 6 (1) US Treasuries and Agencies/Agency MBS are split rated - AAA by Moody’s and AA+ by S&P. These securities are classified separately in the table above and not included in either the AAA or AA classifications.
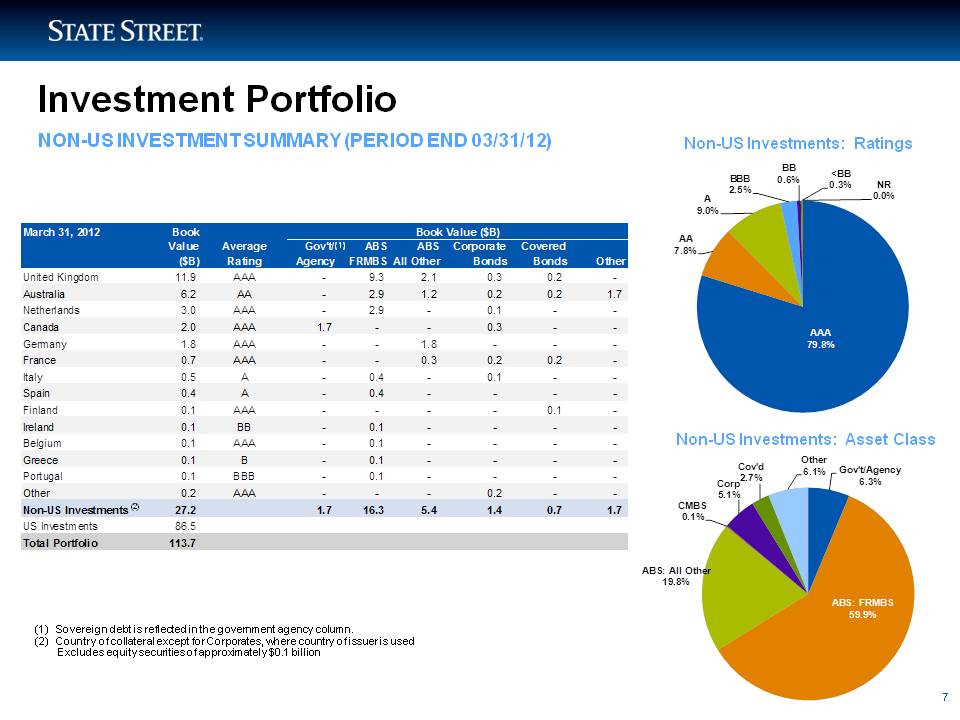
7 Investment Portfolio NON-US INVESTMENT SUMMARY (PERIOD END 03/31/12) Non-US Investments: Ratings A BBB 2.5% BB 0.6% <BB 0.3% NR 0.0% March 31, 2012 Book Book Value ($B) Value Average Gov't/ ABS ABS Corporate Covered ($B) Rating Agency FRMBS All Other Bonds Bonds Other United Kingdom 11.9 AAA - 9.3 2.1 0.3 0.2 - Australia 6.2 AA - 2.9 1.2 0.2 0.2 1.7 Netherlands 3 0 AAA 2 9 0 1 (1) AA 7.8% 9.0% 3.0 - 2.9 - 0.1 - - Canada 2.0 AAA 1.7 - - 0.3 - - Germany 1.8 AAA - - 1.8 - - - France 0.7 AAA - - 0.3 0.2 0.2 - Italy 0.5 A - 0.4 - 0.1 - - Spain 0.4 A - 0.4 - - - - Finland 0 1 AAA - - - - 0 1 - AAA 79.8% 0.1 0.1 Ireland 0.1 BB - 0.1 - - - - Belgium 0.1 AAA - 0.1 - - - - Greece 0.1 B - 0.1 - - - - Portugal 0.1 BBB - 0.1 - - - - Other 0.2 AAA - - - 0.2 - - Non-US Investments 27.2 1.7 16.3 5.4 1.4 0.7 1.7 Non-US Investments: Asset Class (2) Gov't/Agency 6.3% CMBS 0 1% Corp 5.1% Cov'd 2.7% Other 6.1% US Investments 86.5 Total Portfolio 113.7 ABS: FRMBS 59.9% ABS: All Other 19.8% 0.1% 7 (1) Sovereign debt is reflected in the government agency column. (2) Country of collateral except for Corporates, where country of issuer is used Excludes equity securities of approximately $0.1 billion