Attached files
| file | filename |
|---|---|
| 8-K - FORM 8-K - NORTHERN TRUST CORP | d336315d8k.htm |
 Annual Meeting of Stockholders
Service
Expertise
Integrity
Service
Expertise
Integrity
P R I N C I P L E S T H A T E N D U R E
Northern Trust
Corporation
Annual Meeting of Stockholders
Frederick H. Waddell
Chairman & Chief Executive Officer
EXHIBIT 99.1
northerntrust.com
©
2012 Northern Trust Corporation |
 2
Annual Meeting of Stockholders
Forward Looking Statement
This presentation may include forward-looking statements such as statements that relate to
Northern Trust’s financial goals, capital adequacy, dividend policy, expansion and business
development plans, risk management policies, anticipated expense levels and projected profit
improvements, business prospects and positioning with respect to market, demographic and
pricing trends, strategic initiatives, re-engineering and outsourcing activities, new business
results and outlook, changes in securities market prices, credit quality including reserve
levels, planned capital expenditures and technology spending, anticipated tax benefits and
expenses, and the effects of any extraordinary events and various other matters (including
developments with respect to litigation, other contingent liabilities and obligations, and
regulation involving Northern Trust and changes in accounting policies, standards and
interpretations) on Northern Trust’s business and results. These statements speak of
Northern Trust’s plans, goals, targets, strategies, beliefs, and expectations, and refer
to estimates or use similar terms. Actual results could differ materially from those indicated
by these statements because the realization of those results is subject to many risks and
uncertainties.
Our 2011 annual report and periodic reports to the SEC contain information about specific
factors that could cause actual results to differ, and you are urged to read them. Northern Trust
disclaims any continuing accuracy of the information provided in this presentation after today. |
 3
Annual Meeting of Stockholders
Agenda
Northern Trust Corporation
Strategic Overview
Financial Performance
Legacy of Leadership |
 Annual Meeting of Stockholders
Service
Expertise
Integrity
Strategic Overview
northerntrust.com
©
2012 Northern Trust Corporation
Service
Expertise
Integrity
P R I N C I P L E S T H A T E N D U R E
|
 5
Annual Meeting of Stockholders
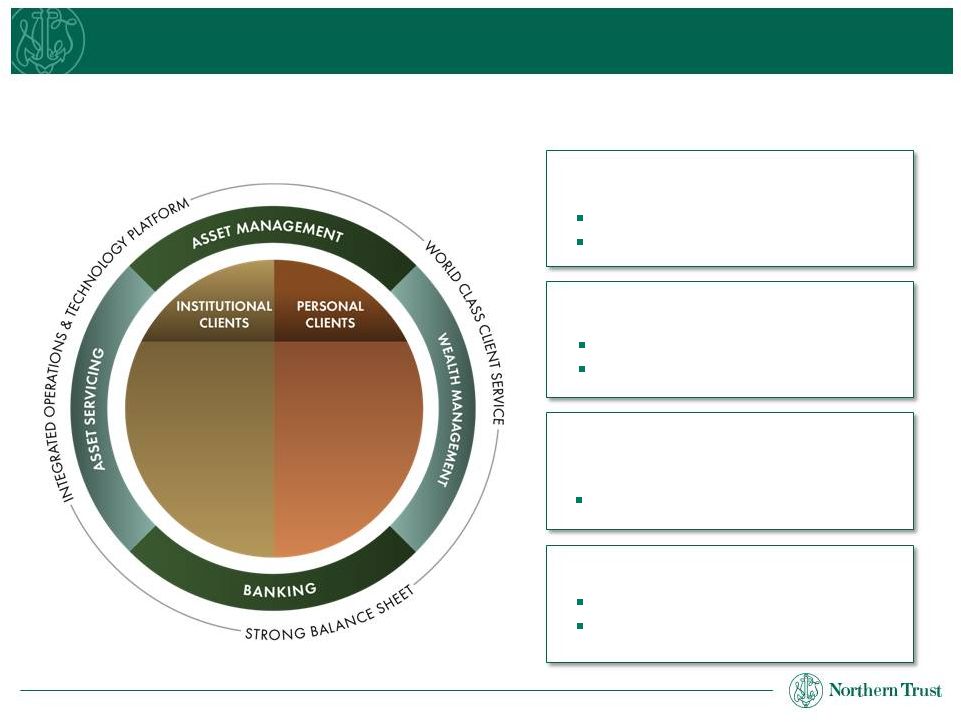
A Highly Focused Business Model
As of March 31, 2012
Founded in 1889, Northern Trust Corporation is a global leader in asset servicing,
asset management, wealth management and banking for personal and institutional
clients. Operations & Technology
Integrated global operating platform
Personal Financial Services
Leading advisor to affluent market
Corporate & Institutional Services
Leading global custodian
Northern Trust Global Investments
Leading asset manager for
personal & institutional clients
Corporations
Pension funds
Fund managers
Foundations
Endowments
Sovereign
wealth funds
Individuals
Families
Family offices
Family foundations
& endowments
Privately held
businesses
AUM
$179 Billion
AUC
$407 Billion
AUC
$4.2 Trillion
AUM
$537 Billion
AUM
$716 Billion
Serving personal and institutional clients
$1.6 Billion in technology spending,
2009-2011 |
 6
Annual Meeting of Stockholders
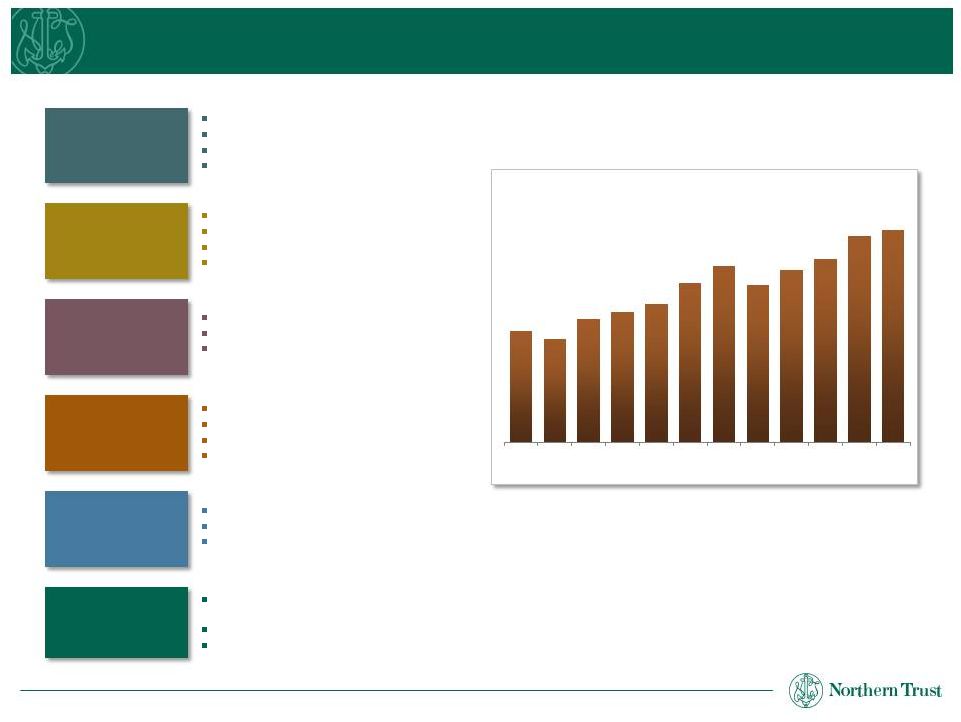
Comprehensive investment capabilities
Custom asset allocation
Broad menu of outside managers
Brokerage services
Investment
Management
Personal Financial Services
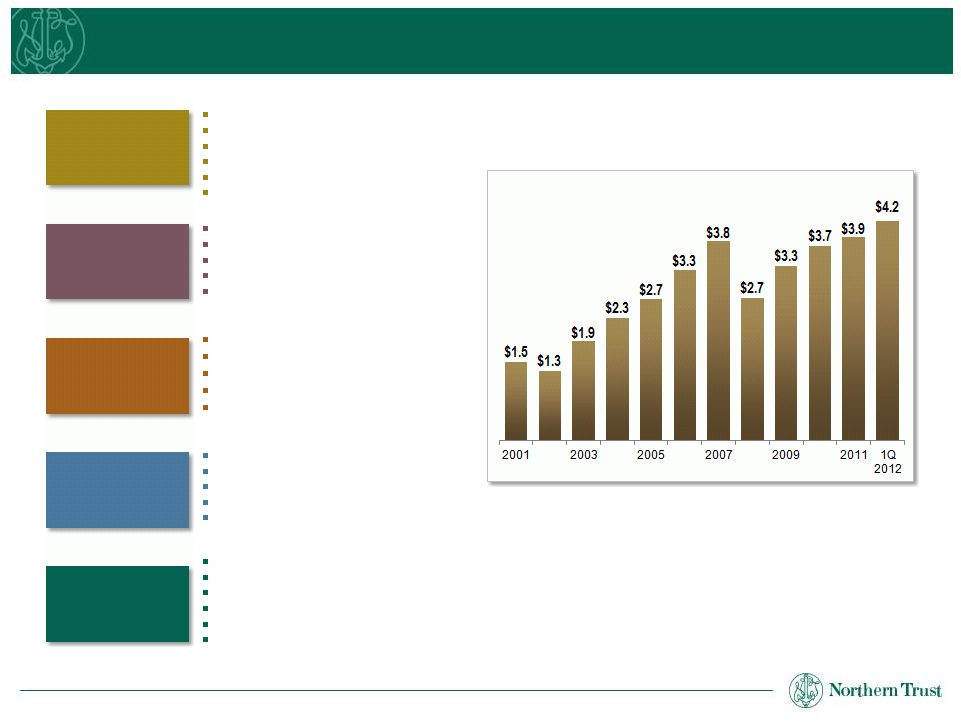
Comprehensive Approach to Serving the Affluent Market
PFS
Assets
Under
Management
($
Billions)
CAGR
+6%
S&P 500 CAGR
+2%
Private and
Business
Banking
Deposit services
Custom financing
Stock option lending
Foundation and
Institutional
Advisors
Customized investment objectives
and strategic asset allocation
Manager selection and oversight
Asset servicing and administration
Advisory
Services
Family education and governance
Family business
Non-financial asset management
Financial
Planning
Cash flow analysis
Debt management
Tax planning
Retirement planning
Trust & Estate
Services
Wealth transfer planning
Trust and estate services
Philanthropic advisory services
Securities custody
$94.0
$87.7
$104.3
$110.4
$117.2
$134.7
$148.3
$132.4
$145.2
$154.4
$173.7
$179.1
2001
2003
2005
2007
2009
2011
1Q
2012 |
 7
Annual Meeting of Stockholders
C&IS
Assets
Under
Custody
($
Trillions)
Corporate & Institutional Services
Delivering a Broad Range of Solutions
CAGR
+11%
S&P 500 CAGR
+2%
US$ EAFE CAGR
+3%
Asset
Administration
Fund accounting
Transfer agency
Corporate secretarial/trustee
Valuations
Investment operations outsourcing
Asset
Management
Active
Global index
Investment outsourcing
Liability driven investing
Multi-manager
Transition management
Asset
Processing
Safekeeping
Settlement
Derivatives and collateral processing
Income collection
Corporate actions
Tax reclamation
White label reporting
Valuation analytics
Performance analytics
Risk monitoring and reporting
Trade execution analysis
Asset
Reporting
Asset
Enhancement
Cross-border pooling
Trade execution
Cash management
Securities lending
Foreign exchange |
 8
Annual Meeting of Stockholders
Northern Trust Global Investments
Client Focused, Diversified Investment Manager
Assets Under Management: $716 Billion
As of March 31, 2012
* Includes Undertakings for Collective Investments in Transferable Securities
Separate Accounts
Mutual &
Commingled Funds*
Exchange Traded
Funds (ETF)
Diversified Asset Management Solutions
Delivered through Various Structures
Across Asset Classes
Across Client Segments
$537 Billion
Institutional
$179 Billion
Personal
Equities
$339 Billion
(47%)
Fixed Income
$134 Billion
(19%)
Short
Duration
$223 Billion
(32%)
Other
$20 Billion
(2%)
Across Styles
$37 Billion
(5%)
$337 Billion
(47%)
Active
$323 Billion
(45%)
Index
Multi-Manager
Other
$19 Billion
(3%) |
 9
Annual Meeting of Stockholders
Northern Trust Global Investments
Representative Asset Management Client Case Studies
Institutional Client
Bond Index
45%
Short
Duration
23%
Equity Index
32%
Northern Trust Global Investments provides customized investment
solutions to
both personal and institutional clients.
Personal Client
50%
27%
23%
Fixed Income
Municipal
Inflation linked
Other
Alternatives
Real Estate
Commodities
Cash
Equities
Large cap
Small cap
International
Tax advantaged
Wealth advisory client with ~$50 million.
A goals driven solution was implemented
using a blend of proprietary and third party
investment products.
Custody client with Defined Benefit pension,
Defined Contribution, and Foundation assets
at Northern Trust.
Northern Trust manages more than $2 billion. |
 10
Annual Meeting of Stockholders
A Recognized Market Leader
Manager
of
the
Year
–
Equity
Indexers
(U.S.)
–
Institutional Investor (April 2011 assets)
Private Bank in North America
–
Financial Times Group
(October 2011, 3 consecutive year)
Ranked among the Top 10 Wealth Managers
–
Barron’s (September 2011)
Serving More than 20% of Forbes 400
Most Affluent Americans
–
Forbes (September 2011)
13 Largest Manager of Worldwide Institutional Assets
17 Largest Asset Manager Worldwide
3 Largest Passive International Indexed Securities
Manager Best
Client Relationship Manager of the Year
–
ICFA Americas Awards (May 2010, 2011)
Best Administrator for UCITS Funds
–
HFM Week, European Hedge Fund Awards
(May 2011 and March 2012)
Best Custody Specialist in Asia
–
The Asset Magazine Awards (4 consecutive year)
Best Outsourcing Services Company
–
The Compliance Register Platinum
Awards (November 2011)
Global Investor Services House
–
Euromoney (Sept. 2011 and July 2010)
Best European ETF Administrator
–
ETF Express Global Awards (2012)
European Administrator of the Year
–
Funds Europe Awards (December 2011)
–
Pensions & Investments (May 2011 based on December 31, 2010 assets)
th
th
th
rd
rd |
 Annual Meeting of Stockholders
Financial Performance
Service
Expertise
Integrity
northerntrust.com
©
2012 Northern Trust Corporation
Service
Expertise
Integrity
P R I N C I P L E S T H A T E N D U R E
|
 12
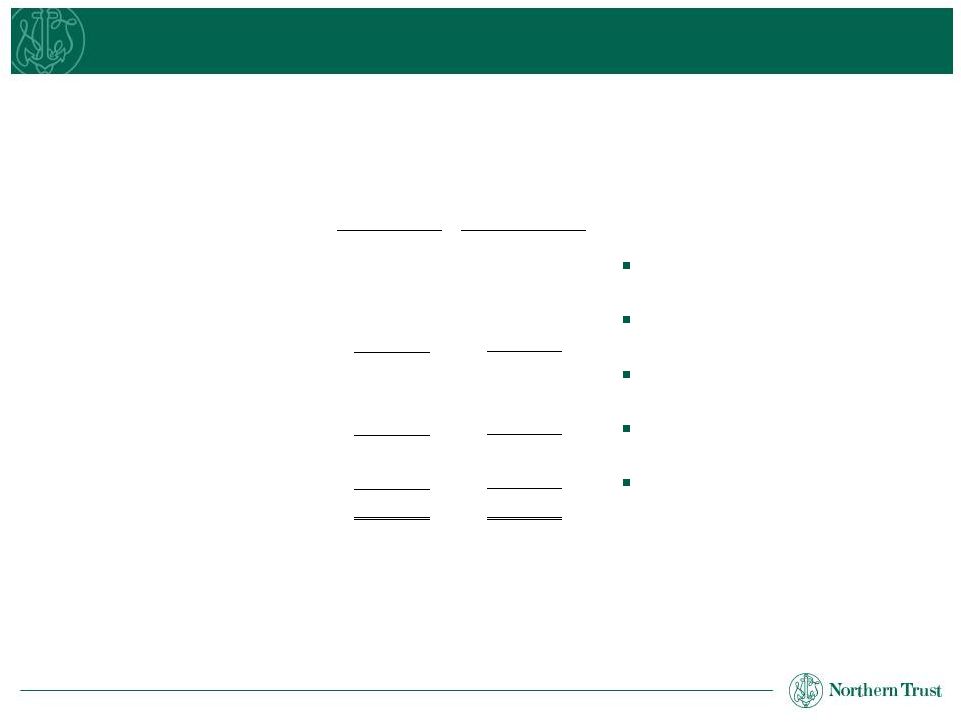
Annual Meeting of Stockholders
Solid performance despite challenging macroeconomic environment.
($MM, except EPS)
Trust, Inv. & Other Servicing Fees
Foreign Exchange Trading Income
Other Non-Interest Income
Net Interest Income
Total Revenues
Non-Interest Expenses
Provision for Credit Losses
Pre-Tax Income
Taxes
Net Income
Earnings per Share
Return on Common Equity
$2,170
325
267
1,009
3,770
2,831
55
884
280
$604
$2.47
8.6%
2011
+4%
-15%
+1%
+10%
+3%
+13%
-66%
-11%
-13%
-10%
-10%
2011 vs. 2010
Strong new business results despite
difficult macroeconomic environment
Invested approximately $609 million in
technology
Maintained
our
dividend
for
the
115
th
consecutive year
Acquisitions of Bank of Ireland
Securities Services and Omnium LLC
Results included restructuring,
acquisition and integration related
charges totaling $91.6 million ($59.8
million after tax, or $.25 per share)
2011 Financial Performance |
 13
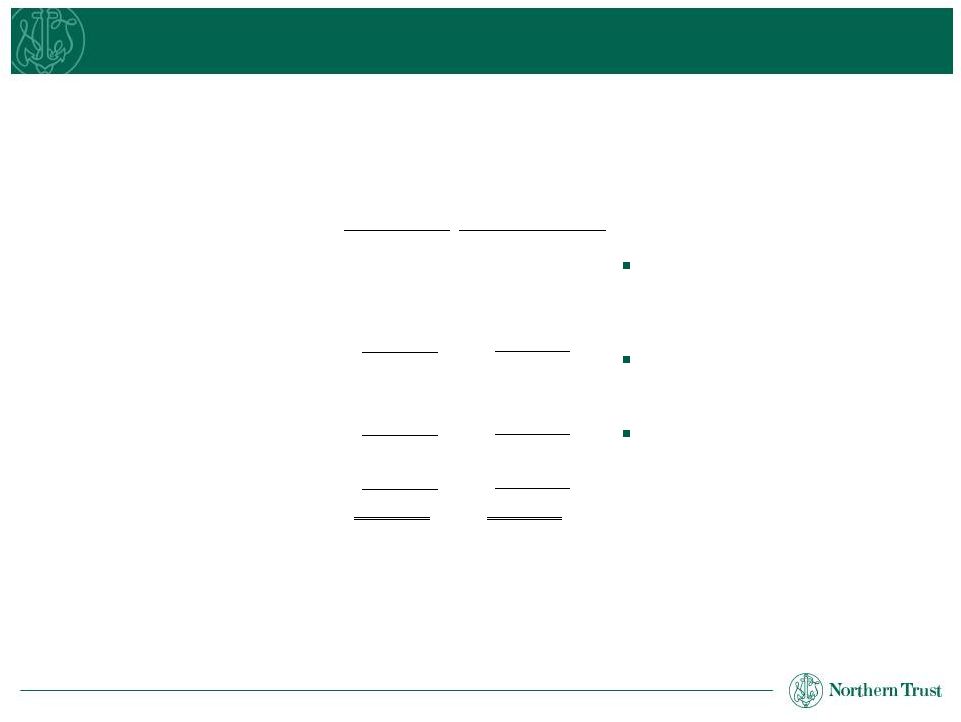
Annual Meeting of Stockholders
1Q12
1Q12 vs 1Q11
Trust, Inv. & Other Servicing Fees
Foreign Exchange Trading Income
Other Non-Interest Income
Net Interest Income
Total Revenues
Non-Interest Expenses
Provision for Credit Losses
Pre-Tax Income
Taxes
Net Income
Earnings per Share
Return on Common Equity
$575
62
72
256
965
723
5
237
76
$161
$0.66
9.0%
+12%
-27%
+13%
+9%
+8%
+11%
-67%
+3%
-4%
+7%
+8%
First Quarter 2012 Financial Performance
($MM, except EPS)
Acquisitions and new business results
delivered revenue growth against the
backdrop of a mixed macroeconomic
environment
Expense growth was impacted by
acquisitions but moderated in the first
quarter as we focused on productivity
We continue to invest in the business |
 14
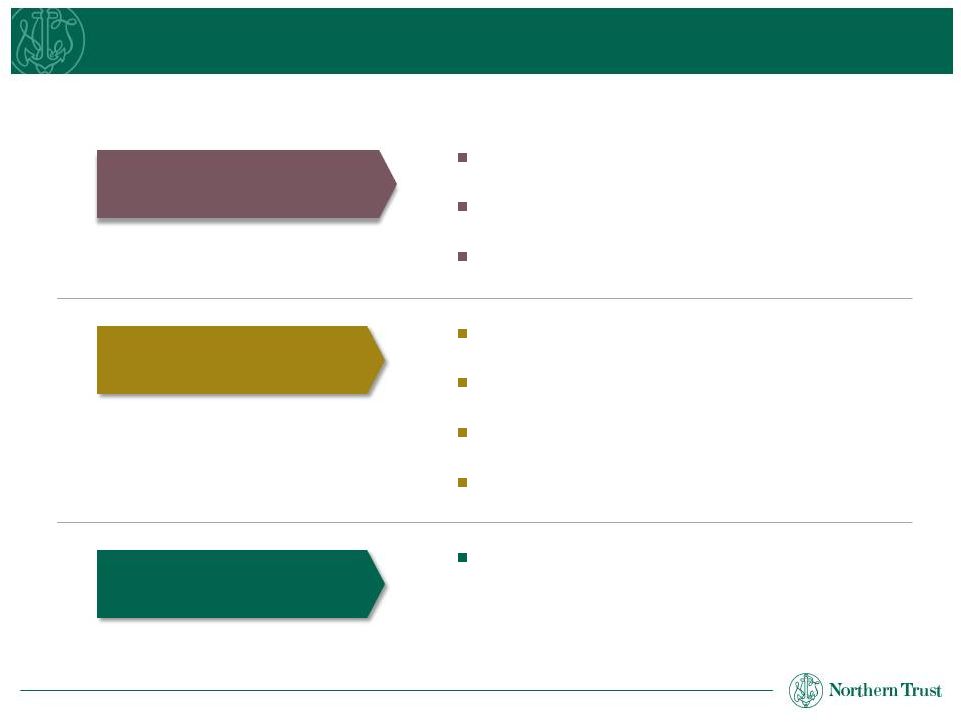
Annual Meeting of Stockholders
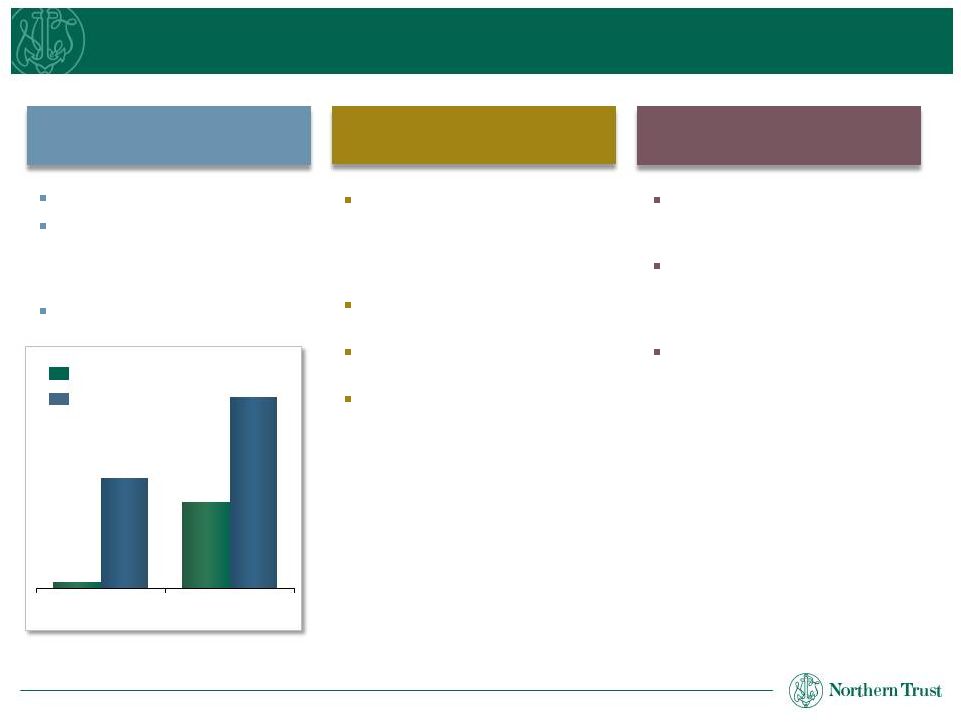
Driving Performance: Overview
Revenue enhancements
Process optimization
Technology efficiency
Corporate-wide initiatives
Maintain client focus
Improve profitability and returns
Advance high performing culture
$250 million by end of 2013
Goals
Drivers of Improvement
Estimated, Annualized
Pre-Tax Impact |
 15
Annual Meeting of Stockholders
Driving Performance: Drivers of Improvement
Fully align value proposition
Unbundle pricing structures
Expand share of relationship
Streamline major business processes
Optimize operational footprint
Apply best-in-class procurement practices
Refine service delivery model
Migrate IT resourcing mix
Rationalize overlapping applications
Manage internal end-user demand
Simplify organizational structure
Align retirement plans with market
Rationalize real estate
Consolidate banking charters
30 –
35%
30 –
40%
5 –
10%
20 –
25%
Process
Optimization
Revenue
Enhancements
Technology
Efficiency
Corporate-wide
Initiatives
Percent of 2013 Impact |
 16
Annual Meeting of Stockholders
Balance Sheet: Consistently Strong and Conservative
Northern Trust data is as of March 31, 2012 and for the quarter then ended.
Peer data is as of the fourth quarter of 2011 as sourced from SNL Financial.
The peer group includes U.S. based banks with assets of more than $50 billion as of
December
31,
2011,
a
group
of
18
institutions
excluding
Northern
Trust.
Northern Trust
Peer Avg.
Relationship-based lending
Diversified by loan type, including
residential real estate (36%),
commercial & institutional (24%),
commercial real estate (10%)
Consistent and conservative
underwriting standards
Placed with banks that have
strong internal risk ratings and
external credit ratings
Includes exposure to banks in
the Eurozone of $3.0 billion,
primarily in the Netherlands
and in the Nordic region
Average duration of less than
2 months
85% of Northern Trust’s total
securities portfolio composed
of U.S. Treasury, government
sponsored agency and triple-A
rated securities
87% of Asset-Backed Securities
rated triple-A
The securities portfolio is in a
net unrealized gain position
Average maturity duration of ~2
years and a re-pricing duration
of ~11 months
Loan Portfolio
$29 billion
Securities
$32 billion
Deposits with Banks
$19 billion
0.08%
0.98%
1.25%
2.16%
NCOs to
Avg. Loans
NPAs
to Loans & REO |
 17
Annual Meeting of Stockholders
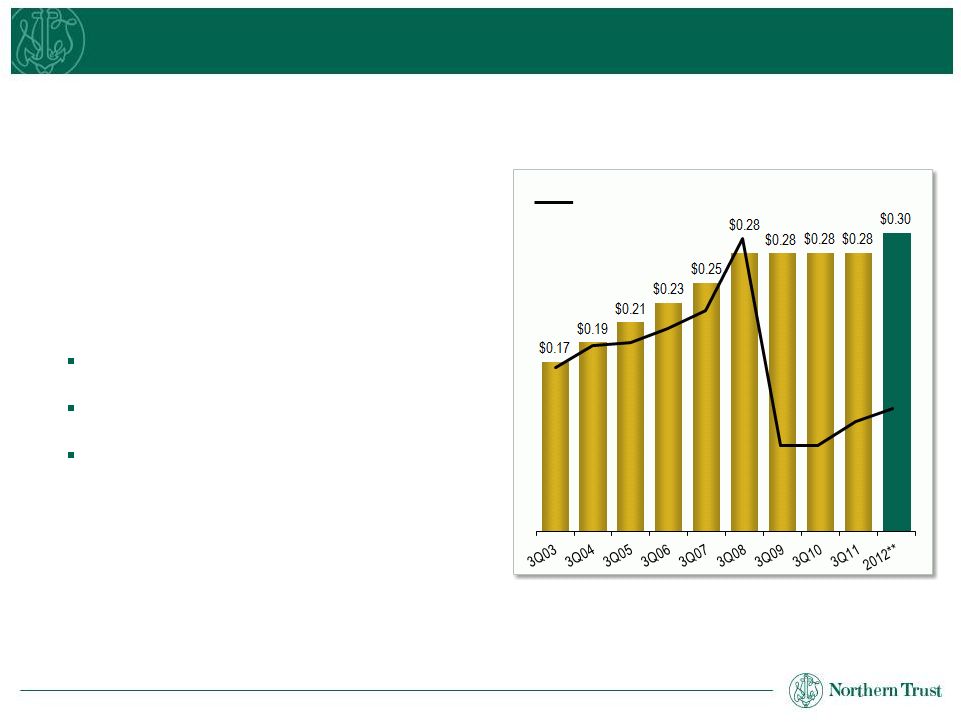
Balance Sheet:
Outstanding Capital Strength
Northern Trust Corporation Capital Ratios
Paid dividends totaling $273 million in 2011 for a
dividend payout ratio of 45%
Announced an increase in our dividend to $0.30
per share
The Federal Reserve did not object to Northern
Trust’s capital plan, including the repurchase of up
to $240 million of common stock through March
2013
Quarterly Dividend Paid
per Common Share
Peer Average***
rd
As of March 31, 2012. Capital ratios are considered preliminary until the 10Q has
been filed with the SEC. *
The
ratio
of
tier
1
common
equity
to
risk-weighted
assets
is
a
non-GAAP
financial
measure.
A
reconciliation
of
tier
1
common
equity
to
tier
1
capital calculated in accordance with applicable regulatory requirements and GAAP
is included in the Appendix on page 24. **2012 figures represent dividend
actions announced upon completion of the Comprehensive Capital Analysis and Review and the Capital
Plan
Review.
For
Northern
Trust,
this
represents
the
dividend
declared
on
March
14,
2012
but
payable
in
the
3
quarter.
***Peer data is indexed based on dividend data sourced from SNL Financial. See note
on slide 17 for a definition of the peer group. Tier 1 Capital Ratio
12.4%
Total Risk-Based Ratio
14.0%
Leverage Ratio
7.6%
Tier 1 Common Equity*
11.9% |
 Annual Meeting of Stockholders
P R I N C I P L E S T H A T E N D U R E
Legacy of Leadership
Service
Expertise
Integrity
northerntrust.com
©
2012 Northern Trust Corporation
Service
Expertise
Integrity |
 19
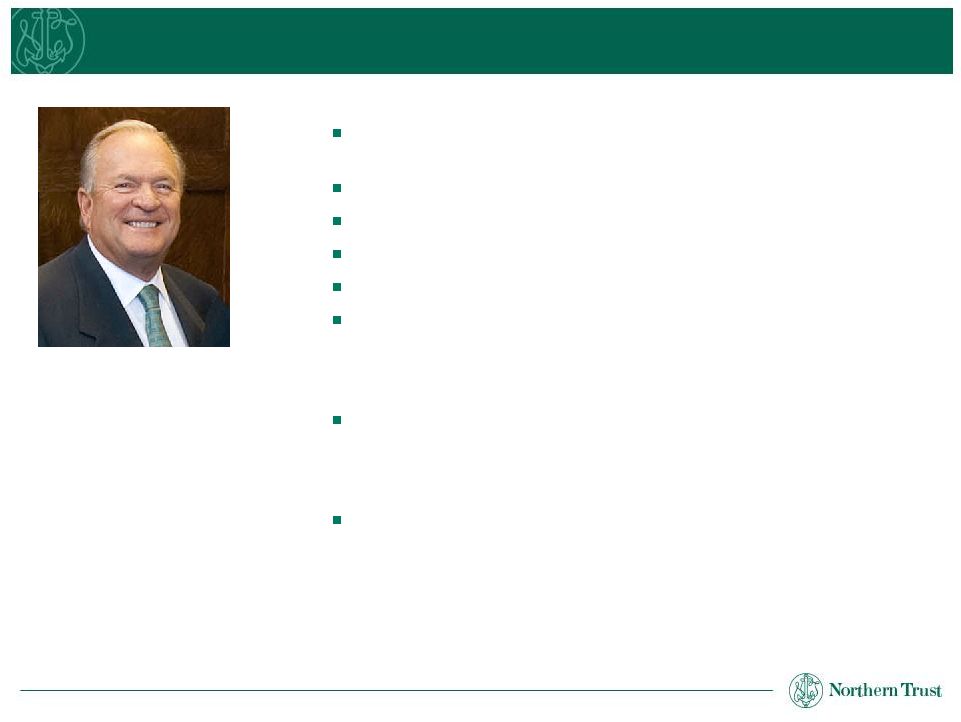
Annual Meeting of Stockholders
Enrique J. Sosa
Director of The Northern Trust Company and Northern Trust
Corporation for 5 years
President, BP Amoco Chemicals, 1999
Executive Vice President, Amoco, Chemicals Sector 1995
Served Dow Chemical Company for 31 years
President, Dow Chemical North America, 1992-1995
Director of other prominent companies including Amtrak, Destec
Energy, Inc., The Dow Corning Corporation, DSM N.V. of the
Netherlands, Electronic Data Systems, FMC Corporation and
MEDNAX, Inc.
Served his community as a member of the Board of Directors
and Executive Committee of the National Parkinson Foundation
and as President of The American Chamber of Commerce, Sao
Paulo, Brazil
During Enrique's tenure as Director, Northern Trust’s average
stockholders’
equity rose from $4.16 billion to $7.02 billion from
2007-2011 and revenue increased from $3.51 billion to $3.77
billion from 2007-2011 |
 20
Annual Meeting of Stockholders
Robert C. McCormack
Director of The Northern Trust Company and Northern Trust
Corporation for 12 years
Co-Founder and Co-Chairman, Trident Capital, Inc. since 1993
Advisory Director, Trident Capital Inc. since 2004
Managing Director, Trident Capital Inc., 1993-2004
Assistant Secretary, U.S. Navy (Financial Management) and
Comptroller, U.S. Navy, 1990-1993
Various positions on staff of U.S. Secretary of Defense,1987-1990
Vice President, Principal and Managing Director, Morgan Stanley &
Co. Incorporated, Chicago office, 1981-1987
Director of other prominent companies including DeVry Inc., Illinois
Tool Works Inc., and MeadWestvaco Corporation
Served community by contributing his time and talent to
organizations such as the Glenwood School for Boys, The
Hotchkiss School, the Illinois Institute of Technology and the
Rehabilitation Institute of Chicago
During Bob's tenure as Director, Northern Trust’s average
stockholders’
equity rose from $2.46 billion to $7.02 billion from
2000-
2011, revenue increased from $2.2 billion to $3.77 billion
from 2000-2011 and net income grew from $485.1 million to $603.6
million from 2000-2011 |
 21
Annual Meeting of Stockholders
Strategically Positioned for Growth
Market Leader in Focused Businesses
Strong History of Organic Growth
Distinctive Financial Strength
Invested & Experienced Management Team |
 Annual Meeting of Stockholders
Northern Trust
Corporation
Annual Meeting of Stockholders
Questions?
Service
Expertise
Integrity
northerntrust.com
©
2012 Northern Trust Corporation
Service
Expertise
Integrity
P R I N C I P L E S T H A T E N D U R E
|
 Annual Meeting of Stockholders
P R I N C I P L E S T H A T E N D U R E
Appendix
Service
Expertise
Integrity
northerntrust.com
©
2012 Northern Trust Corporation
Service
Expertise
Integrity |
 24
Annual Meeting of Stockholders
Reconciliation of Non-GAAP Financial Measures
The following table provides a reconciliation of tier 1 common equity to tier 1
capital calculated in accordance with applicable regulatory requirements
and GAAP. Northern Trust is providing the ratio of tier 1 common equity to
risk-weighted assets in addition to its capital ratios prepared in
accordance with regulatory requirements and GAAP as it is a measure that Northern
Trust and investors use to assess capital adequacy.
March 31,
($ In Millions)
2011
Tier 1 Capital
$
7,157.4
Less: Floating Rate Capital Securities
268.6
Tier 1 Common Equity
$
6,888.8
Ratios
Tier 1 Capital
12.4
%
Tier 1 Common Equity
11.9
% |