Attached files
| file | filename |
|---|---|
| 8-K - FORM 8-K - MidWestOne Financial Group, Inc. | a2012annualmeetingpresenta.htm |
Exhibit 99.1

Annual Shareholder’s Meeting
April 19, 2012
Iowa City, Iowa
Review 2011: Another Year of Progress
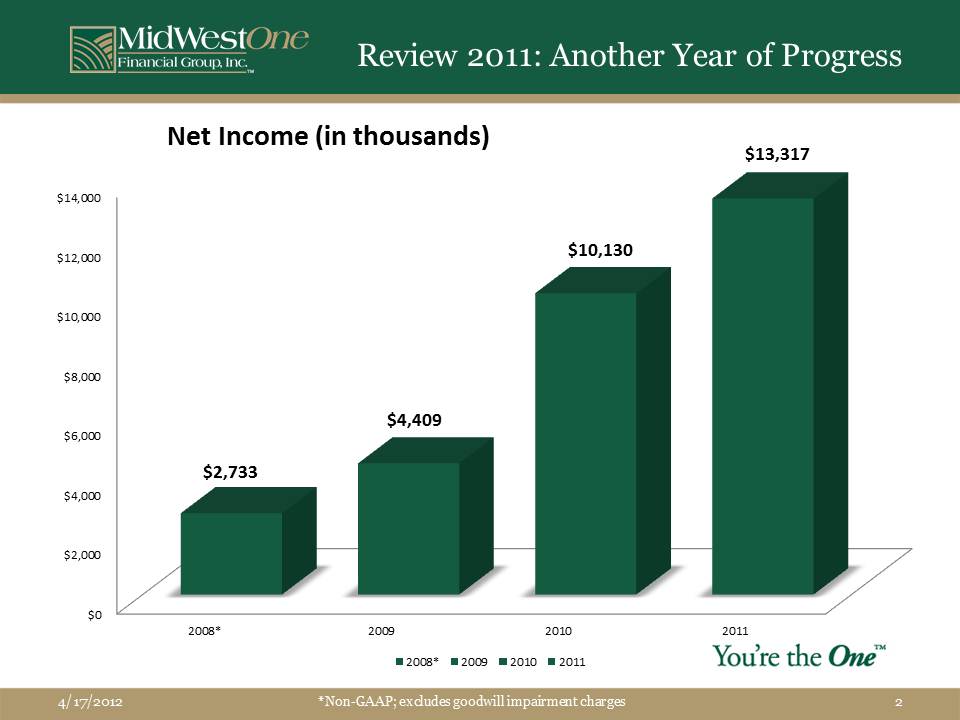
Net Income (in thousands)
*Non-GAAP; excludes goodwill impairment charges

Return on Average Tangible Common Equity (MOFG)
*Non-GAAP; excludes goodwill impairment charges.
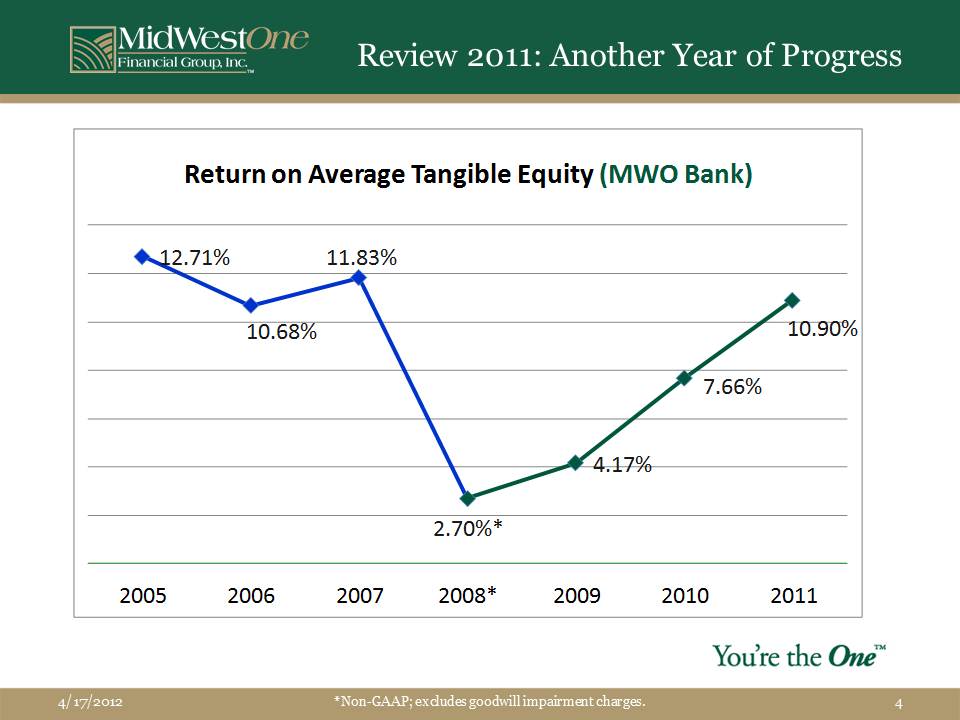
Return on Average Tangible Equity (MWO Bank)
*Non-GAAP; excludes goodwill impairment charges.

Earnings Per Share 2000-2011
* EPS excluding goodwill impairment at 12/31/2008

Total Return Performance
*2005, 2006, and 2007 prices quoted on The Pink Sheets LLC. Data provided by SNL Financial.

Publicly Traded Iowa Depository Institutions
Company City Ticker Market Cap ($M) Price Change 3 Year (%) Price Change 1 Year (%)
MidWestOne Financial Group, Inc. Iowa City MOFG 157.9 125.8 34.7
Meta Financial Group, Inc. Storm Lake CASH 65.3 94.8 23.9
West Bancorporation, Inc. West Des Moines WTBA 168.5 50.1 29.1
Iowa First Bancshares Corp. Muscatine IOFB 31.4 47.4 12.0
QCR Holdings, Inc. Moline QCRH 53.2 41.4 36.8
Ames National Corporation Ames ATLO 210.3 27.8 23.1
Heartland Financial USA, Inc. Dubuque HTLF 277.6 23.4 5.3
Hills Bancorporation Hills HBIA 304.5 20.8 0.2
Two Rivers Financial Group, Inc. Burlington TRVR 33.4 (32.1) (5.0)
National Bancshares, Inc. Bettendorf NABA 20.0 (66.7) 0.0
Iowa Average 104.4 16.6 8.5
Iowa Median 53.2 23.4 5.3
National Average 908.4 10.8 (2.5)
National Median 29.9 2.7 0.0
Balance sheet and income statement data for the quarter ended 12/31/11 where available, otherwise for quarter ended 9/30/11
Institutions sorted by asset size; Excludes M&A targets
Represents price to fully-converted tangible book value for publicly traded MHCs
Excludes renegotiated loans from nonperforming loans
Market Cap as of 03/22/2012
Source: SNL Financial

Bank Balance Sheet Trends 12/31/2011
Loan Portfolio: 2008 2009 2010 2011
Total Bank Loans, net 1,003,837 953,041 922,868 970,497
Bank Loans + Loan Pools, net 1,093,769 1,036,093 988,739 1,020,549
Deposit Portfolio: 2008 2009 2010 2011
Total Deposits 1,128,189 1,179,868 1,219,328 1,306,642
Asset Growth: 2008 2009 2010 2011
Total Assets 1,508,962 1,534,783 1,581,259 1,695,244

Bank Credit Quality Trends
Nonperforming Assets: 2007 2008 2009 2010 2011
NPA’s/ Total Assets 0.18% 1.08% 1.14% 1.49% 1.31%
Charge-offs 2007 2008 2009 2010 2011
NCO’s/ Avg. Loans 0.09% 0.48% 0.48% 0.50% 0.30%
Loan Loss Reserve 2007 2008 2009 2010 2011
LLR/Total Loans 1.36% 1.08% 1.44% 1.62% 1.59%
Bank portfolio only; excludes loan pools

Liquidity
Loan/Deposit Ratio 2007 2008 2009 2010 2011
Bank + Pools/Deposits 76.26% 98.38% 89.18% 82.51% 79.47%

Top Ten Iowa-based Bank Holding Companies by Asset Size
Institution Ticker City Assets (2011)
Heartland Financial USA, Inc. HTFL Dubuque $4,305,058
BTC Financial Corporation - Des Moines $3,090,083
Hills Bancorporation HBIA Hills $2,018,297
MidWestOne Financial Group, Inc. MOFG Iowa City $1,695,244
Stark Bank Group, LTD. - Fort Dodge $1,373,700
Northwest Financial Corp. - Arnolds Park $1,337,527
West Bancorporation WTBA West Des Moines $1,269,524
First Citizens Financial Corp. - Mason City $1,171,387
Ida Grove Bancshares, Inc. - Ida Grove $1,154,534
National Bancshares, Inc. NABA Bettendorf $1,096,123

2011 Expense Control Success
Non-Interest Expense: 2008 – 2011

2011 Expense Control Success
FDIC Premiums: 2006 to 2011

Rewarding Our Shareholders
TARP repaid
Dividend increased from $0.20 $0.34 annually
Share Repurchase Program:
102,190 Shares repurchased at $14.66 (average) in 2011
$3,388,908 returned to our shareholders via dividends and share repurchases in 2011

2012 and Beyond
Industry consolidation
Organic growth
Regulatory challenge

Where do we go from here?

Focus on internal improvement
Improve earnings
Improve efficiency
Grow within our footprint


Serving Our Communities
Our Chairman, Kevin W. Monson

Executive Management Team
Name Position Banking Experience Years with MidWestOne
Charles N. Funk President & CEO 33 Years 12 Years
Susan R. Evans Chief Operating Officer 36 Years 11 Years
Kent L. Jehle EVP, Chief Credit Officer 31 Years 26 Years
Gary J. Ortale EVP, Chief Financial Officer 34 Years 25 Years
Douglas L. Benjamin SVP, Regional President 24 Years 8 Years
James M. Cantrell SVP, Chief Risk Officer 26 Years 3 Years
Barbara A. Finney SVP, Regional President 20 Years 15 Years
Sondra J. Harney SVP, Director of Human Resources 33 Years 33 Years
John J. Henk SVP, Chief Information Officer 25 Years 6 Years
Steven P. Hicks SVP, Regional Credit Manager 24 Years 21 Years
Pamela S. Pothoven SVP, Regional President 29 Years 6 Years
Gregory W. Turner SVP, Wealth Management 15 Years 4 Years

Our Operating Principles
Take care of our customers and those who should be
Hire and retain excellent employees
Always conduct yourself with the utmost integrity
Work as one team
Learn constantly so we can continually improve

Thank you for joining us.