Attached files
| file | filename |
|---|---|
| 8-K - FORM 8-K - CHINA RECYCLING ENERGY CORP | v309492_8k.htm |

Investor Presentation | April 2012 China Recycling Energy Corporation

Safe Harbor Statement This presentation includes or incorporates by reference statements that constitute forward - looking statements within the meaning of Section 27 A of the Securities Act of 1933 , as amended, and Section 21 E of the Securities Exchange Act of 1934 , as amended . These statements relate to future events or to our future financial performance, and involve known and unknown risks, uncertainties and other factors that may cause our actual results, levels of activity, performance, or achievements to be materially different from any future results, levels of activity, performance or achievements expressed or implied by these forward - looking statements . These statements include, but are not limited to, information or assumptions about revenues, gross profit, expenses, income, capital and other expenditures, financing plans, capital structure, cash flow, liquidity, management’s plans, goals and objectives for future operations and growth . In some cases, you can identify forward - looking statements by the use of words such as “may,” “could,” “expect,” “intend,” “plan,” “seek,” “anticipate,” “believe,” “estimate,” “predict,” “potential,” “continue,” or the negative of these terms or other comparable terminology . You should not place undue reliance on forward - looking statements since they involve known and unknown risks, uncertainties and other factors which are, in some cases, beyond our control and which could materially affect actual results, levels of activity, performance, or achievements

Company Overview □ China Recycling Energy Corporation (NASDAQ : CREG) builds, operates, and transfers (BOT) and provides leasing for energy recovery systems . Clients include large, energy intensive industrial plants in the steel, cement, metallurgy, and coal coking industries 3 Symbol: CREG Price: $2.05/share* Shares Outstanding: 46.47M* Market Cap: $95.27M* FY 2011 Revenue: $53.4M FY 2011 Net Income: $21.5M Headquarters: Xi’An, China Attorney: McKenna Long & Aldridge LLP Auditor: Goldman Kurland & Mohidin, LLP (“GKM”), an Independent Member of BDO Seidman Alliance Blast Furnace Top Gas Recovery Turbine Unit (“TRT”) *As of market close 04/05/2012

□ All of CREG’s power systems recover previously wasted, cost free byproducts such as heat, pressure, steam, and other residuals generated during industrial production processes Products & Services Pressure and heat released in production 4 □ CREG’s model creates a win - win situation for both the company and its clients □ CREG provides the initial capex investment for the customer in exchange for a long - term production agreement with attractive returns on investment □ The customers can focus their capital resources on their core businesses while improving their energy efficiency and reducing emissions in compliance with government environmental regulations

Products & Services System Description Application Min. Investment TRT Top gas Recovery Turbine unit, a system that utilizes high pressured gas emitted from the steel blast furnace top to drive turbine units and generate electricity Steel plants $3.5M CHPG Cement Heat Power Generation, a system that collects the waste heat from the entrance and exit ends of cement rotary kilns to generate electricity Cement plants $7M WGPG Waste Gas Power Generation, a system that utilizes flammable waste gas from coal mining, petroleum exploitation and refinery processing as a fuel source to generate electricity Oil refinery plants and coal mining $10M CCPP Combined Cycle Power Plant, a system that generates electricity by burning the previously released gas generated during the iron - making process from blast furnaces. This can be achieved using either the boiler or CCPP turbine method Steel plants and coking factories $25M BWPG Biomass Waste Power Generation, a new energy alternative that utilizes agriculture waste, such as straw, wood, and biogas, as fuel to generate power Agriculture and forestry $15M □ CREG recovers energy in the form of pressure , heat and gas and converts it into electricity . The energy recovery systems can generally be classified into five categories : 5

□ Blast Furnace Top Gas Recovery Units (TRT) □ Steel industry : China has the third largest steel industry in the world and grew at a 20 % rate over the past 5 years □ Energy potential : 38 kWh recovered per ton of steal produced ; equivalent to $ 686 M in electricity revenue □ Regulatory : the Chinese government is requiring all existing and new blast furnaces to install TRT systems ; currently only ~ 50 % are in compliance □ Market size : over 200 TRT projects in China over the next 5 years □ Cement Heat Power Generation (CHPG) □ Cement industry : China produces more than 45 % of the world’s cement, with large scale plants (eligible for CHPG installation) producing more than 1 . 35 billion tons per year □ Energy potential : 38 kWh recovered per ton of cement produced □ Regulatory : the government requires that by 2010 40 % of new, dry - type cement production plants must install CHPG systems (less than 10 % have installed such systems) □ Market size : over 480 CHPG projects in China over the next 5 years Market Outlook – TRT and CHPG 6

□ Waste Gas Power Generation (WGPG) □ Coal coking industry : China’s annual output is reaching 281 million tons ; industry growth rate of 20 % per annum □ Energy potential : 80 kWh recovered per ton of steel produced ; equivalent to $ 1 . 5 B in electricity revenue ( 22 . 5 billion kWh) □ Market size : 300 furnace waste gas projects, 500 blast furnace waste heat projects, 100 glass furnaces □ furnace waste heat projects, 300 non - ferrous metal projects, 300 waste gas power generation projects □ Biomass Waste Power Generation □ Agricultural waste burning industry : the National Development and Reform Commission (NRDC) expects the industry to rapidly expand as supportive policies, new technologies, and raw material collection infrastructure materialize □ Under China's 12 th Five - Year Plan from 2011 to 2015 , energy efficiency and alternative energy technologies (including biomass fueled electricity) are top priorities □ Energy potential : when sold to the state grid, recycled biomass waste has a preferential price of RMB 0 . 25 per kWh versus coal fueled power □ Regulatory : Straw power plants receive preferential tax treatment and subsidies Market Outlook – WGPG and BWPG 7
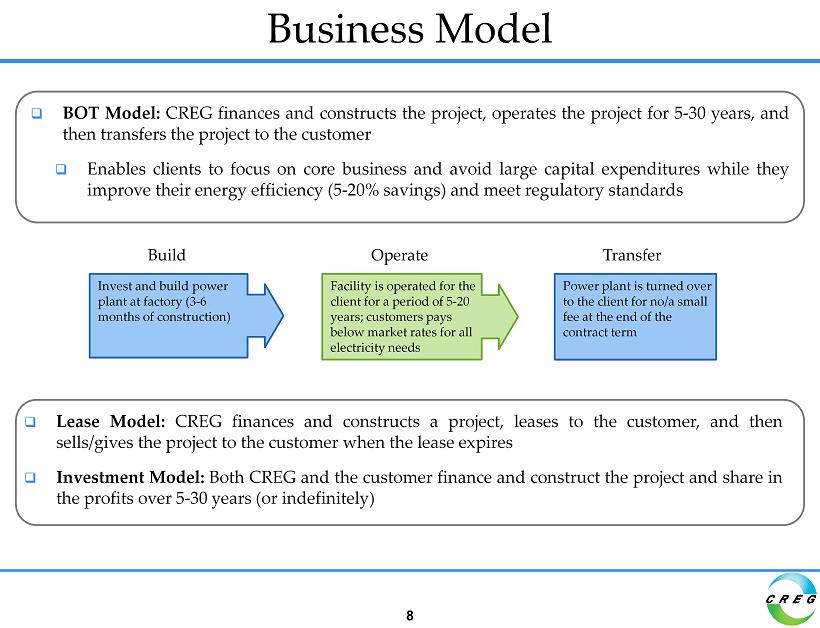
Business Model □ BOT Model : CREG finances and constructs the project, operates the project for 5 - 30 years, and then transfers the project to the customer □ Enables clients to focus on core business and avoid large capital expenditures while they improve their energy efficiency ( 5 - 20 % savings) and meet regulatory standards Build Operate Transfer Invest and build power plant at factory (3 - 6 months of construction) Facility is operated for the client for a period of 5 - 20 years; customers pays below market rates for all electricity needs Power plant is turned over to the client for no/a small fee at the end of the contract term □ Lease Model : CREG finances and constructs a project, leases to the customer, and then sells/gives the project to the customer when the lease expires □ Investment Model : Both CREG and the customer finance and construct the project and share in the profits over 5 - 30 years (or indefinitely) 8

□ Secure recurring revenues □ Operational periods typically range from 5 to 20 years □ Electricity sales are secured by long - term electricity production agreements with customers ; include built in guarantees of reaching minimum operational hours per year □ Internal systematic approval process, including detailed due diligence, minimizes operational and collection risk □ For private businesses, CREG requires mortgage, collateral, personal and third party guarantees and/or three months of payments upfront □ Rapid payback (See Appendix A) □ Payback typically achieved within 3 to 4 years □ Weighted average unlevered IRR of 20 % + on current and under construction projects Business Model 9

□ Current CREG projects (See Appendix A) □ One TRT project, two CHPG projects, six Heat Recovery/WGPG projects and two BWPG project are in operation (total capacity of 108 MW) □ Two heat recovery/WGPG projects are under construction (total capacity 48 MW) □ MOU’s for six other TRT, CHPG, and WGPG projects (total capacity 279 MW) □ Relationships with Chinese industrial giants □ Sino - Steel Group, Binhai Branch - China’s largest nickel steel plant □ Erdos Metallurgy Co . - the world’s largest ferrosilicon alloy plant □ Shengwei Cement Group - major Chinese cement producer Business Growth 10

Technology □ 40+ engineers, 80% of whom have over 15 years of experience □ Self - owned Xingtai Iron & Steel design institute is capable of consulting, engineering and supervising responsibilities for TRT, waste heat, and waste gas power generation projects □ Two self - owned patents as well as six authorized - to - use patents □ Will be applying for 10 patents stemming from Erdos WGPG project □ CREG is cooperating with design institutes and companies in the steel, construction material, metallurgy, chemical, and petrochemical sectors to achiever better integration of power generation devices with the main projects 11

□ Electricity generated by CREG’s power systems is extremely low cost because there are no external fuel sources required □ Beyond cost savings, CREG’s systems allow customers to reduce their environmental footprint by mitigating reliance on fossil fuels (See Appendix A) Alternative Energy Generation Power Type Current Market Share Capital Investment per kW Power Generation Cost per kW CREG’s Waste Heat & Pressure Systems 0.08% $600 - 1,070 $0.0043 - 0.0100 Thermal Power 72.22% $640 - 1,140 $0.0214 - 0.0271 Hydroelectricity 26.80% $860 - 1,430 $0.0057 - 0.0129 Nuclear Power 0.70% $1,450 - 1,670 $0.0229 Solar Power 0.08% $2,000 - 2,570 $0.2857 - 0.4286 Others 0.10% $1,140 - 1,430 $0.0170 - 0.0230 Source: Industrial Association’s Reports and CREG’s Estimates 12

□ CREG combines bank, design institute, EPC/turnkey provider, and project operator functionalities ; there is no direct competitor who provides all these services in one package □ Future competition could arise if EPC or equipment providers acquire the financial platform to offer BOT services Competition Technology Entry Barriers Experience Track record Capital Customer Relationships □ Government owned research institutes □ CREG offers a competitive alternative to TRT systems developed in - house and has little competition from other outsourcing options □ WGPG technology is relatively new to China, and there are few sizable factories capable of developing their own systems ; most existing WGPG systems are small in scale 13

Experienced Management □ Mr . Ku Guohua – Founder, CEO, and Chairman □ More than 20 years of experience in TRT technology, design, R&D, and project management □ Involved in the first set of TRT installation and operation in China □ Mr . David Chong – CFO □ More than two decades of experience in medium to large, private and publicly listed manufacturing companies □ Familiar with Chinese, Singaporean, American, European, and other capital markets □ Qualification from the Association of Chartered Certified Accountants (ACCA) □ Mr . Wu Zhigang – Vice President, Finance □ Responsible for the securities and financing activities of the Company □ Over 10 years experience at Guotai - Junan Securities and Zhongzheng Investment 14

Goals □ Immediate to mid - term goals □ Improve visibility in North America and Europe □ Initiate large - scale total solutions projects that combine pressure, heat, and gas recovery projects at one site □ Strengthen brand campaign □ Increase market share and shareholder value □ Further business development in new application areas of energy recycling □ Longer term plan □ Expand operations globally □ Penetrate into new green energy product categories □ Continue to maximize the interests of shareholders 15
Investment Highlights 16 □ Unique business model is key to market success □ The only listed waste - energy recovery BOT pure - play □ No direct competitors with a comparable combination of technical and financial resources □ Offers affordable and flexible financial solutions for reducing energy costs and emissions while extending the life of primary manufacturing equipment □ Emerging sector in China with strong government support □ Tax incentives : 15 % preferential corporate income tax (versus 25 % ) ; “Energy Management Contract” (EMC) qualifies the company for additional tax incentives □ Named a qualified Energy Saving Service Provider under the Chinese MOF & NDRC Joint Gazette □ Stricter environmental regulations in key industries call for greater energy efficiency □ Rapidly growing Chinese economy requires significant industrial expansion, broadening the potential client base for CREG technology and service 16

Investment Highlights 17 □ Strong institutional investor support □ Carlyle Asia Growth □ Invested $ 18 million in equity and convertible notes to become the second largest shareholder □ Cinda Asset Management Co . , Ltd (owned by Chinese Ministry of Finance) □ Agreed to provide financing channels from affiliates, as well as first right of refusal to all Cinda portfolio companies with high project values □ Long term sustainability □ Self - owned R&D center as well as several partnerships with design and engineering institutions □ Diversified business model and product line allow CREG to provide dynamic solutions to clients in rapidly changing economic, political and industrial environments 17
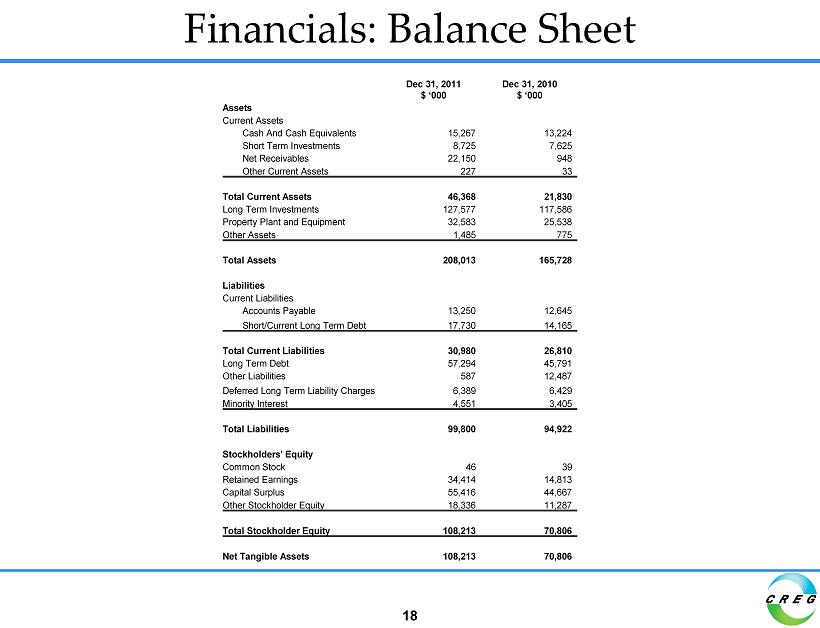
Financials: Balance Sheet 18 Dec 31, 2011 $ ‘000 Dec 31, 2010 $ ‘000 Assets Current Assets Cash And Cash Equivalents 15,267 13,224 Short Term Investments 8,725 7,625 Net Receivables 22,150 948 Other Current Assets 227 33 Total Current Assets 46,368 21,830 Long Term Investments 127,577 117,586 Property Plant and Equipment 32,583 25,538 Other Assets 1,485 775 Total Assets 208,013 165,728 Liabilities Current Liabilities Accounts Payable 13,250 12,645 Short/Current Long Term Debt 17,730 14,165 Total Current Liabilities 30,980 26,810 Long Term Debt 57,294 45,791 Other Liabilities 587 12,487 Deferred Long Term Liability Charges 6,389 6,429 Minority Interest 4,551 3,405 Total Liabilities 99,800 94,922 Stockholders' Equity Common Stock 46 39 Retained Earnings 34,414 14,813 Capital Surplus 55,416 44,667 Other Stockholder Equity 18,336 11,287 Total Stockholder Equity 108,213 70,806 Net Tangible Assets 108,213 70,806

Financials: Operating Results 19 Fiscal Year Fiscal Year Fiscal Year Fiscal Year Fiscal Year 2007 2008 2009 2010 2011 Sales of Systems 9,302,347 8,048,956 38,286,835 74,280,703 30,106,354 Rental Income 0 11,168,707 5,948,373 1,324,835 1,183,510 Total Revenue 9,302,347 19,217,663 44,235,208 75,605,538 31,289,864 Cost of Sales 7,033,400 14,001,736 33,601,015 57,033,984 23,013,807 Interest Income on Sales Type Leases 1 1,015,712 2,258,582 7,052,574 15,136,643 22,104,162 Operating Expenses 542,434 3,354,028 4,194,632 6,340,426 4,738,266 Non - operating Income (Expenses) (425,964) (4,734,308) (483,992) (2,675,662) 989,032 Income before Tax 2,316,261 (613,827) 13,008,143 24,692,109 26,630,985 Add: Income from Discontinued Operations 28,699 0 0 0 0 Less: Tax 466,647 1,632,754 2,946,387 6,866,040 4,232,945 Less: Non controlling interest 0 83 352,480 1,793,472 948,161 Net Income 1,878,313 (2,246,664) 9,709,276 16,032,597 21,449,879 1 See Appendix B for explanation of sales - type lease accounting procedures

Financials: Statement of Cash Flows 20 Dec 31, 2011 Dec 31, 2010 Dec 31, 2009 $ ‘000 $ ‘000 $ ‘000 Cash Flows From Operating Activities Net Income 21,450 16,033 9,709 Depreciation 12,214 1,813 35 Adjustments To Net Income (48,668) (54,403) (34,223) Changes In Accounts Receivables (2,488) 1,052 (1,777) Changes In Liabilities (2,010) 4,632 357 Changes In Inventories - - 10,540 Changes In Other Operating Activities 1,321 14,777 (22,480) Total Cash Flow From Operating Activities (17,234) (14,302) (37,486) Cash Flows From Investing Activites Capital Expenditures (8) (82) (33) Investments - - (16) Other Cash flows from Investing Activities 1,897 (631) (1,461) Total Cash Flows From Investing Activities 1,889 (713) (1,511) Cash Flows From Financing Activities Dividends Paid - - - Sale Purchase of Stock - 1,339 2,263 Net Borrowings 18,877 23,660 30,021 Other Cash Flows from Financing Activities (395) - - Total Cash Flows From Financing Activities 18,482 24,999 32,841 Effect Of Exchange Rate Changes 740 (23) 0 Change In Cash and Cash Equivalents 3,877 9,960 (6,155)

Financials: Interest Income $1,016 $2,259 $7,053 $15,137 $22,104 $0 $5,000 $10,000 $15,000 $20,000 $25,000 2007 2008 2009 2010 2011 Interest Income on Sale - Type Leases (in 000's) 21

Appendix A: Project Info Type Project Name Start Date Project Life MW Tons of Coal Saved Tons of CO 2 Reduction Unleveraged IRR Payback Period TRT Zhangzhi Iron & Steel Q2 2007 13 9.0 26,460 59,270 48% 3 CHPG Shengwei Tongchuan Q4 2008 5 9.0 26,460 59,270 44% 3 CHPG Shengwei Jinyang Q2 2009 5 9.0 26,460 59,270 41% 3 WGPG Erdos Phase I, Project 1 Q4 2009 20 18.0 26,460 59,270 22% 5 WGPG Erdos Phase I, Project 2 Q1 2010 20 9.0 26,460 59,270 22% 6 BWPG Pucheng Biomass Q2 2010 15 12.0 35,280 79,000 22% 6 WGPG SinoSteel Binghai I Q3 2010 9 7.0 20,580 46,100 23% 5 WGPG Erdos Phase II Q1 2011 20 27.0 NA NA 22% 5 BWPG Shenqiu Biomass Q3 2011 11 12.0 NA NA 20% 5 WGPG Erdos Phase III Under Construction 20 25.0 NA NA 22% 5 WGPG Datong Coal – Tongmei Under Construction 20 23.0 NA NA 21% 5 22

Appendix B: Notes on Sales - Type Lease □ Notes on sales - type lease accounting □ During construction expenses incurred are capitalized as construction in progress □ Upon completion of construction, a one - time sale is recorded with approximately 30 % margin □ During the Lease □ An investment in a sales - type lease is recorded as the sum of the total minimum lease payments receivable less unearned interest income □ Interest income is recognized from the recurring cash lease payments over the course of the lease term at a constant periodic rate □ Contingent rental income is recognized when the actual electricity usage is in excess of the minimum lease payments) □ All cash flow of the Company is reflected in the lease payments and contingent income as they are realized by the Company □ When the lease expires the project is “sold” to the customer either at no charge or for a nominal fee 23