Attached files
| file | filename |
|---|---|
| EX-23.2 - CONSENT OF GRANT THORNTON LLP - CHESAPEAKE OILFIELD SERVICES INC | d330734dex232.htm |
| EX-23.1 - CONSENT OF PRICEWATERHOUSECOOPERS LLP - CHESAPEAKE OILFIELD SERVICES INC | d330734dex231.htm |
Table of Contents
Index to Financial Statements
As filed with the Securities and Exchange Commission on April 16, 2012
Registration No. 333-
UNITED STATES
SECURITIES AND EXCHANGE COMMISSION
Washington, D.C. 20549
Form S-1
REGISTRATION STATEMENT
UNDER
THE SECURITIES ACT OF 1933
Chesapeake Oilfield Services, Inc.
(Exact name of registrant as specified in its charter)
| Oklahoma | 1389 | 45-5011340 | ||
| (State or other jurisdiction of incorporation or organization) |
(Primary Standard Industrial Classification Code Number) |
(I.R.S. Employer Identification No.) |
6100 North Western Avenue
Oklahoma City, Oklahoma 73118
(405) 848-8000
(Address, including zip code, and telephone number, including area code, of registrant’s principal executive offices)
Jerry L. Winchester
Chief Executive Officer
6100 North Western Avenue
Oklahoma City, Oklahoma 73118
(405) 848-8000
(Name, address, including zip code, and telephone number, including area code, of agent for service)
Copies to:
| Michael S. Telle Bracewell & Giuliani LLP 711 Louisiana Street, Suite 2300 Houston, Texas 77002 (713) 221-1327 |
William S. Moss III Mayer Brown LLP 700 Louisiana Street, Suite 3400 Houston, Texas 77002 (713) 238-2649 |
Approximate date of commencement of proposed sale to the public: As soon as practicable after the effective date of this registration statement.
If any of the securities being registered on this Form are to be offered on a delayed or continuous basis pursuant to Rule 415 under the Securities Act of 1933 check the following box: ¨
If this Form is filed to register additional securities for an offering pursuant to Rule 462(b) under the Securities Act, please check the following box and list the Securities Act registration statement number of the earlier effective registration statement for the same offering. ¨
If this Form is a post-effective amendment filed pursuant to Rule 462(c) under the Securities Act, check the following box and list the Securities Act registration statement number of the earlier effective registration statement for the same offering. ¨
If this Form is a post-effective amendment filed pursuant to Rule 462(d) under the Securities Act, check the following box and list the Securities Act registration statement number of the earlier effective registration statement for the same offering. ¨
Indicate by check mark whether the registrant is a large accelerated filer, an accelerated filer, a non-accelerated filer, or a smaller reporting company. See the definitions of “large accelerated filer,” “accelerated filer” and “smaller reporting company” in Rule 12b-2 of the Exchange Act. (Check one):
| Large accelerated filer | ¨ | Accelerated filer | ¨ | |||
| Non-accelerated filer | þ (Do not check if a smaller reporting company) | Smaller reporting company | ¨ |
CALCULATION OF REGISTRATION FEE
|
| ||||
| Title of Each Class of Securities to Be Registered |
Proposed Maximum Aggregate Offering Price(1)(2) |
Amount of Registration Fee | ||
| Class A Common Stock, par value $0.001 per share |
$862,500,000 | $98,843 | ||
|
| ||||
|
| ||||
| (1) | Estimated solely for the purpose of calculating the registration fee pursuant to Rule 457(o) under the Securities Act of 1933, as amended. |
| (2) | Includes approximately $112,500,000 attributable to shares of Class A common stock that may be offered upon exercise of a 30-day option to purchase additional shares granted to the underwriters. |
The registrant hereby amends this registration statement on such date or dates as may be necessary to delay its effective date until the registrant shall file a further amendment which specifically states that this registration statement shall thereafter become effective in accordance with Section 8(a) of the Securities Act of 1933 or until the registration statement shall become effective on such date as the Commission acting pursuant to said Section 8(a), may determine.
Table of Contents
Index to Financial Statements
The information in this preliminary prospectus is not complete and may be changed. These securities may not be sold until the registration statement filed with the Securities and Exchange Commission is effective. This preliminary prospectus is not an offer to sell nor does it seek an offer to buy these securities in any jurisdiction where the offer or sale is not permitted.
Subject to Completion
Preliminary Prospectus dated April 16, 2012
Shares

Chesapeake Oilfield Services, Inc.
Class A Common Stock
This is an initial public offering of the Class A common stock of Chesapeake Oilfield Services, Inc. We are offering shares of our Class A common stock.
Prior to this offering, there has been no public market for our Class A common stock. We anticipate that the initial public offering price of our Class A common stock will be between $ and $ per share. We intend to apply to list our Class A common stock on the New York Stock Exchange under the symbol “COS.”
Concurrently with the consummation of this offering, we will issue shares of our Class B common stock, each share of which initially entitles the holder to votes per share, to Chesapeake Energy Corporation. Through its ownership of our Class B common stock, Chesapeake will hold % of the combined voting power of our outstanding common stock immediately after this offering.
See “Risk Factors” on page 25 to read about factors you should consider before buying shares of our Class A common stock.
Neither the Securities and Exchange Commission nor any state securities commission has approved or disapproved of these securities or passed upon the accuracy or adequacy of this prospectus. Any representation to the contrary is a criminal offense.
| Per Share | Total | |||||||
| Initial public offering price |
$ | $ | ||||||
| Underwriting discount |
$ | $ | ||||||
| Proceeds, before expenses, to Chesapeake Oilfield Services, Inc. |
$ | $ | ||||||
The underwriters have the option, exercisable for 30 days from the date of this prospectus, to purchase up to additional shares of our Class A common stock at the initial public offering price less the underwriting discount.
The underwriters expect to deliver the shares against payment in New York, New York on , 2012.
| Goldman, Sachs & Co. | BofA Merrill Lynch |
Prospectus dated , 2012.
Table of Contents
Index to Financial Statements
| Page | ||||
| 1 | ||||
| 25 | ||||
| 47 | ||||
| 48 | ||||
| 51 | ||||
| 53 | ||||
| 54 | ||||
| 55 | ||||
| MANAGEMENT’S DISCUSSION AND ANALYSIS OF FINANCIAL CONDITION AND RESULTS OF OPERATIONS |
57 | |||
| 79 | ||||
| 102 | ||||
| 106 | ||||
| 114 | ||||
| 116 | ||||
| 121 | ||||
| 123 | ||||
| 125 | ||||
| MATERIAL U.S. FEDERAL INCOME TAX CONSIDERATIONS TO NON-U.S. HOLDERS |
134 | |||
| 138 | ||||
| 144 | ||||
| 144 | ||||
| 145 | ||||
| F-1 | ||||
Through and including , 2012 (the 25th day after the date of this prospectus), all dealers effecting transactions in these securities, whether or not participating in this offering, may be required to deliver a prospectus. This is in addition to a dealer’s obligation to deliver a prospectus when acting as an underwriter and with respect to an unsold allotment or subscription.
We have not authorized anyone to provide any information or to make any representations other than those contained in this prospectus or in any free writing prospectuses we have prepared. We take no responsibility for, and can provide no assurance as to the reliability of, any other information that others may give you. This prospectus is an offer to sell only the shares offered hereby, but only under circumstances and in jurisdictions where it is lawful to do so. The information contained in this prospectus is current only as of its date.
Industry and Market Data
The market data and certain other statistical information used throughout this prospectus, including statements as to our ranking, market position and market estimates, are based on independent industry publications, government publications or other published independent sources. Some data is also based on our good faith estimates. Prospective investors are cautioned not to place undue reliance on such data and information due to the fact that it may be based on our estimates or, if derived from a third party, we have not verified it.
i
Table of Contents
Index to Financial Statements
This summary provides a brief overview of information contained elsewhere in this prospectus. This summary does not contain all of the information that you should consider before investing in our Class A common stock. You should read the entire prospectus carefully before making an investment decision, including the information presented under the headings “Risk Factors,” “Cautionary Note Regarding Forward-Looking Statements,” “Organizational Structure” and “Management’s Discussion and Analysis of Financial Condition and Results of Operations” and the historical consolidated financial statements and related notes thereto included elsewhere in this prospectus.
On October 25, 2011, Chesapeake completed the process of reorganizing its oilfield services subsidiaries and operations as subsidiaries of COS Holdings, L.L.C. (“COS LLC”) and commenced providing all of its oilfield services through COS LLC, as more fully described under “Organizational Structure.” As a result, the historical financial information presented in this prospectus for periods and as of dates prior to that October 25, 2011 reorganization is the historical consolidated financial information of our “predecessor” or “Chesapeake Oilfield Services Predecessor.” The historical financial information presented in this prospectus for periods and as of dates on or after that October 25, 2011 reorganization is the historical consolidated financial information of COS LLC.
In this prospectus, unless the context otherwise requires, the terms “we,” “us,” “our” or “ours” refer to COS LLC and its subsidiaries and predecessor entities prior to this offering and to Chesapeake Oilfield Services, Inc. (“COS Inc.”) and its subsidiaries, including COS LLC, from and after this offering. See “—Organizational Structure.” References to “Chesapeake Oilfield Operating” or “COO” mean Chesapeake Oilfield Operating, L.L.C., a wholly owned subsidiary of COS LLC, which is the borrower under our revolving bank credit facility and the co-issuer of our 6.625% Senior Notes due 2019 (the “2019 Senior Notes”). References to “Chesapeake” mean Chesapeake Energy Corporation and its subsidiaries (excluding us), unless the context indicates otherwise.
Our Company
We are a diversified oilfield services company that provides a wide range of well site services primarily to Chesapeake, our founder and principal customer, and its partners. Chesapeake is the most active driller of new oil and natural gas wells in the U.S. based on rig count. We focus on providing services to Chesapeake that are strategic to its oil and gas operations, represent historical bottlenecks to those operations or provide relatively high margins to the service provider, including drilling, hydraulic fracturing, oilfield rentals, oilfield trucking and manufacturing of natural gas compressor packages. Our operations are geographically diversified across most major basins in the U.S. Specifically, we provide Chesapeake and its partners with services in the Eagle Ford, Utica, Granite Wash, Cleveland, Tonkawa, Mississippi Lime, Bone Spring, Avalon, Wolfcamp, Wolfberry and Niobrara unconventional liquids plays and the Barnett, Haynesville, Bossier, Marcellus and Pearsall natural gas shale plays.
Our objective is to provide up to two-thirds of Chesapeake’s overall expected needs for our current and future services. This objective, combined with our unique relationship with Chesapeake, makes us fundamentally different than our competitors because it provides us with substantial growth opportunities while at the same time positioning us to maintain our industry-leading asset utilization rates. We believe that our high-growth, high-utilization business model will allow us to continue creating significant shareholder value over time.
1
Table of Contents
Index to Financial Statements
Our business has grown rapidly since our first subsidiary was founded in 2001, both organically and through acquisitions, and we are now one of the larger U.S. onshore oilfield service companies. We currently operate 111 land drilling rigs, the fourth largest active rig fleet in the U.S., which represents our largest revenue generating service line today. We also operate (a) four hydraulic fracturing fleets with an aggregate of 140,000 horsepower; (b) one of the largest oilfield rental businesses in the U.S.; (c) one of the largest oilfield trucking fleets in the U.S., currently consisting of 227 rig relocation trucks, 57 cranes and forklifts used in the movement of drilling rigs and other heavy equipment and 157 fluid hauling trucks; and (d) manufacturing capacity for up to 150 compressor units per quarter, or approximately 85,000 horsepower in the aggregate per quarter. We continue to grow our assets rapidly and have ordered 12 drilling rigs that will utilize advanced electronic drilling technology, including 10 of our proprietary, fit-for-purpose PeakeRigs™, which are scheduled to be delivered at a rate of approximately one rig per month through May 2013. We have also ordered additional new hydraulic fracturing equipment with an aggregate of 175,000 horsepower, and we expect to have eight hydraulic fracturing fleets with an aggregate of 315,000 horsepower operating by the end of 2012 and 12 such fleets with an aggregate of 450,000 horsepower operating by the end of 2013. We believe our growth plans will place us among the largest hydraulic fracturing companies in the U.S. by year-end 2014 based on horsepower.
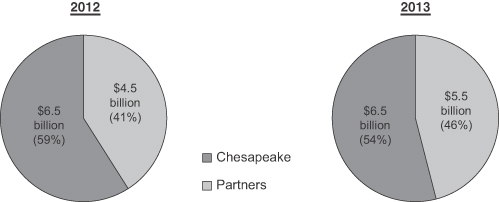
The services that we provide to Chesapeake are fundamental to establishing and maintaining the production of oil and natural gas from its wells. As of December 31, 2011, Chesapeake had total estimated net proved reserves of approximately 18.8 trillion cubic feet of natural gas equivalent (tcfe), which includes approximately 545 million barrels (mmbbls) of oil and natural gas liquids, which we refer to collectively as “liquids,” and was operating 162 drilling rigs to develop its inventory of approximately 39,000 risked net drill sites. During 2011, Chesapeake utilized hydraulic fracturing fleets with an average of approximately 1.0 million horsepower per day. For 2012 and 2013, Chesapeake’s gross operated drilling and completion capital expenditure budgets are approximately $11.0 billion and $12.0 billion, respectively.
Chesapeake’s operated drilling program includes expenditures by both Chesapeake and its partners. The charts below show the percentage of budgeted capital expenditures expected to be funded by Chesapeake and its partners in 2012 and 2013.
Chesapeake’s Gross Operated Drilling and Completion
Capital Expenditure Budget
2
Table of Contents
Index to Financial Statements
We currently supply Chesapeake with small percentages of its overall requirements for most of our services, which presents us with significant organic growth opportunities. For example, during the year ended December 31, 2011, our revenues from hydraulic fracturing represented less than 1% of Chesapeake’s gross operated expenditures for hydraulic fracturing services and our revenues from oilfield equipment rentals would have represented approximately 19% of its gross operated expenditures for oilfield equipment rentals. Additionally, although we already supply approximately two-thirds of Chesapeake’s current drilling rig needs, we provide low percentages of the drilling-related services it uses, such as directional drilling, mud logging and geosteering services, providing us with significant organic growth opportunities for those services as well. Likewise, while our trucking segment provides Chesapeake with a significant percentage of its rig relocation services, we provide only a small percentage of its fluid hauling requirements.
By seeking to match our productive capacity to meet up to two-thirds of Chesapeake’s expected need for our services, we anticipate that we will continue to have industry-leading asset utilization levels through industry cycles, as we believe that Chesapeake will have a number of incentives to use our services given our relationship and the operational efficiencies we provide. Moreover, Chesapeake’s drilling activity levels over time have been more stable than those of its peers. For example, in the twelve-month period ended September 30, 2009, one of the most challenging periods in the recent history of our industry, the U.S. onshore industry rig count decreased by 1,308 rigs, or 50%, while Chesapeake’s operated rig count, which includes third-party rigs, decreased by only 53 rigs, or 34%. During that same period, Chesapeake’s utilization of our rigs increased by six rigs, from 71 to 77, or 8%. Our rig utilization rates for 2009, 2010 and 2011 were 95%, 97% and 98%, respectively, compared to industry averages for the same periods of 79%, 89% and 88%, respectively. The utilization rates of our other assets are correlated with our rig utilization rates because the well drilling performed by our rigs creates demand for most of the other services we provide.
Significantly, we also have contractual arrangements with Chesapeake that provide additional revenue stability in the event of an industry downturn. Under our services agreement with Chesapeake, Chesapeake has guaranteed the utilization of the lesser of 75 of our drilling rigs or 80% of our operational drilling rig fleet at market-based rates. In addition, Chesapeake has guaranteed that each month it will ensure utilization of our operational hydraulic fracturing fleets, up to a maximum of 13 fleets, to complete a minimum aggregate number of fracturing stages equal to 25 stages per month for each fleet at market-based rates.
We currently conduct our business through five operating segments:
Drilling. Nomac Drilling, L.L.C., our drilling subsidiary, provides premium land drilling and drilling-related services, including directional drilling, geosteering and mudlogging, for oil and natural gas exploration and development activities. As of March 31, 2012, we operated a fleet of 111 land drilling rigs, making us the fourth largest land driller operating in the U.S. according to RigData, an independent source of drilling activity information. To address Chesapeake’s needs for horizontal drilling in shale formations and other unconventional resource plays, we have expanded our areas of operation and improved the capability of our drilling rig fleet. We are in the process of building 12 new rigs that will utilize advanced electronic drilling technology, including 10 of our proprietary, fit-for-purpose PeakeRigs™, which are scheduled to be delivered at a rate of approximately one rig per month through May 2013. We are also in the process of refurbishing three rigs in order to modernize and increase the capability of those rigs. For the year ended December 31, 2011, Chesapeake’s gross operated expenditures for drilling and drilling-related services were approximately $1.7 billion, and our revenues from this segment represented approximately 50% of such expenditures.
3
Table of Contents
Index to Financial Statements
Hydraulic Fracturing. Performance Technologies, L.L.C., our hydraulic fracturing subsidiary, provides hydraulic fracturing and other well stimulation services. We began hydraulic fracturing operations in the fourth quarter of 2011 with one hydraulic fracturing fleet and currently have four operational fleets with an aggregate of approximately 140,000 horsepower. We plan to have eight such fleets with approximately 315,000 horsepower in the aggregate operating by the end of 2012 and 12 such fleets with approximately 450,000 horsepower in the aggregate operating by the end of 2013. For the year ended December 31, 2011, Chesapeake’s gross operated expenditures for hydraulic fracturing services were approximately $3.5 billion, and our revenues from this segment represented less than 1% of such expenditures.
Oilfield Rentals. Great Plains Oilfield Rental, L.L.C., our oilfield rentals subsidiary, provides a wide range of premium rental tools and services for land-based oil and natural gas drilling, completion and workover activities. We offer a full line of rental tools, including drill pipe, drill collars, tubing, blowout preventers, frac and mud tanks and also provide air drilling services and services associated with the transfer of fresh water to the well site. As our oilfield rentals segment generates our highest margins and we currently supply Chesapeake with a low percentage of its overall oilfield rentals requirements, this segment offers attractive expansion opportunities, including the purchase and subsequent rental of equipment used in pressure control, flowback and hydraulic fracturing services. For the year ended December 31, 2011, Chesapeake’s gross operated expenditures for oilfield rentals were approximately $1.3 billion, and our revenues from this segment represented approximately 19% of such expenditures.
Oilfield Trucking. Hodges Trucking Company, L.L.C. and Oilfield Trucking Solutions, L.L.C., our oilfield trucking subsidiaries, provide rig relocation and logistics services and fluid hauling services. Our trucks move drilling rigs, crude oil, fluids and construction materials to and from the well site and also transport produced water from the well site. As of March 31, 2012, we owned a fleet of 227 rig relocation trucks, 57 cranes and forklifts used in the movement of drilling rigs and other heavy equipment and 157 fluid hauling trucks. Expansion opportunities for our oilfield trucking segment include expanding our assets, such as our crude hauling capabilities, and deploying our assets in new areas. For the year ended December 31, 2011, Chesapeake’s gross operated expenditures for rig relocation and logistics services were approximately $167.0 million, and our revenues from this segment represented approximately 77% of such expenditures. These amounts do not include Chesapeake’s expenditures for fluid hauling services, of which we currently provide only a small percentage.
Other Operations. Compass Manufacturing, L.L.C., our manufacturing subsidiary, designs, engineers, fabricates, sells and installs natural gas compression units, accessories and equipment used in the production, treatment and processing of oil and natural gas. As of March 31, 2012, we had the capacity to manufacture up to up to 150 compressor units per quarter, or approximately 85,000 horsepower in the aggregate per quarter. Expansion opportunities for Compass include the manufacture of other types of oilfield equipment that are used in our oilfield rentals business. For the year ended December 31, 2011, Chesapeake’s gross operated expenditures for compressor purchases were approximately $87.5 million, and we provided Chesapeake with approximately 66% of its compressor manufacturing needs.
4
Table of Contents
Index to Financial Statements
Our Competitive Strengths
We believe that we have the following competitive strengths:
Our relationship with Chesapeake. For nearly eight years, Chesapeake, our founder and principal customer, has maintained the nation’s most active drilling program, based on rig count. For the years ended December 31, 2009, 2010 and 2011, Chesapeake drilled 1,212, 1,445 and 1,662 gross operated oil and natural gas wells, respectively, and made $5.2 billion, $7.9 billion and $13.3 billion, respectively, of gross operated drilling and completion expenditures. As of December 31, 2011, Chesapeake had total estimated net proved reserves of 18.8 tcfe, which includes approximately 545 mmbbls of liquids, and was operating 162 drilling rigs to develop its inventory of approximately 39,000 risked net drill sites. We anticipate that a significant portion of the demand for our services in future years will come from Chesapeake’s exploitation of this large backlog of drilling locations, approximately 20 years’ worth at current drilling levels.
The chart below shows the average number of rigs drilling for Chesapeake during 2009, 2010 and 2011 compared to its most active competitors.
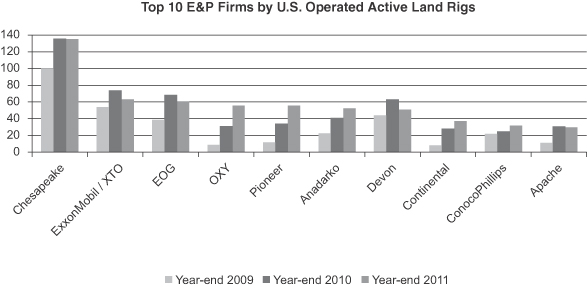
Source: RigData–The Land Rig Newsletter Biweekly Report (excludes operating rigs that are in the process of rigging up or mobilization).
Looking forward, Chesapeake’s gross operated drilling and completion expenditure budgets for 2012 and 2013 are expected to be approximately $11.0 billion and $12.0 billion, respectively. Chesapeake’s industry-leading acreage position and active drilling program provide us with significant growth opportunities. Our relationship with Chesapeake, which gives us unique insights into our principal customer’s current and future oilfield services needs, positions us to operate efficiently, maintain industry-leading asset utilization and continue to improve our margins and creates incentives for Chesapeake to use our services.
5
Table of Contents
Index to Financial Statements
Significant revenue growth opportunities. Chesapeake’s current and future oilfield services needs provide us with significant growth opportunities. As shown in the table below, revenues from our hydraulic fracturing and oilfield rentals segments in 2011 represented less than 1% and approximately 19%, respectively, of Chesapeake’s gross operated expenditures for these services, which is well below our objective of providing up to two-thirds of Chesapeake’s overall expected need for these services.
| Segment(1) |
2011 Revenues (in millions)(2) |
Chesapeake’s 2011 Gross Operated Expenditures (in millions) |
As a Percentage of Chesapeake’s Gross Operated Expenditures |
|||||||||
| Drilling |
$ | 855 | $ | 1,725 | 50 | % | ||||||
| Hydraulic Fracturing |
$ | 13 | $ | 3,486 | 0 | % | ||||||
| Oilfield Rentals |
$ | 246 | $ | 1,266 | 19 | % | ||||||
| (1) | See Note 14 to our audited consolidated financial statements included elsewhere in this prospectus for additional information about our reportable segments. |
| (2) | Drilling and oilfield rentals segment revenues include third-party revenues. Hydraulic fracturing includes ancillary support services. |
In addition, within our drilling and oilfield trucking segments, we currently provide Chesapeake with a small percentage of its needs for drilling-related services and fluid hauling services, providing us with additional growth opportunities. We will also have the opportunity to increase the scope of our service offerings to Chesapeake and its partners and to grow with Chesapeake, whose drilling and completion expenditures have increased by an average of 27% year over year since 2006. We believe that Chesapeake’s oilfield services demand and its incentives to use our services will provide us with the opportunity to grow our business significantly with relatively low risk of over-expansion.
6
Table of Contents
Index to Financial Statements
Industry-leading asset utilization. Chesapeake’s 20-year backlog of drilling locations, many of which are in unconventional liquids plays, provides us with a unique opportunity to keep our assets highly utilized for years to come. We believe that Chesapeake’s incentives to use our services, combined with our objective of matching our productive capacity to meet up to two-thirds of Chesapeake’s expected overall needs for our services, will allow us to maintain industry-leading asset utilization levels through industry cycles. Additionally, Chesapeake’s drilling activity levels over time have been more stable than those of its peers. For example, in the twelve-month period ended September 30, 2009, one of the most challenging periods in the recent history of our industry, the U.S. onshore industry rig count decreased by 1,308 rigs, or 50%, while Chesapeake’s operated rig count, which includes third-party rigs, decreased by only 53 rigs, or 34%. During that same period, Chesapeake’s utilization of our rigs increased by six rigs, from 71 to 77, or 8%. The utilization rates of our other assets are correlated with our rig utilization rates because the well drilling performed by our rigs creates demand for most of the other services we provide. The chart below shows our drilling rig utilization over the last four years as compared with the U.S. industry onshore average.
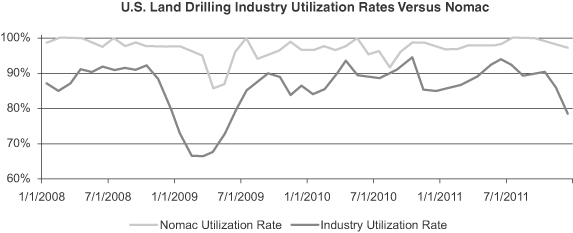
Source: RigData and Nomac active rig counts.
Additionally, our services agreement with Chesapeake guarantees the utilization of a portion of our drilling rig and hydraulic fracturing fleets through October 2016, with an annual evergreen thereafter. While we believe the utilization of our assets will remain at a level significantly higher than the minimum utilization rates provided for in the services agreement, the guaranteed utilization provides us with downside protection in our traditionally cyclical industry.
7
Table of Contents
Index to Financial Statements
Enhanced operational efficiencies. Our unique relationship with Chesapeake creates operational efficiencies that our competitors cannot replicate. We have access to the activity forecasts prepared by Chesapeake and we maintain close communications with Chesapeake regarding its service needs, allowing us to efficiently provide timely, tailored, “just-in-time” service to Chesapeake. As the graph below indicates, we drill wells for Chesapeake and its partners on average approximately 10% faster than our competitors do.
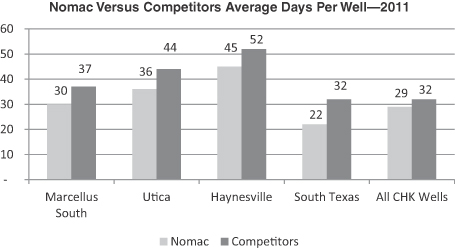
Source: Chesapeake internal reports based on wells spudded in 2011.
Our ability to align our operations and forecasts with Chesapeake incentivizes it to use our services, provides us with cost savings and efficient deployment of capital and allows us to provide services at an overall cost that is attractive to Chesapeake and its partners. Our relationship with Chesapeake also provides us with the support of a large, well-known parent-sponsor which we believe benefits us in dealing with suppliers, lenders, capital providers and others that a similarly sized standalone service company could not replicate. Finally, we believe that Chesapeake’s workplace reputation, which was recently recognized on FORTUNE’s 100 Best Companies to Work For® list as the best among energy production companies, and our stable asset utilization levels have allowed us to build a well-trained, safe and efficient workforce of over 5,000 employees and to maintain a lower employee turnover rate compared to industry averages.
Diversified, high quality asset base. Our modern and well maintained assets are capable of providing unique operational advantages to Chesapeake. A substantial majority of our drilling rig fleet has been newly fabricated or refurbished since 2001, and substantially all of our rigs have been updated with the equipment necessary for horizontal drilling in today’s unconventional resource plays. We expect to have an additional 30 of our proprietary, fit-for-purpose PeakeRigs™ operating in the next six years, which will utilize state-of-the-art technology to improve drilling efficiency and will be rated 1,000 horsepower or greater. We also have an initiative underway to repower our drilling rigs with dual fuel, diesel/natural gas (DNG) systems, which will reduce our customers’ costs through the utilization of natural gas during our rig operations. Our hydraulic fracturing assets are among the newest in the industry, with 100% of our fleet built in 2011 or later by manufacturers with strong reputations for producing durable equipment capable of withstanding the demanding conditions typically presented by unconventional reservoirs. Our oilfield rentals, oilfield trucking and natural gas compressor manufacturing assets are modern and well maintained. The quality of our asset base
8
Table of Contents
Index to Financial Statements
and our comprehensive maintenance program results in less downtime, lower operating costs and increased utilization of our assets, which is critical for drilling and hydraulic fracturing operations where assets are commonly utilized on a 24-hour per day, seven day per week basis.
Experienced management team. We have an experienced and skilled management team which is led by our Chief Executive Officer, Jerry L. Winchester, who has over 30 years of industry experience, including 13 years of experience as the president and chief executive officer of Boots & Coots International Well Control, Inc. (“Boots & Coots”). Our management team, including Mr. Winchester, Cary D. Baetz, our Chief Financial Officer, James G. Minmier, President of Nomac Drilling, L.L.C., Zachary M. Graves, President of Thunder Oilfield Services, L.L.C., William R. Stanger, President of Performance Technologies, L.L.C., and Alan D. Lavenue, President of Compass Manufacturing, L.L.C., collectively has over a century of oilfield services experience with prominent oilfield service companies such as Halliburton Company, Boots & Coots, Helmerich & Payne, Inc., Schlumberger Limited, Precision Drilling Corporation, Bronco Drilling Company, Inc. and Exterran Holdings, Inc. The remainder of our management team is comprised of seasoned operating, financial and administrative executives with extensive experience in and knowledge of the oilfield services industry. Our management team has operated through numerous oilfield services cycles and provides us with valuable experience and a detailed understanding of customer requirements.
Our Business Strategy
Our goal is to maximize shareholder value by profitably building a leading oilfield services company through leveraging our relationship with Chesapeake, the most active driller of new oil and natural gas wells in the U.S., to achieve our objective of providing up to two-thirds of Chesapeake’s overall expected needs for our current and future services and maintain industry-leading utilization rates. We plan to pursue the following strategic objectives to achieve this goal.
Grow our asset base. We intend to aggressively grow our asset base, particularly our hydraulic fracturing fleets, oilfield rental inventory and drilling-related services, in order to achieve our objective of increasing our productive capacity to meet up to two-thirds of Chesapeake’s expected need for our services. We have placed substantial orders for additional new hydraulic fracturing units and expect to have eight fleets with approximately 315,000 horsepower in the aggregate operating by the end of 2012 and 12 fleets with approximately 450,000 horsepower in the aggregate operating by the end of 2013. Our drilling, hydraulic fracturing and oilfield rentals segments provide our highest margins and highest returns on invested capital relative to the other segments in which we operate. We are focused on increasing the revenues of these segments by growing our assets and expanding into the markets necessary to meet higher percentages of Chesapeake’s needs for these services, particularly the liquids-rich plays in which Chesapeake is now most active. During 2012 and 2013, we plan to make $1.1 billion to $1.2 billion of growth capital expenditures, in addition to amounts budgeted for the acquisition of presently leased rigs, and these expenditures will allow us to meet a greater percentage of Chesapeake’s needs and solidify our position as one of the largest U.S. onshore oilfield services companies.
Focus on full utilization of our assets. Our oilfield service assets have traditionally maintained high utilization rates. For example, the utilization of our drilling rigs has averaged between approximately 95% and 99% since 2008. The utilization rates of our other assets are directly correlated with our rig utilization rates because the well drilling performed by our rigs creates demand for most of the other services we provide. Our industry-leading asset utilization rates result from our strategy of growing in tandem with Chesapeake and serving as a substantial provider of oilfield services to Chesapeake and its partners. We plan to maintain our industry-leading utilization rates as we continue
9
Table of Contents
Index to Financial Statements
to grow by growing our productive capacity to meet up to two-thirds of Chesapeake’s overall expected need for our services. We believe this strategy, combined with Chesapeake’s incentives to use our services, will continue to result in high utilization rates for our assets throughout industry cycles.
Focus on improving margins. We plan to continue to improve our margins by leveraging our relationship with Chesapeake to decrease costs and make our business more efficient. Our relationship with Chesapeake enables us to operate more efficiently than our competitors by providing us with exclusive access to data that allows us to align our operations and projections with those of Chesapeake, to efficiently provide Chesapeake with timely, tailored, “just-in-time” services and to anticipate and quickly react to industry trends. As a result, our management team can focus its efforts on delivering efficient, high-quality services to Chesapeake and its partners rather than on marketing our services and managing through the cyclicality of oilfield activity and commodity prices. Additionally, we plan to continue to evolve our product and service offerings to include a larger percentage of higher margin offerings. We also believe that our new management team, which is exclusively dedicated to our operations and collectively has over a century of experience in the oilfield services industry, will enable us to better capitalize on existing efficiencies and identify further opportunities to maximize our margins. For example, since July 2011, our new management team has increased the gross margins in our drilling segment through various cost saving initiatives by approximately 20%, while at the same time improving our safety and productivity metrics.
Capitalize on opportunities to provide additional services. As the driller of a substantial majority of Chesapeake’s wells, we play a central role in the planning and execution of Chesapeake’s drilling program. As a result of this role, we are uniquely positioned to cross-sell our other service offerings to Chesapeake, observe the service offerings of other third-party service providers that are present at the well site and evaluate expansion opportunities. We plan to use this role to focus our growth on high margin product and services offerings. While we already provide Chesapeake with approximately two-thirds of its drilling rig needs, we plan to increase the percentage of drilling-related services that we provide, such as directional drilling, mud logging and geosteering. In our hydraulic fracturing segment, we believe that expansion opportunities exist not only through expanding our fleets but also by vertically integrating our operations through the integration of sand reserves, sand processing operations and railcar, truck and other logistics assets. We also plan to continue to grow our oilfield rentals segment, where our inventory of tools and equipment can be expanded to include additional drilling and completion rental tools. We have a significant growth capital expenditure budget of between $1.1 billion and $1.2 billion over the next two years with which to develop such business lines. These amounts are in addition to amounts budgeted for the acquisition of presently leased rigs. We believe that targeting the development of these high margin product and services offerings through geographic expansion, vertical integration and asset additions will provide us with a greater return on our investment in our assets and cash flows for future growth.
Continued focus on safety. Our relationship with Chesapeake provides us with enhanced utilization across industry cycles, which in turn reduces employee turnover, increases safety and drives superior results. In addition, the continuity of working relationships between our employees and Chesapeake provides for greater communication and data sharing at our drill sites, which we believe results in safer working conditions for employees. We are focused on hiring, training and retaining high-quality employees. As a result of our strong emphasis on training and safety protocols for our employees, we believe we have a superior safety record and reputation. We have a strong and improving Total Recordable Incidence Rate (TRIR) safety record even as our employee base has more than doubled over the past two years. From 2009 to 2011, our TRIR dropped by approximately 36%. In addition, all of our field-based employees are eligible to receive incentive pay based on satisfying safety standards, which we believe motivates them to continually maintain quality and safety.
10
Table of Contents
Index to Financial Statements
Industry Overview
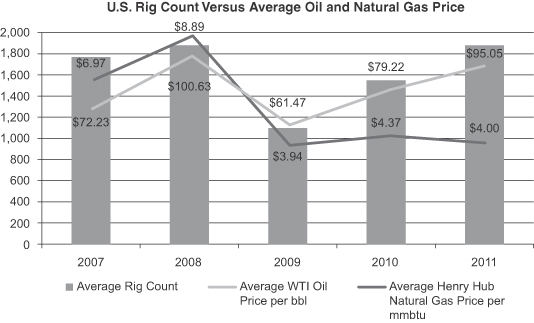
Oilfield service companies provide services that are used by exploration and production companies, or E&P companies, in connection with the exploration for and the development and production of hydrocarbons. E&P companies operating in the U.S. include independent E&P companies, such as Chesapeake, U.S.-based major integrated oil and gas companies, such as ExxonMobil, ChevronTexaco and ConocoPhillips, and international major integrated oil and gas companies, such as Shell, Total S.A., BP America, CNOOC Limited and Statoil. Demand for domestic onshore oilfield services is a function of the willingness of E&P companies to make operating and capital expenditures to explore for, develop and produce hydrocarbons in the U.S. When oil or natural gas prices increase, E&P companies generally increase their capital expenditures, resulting in greater revenues and profits for oilfield service companies. Likewise, significant decreases in the prices of those commodities typically lead E&P companies to reduce their capital expenditures, which lowers the demand for oilfield services.
Oil and natural gas prices rose to record levels in 2008 and then began to decline in late 2008 in conjunction with the widespread economic recession. While the price of oil rebounded somewhat in 2009 and continued to rise throughout 2010 and 2011, the price of natural gas has continued to fall since 2009 largely due to discoveries of vast new natural gas resources in the U.S. The WTI Cushing spot price of a barrel of crude oil reached an all-time high of $145.29 per barrel in July 2008 and then dropped sharply by the end of the year, falling to as low as $31.41 per barrel on December 22, 2008 before trending upward again by late 2009 and reaching $92.19 in January 2011. During 2011, oil prices generally remained high, averaging $95.05 per barrel through December 31, 2011, due to increased demand, generally flattening international supply and geopolitical tensions. This trend has continued in 2012 with current oil prices above $100 per barrel. On the other hand, from the beginning of 2009 through March 31, 2012, U.S. Henry Hub natural gas prices generally declined from a starting price of $5.40 per mmbtu to an ending price of $2.00 per mmbtu.
11
Table of Contents
Index to Financial Statements
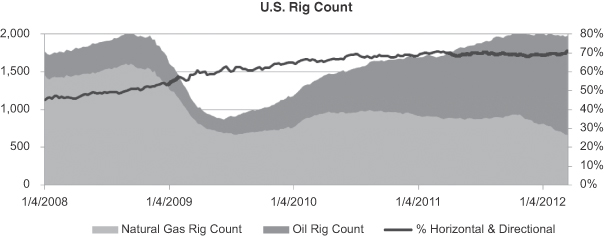
The number of drilling rigs under contract in the U.S. decreased in 2009 but rebounded in 2010 and has remained high since then relative to historical levels, according to data compiled by Baker Hughes Incorporated. This has remained the case despite a dramatic decrease in the price of natural gas over the same period, suggesting a weakening in the traditional correlation between natural gas prices and U.S. onshore drilling rig counts. We believe this decrease in correlation is attributable to several factors, including the discovery of potentially large oil and liquids-rich unconventional plays onshore in the U.S., the increasing presence in U.S. onshore plays of major U.S. and international integrated E&P companies that are typically less reactive to short-term price fluctuations than independent E&P companies, the presence of term contracts for certain types of oilfield services, the need by operators to commence drilling activities in order to establish production and avoid the expiration of oil and natural gas leases, and the more regimented approach to developing unconventional plays characterized by continuous hydrocarbon accumulations. Additionally, we believe that the weakening correlation between natural gas prices and U.S. onshore rig counts is partially attributable to the prevalence of joint ventures for the development of U.S. unconventional plays, many of which include a drilling “carry” that is paid by the joint venture partner and used by the operator to pay for a portion of the cost of drilling and completing the well. Chesapeake, for example, has entered into several such joint ventures since 2008 with companies such as Total S.A., CNOOC Limited, Statoil, BP America and Plains Exploration & Production Company that have provided more than $9.0 billion of drilling carries to Chesapeake.
Source: Baker Hughes Incorporated and Bloomberg.
12
Table of Contents
Index to Financial Statements
In response to historically low natural gas prices, a number of E&P companies, including Chesapeake, have announced that they are reducing dry natural gas drilling and production and redirecting their activities and capital toward currently more economic liquids-rich plays. Liquids-rich plays are those that are characterized by production of predominantly oil and natural gas liquids such as ethane, propane, butane and iso-butane, which are used as energy sources and manufacturing feedstocks, and the prices of which have historically been highly correlated with oil prices rather than natural gas prices. As a result, we expect the trend toward liquids-focused drilling to continue. The proportion of rigs in the U.S. drilling for liquids versus natural gas has also increased steadily over the past few years and, in April 2011, for the first time since 1993, the number of rigs drilling for liquids surpassed the number of rigs drilling for natural gas.
Source: Baker Hughes Incorporated
Trends that we believe are affecting, and will continue to affect, our industry include:
Drilling and developing unconventional U.S. hydrocarbon resources. Due to the maturity of conventional U.S. oil and natural gas reservoirs, the relative abundance of undeveloped unconventional resources and the cost advantage of developing unconventional resources, an increasing proportion of U.S. oil and natural gas production is coming from unconventional resources, which include shale formations. Since the beginning of 2008, producers have spent substantial amounts acquiring properties in unconventional resource plays in the U.S., including approximately $20.0 billion spent by Chesapeake, as advances in horizontal drilling and completion technologies have made the development of many unconventional resources economically attractive.
Horizontal wells are typically drilled in these unconventional formations and tend to involve a higher degree of service intensity associated with their initial drilling and completion, and we believe that these wells will also ultimately require a high degree of service intensity over their lifetime. The U.S. horizontal and directional rig count has risen from 705 (or 42% of the total) at the beginning of 2007 to 1,413 (or 71% of the total) for the week ending March 30, 2012, according to Baker Hughes Incorporated. In addition to an increase in the number of horizontal wells drilled in the U.S., the length of well laterals has increased and the intervals between fracturing stages have decreased over the past several years. The longer laterals and increasing number of fracturing stages have enhanced recoveries and lowered field development costs while causing the number of fracturing stages to grow at a faster rate than the horizontal rig count, creating an increased demand for completion related services.
13
Table of Contents
Index to Financial Statements
Increased drilling in liquids-rich formations. There is increasing horizontal drilling- and completion-related activity in liquids-rich formations such as the Eagle Ford, Utica, Bakken and Niobrara Shales and various other unconventional liquids-rich plays in Texas and Oklahoma, including the Wolfcamp, Bone Spring, Granite Wash, Cleveland and Tonkawa sands and the Mississippi Lime. In January 2012, Chesapeake announced its plan to curtail its dry gas drilling and production activities and redirect capital to its liquids-rich plays. We believe that the oil and natural gas liquids content in these plays significantly enhances the returns for Chesapeake and its partners relative to opportunities in dry gas basins due to the significant disparity between oil and natural gas prices on a British thermal unit (btu) basis. Furthermore, we believe that oil and natural gas liquids prices tend to exhibit less volatility than natural gas prices due to the global nature of the crude oil market and the more localized market for natural gas. We believe that the higher price of liquids relative to natural gas, as well as liquids’ reduced pricing volatility will continue over the near- to medium-term, resulting in increasing demand for services in liquids-rich basins and a reduction in the variability of demand for oilfield services generally.
High asset utilization and tight labor and equipment market. Many of the unconventional reservoirs in the U.S. are deep, high-pressure and challenging environments, factors that increase the demand for skilled workers and high-quality oilfield services. Equipment manufacturers have had difficulty meeting the demand for services equipment, resulting in high asset utilization levels across the industry. In addition, demand for skilled workers is high and the supply is limited. We believe these trends will continue to keep supply tight in our industry for the foreseeable future.
Complex technologies, techniques and equipment. The development of unconventional oil and natural gas resources is driving the need for complex new technologies, completion techniques and equipment designed to increase recovery rates, lower production costs and accelerate field development. These needs have spurred the development of more technologically advanced, higher-margin oilfield services that are required to economically produce oil and natural gas from unconventional resources. In addition to rigs with adequate horsepower and top drives, in many cases directional drilling systems are necessary to enable the operator to steer the drill bit into the appropriate section of the reservoir, and advanced technologies, such as the latest hydraulic fracturing, proppant and fluids technologies, are needed for completion of the wells.
Constrained supply of hydraulic fracturing sand. The sand used as a proppant in hydraulic fracturing operations must meet certain size and other specifications in order to be suitable for hydraulic fracturing purposes. Securing access to hydraulic fracturing sand that conforms to the specifications established by the American Petroleum Institute is increasingly important to suppliers and customers of hydraulic fracturing services. Rising unconventional production in the U.S. will continue to support demand for hydraulic fracturing sand, which is used extensively in domestic unconventional basins. The hydraulic fracturing sand market is driven by the overall demand for oil and natural gas production and, in particular, horizontal drilling of oil and natural gas wells. Accordingly, the demand for hydraulic fracturing sand has grown significantly, paralleling the heightened development activity in unconventional reservoirs. We believe the industry is currently experiencing both high demand and limited supply of hydraulic fracturing sand. As we continue to grow our hydraulic fracturing business, we plan to mitigate this risk by vertically integrating our operations through the integration of sand reserves, sand processing operations and logistics assets such as storage and transload, railcar, trucking and other assets.
14
Table of Contents
Index to Financial Statements
Organizational Structure
Formation Transactions
On October 25, 2011, Chesapeake completed the process of reorganizing its oilfield services subsidiaries and operations as subsidiaries of COS LLC and commenced providing all of its oilfield services through COS LLC.
We were incorporated in Oklahoma on April 10, 2012 and have not engaged in any business or other activities except in connection with our formation and the offering transactions described in this prospectus.
Offering Transactions
Concurrently with the closing of this offering, we will issue shares of our Class A common stock to the purchasers in this offering in exchange for net proceeds of approximately $ . We will use the net proceeds from this offering to acquire newly issued Class A units from COS LLC, representing % of COS LLC’s outstanding membership units. COS LLC will use the following approximate amounts of such net proceeds for the following purposes:
| Ÿ | $ million will be used by COS LLC to make a capital contribution to COO, which will use such cash to repay outstanding borrowings under its revolving bank credit facility and for general corporate purposes; |
| Ÿ | $ million will be used by COS LLC to repay the balance outstanding under an intercompany promissory note with Chesapeake; and |
| Ÿ | $ million will be used to make a distribution to Chesapeake Operating, Inc., a wholly owned subsidiary of Chesapeake. |
If the underwriters exercise their option to purchase additional shares of Class A common stock in full in connection with this offering, we will use the additional net proceeds to acquire additional Class A units from COS LLC, and COS LLC will distribute any such proceeds to Chesapeake. For more information regarding the transactions occurring in connection with the offering, see “Organizational Structure—Offering Transactions.”
Chesapeake’s existing membership units in COS LLC will be reclassified as “Class B units” and will represent % of COS LLC’s outstanding membership units immediately following this offering. In addition, we will issue to Chesapeake a number of shares of our Class B common stock equal to the number of Class B units of COS LLC held by Chesapeake immediately following this offering in exchange for the payment by Chesapeake of the aggregate par value of such shares. Each share of Class B common stock will entitle Chesapeake to votes on matters to be voted on by our shareholders generally until the first time that the number of shares of our Class B common stock outstanding constitutes less than % of the number of all shares of our common stock outstanding. For more information regarding the terms of our common stock, see “Description of Capital Stock.”
Immediately following this offering:
| Ÿ | We will be appointed as the sole managing member of COS LLC; |
| Ÿ | We will hold Class A units of COS LLC representing approximately % of COS LLC’s total outstanding membership units (or and %, respectively, if the underwriters exercise their option to purchase additional shares of Class A common stock in full); |
15
Table of Contents
Index to Financial Statements
| Ÿ | Chesapeake will own Class B units of COS LLC representing approximately % of COS LLC’s total outstanding membership units (or and %, respectively, if the underwriters exercise their option to purchase additional shares of Class A common stock in full); |
| Ÿ | Chesapeake, through its ownership of our Class B common stock, will have % of the combined voting power of all of our common stock and, through its ownership of Class B units of COS LLC, will hold approximately % of the economic interest in our business (or % voting power in us and a % economic interest if the underwriters exercise their option to purchase additional shares of Class A common stock in full); and |
| Ÿ | the purchasers in this offering will own shares of our Class A common stock, representing % of the combined voting power of all of our common stock and, through our ownership of Class A units of COS LLC, approximately % of the economic interest in our business (or % voting power in us and a % economic interest if the underwriters exercise their option to purchase additional shares of Class A common stock in full). |
Following this offering, Chesapeake may exchange its Class B units in COS LLC for shares of our Class A common stock on a one-for-one basis. When Chesapeake exchanges a Class B unit of COS LLC for a share of our Class A common stock, we will automatically redeem and cancel a corresponding share of our Class B common stock. See “Certain Relationships and Related Party Transactions—Amended and Restated Operating Agreement of COS LLC—Exchange Rights.”
16
Table of Contents
Index to Financial Statements
The following chart summarizes our holding company structure and anticipated ownership immediately following this offering and the transactions described above (assuming no exercise by the underwriters of their option to purchase additional shares of Class A common stock). For more information, please see “Organizational Structure.”
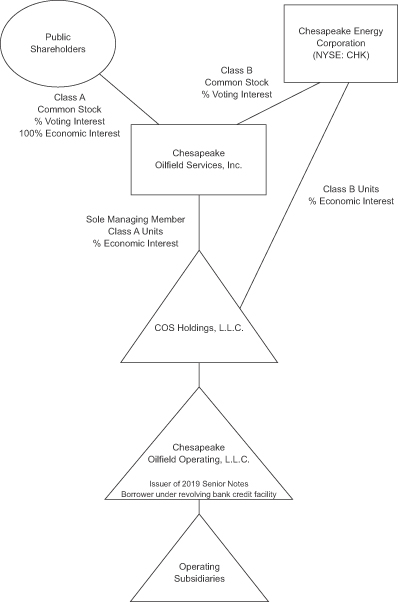
Our Relationship with Chesapeake
Following this offering, we will be a holding company and our sole material asset will be the Class A units of COS LLC that we own. As the sole managing member of COS LLC, we will control all of the business and affairs of COS LLC and its subsidiaries. Initially, Chesapeake, as the holder of all
17
Table of Contents
Index to Financial Statements
of the shares of our Class B common stock, will have % of the combined voting power of all of our outstanding common stock (or % if the underwriters exercise their option to purchase additional shares of Class A common stock in full). Therefore, upon the closing of this offering and for the foreseeable future thereafter, Chesapeake will continue to control our business and will be able to control all matters requiring the approval of our shareholders, including the election of directors and the approval of significant corporate transactions. See “Organizational Structure.”
Additionally, we are a party to several agreements with Chesapeake, including a master services agreement and services agreement pursuant to which we provide services and supply materials and equipment to Chesapeake and under which Chesapeake has agreed to operate a minimum number of our drilling rigs and to utilize our hydraulic fracturing equipment for a minimum number of fracturing stages per month.
In addition, we and Chesapeake are parties to an administrative services agreement and a facilities lease agreement. These agreements were entered into in the context of an affiliated relationship and, consequently, may not be as favorable to us as they might have been if we had negotiated them with unaffiliated third parties. For a more comprehensive discussion of the agreements that we have entered into with Chesapeake and certain of its affiliates, please see “Certain Relationships and Related Party Transactions.” For a discussion of the risks related to our relationship with Chesapeake, please read “Risk Factors—Risks Relating to Our Relationship with Chesapeake.”
Tax Receivable Agreement
In connection with the consummation of this offering, we will enter into a tax receivable agreement with Chesapeake pursuant to which we will agree to pay to Chesapeake 85% of the amount of cash savings, if any, in federal, state and local income taxes that we actually realize (or in certain circumstances are deemed to realize) as a result of (a) the tax basis increases in the assets of COS LLC that arose from certain recent acquisitions by us; (b) any tax basis increase resulting from COS LLC’s distribution of offering proceeds to Chesapeake; (c) the tax basis increases resulting from exchanges by Chesapeake of its Class B units of COS LLC for shares of our Class A common stock; (d) additional deductions allocated to us pursuant to Section 704(c) of the Internal Revenue Code of 1986, as amended (the “Code”) to reflect the difference between the fair market value and the adjusted tax basis of COS LLC’s assets as of the date of this offering and (e) imputed interest deemed to be paid by us as a result of, and additional tax basis arising from, payments under the tax receivable agreement. We will retain the benefit of the remaining 15% of these cash savings. See “Certain Relationships and Related Party Transactions—Tax Receivable Agreement.”
Corporate Information
Our principal executive offices are located at 6100 North Western Avenue, Oklahoma City, Oklahoma 73118, and our telephone number is (405) 848-8000. Our website is located at www.cosok.com. Information on our website or any other website is not incorporated by reference herein and does not constitute a part of this prospectus.
18
Table of Contents
Index to Financial Statements
The Offering
| Class A common stock offered by us |
shares of our Class A common stock. |
| Class A common stock outstanding after the offering |
shares of our Class A common stock (or shares of Class A common stock if the underwriters exercise their option to purchase additional shares of Class A common stock in full). |
| Class B common stock outstanding after the offering |
shares of our Class B common stock (or shares of Class B common stock if the underwriters exercise their option to purchase additional shares of Class A common stock in full). |
| Underwriters’ option to purchase additional shares of Class A common stock in this offering |
We have granted the underwriters an option, exercisable for 30 days from the date of this prospectus, to purchase up to additional shares of our Class A common stock. |
| Use of proceeds |
We are offering the Class A common stock to be sold in this offering. Assuming no exercise of the underwriters’ option to purchase additional shares of Class A common stock, we expect to receive approximately $ million of net proceeds from the sale of the Class A common stock offered based upon the assumed initial public offering price of $ per share (the midpoint of the price range set forth on the cover page of this prospectus), after deducting underwriting discounts and estimated offering expenses. Each $1.00 increase (decrease) in the public offering price would increase (decrease) our net proceeds by approximately $ million. |
| We intend to use the net proceeds from this offering to acquire newly issued Class A units from COS LLC, representing % of COS LLC’s outstanding membership units. COS LLC will use approximately $ million of such net proceeds to make a capital contribution to COO, which will use such cash to repay outstanding borrowings under its revolving bank credit facility and for general corporate purposes, approximately $ million of such net proceeds to repay the balance outstanding under an intercompany promissory note with Chesapeake and approximately $ million of such net proceeds to make a distribution to Chesapeake Operating, Inc., a wholly owned subsidiary of Chesapeake. |
19
Table of Contents
Index to Financial Statements
| We intend to use any additional proceeds we receive if the underwriters exercise their option to purchase additional shares of Class A common stock to acquire additional Class A units from COS LLC, and COS LLC will distribute any such proceeds to Chesapeake. |
| Chesapeake has advised us that it intends to use the net proceeds distributed to it by COS LLC to repay borrowings under its corporate revolving bank credit facility, under which it may re-borrow from time to time and does so for general corporate purposes, including land, drilling and other costs. See “Use of Proceeds.” |
| Voting rights |
Each share of our Class A common stock will entitle its holder to one vote on all matters to be voted on by shareholders generally. |
| Each share of our Class B common stock will entitle its holder to votes on all matters to be voted on by shareholders generally until the first time that the number of shares of our Class B common stock outstanding constitutes less than % of the number of all shares of our common stock outstanding. From and after that time, each share of our Class B common stock will entitle its holder to one vote. Through its ownership of our Class B common stock, Chesapeake will hold shares of our common stock having % of the combined voting power of all of our common stock outstanding (or % if the underwriters exercise their option to purchase additional shares of Class A common stock in full). As a result, for the foreseeable future following this offering, Chesapeake will be able to exercise control over matters requiring the approval of our shareholders, including the election of our directors and the approval of significant corporate transactions. |
| Holders of our Class A common stock and Class B common stock will vote together as a single class on all matters presented to shareholders for their vote or approval, except as otherwise required by law. See “Description of Capital Stock.” |
| Economic interest |
Immediately following this offering, the purchasers in this offering will own in the aggregate a % economic interest in our business through our ownership of Class A units of COS LLC and Chesapeake will own a % economic interest in our business through its ownership of Class B units of COS LLC (or a % economic interest and a % economic interest, respectively, if the underwriters exercise their option to purchase additional shares of our Class A common stock in full). |
20
Table of Contents
Index to Financial Statements
| Lock-up |
We, all of our directors and officers and Chesapeake will enter into a lock-up agreement with the underwriters pursuant to which we and it may not, without the prior written approval of Goldman, Sachs & Co., offer, sell, contract to sell or otherwise dispose of or hedge our Class A common stock or securities convertible into or exchangeable for our Class A common stock, subject to certain exceptions, for a period of 180 days after the date of this prospectus, subject to extension in certain circumstances. See “Underwriting” for a discussion of the circumstances in which this 180-day period may be extended. |
| Exchange and registration rights |
Each Class B unit of COS LLC will be exchangeable for a share of our Class A common stock as described under “Certain Relationships and Related Party Transactions—Amended and Restated Operating Agreement of COS LLC—Exchange Rights.” |
| Pursuant to a registration rights agreement that we will enter into with Chesapeake, we will agree to file a registration statement for the sale of the shares of our Class A common stock that are issuable upon exchange of Class B units of COS LLC upon request and cause that registration statement to be declared effective by the U.S. Securities and Exchange Commission (“SEC”) as soon as practicable thereafter. See “Certain Relationships and Related Party Transactions—Registration Rights Agreement” for a description of the timing and manner limitations on resales of these shares of our Class A common stock. |
| Dividend policy |
After this offering, we do not anticipate paying cash dividends on our Class A common stock in the immediate future. Holders of our Class B common stock will not have the right to receive regular dividends. See “Dividend Policy.” |
| Proposed New York Stock Exchange symbol |
“COS” |
Unless otherwise indicated, the number of shares of Class A common stock outstanding after this offering and other information based thereon in this prospectus excludes:
| Ÿ | shares of our Class A common stock which may be issued upon the exercise of the underwriters’ option to purchase additional shares of Class A common stock and the corresponding number of Class A units of COS LLC that we would acquire with the net proceeds therefrom; and |
| Ÿ | shares of our Class A common stock reserved for issuance upon exchange of Chesapeake’s Class B units of COS LLC that will be outstanding immediately after this offering. |
21
Table of Contents
Index to Financial Statements
Risk Factors
An investment in our Class A common stock involves significant risks. Before investing in our Class A common stock, you should carefully consider all the information contained in this prospectus, including the information under the headings “Risk Factors” and “Cautionary Note Regarding Forward-Looking Statements.” Our business, financial condition and results of operations could be materially and adversely affected by many factors, including the following factors and the factors discussed in “Risk Factors” and elsewhere in this prospectus:
| Ÿ | We are dependent on Chesapeake for a substantial majority of our revenues. Therefore, we are indirectly subject to the business risks of Chesapeake. We have no control over Chesapeake’s business decisions and operations, and Chesapeake is under no obligation to adopt a business strategy that favors us; |
| Ÿ | Demand for services in our industry is cyclical and depends on drilling and completion spending by Chesapeake and other E&P companies in the U.S., and the level of such activity is volatile; |
| Ÿ | Competition in our industry or increases in the supply of drilling rigs or hydraulic fracturing units could decrease the prices for our products and services and our revenues; |
| Ÿ | Shortages or increases in the costs of the equipment we use in our operations could adversely affect our growth plans and our operations in the future; |
| Ÿ | Shortages or increases in the costs of the products we use in our operations could adversely affect our results of operations; |
| Ÿ | The loss of key executives could adversely affect our ability to effectively operate and manage our business; |
| Ÿ | Increased labor costs or the unavailability of skilled workers could hurt our operations; |
| Ÿ | We participate in a capital intensive industry. We may not be able to finance future growth of our operations or future acquisitions; |
| Ÿ | Delays in obtaining permits by our customers for their operations could impair our business; |
| Ÿ | Any future decreases in the rate at which oil or natural gas reserves are discovered or developed could decrease the demand for our services; |
| Ÿ | Our business involves many hazards and operational risks, some of which may not be fully covered by insurance. If a significant accident or event occurs for which we are not adequately insured, our operations and financial results could be adversely affected; |
| Ÿ | Federal and state legislative and regulatory initiatives relating to hydraulic fracturing could restrict or make more difficult our hydraulic fracturing operations or could increase our or Chesapeake’s operating costs; |
| Ÿ | We are subject to federal, state and local laws and regulations regarding issues of health, safety, climate change and protection of the environment. Under these laws and regulations, we may become liable for penalties, damages or costs of remediation or other corrective measures. Any changes in laws or government regulations could increase our costs of doing business; and |
| Ÿ | Chesapeake has the option to terminate our services agreement if Chesapeake no longer controls us. |
22
Table of Contents
Index to Financial Statements
Summary Historical and Pro Forma Financial Data
The following tables set forth summary historical and unaudited pro forma financial data of COS LLC and its predecessors. The summary historical financial data as of December 31, 2011 and for each of the years ended December 31, 2009, 2010 and 2011 is derived from the audited consolidated financial statements included elsewhere in this prospectus. Our historical consolidated financial statements for periods and as of dates prior to our October 25, 2011 reorganization were prepared on a “carve-out” basis from Chesapeake and are intended to represent the financial results of Chesapeake’s oilfield service operations for those periods. The summary historical financial data is not necessarily indicative of results to be expected in future periods. Our summary historical financial data should be read together with the historical consolidated financial statements and related notes thereto and “Management’s Discussion and Analysis of Financial Condition and Results of Operations,” each included elsewhere in this prospectus.
The summary unaudited pro forma financial data as of December 31, 2011 and for the year ended December 31, 2011 is derived from the audited consolidated financial statements included elsewhere in this prospectus and includes pro forma adjustments to give effect to certain transactions that occurred during the year ended December 31, 2011, and the transactions associated with our formation and this offering. Our summary unaudited pro forma financial data should be read together with the unaudited pro forma consolidated financial statements and related notes thereto included elsewhere in this prospectus.
The financial statements of COS Inc. have not been presented in this prospectus as it is a newly incorporated entity, has had no business transactions or activities to date and has no (or nominal) assets or liabilities.
| Years Ended December 31, | ||||||||||||||||
| COS LLC Historical | Pro Forma Combined (3) |
|||||||||||||||
| 2009 | 2010 | 2011 | 2011 | |||||||||||||
| (Unaudited) | ||||||||||||||||
| (In thousands) |
||||||||||||||||
| Income Statement Data: |
||||||||||||||||
| Revenues, including revenues from affiliates |
$ | 650,279 | $ | 815,756 | $ | 1,303,496 | $ | 1,366,066 | ||||||||
| Operating costs |
556,008 | 666,924 | 987,032 | 1,036,399 | ||||||||||||
| Depreciation and amortization |
70,429 | 106,425 | 171,908 | 180,236 | ||||||||||||
| General and administrative costs, including expenses from affiliates |
17,735 | 25,312 | 37,074 | 45,902 | ||||||||||||
| Losses (gains) on sales of property and equipment |
(1,551 | ) | (854 | ) | (3,571 | ) | (3,546 | ) | ||||||||
| Impairments |
26,797 | (1) | 9 | 2,729 | 3,408 | |||||||||||
|
|
|
|
|
|
|
|
|
|||||||||
| Operating income (loss) |
(19,139 | ) | 17,940 | 108,324 | 103,667 | |||||||||||
|
|
|
|
|
|
|
|
|
|||||||||
| Interest expense, including expenses from affiliates |
(23,453 | ) | (38,511 | ) | (65,072 | ) | ||||||||||
| Losses from equity investee |
(164 | ) | (2,243 | ) | — | — | ||||||||||
| Other income (expense) |
(283 | ) | 211 | (2,464 | ) | (1,979 | ) | |||||||||
|
|
|
|
|
|
|
|
|
|||||||||
| Total other expense |
(23,900 | ) | (40,543 | ) | (67,536 | ) | ||||||||||
|
|
|
|
|
|
|
|
|
|||||||||
| Income (loss) before income taxes |
(43,039 | ) | (22,603 | ) | 40,788 | |||||||||||
| Income tax expense (benefit) |
(2,656 | ) | (3,751 | ) | 21,030 | |||||||||||
|
|
|
|
|
|
|
|
|
|||||||||
| Net income (loss) |
(40,383 | ) | (18,852 | ) | 19,758 | |||||||||||
|
|
|
|
|
|
|
|
|
|||||||||
| Less: Net Loss Attributable to Noncontrolling Interest |
— | (639 | ) | (154 | ) | |||||||||||
|
|
|
|
|
|
|
|
|
|||||||||
| Net Income (Loss) Attributable to COS Holdings, L.L.C. |
$ | (40,383 | ) | $ | (18,213 | ) | $ | 19,912 | $ | |||||||
|
|
|
|
|
|
|
|
|
|||||||||
| Other Financial Data: |
||||||||||||||||
| Adjusted EBITDA(2)(unaudited) |
$ | 76,089 | $ | 121,488 | $ | 276,926 | $ | |||||||||
| Capital expenditures (including acquisitions) |
$ | 325,895 | $ | 269,769 | $ | 738,354 | $ | |||||||||
23
Table of Contents
Index to Financial Statements
| As of December 31, 2011 | ||||||||
| Actual | Pro Forma(4) | |||||||
| (Unaudited) | ||||||||
| (In thousands) | ||||||||
| Balance Sheet Data: |
||||||||
| Cash |
$ | 2,360 | $ | |||||
| Total property and equipment, net |
$ | 1,225,580 | $ | 1,225,580 | ||||
| Total assets |
$ | 1,598,582 | $ | |||||
| Total long-term debt |
$ | 1,050,674 | $ | |||||
| Total equity |
$ | 181,782 | $ | |||||
| (1) | We recorded an impairment to goodwill in the amount of $19.8 million and an impairment of long-lived assets in the amount of $7.0 million for the year ended December 31, 2009. |
| (2) | “Adjusted EBITDA” is a non-GAAP financial measure that we define as net income before interest, taxes, depreciation and amortization, as further adjusted to add back gain or loss on sale of property and equipment and impairments. “Adjusted EBITDA,” as used and defined by us, may not be comparable to similarly titled measures employed by other companies and is not a measure of performance calculated in accordance with GAAP. Adjusted EBITDA should not be considered in isolation or as a substitute for operating income, net income or loss, cash flows provided by operating, investing and financing activities, or other income or cash flow statement data prepared in accordance with GAAP. However, our management believes Adjusted EBITDA may be useful to an investor in evaluating our operating performance because this measure: |
| Ÿ | is widely used by investors in the oilfield services industry to measure a company’s operating performance without regard to items excluded from the calculation of such measure, which can vary substantially from company to company depending upon accounting methods, book value of assets, capital structure and the method by which assets were acquired, among other factors; |
| Ÿ | is a financial measurement that, with certain negotiated adjustments, will be reported to our lenders pursuant to our forthcoming revolving bank credit facility and will be used in the financial covenants in our revolving bank credit facility; and |
| Ÿ | is used by our management for various purposes, including as a measure of performance of our operating entities and as a basis for strategic planning and forecasting. |
| There are significant limitations to using Adjusted EBITDA as a measure of performance, including the inability to analyze the effect of certain recurring and non-recurring items that materially affect our net income or loss, and the lack of comparability of results of operations of different companies. |
| The following table presents a reconciliation of the non-GAAP financial measure of Adjusted EBITDA to the GAAP financial measure of net income (loss): |
| Years Ended December 31, | ||||||||||||||||
| COS LLC Historical | Pro Forma Combined |
|||||||||||||||
| 2009 | 2010 | 2011 | 2011 | |||||||||||||
| (In thousands) | ||||||||||||||||
| Net income (loss) |
$ | (40,383 | ) | $ | (18,852 | ) | $ | 19,758 | $ | |||||||
| Interest expense |
23,453 | 38,511 | 65,072 | |||||||||||||
| Income tax expense (benefit) |
(2,656 | ) | (3,751 | ) | 21,030 | |||||||||||
| Depreciation and amortization |
70,429 | 106,425 | 171,908 | 180,236 | ||||||||||||
| Impairments |
26,797 | 9 | 2,729 | 3,408 | ||||||||||||
| Gains on sales of property and equipment |
(1,551 | ) | (854 | ) | (3,571 | ) | (3,546 | ) | ||||||||
|
|
|
|
|
|
|
|
|
|||||||||
| Adjusted EBITDA |
$ | 76,089 | $ | 121,488 | $ | 276,926 | $ | |||||||||
|
|
|
|
|
|
|
|
|
|||||||||
| (3) | Includes pro forma adjustments to give effect to (a) the acquisition of Bronco Drilling Company, Inc. in June 2011, (b) our transfer of certain land and buildings to Chesapeake in October 2011, (c) the issuance by COO of $650.0 million of 6.625% Senior Notes due 2019 in October 2011 and the use of the net proceeds therefrom to repay a portion of an intercompany promissory note owed to Chesapeake, (d) COO’s entry into, and borrowings under, our revolving bank credit facility in November 2011 and (e) our reorganization in connection with, and the closing of, this offering and the application of the estimated net proceeds as described in “Use of Proceeds”. |
| (4) | Includes pro forma adjustments to give effect to our reorganization in connection with, and the closing of, this offering and the application of the estimated net proceeds as described in “Use of Proceeds.” |
24
Table of Contents
Index to Financial Statements
An investment in our Class A common stock involves risks. You should carefully consider the risks described below before making an investment decision. Our business, financial condition or results of operations could be materially adversely affected by any of these risks. The trading price of our Class A common stock could decline due to any of these risks, and you may lose all or part of your investment. The risks discussed below are not the only risks we face. We may experience additional risks and uncertainties not currently known to us, or as a result of developments occurring in the future. Conditions that we currently deem to be immaterial may also materially and adversely affect our business, financial condition, cash flows and results of operations.
Risks Relating to Our Business
We are dependent on Chesapeake for a substantial majority of our revenues. Therefore, we are indirectly subject to the business risks of Chesapeake. We have no control over Chesapeake’s business decisions and operations, and Chesapeake is under no obligation to adopt a business strategy that favors us.
Historically, we have provided substantially all of our oilfield services to Chesapeake and its partners. During 2009, 2010 and 2011, Chesapeake and its partners accounted for approximately 95%, 96% and 94% of our revenues, respectively, and we expect to derive a substantial majority of our revenues from Chesapeake for the foreseeable future. If Chesapeake ceases to engage us on terms that are attractive to us, particularly after the expiration of our services agreement with it, our business, financial condition and results of operations will be materially adversely affected. Accordingly, we are indirectly subject to the business risks of Chesapeake, some of which are the following:
| Ÿ | the volatility of oil and natural gas prices, which could have a negative effect on the value of its oil and natural gas properties, its drilling programs, its ability to finance its operations and its willingness to spend capital for exploration and development activities; |
| Ÿ | the availability of capital on an economic basis to fund its exploration and development activities; |
| Ÿ | its discovery rate of new oil and natural gas reserves and the speed at which it develops such reserves; |
| Ÿ | its drilling and operating risks, including potential environmental liabilities; |
| Ÿ | transportation capacity constraints and interruptions; and |
| Ÿ | adverse effects of governmental and environmental regulation. |
Our relationship with Chesapeake presents a number of additional risks to us. Please read “—Risks Related to Our Relationship with Chesapeake.”
Demand for services in our industry is cyclical and depends on drilling and completion spending by Chesapeake and other E&P companies in the U.S., and the level of such activity is volatile.
Demand for services in our industry is cyclical, and we depend on Chesapeake’s and our other customers’ willingness to make expenditures to explore for, develop and produce oil and natural gas in the U.S. Our customers’ willingness to undertake these activities depends largely upon prevailing industry conditions that are influenced by numerous factors over which we have no control, including:
| Ÿ | prices, and expectations about future prices, of oil and natural gas; |
| Ÿ | domestic and foreign supply of and demand for oil and natural gas; |
25
Table of Contents
Index to Financial Statements
| Ÿ | the cost of exploring for, developing, producing and delivering oil and natural gas; |
| Ÿ | available pipeline, storage and other transportation capacity; |
| Ÿ | lead times associated with acquiring equipment and products and availability of qualified personnel; |
| Ÿ | the expected rates of decline in production from existing and prospective wells; |
| Ÿ | the discovery rates of new oil and natural gas reserves; |
| Ÿ | federal, state and local regulation of hydraulic fracturing and other oilfield activities, including public pressure on governmental bodies and regulatory agencies to regulate our industry; |
| Ÿ | the availability of water resources and suitable proppants in sufficient quantities for use in hydraulic fracturing operations; |
| Ÿ | the availability, capacity and cost of disposal and recycling services for used hydraulic fracturing fluids; |
| Ÿ | political instability in oil and natural gas producing countries; |
| Ÿ | advances in exploration, development and production technologies or in technologies affecting energy consumption; |
| Ÿ | the price and availability of alternative fuels and energy sources; and |
| Ÿ | uncertainty in capital and commodities markets and the ability of oil and natural gas producers to raise equity capital and debt financing. |
Anticipated future prices for natural gas and crude oil are a primary factor affecting spending and drilling activity by E&P companies, including Chesapeake. Lower prices or volatility in prices for oil and natural gas typically decrease spending and drilling activity, which can cause rapid and material declines in demand for our services and in the prices we are able to charge for our services. Worldwide political, economic and military events as well as natural disasters and other factors beyond our control contribute to oil and natural gas price levels and volatility and are likely to continue to do so in the future.
Any prolonged substantial reduction in oil and natural gas prices would likely affect oil and natural gas production levels and, therefore, would affect demand for and prices of the services we provide. While we have a services agreement with Chesapeake providing for minimum utilization of certain of our equipment, that agreement provides that we will receive market rates for our services, and, consequently, the prices we are able to charge will fluctuate with market conditions. A material decline in oil and natural gas prices or drilling activity levels or sustained lower prices or activity levels could have a material adverse effect on our business, financial condition, results of operations and cash flow.
For example, deterioration in the global economic environment commencing in the latter part of 2008 and continuing throughout 2009 caused the oilfield services industry to cycle into a downturn. Declines in prices for oil and natural gas experienced during this period caused many E&P companies to announce reductions in capital budgets for future periods. Likewise, many E&P companies, including Chesapeake, recently have announced plans to reduce drilling in plays characterized by higher concentrations of dry natural gas. Although many of these companies, including Chesapeake, have also announced that they will refocus their drilling activities on liquids-rich plays, an overall reduction in the demand for oilfield services could still occur, which would adversely affect the prices that we are able to charge, and the demand, for our services. Additionally, we may incur costs and have downtime as we redeploy equipment and personnel from dry natural gas plays to liquids-rich plays.
26
Table of Contents
Index to Financial Statements
Spending by E&P companies can also be impacted by conditions in the capital markets. Limitations on the availability of capital, or higher costs of capital, for financing expenditures may cause Chesapeake and other E&P companies to make additional reductions to capital budgets in the future even if oil prices remain at current levels or natural gas prices increase from current levels. Any such cuts in spending will curtail drilling and completion programs as well as discretionary spending on well services, which may result in a reduction in the demand for our services, the rates we can charge and the utilization of our assets. Moreover, reduced discovery rates of new oil and natural gas reserves, or a decrease in the development rate of reserves, in our market areas, whether due to increased governmental regulation, limitations on exploration and drilling activity or other factors, could also have a material adverse impact on our business, financial condition, results of operations and cash flow, even in a stronger oil and natural gas price environment.
Competition in our industry or increases in the supply of drilling rigs or hydraulic fracturing units could decrease the prices for our products and services and our revenues.
The market for oilfield services in which we operate is highly competitive. Contracts are traditionally awarded on the basis of competitive bids or direct negotiations with customers. The competitive environment has intensified as recent mergers among E&P companies have reduced the number of available customers. The fact that drilling rigs and other vehicles and pieces of oilfield services equipment are mobile and can be moved from one market to another in response to market conditions heightens the competition in the industry.
In addition, there has been a substantial increase in the supply of land drilling rigs in the U.S. over the past five years, and a number of competitors have announced that they are expanding their hydraulic fracturing fleets or entering into the hydraulic fracturing market for the first time. An increase in the supply of land drilling rigs, whether through new construction or refurbishment, or an increase in the supply of hydraulic fracturing units could decrease revenue rates and utilization rates. We do not have a fixed price contract with Chesapeake. Thus, if competition or other factors decrease market prices for the products and services we provide, Chesapeake could require us to lower the prices we charge to it. A reduction in the rates we charge would adversely affect our revenues and profitability. Such adverse effect on our revenue and profitability could be further aggravated by any downturn in oil and natural gas prices.
Shortages or increases in the costs of the equipment we use in our operations could adversely affect our growth plans and our operations in the future.
Our business strategy calls for us to grow rapidly. We may not be able to achieve our growth targets due to delays in procuring needed equipment. We generally do not have long term contracts in place that provide for the delivery of equipment needed to meet our growth plans. We could experience delays in the delivery of the equipment that we have ordered and its placement into service due to factors that are beyond our control. New federal regulations regarding diesel engines, demand by other oilfield service companies and numerous other factors beyond our control could adversely affect our ability to procure equipment we have not yet ordered that is needed to meet our growth plans or cause the prices of such equipment to increase.
Shortages or increases in the costs of the products we use in our operations could adversely affect our results of operations.
We do not have long-term contracts with the third-party suppliers of many of the products that we use in large volumes in our operations, such as the proppants and chemicals we use in our hydraulic fracturing operations and the fuel we use in our equipment and vehicles. During periods in which oilfield services are in high demand, the availability of the key products used in our industry decreases
27
Table of Contents
Index to Financial Statements
and the price of such products increases. We are dependent on a small number of suppliers for key raw materials and finished products. Our reliance on a small number of suppliers could increase the difficulty of obtaining such products in the event of shortage in our industry. Shortages of such products could cause us to curtail our operations or could affect our results of operations if price increases cannot be passed on to our customers, or have a combination of both effects, which could have a material adverse effect on our business, financial condition or results of operations.
Although we currently have plans to vertically integrate our hydraulic fracturing operations by integrating sand mines, sand processing facilities and additional logistics assets, there is no assurance that we will be able to do so successfully. If we are unsuccessful at vertically integrating, we will continue to depend on third-party suppliers for dry sand and transportation systems and therefore will be unable to reduce the logistical and supply-chain challenges inherent in our business.
Additionally, our hydraulic fracturing operations require a significant supply of water. Our water requirements are met by Chesapeake or our other customers from sources on or near their sites, but our customers may not have access to water in sufficient quantities to perform hydraulic fracturing operations due to reasons beyond their or our control, such as drought, water rationing and regulatory actions. These risks are more pronounced in semi-arid regions where we operating extensively. An inability to secure an adequate supply of water for our operations could have a material adverse effect on our business, financial condition or results of operations.
The loss of key executives could adversely affect our ability to effectively operate and manage our business.
We are dependent upon the efforts and skills of our executives to manage and grow our business. In addition, our development and expansion will require additional experienced management, operations and technical personnel. We cannot assure you that we will be able to retain these employees, and the loss of the services of one or more of our key executives could increase our exposure to the other risks described in this “Risk Factors” section. We do not maintain key man insurance on any of our personnel.
Increased labor costs or the unavailability of skilled workers could hurt our operations.
We are dependent upon an available pool of skilled employees to maintain and grow our business. We compete with other oilfield services businesses and other employers to attract and retain qualified personnel with the technical skills and experience required to provide the highest quality service. The demand for skilled workers is high and the supply is limited, and a shortage in the labor pool of skilled workers or other general inflationary pressures or changes in applicable laws and regulations could make it more difficult for us to attract and retain personnel and could require us to enhance our wage and benefits packages.
Although our employees are not covered by a collective bargaining agreement, union organizational efforts could occur and, if successful, could increase our labor costs. A significant increase in the wages paid by competing employers or the unionization of groups of our employees could result in increases in the wage rates that we must pay. Likewise, laws and regulations to which we are subject, such as the Fair Labor Standards Act, which governs such matters as minimum wage, overtime and other working conditions, can increase our labor costs or subject us to liabilities to our employees. We cannot assure you that labor costs will not increase. Increases in our labor costs or unavailability of skilled workers could impair our capacity and diminish our profitability, having a material adverse effect on our business, financial condition, results of operations and cash flow.
Historically, our industry has experienced a high annual employee turnover rate. We believe that the high turnover rate is attributable to the nature of the work, which is physically demanding and
28
Table of Contents
Index to Financial Statements
performed outdoors, and to the volatility and cyclical nature of the oilfield service industry. As a result, workers may choose to pursue employment in fields that offer a more desirable work environment at wage rates that are competitive with ours. We cannot assure that we will be able to recruit, train and retain an adequate number of workers to replace departing workers. The inability to maintain an adequate workforce could have a material adverse effect on our business, financial condition, results of operations and cash flow.
We participate in a capital intensive industry. We may not be able to finance future growth of our operations or future acquisitions.
Our activities require substantial capital expenditures. In the past, we have relied on capital infusions by Chesapeake to meet our liquidity needs. We do not anticipate that Chesapeake will need to make these capital infusions in the future. However, if our cash flow from operating activities and borrowings under our revolving bank credit facility are not sufficient to fund our capital expenditure budget, we would be required to fund these expenditures through debt or equity or alternative financing plans, such as:
| Ÿ | refinancing or restructuring our debt; |
| Ÿ | selling assets; and/or |
| Ÿ | reducing or delaying acquisitions or capital investments, such as acquisitions of additional revenue-generating equipment and refurbishments of our rigs and related equipment. |
However, if debt and equity capital or alternative financing plans are not available or are not available on economically attractive terms, we would be required to curtail our capital spending, and our ability to grow our business and sustain or improve our profits may be adversely affected. Our ability to refinance or restructure our debt will depend on the condition of the capital markets and our and Chesapeake’s financial condition at such time, among other things. Any refinancing of our debt could be at higher interest rates and may require us to comply with more onerous covenants, which could further restrict our business operations. In addition, any failure to make payments of interest and principal on our outstanding indebtedness on a timely basis or to satisfy our liquidity needs would likely result in a reduction of our credit rating, which could harm our ability to incur additional indebtedness. Any failure to make payments under the operating subleases for our drilling rigs would result in a default under such sublease and could cause us to lose the use of the affected drilling rigs. The terms of existing or future debt instruments may restrict us from adopting some of these alternatives. Chesapeake has significant long-term indebtedness, and we could experience an increase in our borrowing costs or difficultly accessing, or an inability to access, the capital markets based on adverse developments affecting Chesapeake. See “—Risks Relating to our Relationship With Chesapeake—Chesapeake’s level of indebtedness could adversely affect our ability to grow our business, as well as our credit ratings and profile.” Any of the foregoing consequences could materially and adversely affect our business, financial condition, results of operations and prospects.
Delays in obtaining permits by our customers for their operations could impair our business.
Our customers are required to obtain permits from one or more governmental agencies in order to perform drilling and/or completion activities. Such permits are typically required by state agencies but can also be required by federal and local governmental agencies. The requirements for such permits vary depending on the location where such drilling and completion activities will be conducted. As with all governmental permitting processes, there is a degree of uncertainty as to whether a permit will be granted, the time it will take for a permit to be issued and the conditions which may be imposed in connection with the granting of the permit. Certain regulatory authorities have delayed or suspended the issuance of permits while the potential environmental impacts associated with issuing such permits
29
Table of Contents
Index to Financial Statements
can be studied and appropriate mitigation measures evaluated. Permitting delays, an inability to obtain new permits or revocation of our or our customers’ current permits could cause a loss of revenue and potentially have a materially adverse effect on our operations.
Any future decreases in the rate at which oil or natural gas reserves are discovered or developed could decrease the demand for our services.
Reduced discovery rates of new oil and natural gas reserves, or a decrease in the development rate of reserves, in our market areas, whether due to increased governmental regulation, limitations on exploration and drilling activity or other factors, could have a material adverse impact on our business even in a stronger oil and natural gas price environment.
Our business involves many hazards and operational risks, some of which may not be fully covered by insurance. If a significant accident or event occurs for which we are not adequately insured, our operations and financial results could be adversely affected.
Our operations are subject to many hazards and risks, including the following:
| Ÿ | accidents resulting in serious bodily injury and the loss of life or property; |
| Ÿ | liabilities from accidents or damage by our fleet of trucks, rigs and other equipment; |
| Ÿ | pollution and other damage to the environment; |
| Ÿ | blow-outs, the uncontrolled flow of natural gas, oil or other well fluids into or through the environment, including onto the ground or into the atmosphere, surface waters or an underground formation; and |
| Ÿ | fires and explosions. |
If any of these hazards occur, they could result in suspension of operations, damage to or destruction of our equipment and the property of others, or injury or death to our personnel or third parties and could expose us to substantial liability or losses. The frequency and severity of such incidents will affect operating costs, insurability and relationships with customers, employees and regulators. In addition, these risks may be greater for us upon the acquisition of another company that has not allocated significant resources and management focus to safety and has a poor safety record.
We are not fully insured against all risks inherent in our business. For example, we do not have any business interruption/loss of income insurance that would provide coverage in the event of damage to any of our equipment or facilities. Although we are insured for environmental pollution resulting from environmental accidents that occur on a sudden and accidental basis, we may not be insured against all environmental accidents that might occur, some of which may result in toxic tort claims. If a significant accident or event occurs for which we are not adequately insured, it could adversely affect our operations and financial condition. Furthermore, we may not be able to maintain or obtain insurance of the type and amount we desire at reasonable rates. As a result of market conditions, premiums and deductibles for certain of our insurance policies may substantially increase. In some instances, certain insurance could become unavailable or available only for reduced amounts of coverage.
Federal and state legislative and regulatory initiatives relating to hydraulic fracturing could restrict or make more difficult our hydraulic fracturing operations or could increase our or Chesapeake’s operating costs.
It is customary in our industry to recover oil and natural gas from deep shale and other formations through horizontal drilling and hydraulic fracturing. Hydraulic fracturing is the process of creating or expanding cracks, or fractures, in hydrocarbon bearing formations by pumping water, sand and other additives under high pressure into the formation.
30
Table of Contents
Index to Financial Statements
The hydraulic fracturing process is typically regulated by state oil and natural gas commissions. Several states, including Pennsylvania, Texas, Colorado, Montana, New Mexico and Wyoming, have adopted, and other states are considering adopting, regulations that could impose more stringent permitting, public disclosure, and/or well construction requirements on hydraulic fracturing operations. New York has sought to ban fracturing activities altogether. In addition to state laws, some local municipalities have adopted or are considering adopting land use restrictions, such as city ordinances, that may restrict or prohibit the performance of well drilling in general and/or hydraulic fracturing in particular.
Additionally, the U.S. Environmental Protection Agency (the “EPA”) has asserted federal regulatory authority over the hydraulic fracturing activities involving diesel fuel (specifically, when diesel fuel is utilized in the stimulation fluid) under the Safe Drinking Water Act and is completing the process of drafting guidance documents related to this newly asserted regulatory authority. There are also certain governmental studies either underway or being proposed that focus on deep shale and other formation completion and production practices, including hydraulic fracturing. Depending on the outcome of these studies, federal and state legislatures and agencies may seek to further regulate such activities.
Certain environmental and other groups have suggested that additional federal, state and local laws and regulations may be needed to more closely regulate the hydraulic fracturing process. We cannot predict whether additional federal, state or local laws or regulations will be enacted in the future and, if so, what actions any such laws or regulations would require or prohibit. If additional levels of regulation or permitting requirements were imposed through the adoption of new laws and regulations, our business and operations could be subject to delays, increased operating costs or process prohibitions. Compliance by us and Chesapeake and the costs and burdens associated therewith or the consequences of any failure to comply by us with these regulations could have a material adverse effect on our business, financial condition, results of operations and cash flow.
We are subject to federal, state and local laws and regulations regarding issues of health, safety, climate change and protection of the environment. Under these laws and regulations, we may become liable for penalties, damages or costs of remediation or other corrective measures. Any changes in laws or government regulations could increase our costs of doing business.
Our operations are subject to stringent federal, state and local laws and regulations relating to, among other things, protection of natural resources, wetlands, endangered species, the environment, health and safety, waste management, waste disposal and transportation of waste and other materials. Our operations pose risks of environmental liability, including leakage from our operations to surface or subsurface soils, surface water or groundwater. Some environmental laws and regulations may impose strict liability, joint and several liability, or both. Therefore, in some situations, we could be exposed to liability as a result of our conduct that was lawful at the time it occurred or the conduct of, or conditions caused by, third parties without regard to whether we caused or contributed to the conditions. Actions arising under these laws and regulations could result in the shutdown of our operations, fines and penalties, expenditures for remediation or other corrective measures, and claims for liability for property damage, exposure to hazardous materials, exposure to hazardous waste or personal injuries. Sanctions for noncompliance with applicable environmental laws and regulations also may include the assessment of administrative, civil or criminal penalties, revocation of permits, temporary or permanent cessation of operations in a particular location and issuance of corrective action orders. Such claims or sanctions and related costs could cause us to incur substantial costs or losses and could have a material adverse effect on our business, financial condition, results of operations and cash flow. Additionally, an increase in regulatory requirements on oil and gas exploration and completion activities could significantly delay or interrupt our operations.
31
Table of Contents
Index to Financial Statements
Various state governments and regional organizations are considering enacting new legislation and promulgating new regulations governing or restricting the emission of greenhouse gases from stationary sources such as our equipment and operations. Legislative and regulatory proposals for restricting greenhouse gas emissions or otherwise addressing climate change could require us to incur additional operating costs and could adversely affect demand for the oil and natural gas that we drill for and help produce. The potential increase in our operating costs could include new or increased costs to obtain permits, operate and maintain our equipment and facilities, install new emission controls on our equipment and facilities, acquire allowances to authorize our greenhouse gas emissions, pay taxes related to our greenhouse gas emissions and administer and manage a greenhouse gas emissions program. Moreover, incentives to conserve energy or use alternative energy sources could reduce demand for oil and natural gas.
The EPA regulates air emissions from certain off-road diesel engines that are used by us to power equipment in the field. Under these Tier IV regulations, we are required to retrofit or retire certain engines, and we are limited in the number of non-compliant off-road diesel engines we can purchase. Tier IV engines are costlier and are not yet widely available. Until Tier IV-compliant engines that meet our needs are available, these regulations could limit our ability to acquire a sufficient number of engines to expand our fleet and to replace existing engines as they are taken out of service. Further, the Tier IV regulations may result in increased costs as we continue to grow.
Laws protecting the environment generally have become more stringent over time and we expect them to continue to do so, which could lead to material increases in our costs for future environmental compliance and remediation.
Chesapeake has the option to terminate our services agreement if Chesapeake no longer controls us.
Chesapeake is not subject to any contractual obligation to maintain an ownership interest in us except for a limited period, as described in “Underwriting,” during which it is not permitted to sell any of our Class A common stock until 180 days after the date of this prospectus. Chesapeake has the option to terminate our services agreement in the event it no longer controls us. Under our services agreement with Chesapeake, Chesapeake has guaranteed certain utilization levels for our drilling rigs and hydraulic fracturing fleets. If Chesapeake no longer controls us, it may no longer be required to utilize our services and it will have less incentive to do so.
Part of our growth strategy is focused on our hydraulic fracturing operations, which is subject to certain risks.
The expansion of our hydraulic fracturing operations is a major component of our growth strategy. We began hydraulic fracturing operations in the fourth quarter of 2011 and we currently own four hydraulic fracturing fleets. Congress and several states are considering proposed legislation and regulations which, if passed, would impose additional requirements or restrictions on hydraulic fracturing operations. See “—Federal and state legislative and regulatory initiatives relating to hydraulic fracturing could restrict or make more difficult our hydraulic fracturing operations or could increase our or Chesapeake’s operating costs.” In addition, an increase in the supply of hydraulic fracturing units or a reduction in demand for hydraulic fracturing services could require us to lower the prices we charge for such services, which might make expansion of such business line less attractive. See “—Competition in our industry or increases in the supply of drilling rigs or hydraulic fracturing units could decrease the prices for our products and services and our revenues.” Finally, we may experience a lack of availability of hydraulic fracturing equipment or key products, such as proppants and chemicals, that we use in our hydraulic fracturing operations. See “—Shortages or increases in the costs of the products we use in our operations could adversely affect our results of operations.” The occurrence of these and other events
32
Table of Contents
Index to Financial Statements
and conditions could cause us to be unable to grow our hydraulic fracturing operations as projected and be unable to meet our overall growth objectives.
Growth in our business could strain our resources and increase our operating expenses.
We have experienced rapid growth, and our business strategy calls for us to continue to grow rapidly. Our growth may require us, among other things, to:
| Ÿ | raise additional capital; |
| Ÿ | expand and improve our operational and financial procedures, infrastructure, systems and controls; |
| Ÿ | hire additional management, accounting or other personnel; |
| Ÿ | improve our financial and management information systems; |
| Ÿ | expand, train and manage a larger workforce; |
| Ÿ | improve the coordination among our operating, sales and marketing, financial, accounting and management personnel; and |
| Ÿ | potentially assume unknown liabilities. |
Additionally, growth into new geographic areas presents additional complexities, such as securing facilities for our operations and ensuring compliance with local regulations. Our inability to manage growth effectively or to maintain the quality of our services could have a material adverse effect on our business, financial condition or results of operations.
Severe weather could have a material adverse effect on our business.
Adverse weather can directly impede our operations. Repercussions of severe weather conditions may include:
| Ÿ | curtailment of services; |
| Ÿ | weather-related damage to facilities and equipment, resulting in suspension of operations; |
| Ÿ | inability to deliver equipment, personnel and products to job sites in accordance with contract schedules; and |
| Ÿ | loss of productivity. |
These constraints could delay our operations and materially increase our operating and capital costs. Unusually warm winters or cold summers may also adversely affect the demand for our services by decreasing the demand for natural gas. Our operations in semi-arid regions can be affected by droughts and other lack of access to water used in our operations.
We may not be successful in identifying, making and integrating acquisitions.
A component of our business strategy is to make selective acquisitions that will strengthen our core services or presence in selected markets. The success of this strategy will depend, among other things, on our ability to identify suitable acquisition candidates, to negotiate acceptable financial and other terms, to timely and successfully integrate acquired businesses or assets and to retain the key personnel and the customer base of acquired businesses. Any future acquisitions could present a number of risks, including but not limited to:
| Ÿ | incorrect assumptions regarding the future results of acquired operations or assets or expected cost reductions or other synergies expected to be realized as a result of acquiring operations or assets; |
33
Table of Contents
Index to Financial Statements
| Ÿ | failure to integrate successfully the operations or management of any acquired operations or assets in a timely manner; |
| Ÿ | failure to retain or attract key employees; and |
| Ÿ | diversion of management’s attention from existing operations or other priorities. |
If we are unable to identify, make and successfully integrate acquired businesses, we may be unable to meet our growth objectives.
Restrictions in our credit facilities and indentures could adversely affect our business, financial condition and results of operations.
The operating and financial restrictions in our revolving bank credit facility and in the indenture governing our 2019 Senior Notes and any future financing agreements entered into by us or COO could restrict our ability to finance future operations or capital needs, to meet our growth objectives or to otherwise expand and pursue our business activities. For example, the revolving bank credit facility and the indenture limit COO’s and its subsidiaries’ ability to, among other things:
| Ÿ | incur additional debt or issue guarantees; |
| Ÿ | incur or permit certain liens to exist; |
| Ÿ | make certain investments, acquisitions or other restricted payments; |
| Ÿ | dispose of assets; |
| Ÿ | engage in certain types of transactions with affiliates; |
| Ÿ | merge, consolidate or transfer all or substantially all of our assets; and |
| Ÿ | prepay certain indebtedness. |
Furthermore, our revolving bank credit facility contains covenants requiring COO to maintain a maximum consolidated leverage ratio and a minimum interest coverage ratio.
A failure to comply with the covenants in the revolving bank credit facility, the indenture or any future indebtedness could result in an event of default, which, if not cured or waived, would permit the exercise of remedies against COO that would be likely to have a material adverse effect on our business, financial condition, results of operations and cash flow. The existence of these covenants may also prevent or delay us from pursuing business opportunities that we believe would otherwise benefit us, which could adversely affect our ability to meet our growth objectives.
We may be able to incur more debt and long-term lease obligations in the future.
Our revolving bank credit facility and the indenture governing our 2019 Senior Notes do not prohibit us, and restrict but do not prohibit COO and its subsidiaries, from incurring additional indebtedness and other obligations in the future. If we incur additional debt, the related risks that we and our subsidiaries face could intensify. As of December 31, 2011, after giving effect to this offering and the application of the estimated net proceeds therefrom as described herein, as if each such transaction had occurred on that date, we would have had $ million of long-term indebtedness.
In addition, the revolving bank credit facility and the indenture governing the 2019 Senior Notes do not restrict us, and restrict but do not prohibit COO and its subsidiaries, from entering into sale-leaseback transactions and capital lease obligations. In lieu of incurring debt, we have and may continue to raise capital through sale-leaseback transactions. In a series of transactions since 2006, our predecessor sold an aggregate of 93 drilling rigs and related equipment for total proceeds of approximately $801.8 million. We are currently subleasing these rigs and related equipment from Chesapeake. All of these leases have been accounted for as operating leases and, as a result, our
34
Table of Contents
Index to Financial Statements
obligations under these leases are not reflected on our balance sheet. As of December 31, 2011, the total amount of obligations under our operating leases was $502.3 million, which primarily consisted of leases arising from the sale-leaseback transactions involving the rigs described above. See “Management’s Discussion and Analysis of Financial Condition and Results of Operations—Commitments and Contingencies” and Note 6 “Commitments and Contingencies” to our audited consolidated financial statements included elsewhere in this prospectus.
Our level of indebtedness and long-term lease obligations will have several important effects on our future operations, including, without limitation:
| Ÿ | requiring us to dedicate a significant portion of our cash flow from operations to support the payment of debt service and rental expense; |
| Ÿ | increasing our vulnerability to adverse changes in general economic and industry conditions, and putting us at a competitive disadvantage relative to competitors that have less fixed obligations and more cash flow to devote to their businesses; |
| Ÿ | limiting our ability to obtain additional financing for working capital, capital expenditures, general corporate and other purposes; and |
| Ÿ | limiting our flexibility in operating our business and preventing us from engaging in certain transactions that might otherwise be beneficial to us. |
Any of these factors could result in a material adverse effect on our business, financial condition, results of operations, business prospects.
Changes in trucking regulations may increase our costs and negatively impact our results of operations.
For the transportation and relocation of our drilling rigs and oilfield services equipment and our fluid hauling operations, we operate trucks and other heavy equipment. We therefore are subject to regulation as a motor carrier by the U.S. Department of Transportation and by various state agencies, whose regulations include certain permit requirements of highway and safety authorities. These regulatory authorities exercise broad powers over our trucking operations, generally governing such matters as the authorization to engage in motor carrier operations, safety, equipment testing and specifications and insurance requirements. The trucking industry is subject to possible regulatory and legislative changes that may impact our operations, such as by requiring changes in fuel emissions limits, the hours of service regulations that govern the amount of time a driver may drive or work in any specific period, limits on vehicle weight and size and other matters. On May 21, 2010, President Obama signed an executive memorandum directing the National Highway Traffic Safety Administration and the Environmental Protection Agency to develop new, stricter fuel efficiency standards for medium- and heavy-duty trucks. On September 15, 2011, the NHTSA and the EPA published regulations that regulate fuel efficiency and greenhouse gas emissions from medium- and heavy-duty trucks, beginning with vehicles built for model year 2014. As a result of these regulations, we may experience an increase in costs related to truck purchases and maintenance, impairment of equipment productivity, decrease in the residual value of these vehicles and an increase in operating expenses. Proposals to increase federal, state or local taxes, including taxes on motor fuels, are also made from time to time, and any such increase would increase our operating costs. We cannot predict whether, or in what form, any legislative or regulatory changes applicable to our trucking operations will be enacted and to what extent any such legislation or regulations could increase our costs or otherwise adversely affect our business or operations.
35
Table of Contents
Index to Financial Statements
New technology may cause us to become less competitive.
The oilfield service industry is subject to the introduction of new drilling and completion techniques and services using new technologies, some of which may be subject to patent protection. As competitors and others use or develop new technologies in the future, we may be placed at a competitive disadvantage. Further, we may face competitive pressure to implement or acquire certain new technologies at a substantial cost. Some of our competitors have greater financial, technical and personnel resources that may allow them to enjoy technological advantages and implement new technologies before we can. We cannot be certain that we will be able to implement new technologies or products on a timely basis or at an acceptable cost. Thus, limits on our ability to effectively use and implement new and emerging technologies may have a material adverse effect on our business, financial condition, results of operations and cash flow.
Conservation measures and technological advances could reduce demand for oil and natural gas.
Fuel conservation measures, alternative fuel requirements, increasing consumer demand for alternatives to oil and natural gas, technological advances in fuel economy and energy generation devices could reduce demand for oil and natural gas. Management cannot predict the impact of the changing demand for oil and natural gas services and products, and any major changes may have a material adverse effect on our business, financial condition, results of operations and cash flows.
We have operated at a loss in the past, and there is no assurance of our profitability in the future.
We had net losses during 2009 and 2010, and we may incur operating losses and experience negative operating cash flow in the future. Negative operating results could adversely affect our ability to maintain our capital expenditure program, the trading price of our Class A common stock and our ability to pay dividends in the future.
Our operating history may not be sufficient for investors to evaluate our business and prospects.
We are a recently organized company with a short operating history that is experiencing significant growth. This may make it more difficult for investors to evaluate our business and prospects and to forecast our future operating results. The historical consolidated financial statements included in this prospectus for periods and as of the dates prior to our October 25, 2011 reorganization have been prepared on a “carve-out” basis from Chesapeake and may not be indicative our results of operations and financial condition had we operated as a standalone entity. This prospectus contains unaudited pro forma financial information derived by adjusting our historical consolidated financial statements to give effect to certain described transactions, but that pro forma financial information may not give you an accurate indication of what our actual results would have been if we had been formed at the beginning of the periods presented or of what our future results of operations are likely to be. Our future results will depend on our ability to efficiently manage our combined operations and execute our business strategy.
Risks Relating to Our Relationship with Chesapeake
As long as we are controlled by Chesapeake, your ability to influence the outcome of matters requiring shareholder approval will be limited.
After the completion of this offering, Chesapeake will own all of the outstanding shares of our Class B common stock, representing % of the combined voting power of our Class A and Class B common stock. Each share of our outstanding Class B common stock is entitled to votes per
36
Table of Contents
Index to Financial Statements
share, for as long as the number of shares of our Class B common stock outstanding constitutes at least % of the total number of shares of our common stock outstanding. So long as Chesapeake holds at least % of the total number of shares of our common stock outstanding, it will have voting control of our company. As long as Chesapeake has voting control of our company, it will have the ability to take many shareholder actions, including the election or removal of directors, irrespective of the vote of, and without prior notice to, any other shareholder. As a result, Chesapeake will have the ability to influence or control all matters affecting us, including:
| Ÿ | the composition of our Board of Directors and, through our Board of Directors, decision-making with respect to our business direction and policies, including the appointment and removal of our officers; |
| Ÿ | any determinations with respect to acquisitions of businesses, mergers, or other business combinations; |
| Ÿ | the selection of the services that we will provide; |
| Ÿ | our acquisition or disposition of assets; |
| Ÿ | our capital structure; |
| Ÿ | changes to the agreements relating to our relationship with Chesapeake; |
| Ÿ | decisions as to how to interpret and perform obligations under the agreements relating to our relationship with Chesapeake; |
| Ÿ | our payment or non-payment of dividends on our common stock; and |
| Ÿ | determinations with respect to our tax returns. |
Chesapeake’s interests may not be the same as, or may conflict with, the interests of our other shareholders. As a result, actions that Chesapeake takes with respect to us, as our controlling shareholder, may not be favorable to us or our other shareholders. In addition, this voting control may discourage transactions involving a change of control of our company, including transactions in which you, as a holder of our Class A common stock, might otherwise receive a premium for your shares over the then-current market price.
Chesapeake’s level of indebtedness could adversely affect our ability to grow our business, as well as our credit ratings and profile.
Chesapeake must devote a portion of its cash flows from operating activities to service its indebtedness, and such cash flows are therefore not available for further development activities, which may reduce Chesapeake’s need for our services. As of December 31, 2011, Chesapeake had long-term indebtedness of approximately $10.6 billion. The covenants contained in the agreements governing Chesapeake’s outstanding and future indebtedness may limit its ability to borrow additional funds for development and make certain investments, which also may reduce the demand Chesapeake has for our services.
Credit rating agencies such as Standard & Poor’s and Moody’s will likely consider Chesapeake’s debt ratings when considering our debt ratings, and investors may also consider those ratings because of Chesapeake’s ownership interest in us, the significant commercial relationships between Chesapeake and us and our reliance on Chesapeake for a substantial majority of our revenues. If one or more credit rating agencies were to downgrade the outstanding indebtedness of Chesapeake, we could experience an increase in our borrowing costs or difficulty accessing, or an inability to access, the capital markets. Such a development could also adversely affect our ability to grow our business and to make payments on our debt obligations.
37
Table of Contents
Index to Financial Statements
The interests of Chesapeake, in its capacity as our controlling shareholder and our largest customer, may be adverse to the interests of our other shareholders, and Chesapeake may resolve any potential conflicts of interest in a manner that is unfavorable to our other shareholders.
As our controlling shareholder and largest customer, Chesapeake will able to determine our business strategy and policies. Chesapeake may cause us to pursue a business strategy that favors Chesapeake’s oilfield services needs rather than a business strategy focused on maximizing returns to the holders of our Class A common stock. For example, Chesapeake may cause us to invest in and provide service lines that would otherwise be difficult for Chesapeake to source but that provide relatively low margins to us at the expense of service lines that would provide higher margins to us.
Other conflicts of interest that may arise between Chesapeake and us relating to our past and ongoing relationships include:
| Ÿ | labor, tax, employee benefit, indemnification and other matters arising under our agreements and other relationships with Chesapeake; |
| Ÿ | employee recruiting and retention; |
| Ÿ | sales or distributions by Chesapeake of all or any portion of its ownership interest in us, which could be to one of our competitors; and |
| Ÿ | the interpretation, administration and enforcement of contractual and other rights between Chesapeake and us. |
We cannot assure you that the interests of Chesapeake will coincide with the interests of the holders of our Class A common stock. We may not be able to resolve any potential conflicts, and, so long as Chesapeake continues to own a majority of the combined voting power of all of our outstanding common stock and remains a significant customer, it will continue to be able to effectively control our business and may resolve any such conflicts in a way that is unfavorable to the holders of our Class A common stock.
Additionally, Chesapeake from time to time makes investments in other companies, and it could hold interests in other companies that compete with us. For example, Chesapeake is an equity investor in FTS International, LLC, an oilfield services company that provides hydraulic fracturing services to E&P companies. Chesapeake could have conflicts of interest in its dealings with FTS International and us.
Any of these potential conflicts of interest could have a material adverse effect on our business, financial condition, results of operations and cash flow.
Certain agreements between us and Chesapeake were entered into in the context of an affiliated relationship and may not be fair to us.
While we believe that the master services agreement, services agreement, administrative services agreement, facilities lease agreement and other contractual agreements we have with Chesapeake are on terms that are representative of an arms-length transaction, those agreements were entered into in the context of an affiliated relationship. In addition, at the closing of this offering we will enter into a tax receivable agreement, an amended and restated operating agreement of COS LLC and a registration rights agreement with Chesapeake, each of which also will have been entered into in the context of our affiliated relationship. In addition, these agreements may be amended, and Chesapeake, as the holder of the substantial majority of the combined voting power of our common stock, will have control over our decision to agree to any such amendments, which could have terms
38
Table of Contents
Index to Financial Statements
that may not be representative of the terms of future agreements that we may enter into with unaffiliated third parties.
If our administrative services agreement with Chesapeake is terminated, or if Chesapeake fails to provide us with adequate services, we will have to obtain those services internally or through third-party arrangements.
We depend on Chesapeake to provide us certain general and administrative services and any additional services we may request pursuant to our administrative services agreement. The initial five-year term of the administrative services agreement, which ends October 25, 2016, will be extended for additional one-year periods unless we or Chesapeake provides one-year prior written notice of termination, subject to certain conditions and limitations. Though Chesapeake will agree to perform such services using no less than the level of care it uses in providing such services to itself and its other subsidiaries, if Chesapeake fails to provide us adequate services, or if the agreement is terminated for any reason, we will have to obtain these services internally or through third-party arrangements which may result in increased costs to us.
We will not have control over certain costs and expenses allocated to us by Chesapeake.
We have agreements with Chesapeake pursuant to which Chesapeake allocates certain expenses to us. Under our administrative services agreement with Chesapeake, in return for the general and administrative services provided by Chesapeake, we reimburse Chesapeake on a monthly basis for the overhead expenses incurred by Chesapeake on our behalf in accordance with its current allocation policy, which also includes actual out-of-pocket fees, costs and expenses incurred in connection with the provision of any of the services under the agreement, including the wages and benefits of Chesapeake employees who perform services on our behalf.
Under our facilities lease agreement with Chesapeake, in return for the use of certain yards and other physical facilities out of which we conduct our operations, we pay rent and our proportionate share of maintenance, operating expenses, taxes and insurance to Chesapeake on a monthly basis.
The costs allocated to us by these agreements with Chesapeake may be higher than the costs that we would incur if we obtained such services ourselves.
Our directors and executive officers who own shares of common stock of Chesapeake, who hold options to acquire common stock of Chesapeake or other Chesapeake equity-based awards or who hold positions with Chesapeake may have actual or potential conflicts of interest.
Ownership of shares of common stock of Chesapeake, options to acquire shares of common stock of Chesapeake and other equity-based securities of Chesapeake by certain of our directors and officers after this offering, and the presence of directors or officers of Chesapeake on our Board of Directors could create, or appear to create, potential conflicts of interest when those directors and officers are faced with decisions that could have different implications for Chesapeake than they do for us. Certain of our directors will hold director and/or officer positions with Chesapeake or beneficially own significant amounts of common stock of Chesapeake.
39
Table of Contents
Index to Financial Statements
After the completion of this offering, we will be a “controlled company” within the meaning of the NYSE rules and, as a result, will qualify for, and intend to rely on, exemptions from certain corporate governance requirements that provide protection to shareholders of other companies.
After the completion of this offering, Chesapeake will own more than 50% of the voting power of all then outstanding shares of our capital stock entitled to vote generally in the election of directors, and we will be a “controlled company” under the New York Stock Exchange (“NYSE”) corporate governance standards. As a controlled company, we intend to rely on certain exemptions from the NYSE standards that will enable us not to comply with certain NYSE corporate governance requirements, including the requirements that:
| Ÿ | a majority of our Board of Directors consists of independent directors; |
| Ÿ | we have a nominating and governance committee that is composed entirely of independent directors, with a written charter addressing the committee’s purpose and responsibilities; |
| Ÿ | we have a compensation committee that is composed entirely of independent directors, with a written charter addressing the committee’s purpose and responsibilities; and |
| Ÿ | we conduct an annual performance evaluation of the nominating and governance committee and compensation committee. |
We intend to rely on some or all of these exemptions, and, as a result, you will not have the same protection afforded to shareholders of companies that are subject to all of the NYSE corporate governance requirements.
Risks Related to Our Organizational Structure, this Offering and
an Investment in our Class A Common Stock
Our only material asset after completion of this offering will be our interest in COS LLC, and we are accordingly dependent upon distributions from COS LLC to pay taxes and other expenses.
We and COS LLC are holding companies and we conduct our business through and are dependent upon COO and its subsidiaries, which own all of our operating assets and conduct all of our operations. We and COS LLC have no independent means of generating revenue and are dependent upon COO to do so. COO’s ability to generate revenue and cash flow is subject to the other risks described herein. Additionally, its ability to distribute cash to us is restricted by the indenture governing our 2019 Senior Notes and the terms of our revolving bank credit facility, as well as applicable laws and regulations. While we intend to cause COS LLC to distribute cash to us and Chesapeake in an amount at least equal to that necessary to cover tax liabilities, if any, with respect to the earnings of COS LLC, its ability to do so will be subject to the foregoing risks and limitations.
We will be required to pay Chesapeake for certain tax benefits we may claim arising in connection with prior acquisitions by us, this offering and future exchanges of Class B units, and the amounts we pay could be significant.
We will enter into a tax receivable agreement with Chesapeake that will provide for the payment from us to Chesapeake of 85% of the tax benefits, if any, that we realize or are deemed to realize as a result of (a) the tax basis increases in the assets of COS LLC that arose from certain recent acquisitions by us, (b) any tax basis increase resulting from COS LLC’s distribution of offering proceeds to Chesapeake, (c) the tax basis increases resulting from exchanges by Chesapeake of its Class B units of COS LLC for shares of our Class A common stock, (d) additional deductions allocated to us pursuant to Section 704(c) of the Code to reflect the difference between the fair market value and the adjusted tax basis of COS LLC’s assets as of the date of this offering and (e) imputed interest deemed to be paid by us as a result of, and additional tax basis arising from, payments under the tax receivable agreement. See “Certain Relationships and Related Party Transactions—Tax Receivable Agreement.”
40
Table of Contents
Index to Financial Statements
We expect that the payments that we may make under the tax receivable agreement will be substantial. Assuming no material changes in the relevant tax law, and that we earn sufficient taxable income to realize all tax benefits that are subject to the tax receivable agreement, we expect that future payments under the tax receivable agreement relating to (a) increases in tax basis in the assets that arose from certain recent acquisitions, (b) additional deductions allocated to us to reflect the difference between the fair market value and the adjusted tax basis of COS LLC’s assets as of the date of this offering, (c) any tax basis increase resulting from COS LLC’s distribution to Chesapeake of a portion of the net proceeds of this offering, (d) deductions for interest deemed paid by us and (e) tax basis arising from payments under the tax receivable agreement will aggregate $ (or $ if the underwriters exercise their option to purchase additional shares of Class A common stock in full) and will range over the next 15 years from approximately $ million to $ million per year (or approximately $ million to $ million per year if the underwriters exercise their option to purchase additional shares of Class A common stock in full) and then decline thereafter. Future payments to Chesapeake in respect of subsequent exchanges of Class B units of COS LLC for shares of our Class A common stock would be in addition to these amounts and are expected to be substantial as well. The foregoing numbers are merely estimates and the actual payments could differ materially. It is possible that future transactions or events could increase or decrease the actual tax benefits realized and the corresponding tax receivable agreement payments. There may be a material negative effect on our liquidity if, as a result of timing discrepancies or otherwise, the payments under the tax receivable agreement exceed the actual benefits we realize in respect of the tax attributes subject to the tax receivable agreement, and/or distributions to us by COS LLC are not sufficient to permit us to make payments under the tax receivable agreement after we have paid our taxes and other obligations. The payments under the tax receivable agreement are not conditioned upon Chesapeake’s continued ownership of us.
In certain cases, payments to Chesapeake under the tax receivable agreement may be accelerated and/or significantly exceed the actual benefits we realize in respect of the tax attributes subject to the tax receivable agreement.
The tax receivable agreement will provide that upon certain mergers, asset sales, other forms of business combinations or other changes of control, or if, at any time, we elect an early termination of the tax receivable agreement, we would be obligated to make payments under that agreement based on certain assumptions, including that we would have sufficient taxable income to fully utilize the deductions arising from the increased tax deductions and tax basis and other benefits related to entering into the tax receivable agreement. As a result, (a) we could be required to make payments under the tax receivable agreement that are greater than the specified percentage of the actual benefits we realize in respect of the tax attributes subject to the tax receivable agreement and (b) if we elect to terminate the tax receivable agreement early, we would be required to make an immediate payment equal to the present value of the anticipated future tax benefits, which upfront payment may be made years in advance of the actual realization, if any, of such future benefits. Upon an exchange of Class B units of COS LLC for our Class A common stock following a change of control, any additional increase in tax deductions, tax basis and other benefits in excess of the amounts assumed at the change of control will also result in payments under the tax receivable agreement. In these situations, our obligations under the tax receivable agreement could have a substantial negative impact on our liquidity. We may not be able to finance our obligations under the tax receivable agreement and the terms of our existing indebtedness may limit our subsidiaries’ ability to make distributions to us to pay these obligations.
The tax receivable agreement will provide for the payment from us to Chesapeake of 85% of the tax benefits, if any, that we are deemed to realize as a result of, among other things, the increases in tax basis in the assets of COS LLC that arose from certain recent acquisitions by Chesapeake. In order to calculate the amount we would have been required to pay absent the increase in tax basis as result
41
Table of Contents
Index to Financial Statements
of each acquisition, we will need to determine the tax basis in the assets of COS LLC in effect prior to such acquisition. This determination will be made in our sole judgment based on information received in connection with such acquisition and consistent with COS LLC’s current tax reporting. This information will not be subject to verification by any third party, and there thus can be no assurance that the historic tax basis as determined by us will be accurate and that payments by us under the tax receivable agreement will not exceed 85% of the cash savings that we actually realize.
Payments under the tax receivable agreement will be based on the tax reporting positions that we determine in accordance with the tax receivable agreement. We will not be reimbursed for any payments previously made under the tax receivable agreement; however, such payments will be determined based upon the cumulative net tax benefit to us, which would reflect any reduction in tax benefit for any prior period as a result of an audit. As a result, in certain circumstances, payments could be made under the tax receivable agreement in excess of the benefits that we actually realize.
Additionally, were the Internal Revenue Service (the “IRS”) to successfully challenge the tax basis increases, we would not be reimbursed for any payments made under the tax receivable agreement. As a result, in certain circumstances, we could make payments under the tax receivable agreement in excess of our cash tax savings.
If we are deemed to be an investment company, we may be required to institute burdensome compliance requirements and our activities may be restricted, which may make it difficult for us to complete strategic acquisitions or effect combinations.
If we are deemed an investment company under the Investment Company Act of 1940 (the “Investment Company Act”), our business would be subject to applicable restrictions under that Act, which could make it impracticable for us to continue our business as contemplated.
We believe our company is not an investment company under Section 3(b)(1) of the Investment Company Act because we are primarily engaged in a non-investment company business. We intend to conduct our operations so that we will not be deemed an investment company. However, if we were to be deemed an investment company, restrictions imposed by the Investment Company Act, including limitations on our capital structure and our ability to transact with affiliates, could make it impractical for us to continue our business as contemplated.
The initial public offering price of our Class A common stock may not be indicative of the market price of our Class A common stock after this offering. In addition, an active liquid trading market for our Class A common stock may not develop and our stock price may be volatile.
Prior to this offering, our Class A common stock has not traded on any market. An active and liquid trading market for our Class A common stock may not develop or be maintained after this offering. Liquid and active trading markets usually result in less price volatility and more efficiency in carrying out investors’ purchase and sale orders. The market price of our Class A common stock could vary significantly as a result of a number of factors, some of which are beyond our control. In the event of a drop in the market price of our Class A common stock, you could lose a substantial part or all of your investment in our Class A common stock. The initial public offering price will be negotiated between us and representatives of the underwriters, based on numerous factors that we discuss in the “Underwriting” section of this prospectus, and may not be indicative of the market price of our Class A common stock after this offering. Consequently, you may not be able to sell shares of our Class A common stock at prices equal to or greater than the price paid by you in the offering.
42
Table of Contents
Index to Financial Statements
The following factors, among others, could affect our stock price:
| Ÿ | our operating and financial performance; |
| Ÿ | quarterly variations in the rate of growth of our financial indicators, such as net income per share, net income and revenues; |
| Ÿ | changes in revenue or earnings estimates or publication of reports by equity research analysts; |
| Ÿ | speculation in the press or investment community; |
| Ÿ | sales of our Class A common stock by us or Chesapeake following an exchange of its Class B units of COS LLC for our Class A common stock, or the perception that such sales may occur; |
| Ÿ | general market conditions, including fluctuations in actual and anticipated future commodity prices; and |
| Ÿ | domestic and international economic, legal and regulatory factors unrelated to our performance. |
The stock markets in general have experienced extreme volatility that has often been unrelated to the operating performance of particular companies. These broad market fluctuations may adversely affect the trading price of our Class A common stock.
Purchasers of Class A common stock in this offering will experience immediate and substantial dilution.
Based on an assumed initial public offering price of $ per share (the midpoint of the price range set forth on the cover page of this prospectus), purchasers of our Class A common stock in this offering will experience an immediate and substantial dilution of $ per share in the pro forma as adjusted net tangible book value per share of our Class A common stock from the initial public offering price. Our pro forma as adjusted net tangible book value as of , 2012 after giving effect to this offering would be $ per share. See “Dilution” for a complete description of the calculation of net tangible book value.
The requirements of being a public company, including compliance with the reporting requirements of the Securities Exchange Act of 1934, as amended, which we refer to as the Exchange Act, and the requirements of the Sarbanes-Oxley Act, may strain our resources, increase our costs and distract management. We may be unable to comply with these requirements in a timely or cost-effective manner.
As a public company with listed equity securities, we will have to comply with numerous laws, regulations and requirements, certain corporate governance provisions of the Sarbanes-Oxley Act of 2002, the Dodd-Frank Wall Street Reform and Consumer Protection Act, related regulations of the SEC and the requirements of the NYSE, with which we are not required to comply as a wholly owned subsidiary of Chesapeake. Complying with these statutes, regulations and requirements will occupy a significant amount of time of our Board of Directors and management and will significantly increase our costs and expenses. We will need to:
| Ÿ | institute a more comprehensive compliance function; |
| Ÿ | expand, evaluate and maintain our system of internal controls over financial reporting in compliance with the requirements of Section 404 of the Sarbanes-Oxley Act of 2002 and the related rules and regulations of the SEC and the Public Company Accounting Oversight Board (the “PCAOB”); |
| Ÿ | establish new internal policies, such as those relating to disclosure controls and procedures and insider trading; |
43
Table of Contents
Index to Financial Statements
| Ÿ | comply with corporate governance and other rules promulgated by the NYSE; |
| Ÿ | prepare and file annual, quarterly and other periodic public reports in compliance with the federal securities laws; |
| Ÿ | prepare proxy statements and solicit proxies in connection with annual meetings of our shareholders; |
| Ÿ | involve and retain to a greater degree outside counsel and accountants in the above activities; and |
| Ÿ | establish an investor relations function. |
In addition, we also expect that being a public company subject to these rules and regulations will require us to accept less director and officer liability insurance coverage than we desire or to incur substantial costs to obtain such coverage. These factors could also make it more difficult for us to attract and retain qualified members of our Board of Directors, particularly to serve on our Audit Committee, and qualified executive officers.
We may be unsuccessful in implementing required internal controls over financial reporting.
We are not currently required to comply with the SEC’s rules implementing Section 404 of the Sarbanes-Oxley Act of 2002, and are therefore not required to make a formal assessment of the effectiveness of our internal control over financial reporting for that purpose. Upon becoming a public company, we will be required to comply with the SEC’s rules implementing Section 302 of the Sarbanes-Oxley Act of 2002, which will require our management to certify financial and other information in our quarterly and annual reports and provide an annual management report on the effectiveness of our internal control over financial reporting. We will not be required to make our first assessment of our internal control over financial reporting until the year following our first annual report required to be filed with the SEC. To comply with the requirements of being a public company, we will need to upgrade our systems, including information technology, implement additional financial and management controls, reporting systems and procedures and hire additional accounting, finance and legal staff.
We are in the process of evaluating our internal control systems to allow management to report on, and our independent auditors to assess, our internal controls over financial reporting. We will be performing the system and process evaluation and testing (and any necessary remediation) required to comply with the management certification and auditor attestation requirements of Section 404 of the Sarbanes-Oxley Act. Furthermore, upon completion of this process, we may identify control deficiencies of varying degrees of severity under applicable SEC and PCAOB rules and regulations that remain unremediated. As a public company, we will be required to report, among other things, control deficiencies that constitute a “material weakness” or changes in internal controls that materially affect, or are reasonably likely to materially affect, internal controls over financial reporting. The PCAOB has defined a material weakness as a deficiency, or combination of deficiencies, in internal control over financial reporting such that there is a reasonable possibility that a material misstatement of the company’s annual or interim financial statements will not be prevented, or detected and subsequently corrected, on a timely basis.
Our efforts to develop and maintain effective internal controls may not be successful, and we may be unable to maintain effective controls over our financial processes and reporting in the future and comply with the certification and reporting obligations under Sections 302 and 404 of the Sarbanes-Oxley Act. Any failure to remediate future deficiencies and to develop or maintain effective controls, or any difficulties encountered in our implementation or improvement of our internal controls over financial reporting could result in material misstatements that are not prevented or detected on a timely basis,
44
Table of Contents
Index to Financial Statements
which could potentially subject us to sanctions or investigations by the SEC, the NYSE or other regulatory authorities. Ineffective internal controls could also cause investors to lose confidence in our reported financial information.
We do not intend to pay dividends on our Class A common stock in the immediate future, and our ability to pay dividends in the future may be restricted by the terms of the revolving bank credit facility of COO and the indenture governing the 2019 Senior Notes.
We do not plan to declare dividends on shares of our Class A common stock in the immediate future. Additionally, all of our operations are conducted through COO and COO is currently limited in its ability to make cash distributions to us pursuant to the terms of the indenture governing the 2019 Senior Notes and the revolving bank credit facility, which in turn limits our ability to make cash distributions to shareholders. Consequently, your only opportunity to achieve a return on your investment in us in the immediate future will be if the market price of our Class A common stock appreciates, which may not occur, and you sell your shares at a profit. There is no guarantee that the price of our Class A common stock that will prevail in the market after this offering will ever exceed the price that you pay. See “Dividend Policy.”
Our share price may decline because of Chesapeake’s ability to sell our Class A common stock following an exchange.
Sales of substantial amounts of our Class A common stock after this offering, or the possibility of those sales, including sales by Chesapeake of our Class A common stock received upon exchange of its Class B units of COS LLC, could adversely affect the market price of our Class A common stock and impede our ability to raise capital through the issuance of equity securities. See “Shares Eligible for Future Sale” for a discussion of possible future sales of our Class A common stock.
The shares of our Class A common stock sold in this offering will be freely tradable without restriction in the U.S., by persons other than our affiliates. In connection with this offering, we and Chesapeake have agreed with the underwriters, subject to certain exceptions, not to sell, dispose of or hedge any of our Class A common stock or securities convertible into or exchangeable for shares of Class A common stock until 180 days after the date of this prospectus. See “Underwriting.” Subject to applicable securities laws, after the expiration of the 180-day lock-up period, Chesapeake may sell shares of our Class A common stock through a public offering, sales under Rule 144, or another transaction. Additionally, after the expiration of the 180-day lock-up period, Chesapeake will have the ability to cause us to register the resale of shares of our Class A common stock that may be issued to Chesapeake upon exchange of its Class B units of COS LLC. See “Certain Relationships and Related Party Transactions—Registration Rights Agreement.”
Future sales of our Class A common stock in the public market could lower our stock price, and any additional capital raised by us through the sale of equity or convertible securities may dilute your ownership in us.
We may sell additional shares of Class A common stock in subsequent public offerings and may also issue securities convertible into our Class A common stock. After the completion of this offering, we will have outstanding shares of Class A common stock. This number includes shares that we are selling in this offering (assuming no exercise of the underwriters’ option to purchase additional shares of Class A common stock), which may be resold immediately in the public market. Following the completion of this offering, Class B units of COS LLC owned by Chesapeake will be freely exchangeable into shares of our Class A common stock, which would represent approximately of our total outstanding shares of Class A common stock on an as-converted basis, all of which are restricted from immediate resale under the federal securities laws and are
45
Table of Contents
Index to Financial Statements
subject to the lock-up agreement between Chesapeake and the underwriters described in “Underwriting,” but may be sold into the market in the future.
We cannot predict the size of future issuances of our Class A common stock or the effect, if any, that future issuances and sales of shares of our Class A common stock will have on the market price of our Class A common stock. Sales of substantial amounts of our Class A common stock (including shares issued in connection with an acquisition), or the perception that such sales could occur, may adversely affect prevailing market prices of our Class A common stock.
Our certificate of incorporation and bylaws, as well as Oklahoma law, will contain provisions that could discourage acquisition bids or merger proposals, which may adversely affect the market price of our common stock.
Some provisions in our certificate of incorporation and bylaws, as well as Oklahoma statutes, may have the effect of delaying, deferring or preventing a change of control. These provisions, including those providing for a classified Board of Directors, the possible issuance of shares of our preferred stock and the right of the Board of Directors to amend the bylaws, may make it more difficult for other persons, without the approval of our Board of Directors, to make a tender offer or otherwise acquire a substantial number of shares of our common stock or to launch other takeover attempts that a shareholder might consider to be in his or her best interest. These provisions could limit the price that some investors might be willing to pay in the future for shares of our common stock. See “Description of Capital Stock—Anti-Takeover Effects of Provisions of Our Certificate of Incorporation, Our Bylaws and Oklahoma Law.”
46
Table of Contents
Index to Financial Statements
CAUTIONARY NOTE REGARDING FORWARD-LOOKING STATEMENTS
Certain statements contained in this prospectus constitute forward-looking statements. These statements relate to future events or our future performance. All statements other than statements of historical fact may be forward-looking statements. Forward-looking statements are often, but not always, identified by the use of words such as “seek,” “anticipate,” “plan,” “continue,” “estimate,” “expect,” “may,” “will,” “project,” “predict,” “potential,” “targeting,” “intend,” “could,” “might,” “should,” “believe” and similar expressions. These statements involve known and unknown risks, uncertainties and other facts that may cause actual results or events to differ materially from those anticipated in such forward-looking statements. We believe the expectations reflected in these forward-looking statements are reasonable but we cannot assure you that these expectations will prove to be correct. You should not place undue reliance on forward-looking statements included in this prospectus. We do not intend, and do not assume any obligation, to update any forward-looking statements.
Our actual results could differ materially from those anticipated in these forward-looking statements as a result of many factors, including the following factors and the factors discussed in “Risk Factors” and elsewhere in this prospectus:
| Ÿ | dependence on Chesapeake for a substantial majority of our revenues; |
| Ÿ | Chesapeake’s expenditures for oilfield services; |
| Ÿ | the limitations that Chesapeake’s and our own level of indebtedness may have on our financial flexibility; |
| Ÿ | the cyclical nature of the oil and natural gas industry; |
| Ÿ | changes in the supply of drilling rigs, hydraulic fracturing fleets and other equipment; |
| Ÿ | the availability of capital resources to fund capital expenditures and other contractual obligations, and our ability to access those resources through the debt or equity capital markets; |
| Ÿ | hazards and operational risks that may not be fully covered by insurance; |
| Ÿ | increased labor costs or the unavailability of skilled workers; |
| Ÿ | competitive conditions; and |
| Ÿ | legislative or regulatory changes, including changes in environmental regulations, environmental risks and liability under federal and state environmental laws and regulations. |
The foregoing factors should not be construed as exhaustive and should be read together with the other cautionary statements included in this prospectus, including the information presented under the heading “Risk Factors.” If one or more events related to these or other risks and uncertainties materialize, or if our underlying assumptions prove to be incorrect, our actual results may differ materially from what we anticipate. Except as may be required by law, we do not intend, and do not assume any obligation, to update any forward-looking statements.
47
Table of Contents
Index to Financial Statements
COS Holdings, L.L.C.
On October 25, 2011, Chesapeake completed the process of reorganizing its oilfield services subsidiaries and operations as subsidiaries of COS LLC and commenced providing all of its oilfield services through COS LLC. In connection with this reorganization, certain property, equipment and lease rights as to non-owned drilling rigs used in COS LLC’s operations were transferred to Chesapeake and agreements were entered into between Chesapeake, COS LLC and COO in order to provide COS LLC with continuing access to, and rights to use, such assets and to receive certain services. See “Certain Relationships and Related Party Transactions—Prior Transactions with Chesapeake.”
Chesapeake Oilfield Services, Inc.
We were incorporated in Oklahoma on April 10, 2012 and have not engaged in any business or other activities except in connection with our formation and the offering transactions described in this prospectus. Our business is presently conducted through COS LLC, which has been a wholly owned subsidiary of Chesapeake prior to this offering. Following this offering, our only material asset will be our ownership of Class A units of COS LLC and our only business will be acting as the sole managing member of COS LLC.
Offering Transactions
Concurrently with the closing of this offering, our certificate of formation will be amended and restated to authorize two classes of capital stock, Class A common stock and Class B common stock. Each share of our Class A common stock will entitle its holder to one vote on all matters to be voted on by shareholders generally. Each share of our Class B common stock will entitle its holder to votes on all matters to be voted on by shareholders generally until the first time that the number of shares of our Class B common stock outstanding constitutes less than % of the number of all shares of our common stock outstanding. Holders of our Class A common stock and Class B common stock will vote together as a single class on all matters presented to shareholders for their vote or approval, except as otherwise required by law. See “Description of Capital Stock.” In addition, the operating agreement of COS LLC will be amended and restated to appoint us as the sole managing member of COS LLC and to authorize two classes of units, Class A units and Class B units.
At the closing of this offering, we will issue shares of Class A common stock to the purchasers in this offering in exchange for net proceeds of approximately $ million. We will use the net proceeds from this offering to acquire newly issued Class A units from COS LLC, representing % of COS LLC’s outstanding membership units. Chesapeake’s existing membership units in COS LLC will be reclassified as “Class B units” and will represent % of COS LLC’s outstanding membership units following this offering. In addition, we will issue to Chesapeake a number of shares of our Class B common stock equal to the number of Class B units of COS LLC held by Chesapeake immediately following this offering in exchange for the payment by Chesapeake of the aggregate par value of such shares.
If the underwriters exercise their option to purchase additional shares of Class A common stock in full in connection with this offering, we intend to use the additional net proceeds to acquire additional Class A units from COS LLC and, as a consequence thereof, we would own Class A units representing % of COS LLC’s total outstanding membership units and Chesapeake would own Class B units representing % of COS LLC’s total outstanding membership units.
At any time following this offering, Chesapeake may (subject to the terms of the amended and restated operating agreement of COS LLC) exchange its Class B units in COS LLC for shares of our
48
Table of Contents
Index to Financial Statements
Class A common stock on a one-for-one basis. See “Certain Relationships and Related Party Transactions—Amended and Restated Operating Agreement of COS LLC—Exchange Rights.”
As a result of recent acquisitions by Chesapeake, the consummation of the offering transactions and future exchanges of Class B units of COS LLC for shares of our Class A common stock by Chesapeake, there will be an increase in our share of the tax basis of the assets held directly and indirectly by COS LLC and increased tax deductions allocable to us. These increases in tax basis and increase in available tax deductions may also decrease our allocable share of gains (or increase allocable losses) on future dispositions of certain assets to the extent tax basis is allocated to those assets. As a result, we may incur less taxes than if such basis and additional deductions were not available. We will enter into a tax receivable agreement with Chesapeake that will provide for the payment by us to Chesapeake of 85% of the amount of the benefits, if any, that we realize or are deemed to realize as a result of (a) the tax basis increases in the assets of COS LLC that arose from certain recent acquisitions by us, (b) any tax basis increase resulting from COS LLC’s distribution of offering proceeds to Chesapeake, (c) the tax basis increases resulting from exchanges by Chesapeake of its Class B units of COS LLC for shares of our Class A common stock, (d) additional deductions allocated to us pursuant to Section 704(c) of the Code to reflect the difference between the fair market value and the adjusted tax basis of COS LLC’s assets as of the date of this offering and (e) imputed interest deemed to be paid by us as a result of, and additional tax basis arising from, payments under the tax receivable agreement. We estimate that the incremental tax basis of the assets of COS LLC that will be attributable to us at the time of this offering will be approximately $ million. See “Certain Relationships and Related Party Transactions—Tax Receivable Agreement.”
In connection with our acquisition of Class A units of COS LLC, we will be appointed as the sole managing member of COS LLC. Accordingly, although we will initially have a minority economic interest in COS LLC, we will have 100% of the voting power and will control the management of COS LLC.
As a result of the transactions described above:
| Ÿ | the purchasers in this offering will collectively own shares of our Class A common (or shares of Class A common stock if the underwriters exercise their option to purchase additional shares of Class A common stock in full); |
| Ÿ | We will hold Class A units of COS LLC (or Class A units if the underwriters exercise their option to purchase additional shares of Class A common stock in full); |
| Ÿ | We will be appointed as the sole managing member of COS LLC; |
| Ÿ | the purchasers in this offering will collectively have % voting power in us and, through our ownership of Class A units of COS LLC, a % economic interest in COS LLC (or % voting power in us and a % economic interest in COS LLC if the underwriters exercise their option to purchase additional shares of Class A common stock in full); |
| Ÿ | Chesapeake will hold shares of our Class B common stock (or shares of Class B common stock if the underwriters exercise their option to purchase additional shares of Class A common stock in full) and Class B units of COS LLC (or Class B units if the underwriters exercise their option to purchase additional shares of Class A common stock in full); and |
| Ÿ | Chesapeake, through its ownership of our Class B common stock, will have % of the voting power in us and, through its ownership of Class B units of COS LLC, a % economic interest in COS LLC (or % voting power in us and a % economic interest in COS LLC if the underwriters exercise their option to purchase additional shares of Class A common stock in full). |
49
Table of Contents
Index to Financial Statements
Our post-offering organizational structure will allow Chesapeake to retain its equity ownership in COS LLC, an entity that is classified as a partnership for U.S. federal income tax purposes, in the form of Class B units. Investors in this offering will, by contrast, hold their equity ownership in us in the form of our Class A common stock. We are an Oklahoma corporation that is a domestic corporation for U.S. federal income tax purposes, and we do not believe that our organizational structure gives rise to any significant benefit or detriment to our business or operations.
Holding Company Structure
We will be a holding company following this offering and our sole material asset will be the Class A units of COS LLC that we own. As the sole managing member of COS LLC, we will control all of the business and affairs of COS LLC and its subsidiaries. Initially, Chesapeake, as the holder of all of our Class B common stock, will have % of the combined voting power of our outstanding common stock (or % if the underwriters exercise their option to purchase additional shares of Class A common stock in full). Therefore, upon the closing of this offering and for the foreseeable future thereafter, Chesapeake will be able to exercise control over all matters requiring the approval of our shareholders, including the election of directors and the approval of significant corporate transactions.
As COS LLC’s sole managing member, we will consolidate the financial results of COS LLC and its subsidiaries into our financial statements. Chesapeake’s ownership of Class B units of COS LLC will be accounted for as a minority interest in our consolidated financial statements after this offering.
Net profits and net losses and distributions by COS LLC will be allocated and made to us and Chesapeake pro rata in accordance with our and Chesapeake’s respective ownership of COS LLC. Accordingly, net profits and net losses of COS LLC will initially be allocated, and distributions will be made, approximately % to us and approximately % to Chesapeake (or % and %, respectively, if the underwriters exercise their option to purchase additional shares of Class A common stock in full).
Subject to the availability of net cash flow at the COS LLC level, we intend to cause COS LLC to distribute to us and Chesapeake cash payments for the purpose of funding tax obligations in respect of taxable income and net capital gain allocated to us and Chesapeake, respectively, as members of COS LLC as well as additional payments if any, due us or Chesapeake under the tax receivable agreement.
Assuming COS LLC makes distributions to its members in any given year, the determination to pay dividends, if any, to our Class A shareholders will be made by our Board of Directors. Because our Board of Directors may or may not determine to pay dividends to Class A shareholders, Class A shareholders may not necessarily receive dividend distributions relating to our pro rata share of the income earned by COS LLC, even if COS LLC makes such distributions to us.
In connection with an exchange by Chesapeake of its Class B units of COS LLC for shares of our Class A common stock, we will automatically redeem and cancel a corresponding number of shares of our Class B common stock. Accordingly, Chesapeake’s exchange of Class B units of COS LLC for shares of our Class A common stock will decrease Chesapeake’s share of the combined voting power of our outstanding common stock.
50
Table of Contents
Index to Financial Statements
We will receive net proceeds of approximately $ from our sale of shares of our Class A common stock in this offering, assuming an initial public offering price of $ per share (the midpoint of the price range set forth on the cover page of this prospectus) and after deducting estimated expenses and underwriting discounts of approximately $ million. If the option to purchase additional shares of Class A common stock that we have granted to the underwriters is exercised in full, we estimate that the net proceeds to us will be approximately $ million.
We intend to use the net proceeds from this offering to acquire newly issued Class A units from COS LLC. COS LLC will use $ million of the net proceeds it receives to make a cash capital contribution to COO, which will use such cash to repay outstanding borrowings under its revolving bank credit facility and for general corporate purposes. COO’s credit facility matures on November 3, 2016 and, as of April 10, 2012, the weighted average interest rate applicable to borrowings under the credit facility was 2.79%. Borrowings under the revolving bank credit facility in the past year were incurred for capital expenditures on equipment and other general corporate purposes.
COS LLC will use $ million of the net proceeds to repay the balance outstanding under an intercompany promissory note with Chesapeake. The promissory note matures on October 1, 2016, but demand for payment of the principal amount plus accrued and unpaid interest may be made by Chesapeake at any time. Amounts outstanding under the note bear interest at 6.875% per annum. Borrowings under the promissory note in the past year were incurred for capital expenditures on equipment and other general corporate purposes.
COS LLC will distribute the remaining $ million of the net proceeds it receives to Chesapeake Operating, Inc., a wholly owned subsidiary of Chesapeake.
The table below sets forth the sources and uses of the net proceeds of this offering by us and COS LLC (based on the foregoing assumptions):
| Sources: |
||||
| Proceeds to COS Inc. from sale of Class A common stock in this offering |
$ | |||
| Underwriting discounts and commissions |
||||
| Offering expenses |
||||
|
|
|
|||
| Total net proceeds used to purchase Class A units of COS LLC |
$ | |||
|
|
|
|||
| Uses: |
||||
| Capital contribution to COO |
$ | |||
| Repayment of intercompany promissory note payable to Chesapeake |
||||
| Distribution to Chesapeake |
||||
|
|
|
|||
| Total net proceeds used to purchase Class A units of COS LLC |
$ | |||
|
|
|
We intend to use any additional proceeds we receive if the underwriters exercise their option to purchase additional shares of Class A common stock to acquire additional Class A units from COS LLC and COS LLC will distribute any such proceeds to Chesapeake.
Chesapeake has advised us that it intends to use the net proceeds distributed to it by COS LLC to repay borrowings under its corporate revolving bank credit facility, under which it may re-borrow from time to time and does so for general corporate purposes, including land, drilling and other costs.
Affiliates of Goldman, Sachs & Co. and Merrill Lynch, Pierce, Fenner & Smith Incorporated are lenders under our revolving bank credit facility and under Chesapeake’s corporate revolving bank credit facility and will, thus, receive a portion of the net proceeds from this offering through the repayment of borrowings outstanding under such credit facilities.
51
Table of Contents
Index to Financial Statements
Each $1.00 increase (decrease) in the public offering price would increase (decrease) our net proceeds by approximately $ million, assuming that the number of shares offered by us, as set forth on the cover page of this prospectus, remains the same and after deducting the underwriting discounts and commissions and estimated offering expenses payable by us.
DIVIDEND POLICY
We currently intend to retain future earnings, if any, for use in the operation and expansion of our business and, therefore, do not anticipate paying any cash dividends on our Class A common stock in the immediate future following this offering. However, our Board of Directors, in its discretion, may authorize the payment of dividends in the future. Any decision to pay future dividends will depend upon various factors, including our results of operations, financial condition, capital requirements and investment opportunities. In addition, all of our operations are conducted through COO and COO’s revolving bank credit facility and its indenture governing the 2019 Senior Notes contain covenants that restrict its ability to make distributions to us, which will, in turn, restrict our ability to make any cash distributions to our shareholders. Holders of our Class B common stock will not have the right to receive regular dividends.
52
Table of Contents
Index to Financial Statements
The following table sets forth the capitalization of COS LLC as of December 31, 2011:
| Ÿ | on an actual basis; and |
| Ÿ | on an as adjusted basis to give effect to: |
| Ÿ | the transactions described under “Organizational Structure,” and |
| Ÿ | the closing of this offering and the application of the estimated net proceeds as described in “Use of Proceeds.” |
We derived this table from, and it should be read in conjunction with and is qualified in its entirety by reference to, the consolidated historical financial statements and unaudited pro forma financial data and the accompanying notes included elsewhere in this prospectus. You should also read this table in conjunction with “Management’s Discussion and Analysis of Financial Condition and Results of Operations.”
| As of December 31, 2011 | ||||||||
| Actual | As Adjusted | |||||||
| (Unaudited) | ||||||||
| (In thousands) | ||||||||
| Cash and cash equivalents |
$ | 2,360 | $ | |||||
|
|
|
|
|
|||||
| $ | 2,360 | $ | ||||||
| Long-term debt: |
||||||||
| Affiliate debt |
371,674 | — | ||||||
| Revolving bank credit facility(1)(2) |
29,000 | — | ||||||
| 6.625% Senior Notes due 2019(1) |
650,000 | 650,000 | ||||||
|
|
|
|
|
|||||
| Total long-term debt |
1,050,674 | |||||||
| Total equity |
181,782 | |||||||
|
|
|
|
|
|||||
| Total capitalization |
$ | 1,232,456 | $ | |||||
|
|
|
|
|
|||||
| (1) | Obligations of our indirect wholly owned subsidiary, COO. |
| (2) | As of April 10, 2012, we had borrowings of $215.7 million outstanding under COO’s revolving bank credit facility. |
53
Table of Contents
Index to Financial Statements
If you invest in our Class A common stock, your interest will be diluted to the extent of the difference between the initial public offering price per share of our Class A common stock and the pro forma as adjusted net tangible book value per share of our Class A common stock after this offering. We calculate net tangible book value per share by dividing the net tangible book value (tangible assets less total liabilities) by the number of outstanding shares of our Class A common stock.
Our pro forma net tangible book value as of December 31, 2011, after giving effect to our reorganization in connection with this offering, was approximately $ million, or $ per share of Class A common stock, based on shares of Class A common stock outstanding immediately prior to the closing of this offering and after giving effect to our corporate reorganization. As of December 31, 2011, after giving effect to our reorganization in connection with this offering and the sale of shares of Class A common stock by us in this offering at an assumed initial public offering price of $ per share, the deduction of underwriting discounts and commissions and estimated offering expenses payable by us and the assumed exchange by Chesapeake of the Class B units of COS LLC that it will own immediately following this offering for the corresponding number of shares of our Class A common stock, our pro forma as adjusted net tangible book value as of December 31, 2011, would be $ million, or $ per share. This represents an immediate increase in the pro forma net tangible book value of $ per share to Chesapeake and an immediate dilution of $ per share to new investors purchasing shares in this offering. The following table illustrates this per share dilution:
| Assumed initial public offering price per share |
$ | |||||||
| Pro forma net tangible book value per share as of December 31, 2011 (after giving effect to our corporate reorganization) |
$ | |||||||
| Increase per share attributable to this offering |
||||||||
|
|
|
|||||||
| As adjusted pro forma net tangible book value per share (after giving effect to our corporate reorganization and this offering) |
||||||||
|
|
|
|||||||
| Dilution per share to new investors in this offering |
$ | |||||||
|
|
|
The following table shows, at December 31, 2011, on a pro forma basis as described above, the difference between the number of shares of Class A common stock purchased from us, the total consideration paid to us and the average price paid per share by Chesapeake and by new investors purchasing Class A common stock in this offering:
| Shares Purchased | Total Consideration | Average Price per Share |
||||||||||||||||
| Number | Percent | Amount | Percent | |||||||||||||||
| Chesapeake |
% | $ | % | $ | ||||||||||||||
| New investors |
% | % | ||||||||||||||||
|
|
|
|
|
|
|
|
|
|
||||||||||
| Total |
100 | % | $ | 100 | % | $ | ||||||||||||
|
|
|
|
|
|
|
|
|
|
||||||||||
Assuming the underwriters’ option to purchase additional shares of Class A common stock is exercised in full, sales by us in this offering will reduce the percentage of shares held by Chesapeake to % and will increase the number of shares held by new investors to , or %. This information is based on shares outstanding as of December 31, 2011. No material change has occurred to our equity capitalization since December 31, 2011.
Each $1.00 increase (decrease) in the assumed public offering price per share of our Class A common stock would increase (decrease) the pro forma deficit in net tangible book value by $ per share (assuming no exercise of the underwriters’ option to purchase additional shares) and the dilution to investors in this offering by $ per share, assuming the number of shares offered by us, as set forth on the cover page of this prospectus, remains the same.
54
Table of Contents
Index to Financial Statements
SELECTED HISTORICAL AND PRO FORMA FINANCIAL DATA
The following tables set forth selected historical and unaudited pro forma financial data of COS LLC and its predecessors. The selected financial data for each of the years ended December 31, 2009, 2010 and 2011 are derived from the audited consolidated financial statements included elsewhere in this prospectus. The selected financial data for each of the years ended December 31, 2007 and 2008 are derived from the unaudited consolidated financial statements not included in this prospectus. Our historical consolidated financial statements for periods and as of dates prior to our October 25, 2011 reorganization were prepared on a “carve-out” basis from Chesapeake and are intended to represent the financial results of Chesapeake’s oilfield service operations for those periods. The selected historical financial data are not necessarily indicative of results to be expected in future periods. Our selected historical financial data should be read together with the historical consolidated financial statements and related notes thereto and “Management’s Discussion and Analysis of Financial Condition and Results of Operations,” each included elsewhere in this prospectus.
The selected unaudited pro forma financial data as of December 31, 2011 and for the year ended December 31, 2011 is derived from the audited consolidated financial statements included elsewhere in this prospectus and includes pro forma adjustments to give effect to certain transactions that occurred during the year ended December 31, 2011 and the transactions associated with our formation and this offering. Our selected unaudited pro forma financial data should be read together with the unaudited pro forma consolidated financial statements and related notes thereto included elsewhere in this prospectus.
The financial statements of COS Inc. have not been presented in this prospectus as it is a newly incorporated entity, has had no business transactions or activities to date and has no (or nominal) assets or liabilities.
| Years Ended December 31, | ||||||||||||||||||||||||
| COS LLC Historical | Pro Forma Combined (3) |
|||||||||||||||||||||||
| 2007 | 2008 | 2009 | 2010 | 2011 | 2011 | |||||||||||||||||||
| (Unaudited) | (Unaudited) | (Unaudited) | ||||||||||||||||||||||
| (In thousands) | ||||||||||||||||||||||||
| Income Statement Data: |
||||||||||||||||||||||||
| Revenues, including revenues from affiliates |
$ | 503,605 | $ | 652,828 | $ | 650,279 | $ | 815,756 | $ | 1,303,496 | $ | 1,366,066 | ||||||||||||
| Operating costs |
315,189 | 491,373 | 556,008 | 666,924 | 987,032 | 1,036,399 | ||||||||||||||||||
| Depreciation and amortization |
27,600 | 38,646 | 70,429 | 106,425 | 171,908 | 180,236 | ||||||||||||||||||
| General and administrative, including expenses from affiliates |
8,323 | 13,449 | 17,735 | 25,312 | 37,074 | 45,902 | ||||||||||||||||||
| Losses (gains) on sales of property and equipment |
204 | 283 | (1,551 | ) | (854 | ) | (3,571 | ) | (3,546 | ) | ||||||||||||||
| Impairments |
— | 277 | 26,797 | (1) | 9 | 2,729 | 3,408 | |||||||||||||||||
|
|
|
|
|
|
|
|
|
|
|
|
|
|||||||||||||
| Operating income (loss) |
152,289 | 108,800 | (19,139 | ) | 17,940 | 108,324 | 103,667 | |||||||||||||||||
|
|
|
|
|
|
|
|
|
|
|
|
|
|||||||||||||
| Interest expense, including expenses from affiliates |
(12,352 | ) | (6,161 | ) | (23,453 | ) | (38,511 | ) | (65,072 | ) | ||||||||||||||
| Losses from equity investee |
— | — | (164 | ) | (2,243 | ) | — | — | ||||||||||||||||
| Other income (expense) |
72 | 387 | (283 | ) | 211 | (2,464 | ) | (1,979 | ) | |||||||||||||||
|
|
|
|
|
|
|
|
|
|
|
|
|
|||||||||||||
| Total other expense |
(12,280 | ) | (5,774 | ) | (23,900 | ) | (40,543 | ) | (67,536 | ) | ||||||||||||||
|
|
|
|
|
|
|
|
|
|
|
|
|
|||||||||||||
| Income (loss) before income taxes |
140,009 | 103,026 | (43,039 | ) | (22,603 | ) | 40,788 | |||||||||||||||||
| Income tax expense (benefit) |
55,524 | 40,473 | (2,656 | ) | (3,751 | ) | 21,030 | |||||||||||||||||
|
|
|
|
|
|
|
|
|
|
|
|
|
|||||||||||||
| Net income (loss) |
$ | 84,485 | $ | 62,553 | (40,383 | ) | (18,852 | ) | 19,758 | |||||||||||||||
|
|
|
|
|
|
|
|
|
|
|
|
|
|||||||||||||
| Less: Net Loss Attributable to Noncontrolling Interest |
— | — | — | (639 | ) | (154 | ) | |||||||||||||||||
|
|
|
|
|
|
|
|
|
|
|
|
|
|||||||||||||
| Net Income (Loss) Attributable to COS Holdings, L.L.C. |
$ | 84,485 | $ | 62,553 | $ | (40,383 | ) | $ | (18,213 | ) | $ | 19,912 | ||||||||||||
|
|
|
|
|
|
|
|
|
|
|
|
|
|||||||||||||
| Other Financial Data: |
||||||||||||||||||||||||
| Adjusted EBITDA(2)(unaudited) |
$ | 180,165 | $ | 148,393 | $ | 76,089 | $ | 121,488 | $ | 276,926 | $ | |||||||||||||
| Capital expenditures (including acquisitions) |
$ | 218,610 | $ | 356,421 | $ | 325,895 | $ | 269,769 | $ | 738,354 | $ | |||||||||||||
55
Table of Contents
Index to Financial Statements
| As of December 31, 2011 | ||||||||
| Actual | Pro Forma(4) | |||||||
| (Unaudited) | ||||||||
| (In thousands) | ||||||||
| Balance Sheet Data: |
||||||||
| Cash |
$ | 2,360 | $ | |||||
| Total property and equipment, net |
$ | 1,225,580 | $ | 1,225,580 | ||||
| Total assets |
$ | 1,598,582 | $ | |||||
| Total long-term debt (including current portion) |
$ | 1,050,674 | $ | |||||
| Total equity |
$ | 181,782 | $ | |||||
| (1) | We recorded an impairment to goodwill in the amount of $19.8 million and an impairment of long-lived assets in the amount of $7.0 million for the year ended December 31, 2009. |
| (2) | “Adjusted EBITDA” is a non-GAAP financial measure that we define as net income before interest, taxes, depreciation and amortization, as further adjusted to add back gain or loss on sale of property and equipment and impairments. For additional information about this measure and a reconciliation of our Adjusted EBITDA to our net income, the most directly comparable GAAP financial measure, see footnote 2 to the table in “Prospectus Summary—Summary Historical Financial Data.” |
| (3) | Includes pro forma adjustments to give effect to (a) the acquisition of Bronco Drilling Company, Inc. in June 2011, (b) our transfer of certain land and buildings to Chesapeake in October 2011, (c) the issuance by COO of $650.0 million of 6.625% Senior Notes due 2019 in October 2011 and the use of the net proceeds therefrom to repay a portion of an intercompany promissory note owed to Chesapeake, (d) COO’s entry into, and borrowings under, our revolving bank credit facility in November 2011 and (e) our reorganization in connection with, and the closing of, this offering and the application of the estimated net proceeds as described in “Use of Proceeds.” |
| (4) | Includes pro forma adjustments to give effect to our reorganization in connection with, and the closing of, this offering and the application of the estimated net proceeds as described in “Use of Proceeds.” |
56
Table of Contents
Index to Financial Statements
MANAGEMENT’S DISCUSSION AND ANALYSIS OF
FINANCIAL CONDITION AND RESULTS OF OPERATIONS
The following discussion and analysis should be read in conjunction with our historical consolidated financial statements and related notes thereto included elsewhere in this prospectus. This discussion contains forward-looking statements based on our current expectations, assumptions, estimates and projections about our operations, the oilfield services industry and the broader E&P industry. These forward-looking statements involve known and unknown risks, uncertainties and other facts outside of our control that may cause actual results or events to differ materially from those anticipated in such forward-looking statements. Factors that could cause or contribute to such differences include, but are not limited to general economic and competitive conditions, changes in market prices for oil and natural gas, the level of oil and natural gas drilling and corresponding increases or decreases in the demand for our services, the level of capital expenditures by our existing and prospective customers, regulatory changes and other uncertainties, as well as those factors discussed below and elsewhere in this prospectus, particularly in “Cautionary Note Regarding Forward-Looking Statements” and “Risk Factors.”
Executive Summary
We are a diversified oilfield services company that provides a wide range of well site services primarily to Chesapeake, our founder and principal customer, and its partners. Chesapeake is the most active driller of new oil and natural gas wells in the U.S. based on rig count. We focus on providing services to Chesapeake that are strategic to its oil and gas operations, represent historical bottlenecks to those operations or provide relatively high margins to the service provider, including drilling, hydraulic fracturing, oilfield rentals, oilfield trucking and manufacturing of natural gas compressor packages. Our operations are geographically diversified across most major basins in the U.S. Specifically, we provide Chesapeake and its partners with services in the Eagle Ford, Utica, Granite Wash, Cleveland, Tonkawa, Mississippi Lime, Bone Spring, Avalon, Wolfcamp, Wolfberry and Niobrara unconventional liquids plays and the Barnett, Haynesville, Bossier, Marcellus and Pearsall natural gas shale plays.
Our objective is to provide up to two-thirds of Chesapeake’s overall expected needs for our current and future services. This objective, combined with our unique relationship with Chesapeake, makes us fundamentally different than our competitors because it provides us with substantial growth opportunities while at the same time positioning us to maintain our industry-leading asset utilization rates. We believe that our high-growth, high-utilization business model will allow us to continue creating significant shareholder value over time.
Our business has grown rapidly since our first subsidiary was founded in 2001, both organically and through acquisitions, and we are now one of the larger U.S. onshore oilfield service companies. We currently operate 111 land drilling rigs, the fourth largest active rig fleet in the U.S., which represents our largest revenue generating service line today. We also operate (a) four hydraulic fracturing fleets with an aggregate of 140,000 horsepower; (b) one of the largest oilfield rental businesses in the U.S.; (c) one of the largest oilfield trucking fleets in the U.S., currently consisting of 227 rig relocation trucks, 57 cranes and forklifts used in the movement of drilling rigs and other heavy equipment and 157 fluid hauling trucks; and (d) manufacturing capacity for up to 150 compressor units per quarter, or approximately 85,000 horsepower in the aggregate per quarter. We continue to grow our assets rapidly and have ordered 12 drilling rigs that will utilize advanced electronic drilling technology, including 10 of our proprietary, fit-for-purpose PeakeRigs™, which are scheduled to be delivered at a rate of approximately one rig per month through May 2013. We have also ordered additional new hydraulic fracturing equipment with an aggregate of 175,000 horsepower,
57
Table of Contents
Index to Financial Statements
and we expect to have eight hydraulic fracturing fleets with an aggregate of 315,000 horsepower operating by the end of 2012 and 12 such fleets with an aggregate of 450,000 horsepower operating by the end of 2013. We believe our growth plans will place us among the largest hydraulic fracturing companies in the U.S. by year-end 2014 based on horsepower.
We currently conduct our operations through five operating segments: drilling, hydraulic fracturing, oilfield rentals, oilfield trucking and other operations.
Trends Affecting our Business
Oilfield service companies provide services that are used by E&P companies in connection with the exploration for and the development and production of hydrocarbons. E&P companies operating in the U.S. include independent E&P companies, such as Chesapeake, U.S.-based major integrated oil and gas companies, such as ExxonMobil, ChevronTexaco and ConocoPhillips, and international major integrated oil and gas companies, such as Shell, Total S.A., BP America, CNOOC Limited and Statoil. Demand for domestic onshore oilfield services is a function of the willingness of E&P companies to make operating and capital expenditures to explore for, develop and produce hydrocarbons in the U.S. When oil or natural gas prices increase, E&P companies generally increase their capital expenditures, resulting in greater revenues and profits for oilfield service companies. Likewise, significant decreases in the prices of those commodities typically lead E&P companies to reduce their capital expenditures, which lowers the demand for oilfield services.
Oil and natural gas prices rose to record levels in 2008 and then began to decline in late 2008 in conjunction with the widespread economic recession. While the price of oil rebounded somewhat in 2009 and continued to rise throughout 2010 and 2011, the price of natural gas has continued to fall since 2009 largely due to discoveries of vast new natural gas resources in the U.S. The WTI Cushing spot price of a barrel of crude oil reached an all-time high of $145.29 per barrel in July 2008 and then dropped sharply by the end of the year, falling to as low as $31.41 per barrel on December 22, 2008 before trending upward again by late 2009 and reaching $92.19 in January 2011. During 2011, oil prices generally remained high, averaging $95.05 per barrel through December 31, 2011, due to increased demand, generally flattening international supply and geopolitical tensions. This trend has continued in 2012 with current oil prices above $100 per barrel. On the other hand, from the beginning of 2009 through March 31, 2012, U.S. Henry Hub natural gas prices generally declined from a starting price of $5.40 per mmbtu to an ending price of $2.00 per mmbtu.
58
Table of Contents
Index to Financial Statements
The table below sets forth average daily closing prices for the WTI Cushing spot oil price, the average daily closing prices for the Henry Hub price for natural gas and the average Baker Hughes Incorporated U.S. Land Drilling Rig Count since 2001:
| Period |
Year | Average Daily Closing Henry Hub Spot Natural Gas Prices ($/mcf) |
Average Daily Closing WTI Cushing Spot Oil Price ($/bbl) |
Average Baker Hughes U.S. Land Drilling Rig Count |
||||||||||||||||
| Oil | Gas | |||||||||||||||||||
| January 1 – December 31 |
2001 | $ | 3.96 | $ | 25.94 | 217 | 939 | |||||||||||||
| January 1 – December 31 |
2002 | 3.37 | 26.21 | 137 | 691 | |||||||||||||||
| January 1 – December 31 |
2003 | 5.49 | 31.07 | 157 | 872 | |||||||||||||||
| January 1 – December 31 |
2004 | 5.90 | 41.54 | 165 | 1025 | |||||||||||||||
| January 1 – December 31 |
2005 | 8.89 | 56.65 | 194 | 1186 | |||||||||||||||
| January 1 – December 31 |
2006 | 6.73 | 66.09 | 274 | 1372 | |||||||||||||||
| January 1 – December 31 |
2007 | 6.97 | 72.23 | 297 | 1466 | |||||||||||||||
| January 1 – December 31 |
2008 | 8.89 | 100.63 | 379 | 1491 | |||||||||||||||
| January 1 – December 31 |
2009 | 3.94 | 61.47 | 278 | 801 | |||||||||||||||
| January 1 – December 31 |
2010 | 4.37 | 79.22 | 591 | 943 | |||||||||||||||
| January 1 – December 31 |
2011 | 4.00 | 95.05 | 984 | 887 | |||||||||||||||
Source: Bloomberg NYMEX Prices and Baker Hughes Incorporated
The number of drilling rigs under contract in the U.S. decreased in 2009 but rebounded in 2010 and has remained high since then relative to historical levels, according to data compiled by Baker Hughes Incorporated. This has remained the case despite a dramatic decrease in the price of natural gas over the same period, suggesting a weakening in the traditional correlation between natural gas prices and U.S. onshore drilling rig counts. We believe this decrease in correlation is attributable to several factors, including the discovery of potentially large oil and liquids-rich unconventional plays onshore in the U.S., the increasing presence in U.S. onshore plays of major U.S. and international integrated E&P companies that are typically less reactive to short-term price fluctuations than independent E&P companies, the presence of term contracts for certain types of oilfield services, the need by operators to commence drilling activities in order to establish production and avoid the expiration of oil and natural gas leases, and the more regimented approach to developing unconventional plays characterized by continuous hydrocarbon accumulations. Additionally, we believe that the weakening correlation between natural gas prices and U.S. onshore rig counts is partially attributable to the prevalence of joint ventures for the development of U.S. unconventional plays, many of which include a drilling “carry” that is paid by the joint venture partner and used by the operator to pay for a portion of the cost of drilling and completing the well. Chesapeake, for example, has entered into several such joint ventures since 2008 with companies such as Total S.A., CNOOC Limited, Statoil, BP America and Plains Exploration & Production Company that have provided more than $9.0 billion of drilling carries to Chesapeake.
59
Table of Contents
Index to Financial Statements
Source: Baker Hughes Incorporated and Bloomberg.
In response to historically low natural gas prices, a number of E&P companies, including Chesapeake, have announced that they are reducing dry natural gas drilling and production and redirecting their activities and capital toward currently more economic liquids-rich plays. Liquids-rich plays are those that are characterized by production of predominantly oil and natural gas liquids such as ethane, propane, butane and iso-butane, which are used as energy sources and manufacturing feedstocks, and the prices of which have historically been highly correlated with oil prices rather than natural gas prices. As a result, we expect the trend toward liquids-focused drilling to continue. The proportion of rigs in the U.S. drilling for liquids versus natural gas has also increased steadily over the past few years and, in April 2011, for the first time since 1993, the number of rigs drilling for liquids plays surpassed the number of rigs drilling for natural gas.
Source: Baker Hughes Incorporated
60
Table of Contents
Index to Financial Statements
Trends that we believe are affecting, and will continue to affect, our industry include:
Drilling and developing unconventional U.S. hydrocarbon resources. Due to the maturity of conventional U.S. oil and natural gas reservoirs, the relative abundance of undeveloped unconventional resources and the cost advantage of developing unconventional resources, an increasing proportion of U.S. oil and natural gas production is coming from unconventional resources, which include shale formations. Since the beginning of 2008, producers have spent substantial amounts acquiring properties in unconventional resource plays in the U.S., including approximately $20.0 billion spent by Chesapeake, as advances in horizontal drilling and completion technologies have made the development of many unconventional resources economically attractive.
Horizontal wells are typically drilled in these unconventional formations and tend to involve a higher degree of service intensity associated with their initial drilling and completion, and we believe that these wells will also ultimately require a high degree of service intensity over their lifetime. The U.S. horizontal and directional rig count has risen from 705 (or 42% of the total) at the beginning of 2007 to 1,413 (or 71% of the total) for the week ending March 30, 2012, according to Baker Hughes Incorporated. In addition to an increase in the number of horizontal wells drilled in the U.S., the length of well laterals has increased and the intervals between fracturing stages have decreased over the past several years. The longer laterals and increasing number of fracturing stages have enhanced recoveries and lowered field development costs while causing the number of fracturing stages to grow at a faster rate than the horizontal rig count, creating an increased demand for completion related services.
Increased drilling in liquids-rich formations. There is increasing horizontal drilling- and completion-related activity in liquids-rich formations such as the Eagle Ford, Utica, Bakken and Niobrara Shales and various other unconventional liquids-rich plays in Texas and Oklahoma, including the Wolfcamp, Bone Spring, Granite Wash, Cleveland and Tonkawa sands and the Mississippi Lime. In January 2012, Chesapeake announced its plan to curtail its dry gas drilling and production activities and redirect capital to its liquids-rich plays. We believe that the oil and natural gas liquids content in these plays significantly enhances the returns for Chesapeake and its partners relative to opportunities in dry gas basins due to the significant disparity between oil and natural gas prices on a British thermal unit (btu) basis. Furthermore, we believe that oil and natural gas liquids prices tend to exhibit less volatility than natural gas prices due to the global nature of the crude oil market and the more localized market for natural gas. We believe that the higher price of liquids relative to natural gas, as well as liquids’ reduced pricing volatility will continue over the near- to medium-term, resulting in increasing demand for services in liquids-rich basins and a reduction in the variability of demand for oilfield services generally.
High asset utilization and tight labor and equipment market. Many of the unconventional reservoirs in the U.S. are deep, high-pressure and challenging environments, factors that increase the demand for skilled workers and high-quality oilfield services. Equipment manufacturers have had difficulty meeting the demand for services equipment, resulting in high asset utilization levels across the industry. In addition, demand for skilled workers is high and the supply is limited. We believe these trends will continue to keep supply tight in our industry for the foreseeable future.
Complex technologies, techniques and equipment. The development of unconventional oil and natural gas resources is driving the need for complex new technologies, completion techniques and equipment designed to increase recovery rates, lower production costs and accelerate field development. These needs have spurred the development of more technologically advanced, higher-margin oilfield services that are required to economically produce oil and natural gas from unconventional resources. In addition to rigs with adequate horsepower and top drives, in many cases directional drilling systems are necessary to enable the operator to steer the drill bit into the appropriate section of the reservoir, and advanced technologies, such as the latest hydraulic fracturing, proppant and fluids technologies, are needed for completion of the wells.
61
Table of Contents
Index to Financial Statements
Constrained supply of hydraulic fracturing sand. The sand used as a proppant in hydraulic fracturing operations must meet certain size and other specifications in order to be suitable for hydraulic fracturing purposes. Securing access to hydraulic fracturing sand that conforms to the specifications established by the American Petroleum Institute is increasingly important to suppliers and customers of hydraulic fracturing services. Rising unconventional production in the U.S. will continue to support demand for hydraulic fracturing sand, which is used extensively in domestic unconventional basins. The hydraulic fracturing sand market is driven by the overall demand for oil and natural gas production and, in particular, horizontal drilling of oil and natural gas wells. Accordingly, the demand for hydraulic fracturing sand has grown significantly, paralleling the heightened development activity in unconventional reservoirs. We believe the industry is currently experiencing both high demand and limited supply of hydraulic fracturing sand. As we continue to grow our hydraulic fracturing business, we plan to mitigate this risk by vertically integrating our operations through the integration of sand reserves, sand processing operations and logistics assets such as storage and transload, railcar, trucking and other assets.
How We Generate Our Revenues
We derive substantially all our revenues from the performance of oilfield services for Chesapeake. Chesapeake, as operator of most of the wells that we service, engages us and pays our fees. To the extent that Chesapeake shares the costs of our services with its partners, it seeks separate reimbursement of such shared costs through a joint interest billing. In addition, we perform a small amount of work for other E&P companies. We are a party to a master services agreement with Chesapeake, pursuant to which we provide drilling and other services and supply materials and equipment to Chesapeake. The master services agreement contains general terms and provisions, specifies payment terms, audit rights and insurance requirements and allocates certain operational risks through indemnity and similar provisions. The specific terms of each drilling services request are typically provided pursuant to modified International Association of Drilling Contractors (IADC) drilling contracts on a well-by-well basis. The specific terms of each request for other services are typically set forth in a field ticket or purchase or work order. We generally do not have fixed pricing agreements with Chesapeake and the rates for the services and products we provide are market-based. A brief description of the ways in which we are compensated for the services and products we provide appears below.
Drilling Segment. Currently, all of our drilling contracts are daywork contracts. A daywork contract generally provides for a basic rate per day when drilling (the dayrate for our providing a rig and crew) and for lower rates when the rig is moving, or when drilling operations are interrupted or restricted by equipment breakdowns, adverse weather conditions or other conditions beyond our control. In addition, daywork contracts may provide for a lump-sum fee for the mobilization and demobilization of the rig, which in most cases approximates our incurred costs. Drilling services can also be provided pursuant to a footage contract in which the drilling contractor is paid on the basis of a rate per foot drilled and a turnkey contract in which the drilling contractor is paid for drilling a well to a specified depth for a fixed price. We expect that all of our future contracts with Chesapeake and third parties will be daywork contracts. Under our services agreement with Chesapeake, Chesapeake has guaranteed that it will operate, on a daywork basis at market-based rates, the lesser of 75 of our drilling rigs or 80% of our operational drilling rig fleet, each referred to as a “committed rig,” subject to reduction for each of our drilling rigs that is operated by a third-party customer. In the event Chesapeake does not meet the drilling commitment, it will be required to pay us a non-utilization fee. For each day that a committed rig is not operated, Chesapeake must pay us our average daily operating cost for our operating drilling rigs for the preceding 30 days, plus 20%, and in no event less than $6,600 per day.
62
Table of Contents
Index to Financial Statements
Hydraulic Fracturing Segment. We are generally compensated based on the number of fracturing stages we complete, and we recognize revenue upon the completion of each fracturing stage. We typically complete one or more fracturing stages per day during the course of a job. A stage is considered complete when the customer requests that pumping discontinue for that stage. Invoices typically include a lump sum equipment charge determined by the rate per stage that each contract specifies and product charges for sand, chemicals and other products actually consumed during the course of providing our services. Under our services agreement with Chesapeake, Chesapeake has guaranteed that each month it will utilize a number of our operational hydraulic fracturing fleets, up to a maximum of 13 fleets, to complete a minimum aggregate number of fracturing stages equal to 25 stages per month at market-based rates times the average number of our operational hydraulic fracturing fleets during such month, each referred to as a “committed stage,” subject to reduction for each stage that we perform for a third-party customer during such month. In the event Chesapeake does not meet the stage commitment, it will be required to pay us a non-utilization fee equal to $40,000 for each committed stage not performed.
Oilfield Rentals Segment. We rent many types of oilfield equipment to Chesapeake and third parties, including drill pipe, drill collars, tubing, blowout preventers, frac and mud tanks and also provide air drilling services and services associated with the transfer of fresh water to the well site. We price our rentals and services based on the type of equipment being rented and the service job being performed. Substantially all rental revenue we earn is based upon a charge for the actual period of time the rental is provided to our customer on a market-based fixed per-day or per-hour fee.
Oilfield Trucking Segment. We derive substantially all of our oilfield trucking revenues from rig relocation and logistics services and fluid hauling services. The fees we charge are determined by applying a base rate, which varies depending on the service provided, for the amount of time it took to perform the service.
Other Operations. We derive substantially all of the revenues from our other operations from our sale to Chesapeake of natural gas compression units, accessories and equipment produced by our manufacturing subsidiary. Substantially all of the revenue that we earn from the sale of compression units is based on the particular specifications of the compression units purchased by Chesapeake.
The Costs of Conducting Our Business
The principal expenses involved in conducting our business are labor costs, the costs of maintaining and repairing our equipment, rig lease expenses and product and material costs. We also plan to make expenditures for equipment acquisitions and are required to make expenditures to service our debt.
Direct labor costs represented approximately 35%, 35% and 37% of our revenues in 2011, 2010 and 2009, respectively. The decrease in direct labor costs, as a percentage of revenue, was primarily due to higher utilization of our revenue generating assets, resulting in fixed costs being spread over a higher revenue base.
Repair and maintenance costs are expensed as incurred. These costs represented approximately 10%,10% and 13% of our revenues in 2011, 2010 and 2009, respectively. The decrease in repair and maintenance costs, as a percentage of revenue, was due to the addition of new equipment with lower maintenance requirements.
In a series of transactions since 2006, our predecessor sold a number of drilling rigs and related equipment and entered into a master lease agreement under which it agreed to lease the rigs from the buyer for initial terms of five to ten years. In October 2011, the drilling rig leases were transferred to
63
Table of Contents
Index to Financial Statements
Chesapeake Equipment Finance, L.L.C. (“CEF”), a wholly owned subsidiary of Chesapeake, and were then subleased to us on terms consistent with those in the original leases. As of December 31, 2011, we leased 93 rigs under these arrangements. The rig leases and subleases contain provisions that permit CEF and us to acquire the related rig from the lessor, in some cases at any time we request and in some cases at the end of the term of the lease. Additionally, certain of the leases permit us to extend the lease term at the end of the existing term of the lease. We anticipate that we will generally seek to acquire these leased rigs when we believe it is advantageous and we have access to sufficient capital for us to do so, and we have budgeted $217.5 million in 2013 for this purpose, which amounts are in addition to our budget for growth capital expenditures. For more information regarding the terms of the sale-leaseback transactions and our sublease with CEF, please see “—Contractual Commitments and Obligations,” “Certain Relationships and Related Party Transactions—Drilling Rig Sale-Leaseback Transactions” and Note 6 “Commitments and Contingencies” to our audited combined financial statements.
We have agreements with Chesapeake pursuant to which Chesapeake allocates certain expenses to us. Under our administrative services agreement with Chesapeake, in return for the general and administrative services provided by Chesapeake, we reimburse Chesapeake on a monthly basis for the overhead expenses incurred by Chesapeake on our behalf in accordance with its current allocation policy, which includes actual out-of-pocket fees, costs and expenses incurred in connection with the provision of any of the services under the agreement, including the wages and benefits of Chesapeake employees who perform services on our behalf. Under our facilities lease agreement with Chesapeake, in return for the use of certain yards and other physical facilities out of which we conduct our operations, we pay rent and our proportionate share of maintenance, operating expenses, taxes and insurance to Chesapeake on a monthly basis. See “Certain Relationships and Related Party Transactions.”
How We Evaluate Our Operations
Our management team uses a variety of tools to monitor and manage our operations in the following five areas: (a) Adjusted EBITDA, (b) asset utilization, (c) equipment maintenance performance, (d) service quality, and (e) safety performance.
Adjusted EBITDA. A key financial and operating measurement that our management uses to analyze and monitor the operating performance of our business is Adjusted EBITDA, which consists of net income before interest, income taxes, depreciation and amortization, as further adjusted to add back gain or loss on sale of property and equipment and impairments. For additional information about this measure and a reconciliation of our Adjusted EBITDA to our net income, the most directly comparable GAAP financial measure, see footnote 1 to the table in “Prospectus Summary—Summary Historical Financial Data.” The table below shows our Adjusted EBITDA for 2009, 2010 and 2011. Adjusted EBITDA includes $94.1, $94.8 and $105.6 of operating lease expenses associated with our lease of drilling rigs for 2009, 2010 and 2011, respectively. Management considers a majority of these expenses to be financing costs because the underlying sale-leaseback transactions are a form of financing.
| Year Ended December 31, | ||||||||||||
| 2009 | 2010 | 2011 | ||||||||||
| (Unaudited) | ||||||||||||
| Adjusted EBITDA |
$ | 76,089 | $ | 121,488 | $ | 276,926 | ||||||
Asset utilization. We believe that our relationship with Chesapeake will allow us to maintain industry-leading asset utilization through industry cycles. We measure our activity levels by the total number of jobs completed by each of our drilling rigs and hydraulic fracturing fleets on a monthly basis. By consistently monitoring the activity level, pricing and relative performance of each of our rigs and fleets, we can more efficiently allocate our personnel and equipment to maximize revenue generation. During the year ended December 31, 2011, the utilization of our drilling rig fleet was 98%. The
64
Table of Contents
Index to Financial Statements
utilization rates of our other assets are directly correlated with our rig utilization rates because the well drilling performed by our rigs creates demand for most of the other services we provide.
Equipment maintenance performance. Although our assets across all of our operating segments are modern and well maintained, preventative maintenance on our equipment remains an important factor in our profitability. If our equipment is not maintained properly, our repair costs may increase and, during periods of high activity, our ability to operate efficiently could be significantly diminished due to having trucks and other equipment out of service. Our maintenance crews perform regular inspections and preventative maintenance on our drilling rigs, hydraulic fracturing fleets, rental equipment, trucks and other mechanical equipment. Our management monitors the performance of our maintenance crews at each of our service locations by reviewing ongoing inspection and maintenance activity and monitoring the level of maintenance expenses as a percentage of revenue. A rising level of maintenance expenses as a percentage of revenue at a particular service location can be an early indication that our preventative maintenance schedule is not being followed. In this situation, management can take corrective measures to help reduce maintenance expenses as well as ensure that maintenance issues do not interfere with operations. Our repair and maintenance costs represented approximately 10% of our revenues for the year ended December 31, 2011.
Service quality. Our unique relationship with Chesapeake creates operational efficiencies that our competitors cannot replicate. We have access to the budgets and forecasts prepared by Chesapeake and we maintain close communications with Chesapeake regarding its service needs, which together allows us to provide timely, tailored, “just-in-time” service to Chesapeake. Chesapeake evaluates our performance under various criteria and comments on its overall satisfaction level with our equipment, personnel and services. This feedback gives our management valuable information from which to identify performance issues and trends. Our management also uses this information to evaluate our position relative to our competitors in the various markets in which we operate.
Safety performance. Maintaining a strong safety record is a critical component of our operational success. Our relationship with Chesapeake provides us with enhanced utilization across industry cycles, which in turn reduces employee turnover, increases safety and drives superior results. In addition, the continuity of working relationships between our employees and Chesapeake provides for greater communication and data sharing at our drill sites, which we believe results in safer working conditions for employees. We maintain a safety database that our management uses to identify negative trends in operational incidents so that appropriate measures can be taken to maintain and enhance our safety standards.
Strategic Transactions
Our business has grown organically and through acquisitions. On November 18, 2011, we acquired Horizon Oilfield Services (“Horizon”) for $17.5 million. Included in this acquisition were 38 well site trailers and associated equipment, training and development programs and certain other intellectual property, and approximately 185 experienced employees.
On June 6, 2011, we acquired Bronco Drilling Company, Inc. (“Bronco”) for $339.2 million, adding 22 drilling rigs to our rig count.
On December 15, 2010, we acquired all of the membership interests in Forrest Rig Company, L.L.C. and Forrest Top Drive, L.L.C. (collectively, “Forrest”) for $84.5 million. Included in this acquisition were seven drilling rigs and related equipment.
65
Table of Contents
Index to Financial Statements
Results of Operations
Years Ended December 31, 2011, 2010 and 2009
The following table sets forth our consolidated statements of operations for the years ended December 31, 2011, 2010 and 2009.
| Years Ended December 31, | ||||||||||||
| 2011 | 2010 | 2009 | ||||||||||
| ($ in thousands) | ||||||||||||
| Revenues, Including Revenue From Affiliates |
$ | 1,303,496 | $ | 815,756 | $ | 650,279 | ||||||
| Operating Expenses: |
||||||||||||
| Operating costs |
987,032 | 666,924 | 556,008 | |||||||||
| Depreciation and amortization |
171,908 | 106,425 | 70,429 | |||||||||
| General and administrative, including expenses from affiliates |
37,074 | 25,312 | 17,735 | |||||||||
| Gains on sales of property and equipment |
(3,571 | ) | (854 | ) | (1,551 | ) | ||||||
| Impairments |
2,729 | 9 | 26,797 | |||||||||
|
|
|
|
|
|
|
|||||||
| Total Operating Expenses |
1,195,172 | 797,816 | 669,418 | |||||||||
|
|
|
|
|
|
|
|||||||
| Operating Income (Loss) |
108,324 | 17,940 | (19,139 | ) | ||||||||
|
|
|
|
|
|
|
|||||||
| Other Income (Expense): |
||||||||||||
| Interest including expenses from affiliates |
(65,072 | ) | (38,511 | ) | (23,453 | ) | ||||||
| Losses from equity investee |
— | (2,243 | ) | (164 | ) | |||||||
| Other income (expense) |
(2,464 | ) | 211 | (283 | ) | |||||||
|
|
|
|
|
|
|
|||||||
| Total Other Income (Expense) |
(67,536 | ) | (40,543 | ) | (23,900 | ) | ||||||
|
|
|
|
|
|
|
|||||||
| Income (Loss) Before Income Taxes |
40,788 | (22,603 | ) | (43,039 | ) | |||||||
| Income Tax Expense (Benefit) |
21,030 | (3,751 | ) | (2,656 | ) | |||||||
|
|
|
|
|
|
|
|||||||
| Net Income (Loss) |
19,758 | (18,852 | ) | (40,383 | ) | |||||||
|
|
|
|
|
|
|
|||||||
| Less: Net (Loss) Attributable To Noncontrolling Interest |
(154 | ) | (639 | ) | — | |||||||
|
|
|
|
|
|
|
|||||||
| Net Income (Loss) Attributable To COS Holdings, L.L.C. |
$ | 19,912 | $ | (18,213 | ) | $ | (40,383 | ) | ||||
|
|
|
|
|
|
|
|||||||
General. For the years ended December 31, 2011, 2010 and 2009, we had net income (loss) of $19.8 million, ($18.9) million and ($40.4) million, respectively. The increase in net income was primarily due to the growth of revenue generating assets and an increase in drilling activity by Chesapeake, while at the same time increasing operating margins. The increase in operating margins was due to the growth of higher margin product and service offerings and increased pricing.
Revenues. For the years ended December 31, 2011, 2010 and 2009, we had revenues of $1.303 billion, $815.8 million and $650.3 million, respectively. The increase in revenues from 2010 to 2011 and 2009 to 2010 was due to an increase in our revenue generating assets and increased drilling activity in oil and liquids-rich plays by Chesapeake. Substantially all of our revenues are derived from affiliates.
Our revenues, income (loss) before income taxes and assets are primarily attributable to our four reportable business segments. Each of these segments represents a distinct type of business. These segments have separate management teams that report to our chief operating decision maker. The results of operations in these segments are regularly reviewed by the chief operating decision makers for purposes of determining resource allocation and assessing performance. The following is a description of our segments, as well as our other operations.
Our drilling segment provides premium land drilling and drilling-related services, including directional drilling, geosteering and mudlogging, for oil and natural gas exploration and development activities. As of March 31, 2012, we operated a fleet of 111 land drilling rigs.
66
Table of Contents
Index to Financial Statements
Our hydraulic fracturing segment provides hydraulic fracturing services. Hydraulic fracturing involves pumping fluid down a well casing or tubing under high pressure to cause the underground formation to crack, allowing the oil or natural gas to flow more freely. As of March 31, 2012, we owned four hydraulic fracturing fleets with an aggregate of 140,000 horsepower.
Our oilfield rentals segment provides premium rental tools for land oil and natural gas drilling and workover activities. We offer a number of products and services, including drill pipe, drill collars, tubing, high and low pressure blowout preventers, frac and mud tanks and also provide air drilling services and services associated with the transfer of fresh water to the well site.
Our oilfield trucking segment provides rig relocation and logistics services as well as fluid hauling services. As of March 31, 2012, we owned a fleet of 227 rig relocation trucks, 57 cranes and forklifts used in the movement of drilling rigs and 157 fluid hauling trucks.
Our other operations reportable segment primarily consists of our natural gas compressor manufacturing operations.
Our segment revenues for the years ended December 31, 2011, 2010 and 2009 are detailed below:
| Years Ended December 31, | ||||||||||||
| 2011 | 2010 | 2009 | ||||||||||
| ($ in thousands) | ||||||||||||
| Drilling |
$ | 854,768 | $ | 572,325 | $ | 511,427 | ||||||
| Hydraulic Fracturing |
13,005 | — | — | |||||||||
| Oilfield rentals |
245,666 | 121,411 | 55,764 | |||||||||
| Oilfield trucking |
127,042 | 74,281 | 40,986 | |||||||||
| Other operations |
63,015 | 47,739 | 42,102 | |||||||||
|
|
|
|
|
|
|
|||||||
| Total |
$ | 1,303,496 | $ | 815,756 | $ | 650,279 | ||||||
|
|
|
|
|
|
|
|||||||
| Ÿ | Drilling. Drilling revenues for the year ended December 31, 2011, increased $282.5 million, or 49%, to $854.8 million from $572.3 million for the year ended December 31, 2010. This increase was primarily due to a 17% increase in average day rates in 2011. We also experienced an increase in our average number of operating rigs from 83 to 104 for the years ended December 31, 2010 and 2011, respectively, due primarily to the Bronco acquisition. Our utilization rate increased from 97% to 98% for the years ended December 31, 2010 and 2011, respectively. |
Drilling revenues for the year ended December 31, 2010, increased $60.9 million, or 12%, to $572.3 million from $511.4 million for the year ended December 31, 2009. This increase was primarily due to an 8% increase in average day rates in 2010. We also experienced an increase in our average number of operating rigs from 79 to 83 for the years ended December 31, 2009 and 2010, respectively. Our utilization rate increased from 95% to 97% for the years ended December 31, 2009 and 2010, respectively.
| Ÿ | Hydraulic Fracturing. Hydraulic fracturing revenues for the year ended December 31, 2011 were $13.0 million. In 2010, Chesapeake began the process of establishing a hydraulic fracturing business. We had one hydraulic fracturing fleet with an aggregate of 30,000 horsepower become operational in October 2011. Our second hydraulic fracturing fleet became operational in January 2012, and we anticipate having 12 fleets with an aggregate of approximately 450,000 horsepower by the end of 2013. |
67
Table of Contents
Index to Financial Statements
| Ÿ | Oilfield Rentals. Oilfield rental revenues for the year ended December 31, 2011 increased $124.3 million, or 102%, to $245.7 million from $121.4 million for the year ended December 31, 2010. Oilfield rentals revenue for the year ended December 31, 2010 increased $65.6 million, or 118%, to $121.4 million from $55.8 million for the year ended December 31, 2009. These increases are primarily due to an increase in our revenue generating assets. We also experienced increased utilization due to an increase in drilling activity by Chesapeake and third parties. The utilization of our oilfield rental equipment has historically coincided with fluctuations in our drilling activity. |
| Ÿ | Oilfield Trucking. Oilfield trucking revenues for the year ended December 31, 2011 increased $52.7 million, or 71%, to $127.0 million from $74.3 million for the year ended December 31, 2010. The increase in revenue from 2010 to 2011 is due to an increase in the utilization and size of our trucking fleet, with the increase in utilization being attributable to the increase in drilling activity by Chesapeake. Oilfield trucking revenue for the year ended December 31, 2010 increased $33.3 million, or 81%, to $74.3 million from $41.0 million for the year ended December 31, 2009. This increase in revenue from 2009 to 2010 is primarily due to increased utilization resulting from an increase in drilling activity by Chesapeake. |
| Ÿ | Other Operations. Our other operations consist primarily of our compression unit manufacturing business. For the year ended December 31, 2011, revenues from our other operations increased $15.3 million, or 32%, to $63.0 million from $47.7 million for the year ended December 31, 2010. For the year ended December 31, 2010, revenues from our other operations increased $5.6 million, or 13%, to $47.7 million from $42.1 million for the year ended December 31, 2009. These increases are primarily due to an increase in our overall compression unit manufacturing capacity and increased demand by Chesapeake. |
Operating Costs. Operating costs for the years ended December 31, 2011, 2010 and 2009 were $987.0 million, $666.9 million and $556.0 million, respectively. The increase in operating costs is due to an increase in drilling activity in liquids-rich plays by Chesapeake, which resulted in higher labor, rental, repairs and maintenance, supplies and other operating costs. As a percentage of revenues, operating costs were 76%, 82% and 86% for the years ended December 31, 2011, 2010 and 2009, respectively. The decrease in operating costs as a percentage of revenues is primarily attributable to higher utilization and rates charged for our revenue generating assets resulting in fixed costs being spread over a higher revenue base. Our segment operating costs for the years ended December 31, 2011, 2010 and 2009 are detailed below:
| Years Ended December 31, | ||||||||||||
| 2011 | 2010 | 2009 | ||||||||||
| ($ in thousands) | ||||||||||||
| Drilling |
$ | 685,563 | $ | 482,808 | $ | 435,789 | ||||||
| Hydraulic fracturing |
21,787 | — | — | |||||||||
| Oilfield rentals |
115,286 | 78,631 | 38,439 | |||||||||
| Oilfield trucking |
109,098 | 60,621 | 41,750 | |||||||||
| Other operations |
55,298 | 44,864 | 40,030 | |||||||||
|
|
|
|
|
|
|
|||||||
| Total |
$ | 987,032 | $ | 666,924 | $ | 556,008 | ||||||
|
|
|
|
|
|
|
|||||||
| Ÿ | Drilling. Drilling operating costs for the year ended December 31, 2011, increased $202.8 million, or 42%, to $685.6 million from $482.8 million for the year ended December 31, 2010. This increase was primarily due to an increase in our average number of operating rigs from 83 to 104 for the years ended December 31, 2010 and 2011, respectively. The increase in our average number of operating rigs is primarily due to the Bronco acquisition. The increase in our average number of operating rigs resulted in higher labor costs, repairs and maintenance and other operating costs. We also experienced an increase in our utilization rate from 97% to 98% for the years ended December 31, 2010 and 2011, respectively. As a percentage of |
68
Table of Contents
Index to Financial Statements
| drilling revenues, drilling operating costs decreased from 84% to 80% for the years ended December 31, 2010 and 2011, respectively. This decrease is primarily attributable to rig rental expense related to leased rigs decreasing as a percentage of revenue which is the result of the Bronco acquisition and our owning a higher percentage of our operating rigs. |
Drilling operating costs for the year ended December 31, 2010, increased $47.0 million, or 11%, to $482.8 million from $435.8 million for the year ended December 31, 2009. This increase was primarily due to an increase in our average number of operating rigs and higher utilization. Our average number of operating rigs increased from 79 to 83 for the years ended December 31, 2009 and 2010, respectively. The increase in our average number of operating rigs resulted in higher labor costs and other operating costs. Our utilization rate increased from 95% to 97% for the years ended December 31, 2009 and 2010, respectively, as we experienced an increase in demand for our drilling services. As a percentage of drilling revenues, drilling operating costs decreased from 85% to 84% for the years ended December 31, 2009 and 2010.
| Ÿ | Hydraulic Fracturing. Hydraulic fracturing operating costs for the year ended December 31, 2011 were $21.8 million. As a percentage of hydraulic fracturing revenue, operating costs were 168% for the year ended December 31, 2011 due primarily to labor costs incurred prior to our hydraulic fracturing fleets becoming operational. |
| Ÿ | Oilfield Rentals. Oilfield rental operating costs for the year ended December 31, 2011 increased $36.7 million, or 47%, to $115.3 million from $78.6 million for the year ended December 31, 2010 due to an increase in drilling activity. Oilfield rental operating costs for the year ended December 31, 2010 increased $40.2 million, or 105%, to $78.6 million from $38.4 million for the year ended December 31, 2009. These year over year increases were primarily due to an increase in drilling activity which resulted in higher labor, supplies, repairs and maintenance, freight and third-party expenses. As a percentage of oilfield rental revenues, oilfield rental operating costs were 47%, 65% and 69% for the years ended December 31, 2011, 2010 and 2009, respectively. The reductions in operating costs as a percentage of revenues is primarily attributable to higher utilization of our rental tools resulting in the allocation of fixed costs over a larger revenue base. |
| Ÿ | Oilfield Trucking. Oilfield trucking operating costs for the year ended December 31, 2011 increased $48.5 million, or 80%, to $109.1 million from $60.6 million for the year ended December 31, 2010. Oilfield trucking operating costs for the year ended December 31, 2010 increased $18.8 million, or 45%, to $60.6 million from $41.8 million for the year ended December 31, 2009. These increases are primarily due to an increase in drilling activity, which resulted in higher labor, fuel and repairs and maintenance expense. As a percentage of oilfield trucking revenue, oilfield trucking operating costs were 86%, 82% and 102% for the years ended December 31, 2011, 2010 and 2009, respectively. The increase in oilfield trucking operating costs as a percentage of oilfield trucking revenues from 2010 to 2011 is primarily attributable to our utilizing third parties for longer rig moves, which compressed our margins. The reduction in oilfield trucking operating costs as a percentage of oilfield trucking revenues from 2009 to 2010 is primarily attributable to higher utilization of our trucking fleet resulting in fixed labor costs being spread over a larger revenue base. |
| Ÿ | Other Operations. Our other operations consist primarily of our compression unit manufacturing business. For the year ended December 31, 2011, operating costs for our other operations increased $10.4 million, or 23%, to $55.3 million from $44.9 million for the year ended December 31, 2010. For the year ended December 31, 2010, operating costs for our other operations increased $4.9 million, or 12%, to $44.9 million from $40.0 million for the year ended December 31, 2009. These increases are primarily due to an increase in our overall compression unit manufacturing capacity and increased demand by Chesapeake, which resulted in higher costs of goods sold. |
69
Table of Contents
Index to Financial Statements
Depreciation and Amortization. Depreciation and amortization for the years ended December 31, 2011, 2010 and 2009 was $171.9 million, $106.4 million and $70.4 million, respectively. The increases reflect the overall increase in the size of and investment in our asset base as the result of capital expenditures.
General and Administrative Expenses. General and administrative expenses for the years ended December 31, 2011, 2010 and 2009 were $37.1 million, $25.3 million and $17.7 million, respectively. The increase is due to additional charges from Chesapeake for indirect corporate overhead to cover costs of functions such as legal, accounting, treasury, environmental safety, information technology and other corporate services related to our overall increase in operating activity.
Gains on Sales of Property and Equipment. We recorded a net gain on the sales of property and equipment of $3.6 million, $0.9 million and $1.6 million during the year ended December 31, 2011, 2010 and 2009, respectively.
Impairments. Management determined in the fourth quarter of 2011 to sell certain drill pipe used in our oilfield rentals business. Because the assets met the held-for-sale criteria, we are required to present such assets at the lower of carrying amount or fair value less the anticipated costs to sell. We evaluated these assets for impairment as of December 31, 2011, which resulted in us recognizing a $2.6 million impairment charge. Our fair value estimate was derived from bids received from interested parties. After the impairment charge, the assets had a carrying value of $1.4 million at December 31, 2011 and are included in assets held for sale in our consolidated balance sheets.
There was a significant adverse change in the economic and business climate as financial markets reacted to the credit crisis facing major lending institutions and worsening conditions in the overall economy throughout 2009. During the same time, there were significant declines in oil and natural gas prices which led to declines in service revenues, margins and cash flows. We considered the impact of these significant adverse changes in the economic and business climate as we performed our annual impairment assessment of goodwill in 2009. The estimated fair value of our oilfield trucking segment was negatively impacted by significant reductions in estimated cash flows, and we concluded that there would be no remaining implied fair value attributable to this goodwill. Accordingly, we recorded a non-cash impairment charge of $19.8 million in our operating results for the year ended December 31, 2009.
Our wholly owned subsidiary, Nomac, entered into an equipment purchase agreement with LeTourneau Technologies Drilling Systems, Inc. (“LTDSI”) in June 2008 to purchase nine drilling rigs and related equipment for $90.2 million. We made down payments totaling $22.5 million during 2008 in accordance with the agreement. LTDSI filed suit against Nomac in December 2008 related to a dispute involving the equipment purchase agreement. In 2009, the equipment purchase agreement was terminated and LTDSI agreed to deliver certain rig equipment with an estimated fair value of $15.5 million in exchange for retaining the down payment made by Nomac. We recorded an impairment of long-lived assets in the amount of $7.0 million for the year ended December 31, 2009, equal to the down payments less the fair value of the equipment received.
Interest Expense. Interest expense for the years ended December 31, 2011, 2010 and 2009 was $65.1 million, $38.5 million and $23.5 million, respectively. The increase is due in part to an increase in our average long-term debt of $841.9 million, $564.8 million and $359.0 million for the years ended December 31, 2011, 2010 and 2009, respectively. We entered into our revolving bank credit facility and issued our 2019 Senior Notes during the fourth quarter of 2011. Interest is capitalized on the average amount of accumulated expenditures for significant capital projects under construction using the effective interest rate of our debt until the underlying assets are placed into service. The capitalized interest is added to the cost of the assets and amortized to depreciation expense over the
70
Table of Contents
Index to Financial Statements
useful life of the assets. For the years ended December 31, 2011, 2010 and 2009, we capitalized interest of approximately $0.9 million, $0.6 million and $2.8 million, respectively.
Losses from Equity Investee. Losses from equity investees were $0.0, $2.2 million and $0.2 million for the years ended December 31, 2011, 2010 and 2009, respectively.
Other Income (Expense). Other income (expense) was ($2.5) million, $0.2 million and ($0.3) million in for the years ended December 31, 2011, 2010 and 2009.
Income Tax Expense (Benefit). We recorded income tax expense (benefit) of $21.0 million, ($3.8) million and ($2.7) million for the years ended December 31, 2011, 2010 and 2009, respectively. The $24.8 million increase in income tax expense recorded for the year ended December 31, 2011 was primarily the result of an increase in net income before income taxes of $63.4 million from the year ended December 31, 2010. The $1.1 million increase in income tax benefit recorded for the year ended December 31, 2010 was primarily the result of a decrease in unfavorable permanent differences, partially offset by a decrease in net loss before income taxes of $20.4 million from the year ended December 31, 2009.
Liquidity and Capital Resources
We require capital to fund ongoing operations, including operating expenses, organic growth initiatives, investments, acquisitions and debt service. Additionally, we plan to make significant capital expenditures on equipment during the next two years. Historically, Chesapeake has provided regular capital infusions to help fund our business activities. We anticipate that our future capital needs will be provided for by cash flows from operations, borrowings under our revolving bank credit facility, access to capital markets and other financing transactions. If these sources of capital are not available or are not available on an economic basis, we would be required to reduce our expenditures, which would likely cause us not to meet our growth objectives or could otherwise adversely affect us.
Our $500.0 million senior secured revolving bank credit facility is an important source of liquidity for us. The maximum amount that we may borrow under the facility may be subject to limitation due to the operation of the covenants contained in the facility. The revolving credit facility allows us to request increases in the total commitments under the facility by up to $400.0 million in the aggregate in part or in full anytime during the term of the revolving credit facility, with any such increases being subject to compliance with the restrictive covenants in the revolving bank credit facility and in the indenture governing our 2019 Senior Notes, as well as lender approval. The revolving bank credit facility matures on November 3, 2016. For a more complete description of our revolving bank credit facility, please read “Description of Certain Indebtedness—Revolving Bank Credit Facility.”
Capital Expenditures
Capital expenditures (including acquisitions) were $738.4 million, $269.8 million and $325.9 million for the years ended December 31, 2011, 2010 and 2009, respectively.
We currently expect our growth capital expenditures to be between $1.1 billion and $1.2 billion over the next two years, and we expect to make these expenditures to grow our business lines, particularly our fleets and rental tool inventory. Additionally, we have budgeted $217.5 million in 2013 to acquire certain of our leased drilling rigs, which we plan to do when we believe it is advantageous and we have access to sufficient capital for us to do so. We may increase, decrease or re-allocate our anticipated capital expenditures during any period based on industry conditions, the availability of attractive capital or other factors, and we believe that a significant component of our anticipated capital spending is discretionary.
71
Table of Contents
Index to Financial Statements
Cash Flows
Our cash flows depend, to a large degree, on the level of spending by Chesapeake for exploration, development and production activities. Sustained increases or decreases in the price of oil or natural gas could have a material impact on these activities, thus materially affecting our cash flows. The following is a discussion of our cash flows for the years ended December 31, 2011, 2010 and 2009.
The table below summarizes our cash flows for the years ended December 31, 2011, 2010 and 2009.
| Years Ended December 31, | ||||||||||||
| 2011 | 2010 | 2009 | ||||||||||
| (In thousands) | ||||||||||||
| Cash flow provided by operating activities |
$ | 211,086 | $ | 91,284 | $ | 25,720 | ||||||
| Cash flow (used in) investing activities |
$ | (644,109 | ) | $ | (223,331 | ) | $ | (322,910 | ) | |||
| Cash flow provided by financing activities |
$ | 435,013 | $ | 132,181 | $ | 297,129 | ||||||
| Cash, beginning of period |
$ | 370 | $ | 236 | $ | 297 | ||||||
| Cash, end of period |
$ | 2,360 | $ | 370 | $ | 236 | ||||||
Operating Activities. Cash provided by operating activities was $211.1 million, $91.3 million and $25.7 million for the years ended December 31, 2011, 2010 and 2009, respectively. Net income (loss) adjusted for non-cash components was approximately $213.4 million, $90.0 million and $56.2 million for the years ended December 31, 2011, 2010 and 2009, respectively. Additionally, changes in working capital items provided (used) were $(2.3) million, $1.3 million and ($30.5) million in cash flows for the years ended December 31, 2011, 2010 and 2009, respectively. Factors affecting changes in operating cash flows are largely the same as those that affect net income, with the exception of non-cash expenses such as depreciation and amortization, amortization of sale-leaseback gains, gains or losses on sales of property and equipment, impairments, stock-based compensation, losses from equity investee and deferred income taxes.
Investing Activities. Cash used in investing activities was $644.1 million, $223.3 million and $322.9 million for the years ended December 31, 2011, 2010 and 2009, respectively. Capital expenditures are the main component of our investing activities. Capital expenditures (including acquisitions) were $738.4 million, $269.8 million and $325.9 million for the years ended December 31, 2011, 2010 and 2009, respectively. See “—Capital Expenditures.”
In November 2011, we acquired Horizon for $17.5 million. In June 2011, we acquired Bronco for $322.5 million, net of $16.7 million of cash acquired, which added 22 operating drilling rigs to our rig count. In addition to the Bronco and Horizon acquisitions in 2011, we spent $395.3 million on drilling rigs and related equipment, rental tools, hydraulic fracturing equipment, rig relocation trucks and other property and equipment.
We had additions to investments of $16.7 million for the year ended December 31, 2011. On October 7, 2011, we acquired 49% of the membership interests in Maalt Specialized Bulk, L.L.C. (“Maalt”) for $12.0 million. Maalt provides bulk transportation, transloading and sand hauling services, and its assets consist primarily of 125 trucks and 122 trailers.
On August 24, 2011, we entered into a joint venture agreement with Big Star Field Services, L.L.C. to form Big Star Crude Co., L.L.C. (“Big Star”), which is engaged in the commercial trucking business. Pursuant to the joint venture agreements, we contributed 85% of the capital requirements of this entity, which was approximately $7.1 million, making our portion approximately $6.1 million. We
72
Table of Contents
Index to Financial Statements
own 49% of the equity in Big Star Crude and will receive a preferred return (85% of cash flow) until a 25% rate of return has been reached at which time the distribution will be based on actual equity ownership.
In December 2010, we acquired Forrest for $35.0 million in cash and issued a note payable for $49.5 million. We acquired seven drilling rigs and related equipment in the transaction. In addition to the Forrest acquisition, in 2010 we spent $233.2 million on drilling rigs and related equipment, rental tools, hydraulic fracturing equipment, rig relocation trucks and other property and equipment.
In 2009, we spent $325.9 million on drilling rigs and related equipment, rental tools, rig relocation trucks and other property and equipment.
Cash used in investing activities was partially offset by proceeds from sales of assets in the amounts of $110.9 million, $46.4 million and $6.0 million for the years ended December 31, 2011, 2010 and 2009, respectively. We sold eight drilling rigs and related equipment during 2011 and three drilling rigs and related equipment during 2010 for proceeds of $96.9 million and $40.4 million, respectively, and entered into master lease agreements under which we agreed to lease the rigs from the buyers for initial terms of five to seven years.
Financing Activities. Net cash provided by financing activities was $435.0 million, $132.2 million and $297.1 million for the years ended December 31, 2011, 2010 and 2009, respectively. On November 3, 2011, we entered into a five-year $500.0 million senior secured revolving bank credit facility. We had borrowings and payments on the revolving credit facility of $168.0 million and $139.0 million during 2011, respectively. On October 28, 2011, we issued $650.0 million principal amount of the 2019 Senior Notes in a private placement. We used the net proceeds of $637.0 million to repay a portion of our affiliate debt with Chesapeake. We incurred $7.2 million in deferred financing costs related to our revolving credit facility and 2019 Senior Notes. For a description of our revolving bank credit facility and our 2019 Senior Notes, please read “Description of Certain Indebtedness.” We made payments on third-party notes payable in the amount of $55.2 million in 2011, primarily related to the Forrest note described above.
We also had decreases in our affiliate debt with Chesapeake during 2011 in the amount of $168.6 million. The capital intensive nature of the oilfield service business has historically required Chesapeake to provide regular capital infusions to fund our activities. Cash provided by financing activities for 2010 and 2009 consists primarily of increases in our affiliate debt.
73
Table of Contents
Index to Financial Statements
Contractual Commitments and Obligations
In the normal course of business, we enter into various contractual obligations that impact, or could impact, our liquidity. The following table summarizes our material obligations at December 31, 2011, with projected cash payments in the years shown:
| Payments Due by Period | ||||||||||||||||||||
| Total | Less Than 1 Year |
1-3 Years | 4 - 5 Years | More Than 5 Years |
||||||||||||||||
| (Unaudited) | ||||||||||||||||||||
| (In thousands) | ||||||||||||||||||||
| Long-Term Debt: |
||||||||||||||||||||
| Affiliate debt(a) |
371,674 | — | — | 371,674 | — | |||||||||||||||
| 6.625% Senior Notes due 2019(b) |
650,000 | — | — | — | 650,000 | |||||||||||||||
| Revolving Bank Credit Facility(b) |
29,000 | — | — | 29,000 | — | |||||||||||||||
| Interest(c) |
346,860 | 45,304 | 86,125 | 86,243 | 129,188 | |||||||||||||||
| Purchase obligations(d) |
280,473 | 255,367 | 25,106 | — | — | |||||||||||||||
| Operating leases(e) |
502,320 | 123,936 | 237,714 | 115,094 | 25,576 | |||||||||||||||
|
|
|
|
|
|
|
|
|
|
|
|||||||||||
| Total |
$ | 2,180,327 | $ | 424,607 | $ | 348,945 | $ | 602,011 | $ | 804,764 | ||||||||||
|
|
|
|
|
|
|
|
|
|
|
|||||||||||
| (a) | Represents a revolving note with Chesapeake, the balance of which is expected to be repaid with proceeds from this offering. |
| (b) | Represents long-term debt obligations of our indirect wholly owned subsidiary, COO. See “Description of Certain Indebtedness.” |
| (c) | Amount primarily includes contractual interest payments on the 2019 Senior Notes. |
| (d) | Consists of nonconditional obligations to purchase equipment. See Note 6 to our Consolidated Financial Statements. |
| (e) | Consists primarily of drilling rig and related equipment leases. Amounts disclosed assume no exercise of options to renew or extend the leases. |
In a series of transactions since 2006, our predecessor sold 93 drilling rigs and related equipment and entered into a master lease agreement under which it agreed to lease the rigs from the buyer for initial terms of five to ten years. In October 2011, the drilling rig leases were transferred to CEF, a wholly owned subsidiary of Chesapeake, and were then subleased to us on terms consistent with those in the original leases. CEF’s lease obligations are guaranteed by Chesapeake and certain of its subsidiaries. Under the rig leases, CEF has the right to exercise the early purchase option provided for in the leases after five and one-half to seven years or on the expiration of the lease term for a purchase price equal to the then fair market value of the rigs. Under certain rig leases, CEF can exercise a purchase option at any time, and pursuant to a drilling rig repurchase agreement, we can require CEF to exercise its purchase option. Additionally, in most cases CEF has the option to renew the rig lease for a negotiated renewal term at a periodic lease payment equal to the fair market rental value of the rigs as determined at the time of renewal. For more information regarding the terms of the sale-leaseback transactions and our sublease with CEF, please see “Certain Relationships and Related Party Transactions—Drilling Rig Sale-Leaseback Transactions” and Note 6 “Commitments and Contingencies” to our audited consolidated financial statements.
On October 1, 2011 we entered into our facilities lease agreement with Chesapeake to lease certain administrative offices and operational facilities in various cities for an initial term of approximately three years. The lease will automatically renew for successive one year terms unless an election is made to terminate by either party. This lease is being treated as an operating lease.
In December 2011, we entered into six lease agreements with various third parties to lease rail cars for initial terms of six months to five years. Additional rental payments are required for the use of rail cars in excess of the allowable mileage stated in the respective agreement. These leases are being treated as operating leases.
74
Table of Contents
Index to Financial Statements
Aggregate undiscounted minimum future lease payments under our noncancelable operating leases are presented below:
| December 31, 2011 | ||||||||||||||||
| Rigs | Real Property | Rail Cars | Total | |||||||||||||
| ($ in thousands) | ||||||||||||||||
| 2012 |
$ | 109,904 | $ | 8,273 | $ | 5,759 | $ | 123,936 | ||||||||
| 2013 |
112,105 | 8,273 | 6,005 | 126,383 | ||||||||||||
| 2014 |
97,873 | 8,273 | 5,185 | 111,331 | ||||||||||||
| 2015 |
39,424 | — | 4,481 | 43,905 | ||||||||||||
| 2016 |
67,139 | — | 4,050 | 71,189 | ||||||||||||
| After 2016 |
25,576 | — | — | 25,576 | ||||||||||||
|
|
|
|
|
|
|
|
|
|||||||||
| Total |
$ | 452,021 | $ | 24,819 | $ | 25,480 | $ | 502,320 | ||||||||
|
|
|
|
|
|
|
|
|
|||||||||
Off-Balance Sheet Arrangements
We have no off-balance sheet arrangements, other than drilling rig subleases and other customary operating leases included in the table above, that have or are likely to have a current or future material effect on our financial condition, changes in financial condition, revenues, expenses, results of operations, liquidity, capital expenditures or capital resources.
Critical Accounting Policies
Our consolidated financial statements are prepared in accordance with generally accepted accounting principles, which require us to make estimates and assumptions that affect the reported amounts of assets and liabilities and disclosure of contingent assets and liabilities at the dates of the financial statements and the reported amounts of revenues and expenses during the reported periods. We have provided a description of all of our significant accounting policies in Note 2 to our audited consolidated financial statements included elsewhere in this prospectus. We believe that of these significant policies, the following may involve a higher degree of judgment or complexity.
Property and Equipment
Property and equipment are carried at cost less accumulated depreciation. Depreciation is calculated using the straight-line method, based on estimates, assumptions and judgments relative to the assets’ estimated useful lives and salvage values. These estimates are based on various factors, including age (in the case of acquired assets), manufacturing specifications, technological advances and historical data concerning useful lives of similar assets. Upon the disposition of an asset, we eliminate the cost and related accumulated depreciation and include any resulting gain or loss in the consolidated statements of operations as (gains) losses on the sale of property and equipment. Expenditures for maintenance and repairs that do not add capacity or extend the useful life of an asset are expensed as incurred.
Interest is capitalized on the average amount of accumulated expenditures for significant capital projects under construction using the effective interest rate of our debt until the underlying assets are placed into service. The capitalized interest is added to the cost of the assets and amortized to depreciation expense over the useful life of the assets.
Impairment of Long-Lived Assets
We review our long-lived assets, such as property and equipment, whenever, in management’s judgment, events or changes in circumstances indicate the carrying amount of the assets may not be
75
Table of Contents
Index to Financial Statements
recoverable. Factors that might indicate a potential impairment include a significant decrease in the market value of the long-lived asset, a significant change in the long-lived asset’s physical condition, a change in industry conditions or a reduction in cash flows associated with the use of the long-lived asset. If these or other factors indicate the carrying amount of the asset may not be recoverable, we determine whether an impairment has occurred through analysis of the undiscounted cash flow of the asset. If an impairment has occurred, we recognize a loss for the difference between the carrying amount and the fair market value of the asset. We measure the fair value of the asset using market prices or, in the absence of market prices, based on an estimate of discounted cash flows. Cash flows are generally discounted using an interest rate commensurate with a weighted average cost of capital for a similar asset.
Goodwill, Intangible Assets and Amortization
Goodwill represents the cost in excess of fair value of the net assets of businesses acquired. Goodwill and intangible assets with indefinite lives are not amortized. Intangible assets with finite lives are amortized on a basis that reflects the pattern in which the economic benefits of the intangible assets are realized, which is generally on a straight-line basis over an asset’s estimated useful life.
We review goodwill and intangible assets with indefinite lives for impairment annually or more frequently if events or changes in circumstances indicate that the carrying amount of the reporting unit exceeds its fair value. Circumstances that could indicate a potential impairment include a significant adverse change in the economic or business climate, a significant adverse change in legal factors, an adverse action or assessment by a regulator, unanticipated competition, loss of key personnel and the likelihood that a reporting unit or significant portion of a reporting unit will be sold or otherwise disposed. Accounting guidance requires a two-step process for testing impairment. First, the fair value of each reporting unit is compared to its carrying value to determine whether an indication of impairment exists. Second, if impairment is indicated, the fair value of the reporting unit’s goodwill is determined by allocating the unit’s fair value to its assets and liabilities (including any unrecognized intangible assets) as if the reporting unit had been acquired in a business combination on the impairment test date. The amount of impairment for goodwill is measured as the excess of the carrying value of the reporting unit over its fair value.
When estimating fair values of a reporting unit for our goodwill impairment test, we use the income approach. The income approach provides an estimated fair value based on the reporting unit’s anticipated cash flows that are discounted using a weighted average cost of capital rate. The primary assumptions used in the income approach are estimated cash flows and weighted average cost of capital. Estimated cash flows are primarily based on projected revenues, operating costs and capital expenditures and are discounted based on comparable industry average rates for weighted average cost of capital.
Revenue Recognition
Substantially all of our revenues are derived from affiliates. Overall, we recognize revenue when services are performed, collection of receivables is probable, persuasive evidence of an arrangement exists and the price is fixed or determinable.
Drilling. We earn revenues by drilling oil and natural gas wells for our customers under daywork contracts. We recognize revenue on daywork contracts for the days completed based on the dayrate each contract specifies. In the event we enter into footage contacts, we will follow the percentage-of-completion method of accounting for footage drilling arrangements. Under this method, drilling revenues and costs related to a well in progress are recognized proportionately over the time it takes to drill the well. Payments received and costs incurred for mobilization services are recognized over the days of actual mobilization.
76
Table of Contents
Index to Financial Statements
Hydraulic Fracturing. We recognize revenue upon the completion of each fracturing stage. We typically complete one or more fracturing stages per day per active crew during the course of a job. A stage is considered complete when the customer requests or the job design dictates that pumping discontinue for that stage. Invoices typically include a lump sum equipment charge determined by the rate per stage each contract specifies and product charges for sand, chemicals and other products actually consumed during the course of providing our services.
Oilfield Rentals. We rent many types of oilfield equipment, including drill pipe, drill collars, tubing, blowout preventers, frac and mud tanks, and also provide air drilling services and services associated with the transfer of fresh water to the well site. We price our rentals and services based on the type of equipment being rented and the service job being performed and recognize revenue ratably over the term of the rental.
Oilfield Trucking. Oilfield trucking provides rig relocation and logistics services as well as fluid hauling services. Our trucks move drilling rigs, crude oil, other fluids and construction materials to and from the well site and also transport produced water from the well site. We price these services by the hour and recognize revenue as services are performed.
Other Operations. We design, engineer and fabricate natural gas compressor packages that we sell to Chesapeake. We price our compression units based on certain specifications such as horsepower, stages and additional options. We recognize revenue upon the completion and transfer of ownership of the natural gas compression unit.
Income Taxes
Chesapeake and its subsidiaries historically have filed a consolidated federal income tax return and other state returns as required. COS LLC and certain of its subsidiaries, as limited liability companies, are not subject to federal income taxes. For these entities, for federal and state income tax purposes, all income, expenses, gains, losses and tax credits generated flow through to their respective members or partners. Because these items of income or loss ultimately flow up to Chesapeake’s corporate tax return, we have reported income taxes on a separate return basis for COS LLC and all of our subsidiaries. Accordingly, we have recognized deferred tax assets and liabilities for the future tax consequences attributable to differences between the financial statement carrying amounts of existing assets and liabilities and their respective tax bases for all our subsidiaries, including the limited liability companies as if each entity were a corporation, regardless of its actual characterization for U.S. federal income tax purposes.
A valuation allowance for deferred tax assets is recognized when it is more likely than not that some or all of the benefit from the deferred tax asset will not be realized. To assess that likelihood, we use estimates and judgment regarding our future taxable income, as well as the jurisdiction in which such taxable income is generated, to determine whether a valuation allowance is required. Such evidence can include our current financial position, our results of operations, both actual and forecasted, the reversal of deferred tax liabilities, and tax planning strategies as well as the current and forecasted business economics of our industry. We had no valuation allowance at December 31, 2011 and 2010.
Recent Accounting Pronouncements
In September 2011, the Financial Accounting Standards Board issued revised guidance related to the annual goodwill impairment test. The revised guidance provides both public and non-public entities with the option of performing a qualitative assessment to determine whether further impairment testing is necessary. The revised standard is effective for goodwill impairment tests performed for fiscal years beginning after December 15, 2011. We do not expect this guidance to have a material effect on our financial condition or results of operations.
77
Table of Contents
Index to Financial Statements
Inflation
Inflation in the U.S. has been relatively low in recent years and did not have a material impact on our results of operations for the years ended December 31, 2011, 2010 and 2009. Although the impact of inflation has been insignificant in recent years, it is still a factor in the U.S. economy and we tend to experience inflationary pressure on the cost of energy services and equipment as increasing oil and natural gas prices increase activity in our areas of operations.
Quantitative and Qualitative Disclosures About Market Risk
Historically, we have provided substantially all of our oilfield services to Chesapeake. For the years ended December 31, 2011, 2010 and 2009, Chesapeake accounted for approximately 94%, 96% and 95% of our revenues, respectively. Approximately 83% of Chesapeake’s estimated proved reserves volumes as of December 31, 2011 were natural gas and 84% of Chesapeake’s 2011 oil and natural gas sales volumes were from natural gas sales. Sustained low natural gas prices, as has been the case recently, and volatile commodity prices in general, could have a material adverse effect on Chesapeake’s and our financial position, results of operations and cash flows, which could adversely impact our ability to comply with financial covenants under our revolving bank credit facility and further limit our ability to fund our planned capital expenditures.
Changes in interest rates affect the amount of interest we earn on our cash, cash equivalents and short-term investments and the interest rate we pay on borrowings under our revolving bank credit facility. We have borrowings outstanding under and may in the future borrow under fixed rate and variable rate debt instruments that give rise to interest rate risk. For fixed rate debt, changes in interest rates generally affect the fair value of the debt instrument, but not our earnings or cash flows. Conversely, for variable rate debt, changes in interest rates generally do not impact the fair value of the debt instrument, but may affect our future earnings and cash flows. Our fuel costs, which consist primarily of diesel fuel used by our various trucks and other equipment, can expose us to commodity price risk and, as our hydraulic fracturing operations grow, we will face increased risks associated with the prices of materials used in hydraulic fracturing such as sand and chemicals. The prices for fuel and these materials can be volatile and are impacted by changes in supply and demand, as well as market uncertainty and regional shortages.
Our primary exposure to interest rate risk results from outstanding borrowings under our revolving bank credit facility, which COO entered into on November 3, 2011. Outstanding borrowings under our revolving bank credit facility bear interest at our option at either (a) the greater of the reference rate of Bank of America, N.A., the federal funds effective rate plus 0.50%, and one-month LIBOR plus 1.00%, all of which are subject to a margin that varies from 1.00% to 1.75% per annum, according to our leverage ratio, or (b) the Eurodollar rate, which is based on LIBOR plus a margin that varies from 2.00% to 2.75% per annum, according to our leverage ratio. A one percentage point increase or decrease in interest rate payable on our revolving bank credit facility would have resulted in a $0.2 million increase or decrease in net income.
78
Table of Contents
Index to Financial Statements
Our Company
We are a diversified oilfield services company that provides a wide range of well site services primarily to Chesapeake, our founder and principal customer, and its partners. Chesapeake is the most active driller of new oil and natural gas wells in the U.S. based on rig count. We focus on providing services to Chesapeake that are strategic to its oil and gas operations, represent historical bottlenecks to those operations or provide relatively high margins to the service provider, including drilling, hydraulic fracturing, oilfield rentals, oilfield trucking and manufacturing of natural gas compressor packages. Our operations are geographically diversified across most major basins in the U.S. Specifically, we provide Chesapeake and its partners with services in the Eagle Ford, Utica, Granite Wash, Cleveland, Tonkawa, Mississippi Lime, Bone Spring, Avalon, Wolfcamp, Wolfberry, and Niobrara unconventional liquids plays and the Barnett, Haynesville, Bossier, Marcellus and Pearsall natural gas shale plays.
Our objective is to provide up to two-thirds of Chesapeake’s overall expected needs for our current and future services. This objective, combined with our unique relationship with Chesapeake, makes us fundamentally different than our competitors because it provides us with substantial growth opportunities while at the same time positioning us to maintain our industry-leading asset utilization rates. We believe that our high-growth, high-utilization business model will allow us to continue creating significant shareholder value over time.
Our business has grown rapidly since our first subsidiary was founded in 2001, both organically and through acquisitions, and we are now one of the larger U.S. onshore oilfield service companies. We currently operate 111 land drilling rigs, the fourth largest active rig fleet in the U.S., which represents our largest revenue generating service line today. We also operate (a) four hydraulic fracturing fleets with an aggregate of 140,000 horsepower; (b) one of the largest oilfield rental businesses in the U.S.; (c) one of the largest oilfield trucking fleets in the U.S., currently consisting of 227 rig relocation trucks, 57 cranes and forklifts used in the movement of drilling rigs and other heavy equipment and 157 fluid hauling trucks; and (d) manufacturing capacity for up to 150 compressor units per quarter, or approximately 85,000 horsepower in the aggregate per quarter. We continue to grow our assets rapidly and have ordered 12 drilling rigs that will utilize advanced electronic drilling technology, including 10 of our proprietary, fit-for-purpose PeakeRigs™, which are scheduled to be delivered at a rate of approximately one rig per month through May 2013. We have also ordered additional new hydraulic fracturing equipment with an aggregate of 175,000 horsepower, and we expect to have eight hydraulic fracturing fleets with an aggregate of 315,000 horsepower operating by the end of 2012 and 12 such fleets with an aggregate of 450,000 horsepower operating by the end of 2013. We believe our growth plans will place us among the largest hydraulic fracturing companies in the U.S. by year-end 2014 based on horsepower.
The services that we provide to Chesapeake are fundamental to establishing and maintaining the production of oil and natural gas from its wells. As of December 31, 2011, Chesapeake had total estimated net proved reserves of approximately 18.8 tcfe, which includes approximately 545 mmbbls of oil and natural gas liquids, which we refer to collectively as “liquids,” and was operating 162 drilling rigs to develop its inventory of approximately 39,000 risked net drill sites. During 2011, Chesapeake utilized hydraulic fracturing fleets with an average of approximately 1.0 million horsepower per day. For 2012 and 2013, Chesapeake’s gross operated drilling and completion capital expenditure budgets are approximately $11.0 billion and $12.0 billion, respectively.
79
Table of Contents
Index to Financial Statements
Chesapeake’s operated drilling program includes expenditures by both Chesapeake and its partners. The charts below show the percentage of budgeted capital expenditures expected to be funded by Chesapeake and its partners in 2012 and 2013.
Chesapeake’s Gross Operated Drilling and Completion
Capital Expenditure Budget

We currently supply Chesapeake with small percentages of its overall requirements for most of our services, which presents us with significant organic growth opportunities. For example, during the year ended December 31, 2011, our revenues from hydraulic fracturing represented less than 1% of Chesapeake’s gross operated expenditures for hydraulic fracturing services and our revenues from oilfield equipment rentals would have represented approximately 19% of its gross operated expenditures for oilfield equipment rentals. Additionally, although we already supply approximately two-thirds of Chesapeake’s current drilling rig needs, we provide low percentages of the drilling-related services it uses, such as directional drilling, mud logging and geosteering services, providing us with significant organic growth opportunities for those services as well. Likewise, while our trucking segment provides Chesapeake with a significant percentage of its rig relocation services, we provide only a small percentage of its fluid hauling requirements.
By seeking to match our productive capacity to meet up to two-thirds of Chesapeake’s expected need for our services, we anticipate that we will continue to have industry-leading asset utilization levels through industry cycles, as we believe that Chesapeake will have a number of incentives to use our services given our relationship and the operational efficiencies we provide. Moreover, Chesapeake’s drilling activity levels over time have been more stable than those of its peers. For example, in the twelve-month period ended September 30, 2009, one of the most challenging periods in the recent history of our industry, the U.S. onshore industry rig count decreased by 1,308 rigs, or 50%, while Chesapeake’s operated rig count, which includes third-party rigs, decreased by only 53 rigs, or 34%. During that same period, Chesapeake’s utilization of our rigs increased by six rigs, from 71 to 77, or 8%. Our rig utilization rates for 2009, 2010 and 2011 were 95%, 97% and 98%, respectively, compared to industry averages for the same periods of 79%, 89% and 88%, respectively. The utilization rates of our other assets are correlated with our rig utilization rates because the well drilling performed by our rigs creates demand for most of the other services we provide.
Significantly, we also have contractual arrangements with Chesapeake that provide additional revenue stability in the event of an industry downturn. Under our services agreement with Chesapeake, Chesapeake has guaranteed the utilization of the lesser of 75 of our drilling rigs or 80% of our operational drilling rig fleet at market-based rates. In addition, Chesapeake has guaranteed that each month it will ensure utilization of
80
Table of Contents
Index to Financial Statements
our operational hydraulic fracturing fleets, up to a maximum of 13 fleets, to complete a minimum aggregate number of fracturing stages equal to 25 stages per month for each fleet at market-based rates.
We currently conduct our business through five operating segments:
Drilling. Nomac Drilling, L.L.C., our drilling subsidiary, provides premium land drilling and drilling-related services, including directional drilling, geosteering and mudlogging, for oil and natural gas exploration and development activities. As of March 31, 2012, we operated a fleet of 111 land drilling rigs, making us the fourth largest land driller operating in the U.S. according to RigData, an independent source of drilling activity information. To address Chesapeake’s needs for horizontal drilling in shale formations and other unconventional resource plays, we have expanded our areas of operation and improved the capability of our drilling rig fleet. We are in the process of building 12 new rigs that will utilize advanced electronic drilling technology, including 10 of our proprietary, fit-for-purpose PeakeRigs™, which are scheduled to be delivered at a rate of approximately one rig per month through May 2013. We are also in the process of refurbishing three rigs in order to modernize and increase the capability of those rigs. For the year ended December 31, 2011, Chesapeake’s gross operated expenditures for drilling and drilling-related services were approximately $1.7 billion, and our revenues from this segment represented approximately 50% of such expenditures.
Hydraulic Fracturing. Performance Technologies, L.L.C., our hydraulic fracturing subsidiary, provides hydraulic fracturing and other well stimulation services. We began hydraulic fracturing operations in the fourth quarter of 2011 with one hydraulic fracturing fleet and currently have four operational fleets with an aggregate of approximately 140,000 horsepower. We plan to have eight such fleets with approximately 315,000 horsepower in the aggregate operating by the end of 2012 and 12 such fleets with approximately 450,000 horsepower in the aggregate operating by the end of 2013. For the year ended December 31, 2011, Chesapeake’s gross operated expenditures for hydraulic fracturing services were approximately $3.5 billion, and our revenues from this segment represented less than 1% of such expenditures.
Oilfield Rentals. Great Plains Oilfield Rental, L.L.C., our oilfield rentals subsidiary, provides a wide range of premium rental tools and services for land-based oil and natural gas drilling, completion and workover activities. We offer a full line of rental tools, including drill pipe, drill collars, tubing, blowout preventers, frac and mud tanks and also provide air drilling services and services associated with the transfer of fresh water to the well site. As our oilfield rentals segment generates our highest margins and we currently supply Chesapeake with a low percentage of its overall oilfield rentals requirements, this segment offers attractive expansion opportunities, including the purchase and subsequent rental of equipment used in pressure control, flowback and hydraulic fracturing services. For the year ended December 31, 2011, Chesapeake’s gross operated expenditures for oilfield rentals were approximately $1.3 billion, and our revenues from this segment represented approximately 19% of such expenditures.
Oilfield Trucking. Hodges Trucking Company, L.L.C. and Oilfield Trucking Solutions, L.L.C., our oilfield trucking subsidiaries, provide rig relocation and logistics services and fluid hauling services. Our trucks move drilling rigs, crude oil, fluids and construction materials to and from the well site and also transport produced water from the well site. As of March 31, 2012, we owned a fleet of 227 rig relocation trucks, 57 cranes and forklifts used in the movement of drilling rigs and other heavy equipment and 157 fluid hauling trucks. Expansion opportunities for our oilfield trucking segment include expanding our assets, such as our crude hauling capabilities, and deploying our assets in new areas. For the year ended December 31, 2011, Chesapeake’s gross operated expenditures for rig relocation and logistics services were approximately $167.0 million, and our revenues from this segment represented approximately 77% of such expenditures. These amounts do not include
81
Table of Contents
Index to Financial Statements
Chesapeake’s expenditures for fluid hauling services, of which we currently provide only a small percentage.
Other Operations. Compass Manufacturing, L.L.C., our manufacturing subsidiary, designs, engineers, fabricates, sells and installs natural gas compression units, accessories and equipment used in the production, treatment and processing of oil and natural gas. As of March 31, 2012, we had the capacity to manufacture up to 150 compressor units per quarter, or approximately 85,000 horsepower in the aggregate per quarter. Expansion opportunities for Compass include the manufacture of other types of oilfield equipment that are used in our oilfield rentals business. For the year ended December 31, 2011, Chesapeake’s gross operated expenditures for compressor purchases were approximately $87.5 million, and we provided Chesapeake with approximately 66% of its compressor manufacturing needs.
Our Competitive Strengths
We believe that we have the following competitive strengths:
Our relationship with Chesapeake. For nearly eight years, Chesapeake, our founder and principal customer, has maintained the nation’s most active drilling program, based on rig count. For the years ended December 31, 2009, 2010 and 2011, Chesapeake drilled 1,212, 1,445 and 1,662 gross operated oil and natural gas wells, respectively, and made $5.2 billion, $7.9 billion and $13.3 billion, respectively, of gross operated drilling and completion expenditures. As of December 31, 2011, Chesapeake had total estimated net proved reserves of 18.8 tcfe, which includes approximately 545 mmbbls of liquids, and was operating 162 drilling rigs to develop its inventory of approximately 39,000 risked net drill sites. We anticipate that a significant portion of the demand for our services in future years will come from Chesapeake’s exploitation of this large backlog of drilling locations, approximately 20 years’ worth at current drilling levels.
The chart below shows the average number of rigs drilling for Chesapeake during 2009, 2010 and 2011 compared to its most active competitors.
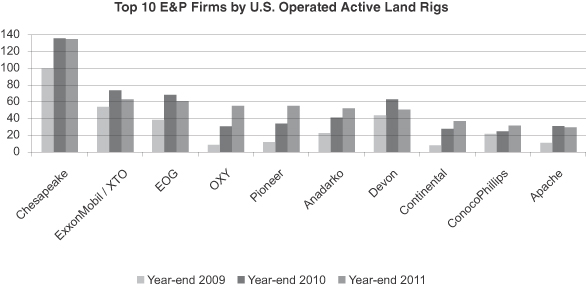
Source: RigData—The Land Rig Newsletter Biweekly Report (excludes operating rigs that are in the process of rigging up or mobilization).
82
Table of Contents
Index to Financial Statements
Looking forward, Chesapeake’s gross operated drilling and completion expenditure budgets for 2012 and 2013 are expected to be approximately $11.0 billion and $12.0 billion, respectively. Chesapeake’s industry-leading acreage position and active drilling program provide us with significant growth opportunities. Our relationship with Chesapeake, which gives us unique insights into our principal customer’s current and future oilfield services needs, positions us to operate efficiently, maintain industry-leading asset utilization and continue to improve our margins and creates incentives for Chesapeake to use our services.
Significant revenue growth opportunities. Chesapeake’s current and future oilfield services needs provide us with significant growth opportunities. As shown in the table below, revenues from our hydraulic fracturing and oilfield rentals segments in 2011 represented less than 1% and approximately 19%, respectively, of Chesapeake’s gross operated expenditures for these services, which is well below our objective of providing up to two-thirds of Chesapeake’s overall expected need for these services.
| Segment(1) |
2011 Revenues (in millions)(2) |
Chesapeake’s 2011 Gross Operated Expenditures (in millions) |
As a Percentage of Chesapeake’s Gross Operated Expenditures |
|||||||||
| Drilling |
$ | 855 | $ | 1,725 | 50 | % | ||||||
| Hydraulic Fracturing |
$ | 13 | $ | 3,486 | 0 | % | ||||||
| Oilfield Rentals |
$ | 246 | $ | 1,266 | 19 | % | ||||||
| (1) | See Note 14 to our audited consolidated financial statements included elsewhere in this prospectus for additional information about our reportable segments. |
| (2) | Drilling and oilfield rentals segment revenues include third-party revenues. Hydraulic fracturing includes ancillary support services. |
In addition, within our drilling and oilfield trucking segments, we currently provide Chesapeake with a small percentage of its needs for drilling-related services and fluid hauling services, providing us with additional growth opportunities. We will also have the opportunity to increase the scope of our service offerings to Chesapeake and its partners and to grow with Chesapeake, whose drilling and completion expenditures have increased by an average of 27% year over year since 2006. We believe that Chesapeake’s oilfield services demand and its incentives to use our services will provide us with the opportunity to grow our business significantly with relatively low risk of over-expansion.
83
Table of Contents
Index to Financial Statements
Industry-leading asset utilization. Chesapeake’s 20-year backlog of risked drilling locations, many of which are in unconventional liquids plays, provides us with a unique opportunity to keep our assets highly utilized for years to come. We believe that Chesapeake’s incentives to use our services, combined with our objective of matching our productive capacity to meet up to two-thirds of Chesapeake’s expected overall needs for our services, will allow us to maintain industry-leading asset utilization levels through industry cycles. Additionally, Chesapeake’s drilling activity levels over time have been more stable than those of its peers. For example, in the twelve-month period ended September 30, 2009, one of the most challenging periods in the recent history of our industry, the U.S. onshore industry rig count decreased by 1,308 rigs, or 50%, while Chesapeake’s operated rig count, which includes third-party rigs, decreased by only 53 rigs, or 34%. During that same period, Chesapeake’s utilization of our rigs increased by six rigs, from 71 to 77, or 8%. The utilization rates of our other assets are correlated with our rig utilization rates because the well drilling performed by our rigs creates demand for most of the other services we provide. The chart below shows our drilling rig utilization over the last four years as compared with the U.S. industry onshore average.
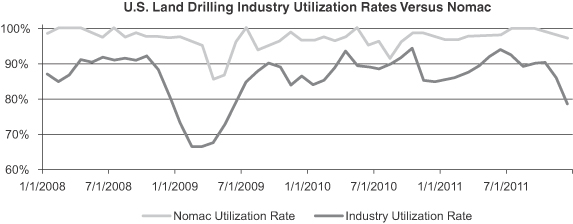
Source: RigData and Nomac active rig counts.
Additionally, our services agreement with Chesapeake guarantees the utilization of a portion of our drilling rig and hydraulic fracturing fleets through October 2016, with an annual evergreen thereafter. While we believe the utilization of our assets will remain at a level significantly higher than the minimum utilization rates provided for in the services agreement, the guaranteed utilization provides us with downside protection in our traditionally cyclical industry.
84
Table of Contents
Index to Financial Statements
Enhanced operational efficiencies. Our unique relationship with Chesapeake creates operational efficiencies that our competitors cannot replicate. We have access to the activity forecasts prepared by Chesapeake and we maintain close communications with Chesapeake regarding its service needs, allowing us to efficiently provide timely, tailored, “just-in-time” service to Chesapeake. As the graph below indicates, we drill wells for Chesapeake and its partners on average approximately 10% faster than our competitors do.
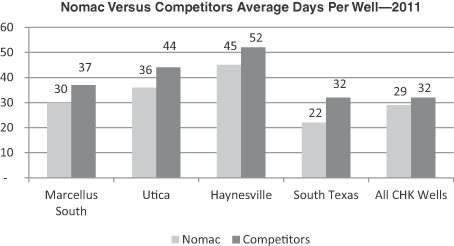
Source: Chesapeake internal reports based on wells spudded in 2011.
Our ability to align our operations and forecasts with Chesapeake incentivizes it to use our services, provides us with cost savings and efficient deployment of capital and allows us to provide services at an overall cost that is attractive to Chesapeake and its partners. Our relationship with Chesapeake also provides us with the support of a large, well-known parent-sponsor which we believe benefits us in dealing with suppliers, lenders, capital providers and others that a similarly sized standalone service company could not replicate. Finally, we believe that Chesapeake’s workplace reputation, which was recently recognized on FORTUNE’s 100 Best Companies to Work For® list as the best among energy production companies, and our stable asset utilization levels have allowed us to build a well-trained, safe and efficient workforce of over 5,000 employees and to maintain a lower employee turnover rate compared to industry averages.
Diversified, high quality asset base. Our modern and well maintained assets are capable of providing unique operational advantages to Chesapeake. A substantial majority of our drilling rig fleet has been newly fabricated or refurbished since 2001, and substantially all of our rigs have been updated with the equipment necessary for horizontal drilling in today’s unconventional resource plays. We expect to have an additional 30 of our proprietary, fit-for-purpose PeakeRigs™ operating in the next six years, which will utilize state-of-the-art technology to improve drilling efficiency and will be rated 1,000 horsepower or greater. We also have an initiative underway to repower our drilling rigs with dual fuel, diesel/natural gas (DNG) systems, which will reduce our customers’ costs through the utilization of natural gas during our rig operations. Our hydraulic fracturing assets are among the newest in the industry, with 100% of our fleet built in 2011 or later by manufacturers with strong reputations for producing durable equipment capable of withstanding the demanding conditions typically presented by unconventional reservoirs. Our oilfield rentals, oilfield trucking and natural gas compressor manufacturing assets are modern and well maintained. The quality of our asset base and our comprehensive maintenance program results in less downtime, lower operating costs and increased utilization of our
85
Table of Contents
Index to Financial Statements
assets, which is critical for drilling and hydraulic fracturing operations where assets are commonly utilized on a 24-hour per day, seven day per week basis.
Experienced management team. We have an experienced and skilled management team which is led by our Chief Executive Officer, Jerry L. Winchester, who has over 30 years of industry experience, including 13 years of experience as the president and chief executive officer of Boots & Coots International Well Control, Inc. (“Boots & Coots”). Our management team, including Mr. Winchester, Cary D. Baetz, our Chief Financial Officer, James G. Minmier, President of Nomac Drilling, L.L.C., Zachary M. Graves, President of Thunder Oilfield Services, L.L.C., William R. Stanger, President of Performance Technologies, L.L.C., and Alan D. Lavenue, President of Compass Manufacturing, L.L.C., collectively has over a century of oilfield services experience with prominent oilfield service companies such as Halliburton Company, Boots & Coots, Helmerich & Payne, Inc., Schlumberger Limited, Precision Drilling Corporation, Bronco Drilling Company, Inc. and Exterran Holdings, Inc. The remainder of our management team is comprised of seasoned operating, financial and administrative executives with extensive experience in and knowledge of the oilfield services industry. Our management team has operated through numerous oilfield services cycles and provides us with valuable experience and a detailed understanding of customer requirements.
Our Business Strategy
Our goal is to maximize shareholder value by profitably building a leading oilfield services company through leveraging our relationship with Chesapeake, the most active driller of new oil and natural gas wells in the U.S., to achieve our objective of providing up to two-thirds of Chesapeake’s overall expected needs for our current and future services and maintain industry-leading utilization rates. We plan to pursue the following strategic objectives to achieve this goal.
Grow our asset base. We intend to aggressively grow our asset base, particularly our hydraulic fracturing fleets, oilfield rental inventory and our drilling-related services, in order to achieve our objective of increasing our productive capacity to meet up to two-thirds of Chesapeake’s expected need for our services. We have placed substantial orders for additional new hydraulic fracturing units and expect to have eight fleets with approximately 315,000 horsepower in the aggregate operating by the end of 2012 and 12 fleets with approximately 450,000 horsepower in the aggregate operating by the end of 2013. Our drilling, hydraulic fracturing and oilfield rentals segments provide our highest margins and highest returns on invested capital relative to the other segments in which we operate. We are focused on increasing the revenues of these segments by growing our assets and expanding into the markets necessary to meet higher percentages of Chesapeake’s needs for these services, particularly the liquids-rich plays in which Chesapeake is now most active. During 2012 and 2013, we plan to make $1.1 billion to $1.2 billion of growth capital expenditures, in addition to amounts budgeted for the acquisition of presently leased rigs, and these expenditures will allow us to meet a greater percentage of Chesapeake’s needs and solidify our position as one of the largest U.S. onshore oilfield services companies.
Focus on full utilization of our assets. Our oilfield service assets have traditionally maintained high utilization rates. For example, the utilization of our drilling rigs has averaged between approximately 95% and 99% since 2008. The utilization rates of our other assets are directly correlated with our rig utilization rates because the well drilling performed by our rigs creates demand for most of the other services we provide. Our industry-leading asset utilization rates result from our strategy of growing in tandem with Chesapeake and serving as a substantial provider of oilfield services to Chesapeake and its partners. We plan to maintain our industry-leading utilization rates as we continue to grow by growing our productive capacity to meet up to two-thirds of Chesapeake’s overall expected need for our services. We believe this strategy, combined with
86
Table of Contents
Index to Financial Statements
Chesapeake’s incentives to use our services, will continue to result in high utilization rates for our assets throughout industry cycles.
Focus on improving margins. We plan to continue to improve our margins by leveraging our relationship with Chesapeake to decrease costs and make our business more efficient. Our relationship with Chesapeake enables us to operate more efficiently than our competitors by providing us with exclusive access to data that allows us to align our operations and projections with those of Chesapeake, to efficiently provide Chesapeake with timely, tailored, “just-in-time” services and to anticipate and quickly react to industry trends. As a result, our management team can focus its efforts on delivering efficient, high-quality services to Chesapeake and its partners rather than on marketing our services and managing through the cyclicality of oilfield activity and commodity prices. Additionally, we plan to continue to evolve our product and service offerings to include a larger percentage of higher margin offerings. We also believe that our new management team, which is exclusively dedicated to our operations and collectively has over a century of experience in the oilfield services industry, will enable us to better capitalize on existing efficiencies and identify further opportunities to maximize our margins. For example, since July 2011, our new management team has increased the gross margins in our drilling segment through various cost saving initiatives by approximately 20%, while at the same time improving our safety and productivity metrics.
Capitalize on opportunities to provide additional services. As the driller of a substantial majority of Chesapeake’s wells, we play a central role in the planning and execution of Chesapeake’s drilling program. As a result of this role, we are uniquely positioned to cross-sell our other service offerings to Chesapeake, observe the service offerings of other third-party service providers that are present at the well site and evaluate expansion opportunities. We plan to use this role to focus our growth on high margin product and services offerings. While we already provide Chesapeake with approximately two-thirds of its drilling rig needs, we plan to increase the percentage of drilling-related services that we provide, such as directional drilling, mud logging and geosteering. In our hydraulic fracturing segment, we believe that expansion opportunities exist not only through expanding our fleets but also by vertically integrating our operations through the integration of sand reserves, sand processing operations and railcar, truck and other logistics assets. We also plan to continue to grow our oilfield rentals segment, where our inventory of tools and equipment can be expanded to include additional drilling and completion rental tools. We have a significant growth capital expenditure budget of between $1.1 billion and $1.2 billion over the next two years with which to develop such business lines. These amounts are in addition to amounts budgeted for the acquisition of presently leased rigs. We believe that targeting the development of these high margin product and services offerings through geographic expansion, vertical integration and asset additions will provide us with a greater return on our investment in our assets and cash flows for future growth.
Continued focus on safety. Our relationship with Chesapeake provides us with enhanced utilization across industry cycles, which in turn reduces employee turnover, increases safety and drives superior results. In addition, the continuity of working relationships between our employees and Chesapeake provides for greater communication and data sharing at our drill sites, which we believe results in safer working conditions for employees. We are focused on hiring, training and retaining high-quality employees. As a result of our strong emphasis on training and safety protocols for our employees, we believe we have a superior safety record and reputation. We have a strong and improving Total Recordable Incidence Rate (TRIR) safety record even as our employee base has more than doubled over the past two years. From 2009 to 2011, our TRIR dropped by approximately 36%. In addition, all of our field-based employees are eligible to receive incentive pay based on satisfying safety standards, which we believe motivates them to continually maintain quality and safety.
87
Table of Contents
Index to Financial Statements
Our Operating Segments
Drilling Segment
Drilling rig fleet. Our drilling segment is operated through our wholly owned subsidiary, Nomac Drilling, L.L.C., and provides premium land drilling and drilling-related services, including directional drilling, geosteering and mudlogging, for oil and natural gas exploration and development activities. As of March 31, 2012, we operated a fleet of 111 operating land drilling rigs, making us the fourth largest land driller operating in the U.S. according to RigData. Our drilling rigs have depth ratings between 3,000 and 25,000 feet and horsepower ratings, which are based on the horsepower of the drawworks of the rigs, from 450 to 2,000. The following table sets forth the location of the land drilling rigs that we operated at March 31, 2012:
| Resource Play |
Rig Count |
|||
| Anadarko Basin |
47 | |||
| Marcellus Shale |
23 | |||
| Eagle Ford Shale |
16 | |||
| Williston Basin |
10 | |||
| Barnett Shale |
4 | |||
| Haynesville/Bossier Shales |
6 | |||
| Utica Shale |
5 | |||
|
|
|
|||
| Total |
111 | |||
As of March 31, 2011, we had 17 drilling rigs, all of which are leased from CEF, that were idle, or “warm stacked,” or that had been placed in storage, or “cold stacked,” due to low demand for drilling rigs with their specifications. Our cold stacked rigs were generally designed for vertical drilling in conventional reservoirs and are not expected to be returned to service under current market conditions. Among our inactive drilling rigs are three rigs that are currently being refurbished, and two rigs that are being used in our training program.
A primary competitive advantage of our drilling segment is our relationship with Chesapeake, which is the most active driller of new wells in the U.S., based on rig count. Since 2000, Chesapeake has built the largest combined inventories of onshore leasehold (15.3 million net acres) and 3-D seismic (30.8 million acres) in the U.S. Chesapeake has also accumulated the largest inventory of U.S. natural gas shale play leasehold (2.2 million net acres) and now owns leading positions in 11 of what it believes are the top 15 liquids-rich plays in the U.S. As of March 31, 2012, Chesapeake was operating 162 drilling rigs, 100 of which were our rigs, to further develop its inventory. In the past, this key relationship has provided us with greater operational stability than our competitors and we expect that it will do so in the future. The following table sets forth historical information regarding utilization of our land drilling rig fleet and industry utilization rates according to Rig Data:
| December 31, | ||||||||||||
| 2009 | 2010 | 2011 | ||||||||||
| Average number of operating rigs for the period |
79 | 83 | 104 | |||||||||
| Average utilization rate |
95 | % | 97 | % | 98 | % | ||||||
| Average industry utilization rate |
79 | % | 89 | % | 88 | % | ||||||
Drilling rig specifications. A drilling rig consists of engines, a hoisting system, a rotating system, pumps and related equipment to circulate drilling fluid, blowout preventers and related equipment.
Diesel or gas engines are typically the main power sources for a drilling rig. Power requirements for drilling jobs may vary considerably, but most drilling rigs employ two or more engines to operate the
88
Table of Contents
Index to Financial Statements
drilling rig and the ancillary equipment, which generate between 2,000 and 4,000 horsepower, depending on well depth and rig design. Most drilling rigs capable of drilling in deep formations, involving depths greater than 15,000 feet, use diesel-electric power units to generate and deliver electric current through cables to electrical switch gears, then to direct-current electric motors attached to the equipment in the hoisting, rotating and circulating systems.
Drilling rigs use long strings of drill pipe and drill collars to drill wells. Drilling rigs are also used to set heavy strings of large-diameter pipe, or casing, inside the borehole. Because the total weight of the drill string and the casing can exceed 500,000 pounds, drilling rigs require significant hoisting and braking capacities. Generally, a drilling rig’s hoisting system is made up of a mast, or derrick, a drilling line, a traveling block and hook assembly and ancillary equipment that attaches to the rotating system, a mechanism known as the drawworks. The drawworks mechanism consists of a revolving drum, around which the drilling line is wound, and a series of shafts, clutches and chain and gear drives for generating speed changes and reverse motion. The drawworks also houses the main brake, which has the capacity to stop and sustain the weights used in the drilling process. When heavy loads are being lowered, a hydromatic or electric auxiliary brake assists the main brake to absorb the great amount of energy developed by the mass of the traveling block, hook assembly, drill pipe, drill collars and drill bit or casing being lowered into the well.
Modern rotating equipment, from top to bottom, consists of a top drive, drill pipe, drill collars and the drill bit. We refer to the equipment between the top drive and the drill bit as the drill stem. The top drive sustains the weight of the drill stem, rotates the drill stem and provides a passageway for circulating drilling fluid into the top of the drill string. Drilling fluid enters the top drive through a hose, called the rotary hose. The drill pipe and drill collars are both steel tubes that, when rotated, rotate the drill bit and also allow a conduit to the drill bit through which drilling fluid can be pumped. Drill pipe, sometimes called drill string, comes in 30-foot sections, or joints, with threaded sections on each end. Drill collars are heavier than drill pipe and are also threaded on the ends. Collars are used on the bottom of the drill stem to apply weight to the drilling bit. At the end of the drill stem is the bit, which chews up the formation rock and dislodges it so that drilling fluid can circulate the fragmented material back up to the surface where the circulating system filters it out of the fluid.
Drilling fluid, often called mud, is a mixture of clays, chemicals and water or oil, which is carefully formulated for the particular well being drilled. Bulk storage of drilling fluid materials, the pumps and the mud-mixing equipment are placed at the start of the circulating system. Working mud pits and reserve storage are at the other end of the system. Between these two points the circulating system includes auxiliary equipment for drilling fluid maintenance and equipment for well pressure control. Within the system, the drilling mud is typically routed from the mud pits to the mud pump and from the mud pump through a standpipe and the rotary hose to the drill stem. The drilling mud travels down the drill stem to the bit, up the annular space between the drill stem and the borehole and through the blowout preventer stack to the return flow line. It then travels to a shale shaker for removal of rock cuttings, and then back to the mud pits, which are usually steel tanks. The rock cuttings are deposited into steel cuttings bins or earthen excavations called reserve pits and properly disposed of at the conclusion of the drilling process.
In a continuing effort to improve our drilling rig fleet, as of March 31, 2012, we had installed top drives on 107 rigs, or approximately 97% of our operating fleet and had installed iron roughnecks on 40 rigs. We plan to install top drives and iron roughnecks on all capable rigs. These upgrades provide our drilling rigs with more varied capabilities for drilling in unconventional plays, and they also improve our efficiency and safety. Top drives provide maximum torque and rotational control, improved well control and better hole conditioning. In horizontal drilling, operators can utilize top drives to reach formations that may not be accessible with conventional rotary drilling. An iron roughneck is a remotely operated pipe handling feature on the rig floor, which is used to help reduce the occurrence of repetitive motion
89
Table of Contents
Index to Financial Statements
injuries and decrease drill pipe tripping time. Several of our rigs accommodate skidding or walking systems. These walking systems increase efficiency by allowing multiple wells to be drilled on the same pad site and permitting the drilling rig to move between wells while drill pipe remains in the derrick, thus reducing move times and costs. We have installed mechanized catwalks on 23 of our rigs. A mechanized catwalk is a tubular handling feature used to raise drill pipe, drill collars, casing and other necessary items to the drilling rig floor. It reduces tubular transfer time, thereby increasing efficiency and decreasing operator costs for handling casing.
We have also begun a new build program that will add 12 new rigs that will utilize advanced electronic drilling technology, including 10 of our proprietary, fit-for-purpose PeakeRigs™, which are scheduled to be delivered at a rate of approximately one rig per month through May 2013. These rigs will utilize state-of-the-art A/C power and control systems to improve drilling efficiency, include certain features to decrease well-to-well mobilization times and provide modern working environments, including joystick controls, touch-screen monitors and climate-controlled drillers’ cabins. All new build rigs will include top drives, iron roughnecks, walking systems and mechanized catwalks. We expect to have an additional 30 of our proprietary, fit-for-purpose PeakeRigs™ operating in the next six years, which will utilize state-of-the-art technology to improve drilling efficiency and will be rated 1,000 horsepower or greater.
There are numerous factors that differentiate drilling rigs, including their power generation systems and their drilling depth capabilities. The actual drilling depth capability of a rig may be less than or more than its rated depth capability due to numerous factors, including the size, weight and amount of the drill pipe on the rig. The intended well depth and the drill site conditions determine the amount of drill pipe and other equipment needed to drill a well. Generally, land rigs operate with crews of five to six persons working at any one time.
In addition to the various upgrades we have made to our drilling rigs, we also have ancillary assets and personnel to maximize the quality of our drilling services. Nomac’s wholly owned subsidiary, Nomac Services, L.L.C., provides integrated directional drilling, measurement while drilling (MWD), well bore planning, geosteering and mud logging services in both conventional and horizontal applications to maximize drilling efficiencies and lower costs.
We believe that our operating drilling rigs and other related equipment are in good operating condition. Our employees perform scheduled maintenance and minor repair work on our drilling rigs. Historically, we have relied on various oilfield service companies for major repair work and overhaul of our drilling equipment. We lease a 41,000 square foot machine shop in Oklahoma City, which allows us to refurbish and repair our rigs and equipment in-house. In the event of major breakdowns or mechanical problems, our rigs could be subject to significant idle time and a resulting loss of revenue if the necessary repair services are not immediately available.
As of March 31, 2012, we owned a fleet of 227 trucks and related oilfield trucking equipment, including 57 cranes and forklifts, which we use to transport our drilling rigs to and from drilling sites. By owning such equipment, we reduce the overall cost of rig moves and reduce downtime between rig moves. For more information concerning our rig relocation equipment, please see “—Oilfield Trucking Segment” below.
Drilling Customers and Contracts. Chesapeake and its partners are our largest customers, representing 93% of our drilling revenues in the year ended December 31, 2011. We typically contract with Chesapeake on a well by well basis pursuant to a modified IADC daywork drilling contract for our drilling services. However, we recently entered into two-year term contracts with Chesapeake with regard to 10 of the drilling rigs coming out of our new build program. As of March 31, 2012, we had 10 drilling rigs operating in the Williston and Marcellus basins on term contracts with non-Chesapeake
90
Table of Contents
Index to Financial Statements
operators. As our contracts expire with non-Chesapeake parties, we expect to enter into new contracts with Chesapeake to supply their drilling needs with those rigs. Contract terms generally depend on the complexity and risk of operations, the on-site drilling conditions, the type of equipment used and the anticipated duration of the work to be performed. We typically enter into drilling contracts that provide for compensation on a daywork basis and that have market-based pricing, including with Chesapeake. We have entered into drilling contracts that provide for compensation on a footage basis in the past but do not currently intend to enter into footage contracts in the future. We have not historically entered into turnkey contracts. We may decide to enter into footage or turnkey contracts in the future.
Currently, all of our drilling contracts are daywork contracts. A daywork contract generally provides for a basic rate per day when drilling (the dayrate for our providing a rig and crew) and for lower rates when the rig is moving, or when drilling operations are interrupted or restricted by equipment breakdowns, adverse weather conditions or other conditions beyond our control. In addition, daywork contracts may provide for a lump-sum fee for the mobilization and demobilization of the rig, which in most cases approximates our incurred costs. Daywork drilling contracts are beneficial in that the customer bears a large portion of the out-of-pocket drilling costs and we generally bear no part of the usual risks associated with drilling, such as time delays and unanticipated costs. A daywork contract differs from a footage contract (in which the drilling contractor is paid on the basis of a rate per foot drilled) and a turnkey contract (in which the drilling contractor is paid for drilling a well to a specified depth for a fixed price). We expect that all of our future contracts with Chesapeake and third parties will be daywork contracts.
Hydraulic Fracturing Segment
Hydraulic fracturing development. Our hydraulic fracturing segment is operated through our wholly owned subsidiary, Performance Technologies, L.L.C., and provides high-pressure hydraulic fracturing (or frac) services and other well stimulation services to Chesapeake. Fracturing services are performed to enhance the production of oil and natural gas from formations having low permeability such that the natural flow of hydrocarbons to the surface is restricted. We have gathered significant expertise in the fracturing of multi-stage horizontal natural gas and liquids-rich wells in shale and other unconventional geological formations.
Currently, we operate four hydraulic fracturing fleets with an aggregate of approximately 140,000 horsepower for Chesapeake. We plan to have eight such fleets with approximately 315,000 horsepower in the aggregate operating by the end of 2012 and 12 such fleets with approximately 450,000 horsepower in the aggregate operating by the end of 2013. We contemplate that we will make approximately $227.7 million of capital expenditures for our hydraulic fracturing segment for the year ending December 31, 2012.
Our initial operations have been focused in western Oklahoma. We plan to expand the focus of our operations in areas of the U.S. in which there are significant onshore developments requiring the application of advanced completion techniques where companies, including Chesapeake, are actively developing and producing oil and natural gas. We believe that we will have significant opportunities for further expansion beyond four crews presently operating in Mid-Continent area. These areas would include the Eagle Ford, Utica and Marcellus, which are all shale formations that typically require hydraulic fracturing in order to be productive.
Hydraulic fracturing process. The fracturing process consists of pumping a fracturing fluid into a well at sufficient pressure to fracture the formation. Materials known as proppants, primarily sand or sand coated with resin, are suspended in the fracturing fluid and are pumped into the fracture to prop it open. The fracturing fluid is designed to “break,” or lose viscosity, and be forced out of the formation by its pressure, leaving the proppants suspended in the fractures.
91
Table of Contents
Index to Financial Statements
Companies offering fracturing services typically own and operate fleets of mobile, high-pressure pumping systems and other heavy equipment. We refer to these pumping systems, each of which consists of a high pressure reciprocating pump, diesel engine, transmission and various hoses, valves, tanks and other supporting equipment, all typically mounted to a flat-bed trailer, as “fracturing units.” The group of fracturing units, other equipment and vehicles necessary to perform a typical fracturing job is referred to as a “fleet.” Each fleet typically consists of eight to 20 fracturing units, two or more blenders (one used as a backup), which blend the proppant and chemicals into the fracturing fluid, sand chiefs, which are large containers used to store sand on location, various vehicles used to transport sand, chemicals, gels and other materials, various service trucks and a monitoring van equipped with monitoring equipment and computers that control the fracturing process. The personnel assigned to each fleet are commonly referred to as a “crew.”
An important element of fracturing services is determining the proper fracturing fluid, proppants and injection program to maximize results. We employ field engineering personnel to provide technical evaluation and job design recommendations for customers as an integral element of our fracturing service. Technological developments in the industry over the past several years have focused on proppant density control, liquid gel concentrate capabilities, computer design and monitoring of jobs and cleanup properties for fracturing fluids.
Proppant and chemical supply. The proppant we use most frequently is raw sand. A reliable source of raw sand and the ability to deliver it to job sites quickly and efficiently are crucial to the success of our hydraulic fracturing business. This is particularly significant during periods in which there are shortages of sand, such as in late 2008. As activity in our industry has increased, demand for and prices of sand have increased significantly. We are in the process of integrating reserves of raw sand and establishing our own mining and processing facilities, which we believe will provide us with a stable source of proppants and reduce our exposure to potential shortages. We have entered into non-metallic mineral mining leases at potential sand mining sites consisting of approximately 1,700 total acres of sand reserves in Wisconsin. We have also entered into an agreement with a dedicated hydraulic fracturing sand carrier to ensure adequate truck transportation services for hauling our hydraulic fracturing sand from our regional distribution points to the well site, and we have entered into rail car leases for the bulk transportation of hydraulic fracturing sand by rail from the mine origins to our regional distribution hubs.
We purchase the fracturing fluid used in our hydraulic fracturing activities from third-party suppliers. The suppliers are responsible for storage, handling and compatibility of the chemicals used in the fracturing fluid. We also require our suppliers to adhere to strict environmental and quality standards and to maintain minimum inventory levels at regional hubs, thus ensuring adequate supply for our hydraulic fracturing operations.
Hydraulic fracturing customers and contracts. All of our hydraulic fracturing services are currently performed for Chesapeake and we anticipate that this will continue to be the case in the foreseeable future. We contract with Chesapeake pursuant to a master services agreement that specifies payment terms, audit rights and insurance requirements and allocates certain operational risks through indemnity and similar provisions. We supplement these agreements for each engagement with a bid proposal, subject to customer acceptance, containing such things as the estimated number of fracturing stages to be performed, pricing, quantities of products expected to be needed, and the number, horsepower and pressure ratings of the hydraulic fracturing fleets to be used. We are generally compensated based on the number of fracturing stages we complete and pricing is market based. See “Certain Relationships and Related Party Transactions—Master Services Agreement” and “Certain Relationships and Related Party Transactions—Services Agreement.”
92
Table of Contents
Index to Financial Statements
Oilfield Rentals Segment
Our oilfield rentals segment is operated through our wholly owned subsidiary, Great Plains Oilfield Rental, L.L.C., and provides a wide range of premium rental tools and services for land-based oil and natural gas drilling, completion and workover activities. Our rental equipment allows Chesapeake to have access to inventories of tools and other equipment without the cost of purchasing, maintaining or storing that equipment in its own inventory. As of March 31, 2012, our rental tool inventory and services included:
| Ÿ | large diameter drill pipe, heavy weight drill pipe, high torque drill pipe, drill collars, tubing and other required accessories; |
| Ÿ | pressure control equipment, such as blowout preventers, high pressure valves, choke and kill manifolds and test pumps; |
| Ÿ | water transfer services; |
| Ÿ | air drilling services; and |
| Ÿ | frac tanks and mud tanks. |
We have various sizes of tubulars and related handling tools, providing a wide range of equipment for drilling at a wide range of well depths and conditions. In response to the growth in directional drilling, we have expanded our inventory of premium, high torque drill pipe, which also provides operators with the technical characteristics demanded by deeper wells and wells expected to encounter harsh geological conditions. Generally, our customers rent drill pipe for use in the lateral section of a horizontal well. Our water transfer services involve providing water to be used in hydraulic fracturing during the completion of a well. These rental tools and related services are marketed through our internal sales force. The majority of our equipment and tools are rented to our customers on a per day basis and are returned after use.
Oilfield Trucking Segment
Our oilfield trucking segment provides rig relocation and logistics services as well as fluid hauling services to Chesapeake and other E&P companies.
Drilling rig relocation and logistics. Our drilling rig relocation and logistics services are operated through our wholly owned subsidiary, Hodges Trucking Company, L.L.C., and provide heavy-duty trucks and equipment used in the movement of land drilling rigs. Hodges has been operating in the oilfield trucking industry for more than 75 years. Our fleet includes three-axle slick-back trucks, three- and four-axle winch trucks, gin-pole trucks, tandem trucks, trailers and forklifts. As of March 31, 2012, we owned a fleet of 227 rig relocation trucks, as well as 57 cranes and forklifts used in the movement of drilling rigs and other heavy equipment. Our trucks and equipment are designed and equipped to meet a variety of terrain and climate conditions. We have a state-of-the-art maintenance and fabrication facility staffed with certified personnel, and we have also created a standardized parts inventory, allowing us to fix problems in the field, minimizing downtime and cost.
Fluid Hauling. Our fluid hauling services are operated through our wholly owned subsidiary, Oilfield Trucking Solutions, L.L.C., and provide heavy- and medium-duty trucks used in connection with the movement of fluids to and from well sites. We operate our fluid hauling services from four facilities located in West Virginia, Pennsylvania and Texas. Fluid hauling trucks are utilized in connection with drilling, completion and workover projects, which tend to use large amounts of various fluids. Each fluid service truck is equipped to pump fluids from or into wells, pits, tanks and other storage facilities. The majority of our fluid hauling trucks are also used to transport water to fill frac tanks on well locations, including frac tanks provided by us through our oilfield rentals segment and third parties, to transport
93
Table of Contents
Index to Financial Statements
produced water to disposal wells or facilities and to transport drilling and completion fluids to and from well locations. We also own trucks that are used in the hauling of crude oil. As of March 31, 2012, we owned a fleet of 157 fluid hauling trucks with a fluid hauling capacity of up to 130 barrels of water and 200 barrels of crude oil. We expect to significantly expand our crude hauling capabilities in the next three years, adding 90 crude hauling trucks with a crude hauling capacity of up to 200 barrels of crude oil per truck and an aggregate of 18,000 total barrels of crude oil.
Other Operations
Our other operations segment primarily consists of our natural gas compressor manufacturing operations and is operated through our wholly owned subsidiary, Compass Manufacturing, L.L.C. We sell large and small natural gas compressor packages and related production equipment used in the production, gathering and transportation of natural gas. Natural gas compression is a mechanical process whereby the pressure of a volume of natural gas is increased to a desired higher pressure for transportation from one point to another, and is essential to the production and transportation of natural gas. Compression is typically required several times during the natural gas production and transportation cycle, including: (a) at the wellhead; (b) throughout gathering and distribution systems; (c) into and out of processing and storage facilities; and (d) along intrastate and interstate pipelines. We design, engineer, fabricate, sell and install natural gas compression units and accessories and equipment used in the production, treating and processing of natural gas and crude oil. As of March 31, 2012, we had the capacity to manufacture up to 150 compressor units per quarter, or a maximum of 85,000 horsepower in the aggregate per quarter. We recently expanded our manufacturing facility, adding approximately 39,000 square feet, bringing the total square footage to 134,000, which has allowed us to double our compressor unit manufacturing capacity in 2012 from our capacity capabilities in most of 2011.
Customers and Competition
The markets in which we operate are highly competitive. Because substantially all of our operations are performed for Chesapeake and its partners, we do not currently face significant competition for our services. We are, however, affected by competition, as Chesapeake pays us market-based rates for the services and products we provide. To the extent that competitive conditions increase and prices for the services and products we provide decrease, we may be required to charge Chesapeake less for such products and services.
In the future, we may face competition to the extent we decide to diversify our customer base. We currently anticipate that our competitors in each of our operating segments and other operations would include:
| Ÿ | Drilling—Helmerich & Payne, Inc., Patterson-UTI Energy, Inc., Trinidad Drilling Ltd., Nabors Industries Ltd., Pioneer Drilling Company, Precision Drilling Corporation and a significant number of other competitors with national, regional or local rig operations; |
| Ÿ | Hydraulic Fracturing—Halliburton Company, Schlumberger Limited, Baker Hughes Incorporated, FTS International, Inc. and several other competitors with national, regional or local hydraulic fracturing operations; |
| Ÿ | Oilfield Rentals—Key Energy Services, Inc., RPC, Inc., Oil States International, Inc., Baker Oil Tools, Weatherford International, Basic Energy Services, Superior Energy Services, Quail Tools (owned by Parker Drilling Company), Knight Oil Tools and several other competitors with national, regional or local tool rental operations; |
| Ÿ | Oilfield Trucking—Basic Energy Services, Inc., Key Energy Services, Inc., Superior Energy Services and several other competitors with national, regional or local trucking operations; and |
94
Table of Contents
Index to Financial Statements
| Ÿ | Other Operations—Cameron International Corporation, Exterran Partners, L.P. and several other competitors with national, regional or local natural gas compressor manufacturing operations. |
Suppliers
We purchase a wide variety of raw materials, parts and components that are made by other manufacturers and suppliers for our use. We are not dependent on any single source of supply for those parts, supplies or materials.
For our drilling rigs, we generally purchase individual components from reputable original equipment manufacturers and then assemble and commission the rigs ourselves at an internal facility, which we believe results in cost savings and higher quality. Occasionally, we may purchase a full rig package from an outside vendor if such package provides technical and commercial advantages over our in-house approach.
We have purchased the majority of our hydraulic fracturing units from FTS International and United Engines. We currently have an agreement with FTS International for a delivery of 80 additional pumping units in 2012. We purchase the raw materials we use in our hydraulic fracturing operations, such as sand, chemicals and diesel fuel, from a variety of suppliers throughout the U.S.
To date, we have generally been able to obtain on a timely basis the equipment, parts and supplies necessary to support our operations. Where we currently source materials from one supplier, we believe that we will be able to make satisfactory alternative arrangements in the event of interruption of supply. However, given the limited number of suppliers of certain of our raw materials, we may not always be able to make alternative arrangements should one of our supplier’s fail to deliver or timely deliver our materials.
Related Party Agreements
We are a party to a master services agreement and services agreement with Chesapeake. The master services agreement governs the performance of services and/or the supply of materials or equipment to Chesapeake, the specifics of which are handled under separate field tickets or purchase or work orders. Under the services agreement, which is subject to the terms of the master services agreement, Chesapeake has agreed to operate a minimum number of our rigs and to utilize our hydraulic fracturing equipment for a minimum number of fracturing stages per month. The field tickets and work and purchase orders with Chesapeake are substantially similar to those in prevailing industry contracts, specifically as they relate to pricing, liabilities and payment terms.
In addition to the foregoing agreements, we and Chesapeake have entered into various other agreements, including an administrative services agreement, that we entered into in the context of an affiliated relationship.
For a more comprehensive discussion concerning the master services agreement, the services agreement and the other agreements that we have entered into, or anticipate entering into, with Chesapeake and certain of its affiliates, please see “Certain Relationships and Related Party Transactions.”
95
Table of Contents
Index to Financial Statements
Employees
At every level of our operations, our employees are critical to our success and committed to operational excellence. Our senior management team has extensive experience building, acquiring and managing oilfield service and other assets. Their focus is on optimizing our business and expanding operations. On an operations level, our supervisory and field personnel are empowered with the training, tools and confidence required to succeed in their jobs.
As of March 31, 2012, we employed approximately 5,500 people. None of these employees are covered by collective bargaining agreements and we and Chesapeake consider our relationships with our employees to be good.
Properties
We conduct our operations out of a number of field offices, yards, shops, terminals and other facilities located in North Dakota, Oklahoma, Ohio, Pennsylvania, Texas and West Virginia. Each of these facilities is leased from Chesapeake pursuant to our facilities lease agreement or from a third party. We do not believe that any one of these facilities is individually material to our operations.
Risk Management and Insurance
The oilfield services business involves a variety of operating risks, including the risk of fire, explosions, blow-outs, pipe failure, abnormally pressured formations and environmental hazards such as oil spills, natural gas leaks, ruptures or discharges of toxic gases. If any of these should occur, we could incur legal defense costs and could suffer substantial losses due to injury or loss of life, severe damage to or destruction of property, natural resources and equipment, pollution or other environmental damage, clean-up responsibilities, regulatory investigation and penalties, and suspension of operations. Our horizontal and deep drilling activities involve greater risk of mechanical problems than vertical and shallow drilling operations.
We maintain policies of insurance that we believe are customary in the industry with customary deductibles or self-insured retentions and there are no assurances that this insurance will be adequate to cover all losses or exposure to liability. We carry a $425.0 million comprehensive general liability umbrella policy and a $150.0 million pollution liability policy. We provide workers’ compensation insurance coverage to employees in all states in which we operate. While we believe these policies are customary in the industry, they do not provide complete coverage against all operating risks. In addition, our insurance does not cover penalties or fines that may be assessed by a governmental authority. A loss not fully covered by insurance could have a material adverse effect on our financial position, results of operations and cash flows. Moreover, these policies also cover properties and operations of Chesapeake unrelated to our properties or operations. To the extent proceeds from such policies are used to cover losses in Chesapeake’s other operations, such coverage may not be available to cover losses relating to our operations. The insurance coverage that we maintain may not be sufficient to cover every claim made against us or may not be commercially available for purchase in the future. Also, in the past, insurance rates have been subject to wide fluctuation, and changes in coverage could result in less coverage, increases in cost or higher deductibles and self-insured retentions.
Our master services agreement with Chesapeake includes certain indemnification provisions for losses resulting from operations. Generally, we take responsibility for our own people and property while Chesapeake takes responsibility for its own people, property and liabilities related to the well and subsurface operations, regardless of either party’s negligence. For example, our master services
96
Table of Contents
Index to Financial Statements
agreement provides that Chesapeake assume liability for (a) damage to the hole, including the cost to re-drill; (b) damages or claims arising from loss of control of a well or a blowout; (c) damage to the reservoir, geological formation or underground strata; (d) damages arising from the use of radioactive tools or any contamination resulting therefrom; (e) damages arising from pollution or contamination (other than surface spills attributable to our negligence); (f) damages arising from damage to, or escape of any substance from, any pipeline, vessel or storage or production facility; and (g) allegations of subsurface trespass.
In general, any material limitations on indemnifications to us from Chesapeake in support of this allocation of responsibility arise only by applicable state laws or public policy. Certain states such as Texas, Louisiana, Wyoming, and New Mexico have enacted oil and natural gas specific statutes that void any indemnity agreement that attempts to relieve a party from liability resulting from its own negligence. These statutes can void the allocation of liability agreed to in a contract. We believe, however, that our master services agreement is structured so that any limitations on the indemnification obligations of Chesapeake should not have a material impact on the terms of the agreement.
Safety and Maintenance
Our business involves the operation of heavy and powerful equipment which can result in serious injuries to our employees and third parties and/or substantial damage to property and/or environmental harm. We have comprehensive environmental, health, and safety (EHS) and training programs designed to reduce accidents in the workplace and improve the efficiency of our operations. In addition, our largest customer, Chesapeake, places great emphasis on EHS and quality management programs of its contractors. We believe that these factors will gain further importance in the future. We have directed substantial resources toward employee EHS and quality management training programs as well as our employee review process and have benefitted from steadily decreasing incident frequencies and severity.
Regulation of Operations
We operate under the jurisdiction of a number of regulatory bodies that regulate worker safety standards, the handling of hazardous materials, the transportation of explosives, the protection of the environment and driving standards of operation. Regulations concerning equipment certification create an ongoing need for regular maintenance that is incorporated into our daily operating procedures. The oil and natural gas industry is subject to environmental regulation pursuant to local, state and federal legislation.
Among the services we provide, we operate as a motor carrier and therefore are subject to regulation by the U.S. Department of Transportation and by various state agencies. These regulatory authorities exercise broad powers, governing activities such as the authorization to engage in motor carrier operations and regulatory safety, financial reporting and certain mergers, consolidations and acquisitions. There are additional regulations specifically relating to the trucking industry, including testing and specification of equipment and product handling requirements. The trucking industry is subject to possible regulatory and legislative changes that may affect the economics of the industry by requiring changes in operating practices or by changing the demand for common or contract carrier services or the cost of providing truckload services. Some of these possible changes include increasingly stringent environmental regulations, changes in the hours of service regulations that govern the amount of time a driver may drive in any specific period, onboard black box recorder devices or limits on vehicle weight and size.
97
Table of Contents
Index to Financial Statements
Interstate motor carrier operations are subject to safety requirements prescribed by the U.S. Department of Transportation. To a large degree, intrastate motor carrier operations are subject to safety regulations that mirror federal regulations. Such matters as weight and dimension of equipment are also subject to federal and state regulations. Department of Transportation regulations mandate drug testing of drivers.
From time to time, various legislative proposals are introduced, including proposals to increase federal, state, or local taxes, including taxes on motor fuels, which may increase our costs or adversely impact the recruitment of drivers. We cannot predict whether, or in what form, any increase in such taxes applicable to us will be enacted.
Environmental Matters
Our operations are subject to various federal, state and local environmental, health and safety laws and regulations pertaining to the release, emission or discharge of materials into the environment, the generation, storage, transportation, handling and disposal of materials (including solid and hazardous wastes), the safety of employees, or otherwise relating to pollution, preservation, remediation or protection of human health and safety, natural resources, wildlife or the environment. Federal environmental, health and safety laws that govern our operations include the Comprehensive Environmental Response, Compensation, and Liability Act, or CERCLA, the Clean Water Act, the Safe Drinking Water Act, the Clean Air Act, the Resource Conservation and Recovery Act, or RCRA, the Endangered Species Act, the Migratory Bird Treaty Act, and the regulations promulgated pursuant to such laws.
Federal laws, including CERCLA and analogous state laws, impose joint and several liability, without regard to fault or legality of the original conduct, on classes of persons who are considered responsible for releases of a hazardous substance into the environment. These persons include the current or former owner or operator of the site where the release occurred and persons that generated, disposed of or arranged for the disposal of hazardous substances at the site. CERCLA and analogous state laws also authorize the EPA, state environmental agencies and, in some cases, third parties to take action to mitigate, prevent or respond to threats to human health or the environment and to seek to recover the costs of such actions from responsible classes of persons.
Other federal and state laws, in particular RCRA, regulate hazardous and non-hazardous wastes. In the course of our operations, we generate petroleum hydrocarbon wastes and other maintenance wastes. We believe we are in material compliance with all regulations regarding the handling of wastes from our operations. Some of our wastes are not currently classified as hazardous wastes, but may in the future be designated as hazardous wastes and may thus become subject to more rigorous and costly compliance and disposal requirements. Such additional regulation could have a material adverse effect on our business.
We lease a number of properties that have been used as service yards in support of oil and natural gas exploration and production activities. Although we utilized operating and disposal practices that we considered to be standard in the industry at the time, repair and maintenance activities on rigs and equipment stored in these service yards may have resulted in the disposal or release of hydrocarbons or other wastes at or from these yards or at or from other locations where these wastes have been taken for treatment, storage or disposal. In addition, we lease properties that in the past were operated by third parties whose operations were not under our control. These properties and the hydrocarbons or hazardous substances handled thereon may be subject to CERCLA, RCRA and analogous state laws. Under these type of laws, we could be required to remove or remediate previously released hazardous substances, wastes or property contamination.
98
Table of Contents
Index to Financial Statements
Our operations are subject to the federal Clean Air Act and comparable state laws and regulations. These laws and regulations regulate emissions of air pollutants from various industrial sources, including our non-road mobile engines, and impose various monitoring and reporting requirements. The EPA has published proposed New Source Performance Standards (NSPS) and National Emissions Standards for Hazardous Air Pollutants (NESHAP) that, if adopted as proposed, would amend existing NSPS and NESHAP standards for oil and gas facilities, as well as create new NSPS standards for oil and gas production, transmission and distribution facilities. Compliance with the increasingly stringent emissions regulations may result in increased costs as we continue to grow. Federal and state regulatory agencies can impose administrative, civil and criminal penalties for non-compliance with air permits or other requirements of the federal Clean Air Act and associated state laws and regulations.
We also seek to manage environmental liability risks through provisions in our contracts with our customers that allocate risks relating to surface activities associated with the fracturing process to us and risks relating to “down-hole” liabilities to our customers. Our contracts generally require our customers to indemnify us against pollution and environmental damages originating below the surface of the ground or arising out of water disposal, or otherwise caused by the customer, other contractors or other third parties. In turn, our contracts generally require us to indemnify our customers for pollution and environmental damages originating at or above the surface caused solely by us. We seek to maintain consistent risk-allocation and indemnification provisions in our customer agreements to the greatest extent possible. Some of our contracts may, however, contain less explicit indemnification provisions, which would typically provide that each party will indemnify the other against liabilities to third parties resulting from the indemnifying party’s actions, except to the extent such liability results from the indemnified party’s gross negligence, willful misconduct or intentional act.
Federal and state occupational safety and health laws require us to organize and maintain information about hazardous materials used, released or produced in our operations. Certain portions of this information must be provided to employees, state and local governmental authorities and local citizens. We are also subject to the requirements and reporting set forth in federal workplace standards.
We have made and will continue to make expenditures to comply with environmental, health and safety regulations and requirements. These are necessary business costs in the oilfield services industry. Although we are not fully insured against all environmental, health and safety risks, and our insurance does not cover any penalties or fines that may be issued by a governmental authority, we maintain insurance coverage which we believe is customary in the industry. Moreover, it is possible that other developments, such as stricter and more comprehensive environmental, health and safety laws and regulations, as well as claims for damages to property or persons, resulting from company operations, could result in substantial costs and liabilities, including administrative, civil and criminal penalties, to us. We believe that we are in material compliance with applicable environmental, health and safety laws and regulations. We believe that the cost of maintaining compliance with these law and regulations will not have a material adverse effect on our business, financial position and results of operation, but new or more stringent regulations could increase the cost of doing business and could have a material adverse effect on our business. Moreover, accidental releases or spills may occur in the course of our operations, causing us to incur significant costs and liabilities, including for third-party claims for damage to property and natural resources or personal injury.
Hydraulic Fracturing. Vast quantities of oil, natural gas liquids and natural gas deposits exist in deep shale and other formations. It is customary in our industry to recover oil, natural gas liquids and natural gas from these deep shale formations through the use of hydraulic fracturing, combined with sophisticated horizontal drilling. Hydraulic fracturing is the process of creating or expanding cracks, or fractures, in formations underground where water, sand and other additives are pumped under high
99
Table of Contents
Index to Financial Statements
pressure into the formation. These formations are generally geologically separated and isolated from fresh ground water supplies by protective rock layers.
Legislative, regulatory and enforcement efforts at the federal level and in some states have been initiated to require or make more stringent the permitting and compliance requirements for our oilfield services, including hydraulic fracturing. Hydraulic fracturing is typically regulated by state oil and gas commissions. However, the EPA recently asserted federal regulatory authority over hydraulic fracturing involving diesel fuels under the Safe Drinking Water Act’s Underground Injection Control Program and has begun the process of drafting guidance documents for permitting authorities and the industry on the process for obtaining a permit for hydraulic fracturing involving diesel fuel. Industry groups have filed suit challenging the EPA’s assertion of authority as improper rule making. The EPA also has commenced a study of the potential environmental impacts of hydraulic fracturing activities, with results of the study anticipated to be available by late 2012. The results of the EPA’s guidance, including its definition of diesel fuel, the related litigation, the EPA’s study, and other analyses by federal and state agencies to assess the impacts of hydraulic fracturing could each spur further action towards federal legislation and regulation of hydraulic fracturing activities.
Also, for the second consecutive session, legislation has been introduced in Congress to provide for federal regulation of hydraulic fracturing and to require disclosure of the chemicals used in the fracturing process. At this time, it is not possible to estimate the potential impact on our business of these state actions or the enactment of additional federal or state legislation or regulations affecting hydraulic fracturing. In addition, there is a growing trend among states that require us to provide information about the chemicals and products we maintain on location and use during hydraulic fracturing activities. Many of these laws and regulations require that we disclose information about the chemicals and products, including, in some instances, confidential and/or proprietary information. In certain cases, these chemicals and products are manufactured and/or imported by third parties and we therefore must rely upon such third parties for such information. Compliance or the consequences of any failure to comply by us could have a material adverse effect on our business, financial condition and operational results.
Climate Change. Various state governments and regional organizations comprising state governments are considering enacting new legislation and promulgating new regulations governing or restricting the emission of greenhouse gases from sources such as our equipment and operations. Legislative and regulatory proposals for restricting greenhouse gas emissions or otherwise addressing climate change could require us to incur additional operating costs and could adversely affect the oil and natural gas industry and, therefore, could reduce the demand for our products and services. The potential increase in our operating costs could include new or increased costs to obtain permits, operate and maintain our equipment and facilities, install new emission controls on our equipment and facilities, acquire allowances to authorize our greenhouse gas emissions, pay taxes related to our greenhouse gas emissions and administer and manage a greenhouse gas emissions program. Moreover, incentives to conserve energy or use alternative energy sources could reduce demand for oil, natural gas liquids and natural gas. The EPA and the National Highway Traffic Safety Administration recently announced their intent to propose coordinated rules to regulate greenhouse gas emissions from heavy-duty engines and vehicles, and light-duty vehicles. Proposed rules have not been issued. Even without federal legislation or regulation of greenhouse gas emissions, states may pursue the issue either directly or indirectly. Restrictions on emissions of methane or carbon dioxide that may be imposed in various states could adversely affect the oil and natural gas industry and, therefore, could reduce the demand for our products and services.
100
Table of Contents
Index to Financial Statements
Cyclical Nature of Industry
We operate in a highly cyclical industry. The main factor influencing demand for oilfield services is the level of drilling activity by E&P companies, which in turn depends largely on current and anticipated future crude oil and natural gas prices and production depletion rates. The most critical factor in assessing the outlook for the industry is the worldwide supply and demand for oil and the domestic supply and demand for natural gas. Demand for oil and natural gas is cyclical and is subject to large and rapid fluctuations. This is primarily because the industry is driven by commodity demand and corresponding price increases. When oil and natural gas price increases occur, producers increase their capital expenditures, which generally results in greater revenues and profits for oilfield service companies. The increased capital expenditures also ultimately result in greater production, which historically has resulted in increased supplies and reduced prices that, in turn, tends to reduce demand for oilfield services. For these reasons, our results of operations may fluctuate from quarter to quarter and from year to year, and these fluctuations may distort period-to-period comparisons of our results of operations.
Legal Proceedings
We are subject to various legal proceedings and claims arising in the ordinary course of our business. Our management does not expect the outcome of any of these known legal proceedings, individually or collectively, to have a material adverse effect on our financial condition or results of operations.
101
Table of Contents
Index to Financial Statements
Directors, Executive Officers and Significant Employees
The following table sets forth information about our executive officers, certain significant employees and our directors. Presently, each of the persons listed as an executive officer in the table below serves in a corresponding position with COS LLC and COO. There are no family relationships among any of our executive officers.
| Name |
Age | Position | ||||
| Jerry L. Winchester |
53 | Director and Chief Executive Officer | ||||
| Cary D. Baetz |
47 | Chief Financial Officer | ||||
| James G. (“Jay”) Minmier |
47 | President—Nomac Drilling, L.L.C. | ||||
| William R. (“Bill”) Stanger |
58 | President—Performance Technologies, L.L.C. | ||||
| Zachary M. (“Zac”) Graves |
36 | President—Thunder Oilfield Services, L.L.C. | ||||
| Alan D. (“Al”) Lavenue |
51 | President—Compass Manufacturing, L.L.C. | ||||
| Aubrey K. McClendon |
52 | Director | ||||
| Steven C. (“Steve”) Dixon |
53 | Director | ||||
| Domenic J. (“Nick”) Dell’Osso, Jr |
35 | Director | ||||
| Director | ||||||
| Director | ||||||
| Director | ||||||
Jerry L. Winchester, 53, has served as our Chief Executive Officer since September 2011. From November 2010 to September 2011, Mr. Winchester served as the Vice President—Boots & Coots of Halliburton. From July 2002 to September 2010, Mr. Winchester served as the President and Chief Executive Officer of Boots & Coots International Well Control, Inc. (“Boots & Coots”), an NYSE-listed oilfield services company specializing in providing integrated pressure control and related services. In addition, from 1998 until September 2010, Mr. Winchester served as a director of Boots & Coots and from 1998 until May 2008, served as Chief Operating Officer of Boots & Coots. Mr. Winchester started his career with Halliburton in 1981 and received a Bachelor of Science degree from Oklahoma State University.
Cary D. Baetz, 47, has served as our Chief Financial Officer since January 2012. From November 2010 to December 2011, Mr. Baetz served as Senior Vice President and Chief Financial Officer of Atrium Companies, Inc. and, from August 2008 to September 2010, served with Mr. Winchester as Chief Financial Officer of Boots & Coots. From 2005 to 2008, Mr. Baetz served as Vice President of Finance, Treasurer and Assistant Secretary of Chaparral Steel Company. Prior to joining Chaparral, Mr. Baetz had been employed since 1996 with Chaparral’s parent company, Texas Industries Inc. From 2002 to 2005, he served as Director of Corporate Finance of Texas Industries Inc. Mr. Baetz received a Bachelor of Science degree from Oklahoma State University and a Master of Business Administration degree from the University of Arkansas.
James G. (“Jay”) Minmier, 47, has served as President of Nomac Drilling, L.L.C., which operates our drilling segment, since June 2011. Prior to joining our company, from August 2005 to June 2011, Mr. Minmier served as Vice President and General Manager for Precision Drilling Corporation. Mr. Minmier has more than twenty years experience with drilling contractors, notably Grey Wolf Inc. and Helmerich & Payne, Inc. Mr. Minmier received a Bachelor of Science degree from the University of Texas at Arlington and a Master of Business Administration degree from the University of West Florida.
William R. (“Bill”) Stanger, 58, has served as the President of Performance Technologies, L.L.C., which operates our hydraulic fracturing segment, since January 2011. Mr. Stanger joined Chesapeake in January 2010 as President of Great Plains Oilfield Rentals, L.L.C. Prior to joining Chesapeake, from
102
Table of Contents
Index to Financial Statements
1987 to January 2010, Mr. Stanger served in various domestic and international management capacities with Schlumberger Limited, including Well Services Vice President of Operations North America and Well Services Vice President of Global Sales. Mr. Stanger received a Bachelor of Science degree from the University of Tulsa.
Zachary M. (“Zac”) Graves, 36, has served as President of Thunder Oilfield Services, L.L.C., which includes Great Plains Oilfield Rental, L.L.C., Hodges Trucking Company, L.L.C. and Oilfield Trucking Solutions, L.L.C., since June 2011. Prior to joining our company, from April 2003 to June 2011, Mr. Graves served in various capacities at Bronco Drilling Company, Inc., including as its Executive Vice President of Operations and Chief Financial Officer. Mr. Graves received a Bachelor of Business Administration degree from the University of Oklahoma.
Alan D. (“Al”) Lavenue, 51, has served as President of Compass Manufacturing, L.L.C., which operates our manufacturing segment, since its formation in 2007. Mr. Lavenue has also served as the President of MidCon Compression, L.L.C., a wholly owned subsidiary of Chesapeake providing natural gas compression rental and related compression services to Chesapeake and its affiliates, since April 2006. Mr. Lavenue joined Chesapeake in September 2003 as General Manager of Midcon Compression. Before joining Chesapeake, Mr. Lavenue served as the Vice President of Sales for Hanover Compressor Company from April 1995 through September 2003. Mr. Lavenue holds a Bachelor of Science degree from Texas A&M University.
Aubrey K. McClendon, 52, has served as Chairman of the Board, Chief Executive Officer and a director of Chesapeake since co-founding Chesapeake in 1989. We believe that Mr. McClendon’s extensive energy industry background and relationship with Chesapeake, particularly his leadership skills in serving as Chairman of the Board and Chief Executive Officer of Chesapeake and his instrumental role in the formulation and promotion of national and local initiatives that promote U.S natural gas as the best solution for our nation’s future energy needs, bring important experience and skill to the board. Mr. McClendon has also served as a director of the general partner of Chesapeake Midstream Partners, L.P. (NYSE:CHKM) since 2010. From 1982 to 1989, Mr. McClendon was an independent producer of oil and natural gas. Mr. McClendon graduated from Duke University in 1981.
Steven C. (“Steve”) Dixon, 53, has served as Executive Vice President—Operations and Geosciences and Chief Operating Officer of Chesapeake since February 2010. Mr. Dixon served as Executive Vice President—Operations and Chief Operating Officer of Chesapeake from 2006 to February 2010 and as Senior Vice President—Production of Chesapeake from 1995 to 2006. He also served as Vice President—Exploration of Chesapeake from 1991 to 1995. Mr. Dixon was a self-employed geological consultant in Wichita, Kansas from 1983 through 1990. He was employed by Beren Corporation in Wichita, Kansas from 1980 to 1983 as a geologist. Mr. Dixon graduated from the University of Kansas in 1980.
Domenic J. (“Nick”) Dell’Osso, Jr., 35, has served as Executive Vice President and Chief Financial Officer of Chesapeake since November 2010. Mr. Dell’Osso has also served as a director of the general partner of Chesapeake Midstream Partners, L.P. (NYSE:CHKM) since June 2011. Mr. Dell’Osso served as Vice President—Finance of Chesapeake and Chief Financial Officer of Chesapeake’s wholly owned midstream subsidiary, Chesapeake Midstream Development, L.P., from August 2008 to November 2010. Prior to joining Chesapeake, Mr. Dell’Osso was an energy investment banker with Jefferies & Co. from 2006 to August 2008 and Banc of America Securities from 2004 to 2006. Mr. Dell’Osso graduated from Boston College in 1998 and received a Master of Business Administration degree from the University of Texas at Austin in 2003.
103
Table of Contents
Index to Financial Statements
Board of Directors
Our certificate of incorporation and bylaws will provide that the Board of Directors shall consist of not less than directors, nor more than directors, and the number of directors may be changed only by resolution of the Board of Directors. Our directors will be elected annually to serve until the next meeting of shareholders or until their successors are duly elected and qualified. Upon completion of this offering, we anticipate that we will have directors: Messrs. Dell’Osso, Dixon, McClendon, Winchester, , and .
Initially, our Board of Directors will consist of a single class of directors, each serving one year terms. We expect that our certificate of incorporation will provide that our Board of Directors will become a classified board, divided into three classes of directors, with each class as nearly equal in number as possible, serving staggered three year terms (other than directors which may be elected by holders of preferred stock, if any) upon the earlier of (a) such time as Chesapeake no longer beneficially owns at least a majority of the combined voting power of all of our outstanding common stock and (b) such time as we have 1,000 or more holders of record of our common stock.
Based upon the listing standards of the NYSE and SEC regulations, we anticipate that our Board of Directors will determine that Messrs. , and are “independent” under the standards of the NYSE. Although we have not established any specific objective criteria for service on our board, we anticipate that we will offer positions on our Board of Directors to persons who have significant experience relevant to companies in our industry and other qualifications that the existing members of our board believe will enable such persons to make significant contributions to our company. In addition, we will seek to identify candidates to fill the positions who meet the requirements for service on our Audit Committee, as described below.
Corporate Governance Guidelines and Board Matters
Upon completion of this offering, we will be a “controlled company” under the NYSE corporate governance rules for so long as Chesapeake owns more than 50% of the combined voting power of our common stock after the completion of this offering. As a result, we will be eligible for exemptions from provisions of the NYSE corporate governance standards, including (a) the requirement that a majority of the Board of Directors consist of independent directors, (b) the requirement that we have a nominating and corporate governance committee that is composed entirely of independent directors with a written charter addressing the committee’s purpose and responsibilities, (c) the requirement that we have a compensation committee that is composed entirely of independent directors with a written charter addressing the committee’s purpose and responsibilities and (d) the requirement that there be an annual performance evaluation of the corporate governance and compensation committees.
Following this offering, we intend to utilize these exemptions. As a result, we will not be required to have a majority of independent directors nor will we have nominating and corporate governance and compensation committees. Accordingly, you will not have the same protections afforded to shareholders of companies that are subject to all of the NYSE corporate governance requirements. In the event that we cease to be a controlled company within the meaning of these rules, we will be required to comply with these provisions within the transition periods specified in the NYSE corporate governance rules.
Committees of the Board of Directors
Prior to the closing of this offering, our Board of Directors will establish an Audit Committee and may establish such other committees as the Board of Directors may determine from time to time.
104
Table of Contents
Index to Financial Statements
Audit Committee
We anticipate that the initial members of our Audit Committee will be Messrs. , and , each of whom is independent and financially literate. We anticipate that Mr. will be the Chairman of the committee, and he is an “audit committee financial expert” as described in Item 407(d)(5) of Regulation S-K. Our Audit Committee will be authorized to assist the board in overseeing the integrity of our financial statements, the qualifications and independence of our independent auditor, the performance of our independent auditor and internal auditors, our compliance with legal and regulatory requirements, our risk exposures and the other responsibilities set forth in its charter.
Specifically, the Audit Committee will also be authorized to:
| Ÿ | appoint, retain or replace the independent auditor to conduct the annual audit of our consolidated financial statements; |
| Ÿ | review the proposed scope and results of the audit; |
| Ÿ | review and pre-approve the independent auditors’ audit and non-audit services rendered; |
| Ÿ | approve the audit fees to be paid; |
| Ÿ | review accounting and financial controls with the independent auditors and our financial and accounting staff; |
| Ÿ | establish procedures for complaints received by us regarding accounting or auditing matters; |
| Ÿ | oversee internal audit functions; and |
| Ÿ | prepare the report of the Audit Committee that SEC rules require to be included in our annual meeting proxy statement. |
Code of Business Conduct and Ethics
Our Board of Directors will adopt a code of business conduct and ethics applicable to our employees, directors and officers, in accordance with applicable U.S. federal securities laws and the corporate governance rules of the NYSE. Any waiver of this code may be made only by our Board of Directors and will be promptly disclosed as required by applicable U.S. federal securities laws and the corporate governance rules of the NYSE.
Director Compensation
We were incorporated in April 2012 and, thus, did not have any directors or pay compensation to any directors in 2011. We believe that attracting and retaining qualified non-employee directors will be critical to our future growth. Following this offering, our non-employee directors are expected to receive compensation that is commensurate with the compensation that is offered to directors of companies that are similar to ours. We have not nor do we expect to compensate directors that are employees of us or Chesapeake for their service on our Board of Directors. We expect to reimburse our directors for reasonable out-of-pocket expenses that they incur in connection with their service as directors, in accordance with our general expense reimbursement policies.
105
Table of Contents
Index to Financial Statements
CERTAIN RELATIONSHIPS AND RELATED PARTY TRANSACTIONS
Relationship with Chesapeake
Prior to the consummation of this offering, COS LLC was a wholly owned subsidiary of Chesapeake. Following this offering and for the foreseeable future thereafter, Chesapeake will own a substantial majority of the combined voting power of our outstanding common stock and will have the ability influence or control all matters affecting our business.
We are entering into several agreements with Chesapeake in connection with this offering, including a tax receivable agreement, an amended and restated operating agreement of COS LLC and a registration rights agreement. Summaries of those agreements appear below.
Additionally, in connection with the establishment of COS LLC’s business in October 2011, COS LLC and COO entered into several agreements with Chesapeake, which are described below in “—Prior Transactions with Chesapeake.”
Offering Related Agreements with Chesapeake
Tax Receivable Agreement
As described in “Organizational Structure—Offering Transactions,” we intend to use substantially all of the net proceeds from this offering to acquire newly-issued Class A units from COS LLC. In addition, as described in “Use of Proceeds,” we intend to cause COS LLC to distribute a portion of such net proceeds to Chesapeake. Following this offering, Chesapeake may exchange its Class B units of COS LLC for shares of our Class A common stock on a one-for-one basis. The acquisition of newly-issued Class A units, the distribution to Chesapeake of a portion of the net proceeds of this offering and future exchanges of Class B units in COS LLC for Class A common stock are expected to result in an increase in the tax basis of the assets of COS LLC and additional deductions allocated to us. In addition, recent acquisitions by us have resulted in an increase, at the time of such acquisition, in the tax basis of the assets acquired. These increases in tax basis and additional deductions may reduce the amount of tax that we would otherwise be required to pay in the future.
We will enter into a tax receivable agreement with Chesapeake that will require us to pay Chesapeake 85% of the amount of tax benefits, that we realize (or we are deemed to realize, in the case of an early termination payment by us, or a change of control, as discussed below) as a result of (a) the increase in tax basis in the assets of COS LLC that arose from certain recent acquisitions by us; (b) any tax basis increase resulting from COS LLC’s distribution of offering proceeds by COS LLC to Chesapeake; (c) the tax basis increases resulting from exchanges by Chesapeake of its Class B units of COS LLC for shares of our Class A common stock; (d) additional deductions allocated to us pursuant to Section 704(c) of the Code to reflect the difference between the fair market value and the adjusted tax basis of COS LLC’s assets as of the date of this offering and (e) imputed interest deemed to be paid by us as a result of, and additional tax basis arising from, payments under the tax receivable agreement. We expect to benefit from the remaining 15% of cash savings, if any, realized.
For purposes of the tax receivable agreement, tax benefits will be computed by comparing our actual income tax liability to the amount of such taxes that we would have been required to pay had the tax basis increases and additional deductions listed in the prior paragraph not been available to us. The term of the tax receivable agreement will commence upon consummation of this offering and will continue until all such tax benefits have been utilized or expired, unless we exercise our right to terminate the tax receivable agreement for an amount based on an agreed-upon value of payments remaining to be made under the agreement.
106
Table of Contents
Index to Financial Statements
We will record amounts payable under the tax receivable agreement as a liability in our consolidated financial statements, which liability will be increased upon the exchanges by Chesapeake of Class B units of COS LLC for shares of our Class A common stock by an amount equal to 85% of the estimated future tax benefits, if any, relating to the increase in tax basis associated with any such exchanges. Estimating the amount of payments that we may be required to make under the tax receivable agreement is imprecise by its nature, because the actual increase in our share of the tax basis, as well as the amount and timing of any payments under the tax receivable agreement, will vary depending upon a number of factors, including:
| Ÿ | the timing of exchanges by Chesapeake—for instance, the increase in any tax deductions will vary depending on the fair market value, which may fluctuate over time, of the depreciable and amortizable assets of COS LLC at the time of the exchanges; |
| Ÿ | the market price of our Class A common stock at the time of exchanges by Chesapeake—the increase in our share of the basis in the assets of COS LLC, as well as the increase in any tax deductions, will be related to the market price of our Class A common stock at the time of these exchanges; |
| Ÿ | the extent to which these exchanges are taxable—if an exchange is not taxable for any reason (for instance, if Chesapeake exchanges Class B units of COS LLC in order to make a charitable contribution), increased deductions will not be available; |
| Ÿ | the tax rates in effect at the time we utilize the increased amortization and depreciation deductions; and |
| Ÿ | the amount and timing of our income—we will be required to pay 85% of the tax savings, as and when realized, if any. If we do not have taxable income, we generally will not be required to make payments under the tax receivable agreement for that taxable year because no tax savings will have been actually realized. |
We expect that the payments that we make under the tax receivable agreement will be substantial. Assuming no material changes in the relevant tax law, and that we earn sufficient taxable income to realize the full tax benefit of the increased depreciation and amortization of the assets of COS LLC, we expect that future payments under the tax receivable agreement relating to increases in tax basis in the assets that arose from certain recent acquisitions, additional deductions allocated to us to reflect the difference between the fair market value and the adjusted tax basis of COS LLC’s assets as of the date of this offering, any tax basis increase resulting from COS LLC’s distribution to Chesapeake of a portion of the net proceeds of this offering, deductions for interest deemed paid by us and tax basis arising from payments under the tax receivable agreement will aggregate $ million and range from approximately $ million to $ million per year over the next 15 years (or $ million and range from approximately $ million to $ million per year over the next 15 years if the underwriters exercise their option to purchase additional shares of Class A common stock in full) and decline thereafter. Future payments under the tax receivable agreement in respect of subsequent exchanges of Class B units of COS LLC for shares of our Class A common stock will be in addition to these amounts and are expected to be substantial as well.
In addition, the tax receivable agreement provides that, upon certain mergers, asset sales, other forms of business combinations or other changes of control, our (or our successors’) obligations with respect to exchanged or acquired Class B units of COS LLC (whether exchanged or acquired before or after such transaction) would be based on certain assumptions, including that we would have sufficient taxable income to fully utilize the deductions arising from the increased tax deductions and tax basis and other benefits related to entering into the tax receivable agreement.
Decisions made by Chesapeake in the course of running our business, such as with respect to mergers, asset sales, other forms of business combinations or other changes in control, may influence
107
Table of Contents
Index to Financial Statements
the timing and amount of payments that are received by Chesapeake under the tax receivable agreement. For example, the earlier disposition of assets following an exchange or acquisition of Class B Units will generally accelerate payments under the tax receivable agreement and increase the present value of such payments, and the disposition of assets before an exchange or acquisition of Class B Units will increase Chesapeake’s tax liability without giving rise to any rights of Chesapeake to receive payments under the tax receivable agreement.
Payments are generally due under the tax receivable agreement within a specified period of time following the filing of our tax return for the taxable year with respect to which the payment obligation arises, although interest on such payments will begin to accrue from the due date (without extensions) of such tax return. In certain circumstances, we may defer that portion of our payments under the tax receivable agreement that is attributable to increases in tax basis arising from such payments, but only to the extent we do not have available cash to satisfy our payment obligations under the tax receivable agreement. Such deferred payments would accrue interest until the payments are made.
Payments under the tax receivable agreement will be based on the tax reporting positions that we will determine in accordance with such agreement. We will not be reimbursed for any payments previously made to Chesapeake under the tax receivable agreement; however, such payments will be determined based upon the cumulative net tax benefit to us, which would reflect any reduction in tax benefit for any prior period as a result of an audit. As a result, in certain circumstances, we could be required to make payments under the tax receivable agreement in excess of the benefits we actually realize.
Amended and Restated Operating Agreement of COS LLC
In connection with the closing of this offering, the operating agreement of COS LLC will be amended and restated to authorize two classes of units, the Class A units and the Class B units, and to appoint us as the sole managing member of COS LLC. The following is a description of the material terms of COS LLC’s amended and restated operating agreement.
Governance. We will serve as the sole managing member of COS LLC. As such, we will control the business and affairs of COS LLC and be responsible for the management of its business. No other member of COS LLC, in its capacity as such, will have any authority or right to control the management of COS LLC or to bind it in connection with any matter.
Voting and Economic Rights of Members. COS LLC will issue Class A units, which may only be issued to us, as the sole managing member, and Class B units, which may only be issued to Chesapeake. The Class A units and Class B units will have equivalent economic and other rights, except that each Class B unit will be exchangeable for a share of our Class A common stock. When Chesapeake exchanges a Class B unit of COS LLC for a share of our Class A common stock, we will automatically redeem and cancel a corresponding share of our Class B common stock. The Class A units and Class B units will not have any voting rights.
Net profits and net losses and distributions by COS LLC will be allocated and made to us and Chesapeake pro rata in accordance with the respective number of membership units of COS LLC held by us and Chesapeake. COS LLC will agree to make distributions to us and Chesapeake for the purpose of funding tax obligations in respect of income of COS LLC that is allocated to the members of COS LLC. However, COS LLC may not make any distributions to its members if doing so would violate any agreement to which it is then a party or any law then applicable to it, have the effect of rendering it insolvent or result in it having net capital lower than that required by applicable law. Additionally, because all of our operations are conducted through COO and COO’s revolving bank credit facility and
108
Table of Contents
Index to Financial Statements
the indenture governing the 2019 Senior Notes restrict the ability of COO to make distributions to COS LLC, COS LLC may not have any funds available to make distributions to us and Chesapeake in respect of tax obligations.
Coordination of COS Inc. and COS LLC. At any time we issue a share of our Class A common stock for cash, the net proceeds will be promptly transferred to COS LLC, and COS LLC will issue one of its Class A units to us, or, alternatively, we may agree to transfer the net proceeds to Chesapeake in exchange for one Class B Unit of COS LLC, which Class B Unit will be converted automatically into a Class A Unit. If COS LLC issues other classes or series of equity securities, COS LLC will issue an equal amount of equity securities of COS LLC with designations, preferences and other rights and terms that are substantially the same as our newly-issued equity securities. Conversely, if we redeem any shares of our Class A common stock (or our equity securities of other classes or series) for cash, COS LLC will, immediately prior to such redemption, redeem an equal number of Class A units (or its equity securities of the corresponding classes or series) held by us, upon the same terms and for the same price, as the shares of our Class A common stock (or our equity securities of such other classes or series) are redeemed.
Issuances and Transfer of Units. Class A units may only be issued to us, as the managing member of COS LLC, and are non-transferable. Class B units may only be issued to Chesapeake. Class B units may not be transferred without our consent, subject to such conditions as we may specify, except Chesapeake may transfer Class B units to an affiliate or to its shareholders without our consent. Chesapeake may not transfer any Class B units to any person unless Chesapeake transfers an equal number of shares of our Class B common stock to the same transferee.
Exchange Rights. We have reserved for issuance shares of our Class A common stock, which is the aggregate number of shares of Class A common stock expected to be issued over time upon the exchanges by Chesapeake of all Class B units of COS LLC outstanding immediately after this offering. Chesapeake may exchange its Class B units of COS LLC for shares of our Class A common stock at any time.
In connection with exercising its right to exchange Class B units of COS LLC for shares of our Class A common stock, Chesapeake must deliver a corresponding number of shares of our Class B common stock to us for redemption.
Indemnification and Exculpation. To the extent permitted by applicable law, COS LLC will indemnify us, as its managing member, our authorized officers and our other employees and agents from and against any losses, liabilities, damages, costs, expenses, fees or penalties incurred in connection with serving in such capacities, provided that the acts or omissions of these indemnified persons are not the result of fraud, intentional misconduct or a violation of the implied contractual duty of good faith and fair dealing, or any lesser standard of conduct permitted under applicable law.
We, as the managing member of COS LLC, and our authorized officers and other employees and agents will not be liable to COS LLC, its members or their affiliates for damages incurred as a result of any acts or omissions of these persons, provided that the acts or omissions of these exculpated persons are not the result of fraud, intentional misconduct or a violation of the implied contractual duty of good faith and fair dealing, or any lesser standard of conduct permitted under applicable law.
Registration Rights Agreement
We plan to enter into a registration rights agreement with Chesapeake pursuant to which Chesapeake will be entitled to demand registration rights, including the right to demand that a shelf registration statement be filed, and “piggyback” registration rights, for shares of our Class A common
109
Table of Contents
Index to Financial Statements
stock that are issuable upon exchange of Class B units of COS LLC that it owns. In order to exercise its demand for registration, Chesapeake must deliver a written request to us. Until we become eligible to use Form S-3 for a registration of shares of our Class A common stock, Chesapeake will have the right to exercise demand rights for an agreed number of separate registrations. After we become eligible to use Form S-3 for a registration of shares of our Class A common stock, Chesapeake will have the right to exercise demand rights for an additional number of separate registrations, less the number of registrations that were effected prior to such date as a result of the exercise of such demand rights.
We expect that the registration rights agreement will provide that if our Board of Directors determines that it would be in our best interests, we may delay any demand registration for a period not to exceed 90 days, and such deferral may only be made by us once. We further expect it will provide that (a) we are not required to comply with any registration demand unless the anticipated aggregate offering amount equals or exceeds $50.0 million, (b) we will not be required to effect a demand registration within 150 days after the effective date of the registration statement for this offering or 60 days after the effective date of a previous demand registration, other than a shelf registration, and (c) we will not be required to effect more than two demand registrations during the first 12 months the registration rights agreement is effective or more than three demand registrations during any subsequent 12-month period. In addition, Chesapeake will have the right to participate in any public offering of our Class A common stock, other than an offering under a registration statement on Form S-4 or Form S-8 or any other forms not available for registering capital stock for sale to the public, subject to marketing considerations as determined by our managing underwriter for that offering and execution of a lock-up agreement.
We will pay all expenses in connection with any registration under the registration rights agreement, other than underwriters discounts and commissions, and provide customary indemnification. We anticipate that the registration rights described above will begin from the closing date of this offering and will cease to apply to a particular share of Class A common stock after it is, among others, (a) sold pursuant to a registration statement under the Securities Act of 1933; as amended (the “Securities Act”) (b) sold pursuant to Rule 144 under the Securities Act (or any successor provisions) or (c) otherwise transferred under circumstances where the subsequent public distribution of such shares will not require registration or qualification under the Securities Act or any similar state law. The members of our Board of Directors that are directors or officers of Chesapeake may be deemed to beneficially own or control Class B units of COS LLC that Chesapeake owns and may therefore personally benefit from the registration rights agreement. See “Principal Shareholder.”
Prior Transactions with Chesapeake
COS LLC and COO entered into the following transactions with Chesapeake in connection with the establishment of COS LLC’s business in October 2011.
110
Table of Contents
Index to Financial Statements
Master Services Agreement
We are a party to a master services agreement with Chesapeake, pursuant to which we provide drilling and other services and supply materials and equipment to Chesapeake. Drilling services are typically provided pursuant to modified IADC daywork drilling contracts. The specific terms of each request for other services are typically set forth in a field ticket or purchase or work order. The master services agreement contains general terms and provisions, including minimum insurance coverage amounts that we are required to maintain and confidentiality obligations with respect to Chesapeake’s business, and allocates certain operational risks between Chesapeake and us through indemnity provisions. The agreement will remain in effect until we or Chesapeake provide 30 days written notice of termination, although such agreement may not be terminated during the term of the services agreement described below.
We believe that our drilling contracts, field tickets or purchase or work orders with Chesapeake are substantially similar to those in prevailing industry contracts, specifically as they relate to pricing, liabilities and payment terms.
Services Agreement
We are a party to a services agreement with Chesapeake under which Chesapeake guarantees the utilization of a portion of our drilling rig and hydraulic fracturing fleets during the term of the agreement. Chesapeake guarantees that it will operate, on a daywork basis at market-based rates, the lesser of 75 of our drilling rigs or 80% of our operational drilling rig fleet, each referred to as a “committed rig,” subject to ratable reduction for each of our drilling rigs that is operated by a third-party customer. In addition, Chesapeake guarantees that each month it will utilize a number of our operational hydraulic fracturing fleets, up to a maximum of 13 fleets, to complete a minimum aggregate number of fracturing stages equal to 25 stages per month at market-based rates times the average number of our operational hydraulic fracturing fleets during such month, each referred to as a “committed stage,” subject to ratable reduction for each stage that we perform for a third-party customer during such month. In the event Chesapeake does not meet either the drilling commitment or the stage commitment, it will be required to pay us a non-utilization fee. For each day that a committed rig is not operated, Chesapeake must pay us our average daily operating cost for our operating drilling rigs for the preceding 30 days, plus 20%, and in no event less than $6,600 per day. For each committed stage not performed, Chesapeake must pay us $40,000. The services agreement is subject to the terms of our master services agreement with Chesapeake, has a five-year initial term ending October 25, 2016 and will thereafter automatically extend for successive one-year terms unless we or Chesapeake give written notice of termination at least 45 days prior to the end of a term; although Chesapeake has the right to terminate the agreement upon 30 days written notice after a change of control of us. For purposes of the services agreement, a change of control is deemed to have occurred if Chesapeake no longer controls us.
Facilities Lease Agreement
We are a party to a master lease agreement with Chesapeake pursuant to which we lease a number of the yards and other physical facilities out of which we conduct our operations. The initial term of the lease agreement ends December 31, 2014, after which the agreement will automatically renew for successive one-year terms unless we or Chesapeake terminate it. During such evergreen period, the amount of rent charged by Chesapeake will increase by 2.5% each year. We make monthly payments to Chesapeake under the lease agreement in respect of rent and our proportionate share of maintenance, operating expenses, taxes and insurance.
111
Table of Contents
Index to Financial Statements
Drilling Rig Sale-Leaseback Transactions
In a series of transactions since 2006, we sold 93 drilling rigs and related equipment to certain counterparties for an aggregate of $801.8 million and entered into two master lease agreements under which we agreed to lease the rigs from such counterparties for initial terms of five to ten years. In connection with our reorganization in October 2011, we assigned our rights under the master lease agreements to Chesapeake Equipment Finance, L.L.C. (“CEF”), a wholly owned subsidiary of Chesapeake, and entered into a sublease agreement with CEF under which we sublease all of the drilling rigs covered by the master lease agreements. Pursuant to the sublease agreement, we pay the same rent rates to CEF that it pays under the master lease agreements. See “Management’s Discussion and Analysis of Financial Condition and Results of Operations—Contractual Commitments and Obligations.” The sublease will continue as to each drilling rig until the earlier of the expiration date for such rig set forth on an exhibit to the sublease or the applicable master lease agreement is terminated.
We are also a party to a drilling rig repurchase agreement with CEF, which provides that, to the extent CEF has the right to purchase a drilling rig under one of the master lease agreements, we may require CEF to exercise that right, and we will purchase that rig from CEF for a price equal to the greater of the price paid by CEF or the fair market value of the rig. Currently, we believe that the fair value market of drilling rigs is higher than the purchase price CEF would expect to pay under the master lease agreements.
Administrative Services Agreement
Chesapeake provides us with general and administrative services and the services of its employees pursuant to an administrative services agreement. In return for the general and administrative services provided by Chesapeake, we reimburse Chesapeake on a monthly basis for the overhead expenses incurred by Chesapeake on our behalf in accordance with its current allocation policy, which includes actual out-of-pocket fees, costs and expenses incurred in connection with the provision of any of the services under the agreement, including the allocable portion of the wages and benefits of Chesapeake employees who perform services on our behalf.
The administrative services agreement has a five-year initial term ending October 25, 2016 and will thereafter automatically extend for successive one-year terms unless we or Chesapeake give written notice of termination at least one year prior to the end of a term.
Tax Allocation Agreement
COS LLC is a party to a tax allocation agreement with Chesapeake that generally governs Chesapeake’s and COS LLC’s respective rights, responsibilities and obligations with respect to the payment of taxes and the preparation and filing of tax returns. At the time of the offering, however, the current tax allocation arrangement will be modified generally to provide for cash distributions by COS LLC to its unitholders for the payment of taxes due with respect to income earned by COS LLC.
Intercompany Promissory Note
On October 21, 2011, COS, LLC entered into a five-year, $1.5 billion revolving promissory note with Chesapeake. Amounts outstanding under the note bear interest at 6.875% per annum, and interest is payable semi-annually. The note is due on October 1, 2016, but demand for payment of the principal amount plus accrued and unpaid interest may be made by Chesapeake at any time. As of December 31, 2011, the note had an outstanding balance of $371.7 million. The balance of this note will be paid with a portion of the net proceeds of this offering and the note will be cancelled.
112
Table of Contents
Index to Financial Statements
Related Person Transactions Policy
We expect that our Board of Directors will adopt a written related person transactions policy prior to the completion of this offering pursuant to which our Board of Directors or a designated committee thereof will review all material facts of all related party transactions and either approve or disapprove entry into the related party transaction, subject to certain limited exceptions. We expect that such policy will provide that, in determining whether to approve or disapprove entry into a related party transaction, our Board of Directors or such committee shall take into account, among other factors, the following: (a) whether the related party transaction is on terms no less favorable to us than terms generally available to an unaffiliated third party under the same or similar circumstances and (b) the extent of the related party’s interest in the transaction. Further, we expect that such policy will require that all related party transactions required to be disclosed in our filings with the SEC be so disclosed in accordance with applicable laws, rules and regulations.
Under the SEC’s regulations, a “related party transaction” is a transaction, arrangement or relationship in which we or any of our subsidiaries was, is or will be a participant, and which involves an amount exceeding $120,000, and in which any related party had, has or will have a direct or indirect material interest. A “related party” is:
| Ÿ | any person who is, or at any time during the applicable period was, one of our executive officers or one of our directors; |
| Ÿ | any person who is known by us to be the beneficial owner of more than 5% of our Class A common stock or Class B common stock; |
| Ÿ | any immediate family member of any of the foregoing persons, which means any child, stepchild, parent, stepparent, spouse, sibling, mother-in-law, father-in-law, son-in-law, daughter-in-law, brother-in-law or sister-in-law of a director, executive officer or a beneficial owner of more than 5% of our Class A common stock, and any person (other than a tenant or employee) sharing the household of such director, executive officer or beneficial owner of more than 5% of our Class A common stock; and |
| Ÿ | any firm, corporation or other entity in which any of the foregoing persons is a partner or principal or in a similar position or in which such person has a 10% or greater beneficial ownership interest. |
113
Table of Contents
Index to Financial Statements
Prior to this offering, all of our outstanding common stock has been owned by Chesapeake. Immediately following this offering, the purchasers in this offering will own all of the outstanding shares of our Class A common stock and Chesapeake will own all of the outstanding shares of our Class B common stock. The table below sets forth information regarding the beneficial ownership of our Class B common stock by Chesapeake on a pro forma basis after giving effect to (a) the issuance of an aggregate of shares of our Class A common stock in this offering, assuming no exercise of the underwriters’ option to purchase additional shares of Class A common stock, and (b) the issuance of an aggregate of shares of our Class B common stock to Chesapeake.
None of our named executive officers or directors own any shares of our common stock.
Beneficial ownership is determined in accordance with the rules of the SEC and includes voting or investment power with respect to the securities.
| Class B Common Stock(2) | Combined Voting Power | |||||||||||||
| No. of Shares Before Offering |
No. of Shares After Offering |
No. of Shares After Offering Assuming Exercise of Option to Purchase Additional Shares of Class A Common Stock |
% of Combined Voting Power Before Offering |
% of Combined Voting Power After Offering(3) |
% of Combined Voting Power After Offering Assuming Exercise of Option to Purchase Additional Shares of Class A Common Stock(3) | |||||||||
| Chesapeake Energy Corporation(1) |
||||||||||||||
| (1) | Chesapeake Energy Corporation is the ultimate parent entity of, and owns its interest in our Class B common stock through, Chesapeake Operating, Inc. (“COI”). Chesapeake Energy Corporation may be deemed to be the beneficial owner of the Class B common stock owned by COI. The address of Chesapeake Energy Corporation and COI is 6100 North Western Avenue, Oklahoma City, Oklahoma 73118. |
| (2) | COI will not own any shares of Class A common stock immediately following this offering. However, COI will own Class B common units of COS LLC which are exchangeable for shares of our Class A common stock at any time following this offering. As a result, COI and Chesapeake Energy Corporation may be deemed to beneficially own the shares of Class A common stock for which such Class B units are exchangeable. If COI exchanged all of its Class B common units for shares of our Class A common stock, it would own none of our shares of Class B common stock, it would own shares, or %, of our Class A common stock and it would hold % of our combined voting power. |
| (3) | Each share of our Class B common stock is entitled to votes per share, for as long as the number of shares of our Class B common stock outstanding constitutes at least % of the total number of shares of our common stock outstanding. |
114
Table of Contents
Index to Financial Statements
Ownership of Chesapeake Securities by Directors and Executive Officers
The following table sets forth, as of April 11, 2012, the number of shares of common stock of Chesapeake owned by each of our directors and executive officers and all of our directors and executive officers as a group. To our knowledge, the persons named in the table have sole investment and voting power with respect to the shares of common stock indicated, subject to community property laws where applicable. None of the persons in the table below beneficially owns greater than 1.0% of Chesapeake’s common stock. The address for all beneficial owners listed in the table below is 6100 North Western Avenue, Oklahoma City, Oklahoma 73118.
| Name of beneficial owner |
Number of shares of common stock owned |
Shares underlying options exercisable within 60 days |
Total shares of common stock beneficially owned |
|||||||||
| Jerry L. Winchester |
— | — | — | |||||||||
| Cary D. Baetz |
— | — | — | |||||||||
| Aubrey K. McClendon |
1,780,170 | (a) | — | 1,780,170 | ||||||||
| Steven L. Dixon |
535,380 | (b) | 77,500 | (c) | 612,880 | |||||||
| Domenic J. Dell’Osso, Jr. |
62,861 | (d) | — | 62,861 | ||||||||
| All directors and executive officers as a group |
2,378,411 | 77,500 | 2,455,911 | |||||||||
| (a) | Includes (i) 13,671 shares held by Chesapeake Investments, an Oklahoma limited partnership of which Mr. McClendon is sole general partner; (ii) 114,891 shares purchased on behalf of Mr. McClendon in the 401(k) Plan; (iii) 102,118 shares of vested common stock purchased on behalf of Mr. McClendon in the Chesapeake Energy Corporation Deferred Compensation Plan; and (iv) 1,095 shares held by Mr. McClendon’s son who shares the same household. |
| (b) | Includes 27,826 shares held in the Chesapeake Energy Corporation 401(k) Plan, 54,790 shares of vested common stock held in the Chesapeake Energy Corporation Deferred Compensation Plan and 170,115 shares held in grantor retained annuity trusts. |
| (c) | Represents shares of common stock which can be acquired through the exercise of stock options as of April 11, 2012 or within 60 days thereafter. |
| (d) | Includes 1,693 shares held in the Chesapeake Energy Corporation 401(k) Plan, and 112 shares of vested common stock held in the Chesapeake Energy Corporation Deferred Compensation Plan. |
115
Table of Contents
Index to Financial Statements
The following is a description of the material terms of our amended and restated certificate of incorporation and amended and restated bylaws that will be in effect upon consummation of this offering. We refer you to our certificate of incorporation and bylaws, copies of which have been filed as exhibits to the registration statement of which this prospectus forms a part.
Authorized Capitalization
Upon completion of this offering, our authorized capital stock will consist of shares of Class A common stock, par value $0.001 per share, of which shares will be issued and outstanding, shares of Class B common stock, par value $0.001 per share, of which shares will be issued and outstanding, and shares of preferred stock, par value $0.001 per share, none of which will be issued and outstanding. Unless our Board of Directors determines otherwise, we will issue all shares of our capital stock in uncertificated form.
Class A Common Stock
Voting Rights
Each share of Class A common stock will entitle its holder to one vote on matters submitted to a vote of the holders of the shares of Class A common stock. The holders of Class A common stock do not have cumulative voting rights in the election of directors. Holders of shares of our Class A common stock and Class B common stock vote together as a single class on all matters presented to our shareholders for their vote or approval, except as otherwise required by applicable law.
Dividend Rights
Subject to the rights of the holders of any preferred stock that may be outstanding and any contractual or statutory restrictions, holders of our Class A common stock are entitled to receive equally and ratably, share for share dividends as may be declared by our Board of Directors out of funds legally available to pay dividends. Dividends upon our Class A common stock may be declared by the Board of Directors at any regular or special meeting, and may be paid in cash, in property or in shares of capital stock. Before payment of any dividend, there may be set aside out of any of our funds available for dividends, such sums as the Board of Directors deems proper as reserves to meet contingencies, or for equalizing dividends, or for repairing or maintaining any of our property or for any proper purpose, and the Board of Directors may modify or abolish any such reserve.
Liquidation Rights
Upon liquidation, dissolution, distribution of assets or other winding up, the holders of Class A common stock are entitled to receive ratably the assets available for distribution to our shareholders after payment of all of our liabilities and the liquidation preference of any of our outstanding shares of preferred stock, subject only to the right of the holders of shares of our Class B common stock to receive payment for the par value of their shares in connection with our liquidation.
Other Matters
The shares of Class A common stock have no preemptive or conversion rights and are not subject to further calls or assessment by us. There are no redemption or sinking fund provisions applicable to the Class A common stock. All outstanding shares of our Class A common stock, including the Class A common stock offered in this offering, are fully paid and non-assessable.
116
Table of Contents
Index to Financial Statements
Class B Common Stock
Voting Rights
Each share of Class B common stock will entitle its holder to votes on matters submitted a vote of the holders of the shares of Class B common stock, until the first time that the number of shares of Class B common stock outstanding constitutes less than % of the number of all shares of our common stock outstanding. From and after that time, each share of Class B common stock will entitle its holder to one vote. Holders of shares of our Class A common stock and Class B common stock vote together as a single class on all matters presented to our shareholders for their vote or approval, except as otherwise required by applicable law.
Dividend and Liquidation Rights
Holders of our Class B common stock do not have any right to receive dividends or to receive a distribution upon our liquidation or winding up except for their right to receive payment for the par value of their shares of Class B common stock in connection with our liquidation.
Preferred Stock
Preferred stock, if issued, would have priority over the common stock with respect to dividends and other distributions, including the distribution of our assets upon liquidation. Each class or series of preferred stock will cover the number of shares and will have the powers, preferences, rights, qualifications, limitations and restrictions determined by the Board of Directors, which may include dividend rights, liquidation preferences, voting rights, conversion rights, preemptive rights and redemption rights. Except as provided by law or in a preferred stock certificate of designations, the holders of preferred stock will not be entitled to vote at or receive notice of any meeting of shareholders.
While providing desirable flexibility for possible acquisitions and other corporate purposes, and eliminating delays associated with a shareholder vote on specific issuances, the issuance of preferred stock could adversely affect the voting power of holders of our common stock, as well as dividend and liquidation payments on both common and preferred stock. It also could have the effect of delaying, deferring or preventing a change of control.
Anti-Takeover Effects of Provisions of Our Certificate of Incorporation,
Our Bylaws and Oklahoma Law
In addition to the disproportionate voting rights that Chesapeake will have following this offering as a result of its ownership of our Class B common stock, some provisions of Oklahoma law contain, and our certificate of incorporation and our bylaws described below will contain, a number of provisions which may have the effect of encouraging persons considering unsolicited tender offers or other unilateral takeover proposals to negotiate with our Board of Directors rather than pursue non-negotiated takeover attempts. These provisions include a classified Board of Directors, authorized blank check preferred stock, restrictions on business combinations and the availability of authorized but unissued preferred stock.
Oklahoma law
Classified Board of Directors. Initially, our Board of Directors will consist of a single class of directors, each serving one-year terms. We expect that our certificate of incorporation will provide that our Board of Directors will become a classified board upon the earlier of (a) such time that Chesapeake no longer beneficially owns at least a majority of the combined voting power of all of our outstanding
117
Table of Contents
Index to Financial Statements
common stock and (b) such time that we have 1,000 or more holders of record of our common stock. Once our Board of Directors becomes classified, our directors will be divided into three classes with each class as nearly equal in number as possible, serving staggered three-year terms (other than directors which may be elected by holders of preferred stock, if any). A classified board will make it more difficult for shareholders to change the majority of our directors. The Oklahoma General Corporation Act requires a classified board for an Oklahoma corporation having (a) voting stock listed or traded on a national securities exchange or registered under Section 12(g) of the Exchange Act and (b) 1,000 or more shareholders of record. Effective January 1, 2015, the Oklahoma General Corporation Act permits a corporation subject to such provisions to elect not to be governed by the statutory requirements for a classified board upon a resolution adopted by the Board of Directors and approved by shareholders.
Oklahoma Business Combination Statute. We will expressly elect not to be governed by the “business combination” provisions of Section 1090.3 of the Oklahoma General Corporation Act regulating corporate takeovers. At any time after Chesapeake no longer beneficially owns at least a majority of the combined voting power of all of our outstanding common stock, our election to “opt out” shall be automatically withdrawn and we will thereafter be governed by such provisions of Section 1090.3.
In general, Section 1090.3 of the Oklahoma General Corporation Act prevents an “interested shareholder” from engaging in a “business combination” with an Oklahoma corporation for three years following the date the person became an interested shareholder, unless:
| Ÿ | prior to the date the person became an interested shareholder, the Board of Directors of the corporation approved the transaction in which the interested shareholder became an interested shareholder or approved the business combination; |
| Ÿ | upon consummation of the transaction that resulted in the interested shareholder becoming an interested shareholder, the interested shareholder owns stock having at least 85% of all voting power of the corporation at the time the transaction commenced, excluding stock held by directors who are also officers of the corporation and stock held by certain employee stock plans; or |
| Ÿ | on or subsequent to the date of the transaction in which the person became an interested shareholder, the business combination is approved by the Board of Directors of the corporation and authorized at a meeting of shareholders by the affirmative vote of the holders of two-thirds of all voting power not attributable to shares owned by the interested shareholder. |
The statute defines a “business combination” to include:
| Ÿ | any merger or consolidation involving the corporation and an interested shareholder; |
| Ÿ | any sale, lease, exchange, mortgage, pledge, transfer or other disposition to or with an interested shareholder of 10% or more of the assets of the corporation; |
| Ÿ | subject to certain exceptions, any transaction that results in the issuance or transfer by the corporation of any stock of the corporation to an interested shareholder; |
| Ÿ | any transaction involving the corporation that has the effect of increasing the proportionate share of the stock of any class or series or voting power of the corporation owned by the interested shareholder; |
| Ÿ | the receipt by an interested shareholder of any loans, guarantees, pledges or other financial benefits provided by or through the corporation; or |
| Ÿ | any share acquisition by the interested shareholder pursuant to Section 1090.1 of the Oklahoma General Corporation Act. |
118
Table of Contents
Index to Financial Statements
For purposes of Section 1090.3, the term “corporation” also includes the corporation’s majority-owned subsidiaries.
In addition, Section 1090.3 defines an “interested shareholder,” generally, as any person that owns stock having 15% or more of all voting power of the corporation, any person that is an affiliate or associate of the corporation and owned stock having 15% or more of all voting power of the corporation at any time within the three-year period prior to the time of determination of interested shareholder status and any affiliate or associate of such person.
Amended and Restated Certificate of Incorporation Amended and Restated and Bylaws
In addition to the classified board and “blank check” preferred stock provisions described above, we anticipate that, upon the completion of this offering, our certificate of incorporation and bylaws will contain certain provisions that could make it more difficult for a third party to acquire control of us. These provisions will:
| Ÿ | provide that the authorized number of directors may be changed only by resolution of the Board of Directors; |
| Ÿ | provide that all vacancies, including newly created directorships, may, except as otherwise required by law, be filled by the affirmative vote of a majority of directors then in office, even if less than a quorum; |
| Ÿ | at any time after Chesapeake no longer beneficially owns at least a majority of the combined voting power of all of our outstanding common stock, provide that any action required or permitted to be taken by the shareholders must be effected at a duly called annual or special meeting of shareholders and may not be effected by any consent in writing in lieu of a meeting of such shareholders, subject to the rights of the holders of any series of preferred stock (prior to such time, such actions may be taken without a meeting by written consent); |
| Ÿ | at any time after Chesapeake no longer beneficially owns at least a majority of the combined voting power of all of our outstanding common stock, provide that directors may be removed only for cause and only by the affirmative vote of holders of a majority of the combined voting power of our then outstanding stock (prior to such time, directors may be removed with or without cause); |
| Ÿ | at any time after Chesapeake no longer beneficially owns at least a majority of the combined voting power of all of our outstanding common stock, provide that special meetings of our shareholders may only be called by the Board of Directors or the chairman of the board (prior to such time a special meeting may also be called by shareholders holding a majority of the outstanding shares entitled to vote); |
| Ÿ | provide that we renounce any interest in the business opportunities of Chesapeake and of our directors who are affiliated with Chesapeake, other than directors employed by us, and that neither our directors affiliated with Chesapeake, other than directors employed by us, nor Chesapeake has any obligation to offer us those opportunities; |
| Ÿ | eliminate the personal liability of our directors for monetary damages resulting from breaches of fiduciary duty to the extent permitted by the Oklahoma General Corporation Act and indemnify our directors and officers to the fullest extent permitted by the Oklahoma General Corporation Act; |
| Ÿ | provide that shareholders seeking to present proposals before a meeting of shareholders or to nominate candidates for election as directors at a meeting of shareholders must provide notice in writing in a timely manner, and also specify requirements as to the form and content of a shareholder’s notice; |
119
Table of Contents
Index to Financial Statements
| Ÿ | not provide for cumulative voting rights, therefore allowing the holders of a majority of the shares of common stock entitled to vote in any election of directors to elect all of the directors standing for election, if they should so choose; and |
| Ÿ | provide that our bylaws can be amended or repealed at any regular or special meeting of shareholders or by the Board of Directors. |
Stock Purchase Provisions. Our certificate of incorporation will include a provision which requires the affirmative vote of two-thirds of the votes cast by the holders, voting together as a single class, of all then outstanding shares of capital stock, excluding the votes by an interested shareholder, to approve the purchase of any of our capital stock from the interested shareholder at a price in excess of fair market value, unless the purchase is either (a) made on the same terms offered to all holders of the same securities or (b) made on the open market and not the result of a privately negotiated transaction.
Transfer Agent and Registrar
The transfer agent and registrar for our Class A common stock will be Computershare Trust Company, N.A.
Listing
We intend to apply to list our Class A common stock on the NYSE under the symbol “COS.”
120
Table of Contents
Index to Financial Statements
SHARES ELIGIBLE FOR FUTURE SALE
Prior to this offering, there has been no public market for our Class A common stock. Future sales of our Class A common stock in the public market, or the availability of such shares for sale in the public market, could adversely affect market prices prevailing from time to time. As described below, only a limited number of shares, other than shares sold in this offering, will be available for sale shortly after this offering due to contractual and legal restrictions on resale. Nevertheless, sales of a substantial number of shares of our Class A common stock in the public market after such restrictions lapse, or the perception that those sales may occur, could adversely affect the prevailing market price at such time and our ability to raise equity-related capital at a time and price we deem appropriate.
Upon the closing of this offering, we will have issued and outstanding an aggregate of shares of Class A common stock (or shares of Class A common stock if the underwriters exercise their option to purchase additional shares of Class A common stock in full). All of the shares of Class A common stock to be sold in this offering will be freely tradable without restriction or further registration under the Securities Act, unless held by any of our “affiliates” as such term is defined in Rule 144 under the Securities Act, which would be subject to the limitations and restrictions described below under “—Rule 144.”
Following this offering, Chesapeake may exchange Class B units of COS LLC for shares of our Class A common stock on a one-for-one basis, subject to customary conversion rate adjustments for stock splits, stock dividends and reclassifications. Upon consummation of this offering, Chesapeake will hold Class B units of COS LLC ( Class B units if the underwriters exercise their option to purchase additional shares of Class A common stock in full), all of which will be exchangeable for shares of our Class A common stock. See “Certain Relationships and Related Party Transactions—Amended and Restated Operating Agreement of COS LLC—Exchange Rights.” The shares of Class A common stock we issue upon such exchanges would be “restricted securities” as defined in Rule 144 described below. However, upon the closing of this offering, we intend to enter into a registration rights agreement with Chesapeake that will require us to register under the Securities Act shares of our Class A common stock issued in such an exchange. See “—Registration Rights.”
Lock-up Agreements
We, all of our directors and officers and Chesapeake have agreed not to sell or otherwise transfer or dispose of any Class A common stock for a period of 180 days from the date of this prospectus, subject to certain exceptions and extensions, without the prior consent of Goldman, Sachs & Co. See “Underwriting.”
Rule 144
Once we have been a reporting company subject to the reporting requirements of Section 13 or 15(d) of the Exchange Act for 90 days, a person (or persons whose shares are aggregated) who is deemed to be an affiliate of ours and who has beneficially owned restricted securities within the meaning of Rule 144 for at least six months would be entitled to sell within any three-month period a number of shares that does not exceed the greater of one percent of the then outstanding shares of our Class A common stock or the average weekly trading volume of our Class A common stock reported through the NYSE during the four calendar weeks preceding the filing of notice of the sale. Such sales are also subject to certain manner of sale provisions, notice requirements and the availability of current public information about us.
For purposes of Rule 144, an “affiliate” of an issuer is a person that directly or indirectly controls, is controlled by or is under common control with that issuer. Accordingly, Chesapeake will be our affiliate for purposes of Rule 144.
121
Table of Contents
Index to Financial Statements
Once we have been a reporting company subject to the reporting requirements of Section 13 or 15(d) of the Exchange Act for 90 days, a person (or persons whose shares are aggregated) who is not deemed to have been an affiliate of ours at any time during the three months preceding a sale, and who has beneficially owned restricted securities within the meaning of Rule 144 for at least six months (including any period of consecutive ownership of preceding non-affiliated holders) would be entitled to sell those shares, subject only to the availability of current public information about us. A non-affiliated person who has beneficially owned restricted securities within the meaning of Rule 144 for at least one year would be entitled to sell those shares without regard to the provisions of Rule 144.
Registration Rights
In connection with this offering we will enter into a registration rights agreement with Chesapeake pursuant to which Chesapeake will have the right to require us, under certain circumstances, to register under the Securities Act the shares of Class A common stock held by Chesapeake, including Class A common stock received in exchange for Class B units of COS LLC. See “Certain Relationships and Related Party Transactions—Registration Rights Agreement.”
122
Table of Contents
Index to Financial Statements
DESCRIPTION OF CERTAIN INDEBTEDNESS
Revolving Bank Credit Facility
In November 2011, our indirect wholly owned subsidiary, COO, as borrower, and all of its subsidiaries (other than Chesapeake Oilfield Finance, Inc.), as guarantors, entered into a $500.0 million senior secured revolving bank credit facility with Bank of America, N.A. (“Bank of America”) as administrative agent and collateral agent. The revolving bank credit facility matures on November 3, 2016.
The revolving bank credit facility allows COO to request increases in the total commitments under the facility by up to $400.0 million in the aggregate in part or in full anytime during the term of the revolving credit facility, with any such increases being subject to certain requirements as well as lenders’ approval.
Amounts borrowed under the revolving credit facility are secured by liens on all of the equity interests of COO and COO’s current and future guarantor subsidiaries, and all of COO’s and its guarantor subsidiaries’ assets, including real and personal property. During any period that COO maintains an investment grade corporate rating, the requirements that it provide security for amounts borrowed under the facility will be suspended.
Borrowings bear interest under a leverage-based pricing grid at COO’s option at either: (a) the greater of (1) the reference rate of Bank of America, (2) the federal funds effective rate plus 0.50% or (3) the Eurodollar rate which is based on the London Interbank Offered Rate (LIBOR), plus 1.00%, each of which is subject to a margin that varies from 2.00% to 2.75% per annum, according to COO’s leverage ratio, or (b) the Eurodollar rate plus a margin that varies from 1.00% to 1.75% per annum, according to COO’s leverage ratio. The unused portion of the revolving credit facility is subject to commitment fees of 0.375% to 0.500% per annum, according to COO’s leverage ratio. Interest is payable quarterly or, if LIBOR applies, it may be payable at more frequent intervals.
The revolving credit facility contains covenants requiring COO to maintain certain financial ratios such as leverage and interest coverage ratios. In addition, the revolving credit facility includes negative covenants that, subject to exceptions, limit COO’s and each of its subsidiaries’ ability to, among other things:
| Ÿ | incur, assume or permit to exist additional indebtedness, guarantees and other contingent obligations; |
| Ÿ | incur liens; |
| Ÿ | pay dividends or make other distributions; |
| Ÿ | engage in transactions with affiliates; |
| Ÿ | make certain loans and investments; and |
| Ÿ | consolidate, merge or sell all or substantially all of its assets. |
The revolving credit facility contains certain customary representations and warranties, affirmative and negative covenants and events of default, including, among other things, payment defaults, breaches of representations and warranties, covenant defaults, cross-defaults to material indebtedness, certain events of bankruptcy, certain events under ERISA, material judgments, actual or asserted failure of any guaranty or security document supporting the credit facility to be in force and effect and change of control. If an event of default occurs, the administrative agent is entitled to take various actions, including the acceleration of amounts due under the credit facility, termination of the commitments under the revolving credit facility and all remedial actions available to a secured creditor.
123
Table of Contents
Index to Financial Statements
6.625% Senior Notes due 2019
On October 28, 2011, COO and Chesapeake Oilfield Finance, Inc., as co-issuers, completed a private offering of $650.0 million aggregate principal amount of 6.625% Senior Notes due 2019, which we refer to as the “2019 Senior Notes,” for total cash proceeds of approximately $637.0 million, after deducting commissions. The 2019 Senior Notes mature on November 15, 2019 and bear interest at 6.625% per annum, payable semi-annually in arrears on May 15 and November 15, beginning May 15, 2012. The 2019 Senior Notes are unsecured and are guaranteed by COO’s existing and future subsidiaries, subject to certain exceptions.
The 2019 Senior Notes are not entitled to any mandatory redemption or sinking fund. Prior to November 15, 2015, COO may redeem up to 35% of the 2019 Senior Notes with proceeds of certain equity offerings at a redemption price of 106.625% of the principal amount plus accrued and unpaid interest. Prior to November 15, 2015, COO may redeem some or all of the 2019 Senior Notes at a price equal to 100% of the principal amount plus a make-whole premium determined pursuant to a formula set forth in the indenture governing the 2019 Senior Notes, plus accrued and unpaid interest. On or after November 15, 2015, COO may redeem some or all of the 2019 Senior Notes at the following prices (as a percentage of principal), plus accrued and unpaid interest, if redeemed during the 12-month period beginning on November 15 of the years indicated below:
| Year |
Redemption Price | |||
| 2015 |
103.313 | % | ||
| 2016 |
101.656 | % | ||
| 2017 and thereafter |
100.000 | % | ||
The indenture governing the 2019 Senior Notes contains covenants that limit the ability of the co-issuers and the ability of certain of their subsidiaries to incur or guarantee additional indebtedness or issue certain preferred stock, pay dividends on capital stock or redeem capital stock or subordinated indebtedness, transfer or sell assets, make certain payments or investments, incur liens, enter into transactions with affiliates; and merge or consolidate with other companies or transfer all or substantially all assets. These covenants are subject to a number of qualifications and exceptions.
The indenture contains customary events of default, including defaults related to the failure to make required payments under other agreements that exceed $50.0 million and the existence of unsatisfied judgments (for a period of 60 days from entry) in excess of $50.0 million.
Pursuant to a Registration Rights Agreement among the co-issuers, the guarantors and the initial purchasers of the 2019 Senior Notes, dated October 28, 2011, the co-issuers and the guarantors of the 2019 Senior Notes agreed to file with the SEC on or prior to 365 days after the closing of the 2019 Senior Notes offering a registration statement with respect to an offer to exchange the 2019 Senior Notes and the related guarantees for identical new notes and guarantees registered under the Securities Act (or, under certain circumstances, a shelf registration statement covering resales of the 2019 Senior Notes and related guarantees).
Intercompany Promissory Note
On October 21, 2011, COS, LLC entered into a five-year, $1.5 billion revolving promissory note with Chesapeake. Amounts outstanding under the note bear interest at 6.875% per annum, and interest is payable semi-annually. The note is due on October 1, 2016, but demand for payment of the principal amount plus accrued and unpaid interest may be made by Chesapeake at any time. As of December 31, 2011, the note had an outstanding balance of $371.7 million. The balance of this note will be paid with a portion of the net proceeds of this offering and the note will be cancelled.
124
Table of Contents
Index to Financial Statements
EXECUTIVE COMPENSATION AND OTHER INFORMATION
Compensation Discussion and Analysis
Overview
This section provides a description and explanation of the compensation program for the following persons that served as COS LLC’s named executive officers during 2011 following its formation by Chesapeake:
| Name |
Position | |
| Jerry L. Winchester |
Chief Executive Officer | |
| Domenic J. (“Nick”) Dell’Osso, Jr. |
Executive Vice President and Chief Financial Officer—Chesapeake Energy Corporation | |
COS Inc. was incorporated on April 10, 2012 and, therefore, had no officers during 2011. Additionally, Mr. Dell’Osso does not currently serve as one of our executive officers and will not serve as one of our executive officers following this offering. Information regarding Mr. Dell’Osso is presented in this section because he served as COS LLC’s principal financial officer during 2011. Cary D. Baetz became our Chief Financial Officer in January 2012. Accordingly, historic references in this section to the term “named executive officer” include Mr. Dell’Osso but exclude Mr. Baetz and prospective references to such phrase include Mr. Baetz but exclude Mr. Dell’Osso.
Prior to this offering, we were a wholly owned subsidiary of Chesapeake and Chesapeake’s compensation committee oversaw our executive compensation policies and practices. Thus, historical compensation information presented in this section reflects the policies and procedures of, and decisions made by, Chesapeake. Additionally, because Chesapeake will control us immediately following this offering and for the foreseeable future thereafter, we expect that our compensation policies and procedures will continue to closely resemble those of Chesapeake prior to and following this offering. We also expect that our Board of Directors will determine that our compensation policies and procedures will evolve to include elements of compensation that are tied to our performance. In addition, we expect that we will be a “controlled company” under the NYSE corporate governance rules for the foreseeable future following this offering and, consequently, we will not be required to have a compensation committee composed entirely of independent directors. As a result, while our Board of Directors will be responsible for the design and implementation of our compensation plans and programs, we anticipate that the process, type and amount of compensation will correspond with those of Chesapeake.
Executive Compensation Program Objectives, Design and Process
Chesapeake’s compensation system, which was applicable to our named executive officers in 2011, was designed to:
| Ÿ | attract, retain and motivate executive officers with the competence, knowledge, leadership skills and experience to grow our and, by extension, Chesapeake’s profitability; |
| Ÿ | align the interests of executive officers with the interests of shareholders; and |
| Ÿ | encourage both a short-term and long-term focus, while discouraging excessive risk taking. |
We expect that our compensation system will be designed with similar goals and objectives.
Our named executive officers are parties to employment agreements, which are described below. Such employment agreements have been and we believe that they will continue to be the primary basis for the compensation mix and levels for each of our named executive officers. Historically,
125
Table of Contents
Index to Financial Statements
Chesapeake’s Employee Compensation and Benefits Committee (the “ECBC”), a management committee established and overseen by Chesapeake’s Compensation Committee, would review each named executive officer’s performance twice each year in June and December, with the exception of Mr. Dell’Osso, whose performance is reviewed by Chesapeake’s Compensation Committee. Chesapeake believes that semi-annual performance reviews (rather than annual year-end performance reviews) allow better performance evaluation and compensation decision making in light of the dynamic nature of our industry and permit Chesapeake to better understand the business issues facing the named executive officers on an ongoing basis. This review consists of a subjective assessment of the overall performance of the named executive officer and his or her team and the role and relative contribution of each of its members. In its assessment of the performance of each named executive officer, Chesapeake historically has considered, and we anticipate that our Board of Directors will consider, the following:
| Ÿ | Individual performance: for example, the executive’s contributions to the development and execution of business plans and strategies (including contributions that are expected to provide substantial benefit to the organization in future periods), performance of the executive’s department or functional unit, level of responsibility and longevity; |
| Ÿ | Company-level performance: including progress made with respect to operational results, risk management activities, asset acquisitions and asset monetizations, and financial performance as measured by cash flow, net income, cost of capital, general and administrative costs and common stock price performance; and |
| Ÿ | Intangibles: for example, leadership ability, demonstrated commitment to the organization, motivational skills, attitude and work ethic. |
Our named executive officers participated in the performance reviews for 2011 that were applicable to their respective positions within Chesapeake and their compensation during 2011 was established, in part, based on these reviews. We expect that our Board of Directors will employ the same or a similar review process for our employees, including our named executive officers, following this offering, which will include reviews by the ECBC. As part of this review process, we expect that Mr. Winchester will provide recommendations to the ECBC with respect to the compensation levels of our named executive officers, other than himself, based on their respective employment agreements as well as a comprehensive, subjective evaluation of our performance and their individual performance. Additionally, we expect that our Board of Directors will approve Mr. Winchester’s performance based on a similar assessment and recommendation of the ECBC.
Elements and Mix of Compensation
In 2011, our named executive officers received short-term compensation in the form of base salaries and cash bonuses and long-term compensation in the form of Chesapeake restricted stock awards and 401(k) matching contributions, which are paid in Chesapeake stock. The base salaries, cash bonuses and restricted stock awards are required to be paid in minimum amounts pursuant to the employment agreements described below. Chesapeake’s more highly-compensated employees, including our named executive officers, are eligible to defer certain compensation through the Chesapeake Amended and Restated Deferred Compensation Plan (the “DCP”), a nonqualified deferred compensation plan, and to receive certain perquisites. For more information regarding the DCP, please refer to “—Nonqualified Deferred Compensation 2011.”
Cash Salary and Bonuses. Chesapeake established base salary levels for our named executive officers for 2011 intended to reflect each officer’s base level of responsibility, leadership, experience and contribution to the success and profitability of Chesapeake and our business. Chesapeake established cash bonuses for 2011 at levels intended to provide incentives based on a subjective evaluation of the performance of Chesapeake and the individual over a shorter period than
126
Table of Contents
Index to Financial Statements
the equity compensation described below. We expect that our Board of Directors will include cash salary and bonus components as part of our overall compensation package following this offering.
Long-term Incentive Compensation. Long-term incentive awards for Chesapeake’s employees, including our named executive officers, have historically been made in the form of Chesapeake restricted stock grants. In 2011, restricted stock, with a ratable vesting period of four years, was awarded to employees, including the named executive officers, on the first trading day of each January and July as part of the ECBC’s and Chesapeake’s Compensation Committee’s semi-annual review of compensation. We expect that our Board of Directors will consider including long-term incentive compensation as part of our compensation package following this offering.
Other Compensation Arrangements. During 2011, Chesapeake provided compensation in the form of personal benefits and perquisites to our named executive officers, including health and welfare insurance benefits, 401(k) matching contributions of common stock under Chesapeake’s 401(k) plan and the DCP (under which an employee may defer up to 15% of his or her annual base salary and cash incentive bonus compensation), certain transportation benefits and financial planning services. Certain of the foregoing perquisites are provided to all of our and Chesapeake’s employees and certain of such benefits are provided to a large number of our and Chesapeake’s senior-level employees. Chesapeake does not have a pension plan or any other retirement plan other than the 401(k) and the DCP. We expect that our Board of Directors will include many of these same perquisites as part of our overall compensation package following this offering.
During 2011, Chesapeake provided Messrs. Dell’Osso and Winchester personal use of Chesapeake’s fractionally-owned aircraft. Chesapeake believes that access to its fractionally-owned aircraft for personal use greatly enhances the productivity and work-life balance of executive officers and provides performance and retention incentives far in excess of the cost of the perquisite. Chesapeake includes the above benefits and perquisites as taxable income to the executive on Form W-2 after each fiscal year, in accordance with Internal Revenue Service (IRS) guidelines. We expect that Mr. Winchester, as a senior vice president of Chesapeake, will qualify for personal use of Chesapeake’s fractionally-owned aircraft following this offering and that our Board of Directors will consider including this perquisite as part of his overall compensation package following this offering.
Employment Agreements
Set forth below is a description of certain terms of the employment agreements of our named executive officers, including the term of such agreements and minimum salary and bonus levels for future years. Information regarding Mr. Baetz is being presented because he, and not Mr. Dell’Osso, will serve as our principal financial officer during the periods presented. The employment agreements with our named executive officers are “at will,” and we retain the right to terminate an executive with or without cause.
| Name |
Position |
Effective Date |
Expiration Date | |||
| Jerry L. Winchester |
Chief Executive Officer | September 15, 2011 | December 31, 2014 | |||
| Cary D. Baetz |
Chief Financial Officer | January 9, 2012 | December 31, 2014 |
The agreements provide for the following minimum annual base salaries:
| Name |
First Year of Employment |
Second Year of Employment |
Third Year of Employment |
|||||||||
| Jerry L. Winchester |
$ | 350,000 | $ | 500,000 | $ | 650,000 | ||||||
| Cary D. Baetz |
$ | 350,000 | $ | 400,000 | $ | 450,000 | ||||||
127
Table of Contents
Index to Financial Statements
Our named executive officers are guaranteed the following minimum annual bonuses and annual awards of Chesapeake restricted stock, provided that they remain employed on the applicable bonus payment or award date. Additional discretionary bonuses may be made.
| Minimum Annual Bonus Payment | Minimum Annual Award of Chesapeake Restricted Stock |
|||||||||||||||||||||||
| Name |
First Year of Employment |
Second Year of Employment |
Third Year of Employment |
First Year of Employment |
Second Year of Employment |
Third Year of Employment |
||||||||||||||||||
| Jerry L. Winchester |
$ | 350,000 | $ | 500,000 | $ | 650,000 | $ | 800,000 | $ | 1,000,000 | $ | 1,200,000 | ||||||||||||
| Cary D. Baetz |
$ | 250,000 | $ | 300,000 | $ | 350,000 | $ | 150,000 | $ | 200,000 | $ | 250,000 | ||||||||||||
Our named executive officers are also entitled to participate in the employee benefit plans and arrangements, such as retirement and health plans and vacation programs that are customarily provided to our other employees, to the extent they are eligible under the terms and conditions of such arrangements.
The employment agreements provide for certain change in control and termination benefits in the event of a change in control or a termination of each named executive officer’s employment under certain circumstances, as applicable. These benefits are detailed below under “Potential Payments Upon Termination and Change of Control.”
The employment agreements also contain certain confidentiality, noncompete and nonsolicitation covenants. Specifically, our named executive officers have agreed not to disclose any confidential information during the term of their employment and for three years following their termination. In addition, they have agreed to a noncompete covenant for six months following termination and not to solicit customers or employees for a period of one year following termination.
Compensation Changes for 2012
Due to Chesapeake’s continuing and rapid growth, and, in an effort to continue best practices, in early 2011 Chesapeake’s Compensation Committee retained an independent compensation consultant, Cogent Compensation Partners, to review its existing compensation system and provide recommendations to Chesapeake’s Compensation Committee with respect to future improvements. In December 2011, Chesapeake announced that its Compensation Committee and Board of Directors approved changes to Chesapeake’s executive compensation system to provide additional emphasis on performance-based components. We expect that Mr. Winchester, as a senior vice president of Chesapeake, will participate in the new system.
128
Table of Contents
Index to Financial Statements
2011 Compensation
The following discussion relating to compensation paid by Chesapeake in 2011 is based on information provided to us by Chesapeake and does not purport to be a complete discussion and analysis of Chesapeake’s executive compensation philosophy and practices.
Summary Compensation Table
The table below summarizes the compensation received by our named executive officers in 2011. The amounts shown in the table for Mr. Dell’Osso reflect compensation for his time spent providing services to COS LLC in 2011, which was approximately 8.5% of his time. The named executive officers did not receive any option awards or awards under non-equity incentive plans and do not participate in a pension plan.
| Name and Principal Position |
Year | Salary(a) | Bonus(b) | Stock Awards(c) |
All Other Compensation(d) |
Total | ||||||||||||||||||
| Jerry L. Winchester(e) |
2011 | $ | 96,923 | $ | 350,250 | $ | 277,966 | $ | 142,074 | $ | 867,213 | |||||||||||||
| Chief Executive Officer |
||||||||||||||||||||||||
| Domenic J. (“Nick”) Dell’Osso, Jr.(f) |
2011 | $ | 47,592 | $ | 87,210 | $ | 315,195 | $ | 36,040 | $ | 486,037 | |||||||||||||
| Executive Vice President and Chief Financial Officer—Chesapeake Energy Corporation |
||||||||||||||||||||||||
| (a) | The amounts shown for Mr. Winchester reflect amounts earned for a partial year of service. Mr. Winchester commenced employment in September 2011. |
| (b) | The amounts shown include (1) regular bonuses paid to each named executive officer and (2) a signing bonus paid to Mr. Winchester in connection with his commencement of employment. |
| (c) | These amounts shown represent the aggregate grant date fair value of the awards, determined in accordance with applicable financial accounting standards. The value ultimately realized by the executive upon the actual vesting of the awards may be more or less than the grant date fair value. Please see “Grants of Plan-Based Awards for 2011” for additional information regarding restricted stock awards made to the named executive officers in 2011. Unvested restricted stock does not accrue dividends. |
| (d) | Includes the value of other benefits and perquisites provided to the named executive officers, including relocation benefits, supplemental life insurance premiums, financial advisory services, reimbursement of amounts paid by named executive officers under COBRA and transportation benefits. For Mr. Winchester, amounts include an $87,000 relocation benefit and $50,211 related to his personal use of Chesapeake’s fractionally-owned aircraft, which is provided to him as an executive officer of Chesapeake. The value of personal use of Chesapeake’s fractionally-owned aircraft is based on the incremental cost to Chesapeake determined by the invoiced amount allocated to the named executive officer. The amounts represent operating costs of such use, including the cost of fuel, trip-related maintenance, crew travel expenses, on-board catering, landing fees and trip-related parking/hangar costs, net of any applicable employee reimbursement. Since Chesapeake’s fractionally-owned aircraft are used primarily for business travel, we do not include the fixed costs that do not change based on the usage, such as purchase costs and maintenance costs not related to trips. The named executive officers also received benefits for which there was no incremental cost to Chesapeake, such as tickets to certain sporting events. |
| (e) | Mr. Winchester commenced employment with Chesapeake in September 2011. Prior to the formation of COS LLC in September 2011, we did not have a principal executive officer as our subsidiaries and operations had not been operated as a single group of companies. |
| (f) | Cary D. Baetz became our Chief Financial Officer in January 2012, and thereby assumed Mr. Dell’Osso’s duties. |
129
Table of Contents
Index to Financial Statements
Grants of Plan-Based Awards for 2011
The table below summarizes grants of plan-based awards made to our named executive officers under Chesapeake’s equity compensation plans during 2011.
| Name |
Grant Date | Approval Date(a) | Number of Shares of Stock(b) |
Grant Date Fair Value of Stock Awards(c) |
||||||||
| Jerry L. Winchester |
October 31, 2011 | October 31, 2011 | 9,885 | $ | 277,966 | |||||||
| Domenic J. (“Nick”) Dell’Osso, Jr.(d) |
January 3, 2011 | December 16, 2010 | 4,675 | $ | 123,934 | |||||||
| July 1, 2011 | June 9, 2011 | 6,354 | $ | 191,260 | ||||||||
| (a) | Chesapeake approved the restricted stock awards in accordance with its regular procedures. Restricted stock awards approved on December 16, 2010 were issued with a grant date of the first trading day of January 2011. Restricted stock awards approved on June 9, 2011 were issued with a grant date of the first trading day of July 2011. Mr. Winchester’s award was granted in connection with his employment on the last trading day of the second month following his month of hire. |
| (b) | The restricted stock awards vest ratably over four years from the date of the award. No dividends are accrued or paid on restricted stock awards until vested. |
| (c) | The values shown in reference to restricted stock awards are based on the closing price of Chesapeake’s common stock on the grant date. |
| (d) | Represents an amount of restricted stock awards that is proportional to the amount of time spent providing services to COS LLC, as described under “—Summary Compensation Table”. |
Outstanding Equity Awards at Fiscal Year-End 2011
The table below contains information regarding unvested shares of Chesapeake restricted stock held by our named executive officers under Chesapeake’s equity compensation plans as of December 31, 2011.
| Stock Awards | ||||||||
| Name |
Number of Shares of Stock That Have Not Vested(a) |
Market Value of Shares of Stock That Have Not Vested(b) |
||||||
| Jerry L. Winchester(c) |
9,885 | $ | 220,337 | |||||
| Domenic J. (“Nick”) Dell’Osso, Jr.(d) |
11,029 | $ | 245,836 | |||||
| (a) | All stock awards consist of grants of restricted shares of Chesapeake’s common stock. All restricted stock awards vest ratably over four years from the grant date of the award. |
| (b) | The value shown is based on the closing price of Chesapeake’s common stock on December 30, 2011 of $22.29 per share. |
| (c) | Includes restricted stock granted on October 31, 2011. |
| (d) | Includes 4,675 shares of restricted stock granted January 3, 2011 and 6,354 shares of restricted stock granted July 1, 2011, which are amounts of unvested shares of Chesapeake’s common stock held by Mr. Dell’Osso that are proportional to the amount of time he spent providing services to COS LLC, as described under “—Summary Compensation Table.” |
Option Exercises and Stock Vested During 2011
None of our named executive officers held any options to purchase Chesapeake’s common stock or shares of Chesapeake’s restricted common stock that vested during 2011.
Pension Benefits
Neither we nor Chesapeake has a pension plan or any other retirement plan other than the Chesapeake 401(k) Plan and the DCP.
130
Table of Contents
Index to Financial Statements
Nonqualified Deferred Compensation for 2011
The named executive officers are permitted to participate in the DCP. The DCP allows certain employees to voluntarily defer receipt of a portion of their salary and/or their annual bonus payments. Pursuant to the terms of the administrative services agreement, a portion of the expense related to these plans is allocated to us by Chesapeake. For 2011, Mr. Dell’Osso was the only named executive officer that participated in the DCP. The allocated expense for Mr. Dell’Osso is included in the All Other Compensation column under “—Summary Compensation Table.” We have not included a nonqualified deferred compensation table because the value of Mr. Dell’Osso’s total balance is tied significantly to contributions made prior to the time he began providing services to us and is not reflective of the expenses allocated to us.
Potential Payments Upon Termination and Change of Control
As discussed under “—Compensation Discussion and Analysis” above, our named executive officers are parties to employment agreements that govern the terms and conditions of their employment, including their duties and responsibilities, compensation and benefits, and applicable severance terms. The energy industry’s history of terminating professionals during its cyclical downturns and the frequency of mergers, acquisitions and consolidation in our industry are two important factors that have contributed to a widespread, heightened concern for long-term job stability by many professionals in our industry. In response to this concern, arrangements that provide compensation guarantees in the event of an employee’s termination without cause, death or incapacity or due to a change of control are common practice in our industry. These provisions in the named executive officers’ employment agreements and the incentive plans in which the named executive officers participate are integral to our ability to recruit and retain the high caliber of professionals that are critical to the successful execution of our business strategy. Below is a discussion of these arrangements, other than for Mr. Dell’Osso, who was replaced by Mr. Baetz as our Chief Financial Officer in January 2012.
Termination Without Cause or for Good Reason
Mr. Winchester. If Mr. Winchester’s employment is terminated without cause or if Mr. Winchester terminates his employment for good reason, Mr. Winchester is entitled to receive the following payments and benefits:
| Ÿ | a lump sum amount equal to 52 weeks of his then-current base salary; |
| Ÿ | immediate vesting of Chesapeake restricted common stock granted under his employment agreement and any supplemental matching contributions to the DCP; and |
| Ÿ | an amount equal to the paid time off that he has accrued at the time of his termination. |
Mr. Baetz. If Mr. Baetz’s employment is terminated without cause or if Mr. Baetz terminates his employment for good reason, Mr. Baetz is entitled to receive the following payments and benefits:
| Ÿ | a lump sum amount equal to 26 weeks of his then-current base salary; and |
| Ÿ | an amount equal to the paid time off that he has accrued at the time of the termination. |
Change of Control
Mr. Winchester. Upon a change of control of Chesapeake, Mr. Winchester is entitled to a payment in an amount equal to 200% of the sum of (a) his base salary as of the date of the change of control and (b) bonus compensation paid to him during the twelve-month period immediately prior to the change of control. In additional, all unvested equity compensation and deferred compensation will immediately vest and will be paid in a lump sum.
131
Table of Contents
Index to Financial Statements
Mr. Baetz. Upon a change of control of Chesapeake, Mr. Baetz is entitled to a payment in an amount equal to 100% of the sum of (a) his base salary as of the date of the change of control and (b) bonus compensation paid to him during the twelve-month period immediately prior to the change of control. In addition, all unvested equity compensation and deferred compensation will immediately vest and will be paid in a lump sum.
A Change of Control is defined in the employment agreements to include:
| (1) | the acquisition by a person of 30% or more of Chesapeake’s outstanding common stock or the voting power of Chesapeake’s existing voting securities unless one of the circumstances described in clause 3(a), (b) and (c) below exists or such acquisition is directly from Chesapeake or is an acquisition by Chesapeake or a Chesapeake employee benefit plan or, an acquisition by or sponsored by Mr. Aubrey K. McClendon, Chief Executive Officer of Chesapeake; |
| (2) | the replacement of a majority of the members of the Incumbent Board of Chesapeake is replaced by directors who were not nominated or elected by the Incumbent Board (the current directors and directors later nominated or elected by a majority of such directors are referred to as the “Incumbent Board”); |
| (3) | the consummation of a business combination such as a reorganization, merger, consolidation or sale of all or substantially all of Chesapeake’s assets unless following such business combination (a) the persons who beneficially owned Chesapeake’s common stock and voting securities immediately prior to the business combination beneficially own more than 60% of such securities of the corporation resulting from the business combination in substantially the same proportions, (b) no person beneficially owns 30% or more of such securities of the corporation resulting from the business combination unless such ownership existed prior to the business combination, and (c) a majority of the members of the Board of Directors of the corporation resulting from the business combination were members of the Incumbent Board at the time of the execution or approval of the business combination agreement; and |
| (4) | the approval by the shareholders of a complete liquidation or dissolution of Chesapeake. |
Termination Due to Incapacity or Death
If any of our named executive officers’ employment is terminated due to the executive’s incapacity or death, the executive (or his beneficiary or estate, as applicable) is entitled to receive:
| Ÿ | a lump sum amount equal to a specified number of weeks of his then current base salary: 26 weeks in the case of incapacity and 52 weeks in the case of death; |
| Ÿ | immediate vesting of Chesapeake restricted common stock granted under his employment agreement and any supplemental matching contributions to the DCP; and |
| Ÿ | an amount equal to the paid time off that he has accrued at the time of the termination. |
132
Table of Contents
Index to Financial Statements
Termination and Change of Control Tables
The tables below quantify the payments and benefits due to Messrs. Winchester and Baetz in the event of a qualifying termination of employment and/or in the event of a change of control of Chesapeake.
The amounts disclosed in the table below assume that the termination event and/or the occurrence of the change of control occurred on December 31, 2011. We have also assumed that each named executive officer (a) was employed from January 1, 2011 through December 31, 2011, (b) had no accrued vacation as of December 31, 2011 and (c) was awarded only the shares of Chesapeake restricted common stock that they were actually awarded in 2011. In calculating the bonus payments in the table below, we have used the applicable minimum annual bonus specified in the executive’s employment agreement. The actual amounts to be paid are dependent on various factors, which may or may not exist at the time a named executive officer is actually terminated or a change of control actually occurs.
Jerry L. Winchester
| Executive Benefits and Payments Upon Separation or |
Termination without Cause |
Change of Control |
Incapacity of Executive |
Death of Executive |
||||||||||||
| Compensation: |
||||||||||||||||
| Cash payment |
$ | 350,000 | $ | 1,400,000 | $ | 175,000 | $ | 350,000 | ||||||||
| Acceleration of Equity Compensation: |
||||||||||||||||
| Restricted Stock Awards |
$ | 256,120 | $ | 256,120 | $ | 256,120 | $ | 256,120 | ||||||||
| 401(k) Plan and Deferred Comp Plan Matching |
— | — | — | — | ||||||||||||
|
|
|
|
|
|
|
|
|
|||||||||
| Total |
$ | 606,120 | $ | 1,656,120 | $ | 431,120 | $ | 606,120 | ||||||||
| Cary D. Baetz
|
||||||||||||||||
| Executive Benefits and Payments Upon Separation or Change of Control |
Termination without Cause |
Change of Control |
Incapacity of Executive |
Death of Executive |
||||||||||||
| Compensation: |
||||||||||||||||
| Cash payment |
$ | 350,000 | $ | 600,000 | $ | 175,000 | $ | 350,000 | ||||||||
| Acceleration of Equity Compensation: |
||||||||||||||||
| Restricted Stock Awards |
— | — | — | — | ||||||||||||
| 401(k) Plan and Deferred Comp Plan Matching |
— | — | — | — | ||||||||||||
|
|
|
|
|
|
|
|
|
|||||||||
| Total |
$ | 350,000 | $ | 600,000 | $ | 175,000 | $ | 350,000 | ||||||||
133
Table of Contents
Index to Financial Statements
MATERIAL U.S. FEDERAL INCOME TAX
CONSIDERATIONS TO NON-U.S. HOLDERS
The following is a summary of the material U.S. federal income tax consequences of the purchase, ownership and disposition of our Class A common stock to a non-U.S. holder as of the date hereof. For the purpose of this discussion, a non-U.S. holder is any beneficial owner of our Class A common stock (other than a partnership or entity treated as a partnership for U.S. federal income tax purposes) that is not for U.S. federal income tax purposes any of the following:
| Ÿ | an individual citizen or resident of the U.S.; |
| Ÿ | a corporation (including any other entity treated as a corporation for U.S. federal income tax purposes) that is created or organized under the laws of the U.S., any state thereof or the District of Columbia; |
| Ÿ | an estate the income of which is subject to U.S. federal income tax regardless of its source; or |
| Ÿ | a trust (a) whose administration is subject to the primary supervision of a U.S. court and which has one or more U.S. persons who have the authority to control all substantial decisions of the trust or (b) which has made a valid election to be treated as a U.S. person. |
If a partnership (including any entity or arrangement treated as a partnership for U.S. federal income tax purposes) holds our Class A common stock, the U.S. federal income tax treatment of a partner in the partnership generally will depend on the status of the partner and upon the activities of the partnership. Accordingly, we urge partnerships that hold our Class A common stock and partners in such partnerships to consult their tax advisors as to the particular U.S. federal income tax consequences applicable to them.
This summary assumes that a non-U.S. holder will hold our Class A common stock issued pursuant to the offering as a capital asset (generally, property held for investment). This summary does not address all aspects of U.S. federal income taxation and does not deal with foreign, state, local, alternative minimum tax or other tax considerations that may be relevant to non-U.S. holders in light of their personal circumstances. In addition, this summary does not address U.S. federal income tax considerations that may be relevant to non-U.S. holders that may be subject to special treatment under U.S. federal income tax laws, including, without limitation, U.S. expatriates, insurance companies, tax-exempt or governmental organizations, dealers in securities or currency, banks or other financial institutions, traders in securities that mark-to-market, shareholders that hold our Class A common stock as a result of a constructive sale, shareholders who acquired our Class A common stock through the exercise of employee stock options or otherwise as compensation or through a tax-qualified retirement plan and shareholders that hold our Class A common stock as part of a hedge, straddle, appreciated financial position, synthetic security, conversion transaction or other integrated investment or risk reduction transaction. Furthermore, this summary is based on current provisions of the U.S. Internal Revenue Code of 1986, as amended (the “Code”), and Treasury Regulations and administrative and judicial interpretations thereof, all as in effect on the date hereof, and all of which are subject to change, possibly with retroactive effect.
We have not sought any ruling from the IRS with respect to the statements made and the conclusions reached in the following summary, and there can be no assurance that the IRS will agree with such statements and conclusions. INVESTORS CONSIDERING THE PURCHASE OF CLASS A COMMON STOCK SHOULD CONSULT THEIR TAX ADVISORS WITH RESPECT TO THE APPLICATION OF THE U.S. FEDERAL INCOME TAX LAWS TO THEIR PARTICULAR SITUATIONS AS WELL AS ANY TAX CONSEQUENCES ARISING UNDER THE LAWS OF ANY STATE, LOCAL OR FOREIGN TAXING JURISDICTION OR UNDER ANY APPLICABLE TAX TREATY.
134
Table of Contents
Index to Financial Statements
Distributions on Our Class A Common Stock
We currently intend to retain future earnings, if any, for use in the operation or expansion of our business and, therefore, do not anticipate paying any cash dividends in the immediate future following this offering. In addition, the indenture governing COO’s 2019 Senior Notes limits its ability to make distributions to COS, LLC and us. If we make cash or other property distributions on our Class A common stock, such distributions will constitute dividends for U.S. federal income tax purposes to the extent paid from our current or accumulated earnings and profits, as determined under U.S. federal income tax principles. To the extent those distributions exceed our current and accumulated earnings and profits, the distributions will constitute a return of capital and will first reduce the non-U.S. holder’s adjusted tax basis in our Class A common stock, but not below zero, and then will be treated as gain realized from the sale or other disposition of our Class A common stock and will be treated as described under “Gain on Disposition of Class A Common Stock” below.
Any dividend paid to a non-U.S. holder of our Class A common stock generally will be subject to U.S. withholding tax either at a rate of 30% of the gross amount of the dividend or such lower rate as may be specified by an applicable income tax treaty. To receive the benefit of a reduced treaty rate, a non-U.S. holder must provide us (a) a valid IRS Form W-8BEN (or applicable successor form) properly certifying qualification for the reduced rate or (b) in the case of payments made outside the U.S. to an offshore account (generally, an account maintained by you at an office or branch of a bank or other financial institution at any location outside the U.S.), other documentary evidence establishing an entitlement to the lower treaty rate in accordance with applicable U.S. Treasury Regulations.
Dividends paid to a non-U.S. holder that are effectively connected with the conduct of a trade or business by the non-U.S. holder in the U.S. (and, if required by an applicable income tax treaty, are attributable to a U.S. permanent establishment or fixed base of the non-U.S. holder) generally are exempt from the withholding tax described above and instead will be subject to U.S. federal income tax on a net income basis at the regular graduated U.S. federal income tax rates in the same manner as if the non-U.S. holder were a U.S. person as defined under the Code. In such case, we will not be required to withhold U.S. federal income tax if the non-U.S. holder complies with applicable certification and disclosure requirements. In order to obtain this exemption from withholding tax, a non-U.S. holder must provide us with an IRS Form W-8ECI (or applicable substitute or successor form) properly certifying eligibility for such exemption. Any such effectively connected dividends received by a foreign corporation may be subject to an additional “branch profits tax” at a rate of 30% or such lower rate as may be specified by an applicable income tax treaty. Non-U.S. holders are urged to consult with their tax advisors regarding any applicable income tax treaties that may provide different rules.
Gain on Disposition of Class A Common Stock
Any gain realized on the disposition of our Class A common stock by a non-U.S. holder generally will not be subject to U.S. federal income tax unless:
| Ÿ | the gain is effectively connected with the conduct of a trade or business by the non-U.S. holder in the U.S. (and, if required by an applicable income tax treaty, is attributable to a U.S. permanent establishment or fixed base of the non-U.S. holder); |
| Ÿ | the non-U.S. holder is an individual who is present in the U.S. for 183 days or more during the taxable year of that disposition, and certain other conditions are met; or |
| Ÿ | we are or have been a “United States real property holding corporation,” or USRPHC, for U.S. federal income tax purposes. |
A non-U.S. holder who has gain that is described in the first bullet point immediately above will be subject to tax on the net gain derived from the disposition under regular graduated U.S. federal income
135
Table of Contents
Index to Financial Statements
tax rates in the same manner as if it were a U.S. person as defined under the Code. In addition, a non-U.S. holder described in the first bullet point immediately above that is a foreign corporation may be subject to the branch profits tax equal to 30% of its effectively connected earnings and profits or at such lower rate as may be specified by an applicable income tax treaty.
A non-U.S. holder who meets the requirements described in the second bullet point immediately above will be subject to a flat 30% tax on the gain derived from the disposition, which may be offset by U.S. source capital losses, even though the individual is not considered a resident of the U.S.
We do not believe that we currently are, and do not expect to be for the foreseeable future, a USRPHC for U.S. federal income tax purposes. You should be aware, however, that the determination of whether we are a USRPHC depends on the fair market value from time to time of our interests in real property (and certain associated personal property) located within the U.S. relative to our other business assets. There can be no assurance that we will not become a USRPHC in the future. In the event we do become a USRPHC, so long as our Class A common stock is regularly traded on an “established securities market” within the meaning of the applicable U.S. Treasury Regulations, a non-U.S. holder will not be subject to, U.S. federal withholding tax on the sale or other disposition of its shares of our Class A common stock and any gain realized on such sale or other disposition would only be subject to U.S. federal income tax if the selling non-U.S. holder actually or constructively holds more than five percent of our Class A common stock at any time during the shorter of the five-year period preceding the date of disposition or the holder’s holding period.
Non-U.S. holders should consult their tax advisors with respect to the application of the foregoing rules to their ownership and disposition of our Class A common stock.
Backup Withholding and Information Reporting
Generally, we must report annually to the IRS and to each non-U.S. holder the amount of dividends paid to such non-U.S. holder, the name and address of the recipient, and the amount, if any, of tax withheld with respect to those dividends. These information reporting requirements apply even if withholding was not required. Pursuant to tax treaties or other agreements, the IRS may make its reports available to tax authorities in the recipient’s country of residence.
Payments of dividends to a non-U.S. holder will be subject to backup withholding (at the applicable rate) unless the non-U.S. holder establishes an exemption, for example, by properly certifying its non-U.S. status on an IRS Form W-8BEN or another appropriate version of IRS Form W-8. Notwithstanding the foregoing, backup withholding will apply if either we or our paying agent has actual knowledge, or reason to know, that the beneficial owner is a U.S. person that is not an exempt recipient.
Payments of the proceeds from a sale or other disposition by a non-U.S. holder of our Class A common stock effected outside the U.S. by or through a foreign office of a broker generally will not be subject to information reporting or backup withholding. However, information reporting (but not backup withholding) will apply to those payments if the broker does not have documentary evidence that the holder is a non-U.S. holder, an exemption is not otherwise established, and the broker has certain relationships with the U.S.
Payments of the proceeds from a sale or other disposition by a non-U.S. holder of our Class A common stock effected by or through a U.S. office of a broker generally will be subject to information reporting and backup withholding (at the applicable rate) unless the non-U.S. holder establishes an exemption, for example, by properly certifying its non-U.S. status on an IRS Form W-8BEN or another
136
Table of Contents
Index to Financial Statements
appropriate version of IRS Form W-8. Notwithstanding the foregoing, information reporting and backup withholding will apply if the broker has actual knowledge, or reason to know, that the holder is a U.S. person that is not an exempt recipient.
Backup withholding is not an additional tax. Rather, the U.S. income tax liability of persons subject to backup withholding will be reduced by the amount of tax withheld. If withholding results in an overpayment of taxes, a refund may be obtained, provided that the required information is timely furnished to the IRS.
Additional Withholding Requirements
Under recently enacted legislation and administrative guidance, the relevant withholding agent may be required to withhold 30% of any dividends paid after December 31, 2013 and the proceeds of a sale of our Class A common stock paid after December 31, 2014 to (a) a foreign financial institution unless such foreign financial institution agrees to verify, report and disclose its U.S. accountholders and meets certain other specified requirements or (b) a non-financial foreign entity that is the beneficial owner of the payment unless such entity certifies that it does not have any substantial U.S. owners or provides the name, address and taxpayer identification number of each substantial U.S. owner and such entity meets certain other specified requirements. Investors should consult their own tax advisors regarding this legislation.
U.S. Federal Estate Tax
The estates of nonresident alien individuals generally are subject to U.S. federal estate tax on property with a U.S. situs. Because we are a U.S. corporation, our Class A common stock will be U.S. situs property and therefore will be included in the taxable estate of a nonresident alien decedent, unless an applicable estate tax treaty between the United States and the decedent’s country of residence provides otherwise.
137
Table of Contents
Index to Financial Statements
We and the underwriters named below have entered into an underwriting agreement with respect to the shares of Class A common stock being offered. Subject to certain conditions, each underwriter has severally agreed to purchase the number of shares of Class A common stock indicated in the following table. Goldman, Sachs & Co., and Merrill Lynch, Pierce, Fenner & Smith Incorporated are the representatives of the underwriters.
| Underwriter |
Number of Shares | |
| Goldman, Sachs & Co. |
||
| Merrill Lynch, Pierce, Fenner & Smith |
||
|
| ||
| Total |
||
|
|
Subject to the terms and conditions set forth in the underwriting agreement, the underwriters are committed to take and pay for all of the shares of Class A common stock being offered, if any are taken, other than the shares covered by the option described below unless and until this option is exercised.
The underwriters are offering the shares, subject to prior sale, when, as and if issued to and accepted by them, subject to approval of legal matters by their counsel, including the validity of the shares, and other conditions contained in the underwriting agreement, such as the receipt by the underwriters of officers’ certificates and legal opinions. The underwriters reserve the right to withdraw, cancel or modify offers to the public and to reject orders in whole or in part.
The underwriters have an option to buy up to an additional shares of Class A common stock from us. They may exercise that option for 30 days after the date of this prospectus. If any shares of Class A common stock are purchased pursuant to this option, each of the underwriters will, subject to conditions in the Underwriting Agreement, severally purchase a number of additional shares in approximately the same proportion as set forth in the table above.
The following tables show the per share and total underwriting discount to be paid to the underwriters by us. Such amounts are shown assuming both no exercise and full exercise of the underwriters’ option to purchase additional shares of Class A common stock.
Paid by Us
| No Exercise | Full Exercise | |||||||
| Per Share |
$ | $ | ||||||
| Total |
$ | $ | ||||||
Shares of Class A common stock sold by the underwriters to the public will initially be offered at the initial public offering price set forth on the cover of this prospectus. Any shares sold by the underwriters to securities dealers may be sold at a discount of up to $ per share from the initial public offering price. After the initial offering of the shares, the representatives may change the offering price and the other selling terms. The offering of the shares of Class A common stock by the underwriters is subject to receipt and acceptance and subject to the underwriters’ right to reject any order in whole or in part.
We, all of our directors and officers and Chesapeake have agreed with the underwriters, subject to certain exceptions, not to dispose of or hedge any of our Class A common stock or securities convertible into or exchangeable for shares of Class A common stock during the period from the date
138
Table of Contents
Index to Financial Statements
of this prospectus continuing through the date 180 days after the date of this prospectus, except with the prior written consent of Goldman, Sachs & Co. This agreement does not apply to any existing employee benefit plans. See “Shares Available for Future Sale” for a discussion of certain transfer restrictions.
The 180-day restricted period described in the preceding paragraph will be automatically extended if: (a) during the last 17 days of the 180-day restricted period we issue an earnings release or announce material news or a material event; or (b) prior to the expiration of the 180-day restricted period, we announce that we will release earnings results during the 15-day period following the last day of the 180- day period, in which case the restrictions described in the preceding paragraph will continue to apply until the expiration of the 18-day period beginning on the issuance of the earnings release or the announcement of the material news or material event.
Prior to this offering, there has been no public market for our Class A common stock. The initial public offering price has been negotiated among us and the representatives. Among the factors considered in determining the initial public offering price of the shares, in addition to prevailing market conditions, will be our historical performance, estimates of our business potential and earnings prospects, an assessment of our management and the consideration of the above factors in relation to market valuation of companies in related businesses.
We intend to apply to list our Class A common stock on the NYSE under the symbol “COS.”
In connection with the offering, the underwriters may purchase and sell shares of Class A common stock in the open market. These transactions may include short sales, stabilizing transactions and purchases to cover positions created by short sales. Short sales involve the sale by the underwriters of a greater number of shares than they are required to purchase in the offering, and a short position represents the amount of such sales that have not been covered by subsequent purchases. A “covered short position” is a short position that is not greater than the amount of additional shares for which the underwriters’ option described above may be exercised. The underwriters may cover any covered short position by either exercising their option to purchase additional shares of Class A common stock or purchasing shares in the open market. In determining the source of shares to cover the covered short position, the underwriters will consider, among other things, the price of shares available for purchase in the open market as compared to the price at which they may purchase additional shares pursuant to the option described above. “Naked” short sales are any short sales that create a short position greater than the amount of additional shares for which the option described above may be exercised. The underwriters must cover any such naked short position by purchasing shares in the open market. A naked short position is more likely to be created if the underwriters are concerned that there may be downward pressure on the price of the Class A common stock in the open market after pricing that could adversely affect investors who purchase in the offering. Stabilizing transactions consist of various bids for or purchases of Class A common stock made by the underwriters in the open market prior to the completion of the offering.
The underwriters may also impose a penalty bid. This occurs when a particular underwriter repays to the underwriters a portion of the underwriting discount received by it because the representatives have repurchased shares sold by or for the account of such underwriter in stabilizing or short covering transactions.
Purchases to cover a short position and stabilizing transactions, as well as other purchases by the underwriters for their own accounts, may have the effect of preventing or retarding a decline in the market price of our stock, and together with the imposition of the penalty bid, may stabilize, maintain or otherwise affect the market price of the Class A common stock. As a result, the price of the Class A common stock may be higher than the price that otherwise might exist in the open market. The
139
Table of Contents
Index to Financial Statements
underwriters are not required to engage in these activities and may end any of these activities at any time. These transactions may be effected on the NYSE, in the over-the-counter market or otherwise.
In connection with the offering, certain of the underwriters or securities dealers may distribute prospectuses by electronic means, such as e-mail.
Offering Restrictions
European Economic Area
In relation to each Member State of the European Economic Area which has implemented the Prospectus Directive (each, a “Relevant Member State”), each underwriter has represented and agreed that, with effect from and including the date on which the Prospectus Directive is implemented in that Relevant Member State (the “Relevant Implementation Date”), it has not made and will not make an offer of shares of Class A common stock to the public in that Relevant Member State prior to the publication of a prospectus in relation to the shares which has been approved by the competent authority in that Relevant Member State or, where appropriate, approved in another Relevant Member State and notified to the competent authority in that Relevant Member State, all in accordance with the Prospectus Directive, except that it may, with effect from and including the Relevant Implementation Date, make an offer of shares to the public in that Relevant Member State at any time:
| (a) | to legal entities which are authorized or regulated to operate in the financial markets or, if not so authorized or regulated, whose corporate purpose is solely to invest in securities; |
| (b) | to any legal entity which has two or more of (a) an average of at least 250 employees during the last financial year; (b) a total balance sheet of more than €43,000,000 and (3) an annual net turnover of more than €50,000,000, as shown in its last annual or consolidated accounts; |
| (c) | to fewer than 100 natural or legal persons (other than qualified investors as defined in the Prospectus Directive) subject to obtaining the prior consent of the representatives for any such offer; or |
| (d) | in any other circumstances which do not require the publication by the Issuer of a prospectus pursuant to Article 3 of the Prospectus Directive. |
For the purposes of this provision, the expression an “offer of shares to the public” in relation to any shares in any Relevant Member State means the communication in any form and by any means of sufficient information on the terms of the offer and the shares to be offered so as to enable an investor to decide to purchase or subscribe the shares, as the same may be varied in that Relevant Member State by any measure implementing the Prospectus Directive in that Relevant Member State and the expression Prospectus Directive means Directive 2003/71/EC and includes any relevant implementing measure in each Relevant Member State.
Each underwriter has represented and agreed that:
| (a) | it has only communicated or caused to be communicated and will only communicate or cause to be communicated an invitation or inducement to engage in investment activity (within the meaning of Section 21 of the FSMA) received by it in connection with the issue or sale of the shares in circumstances in which Section 21(1) of the FSMA would not, if the Company was not an authorized person, apply to the Company; and |
| (b) | it has complied and will comply with all applicable provisions of the FSMA with respect to anything done by it in relation to the shares in, from or otherwise involving the United Kingdom. |
140
Table of Contents
Index to Financial Statements
Hong Kong
The shares of Class A common stock may not be offered or sold by means of any document other than (a) in circumstances which do not constitute an offer to the public within the meaning of the Companies Ordinance (Cap.32, Laws of Hong Kong), or (b) to “professional investors” within the meaning of the Securities and Futures Ordinance (Cap.571, Laws of Hong Kong) and any rules made thereunder, or (c) in other circumstances which do not result in the document being a “prospectus” within the meaning of the Companies Ordinance (Cap.32, Laws of Hong Kong), and no advertisement, invitation or document relating to the shares may be issued or may be in the possession of any person for the purpose of issue (in each case whether in Hong Kong or elsewhere), which is directed at, or the contents of which are likely to be accessed or read by, the public in Hong Kong (except if permitted to do so under the laws of Hong Kong) other than with respect to shares which are or are intended to be disposed of only to persons outside Hong Kong or only to “professional investors” within the meaning of the Securities and Futures Ordinance (Cap. 571, Laws of Hong Kong) and any rules made thereunder.
Singapore
This prospectus has not been registered as a prospectus with the Monetary Authority of Singapore. Accordingly, this prospectus and any other document or material in connection with the offer or sale, or invitation for subscription or purchase, of the shares of Class A common stock may not be circulated or distributed, nor may the shares be offered or sold, or be made the subject of an invitation for subscription or purchase, whether directly or indirectly, to persons in Singapore other than (a) to an institutional investor under Section 274 of the Securities and Futures Act, Chapter 289 of Singapore (the “SFA”), (b) to a relevant person, or any person pursuant to Section 275(1A), and in accordance with the conditions, specified in Section 275 of the SFA or (c) otherwise pursuant to, and in accordance with the conditions of, any other applicable provision of the SFA.
Where the shares of Class A common stock are subscribed or purchased under Section 275 by a relevant person which is: (a) a corporation (which is not an accredited investor) the sole business of which is to hold investments and the entire share capital of which is owned by one or more individuals, each of whom is an accredited investor; or (b) a trust (where the trustee is not an accredited investor) whose sole purpose is to hold investments and each beneficiary is an accredited investor, shares, debentures and units of shares and debentures of that corporation or the beneficiaries’ rights and interest in that trust shall not be transferable for 6 months after that corporation or that trust has acquired the shares under Section 275 except: (a) to an institutional investor under Section 274 of the SFA or to a relevant person, or any person pursuant to Section 275(1A), and in accordance with the conditions, specified in Section 275 of the SFA; (b) where no consideration is given for the transfer; or (c) by operation of law.
Japan
The shares of Class A common stock have not been and will not be registered under the Financial Instruments and Exchange Law of Japan (the Financial Instruments and Exchange Law) and each underwriter has agreed that it will not offer or sell any securities, directly or indirectly, in Japan or to, or for the benefit of, any resident of Japan (which term as used herein means any person resident in Japan, including any corporation or other entity organized under the laws of Japan), or to others for re-offering or resale, directly or indirectly, in Japan or to a resident of Japan, except pursuant to an exemption from the registration requirements of, and otherwise in compliance with, the Financial Instruments and Exchange Law and any other applicable laws, regulations and ministerial guidelines of Japan.
141
Table of Contents
Index to Financial Statements
Switzerland
The shares of Class A common stock may not be publicly offered in Switzerland and will not be listed on the SIX Swiss Exchange (“SIX”) or on any other stock exchange or regulated trading facility in Switzerland. This document has been prepared without regard to the disclosure standards for issuance prospectuses under art. 652a or art. 1156 of the Swiss Code of Obligations or the disclosure standards for listing prospectuses under art. 27 ff. of the SIX Listing Rules or the listing rules of any other stock exchange or regulated trading facility in Switzerland. Neither this document nor any other offering or marketing material relating to the shares of Class A common stock or the offering may be publicly distributed or otherwise made publicly available in Switzerland.
Neither this document nor any other offering or marketing material relating to the offering, the Company, the shares of Class A common stock have been or will be filed with or approved by any Swiss regulatory authority. In particular, this document will not be filed with, and the offer of shares will not be supervised by, the Swiss Financial Market Supervisory Authority (“FINMA”), and the offer of shares of Class A common stock has not been and will not be authorized under the Swiss Federal Act on Collective Investment Schemes (“CISA”). The investor protection afforded to acquirers of interests in collective investment schemes under the CISA does not extend to acquirers of shares of Class A common stock.
Dubai International Financial Centre
This prospectus relates to an Exempt Offer in accordance with the Offered Securities Rules of the Dubai Financial Services Authority (“DFSA”). This prospectus is intended for distribution only to persons of a type specified in the Offered Securities Rules of the DFSA. It must not be delivered to, or relied on by, any other person. The DFSA has no responsibility for reviewing or verifying any documents in connection with Exempt Offers. The DFSA has not approved this prospectus nor taken steps to verify the information set forth herein and has no responsibility for the prospectus. The shares of Class A common stock to which this prospectus relates may be illiquid and/or subject to restrictions on their resale. Prospective purchasers of the shares of Class A common stock offered should conduct their own due diligence on the shares of Class A common stock. If you do not understand the contents of this prospectus you should consult an authorized financial advisor.
Notice to Prospective Investors in the United Kingdom
In addition, in the United Kingdom, this document is being distributed only to, and is directed only at, and any offer subsequently made may only be directed at persons who are “qualified investors” (as defined in the Prospectus Directive) (i) who have professional experience in matters relating to investments falling within Article 19 (5) of the Financial Services and Markets Act 2000 (Financial Promotion) Order 2005, as amended (the “Order”) and/or (ii) who are high net worth companies (or persons to whom it may otherwise be lawfully communicated) falling within Article 49(2)(a) to (d) of the Order (all such persons together being referred to as “relevant persons”). This document must not be acted on or relied on in the United Kingdom by persons who are not relevant persons. In the United Kingdom, any investment or investment activity to which this document relates is only available to, and will be engaged in with, relevant persons.
Other Relationships
The underwriters do not expect sales to discretionary accounts to exceed five percent of the total number of shares offered.
142
Table of Contents
Index to Financial Statements
We estimate that our share of the total expenses of the offering, excluding underwriting discounts and commissions, will be approximately $ . The underwriters have agreed to reimburse us for up to $ in expenses incurred by us in connection with this offering.
We have agreed to indemnify the several underwriters against certain liabilities, including liabilities under the Securities Act of 1933, or to contribute to payments the underwriters may be required to make in respect of these liabilities.
The underwriters and their respective affiliates are full service financial institutions engaged in various activities, which may include securities trading, commercial and investment banking, financial advisory, investment management, investment research, principal investment, hedging, financing and brokerage activities. Certain of the underwriters and their respective affiliates have, from time to time, performed, and may in the future perform, various financial advisory and investment banking services for us and for Chesapeake and its other affiliates, for which they received or will receive customary fees and expenses. Specifically, affiliates of Goldman, Sachs & Co. and Merrill Lynch, Pierce, Fenner & Smith Incorporated are lenders under our revolving bank credit facility and under Chesapeake’s corporate revolving bank credit facility and will, thus, receive a portion of the net proceeds from this offering through the repayment of borrowings outstanding under such credit facilities. In addition, an affiliate of Merrill Lynch, Pierce, Fenner & Smith Incorporated is a lessor under master lease agreements pursuant to which a portion of our drilling rig fleet is leased. See “Certain Relationships and Related Party Transactions—Drilling Rig Sale-Leaseback Transactions.”
In the ordinary course of their various business activities, the underwriters and their respective affiliates may make or hold a broad array of investments, including serving as counterparties to certain derivative and hedging arrangements, and actively trade debt and equity securities (or related derivative securities) and financial instruments (including bank loans) for their own account and for the accounts of their customers, and such investment and securities activities may involve securities and/or instruments of us (directly, as collateral securing other obligations or otherwise). The underwriters and their respective affiliates may also make investment recommendations and/or publish or express independent research views in respect of such securities or instruments and may at any time hold, or recommend to clients that they acquire, long and/or short positions in such securities and instruments.
143
Table of Contents
Index to Financial Statements
The validity of the shares of Class A common stock offered by this prospectus will be passed upon for us by Commercial Law Group, P.C., Oklahoma City, Oklahoma. Certain other legal matters will be passed upon for us by Bracewell & Giuliani LLP, Houston, Texas. Certain legal matters in connection with this offering will be passed upon for the underwriters by Mayer Brown LLP, Houston, Texas.
The consolidated financial statements of COS Holdings, L.L.C. as of December 31, 2011 and 2010 and for each of the three years in the period ended December 31, 2011, included in this prospectus, have been so included in reliance on the report of PricewaterhouseCoopers LLP, an independent registered public accounting firm, given on the authority of said firm as experts in auditing and accounting.
The consolidated financial statements of Bronco Drilling Company, Inc. as of December 31, 2010 and 2009, and for each of the three years ended December 31, 2010 included in this prospectus have been so included in reliance upon the report of Grant Thornton LLP, independent registered public accountants, upon authority of said firm as experts in accounting and auditing in giving said reports.
144
Table of Contents
Index to Financial Statements
WHERE YOU CAN FIND MORE INFORMATION
We have filed with the SEC a registration statement on Form S-1 (including the exhibits, schedules and amendments thereto) under the Securities Act, with respect to the shares of our Class A common stock offered hereby. This prospectus does not contain all of the information set forth in the registration statement and the exhibits and schedules thereto. For further information with respect to us and the Class A common stock offered hereby, we refer you to the registration statement and the exhibits and schedules filed therewith.
Statements contained in this prospectus as to the contents of any contract, agreement or any other document are summaries of the material terms of such contract, agreement or other document. With respect to each of these contracts, agreements or other documents filed as an exhibit to the registration statement, reference is made to the exhibits to the registration statement for a more complete description thereof. A copy of the registration statement, and the exhibits and schedules thereto, may be inspected without charge at the public reference facilities maintained by the SEC at 100 F Street NE, Washington, D.C. 20549. Copies of these materials may be obtained, upon payment of a duplicating fee, from the Public Reference Section of the SEC at 100 F Street NE, Washington, D.C. 20549. Please call the SEC at 1-800-SEC-0330 for further information on the operation of the public reference facility. The SEC maintains a website that contains reports, proxy and information statements and other information regarding registrants that file electronically with the SEC. The address of the SEC’s website is http://www.sec.gov.
After we have completed this offering, we will file annual, quarterly and current reports, proxy statements and other information with the SEC. Our website is located at http://www.cosok.com, and we expect to make our periodic reports and other information filed with or furnished to the SEC available, free of charge, through our website, as soon as reasonably practicable after those reports and other information are electronically filed with or furnished to the SEC. Information on our website or any other website is not incorporated by reference into this prospectus and does not constitute a part of this prospectus.
145
Table of Contents
Index to Financial Statements
F-1
Table of Contents
Index to Financial Statements
Report of Independent Registered Public Accounting Firm
To the Member of COS Holdings, L.L.C.:
In our opinion, the accompanying consolidated balance sheets and the related consolidated statements of operations, of changes in equity and of cash flows present fairly, in all material respects, the financial position of COS Holdings, L.L.C. (the “Company”) and its subsidiaries at December 31, 2011 and 2010, and the results of their operations and their cash flows for each of the three years in the period ended December 31, 2011 in conformity with accounting principles generally accepted in the United States of America. These financial statements are the responsibility of the Company’s management. Our responsibility is to express an opinion on these financial statements based on our audits. We conducted our audits of these statements in accordance with the standards of the Public Company Accounting Oversight Board (United States). Those standards require that we plan and perform the audit to obtain reasonable assurance about whether the financial statements are free of material misstatement. An audit includes examining, on a test basis, evidence supporting the amounts and disclosures in the financial statements, assessing the accounting principles used and significant estimates made by management, and evaluating the overall financial statement presentation. We believe that our audits provide a reasonable basis for our opinion.
As discussed in Notes 12 and 13 to the accompanying consolidated financial statements, the Company earned the majority of its revenues and has other significant transactions with affiliated entities.
/s/ PricewaterhouseCoopers LLP
Tulsa, Oklahoma
April 16, 2012
F-2
Table of Contents
Index to Financial Statements
CONSOLIDATED BALANCE SHEETS
| December 31, | ||||||||
| 2011 | 2010 | |||||||
| ($ in thousands) | ||||||||
| Assets |
||||||||
| Current Assets: |
||||||||
| Cash |
$ | 2,360 | $ | 370 | ||||
| Accounts receivable, net of allowance of $102 and $254 at December 31, 2011 and 2010, respectively |
31,070 | 10,381 | ||||||
| Affiliate accounts receivable |
172,456 | 87,556 | ||||||
| Inventory |
26,693 | 13,712 | ||||||
| Deferred income tax asset |
3,576 | 4,711 | ||||||
| Prepaid expenses and other |
16,891 | 8,321 | ||||||
| Assets held for sale |
1,360 | — | ||||||
|
|
|
|
|
|||||
| Total Current Assets |
254,406 | 125,051 | ||||||
|
|
|
|
|
|||||
| Property and Equipment: |
||||||||
| Property and equipment, at cost |
1,587,870 | 1,146,442 | ||||||
| Less: accumulated depreciation |
(362,290 | ) | (226,630 | ) | ||||
|
|
|
|
|
|||||
| Total Property and Equipment, Net |
1,225,580 | 919,812 | ||||||
|
|
|
|
|
|||||
| Other Assets: |
||||||||
| Investments |
16,657 | — | ||||||
| Goodwill |
42,370 | — | ||||||
| Intangible assets, net |
15,336 | 7,900 | ||||||
| Deferred financing costs |
19,644 | — | ||||||
| Other long-term assets |
24,589 | 3,385 | ||||||
|
|
|
|
|
|||||
| Total Other Assets |
118,596 | 11,285 | ||||||
|
|
|
|
|
|||||
| Total Assets |
$ | 1,598,582 | $ | 1,056,148 | ||||
|
|
|
|
|
|||||
| Liabilities and Equity |
||||||||
| Current Liabilities: |
||||||||
| Accounts payable |
$ | 63,681 | $ | 17,642 | ||||
| Affiliate accounts payable |
38,053 | — | ||||||
| Accrued liabilities |
143,180 | 123,946 | ||||||
| Notes payable |
— | 55,213 | ||||||
|
|
|
|
|
|||||
| Total Current Liabilities |
244,914 | 196,801 | ||||||
|
|
|
|
|
|||||
| Long-Term Liabilities: |
||||||||
| Deferred income tax liabilities |
95,976 | 33,899 | ||||||
| Senior notes |
650,000 | — | ||||||
| Revolving credit facility |
29,000 | — | ||||||
| Affiliate debt |
371,674 | 633,090 | ||||||
| Other liabilities |
25,236 | 26,035 | ||||||
|
|
|
|
|
|||||
| Total Long-Term Liabilities |
1,171,886 | 693,024 | ||||||
|
|
|
|
|
|||||
| Commitments and Contingencies (Note 6) |
||||||||
| Equity: |
||||||||
| Owner’s equity |
181,782 | 161,870 | ||||||
| Noncontrolling interest |
— | 4,453 | ||||||
|
|
|
|
|
|||||
| Total Equity |
|
181,782 |
|
166,323 | ||||
|
|
|
|
|
|||||
| Total Liabilities and Equity |
$ | 1,598,582 | $ | 1,056,148 | ||||
|
|
|
|
|
|||||
The accompanying notes are an integral part of these consolidated financial statements.
F-3
Table of Contents
Index to Financial Statements
CONSOLIDATED STATEMENTS OF OPERATIONS
| Years Ended December 31, | ||||||||||||
| 2011 | 2010 | 2009 | ||||||||||
| ($ in thousands) | ||||||||||||
| Revenues: |
||||||||||||
| Revenues from Chesapeake |
$ | 1,226,420 | $ | 779,290 | $ | 620,035 | ||||||
| Revenues from third parties |
77,076 | 36,466 | 30,244 | |||||||||
|
|
|
|
|
|
|
|||||||
| Total Revenues |
1,303,496 | 815,756 | 650,279 | |||||||||
| Operating Expenses: |
||||||||||||
| Operating costs |
987,032 | 666,924 | 556,008 | |||||||||
| Depreciation and amortization |
171,908 | 106,425 | 70,429 | |||||||||
| General and administrative, including expenses from affiliates (Notes 1 and 13) |
37,074 | 25,312 | 17,735 | |||||||||
| Gains on sales of property and equipment |
(3,571 | ) | (854 | ) | (1,551 | ) | ||||||
| Impairments |
2,729 | 9 | 26,797 | |||||||||
|
|
|
|
|
|
|
|||||||
| Total Operating Expenses |
1,195,172 | 797,816 | 669,418 | |||||||||
|
|
|
|
|
|
|
|||||||
| Operating Income (Loss) |
108,324 | 17,940 | (19,139 | ) | ||||||||
|
|
|
|
|
|
|
|||||||
| Other Income (Expense): |
||||||||||||
| Interest expense, including expenses from affiliates (Note 4) |
(65,072 | ) | (38,511 | ) | (23,453 | ) | ||||||
| Losses from equity investee |
— | (2,243 | ) | (164 | ) | |||||||
| Other income (expense) |
(2,464 | ) | 211 | (283 | ) | |||||||
|
|
|
|
|
|
|
|||||||
| Total Other Expense |
(67,536 | ) | (40,543 | ) | (23,900 | ) | ||||||
|
|
|
|
|
|
|
|||||||
| Income (Loss) Before Income Taxes |
40,788 | (22,603 | ) | (43,039 | ) | |||||||
| Income Tax Expense (Benefit) |
21,030 | (3,751 | ) | (2,656 | ) | |||||||
|
|
|
|
|
|
|
|||||||
| Net Income (Loss) |
19,758 | (18,852 | ) | (40,383 | ) | |||||||
|
|
|
|
|
|
|
|||||||
| Less: Net Loss Attributable To Noncontrolling Interest |
(154 | ) | (639 | ) | — | |||||||
|
|
|
|
|
|
|
|||||||
| Net Income (Loss) Attributable To COS Holdings, L.L.C. |
$ | 19,912 | $ | (18,213 | ) | $ | (40,383 | ) | ||||
|
|
|
|
|
|
|
|||||||
The accompanying notes are an integral part of these consolidated financial statements.
F-4
Table of Contents
Index to Financial Statements
CONSOLIDATED STATEMENTS OF CHANGES IN EQUITY
| Owner’s Equity |
Noncontrolling Interest |
Total Equity |
||||||||||
| ($ in thousands) | ||||||||||||
| Balance at January 1, 2009 |
$ | 220,466 | $ | — | $ | 220,466 | ||||||
| Net loss |
(40,383 | ) | — | (40,383 | ) | |||||||
|
|
|
|
|
|
|
|||||||
| Balance at December 31, 2009 |
180,083 | — | 180,083 | |||||||||
| Noncontrolling interest |
— | 5,092 | 5,092 | |||||||||
| Net loss |
(18,213 | ) | (639 | ) | (18,852 | ) | ||||||
|
|
|
|
|
|
|
|||||||
| Balance at December 31, 2010 |
161,870 | 4,453 | 166,323 | |||||||||
| Net income (loss) |
19,912 | (154 | ) | 19,758 | ||||||||
| Acquisition of noncontrolling interest |
— | (4,299 | ) | (4,299 | ) | |||||||
|
|
|
|
|
|
|
|||||||
| Balance at December 31, 2011 |
$ | 181,782 | $ | — | $ | 181,782 | ||||||
|
|
|
|
|
|
|
|||||||
The accompanying notes are an integral part of these consolidated financial statements.
F-5
Table of Contents
Index to Financial Statements
CONSOLIDATED STATEMENTS OF CASH FLOWS
| Years Ended December 31, | ||||||||||||
| 2011 | 2010 | 2009 | ||||||||||
| ($ in thousands) | ||||||||||||
| CASH FLOWS FROM OPERATING ACTIVITIES: |
||||||||||||
| NET INCOME (LOSS) |
$ | 19,758 | $ | (18,852 | ) | $ | (40,383 | ) | ||||
| ADJUSTMENTS TO RECONCILE NET INCOME (LOSS) TO CASH PROVIDED BY OPERATING ACTIVITIES: |
||||||||||||
| Depreciation and amortization |
171,908 | 106,425 | 70,429 | |||||||||
| Amortization of sale/leaseback gains |
(6,282 | ) | (5,726 | ) | (5,546 | ) | ||||||
| Amortization of deferred financing costs |
523 | — | — | |||||||||
| Gains on sales of property and equipment |
(3,571 | ) | (854 | ) | (1,551 | ) | ||||||
| Impairments |
2,729 | 9 | 26,797 | |||||||||
| Losses from equity investee |
— | 2,243 | 164 | |||||||||
| Stock-based compensation |
10,906 | 9,135 | 8,036 | |||||||||
| Deferred income tax expense (benefit) |
17,453 | (7,506 | ) | (6,217 | ) | |||||||
| Other |
(24 | ) | 5,123 | 4,479 | ||||||||
| Changes in operating assets and liabilities, net of effects from acquisitions: |
||||||||||||
| Accounts receivable |
(69,362 | ) | (12,026 | ) | (12,068 | ) | ||||||
| Inventory |
(12,981 | ) | (2,544 | ) | (4,146 | ) | ||||||
| Other current assets |
(7,565 | ) | (2,559 | ) | (1,317 | ) | ||||||
| Other long-term assets |
(21,204 | ) | (3,385 | ) | — | |||||||
| Accounts payable |
73,378 | 6,115 | (15,541 | ) | ||||||||
| Accrued liabilities |
38,834 | 16,826 | 7,758 | |||||||||
| Other long-term liabilities |
(3,414 | ) | (1,140 | ) | (5,174 | ) | ||||||
|
|
|
|
|
|
|
|||||||
| Net cash provided by operating activities |
211,086 | 91,284 | 25,720 | |||||||||
|
|
|
|
|
|
|
|||||||
| CASH FLOWS FROM INVESTING ACTIVITIES: |
||||||||||||
| Additions to property and equipment |
(395,260 | ) | (233,229 | ) | (325,895 | ) | ||||||
| Acquisition of businesses, net of cash acquired |
(343,094 | ) | (36,540 | ) | — | |||||||
| Proceeds from sales of assets |
110,902 | 46,438 | 6,010 | |||||||||
| Additions to investments |
(16,657 | ) | — | (3,025 | ) | |||||||
|
|
|
|
|
|
|
|||||||
| Net cash used in investing activities |
(644,109 | ) | (223,331 | ) | (322,910 | ) | ||||||
|
|
|
|
|
|
|
|||||||
| CASH FLOWS FROM FINANCING ACTIVITIES: |
||||||||||||
| Increase (decrease) in affiliate debt |
(168,606 | ) | 132,181 | 298,415 | ||||||||
| Borrowings from revolving credit facility |
168,000 | — | — | |||||||||
| Payments on revolving credit facility |
(139,000 | ) | — | — | ||||||||
| Proceeds from issuance of senior notes, net of offering costs |
637,000 | — | — | |||||||||
| Deferred financing costs |
(7,168 | ) | — | — | ||||||||
| Payments on third-party notes |
(55,213 | ) | — | (1,286 | ) | |||||||
|
|
|
|
|
|
|
|||||||
| Net cash provided by financing activities |
435,013 | 132,181 | 297,129 | |||||||||
|
|
|
|
|
|
|
|||||||
| Net increase (decrease) in cash |
1,990 | 134 | (61 | ) | ||||||||
| Cash, beginning of period |
370 | 236 | 297 | |||||||||
|
|
|
|
|
|
|
|||||||
| Cash, end of period |
$ | 2,360 | $ | 370 | $ | 236 | ||||||
|
|
|
|
|
|
|
|||||||
| SUPPLEMENTAL DISCLOSURE OF SIGNIFICANT NON-CASH INVESTING AND FINANCING ACTIVITIES: |
||||||||||||
| Increases (decreases) in accounts payable related to purchases of property and equipment and equipment |
$ | (31,146 | ) | $ | 21,895 | $ | (76,296 | ) | ||||
| Decrease in affiliate debt due to transfer of land and buildings |
$ | 85,868 | $ | — | $ | — | ||||||
| Note issued for acquisition of business |
$ | — | $ | 49,500 | $ | — | ||||||
| SUPPLEMENTAL DISCLOSURE OF CASH PAYMENTS (REFUNDS): |
||||||||||||
| Interest, net of amount capitalized |
$ | 1,493 | $ | — | $ | 20 | ||||||
| Income taxes, net of refunds received |
$ | (512 | ) | $ | 43 | $ | 323 | |||||
The accompanying notes are an integral part of these consolidated financial statements.
F-6
Table of Contents
Index to Financial Statements
NOTES TO CONSOLIDATED FINANCIAL STATEMENTS
| 1. | Organization, Basis of Presentation and Nature of Business |
Organization
COS Holdings, L.L.C., formerly known as Chesapeake Oilfield Services, L.L.C. (“COS LLC”, “our” or “we”), is an Oklahoma limited liability company formed on May 24, 2011, to own and operate the oilfield service companies of Chesapeake Energy Corporation (“Chesapeake”). Chesapeake Oilfield Operating, L.L.C. (“COO”), an Oklahoma limited liability company and a wholly owned subsidiary of COS LLC, was formed on September 19, 2011, and is the borrower under our $500.0 million revolving bank credit facility and the co-issuer of our $650.0 million 6.625% Senior Notes due 2019 (the “2019 Senior Notes”) (see Note 4). We conduct operations through the following wholly owned and consolidated subsidiaries: Nomac Drilling, L.L.C. (“Nomac”), Performance Technologies, L.L.C., PTL Prop Solutions, L.L.C., Thunder Oilfield Services, L.L.C., Compass Manufacturing, L.L.C., Hodges Trucking Company, L.L.C. (“Hodges”), Oilfield Trucking Solutions, L.L.C. (“OTS”), Great Plains Oilfield Rental, L.L.C., Keystone Rock & Excavation, L.L.C., Mid-States Oilfield Machine LLC and Nomac Services, L.L.C. (“Nomac Services”).
Basis of Presentation
The accompanying consolidated financial statements and related notes include the accounts of COS LLC and its subsidiaries, all of which were wholly owned as of and after October 25, 2011, and prior to that date include the assets, liabilities, results of operations and cash flows of Chesapeake’s oilfield service operations on a carve out basis. Chesapeake transferred those assets to COS LLC on October 25, 2011 and the transferred assets and liabilities were carried forward to COS LLC and are presented for all periods at their historical costs. COS LLC’s accounting and financial reporting policies conform to accounting principles and practices generally accepted in the United States of America (“GAAP”). All significant intercompany accounts and transactions within COS LLC have been eliminated.
The capital intensive nature of the oilfield service business in conjunction with our rapid growth over the periods presented has required Chesapeake to provide regular capital infusions to fund our activities. For purposes of these financial statements, prior to 2011, management has allocated these advances to affiliate debt based on the portion of Chesapeake’s consolidated debt estimated to be attributable to our operations. Interest expense was assumed to be paid to Chesapeake through additional borrowings of affiliate debt prior to October 25, 2011. On October 28, 2011, we issued $650.0 million principal amount of our 2019 Senior Notes in a private placement. We used the net proceeds of approximately $637.0 million from the notes issuance to pay down a portion of our affiliate debt with Chesapeake. On November 3, 2011, we entered into a five-year senior secured revolving bank credit facility with total commitments of $500.0 million. Prior to the completion of the notes issuance and the revolving bank credit facility, certain subsidiaries of COS LLC were guarantors of substantially all of Chesapeake’s debt. In connection with our issuance of the 2019 Senior Notes and our entry into the revolving bank credit facility, COS LLC and its subsidiaries ceased to be guarantors with respect to the debt of Chesapeake.
Chesapeake provides cash management services to COS LLC through a centralized treasury system. Prior to October 25, 2011, all intercompany charges and cost allocations covered by the centralized treasury system were deemed to have been paid to or received from Chesapeake in cash during the period in which the respective transactions were recorded in the financial statements. All intercompany charges and cost allocations were and will continue to be cash settled from and after October 25, 2011. Transactions between COS LLC and Chesapeake have been identified in the financial statements as transactions between affiliates (see Notes 12 and 13).
F-7
Table of Contents
Index to Financial Statements
COS HOLDINGS, L.L.C.
NOTES TO CONSOLIDATED FINANCIAL STATEMENTS—(Continued)
The accompanying consolidated financial statements include charges from Chesapeake for indirect corporate overhead to cover costs of functions such as legal, accounting, treasury, environmental, safety, information technology and other corporate services. These charges from Chesapeake were $33.7 million, $23.9 million and $17.6 million for the years ended December 31, 2011, 2010 and 2009, respectively. Management believes that the allocated charges are representative of the costs and expenses incurred by Chesapeake for COS LLC. See Note 13 for discussion of the methods of allocation.
Nature of Business
We provide a wide range of well site services, including drilling, hydraulic fracturing, oilfield rentals, oilfield trucking, fluid transportation and disposal, and other ancillary oilfield services. In addition, we manufacture natural gas compressors for Chesapeake. We conduct our operations in Kansas, Louisiana, New York, North Dakota, Ohio, Oklahoma, Pennsylvania, Texas, West Virginia, Wisconsin and Wyoming. As of December 31, 2011, our primary owned operating assets consisted of 40 drilling rigs, two hydraulic fracturing fleets, 202 rig relocation trucks, 56 cranes and forklifts, 113 trucks for fluid hauling and disposal, 2,074 frac tanks and approximately 1.5 million feet of tubulars. Additionally, we had 93 rigs leased under long-term contracts from an affiliate at December 31, 2011 (see Note 6). Our reportable business segments are drilling, hydraulic fracturing, oilfield rentals and oilfield trucking (see Note 14).
| 2. | Significant Accounting Policies |
Accounting Estimates
The preparation of consolidated financial statements in conformity with GAAP requires management to make estimates and assumptions that affect the reported amounts of assets and liabilities and disclosure of contingent assets and liabilities at the balance sheet date and the reported amounts of revenues and expenses during the reporting periods. Although management believes these estimates are reasonable, actual results could differ from those estimates. Areas where critical accounting estimates are made by management include:
| Ÿ | estimated useful lives of assets, which impacts depreciation and amortization of property and equipment; |
| Ÿ | impairment of long-lived assets; |
| Ÿ | income taxes; |
| Ÿ | accruals related to revenue, expenses, capital costs and contingencies; and |
| Ÿ | cost allocations as described in Note 13. |
Risks and Uncertainties
Historically, we have provided substantially all of our oilfield services to Chesapeake. For the years ended December 31, 2011, 2010 and 2009, Chesapeake accounted for approximately 94%, 96% and 95% of our revenues. Approximately 83% of Chesapeake’s estimated proved reserves volumes as of December 31, 2011 were natural gas and 84% of Chesapeake’s 2011 oil and natural gas sales volumes were natural gas. Sustained low natural gas prices, and volatile commodity prices in general, could have a material adverse effect on Chesapeake’s and our financial position, results of operations and cash flows, which could adversely impact our ability to comply with financial covenants under our revolving bank credit facility and further limit our ability to fund our planned capital expenditures.
F-8
Table of Contents
Index to Financial Statements
COS HOLDINGS, L.L.C.
NOTES TO CONSOLIDATED FINANCIAL STATEMENTS—(Continued)
Cash and Cash Equivalents
For purposes of the consolidated financial statements, we consider investments in all highly liquid instruments with original maturities of three months or less at date of purchase to be cash equivalents. There were no cash equivalents as of December 31, 2011 or 2010.
Accounts Receivable
Trade accounts receivable are recorded at the invoice amount and do not bear interest. The majority of our receivables, 85% and 89% at December 31, 2011 and 2010, respectively, are with Chesapeake and its subsidiaries. The allowance for doubtful accounts is our best estimate for losses that may occur resulting from disputed amounts with our customers and their inability to pay amounts owed. We determine the allowance based on historical write-off experience and information about specific customers. During 2011, 2010 and 2009, we recognized $0, $0 and $0.1 million, respectively, of bad debt expense related to potentially uncollectible receivables.
Inventory
We value inventory at the lower of cost or market using the average cost method. Average cost is derived from third-party invoices and production cost. Production cost includes material, labor and manufacturing overhead. Inventory primarily consists of components used in our compressor manufacturing business and proppants and chemicals used in our hydraulic fracturing operations. A summary of our inventory is as follows:
| December 31, | ||||||||
| 2011 | 2010 | |||||||
| ($ in thousands) | ||||||||
| Raw materials, components and supplies |
$ | 22,107 | $ | 12,001 | ||||
| Work in process |
4,586 | 1,711 | ||||||
|
|
|
|
|
|||||
| Total Inventory |
$ | 26,693 | $ | 13,712 | ||||
|
|
|
|
|
|||||
Property and Equipment
Property and equipment are carried at cost less accumulated depreciation. Depreciation of assets is based on estimates, assumptions and judgments relative to useful lives and salvage values. Upon the disposition of an asset, we eliminate the cost and related accumulated depreciation and include any resulting gain or loss in operating expenses in the consolidated statements of operations. We recorded net gains on sales of property and equipment of $3.6 million, $0.9 million and $1.6 million for the years ended December 31, 2011, 2010 and 2009, respectively. Expenditures for maintenance and repairs that do not add capacity or extend the useful life of an asset are expensed as incurred.
F-9
Table of Contents
Index to Financial Statements
COS HOLDINGS, L.L.C.
NOTES TO CONSOLIDATED FINANCIAL STATEMENTS—(Continued)
In 2011, we transferred land, buildings and improvements with a gross book value and accumulated depreciation of $94.0 million and $8.2 million, respectively, to Chesapeake. This was treated as a reduction in affiliate debt to Chesapeake. On October 1, 2011 we entered into a facilities lease agreement with Chesapeake to lease the land and buildings transferred for an initial term of approximately three years (see Note 6). A summary of property and equipment and their useful lives is as follows:
| December 31, | Estimated Useful Life | |||||||||
| 2011 | 2010 | |||||||||
| ($ in thousands) | (in years) | |||||||||
| Drilling rigs and related equipment |
$ | 885,667 | $ | 608,399 | 3-15 | |||||
| Oilfield rental equipment |
287,493 | 214,222 | 2-10 | |||||||
| Trucking and fluid disposal equipment |
141,314 | 93,640 | 5-8 | |||||||
| Leasehold improvements |
105,249 | 81,656 | 3-5 | |||||||
| Hydraulic fracturing equipment |
95,367 | 15,706 | 8 | |||||||
| Vehicles |
56,782 | 32,197 | 3 | |||||||
| Buildings and improvements |
1,416 | 76,273 | 3-39 | |||||||
| Land |
440 | 12,755 | — | |||||||
| Other |
14,142 | 11,594 | 3-7 | |||||||
|
|
|
|
|
|||||||
| Total property and equipment, at cost |
1,587,870 | 1,146,442 | ||||||||
|
|
|
|
|
|||||||
| Less: accumulated depreciation and amortization |
(362,290 | ) | (226,630 | ) | ||||||
|
|
|
|
|
|||||||
| Total property and equipment, net |
$ | 1,225,580 | $ | 919,812 | ||||||
|
|
|
|
|
|||||||
Depreciation is calculated using the straight-line method based on the assets’ estimated useful lives. These estimates are based on various factors including age (in the case of acquired assets), manufacturing specifications, technological advances and historical data concerning useful lives of similar assets.
Depreciation expense on property and equipment for the years ended December 31, 2011, 2010 and 2009 was $169.3 million, $105.8 million and $69.8 million, respectively. Included in property and equipment are $129.8 million and $150.9 million at December 31, 2011 and 2010, respectively, of assets that have not been put into service and therefore are not subject to depreciation.
Interest is capitalized on the average amount of accumulated expenditures for major capital projects under construction using a weighted average interest rate based on our outstanding borrowings until the underlying assets are placed into service. The capitalized interest is added to the cost of the assets and amortized to depreciation expense over the useful life of the assets. During 2011, 2010 and 2009, we capitalized interest of approximately $0.9 million, $0.6 million and $2.8 million, respectively.
Impairment of Long-Lived Assets
We review our long-lived assets, such as property and equipment, whenever, in management’s judgment, events or changes in circumstances indicate the carrying amount of the assets may not be recoverable. Factors that might indicate a potential impairment include a significant decrease in the market value of the long-lived asset, a significant change in the long-lived asset’s physical condition, a change in industry conditions or a reduction in cash flows associated with the use of the long-lived
F-10
Table of Contents
Index to Financial Statements
COS HOLDINGS, L.L.C.
NOTES TO CONSOLIDATED FINANCIAL STATEMENTS—(Continued)
asset. If these or other factors indicate the carrying amount of the asset may not be recoverable, we determine whether an impairment has occurred through analysis of the forecasted undiscounted cash flows of the asset at the lowest level that has an identifiable cash flow. If an impairment has occurred, we recognize a loss for the difference between the carrying amount and the fair value of the asset. We measure the fair value of the asset using market prices or, in the absence of market prices, based on an estimate of discounted cash flows. Cash flows are generally discounted using an interest rate commensurate with a weighted average cost of capital for a similar asset.
Management determined in the fourth quarter of 2011 to sell certain drill pipe, which is a component of property and equipment. Because the assets met the held-for-sale criteria, we were required to present such assets at the lower of carrying amount or fair value less the anticipated costs to sell. We evaluated these assets for impairment as of December 31, 2011, which resulted in us recognizing a $2.6 million impairment charge. Our fair value estimate was derived from bids received from interested parties. After the impairment charge, the assets had a carrying value of $1.4 million at December 31, 2011 and are included in assets held for sale in our consolidated balance sheets. The drill pipe was included as part of our oilfield rentals segment.
Our wholly owned subsidiary, Nomac, entered into an equipment purchase agreement with LeTourneau Technologies Drilling Systems, Inc. (“LTDSI”) in June 2008 to purchase nine drilling rigs and related equipment for $90.2 million. We made down payments totaling $22.5 million during 2008 in accordance with the agreement. LTDSI filed suit against Nomac in December 2008 related to a dispute involving the equipment purchase agreement. In 2009, the equipment purchase agreement was terminated and LTDSI agreed to deliver certain rig equipment with an estimated fair value of $15.5 million and retained the down payment made by Nomac. We recorded an impairment of long-lived assets in the amount of $7.0 million for the year ended December 31, 2009, equal to the down payments less the estimated fair value of the equipment received.
Investments
Investments in securities are accounted for under the equity method in circumstances where we have the ability to exercise significant influence over the operating and investing policies of the investee but do not have control. Under the equity method, we recognize our share of the investee’s earnings in our consolidated statements of operations. We consolidate all subsidiaries in which we hold a controlling interest.
We evaluate our investments for impairment and recognize a charge to earnings when any identified impairment is determined to be other than temporary. See Note 9 for further discussion of investments.
Variable Interest Entities
An entity is referred to as a variable interest entity (“VIE”) pursuant to accounting guidance for consolidation if it possesses one of the following criteria: (i) it is thinly capitalized, (ii) the residual equity holders do not control the entity, (iii) the equity holders are shielded from the economic losses, (iv) the equity holders do not participate fully in the entity’s residual economics, or (v) the entity was established with non-substantive voting interests. We consolidate a VIE when we have both the power to direct the activities that most significantly impact the activities of the VIE and the right to receive benefits or the obligation to absorb losses of the entity that could be potentially significant to the VIE. We do not consolidate VIEs when we are not the primary beneficiary. In order to determine whether we
F-11
Table of Contents
Index to Financial Statements
COS HOLDINGS, L.L.C.
NOTES TO CONSOLIDATED FINANCIAL STATEMENTS—(Continued)
have a variable interest in a VIE, we perform a qualitative analysis of the entity’s design, organizational structure, primary decision makers and relevant agreements. We continually monitor VIEs to determine if any events have occurred that could cause the primary beneficiary to change. See Note 10 for further discussion.
Goodwill, Intangible Assets and Amortization
Goodwill represents the cost in excess of fair value of the net assets of businesses acquired. In 2011, we recorded goodwill in the amounts of $27.2 million and $15.1 million related to our acquisitions of Bronco Drilling Company, Inc. (“Bronco”) and Horizon Oilfield Services, LLC (“Horizon”), respectively (See Note 3). Goodwill is not amortized. Intangible assets with finite lives are amortized on a basis that reflects the pattern in which the economic benefits of the intangible assets are realized, which is generally on a straight-line basis over an asset’s estimated useful life.
We review goodwill for impairment annually on October 1 or more frequently if events or changes in circumstances indicate that the carrying amount of the reporting unit exceeds its fair value. Circumstances that could indicate a potential impairment include a significant adverse change in the economic or business climate, a significant adverse change in legal factors, an adverse action or assessment by a regulator, unanticipated competition, loss of key personnel and the likelihood that a reporting unit or significant portion of a reporting unit will be sold or otherwise disposed of. Accounting guidance requires a two-step process for testing impairment. First, the fair value of each reporting unit is compared to its carrying value to determine whether an indication of impairment exists. Second, if impairment is indicated, the fair value of the reporting unit’s goodwill is determined by allocating the unit’s fair value to its assets and liabilities (including any unrecognized intangible assets) as if the reporting unit had been acquired in a business combination on the impairment test date. The amount of impairment for goodwill is measured as the excess of the carrying value of the reporting unit over its fair value.
When estimating fair values of a reporting unit for our goodwill impairment test, we use the income approach. The income approach provides an estimated fair value based on the reporting unit’s anticipated cash flows that are discounted using a weighted average cost of capital rate. Estimated cash flows are primarily based on projected revenues, operating expenses and capital expenditures and are discounted based on comparable industry average rates for weighted average cost of capital.
There was a significant adverse change in the economic and business climate as financial markets reacted to the credit crisis facing major lending institutions and worsening conditions in the overall economy throughout 2009. During the same time, there were significant declines in oil and natural gas prices which led to declines in service revenues, margins and cash flows. We considered the impact of these significant adverse changes in the economic and business climate as we performed our annual impairment assessment of goodwill in 2009. The estimated fair value of our oilfield trucking segment was negatively impacted by significant reductions in estimated cash flows, and we concluded that there was no remaining implied fair value attributable to the goodwill. Accordingly, we recorded a non-cash charge of $19.8 million in our operating results for the year ended December 31, 2009.
F-12
Table of Contents
Index to Financial Statements
COS HOLDINGS, L.L.C.
NOTES TO CONSOLIDATED FINANCIAL STATEMENTS—(Continued)
Our intangible assets consisting of customer relationships and a trade name, are subject to amortization. Amortization is calculated using the straight-line method. A summary of intangible assets and the useful lives is as follows:
| December 31, | Estimated Useful Life | |||||||||
| 2011 | 2010 | |||||||||
| ($ in thousands) | (in years) | |||||||||
| Customer relationships |
$ | 19,600 | $ | 9,600 | 3-20 | |||||
| Trade name |
1,400 | 1,400 | 10 | |||||||
|
|
|
|
|
|||||||
| Total intangible assets, at cost |
21,000 | 11,000 | ||||||||
| Less: accumulated amortization |
(5,664 | ) | (3,100 | ) | ||||||
|
|
|
|
|
|||||||
| Total intangible assets, net |
$ | 15,336 | $ | 7,900 | ||||||
|
|
|
|
|
|||||||
Amortization expense was $2.6 million, $0.6 million and $0.6 million for the years ended December 31, 2011, 2010 and 2009, respectively. Future estimated amortization expense is presented below.
| December 31, | ||||
| 2011 | ||||
| ($ in thousands) | ||||
| 2012 |
$ | 3,953 | ||
| 2013 |
3,953 | |||
| 2014 |
2,009 | |||
| 2015 |
620 | |||
| 2016 |
480 | |||
| After 2016 |
4,321 | |||
|
|
|
|||
| Total |
$ | 15,336 | ||
|
|
|
|||
Deferred Financing Costs
Legal fees and other debt issuance costs incurred in obtaining financing are amortized over the term of the debt using a method that approximates the effective interest method. Gross deferred financing costs were $20.2 million at December 31, 2011 related to our revolving bank credit facility and 2019 Senior Notes. Prior to 2011, we had no deferred financing costs. Amortization expense related to deferred financing costs was $0.5 million for the year ended December 31, 2011 and is included in interest expense in the consolidated statements of operations.
Other Long-Term Assets
Other long-term assets consist primarily of deposits on property and equipment. When we order equipment from manufacturers, we are often required to pay a deposit against the total cost of the order as part of the acceptance of the order. Occasionally, we are required to make progress payments as manufacturing milestones are reached. We had deposits on property and equipment of $20.9 million and $3.4 million at December 31, 2011 and 2010, respectively, primarily related to drilling rigs and related equipment and hydraulic fracturing equipment.
F-13
Table of Contents
Index to Financial Statements
COS HOLDINGS, L.L.C.
NOTES TO CONSOLIDATED FINANCIAL STATEMENTS—(Continued)
Accounts Payable
Included in accounts payable at December 31, 2011 and 2010 are liabilities of $13.4 million and $7.3 million, respectively, representing the amount by which checks issued, but not yet presented to our banks for collection, exceeded balances in applicable bank accounts.
Revenue Recognition
Substantially all of our revenues are derived from affiliates. We recognize revenue when services are performed, collection of receivables is probable, persuasive evidence of an arrangement exists and the price is fixed or determinable.
Drilling. We earn revenues by drilling oil and natural gas wells for our customers under daywork contracts. We recognize revenue on daywork contracts for the days completed based on the dayrate each contract specifies. We follow the percentage-of-completion method of accounting for footage drilling arrangements. Under this method, drilling revenues and costs related to a well in progress are recognized proportionately over the time it takes to drill the well. Payments received and costs incurred for mobilization services are recognized over the days of actual mobilization.
Hydraulic Fracturing. We recognize revenue upon the completion of each fracturing stage. We typically complete one or more fracturing stages per day per active crew during the course of a job. A stage is considered complete when the customer requests or the job design dictates that pumping discontinue for that stage. Invoices typically include a lump sum equipment charge determined by the rate per stage each contact specifies and product charges for sand, chemicals and other products actually consumed during the course of providing our services.
Oilfield Rentals. We rent many types of oilfield equipment including drill pipe, drill collars, tubing, blowout preventers, frac and mud tanks and also provide air drilling services and services associated with the transfer of fresh water to the well site. We price our rentals and services by the day or hour based on the type of equipment being rented and the service job being performed and recognize revenue ratably over the term of the rental.
Oilfield Trucking. Oilfield trucking provides rig relocation and logistics services as well as fluid handling services. Our trucks move drilling rigs, crude oil, other fluids and construction materials to and from the wellsite and also transport produced water from the well site. We price these services by the hour and recognize revenue as services are performed.
Litigation Accruals
We estimate our accruals related to litigation based on the facts and circumstances specific to the litigation and our past experience with similar claims. We estimate our liability related to pending litigation when we believe the amount or a range of the loss can be reasonably estimated. We record our best estimate of a loss when the loss is considered probable. When a loss is probable and there is a range of estimated loss with no best estimate in the range, we record the minimum estimated liability related to a lawsuit or claim. As additional information becomes available, we assess the potential liability related to our pending litigation and claims and revise our estimates accordingly.
Environmental Costs
Our operations involve the storage, handling, transport and disposal of bulk waste materials, some of which contain oil, contaminants and regulated substances. These operations are subject to various federal, state and local laws and regulations intended to protect the environment. Environmental
F-14
Table of Contents
Index to Financial Statements
COS HOLDINGS, L.L.C.
NOTES TO CONSOLIDATED FINANCIAL STATEMENTS—(Continued)
expenditures are expensed or capitalized depending on their future economic benefit. Expenditures that relate to an existing condition caused by past operations and that have no future economic benefit are expensed. There were no amounts capitalized as of December 31, 2011 and 2010. We record liabilities on an undiscounted basis when our remediation efforts are probable and the costs to conduct such remediation efforts can be reasonably estimated.
Leases
We lease drilling rigs, real property and rail cars through various leasing arrangements (see Note 6). When we enter into a leasing arrangement, we analyze the terms of the arrangement to determine its accounting treatment. As of December 31, 2011, all leases have been accounted for as operating leases.
We periodically incur costs to improve the assets that we lease under these arrangements. We record the improvement as a component of property and equipment and amortize the improvement over the shorter of the useful life of the improvement or the remaining lease term.
Income Taxes
Chesapeake and its subsidiaries historically have filed a consolidated federal income tax return and other state returns as required. We and certain of our subsidiaries, as limited liability companies, are not subject to federal income taxes. For these entities, for federal and state income tax purposes, all income, expenses, gains, losses and tax credits generated flow through to their respective members or partners. Because these items of income or loss ultimately flow up to Chesapeake’s corporate tax return, we have reported income taxes on a separate return basis for COS LLC and all of our subsidiaries. Accordingly, we have recognized deferred tax assets and liabilities for the future tax consequences attributable to differences between the financial statement carrying amounts of existing assets and liabilities and their respective tax bases for all our subsidiaries, including the limited liability companies as if each entity were a corporation, regardless of its actual characterization for U.S. federal income tax purposes.
A valuation allowance for deferred tax assets is recognized when it is more likely than not that some or all of the benefit from the deferred tax asset will not be realized. To assess that likelihood, we use estimates and judgment regarding our future taxable income, as well as the jurisdiction in which such taxable income is generated, to determine whether a valuation allowance is required. Such evidence can include our current financial position, our results of operations, both actual and forecasted, the reversal of deferred tax liabilities, and tax planning strategies as well as the current and forecasted business economics of our industry (see Note 8). We had no valuation allowance at December 31, 2011 and 2010.
The benefit of an uncertain tax position taken or expected to be taken on an income tax return is recognized in the consolidated financial statements at the largest amount that is more likely than not to be sustained upon examination by the relevant taxing authority. There were no uncertain tax positions at December 31, 2011 and 2010.
| 3. | Acquisitions |
On November 18, 2011, we entered into an agreement to acquire 100% of the membership interests in Horizon for $17.5 million. Horizon was merged into Nomac Services during 2011. Horizon provides field geology services, including mud logging, geosteering and geotechnical services in
F-15
Table of Contents
Index to Financial Statements
COS HOLDINGS, L.L.C.
NOTES TO CONSOLIDATED FINANCIAL STATEMENTS—(Continued)
connection with oil and natural gas exploration and production activities. The assets acquired consisted primarily of field equipment, vehicles, trailers, accounts receivable and a highly technical workforce. We allocated the purchase price to property and equipment, accounts receivable and goodwill in the amounts of $1.4 million, $1.0 million and $15.1 million, respectively, based on their fair values at the date of acquisition. None of the goodwill is deductible for tax purposes. Goodwill is primarily attributable to operational and cost synergies expected to be realized from the acquisition by integrating Horizon’s assembled workforce. The goodwill was assigned to our drilling segment.
On June 6, 2011, we acquired Bronco for an aggregate cash purchase price of $339.2 million, or $11.00 per share of Bronco common stock. The following table summarizes the fair value of assets acquired and liabilities assumed:
| As of | ||||
| June 6, 2011 | ||||
| ($ in thousands) | ||||
| Current assets |
$ | 53,396 | ||
| Drilling rigs and equipment |
290,932 | |||
| Goodwill |
27,231 | |||
| Intangible assets |
10,000 | |||
| Other |
15,461 | |||
|
|
|
|||
| Total assets acquired |
397,020 | |||
| Current liabilities |
31,542 | |||
| Long-term liabilities |
1,223 | |||
| Deferred income taxes |
25,055 | |||
|
|
|
|||
| Total liabilities assumed |
57,820 | |||
|
|
|
|||
| Net assets acquired |
$ | 339,200 | ||
|
|
|
|||
We received carryover tax basis in Bronco’s assets and liabilities because the acquisition was not a taxable transaction under the Internal Revenue Code. Based upon the purchase price allocation, a step-up in basis related to the assets acquired from Bronco resulted in a net deferred tax liability of approximately $25.1 million. Prior to purchase price adjustments, we recorded goodwill of $52.1 million, which represents the amount of the consideration transferred in excess of the fair values assigned to the individual assets acquired and liabilities assumed. We recorded purchase price adjustments of approximately $24.9 million during the year ended December 31, 2011 largely related to a reduction in the deferred income tax liability assumed as part of the transaction and tax refunds received. Goodwill is primarily attributable to operational and cost synergies expected to be realized from the acquisition by integrating Bronco’s drilling rigs and assembled workforce. None of the goodwill is deductible for tax purposes. The goodwill was assigned to our drilling segment. We tested the goodwill for impairment as of October 1, 2011 and concluded that no impairment was necessary. We assigned $10.0 million of the purchase price to customer lists which are included in intangible assets on the balance sheet at December 31, 2011. Customer lists will be amortized under the straight-line method over three years.
F-16
Table of Contents
Index to Financial Statements
COS HOLDINGS, L.L.C.
NOTES TO CONSOLIDATED FINANCIAL STATEMENTS—(Continued)
The following table sets forth our unaudited pro forma revenues and net income (loss) giving effect to the Bronco acquisition as though it was effective January 1, 2009. Pro forma adjustments primarily relate to additional depreciation, amortization and interest costs. The information reflects our historical data and historical data from the acquired business for the periods indicated. The pro forma data may not be indicative of the results we would have achieved had the acquisition been completed on the date assumed, or that we may achieve in the future.
| Years Ended December 31, | ||||||||||||
| 2011 | 2010 | 2009 | ||||||||||
| ($ in thousands) | ||||||||||||
| (unaudited) | ||||||||||||
| Total revenues |
$ | 1,366,066 | $ | 940,155 | $ | 753,175 | ||||||
| Net income (loss) |
$ | (12,290 | ) | $ | (62,748 | ) | $ | (91,768 | ) | |||
On December 15, 2010, we acquired all of the membership interests in Forrest Rig Company, L.L.C. and Forrest Top Drive, L.L.C. (collectively “Forrest”). Included in these acquisitions were seven drilling rigs and related equipment. The aggregate purchase price was $84.5 million, of which $35.0 million was paid in cash and $49.5 million was paid in the form of a promissory note issued to the sellers (see Note 4). We allocated the entire purchase price to property and equipment based on their fair values at the date of acquisition.
On August 31, 2010, we completed the acquisition of an additional 12% of the preferred stock of Resource Energy Services Corporation (“Rensco”), increasing our interest from 46% to 58%, and providing us with control over Rensco. Rensco was renamed Nomac Services during 2011. As a result of obtaining control, we began to consolidate Rensco’s financial results with ours and reflect a noncontrolling interest as a separate component of equity on the consolidated balance sheet. In 2011, we acquired the remaining 42% of the preferred stock of Rensco for $3.1 million, thereby eliminating the noncontrolling interest. The difference between the consideration paid for the remaining 42% and the carrying value attributed to the noncontrolling interest is reflected in owners’ equity. Rensco provides directional drilling services and downhole tools and equipment in connection with oil and natural gas exploration and production activities. We previously accounted for our 46% interest in Rensco as an equity method investee. We recorded losses from our equity investee of $0.3 million and $0.2 million for the years ended December 31, 2010 and 2009, respectively.
F-17
Table of Contents
Index to Financial Statements
COS HOLDINGS, L.L.C.
NOTES TO CONSOLIDATED FINANCIAL STATEMENTS—(Continued)
The fair value of the consideration transferred for the additional 12% interest acquired in 2010 consisted of cash of $1.5 million. The following table details the consideration paid for the additional 12% interest in Rensco, the fair value of the previously held equity interest and noncontrolling interest in Rensco and the fair value of the assets acquired and liabilities assumed at the acquisition date.
| As of August 31, | ||||
| 2010 | ||||
| ($ in thousands) | ||||
| Consideration paid for additional 12% interest |
$ | 1,540 | ||
| Fair value of previously held 46% equity interest in Rensco |
5,617 | |||
|
|
|
|||
| $ | 7,157 | |||
|
|
|
|||
| Cash |
$ | 389 | ||
| Accounts receivable |
5,518 | |||
| Inventory |
494 | |||
| Prepaid expenses and other |
320 | |||
| Directional drilling equipment, net |
14,504 | |||
| Accounts payable |
(1,968 | ) | ||
| Accrued liabilities |
(1,005 | ) | ||
| Revolving credit facilities |
(6,003 | ) | ||
| Noncontrolling interest |
(5,092 | ) | ||
|
|
|
|||
| Total identifiable net assets |
$ | 7,157 | ||
|
|
|
|||
We recognized a loss of $2.0 million as a result of remeasuring to fair value our previously held equity interest in Rensco of $7.6 million at the acquisition date. The loss is included in losses from equity investee in the accompanying consolidated statement of operations for the year ended December 31, 2010.
The fair value of the previously held equity interest and the noncontrolling interest in Rensco was estimated by applying significant unobservable Level 3 inputs as no market exists for the member interest acquired.
| 4. | Debt |
Affiliate Debt
On October 21, 2011, we entered into a five year $1.5 billion revolving promissory note with Chesapeake. The note has a stated annual interest rate of 6.875% and interest is payable semi-annually. The note has a maturity date of October 1, 2016. The initial balance of the note represented the portion of Chesapeake’s consolidated debt estimated to be attributable to our operations presented on a push-down basis prior to our entering into the revolving promissory note. Interest expense charged to us of $54.5 million, $38.5 million and $23.4 million for the years ended December 31, 2011, 2010 and 2009, respectively, was based on Chesapeake’s average borrowing rate for the periods prior to our entering into the promissory note. The average outstanding affiliate debt was $502.4 million, $564.8 million and $359.0 million for the years ended December 31, 2011, 2010 and 2009, respectively. Interest expense was assumed to be paid to Chesapeake through additional borrowings of affiliate debt prior to November 1, 2011 and cash settled on and after November 1, 2011. Management believes this presentation best represents the cost of financing our operations prior to our entering into our revolving bank credit facility.
F-18
Table of Contents
Index to Financial Statements
COS HOLDINGS, L.L.C.
NOTES TO CONSOLIDATED FINANCIAL STATEMENTS—(Continued)
Senior Notes
On October 28, 2011, we issued $650.0 million principal amount of our 2019 Senior Notes in a private placement. We incurred $14.8 million in financing costs related to the notes issuance which have been deferred and will be amortized over the life of the 2019 Senior Notes. We used the net proceeds of approximately $637.0 million from the 2019 Senior Notes issuance to pay down a portion of our affiliate debt with Chesapeake. The 2019 Senior Notes will mature on November 15, 2019 and interest is payable semi-annually on each of May 15 and November 15, beginning on May 15, 2012. COO and Chesapeake Oilfield Finance, Inc., our wholly owned subsidiary, are the co-issuers of the 2019 Senior Notes.
We may redeem up to 35% of the 2019 Senior Notes with proceeds of certain equity offerings at a redemption price of 106.625% of the principal amount plus accrued and unpaid interest prior to November 15, 2014. Prior to November 15, 2015, but after November 15, 2014, we may redeem some or all of the 2019 Senior Notes at a price equal to 100% of the principal amount plus a make-whole premium determined pursuant to a formula set forth in the indenture governing the 2019 Senior Notes, plus accrued and unpaid interest. On and after November 15, 2015, we may redeem all or part of the 2019 Senior Notes at the following prices (as a percentage of principal), plus accrued and unpaid interest, if redeemed during the 12-month period beginning on November 15 of the years indicated below:
| Redemption | ||||
| Year |
Price | |||
| 2015 |
103.313 | % | ||
| 2016 |
101.656 | % | ||
| 2017 and thereafter |
100.000 | % | ||
The 2019 Senior Notes are subject to covenants that, among other things, limit our ability and the ability of certain of our subsidiaries to: (1) sell assets; (2) declare dividends or make cash distributions on our equity interests or purchase or redeem our equity interests; (3) make investments or other specified restricted payments; (4) incur or guarantee additional indebtedness and issue disqualified or preferred equity; (5) create or incur certain liens; (6) enter into agreements that restrict the ability of our restricted subsidiaries to pay dividends, make intercompany loans or transfer assets to us; (7) effect a merger, consolidation or sale of all or substantially all of our assets; (8) enter into transactions with affiliates; and (9) designate subsidiaries as unrestricted subsidiaries. We were in compliance with these covenants at December 31, 2011. If the 2019 Senior Notes achieve an investment grade rating by either of Moody’s Investors Service, Inc. (“Moody’s”) or Standard & Poor’s Rating Services (“S&P”), our obligation to comply with certain of these covenants will be suspended, and if the notes achieve an investment grade rating from both of Moody’s and S&P, then such obligations will terminate.
Under a registration rights agreement, we have agreed to file a registration statement within 365 days after the closing of the notes offering enabling holders of notes to exchange the privately placed notes for publicly registered exchange notes with substantially the same terms and to use our commercially reasonable best efforts to cause the registration statement to become effective as soon as practicable after filing and to consummate the exchange offer on the earliest practicable date after the registration statement has become effective, but in no event later than 60 days after the date the registration statement has become effective. We have also agreed to make additional interest payments to holders of the notes under certain circumstances if we do not comply with our obligations under the registration rights agreement. The notes are guaranteed by all of our existing subsidiaries, other than certain immaterial subsidiaries.
F-19
Table of Contents
Index to Financial Statements
COS HOLDINGS, L.L.C.
NOTES TO CONSOLIDATED FINANCIAL STATEMENTS—(Continued)
Revolving Credit Facility
On November 3, 2011, we entered into a five-year $500.0 million senior secured revolving bank credit facility. We incurred $5.4 million in financing costs related to the credit facility which has been deferred and will be amortized over the life of the credit facility. The credit facility may be increased to $900.0 million at our option, subject to compliance with the indenture governing the 2019 Senior Notes, certain other requirements and lender approval. The credit facility is used to fund capital expenditures and for general corporate purposes associated with our operations. Borrowings under the credit facility are secured by liens on all of the equity interests of our current and future guarantor subsidiaries and all of their assets, including real and personal property, and bear interest at our option at either (i) the greater of the reference rate of Bank of America, N.A., the federal funds effective rate plus 0.50%, and one-month LIBOR plus 1.00%, all of which are subject to a margin that varies from 1.00% to 1.75% per annum, according to our leverage ratio, or (ii) the Eurodollar rate, which is based on LIBOR plus a margin that varies from 2.00% to 2.75% per annum, according to our leverage ratio. The unused portion of the credit facility is subject to a commitment fee that varies from 0.375% to 0.50% per annum, according to our leverage ratio. We recorded commitment fee expense of $0.4 million for the year ended December 31, 2011. Interest is payable quarterly or, if LIBOR applies, it may be payable at more frequent intervals. COO is the borrower under our credit facility.
The credit facility agreement contains various covenants and restrictive provisions which limit our and our restricted subsidiaries’ ability to incur additional indebtedness, make investments or loans and create liens. The credit facility requires maintenance of a leverage ratio, a senior secured leverage ratio and a fixed charge coverage ratio, in each case as defined in the credit facility agreement. We were in compliance with all covenants at December 31, 2011. If we or our subsidiaries should fail to perform our obligations under these and other covenants, the credit facility could be terminated and any outstanding borrowings under the facility could be declared immediately due and payable. The credit facility also contains cross default provisions that apply to other indebtedness, including our 2019 Senior Notes, that we and our restricted subsidiaries may have from time to time with an outstanding principal amount in excess of $15.0 million.
No scheduled principal payments are required on any of our long-term debt until 2016, when our affiliate debt and credit facility become due.
Other Financings
On December 15, 2010, we entered into a $49.5 million note payable to the sellers in the Forrest transaction. The note has a stated annual interest rate of 6.0%. We made principal and interest payments monthly in the amount of approximately $4.3 million until November 2, 2011, when the remaining obligation was paid off in its entirety. At December 31, 2010, the note payable had a balance of $49.5 million.
On September 1, 2009, Rensco entered into a revolving bank credit facility agreement in the amount of $2.0 million. The facility was secured by Rensco’s accounts receivable, had an annual interest rate of 7.0% and was scheduled to mature on September 1, 2012. At December 31, 2010, the facility had an outstanding balance of $2.0 million. The loan was paid in full in 2011.
On February 28, 2007, Rensco entered into a revolving promissory note in the amount of $4.0 million, which was secured by a first lien on all of Rensco’s operating equipment. The facility had an annual interest rate of LIBOR plus 2.5%, a maturity date of February 28, 2011 and required monthly
F-20
Table of Contents
Index to Financial Statements
COS HOLDINGS, L.L.C.
NOTES TO CONSOLIDATED FINANCIAL STATEMENTS—(Continued)
payments of accrued interest only. At December 31, 2010, the facility had an outstanding balance of $3.7 million and an effective interest rate of 2.8%. The loan was paid in full in 2011.
| 5. | Other Current and Long-Term Liabilities |
Other current and long-term liabilities as of December 31, 2011 and 2010 are detailed below:
| December 31, | ||||||||
| 2011 | 2010 | |||||||
| ($ in thousands) | ||||||||
| Accrued Liabilities: |
||||||||
| Operating expenditures |
$ | 38,767 | $ | 20,568 | ||||
| Payroll related |
34,222 | 17,594 | ||||||
| Self-insurance reserves |
23,686 | 11,717 | ||||||
| Property and equipment |
22,155 | 53,301 | ||||||
| Interest |
12,941 | — | ||||||
| Property, sales, use and other taxes |
5,984 | 5,234 | ||||||
| Deferred gain on sale/leasebacks |
5,425 | 6,309 | ||||||
| Employee incentives |
— | 4,010 | ||||||
| Other |
— | 5,213 | ||||||
|
|
|
|
|
|||||
| Total Accrued Liabilities |
$ | 143,180 | $ | 123,946 | ||||
|
|
|
|
|
|||||
| Other Liabilities: |
||||||||
| Deferred gain on sale/leasebacks |
$ | 24,729 | $ | 25,398 | ||||
| Other |
507 | 637 | ||||||
|
|
|
|
|
|||||
| Total Other Liabilities |
$ | 25,236 | $ | 26,035 | ||||
|
|
|
|
|
|||||
In August 2006, we agreed to pay approximately $14.0 million in cash bonuses to certain employees with 50% of the bonus payable after three years of service and the remaining 50% payable after five years of service. Compensation expense was recognized using the straight-line method over the respective terms of the two separate vesting tranches. Compensation expense related to these bonuses for the years ended December 31, 2011, 2010 and 2009 was $0.2 million, $0.6 million and $1.9 million, respectively.
F-21
Table of Contents
Index to Financial Statements
COS HOLDINGS, L.L.C.
NOTES TO CONSOLIDATED FINANCIAL STATEMENTS—(Continued)
| 6. | Commitments and Contingencies |
Leases
In a series of transactions since 2006, we sold 93 drilling rigs (net of one repurchased rig) and related equipment for $801.8 million and entered into master lease agreements under which we agreed to lease the rigs from the buyers for initial terms of five to ten years. These transactions were recorded as sales and operating leasebacks and any related gain or loss is amortized to operating expense over the lease term. The deferred gain, net of fees, is included in accrued liabilities and other liabilities on our consolidated balance sheets. We amortized $6.3 million, $5.7 million and $5.5 million to operating expense related to the deferred gain for the years ended December 31, 2011, 2010 and 2009, respectively, on a straight-line basis. The table below summarizes certain of the terms of these sale-leaseback arrangements.
| Year of |
Rigs Sold |
Leaseback Term (Years) |
Initial Sales Proceeds |
Net Book Value of P&E |
Fees | Deferred Gains |
||||||||||||||||||
| ($ in thousands) | ||||||||||||||||||||||||
| 2006 |
24 | 8 | $ | 243,615 | $ | 213,636 | $ | 790 | $ | 29,189 | ||||||||||||||
| 2007 |
54 | 7-10 | 369,765 | 354,014 | 939 | 14,812 | ||||||||||||||||||
| 2008 |
4 | 7-10 | 51,135 | 48,009 | 128 | 2,998 | ||||||||||||||||||
| 2010 |
3 | 7 | 40,360 | 33,576 | 297 | 6,487 | ||||||||||||||||||
| 2011 |
8 | 5-7 | 96,940 | 86,171 | 1,829 | 8,940 | ||||||||||||||||||
|
|
|
|
|
|
|
|
|
|
|
|||||||||||||||
| Total |
93 | $ | 801,815 | $ | 735,406 | $ | 3,983 | $ | 62,426 | |||||||||||||||
|
|
|
|
|
|
|
|
|
|
|
|||||||||||||||
On October 25, 2011, we assigned our drilling rig leases to Chesapeake Equipment Finance, L.L.C. (“CEF”), a wholly owned subsidiary of Chesapeake, and then entered into subleases for the rigs with CEF on terms consistent with those in the original leases. Under the rig leases, CEF can exercise a purchase option, and pursuant to a drilling rig repurchase agreement between us and CEF, we can require CEF to exercise its purchase option. To purchase a rig from CEF, we must pay CEF the greater of (a) the price, including all purchase expenses paid by CEF; or (b) the then current fair market value of the rig.
On October 1, 2011 we entered into a facilities lease agreement with Chesapeake pursuant to which we lease a number of the storage yards and other physical facilities out of which we conduct our operations. The initial term of the lease agreement ends December 31, 2014, after which the agreement is automatically renewed for successive one-year terms until we or Chesapeake terminate it. During such period, the amount of rent charged by Chesapeake increases by 2.5% each year. We make monthly payments to Chesapeake under the lease agreement that cover rent and our proportionate share of maintenance, operating expenses, taxes and insurance. These leases are being treated as operating leases.
In December 2011, we entered into six lease agreements with various third parties to lease rail cars for initial terms of six months to five years. These rail cars are used to transport sand for our hydraulic fracturing operations. Additional rental payments are required for the use of rail cars in excess of the allowable mileage stated in the respective agreements. These leases are being treated as operating leases.
F-22
Table of Contents
Index to Financial Statements
COS HOLDINGS, L.L.C.
NOTES TO CONSOLIDATED FINANCIAL STATEMENTS—(Continued)
Aggregate undiscounted minimum future lease payments under our noncancelable operating leases are presented below:
| December 31, 2011 | ||||||||||||||||
| Rigs | Real Property | Rail Cars | Total | |||||||||||||
| ($ in thousands) | ||||||||||||||||
| 2012 |
$ | 109,904 | $ | 8,273 | $ | 5,759 | $ | 123,936 | ||||||||
| 2013 |
112,105 | 8,273 | 6,005 | 126,383 | ||||||||||||
| 2014 |
97,873 | 8,273 | 5,185 | 111,331 | ||||||||||||
| 2015 |
39,424 | — | 4,481 | 43,905 | ||||||||||||
| 2016 |
67,139 | — | 4,050 | 71,189 | ||||||||||||
| After 2016 |
25,576 | — | — | 25,576 | ||||||||||||
|
|
|
|
|
|
|
|
|
|||||||||
| Total |
$ | 452,021 | $ | 24,819 | $ | 25,480 | $ | 502,320 | ||||||||
|
|
|
|
|
|
|
|
|
|||||||||
Rent expense for rigs, real property and rail cars, including short-term rentals, for the years ended December 31, 2011, 2010 and 2009 was $107.1 million, $94.7 million, and $94.1 million, respectively, which was recorded as operating expenses in our consolidated statements of operations.
Much of the equipment we purchase requires long lead times in production. As a result, most of the time we have outstanding orders and commitments for such equipment. As of December 31, 2011, we had $255.4 million and $25.1 million of purchase obligations related to future capital expenditures for 2012 and 2013, respectively. The capital expenditures are primarily for drilling rigs and related equipment and hydraulic fracturing equipment.
On October 7, 2011, we entered into a membership interest purchase agreement with Maalt Specialized Bulk, L.L.C. (“Maalt”) (See Note 9). Under the agreement, we could be required to make future additional payments not to exceed $3.0 million which are contingent on Maalt meeting certain performance targets. Each year during the period of three consecutive years beginning December 6, 2011, we will determine whether Maalt has met the specified performance targets for the preceding year. In the event that Maalt has met the specified performance targets for the preceding year, we will make additional payments for such year in the amount of $1.0 million, or a fraction thereof based upon the number of specified performance targets met. No payments have been required under these commitments at December 31, 2011.
We also entered into a transportation services and usage agreement with Maalt. Maalt will dedicate a portion of its trucking fleet to allow us to meet our sand transportation needs. The size of the dedicated fleet will be determined on a monthly basis based on our projected needs and agreed upon by both parties. We have guaranteed to Maalt that we will utilize its services at such a rate that the aggregate monthly revenue generated by the number of trucking units in the dedicated fleet exceeds a certain threshold stated in the agreement. If this threshold is not met during any month, we must pay Maalt an amount equal to 90.0% of the difference between the minimum services threshold and the total revenue generated by the trucking units during the applicable month. We made payments in the amount of $0.1 million related to this agreement during 2011.
Litigation
We are involved in various lawsuits and disputes incidental to our business operations, including commercial disputes, personal injury claims, property damage claims and contract actions. We record an associated liability when a loss is probable and the amount is reasonably estimable. Although the outcome of litigation cannot be predicted with certainty, management is of the opinion that no pending
F-23
Table of Contents
Index to Financial Statements
COS HOLDINGS, L.L.C.
NOTES TO CONSOLIDATED FINANCIAL STATEMENTS—(Continued)
or threatened lawsuit or dispute incidental to our business operations is likely to have a material adverse effect on our consolidated financial position, results of operations or cash flows. The final resolution of such matters could exceed amounts accrued and actual results could differ materially from management’s estimate.
Self-Insured Reserves
We are self-insured up to certain retention limits with respect to workers’ compensation and general liability matters. We maintain accruals for self-insurance retentions that we estimate using third-party data and claims history. Included in operating expenses is workers’ compensation expense of $16.5 million, $7.9 million and $6.7 million during the years ended December 31, 2011, 2010 and 2009, respectively.
| 7. | Stock-Based Compensation |
Chesapeake’s stock-based compensation program consists of restricted stock awarded to employees and non-employee directors. The fair value of the awards is determined based on the fair market value of the shares of Chesapeake common stock on the date of the grant. This value is amortized over the vesting period, which is generally four years from the date of the grant. To the extent compensation cost relates to employees directly involved in oilfield service operations, such amounts are charged to us and reflected as operating expenses. Included in operating expenses is stock-based compensation expense of $10.9 million, $9.1 million and $8.0 million for the years ended December 31, 2011, 2010 and 2009, respectively. To the extent compensation cost relates to employees indirectly involved in oilfield service operations, such amounts are charged to us through an overhead allocation and are reflected as general and administrative expenses.
A summary of the status and changes of the unvested shares of restricted stock related to employees directly involved in oilfield service operations is presented below.
| Number of Unvested Restricted Shares |
Weighted Average Grant-Date Fair Value |
|||||||
| (in thousands) | ||||||||
| Unvested shares as of January 1, 2011 |
1,268 | $ | 26.89 | |||||
| Granted |
939 | $ | 29.18 | |||||
| Vested |
(611 | ) | $ | 29.99 | ||||
| Forfeited |
(100 | ) | $ | 26.51 | ||||
|
|
|
|||||||
| Unvested shares as of December 31, 2011 |
1,496 | $ | 27.15 | |||||
|
|
|
|||||||
| Unvested shares as of January 1, 2010 |
994 | $ | 30.03 | |||||
| Granted |
674 | $ | 23.75 | |||||
| Vested |
(257 | ) | $ | 30.59 | ||||
| Forfeited |
(143 | ) | $ | 27.26 | ||||
|
|
|
|||||||
| Unvested shares as of December 31, 2010 |
1,268 | $ | 26.89 | |||||
|
|
|
|||||||
| Unvested shares as of January 1, 2009 |
872 | $ | 39.82 | |||||
| Granted |
544 | $ | 18.77 | |||||
| Vested |
(330 | ) | $ | 37.95 | ||||
| Forfeited |
(92 | ) | $ | 27.88 | ||||
|
|
|
|||||||
| Unvested shares as of December 31, 2009 |
994 | $ | 30.03 | |||||
|
|
|
|||||||
F-24
Table of Contents
Index to Financial Statements
COS HOLDINGS, L.L.C.
NOTES TO CONSOLIDATED FINANCIAL STATEMENTS—(Continued)
The aggregate intrinsic value of restricted stock vested for the year ended December 31, 2011, as reflected in the table above, was approximately $17.2 million based on the Chesapeake common stock price at the time of vesting.
As of December 31, 2011, there was $33.3 million of total unrecognized compensation cost related to the unvested restricted stock of employees involved directly in oilfield service operations. The cost is expected to be recognized over a weighted average period of approximately three years.
| 8. | Income Taxes |
The components of the income tax expense (benefit) for each of the periods presented below are as follows:
| Years Ended December 31, | ||||||||||||
| 2011 | 2010 | 2009 | ||||||||||
| ($ in thousands) | ||||||||||||
| Current |
$ | 3,577 | $ | 3,755 | $ | 3,561 | ||||||
| Deferred |
17,453 | (7,506 | ) | (6,217 | ) | |||||||
|
|
|
|
|
|
|
|||||||
| Total |
$ | 21,030 | $ | (3,751 | ) | $ | (2,656 | ) | ||||
|
|
|
|
|
|
|
|||||||
The effective income tax expense (benefit) differed from the computed “expected” federal income tax expense on earnings before income taxes for the following reasons:
| Years Ended December 31, | ||||||||||||
| 2011 | 2010 | 2009 | ||||||||||
| ($ in thousands) | ||||||||||||
| Income tax expense (benefit) at the federal statutory rate (35%) |
$ | 14,276 | $ | (7,911 | ) | $ | (15,064 | ) | ||||
| State income taxes (net of federal income tax benefit) |
979 | (384 | ) | 344 | ||||||||
| Effect of permanent differences |
3,393 | 1,001 | 9,630 | |||||||||
| Other |
2,382 | 3,543 | 2,434 | |||||||||
|
|
|
|
|
|
|
|||||||
| Total |
$ | 21,030 | $ | (3,751 | ) | $ | (2,656 | ) | ||||
|
|
|
|
|
|
|
|||||||
F-25
Table of Contents
Index to Financial Statements
COS HOLDINGS, L.L.C.
NOTES TO CONSOLIDATED FINANCIAL STATEMENTS—(Continued)
Deferred income taxes are provided to reflect temporary differences in the basis of net assets for income tax and financial reporting purposes. The tax-effected temporary differences and tax loss carryforwards which comprise deferred taxes are as follows:
| Years Ended December 31, | ||||||||
| 2011 | 2010 | |||||||
| ($ in thousands) | ||||||||
| Deferred tax liabilities: |
||||||||
| Property and equipment |
$ | (227,857 | ) | $ | (52,432 | ) | ||
| Sale/leaseback obligations |
(29,708 | ) | — | |||||
| Intangible assets |
(5,736 | ) | (2,899 | ) | ||||
| Deferred stock compensation |
— | (1,181 | ) | |||||
| Prepaid expenses |
(5,321 | ) | (2,250 | ) | ||||
| Other |
(1,051 | ) | (867 | ) | ||||
|
|
|
|
|
|||||
| Deferred tax liabilities |
(269,673 | ) | (59,629 | ) | ||||
|
|
|
|
|
|||||
| Deferred tax assets: |
||||||||
| Net operating loss carryforwards |
156,510 | 10,085 | ||||||
| Deferred gain on sale leaseback |
9,249 | 9,321 | ||||||
| Accrued liabilities |
4,511 | 4,950 | ||||||
| State tax payments |
2,428 | 2,878 | ||||||
| Deferred stock compensation |
2,067 | — | ||||||
| Investments |
748 | — | ||||||
| Other |
1,760 | 3,207 | ||||||
|
|
|
|
|
|||||
| Deferred tax assets |
177,273 | 30,441 | ||||||
|
|
|
|
|
|||||
| Net deferred tax asset (liability) |
$ | (92,400 | ) | $ | (29,188 | ) | ||
|
|
|
|
|
|||||
| Reflected in accompanying balance sheets as: |
||||||||
| Current deferred income tax asset |
$ | 3,576 | $ | 4,711 | ||||
| Non-current deferred income tax liability |
(95,976 | ) | (33,899 | ) | ||||
|
|
|
|
|
|||||
| Total |
$ | (92,400 | ) | $ | (29,188 | ) | ||
|
|
|
|
|
|||||
| 9. | Investments |
In October 2011, we acquired 49% of the membership interests in Maalt Specialized Bulk, LLC (“Maalt”) for $12.0 million. Maalt provides bulk transportation, transloading and sand hauling services, and its assets consist primarily of trucks and trailers. We use the equity method of accounting to account for our investment in Maalt, which had a carrying value of $12.0 million as of December 31, 2011. The carrying value of our investment in Maalt is in excess of our underlying equity in Maalt’s net assets by approximately $10.9 million. This excess is attributable to the goodwill of Maalt and will not be amortized.
| 10. | Variable Interest Entities |
In August 2011, we entered into an agreement with Big Star Field Services, L.L.C. to form Big Star Crude Co., L.L.C. (“Big Star”), a jointly controlled entity, which engages in the commercial trucking business. We are committed to contribute 85% of the capital requirements of this entity, which is budgeted at $7.1 million, making our budgeted commitment $6.1 million. We currently own 100% of the
F-26
Table of Contents
Index to Financial Statements
COS HOLDINGS, L.L.C.
NOTES TO CONSOLIDATED FINANCIAL STATEMENTS—(Continued)
preferred voting units, which represent a 49% ownership interest on a fully diluted basis. We will receive a preferred return (85% of all distributions) until a 25% rate of return has been reached, at which time the preferred units will be converted to common units and future distributions will be based on actual equity ownership.
Big Star is considered a VIE due to our voting rights not being proportional to our economic interests. Big Star entered into a fleet usage agreement with Chesapeake Energy Marketing, Inc. (“CEMI”), a wholly owned subsidiary of Chesapeake, whereby it dedicates 100% of its trucking fleet’s usage hours to providing crude hauling services exclusively for CEMI (see Note 13). We determined that CEMI is the primary beneficiary due to the fleet usage agreement and would therefore be the consolidating entity. Accordingly, we use the equity method of accounting to record our investment in Big Star, which had a carrying value of $4.7 million as of December 31, 2011. Our risk of loss related to Big Star is our investment balance.
| 11. | Fair Value Measurements |
Our financial instruments consist primarily of cash, trade receivables, trade payables and long-term debt. The carrying value of cash, trade receivables and trade payables are considered to be representative of their respective fair values due to the short-term nature of these instruments. Based on borrowing rates available at December 31, 2011 for debt with similar terms and maturities, the carrying value of our long-term debt approximates its fair value. Under fair value measurement accounting guidance, fair value is defined as the price that would be received to sell an asset or paid to transfer a liability in an orderly transaction between market participants at the measurement date (referred to as an “exit price”). Authoritative guidance on fair value measurements and disclosures clarifies that a fair value measurement for a liability should reflect the entity’s non-performance risk. In addition, a fair value hierarchy is established that prioritizes the inputs to valuation techniques used to measure fair value. The hierarchy gives the highest priority to unadjusted quoted market prices in active markets for identical assets and liabilities (Level 1 measurements) and the lowest priority to unobservable inputs (Level 3 measurements). The three levels of the fair value hierarchy are:
Level 1: Unadjusted quoted prices in active markets that are accessible at the measurement date for identical, unrestricted assets or liabilities.
Level 2: Quoted prices in markets that are not active, or inputs which are observable, either directly or indirectly, for substantially the full term of the asset or liability. This category includes quoted prices for similar assets or liabilities in active markets; quoted prices for identical or similar assets or liabilities in markets that are not active; inputs other than quoted prices that are observable for the asset or liability; and inputs that are derived principally from or corroborated by observable market data by correlation or other means.
Level 3: Measured based on prices or valuation models that require inputs that are both significant to the fair value measurement and less observable from objective sources.
Fair Value on Non-Recurring Basis
Fair value measurements were applied with respect to our non-financial assets and liabilities measured on a non-recurring basis, which consist primarily of goodwill, assets acquired and liabilities assumed in a business combination and impairments of goodwill and long-lived assets. See Notes 2 and 3 for additional discussion.
F-27
Table of Contents
Index to Financial Statements
COS HOLDINGS, L.L.C.
NOTES TO CONSOLIDATED FINANCIAL STATEMENTS—(Continued)
| 12. | Major Customers and Concentration of Credit Risk |
Financial instruments that potentially subject us to concentrations of credit risk consist principally of cash and trade receivables. Revenues from Chesapeake affiliates were $1.226 billion, $779.3 million and $620.0 million for the years ended December 31, 2011, 2010 and 2009, or 94%, 96% and 95%, respectively. We believe that the loss of these customers would have a material adverse effect on our operating results as there can be no assurance that replacement customers would be identified and accessed in a timely fashion or at comparable margins.
| 13. | Transactions With Affiliates |
In the normal course of business, drilling, hydraulic fracturing, oilfield rentals, trucking and fluid hauling and disposal services and compressor manufacturing are provided to Chesapeake and its affiliates. Substantially all of our revenues are derived from Chesapeake (see Note 12).
We are a party to a master services agreement with Chesapeake, pursuant to which we provide drilling and other services and supply materials and equipment to Chesapeake. Drilling services are typically provided pursuant to modified IADC drilling contracts. The specific terms of each request for other services are typically set forth in a field ticket or purchase or work order. The master services agreement contains general terms and provisions, including minimum insurance coverage amounts that we are required to maintain and confidentiality obligations with respect to Chesapeake’s business, and allocates certain operational risks between Chesapeake and us through indemnity provisions. The agreement will remain in effect until we or Chesapeake provides 30 days written notice of termination, although such agreement may not be terminated during the term of the services agreement described below.
We believe our drilling contracts, field tickets or purchase or work orders with Chesapeake are substantially similar to those in prevailing industry contracts, specifically as they relate to pricing, liabilities and payment terms.
We are a party to a services agreement with Chesapeake under which Chesapeake guarantees the utilization of a portion of our drilling rig and hydraulic fracturing fleets during the term of the agreement. Chesapeake guarantees that it will operate, on a daywork basis at market rates, the lesser of 75 of our drilling rigs or 80% of our operational drilling rig fleet, each referred to as a “committed rig.” However, the number of committed rigs will be ratably reduced for each of our drilling rigs that are operated by a third-party customer. In addition, Chesapeake guarantees that each month it will utilize a number of our operational hydraulic fracturing fleets, up to a maximum of 13 fleets, to complete a minimum aggregate number of fracturing stages equal to 25 stages per month times the average number of our operational hydraulic fracturing fleets during such month, each referred to as a “committed stage.” However, the number of committed stages per month will be reduced for each stage that we perform for a third-party customer during such month. In the event Chesapeake does not meet either the drilling commitment or the stage commitment, it will be required to pay us a non-utilization fee. For each day that a committed rig is not operated, Chesapeake must pay us our average daily operating cost for our operating drilling rigs for the preceding 30 days, plus 20%, and in no event less than $6,600 per day. For each committed stage not performed, Chesapeake must pay us $40,000. The services agreement is subject to the terms of our master services agreement with Chesapeake, has a five-year initial term ending October 25, 2016 and will thereafter automatically extend for successive one-year terms unless we or Chesapeake gives written notice of termination at least 45 days prior to the end of a term; provided, however, Chesapeake has the right to terminate the agreement upon 30 days written notice after a change of control of us. For purposes of the services agreement, a change of control is deemed to have occurred if Chesapeake no longer beneficially owns at least 51% of our outstanding equity interests.
F-28
Table of Contents
Index to Financial Statements
COS HOLDINGS, L.L.C.
NOTES TO CONSOLIDATED FINANCIAL STATEMENTS—(Continued)
We are a party to a facilities lease agreement with Chesapeake pursuant to which we lease a number of the storage yards and physical facilities out of which we conduct our operations. The initial term of the lease agreement ends December 31, 2014, after which the agreement is automatically renewed in successive one-year terms until we or Chesapeake terminates it. During the renewal periods, the amount of rent charged by Chesapeake increases by 2.5% each year. We make monthly payments to Chesapeake under the lease agreement that cover rent and our proportionate share of maintenance, operating expenses, taxes and insurance. We incurred $1.8 million of rent expense related to the facilities lease agreement with Chesapeake for the year ended December 31, 2011.
Chesapeake provides us with general and administrative services and the services of its employees pursuant to an administrative services agreement. These services include legal, accounting, treasury, environmental, safety, information technology and other corporate services. In return for the general and administrative services provided by Chesapeake, we reimburse Chesapeake on a monthly basis for the overhead expenses incurred by Chesapeake on our behalf in accordance with its current allocation policy, which includes actual out-of-pocket fees, costs and expenses incurred in connection with the provision of any of the services under the agreement, including the wages and benefits of Chesapeake employees who perform services on our behalf. All of the allocations of administrative costs are based on assumptions that management believes are reasonable; however, these allocations are not necessarily indicative of the costs and expenses that would have resulted if we had been operating as a stand-alone entity. The administrative services agreement has a five-year initial term and will thereafter automatically extend for successive one-year terms unless we or Chesapeake gives written notice of termination at least one year prior to the end of a term.
We are a party to a transportation services and usage agreement with Maalt. Maalt has dedicated a portion of its trucking fleet to allow us to meet our sand transportation needs. The size of the dedicated fleet is determined on a monthly basis based on our projected needs and agreed upon by both parties. We have guaranteed to Maalt that we will utilize its services at such a rate that the aggregate monthly revenue generated by the number of trucking units in the dedicated fleet exceeds a certain threshold stated in the agreement. If this threshold is not met during any month, we must pay Maalt an amount equal to 90% of the difference between the minimum services threshold and the total revenue generated by the trucking units during the applicable month.
Big Star is party to a fleet usage agreement with CEMI, a wholly owned subsidiary of Chesapeake, whereby it dedicates 100% of its trucking fleet’s usage hours to providing crude hauling services exclusively for CEMI. CEMI has committed to utilize, at a minimum, 75% of Big Star’s operating fleet on a monthly basis. CEMI has agreed to pay Big Star an amount equal to a base rate multiplied by the number of hours below the minimum usage hours for any month that it does not utilize 75% of Big Star’s operating fleet.
F-29
Table of Contents
Index to Financial Statements
COS HOLDINGS, L.L.C.
NOTES TO CONSOLIDATED FINANCIAL STATEMENTS—(Continued)
| 14. | Segment Information |
Our revenues, income (loss) before income taxes and identifiable assets are primarily attributable to four reportable segments. Each of these segments represents a distinct type of business. These segments have separate management teams which report to our chief operating decision maker. The results of operations in these segments are regularly reviewed by the chief operating decision maker for purposes of determining resource allocation and assessing performance. Management evaluates the performance of our segments based upon earnings before interest, taxes, depreciation and amortization, as further adjusted to add back nonrecurring items. The following is a description of the segments and other operations:
Drilling. Our drilling segment provides land drilling and drilling-related services, including directional drilling, geosteering and mudlogging, for oil and natural gas exploration and development activities. As of December 31, 2011, we owned or leased a fleet of 133 drilling rigs.
Hydraulic Fracturing. Our hydraulic fracturing segment provides hydraulic fracturing services. Hydraulic fracturing involves pumping fluid down a well casing or tubing under high pressure to cause the underground formation to crack, allowing the oil or natural gas to flow more freely. As of December 31, 2011, we owned two hydraulic fracturing fleets with an aggregate of 60,000 horsepower.
Oilfield Rentals. Our oilfield rentals segment provides premium rental tools for land oil and natural gas drilling and workover activities. We offer our customers a number of products and services, including drill pipe, drill collars, tubing, high and low pressure blowout preventers, water transfer, frac tanks, mud tanks and mud systems and also provide air drilling services and services associated with the transfer of fresh water to the well site. As of December 31, 2011, we owned 2,074 frac tanks and 1.5 million feet of tubulars.
Oilfield Trucking. Our oilfield trucking segment provides drilling rig relocation and logistics services as well as fluid handling services. Our trucks move drilling rigs, crude oil, other fluids and construction materials to and from the wellsite and also transport produced water from the well site. As of December 31, 2011, we owned a fleet of 202 rig relocation trucks and 56 cranes and forklifts and 113 fluid hauling trucks.
Other Operations. Our other operations primarily consist of our natural gas compressor manufacturing operations.
F-30
Table of Contents
Index to Financial Statements
COS HOLDINGS, L.L.C.
NOTES TO CONSOLIDATED FINANCIAL STATEMENTS—(Continued)
| Drilling | Hydraulic Fracturing |
Oilfield Rentals |
Oilfield Trucking |
Other Operations |
Intercompany Eliminations |
Consolidated Total |
||||||||||||||||||||||
| ($ in thousands) | ||||||||||||||||||||||||||||
| For The Year Ended December 31, 2011: |
||||||||||||||||||||||||||||
| Revenues |
$ | 854,768 | $ | 13,005 | $ | 247,336 | $ | 130,858 | $ | 63,015 | $ | (5,486 | ) | $ | 1,303,496 | |||||||||||||
| Intersegment revenues |
— | — | (1,670 | ) | (3,816 | ) | — | 5,486 | — | |||||||||||||||||||
|
|
|
|
|
|
|
|
|
|
|
|
|
|
|
|||||||||||||||
| Total revenues |
854,768 | 13,005 | 245,666 | 127,042 | 63,015 | — | 1,303,496 | |||||||||||||||||||||
| Depreciation and amortization |
106,087 | 1,210 | 49,200 | 14,882 | 1,299 | (770 | ) | 171,908 | ||||||||||||||||||||
| (Gains) losses on sales of property and equipment and equipment |
(2,438 | ) | — | (761 | ) | (377 | ) | 5 | — | (3,571 | ) | |||||||||||||||||
| Impairments |
68 | — | 2,633 | 28 | — | — | 2,729 | |||||||||||||||||||||
| Interest expense |
(26,516 | ) | (2,385 | ) | (9,534 | ) | (5,277 | ) | (21,360 | ) | — | (65,072 | ) | |||||||||||||||
| Other income (expense) |
(3,074 | ) | 1 | (6 | ) | 227 | 388 | — | (2,464 | ) | ||||||||||||||||||
| Income (Loss) Before Income Taxes |
$ | 14,890 | $ | (12,802 | ) | $ | 65,229 | $ | (5,826 | ) | $ | (20,703 | ) | $ | — | $ | 40,788 | |||||||||||
| Total Assets |
$ | 990,872 | $ | 138,341 | $ | 258,960 | $ | 150,896 | $ | 60,837 | $ | (1,324 | ) | $ | 1,598,582 | |||||||||||||
| Net Capital Expenditures |
$ | 261,935 | $ | 80,700 | $ | 65,047 | $ | 39,551 | $ | (5,804 | ) | $ | — | $ | 441,429 | |||||||||||||
| For The Year Ended December 31, 2010: |
||||||||||||||||||||||||||||
| Revenues |
$ | 572,325 | $ | — | $ | 123,317 | $ | 79,966 | $ | 47,739 | $ | (7,591 | ) | $ | 815,756 | |||||||||||||
| Intersegment revenues |
— | — | (1,906 | ) | (5,685 | ) | — | 7,591 | — | |||||||||||||||||||
|
|
|
|
|
|
|
|
|
|
|
|
|
|
|
|||||||||||||||
| Total revenues |
572,325 | — | 121,411 | 74,281 | 47,739 | — | 815,756 | |||||||||||||||||||||
| Depreciation and amortization |
60,953 | — | 34,467 | 11,598 | 702 | (1,295 | ) | 106,425 | ||||||||||||||||||||
| (Gains) losses on sales of property and equipment |
(1,932 | ) | — | 1,152 | (84 | ) | 10 | — | (854 | ) | ||||||||||||||||||
| Impairments |
— | — | — | 9 | — | — | 9 | |||||||||||||||||||||
| Interest expense |
(24,330 | ) | (554 | ) | (8,947 | ) | (4,094 | ) | (586 | ) | — | (38,511 | ) | |||||||||||||||
| Losses from equity investee |
(2,243 | ) | — | — | — | — | — | (2,243 | ) | |||||||||||||||||||
| Other income (expense) |
120 | — | 59 | 28 | 4 | — | 211 | |||||||||||||||||||||
| Income (Loss) Before Income Taxes |
$ | (12,901 | ) | $ | (554 | ) | $ | (4,897 | ) | $ | (4,639 | ) | $ | 388 | $ | — | $ | (22,603 | ) | |||||||||
| Total Assets |
$ | 702,438 | $ | 15,707 | $ | 210,086 | $ | 101,900 | $ | 27,396 | $ | (1,379 | ) | $ | 1,056,148 | |||||||||||||
| Net Capital Expenditures |
$ | 203,331 | $ | 15,707 | $ | 51,593 | $ | 29,249 | $ | 6,817 | $ | — | $ | 306,697 | ||||||||||||||
| For The Year Ended December 31, 2009: |
||||||||||||||||||||||||||||
| Revenues |
$ | 511,427 | $ | — | $ | 57,444 | $ | 50,896 | $ | 42,102 | $ | (11,590 | ) | $ | 650,279 | |||||||||||||
| Intersegment revenues |
— | — | (1,680 | ) | (9,910 | ) | — | 11,590 | — | |||||||||||||||||||
|
|
|
|
|
|
|
|
|
|
|
|
|
|
|
|||||||||||||||
| Total revenues |
511,427 | — | 55,764 | 40,986 | 42,102 | — | 650,279 | |||||||||||||||||||||
| Depreciation and amortization |
36,485 | — | 26,095 | 10,223 | 591 | (2,965 | ) | 70,429 | ||||||||||||||||||||
| (Gains) losses on sales of property and equipment |
(1,250 | ) | — | (339 | ) | 38 | — | — | (1,551 | ) | ||||||||||||||||||
| Impairments |
6,987 | — | — | 19,810 | — | — | 26,797 | |||||||||||||||||||||
| Interest expense |
(13,694 | ) | — | (6,567 | ) | (2,870 | ) | (322 | ) | — | (23,453 | ) | ||||||||||||||||
| Losses from equity investee |
(164 | ) | — | — | — | — | — | (164 | ) | |||||||||||||||||||
| Other income (expense) |
(134 | ) | — | 25 | (180 | ) | 6 | — | (283 | ) | ||||||||||||||||||
| Income (Loss) Before Income Taxes |
$ | 7,623 | $ | — | $ | (16,715 | ) | $ | (34,653 | ) | $ | 706 | $ | — | $ | (43,039 | ) | |||||||||||
| Total Assets |
$ | 552,258 | $ | — | $ | 173,893 | $ | 81,517 | $ | 19,178 | $ | (2,460 | ) | $ | 824,386 | |||||||||||||
| Net Capital Expenditures |
$ | 179,247 | $ | — | $ | 44,347 | $ | 9,458 | $ | 795 | $ | — | $ | 233,847 | ||||||||||||||
F-31
Table of Contents
Index to Financial Statements
COS HOLDINGS, L.L.C.
NOTES TO CONSOLIDATED FINANCIAL STATEMENTS—(Continued)
| 15. | Recent Accounting Pronouncements |
In September 2011, the FASB issued revised guidance related to the annual goodwill impairment test. The revised guidance provides both public and non-public entities with the option of performing a qualitative assessment to determine whether future impairment testing is necessary. The revised standard is effective for goodwill impairment tests performed for fiscal years beginning after December 15, 2011. We do not expect this guidance to have a material effect on our financial condition or results of operations.
| 16. | Subsequent Events |
Any material subsequent events have been considered for disclosure through April 16, 2012.
COS LLC entered into a tax allocation agreement with Chesapeake, effective for tax years starting on or after October 25, 2011, under which COS LLC generally is required to remit to Chesapeake, an amount equal to the taxes incurred by COS LLC and its subsidiaries. Under that agreement, COS LLC and each subsidiary of COS LLC computes its own federal and state income tax liability on a separate company basis, in each case, as if the entity were a corporation, regardless of its actual characterization for U.S. federal income tax purposes, and COS LLC makes a corresponding payment to Chesapeake based upon such aggregate tax liability of COS LLC and its subsidiaries.
F-32
Table of Contents
Index to Financial Statements
CONSOLIDATED FINANCIAL STATEMENTS
Report of Independent Registered Public Accounting Firm
Board of Directors
Bronco Drilling Company, Inc.
We have audited the accompanying consolidated balance sheets of Bronco Drilling Company, Inc. and Subsidiaries (the “Company”) as of December 31, 2010 and 2009, and the related consolidated statements of operations, stockholders’ equity and comprehensive income (loss) and cash flows for each of the three years in the period ended December 31, 2010. These financial statements are the responsibility of the Company’s management. Our responsibility is to express an opinion on these financial statements based on our audits.
We conducted our audits in accordance with the standards of the Public Company Accounting Oversight Board (United States). Those standards require that we plan and perform the audit to obtain reasonable assurance about whether the financial statements are free of material misstatement. An audit includes examining, on a test basis, evidence supporting the amounts and disclosures in the financial statements. An audit also includes assessing the accounting principles used and significant estimates made by management, as well as evaluating the overall financial statement presentation. We believe that our audits provide a reasonable basis for our opinion.
In our opinion, the consolidated financial statements referred to above present fairly, in all material respects, the financial position of Bronco Drilling Company, Inc. and Subsidiaries as of December 31, 2010 and 2009, and the results of their operations and their cash flows for each of the three years in the period ended December 31, 2010, in conformity with accounting principles generally accepted in the United States of America.
We also have audited, in accordance with the standards of the Public Company Accounting Oversight Board (United States), the Company’s internal control over financial reporting as of December 31, 2010, based on the criteria established in Internal Control—Integrated Framework issued by the Committee of Sponsoring Organizations of the Treadway Commission (COSO) and our report dated March 15, 2011 (not separately included herein) expressed an unqualified opinion.
/s/ GRANT THORNTON LLP
Oklahoma City, Oklahoma
March 15, 2011
F-33
Table of Contents
Index to Financial Statements
CONSOLIDATED BALANCE SHEET
(Amounts in thousands, except share par value)
| December 31, | ||||||||
| 2010 | 2009 | |||||||
| ASSETS | ||||||||
| CURRENT ASSETS |
||||||||
| Cash and cash equivalents |
$ | 11,854 | $ | 9,497 | ||||
| Restricted cash |
2,700 | — | ||||||
| Receivables |
||||||||
| Trade and other, net of allowance for doubtful accounts of $891 and $3,576 in 2010 and 2009, respectively |
24,656 | 15,306 | ||||||
| Affiliate receivables, net of allowance of $800 in 2010 |
1,508 | 9,620 | ||||||
| Unbilled receivables |
428 | 828 | ||||||
| Income tax receivable |
5,700 | 3,800 | ||||||
| Current deferred income taxes |
2,765 | 1,360 | ||||||
| Current maturities of note receivable from affiliate |
1,607 | 2,000 | ||||||
| Prepaid expenses |
329 | 666 | ||||||
|
|
|
|
|
|||||
| Total current assets |
51,547 | 43,077 | ||||||
| PROPERTY AND EQUIPMENT—AT COST |
||||||||
| Drilling rigs and related equipment |
315,085 | 386,514 | ||||||
| Transportation, office and other equipment |
16,236 | 18,602 | ||||||
|
|
|
|
|
|||||
| 331,321 | 405,116 | |||||||
| Less accumulated depreciation |
105,242 | 116,455 | ||||||
|
|
|
|
|
|||||
| 226,079 | 288,661 | |||||||
| OTHER ASSETS |
||||||||
| Note receivable from affiliate, less current maturities |
— | 517 | ||||||
| Investment in Challenger |
38,730 | 39,714 | ||||||
| Investment in Bronco MX |
20,632 | 21,407 | ||||||
| Debt issue costs and other |
3,362 | 3,672 | ||||||
| Non-current assets held for sale and discontinued operations |
1,680 | 48,535 | ||||||
|
|
|
|
|
|||||
| 64,404 | 113,845 | |||||||
|
|
|
|
|
|||||
| $ | 342,030 | $ | 445,583 | |||||
|
|
|
|
|
|||||
| LIABILITIES AND STOCKHOLDERS’ EQUITY | ||||||||
| CURRENT LIABILITIES |
||||||||
| Accounts payable |
$ | 7,945 | $ | 9,756 | ||||
| Accrued liabilities |
7,847 | 7,952 | ||||||
| Current maturities of long-term debt |
95 | 89 | ||||||
|
|
|
|
|
|||||
| Total current liabilities |
15,887 | 17,797 | ||||||
| LONG-TERM DEBT, less current maturities and discount |
6,730 | 51,814 | ||||||
| WARRANT |
4,407 | 2,829 | ||||||
| DEFERRED INCOME TAXES |
21,664 | 32,872 | ||||||
| COMMITMENTS AND CONTINGENCIES (Note 8) |
||||||||
| STOCKHOLDERS’ EQUITY |
||||||||
| Common stock, $.01 par value, 100,000 shares authorized; 27,236 and 26,713 shares issued and outstanding at December 31, 2010 and 2009 |
277 | 270 | ||||||
| Additional paid-in capital |
310,580 | 307,313 | ||||||
| Accumulated other comprehensive income |
1,012 | 538 | ||||||
| Retained earnings (Accumulated deficit) |
(18,527 | ) | 32,150 | |||||
|
|
|
|
|
|||||
| Total stockholders’ equity |
293,342 | 340,271 | ||||||
|
|
|
|
|
|||||
| $ | 342,030 | $ | 445,583 | |||||
|
|
|
|
|
|||||
The accompanying notes are an integral part of these consolidated financial statements.
F-34
Table of Contents
Index to Financial Statements
CONSOLIDATED STATEMENTS OF OPERATIONS
(Amounts in thousands, except per share amounts)
| Years Ended December 31, | ||||||||||||
| 2010 | 2009 | 2008 | ||||||||||
| REVENUES |
||||||||||||
| Contract drilling revenues, including 0%, 0%, and 2% from related parties |
$ | 124,399 | $ | 102,896 | $ | 233,922 | ||||||
| EXPENSES |
||||||||||||
| Contract drilling |
90,290 | 70,721 | 140,935 | |||||||||
| Depreciation and amortization |
28,445 | 36,180 | 39,194 | |||||||||
| General and administrative |
17,108 | 15,782 | 29,821 | |||||||||
| Gain on Challenger transactions |
— | — | (2,252 | ) | ||||||||
| Loss on Bronco MX transaction |
1,487 | 23,705 | — | |||||||||
| Impairment of goodwill |
— | — | 21,115 | |||||||||
| Impairment of drilling rigs and related equipment |
7,900 | — | — | |||||||||
| Loss on sale of drilling rigs and related equipment |
23,732 | — | — | |||||||||
|
|
|
|
|
|
|
|||||||
| 168,962 | 146,388 | 228,813 | ||||||||||
|
|
|
|
|
|
|
|||||||
| Income (loss) from continuing operations |
(44,563 | ) | (43,492 | ) | 5,109 | |||||||
| OTHER INCOME (EXPENSE) |
||||||||||||
| Interest expense |
(4,671 | ) | (6,933 | ) | (4,048 | ) | ||||||
| Loss from early extinguishment of debt |
— | (2,859 | ) | (155 | ) | |||||||
| Interest income |
201 | 273 | 1,039 | |||||||||
| Loss on partial sale of investment in Bronco MX |
(1,271 | ) | — | — | ||||||||
| Equity in income (loss) of Challenger |
(984 | ) | (1,914 | ) | 2,186 | |||||||
| Equity in income (loss) of Bronco MX |
22 | (588 | ) | — | ||||||||
| Impairment of investment in Challenger |
— | (21,247 | ) | (14,442 | ) | |||||||
| Other |
204 | (383 | ) | (343 | ) | |||||||
| Change in fair value of warrant |
(1,578 | ) | 1,850 | — | ||||||||
|
|
|
|
|
|
|
|||||||
| (8,077 | ) | (31,801 | ) | (15,763 | ) | |||||||
|
|
|
|
|
|
|
|||||||
| Loss from continuing operations before income tax |
(52,640 | ) | (75,293 | ) | (10,654 | ) | ||||||
| Income tax benefit |
(18,135 | ) | (27,151 | ) | (5,339 | ) | ||||||
|
|
|
|
|
|
|
|||||||
| Loss from continuing operations |
(34,505 | ) | (48,142 | ) | (5,315 | ) | ||||||
| Loss from discontinued operations, net of tax |
(16,172 | ) | (9,437 | ) | (2,928 | ) | ||||||
|
|
|
|
|
|
|
|||||||
| NET LOSS |
$ | (50,677 | ) | $ | (57,579 | ) | $ | (8,243 | ) | |||
|
|
|
|
|
|
|
|||||||
| Loss per common share-Basic |
||||||||||||
| Continuing operations |
(1.27 | ) | (1.81 | ) | (0.20 | ) | ||||||
| Discontinued operations |
(0.60 | ) | (0.35 | ) | (0.11 | ) | ||||||
|
|
|
|
|
|
|
|||||||
| Loss per common share-Basic |
$ | (1.87 | ) | $ | (2.16 | ) | $ | (0.31 | ) | |||
|
|
|
|
|
|
|
|||||||
| Loss per common share-Diluted |
||||||||||||
| Continuing operations |
(1.27 | ) | (1.81 | ) | (0.20 | ) | ||||||
| Discontinued operations |
(0.60 | ) | (0.35 | ) | (0.11 | ) | ||||||
|
|
|
|
|
|
|
|||||||
| Loss per common share-Diluted |
$ | (1.87 | ) | $ | (2.16 | ) | $ | (0.31 | ) | |||
|
|
|
|
|
|
|
|||||||
| Weighted average number of shares outstanding-Basic |
27,091 | 26,651 | 26,293 | |||||||||
|
|
|
|
|
|
|
|||||||
| Weighted average number of shares outstanding-Diluted |
27,091 | 26,651 | 26,293 | |||||||||
|
|
|
|
|
|
|
|||||||
The accompanying notes are an integral part of these consolidated financial statements.
F-35
Table of Contents
Index to Financial Statements
CONSOLIDATED STATEMENTS OF STOCKHOLDERS’ EQUITY AND COMPREHENSIVE INCOME (LOSS)
(Amounts in thousands)
| Common Shares |
Common Amount |
Additional Paid In Capital |
Accumulated Other Comprehensive Income |
Retained Earnings |
Total Stockholders’ Equity |
|||||||||||||||||||
| Balance as of December 31, 2007 |
26,031 | $ | 262 | $ | 298,195 | $ | — | $ | 97,972 | $ | 396,429 | |||||||||||||
| Net loss |
— | — | — | — | (8,243 | ) | (8,243 | ) | ||||||||||||||||
| Stock compensation |
315 | 5 | 5,820 | — | — | 5,825 | ||||||||||||||||||
|
|
|
|
|
|
|
|
|
|
|
|
|
|||||||||||||
| Balance as of December 31, 2008 |
26,346 | 267 | 304,015 | — | 89,729 | 394,011 | ||||||||||||||||||
| Net loss |
— | — | — | — | (57,579 | ) | (57,579 | ) | ||||||||||||||||
| Other Comprehensive Income: |
||||||||||||||||||||||||
| Foreign currency translation adjustment |
— | — | — | 538 | — | 538 | ||||||||||||||||||
|
|
|
|||||||||||||||||||||||
| Total Comprehensive Income (Loss) |
(57,041 | ) | ||||||||||||||||||||||
| Stock compensation |
367 | 3 | 3,298 | — | — | 3,301 | ||||||||||||||||||
|
|
|
|
|
|
|
|
|
|
|
|
|
|||||||||||||
| Balance as of December 31, 2009 |
26,713 | 270 | 307,313 | 538 | 32,150 | 340,271 | ||||||||||||||||||
| Net loss |
— | — | — | — | (50,677 | ) | (50,677 | ) | ||||||||||||||||
| Other Comprehensive Income: |
||||||||||||||||||||||||
| Foreign currency translation adjustment |
— | — | — | 474 | — | 474 | ||||||||||||||||||
|
|
|
|||||||||||||||||||||||
| Total Comprehensive Income (Loss) |
(50,203 | ) | ||||||||||||||||||||||
| Stock compensation |
523 | 7 | 3,267 | — | — | 3,274 | ||||||||||||||||||
|
|
|
|
|
|
|
|
|
|
|
|
|
|||||||||||||
| Balance as of December 31, 2010 |
27,236 | $ | 277 | $ | 310,580 | $ | 1,012 | $ | (18,527 | ) | $ | 293,342 | ||||||||||||
|
|
|
|
|
|
|
|
|
|
|
|
|
|||||||||||||
The accompanying notes are an integral part of these consolidated financial statements.
F-36
Table of Contents
Index to Financial Statements
CONSOLIDATED STATEMENTS OF CASH FLOWS
(Amounts in thousands)
| Years Ended December 31, | ||||||||||||
| 2010 | 2009 | 2008 | ||||||||||
| (Unaudited) | ||||||||||||
| Cash flows from operating activities from continuing operations: |
||||||||||||
| Net loss |
$ | (50,677 | ) | $ | (57,579 | ) | $ | (8,243 | ) | |||
| Adjustments to reconcile net loss to net cash provided by operating activities from continuing operations: |
||||||||||||
| Loss from discontinued operations, net of tax |
16,172 | 9,437 | 2,928 | |||||||||
| Depreciation and amortization |
29,241 | 36,942 | 39,455 | |||||||||
| Bad debt expense |
2,282 | 240 | 3,582 | |||||||||
| Loss (gain) on sale of assets |
(272 | ) | 466 | 941 | ||||||||
| Write off of debt issue costs |
— | 2,859 | 155 | |||||||||
| Gain on Challenger transactions |
— | — | (3,138 | ) | ||||||||
| Impairment of investment in Challenger |
— | 21,247 | 14,442 | |||||||||
| Impairment of goodwill |
— | — | 21,534 | |||||||||
| Loss on sale of drilling rigs and related equipment |
23,732 | — | ||||||||||
| Impairment of drilling rigs and related equipment |
7,900 | — | ||||||||||
| Loss on partial sale of investment in Bronco MX |
1,271 | — | ||||||||||
| Equity in (income) loss of Challenger |
984 | 1,914 | (2,186 | ) | ||||||||
| Equity in (income) loss of Bronco MX |
(22 | ) | 588 | — | ||||||||
| Change in fair value of warrant |
1,578 | (1,850 | ) | — | ||||||||
| Loss on Bronco MX transaction |
1,487 | 23,705 | — | |||||||||
| Imputed interest expense |
907 | 224 | — | |||||||||
| Stock compensation |
3,274 | 3,301 | 5,825 | |||||||||
| Deferred income taxes |
(5,392 | ) | (25,760 | ) | (6,332 | ) | ||||||
| Changes in current assets and liabilities: |
||||||||||||
| Receivables |
(11,993 | ) | 40,490 | (1,643 | ) | |||||||
| Affiliate receivables |
8,112 | (6,233 | ) | — | ||||||||
| Unbilled receivables |
400 | 1,990 | (937 | ) | ||||||||
| Prepaid expenses |
190 | (64 | ) | (152 | ) | |||||||
| Other assets |
(790 | ) | 244 | 717 | ||||||||
| Accounts payable |
8,627 | (21,465 | ) | (13,973 | ) | |||||||
| Accrued expenses |
181 | (6,762 | ) | (4,552 | ) | |||||||
| Income taxes receivable |
1,086 | (1,730 | ) | — | ||||||||
|
|
|
|
|
|
|
|||||||
| Net cash provided by operating activities from continuing operations |
38,278 | 22,204 | 48,423 | |||||||||
| Cash flows from investing activities from continuing operations: |
||||||||||||
| Restricted cash account |
(2,700 | ) | — | 2,899 | ||||||||
| Business acquisition, net of cash acquired |
— | — | (5,063 | ) | ||||||||
| Principal payments on note receivable |
911 | 3,065 | — | |||||||||
| Proceeds from sale of assets |
23,982 | 32,375 | 3,965 | |||||||||
| Purchase of property and equipment |
(19,177 | ) | (16,462 | ) | (76,793 | ) | ||||||
|
|
|
|
|
|
|
|||||||
| Net cash provided by (used in) investing activities from continuing operations |
3,016 | 18,978 | (74,992 | ) | ||||||||
| Cash flows from financing activities from continuing operations: |
||||||||||||
| Proceeds from borrowings |
5,000 | 55,000 | 51,100 | |||||||||
| Payments of debt |
(50,986 | ) | (111,184 | ) | (79 | ) | ||||||
| Debt issue costs |
— | (2,232 | ) | (3,501 | ) | |||||||
|
|
|
|
|
|
|
|||||||
| Net provided by (used in) financing activities from continuing operations |
(45,986 | ) | (58,416 | ) | 47,520 | |||||||
|
|
|
|
|
|
|
|||||||
| Net increase (decrease) in cash and cash equivalents from continuing operations |
(4,692 | ) | (17,234 | ) | 20,951 | |||||||
| Cash flows from discontinued operations: |
||||||||||||
| Operating cash flows |
(16,611 | ) | 5,844 | 10,677 | ||||||||
| Investing cash flows |
23,660 | (784 | ) | (7,803 | ) | |||||||
| Financing cash flows |
— | (5,005 | ) | (2,870 | ) | |||||||
|
|
|
|
|
|
|
|||||||
| Net increase (decrease) in cash and cash equivalents from discontinued operations |
7,049 | 55 | 4 | |||||||||
|
|
|
|
|
|
|
|||||||
| Increase (decrease) in cash and cash equivalents |
2,357 | (17,179 | ) | 20,955 | ||||||||
| Beginning cash and cash equivalents |
9,497 | 26,676 | 5,721 | |||||||||
|
|
|
|
|
|
|
|||||||
| Ending cash and cash equivalents |
$ | 11,854 | $ | 9,497 | $ | 26,676 | ||||||
|
|
|
|
|
|
|
|||||||
| Supplementary disclosure of cash flow information: |
||||||||||||
| Interest paid, net of amount capitalized |
$ | 4,026 | $ | 11,549 | $ | 2,704 | ||||||
| Income taxes (refunded) paid |
(13,829 | ) | 339 | 198 | ||||||||
| Supplementary disclosure of non-cash investing and financing: |
||||||||||||
| Purchase of property and equipment in accounts payable |
2,034 | 4,425 | 11,430 | |||||||||
| Reduction of receivable for property and equipment |
— | 5,040 | — | |||||||||
| Reduction of debt for warrants issued |
— | 4,679 | — | |||||||||
| Assets contributed to Bronco MX |
— | 77,194 | — | |||||||||
| Note issued for acquisition of property and equipment |
— | — | 1,277 | |||||||||
| Assets exchanged/sold for equity interest and note receivable |
— | — | 72,503 | |||||||||
| Common stock received for payment of receivable |
— | — | 1,900 | |||||||||
The accompanying notes are an integral part of these consolidated financial statements.
F-37
Table of Contents
Index to Financial Statements
NOTES TO CONSOLIDATED FINANCIAL STATEMENTS
($ Amounts in thousands, except per share amounts)
| 1. | Organization and Summary of Significant Accounting Policies |
Business and Principles of Consolidation
Bronco Drilling Company, Inc. (the “Company”) provides contract land drilling services to oil and natural gas exploration and production companies. The accompanying consolidated financial statements include the Company’s accounts and the accounts of its wholly owned subsidiaries. All intercompany accounts and transactions have been eliminated in consolidation.
The Company has prepared the consolidated financial statements and related notes in accordance with accounting principles generally accepted in the United States of America. In preparing the financial statements, the Company made various estimates and assumptions that affect the amounts of assets and liabilities the Company reports as of the dates of the balance sheets and amounts the Company reports for the periods shown in the consolidated statements of operations, stockholders’ equity and cash flows. The Company’s actual results could differ significantly from those estimates. Material estimates that are particularly susceptible to significant changes in the near term relate to the Company’s recognition of revenues and accrued expenses, estimate of the allowance for doubtful accounts, estimate of asset impairments, estimate of deferred taxes and determination of depreciation and amortization expense.
A summary of the significant accounting policies consistently applied in the preparation of the accompanying consolidated financial statements follows.
Cash and Cash Equivalents
The Company considers all highly liquid debt instruments purchased with a maturity of three months or less when acquired and money market mutual funds to be cash equivalents.
The Company maintains its cash and cash equivalents in accounts and instruments that may not be federally insured beyond certain limits. The Company has not experienced any losses in such accounts and believes it is not exposed to any significant credit risks on cash and cash equivalents.
Restricted Cash
At December 31, 2010, the Company had restricted cash of $2,700, at a bank in escrow related to the sale of drilling rigs.
Foreign Currency
The U.S. dollar is the functional currency for the Company’s consolidated operations. However, the Company has an equity investment in a Mexican entity whose functional currency is the peso. The assets and liabilities of the Mexican investment are translated into U.S. dollars based on the current exchange rate in effect at the balance sheet dates. Mexican income and expenses are translated at average rates for the periods presented. Translation adjustments have no effect on net income and are included in accumulated other comprehensive income in stockholders’ equity.
Revenue Recognition
The Company earns contract drilling revenue under daywork and footage contracts.
F-38
Table of Contents
Index to Financial Statements
BRONCO DRILLING COMPANY, INC.
NOTES TO CONSOLIDATED FINANCIAL STATEMENTS—(Continued)
Revenues on daywork contracts are recognized based on the days completed at the dayrate each contract specifies. Mobilization revenues and costs for daywork contracts are deferred and recognized over the days of actual drilling.
The Company follows the percentage-of-completion method of accounting for footage contract drilling arrangements. Under this method, drilling revenues and costs related to a well in progress are recognized proportionately over the time it takes to drill the well. Percentage-of-completion is determined based upon the amount of expenses incurred through the measurement date as compared to total estimated expenses to be incurred drilling the well. Mobilization costs are not included in costs incurred for percentage-of-completion calculations. Mobilization costs on footage contracts are deferred and recognized over the days of actual drilling. Under the percentage-of-completion method, management estimates are relied upon in the determination of the total estimated expenses to be incurred drilling the well. When estimates of revenues and expenses indicate a loss on a contract, the total estimated loss is accrued.
Revenue arising from claims for amounts billed in excess of the contract price or for amounts not included in the original contract are recognized when billed less any allowance for uncollectibility. Revenue from such claims is only recognized if it is probable that the claim will result in additional revenue, the costs for the additional services have been incurred, management believes there is a legal basis for the claim and the amount can be reliably estimated. Revenue from such claims are recorded only to the extent that contract costs relating to the claim have been incurred. Historically we have not billed any customers for amounts not included in the original contract.
The asset “unbilled receivables” represents revenues we have recognized in excess of amounts billed on drilling contracts in progress or costs deferred on daywork contracts in progress.
Accounts Receivable
The Company records trade accounts receivable at the amount invoiced to customers. Substantially all of the Company’s accounts receivable are due from companies in the oil and gas industry. Credit is extended based on evaluation of a customer’s financial condition and, generally, collateral is not required. Accounts receivable are due within 30 days and are stated at amounts due from customers, net of an allowance for doubtful accounts when the Company believes collection is doubtful. Accounts outstanding longer than the contractual payment terms are considered past due. The Company determines its allowance by considering a number of factors, including the length of time trade accounts receivable are past due, the Company’s previous loss history, the customer’s current ability to pay its obligation to the Company and the condition of the general economy and the industry as a whole. The Company writes off specific accounts receivable when they become uncollectible and payments subsequently received on such receivables reduce the allowance for doubtful accounts. At December 31, 2010 and 2009, our allowance for doubtful accounts was $1,691 and $3,576, respectively.
Prepaid Expenses
Prepaid expenses include items such as insurance and fees. The Company routinely expenses these items in the normal course of business over the periods these expenses benefit.
Property and Equipment
Property and equipment, including renewals and betterments, are capitalized and stated at cost, while maintenance and repairs are expensed currently. Assets are depreciated on a straight-line basis.
F-39
Table of Contents
Index to Financial Statements
BRONCO DRILLING COMPANY, INC.
NOTES TO CONSOLIDATED FINANCIAL STATEMENTS—(Continued)
The depreciable lives of drilling rigs and related equipment are three to 15 years. The depreciable life of other equipment is three years. Depreciation is not commenced until acquired rigs are placed in service. Once placed in service, depreciation continues when rigs are being repaired, refurbished or between periods of deployment. Assets not placed in service and not being depreciated were $14,111 and $26,038 as of December 31, 2010 and 2009, respectively.
The Company capitalizes interest as a component of the cost of drilling rigs constructed for its own use. For the years ended December 31, 2010 and 2009, the Company did not capitalize any interest.
The Company evaluates for potential impairment of long-lived assets held for use and intangible assets subject to amortization when indicators of impairment are present, as defined in ASC Topic 360, Accounting for the Impairment or Disposal of Long-Lived Assets. Circumstances that could indicate a potential impairment include significant adverse changes in industry trends, economic climate, legal factors, and an adverse action or assessment by a regulator. More specifically, significant adverse changes in industry trends include significant declines in revenue rates, utilization rates, oil and natural gas market prices and industry rig counts for drilling rigs and workover rigs. In performing an impairment evaluation, the Company estimates the future undiscounted net cash flows from the use and eventual disposition of long-lived assets and intangible assets grouped at the lowest level that cash flows can be identified. If the sum of the estimated future undiscounted net cash flows is less than the carrying amount of the long-lived assets and intangible assets for these asset grouping levels, then the Company would recognize an impairment charge. The amount of an impairment charge would be measured as the difference between the carrying amount and the fair value of these assets. See Note 9, Asset Sales and Held for Sale, for discussion of impairment of drilling rigs and related equipment due to their classification as held for sale. Assets held for sale are recorded at the lower of carrying amount or fair value less cost to sell. See Note 10, Discontinued Operations, for discussion of well servicing segment property and equipment impairment relating to its classification as held for sale. The assumptions used in the impairment evaluation for long-lived assets and intangible assets are inherently uncertain and require management judgment.
Debt issue costs and other
Debt issue costs and other assets consist of intangibles related to acquisitions, net of amortization, and debt issue costs, net of amortization. The Company follows Statement ASC Topic 323, “Intangibles—Goodwill and Other” to account for amortizable intangibles. Intangible assets that are acquired either individually or with a group of other assets are recognized based on its fair value and amortized over its useful life. The Company’s amortizable intangibles consist entirely of customer lists and relationships obtained through acquisitions. Customer lists and relationships are amortized over their estimated benefit period of four years. Depreciation and amortization expense includes amortization of intangibles of $78, $751, and $974 for the years ended December 31, 2010, 2009, and 2008, respectively. Total cost and accumulated amortization of intangibles at December 31, 2010 and 2009 was $2,318 and $2,318 and $3,705 and $3,403, respectively.
Legal fees and other debt issue costs incurred in obtaining financing are amortized over the term of the debt using a method which approximates the effective interest method. Gross debt issue costs were $2,669 and $2,232 at December 31, 2010 and 2009, respectively. Amortization expense related to debt issue costs was $688, $592, and $571 for the years ended December 31, 2010, 2009, and 2008, respectively, and is included in interest expense in the consolidated statements of operations. Accumulated amortization related to loan fees was $864 and $126 as of December 31, 2010 and 2009,
F-40
Table of Contents
Index to Financial Statements
BRONCO DRILLING COMPANY, INC.
NOTES TO CONSOLIDATED FINANCIAL STATEMENTS—(Continued)
respectively. On September 18, 2009 and September 29, 2008 the Company refinanced its revolving debt facility and incurred $2,232 and $3,501 of debt issuance costs, respectively. The Company wrote-off debt issue costs of $2,859, which is included in loss from early extinguishment of debt on the consolidated statement of operations for the year ended December 31, 2009.
Income Taxes
Pursuant to Statement ASC Topic 740, Income Taxes, the Company follows the asset and liability method of accounting for income taxes, under which the Company recognizes deferred tax assets and liabilities for the future tax consequences attributable to differences between the financial statement carrying amounts of existing assets and liabilities and their respective tax bases. Deferred tax assets and liabilities were measured using enacted tax rates expected to apply to taxable income in the years in which the Company expects to recover or settle those temporary differences. A statutory Federal tax rate of 35% and effective state tax rate of 3.7% (net of Federal income tax effects) were used for the enacted tax rates for all periods.
As changes in tax laws or rates are enacted, deferred income tax assets and liabilities are adjusted through the provision for income taxes. Deferred tax assets are reduced by a valuation allowance if, based on available evidence, it is more likely than not that some portion or all of the deferred tax assets will not be realized. The classification of current and noncurrent deferred tax assets and liabilities is based primarily on the classification of the assets and liabilities generating the difference.
The Company applies the provisions of ASC Topic 740 which addresses the accounting for uncertainty in income taxes recognized in an enterprise’s financial statements and prescribes a recognition threshold and measurement attribute for the financial statement recognition and measurement of a tax position taken or expected to be taken in a tax return. The Company recognizes interest and/or penalties related to income tax matters as income tax expense. As of December 31, 2010, the tax years ended December 31, 2006 through December 31, 2009 are open for examination by U.S. taxing authorities.
Comprehensive Income (Loss)
Comprehensive income (loss) is comprised of net income (loss) and other comprehensive income. Other comprehensive income includes the translation adjustments of the financial statements of Bronco MX at December 31, 2010 and 2009. The following table sets forth the components of comprehensive income (loss):
| Years ended December 31, | ||||||||||||
| 2010 | 2009 | 2008 | ||||||||||
| Net income (loss) |
$ | (50,677 | ) | $ | (57,579 | ) | $ | (8,243 | ) | |||
| Other comprehensive income—translation adjustment |
474 | 538 | — | |||||||||
|
|
|
|
|
|
|
|||||||
| Comprehensive income (loss) |
$ | (50,203 | ) | $ | (57,041 | ) | $ | (8,243 | ) | |||
|
|
|
|
|
|
|
|||||||
Net income (Loss) Per Common Share
The Company computes and presents net income (loss) per common share in accordance with ASC Topic 260, Earnings per Share. This standard requires dual presentation of basic and diluted net
F-41
Table of Contents
Index to Financial Statements
BRONCO DRILLING COMPANY, INC.
NOTES TO CONSOLIDATED FINANCIAL STATEMENTS—(Continued)
income (loss) per share on the face of the Company’s statement of operations. Basic net income (loss) per common share is computed by dividing net income or loss attributable to common stock by the weighted average number of common shares outstanding for the period. Diluted net income (loss) per common share reflects the potential dilution that could occur if options or other contracts to issue common stock were exercised or converted into common stock.
Stock-based Compensation
The Company has adopted ASC Topic 718, Stock Compensation upon granting its first stock options on August 16, 2005. ASC Topic 718 requires a public entity to measure the costs of employee services received in exchange for an award of equity or liability instruments based on the grant-date fair value of the award. That cost will be recognized over the periods during which an employee is required to provide service in exchange for the award.
Equity Method Investments
Investee companies that are not consolidated, but over which the Company exercises significant influence, are accounted for under the equity method of accounting. Whether or not the Company exercises significant influence with respect to an Investee depends on an evaluation of several factors including, among others, representation on the Investee company’s board of directors and ownership level, which is generally a 20% to 50% interest in the voting securities of the Investee company. Under the equity method of accounting, an Investee company’s accounts are not reflected within the Company’s Consolidated Balance Sheets and Statements of Operations; however, the Company’s share of the earnings or losses of the Investee company is reflected in the caption “Equity in income (loss) of Challenger” and “Equity in income (loss) of Bronco MX” in the Consolidated Statements of Operations. The Company’s carrying value in an equity method Investee company is reflected in the caption “Investment in Challenger” and “Investment in Bronco MX” in the Company’s Consolidated Balance Sheets.
Recent Accounting Pronouncements
In December 2010, the FASB issued an accounting standard update that addresses the disclosure of supplementary pro forma information for business combinations. This update clarifies that when public entities are required to disclose pro forma information for business combinations that occurred in the current reporting period, the pro forma information should be presented as if the business combination occurred as of the beginning of the previous fiscal year when comparative financial statements are presented. This update is effective prospectively for business combinations for which the acquisition date is on or after the beginning of the first annual reporting period beginning on or after December 15, 2010. Early adoption is permitted. The Company is currently evaluating the impact, if any, the adoption will have on our consolidated financial statements.
In January 2010, the FASB issued a new accounting standard which requires reporting entities to provide information about movements of assets among Levels 1 and 2 of the three-tier fair value hierarchy established by ASC 820, Fair Value Measurements. Also required will be a reconciliation of purchases, sales, issuance, and settlements of financial instruments valued with a Level 3 method, which is used to price the hardest to value instruments. Entities will have to provide fair value measurement disclosures for each class of financial assets and liabilities. The guidance will be effective for fiscal years beginning after December 15, 2010. The Company is currently evaluating the impact, if any, the adoption will have on our consolidated financial statements.
F-42
Table of Contents
Index to Financial Statements
BRONCO DRILLING COMPANY, INC.
NOTES TO CONSOLIDATED FINANCIAL STATEMENTS—(Continued)
In December 2009, the FASB issued a new accounting standard which updates the quantitative-based risks and rewards calculation for determining which reporting entity, if any, has a controlling financial interest in a variable interest entity with an approach focused on identifying which reporting entity has the power to direct the activities of a variable interest entity that most significantly impact the entity’s economic performance and (1) the obligation to absorb losses of the entity or (2) the right to receive benefits from the entity. An approach that is expected to be primarily qualitative will be more effective for identifying which reporting entity has a controlling financial interest in a variable interest entity. The amendments in this update also require additional disclosures about an reporting entity’s involvement in variable interest entities, which will enhance the information provided to users of financial statements. This new standard is effective at the start of a reporting entity’s first fiscal year beginning after January 1, 2010. The adoption of this standard did not impact our consolidated financial statements.
In October 2009, the FASB issued a new accounting standard that addresses the accounting for multiple-deliverable revenue arrangements to enable vendors to account for deliverables separately rather than as a combined unit. This new standard addresses how to separate deliverables and how to measure and allocate arrangement consideration to one or more units of accounting. Existing accounting standards require a vendor to use objective and reliable evidence of fair value for the undelivered items or the residual method to separate deliverables in a multiple-deliverable arrangement. Under the new standard, it is expected that multiple-deliverable arrangements will be separated in more circumstances than under current requirements. The new standard establishes a hierarchy for determining the selling price of a deliverable for purposes of allocating revenue to multiple deliverables. The selling price used will be based on vendor-specific objective evidence if available, third-party evidence if vendor-specific objective evidence is not available, or estimated selling price if neither vendor-specific objective evidence nor third-party evidence is available. The new standard must be prospectively applied to all revenue arrangements entered into in fiscal years beginning on or after June 15, 2010 and became effective for us on January 1, 2011. The Company is currently evaluating the impact, if any, the adoption will have on our consolidated financial statements.
In June 2009, the FASB issued a new accounting standard that amends the accounting and disclosure requirements for the consolidation of variable interest entities. This new standard removes the previously existing exception from applying consolidation guidance to qualifying special-purpose entities and requires ongoing reassessments of whether an enterprise is the primary beneficiary of a variable interest entity. Before this new standard, generally accepted accounting principles required reconsideration of whether an enterprise is the primary beneficiary of a variable interest entity only when specific events occurred. This new standard is effective as of the beginning of each reporting entity’s first annual reporting period that begins after November 15, 2009, for interim periods within that first annual reporting period, and for interim and annual reporting periods thereafter. This new standard became effective for us on January 1, 2010. The adoption of this standard did not impact our consolidated financial statements.
Reclassifications
Certain amounts in the financial statements for the prior years have been reclassified to conform to the current year’s presentation.
| 2. | Equity Method Investments |
On January 4, 2008, we acquired a 25% equity interest in Challenger Limited, in exchange for six drilling rigs and cash. The Company also sold to Challenger four drilling rigs and ancillary equipment.
F-43
Table of Contents
Index to Financial Statements
BRONCO DRILLING COMPANY, INC.
NOTES TO CONSOLIDATED FINANCIAL STATEMENTS—(Continued)
The Company recorded equity in loss of investment of $984 and $1,914 for the years ended December 31, 2010 and 2009, respectively, related to its equity investment in Challenger. Challenger is an international provider of contract land drilling and workover services to oil and natural gas companies with its principal operations in Libya.
The Company entered into a term note with Challenger related to the sale of four drilling rigs and ancillary equipment. The term note bears interest at 8.5%. Interest and principal payments of $529 on the note are due quarterly until maturity at February 2, 2011. The note receivable is collaterized by the assets sold to Challenger. The note receivable from Challenger at December 31, 2010 was $1,607, all of which was classified as current. The note receivable from Challenger at December 31, 2009 was $2,517.
On February 20, 2008, the Company entered into a Management Services Agreement and Master Services Agreement with Challenger. The Company agreed to make available to Challenger certain employees of the Company for the purpose of providing land drilling services, certain business consulting services and managerial support to Challenger. The Company invoices Challenger monthly for the services provided. The Company had accounts receivable from Challenger of $1,508 and $2,499 at December 31, 2010 and December 31, 2009, respectively, related to these services provided.
At December 31, 2010, the book value of the Company’s ordinary share investment in Challenger was $38,730. The Company’s 25% interest of the net assets of Challenger was estimated to be $35,428. The basis difference between the Company’s ordinary equity investment in Challenger and the Company’s 25% interest of the net assets of Challenger primarily consists of certain property, plant and equipment and accumulated depreciation in the amount of $3,626 and $324, respectively, at December 31, 2010. These amounts are being amortized against the Company’s 25% interest of Challenger’s net income over the estimated useful lives of 15 years for the property, plant and equipment. Amortization recorded during years ended December 31, 2010 and 2009 was $264 and $1,026, respectively.
The Company reviews its investment in Challenger for impairment based on the guidance of ASC Topic 323, Investments-Equity Method and Joint Venture, which states that a loss in value of an investment which is other than a temporary decline should be recognized. Evidence of a loss in value might include the absence of an ability to recover the carrying amount of the investment or inability of the investee to sustain an earnings capacity which would justify the carrying amount of the investment. A current fair value of an investment that is less than its carrying amount may indicate a loss in value of the investment. Due to the recent volatility and decline in oil and natural gas prices, a deteriorating global economic environment and the anticipated future earnings of Challenger, the Company deemed it necessary to test the investment for impairment in 2008, 2009 and 2010. Fair value of the investment was estimated using a combination of income, or discounted cash flows approach, and the market approach, which utilizes comparable companies’ data. The analysis resulted in an impairment charge of $14,442 during 2008. The analysis resulted in a fair value of $39,800 related to our investment in Challenger as of September 30, 2009, which was below the carrying value of the investment and resulted in a non-cash impairment charge in the amount of $21,247.
The analysis performed at December 31, 2010, resulted in a fair value of $40,863 related to our investment in Challenger, which was above the carrying value of the investment and resulted in no impairment. The estimate of fair value required management to make many estimates and judgments, such as forecasts of future cash flows, discount rates of approximately 15.0% and long term growth
F-44
Table of Contents
Index to Financial Statements
BRONCO DRILLING COMPANY, INC.
NOTES TO CONSOLIDATED FINANCIAL STATEMENTS—(Continued)
rates of 3.0% which it believes were reasonable and appropriate at December 31, 2010. Changes in such assumptions can result in an estimate of fair value that could be below the carrying amount of our investment in Challenger.
Recent civil and political disturbances in Libya the elsewhere in North Africa, and the Middle East that developed during the first quarter of 2011 may affect Challenger’s operations. Ongoing political unrest may result in loss of revenue and damage to equipment. Any impact from the political turmoil in Libya and elsewhere in North Africa on Challenger’s operations could negatively impact the Company’s investment in Challenger including, the entire loss of our investment.
Summarized financial information of Challenger is presented below:
| December 31, | ||||||||
| 2010 | 2009 | |||||||
| Condensed statement of operations: |
||||||||
| Revenues |
$ | 49,267 | $ | 56,509 | ||||
|
|
|
|
|
|||||
| Gross margin |
$ | 12,616 | $ | 21,076 | ||||
|
|
|
|
|
|||||
| Net Income (loss) |
$ | (2,931 | ) | $ | (3,552 | ) | ||
|
|
|
|
|
|||||
| Condensed balance sheet: |
||||||||
| Current assets |
$ | 61,147 | $ | 59,971 | ||||
| Noncurrent assets |
124,494 | 130,667 | ||||||
|
|
|
|
|
|||||
| Total assets |
$ | 185,641 | $ | 190,638 | ||||
|
|
|
|
|
|||||
| Current liabilities |
$ | 28,788 | $ | 25,511 | ||||
| Noncurrent liabilities |
15,189 | 20,531 | ||||||
| Equity |
141,664 | 144,596 | ||||||
|
|
|
|
|
|||||
| Total liabilities and equity |
$ | 185,641 | $ | 190,638 | ||||
|
|
|
|
|
|||||
In September 2009, Carso Infraestructura y Construcción, S.A.B. de C.V., or CICSA, purchased from us 60% of the outstanding membership interests of Bronco MX. Upon closing of the transaction, the Company owned the remaining 40% of the outstanding membership interests of Bronco MX. Immediately prior to the sale of the membership interests in Bronco MX to CICSA, the Company contributed six drilling rigs (Nos. 4, 43, 53, 58, 60 and 72), and the future net profit from rig leases relating to three additional drilling rigs (Nos. 55, 76 and 78), which the Company contributed to Bronco MX upon the expiration of the leases relating to such rigs. The general specifications of the contributed rigs are as follows:
| Rig |
Design |
Approximate Drilling Depth (ft) |
Type | Horsepower | ||||||||||
| 43 |
Gardner Denver 800 | 15,000 | Mechanical | 1,000 | ||||||||||
| 4 |
Skytop Brewster N46 | 14,000 | Mechanical | 950 | ||||||||||
| 53 |
Skytop Brewster N42 | 12,000 | Mechanical | 850 | ||||||||||
| 55 |
Oilwell 660 | 12,000 | Mechanical | 1,000 | ||||||||||
| 58 |
National N55 | 12,000 | Mechanical | 800 | ||||||||||
| 60 |
Skytop Brewster N46 | 14,000 | Mechanical | 850 | ||||||||||
| 72 |
Skytop Brewster N42 | 10,000 | Mechanical | 750 | ||||||||||
| 76 |
National N55 | 12,000 | Mechanical | 700 | ||||||||||
| 78 |
Seaco 1200 | 12,000 | Mechanical | 1,200 | ||||||||||
F-45
Table of Contents
Index to Financial Statements
BRONCO DRILLING COMPANY, INC.
NOTES TO CONSOLIDATED FINANCIAL STATEMENTS—(Continued)
The Company received $31,735 from CICSA in exchange for the 60% membership interest in Bronco MX, which included reimbursement for 60% of value added taxes previously paid by, or on behalf of, Bronco MX as a result of the importation to Mexico of the six drilling rigs that were contributed by the Company to Bronco MX. Upon completion of the transaction, the Company treated Bronco MX as a deconsolidated subsidiary in order to compute a loss in accordance with ASC Topic 810, Consolidation, due to the Company not retaining a controlling financial interest in Bronco MX subsequent to the sale. The Company recorded a net loss of $23,964 for the nine months ended September 30, 2009 relating to the transactions. The loss was computed based on the proceeds received from CICSA of $31,735 and the value of the Company’s 40% retained interest in Bronco MX of $21,495 less the book value of the net assets of Bronco MX, including rigs contributed to Bronco MX, of $77,194. The Company recorded a negative adjustment to the loss during the year ended December 31, 2010 of $1,487 due to post closing adjustments. Fair value of the Company’s 40% investment in Bronco MX was estimated using a combination of income, or discounted cash flows approach, the market approach, which utilizes pricing of third-party transactions of comparable businesses or assets and the cost approach which considers replacement cost as the primary indicator of value. The analysis resulted in a fair value of $21,495 related to the Company’s 40% retained interest in Bronco MX. At December 31, 2010, the book value of the Company’s ordinary share investment in Bronco MX was $20,632. The Company recorded equity in income (loss) of investment of $22 and ($588) for the year ended December 31, 2010 and for the period September 18 through December 31, 2009, respectively, related to its equity investment in Bronco MX. The Company’s investment in Bronco MX was increased by $474 as a result of a currency translation gain for the year ended December 31, 2010.
On July 1, 2010, CICSA contributed cash of approximately $45,100 in exchange for 735,356,219 shares of Bronco MX. As a result of the contribution, the Company’s membership interest in Bronco MX was decreased to approximately 20%. The Company accounted for the share issuance as if the Company had sold a proportionate amount of its shares. The Company recorded a loss on the transaction in the amount of $1,271.
Bronco MX is jointly managed, with CICSA having four representatives on its board of managers and the Company having one representative on its board of managers. The Company and CICSA, and their respective affiliates, have agreed to conduct all future land drilling and workover rig services, rental, construction, refurbishment, transportation, trucking and mobilization in Mexico and Latin America exclusively through Bronco MX, subject to Bronco MX’s ability to perform.
According to a Schedule 13D/A filed with the SEC on March 8, 2010 by Carlos Slim Helú, certain members of his family and affiliated entities (collectively, the “Slim Affiliates”), these individuals and entities collectively beneficially own approximately 19.99% of our common stock. CICSA is also a Slim Affiliate.
F-46
Table of Contents
Index to Financial Statements
BRONCO DRILLING COMPANY, INC.
NOTES TO CONSOLIDATED FINANCIAL STATEMENTS—(Continued)
Summarized financial information of Bronco MX is presented below:
| December 31, | ||||||||
| 2010 | 2009 | |||||||
| Condensed statement of operations: |
||||||||
| Revenues |
$ | 34,128 | $ | 7,171 | ||||
|
|
|
|
|
|||||
| Gross margin |
$ | 765 | $ | (2,582 | ) | |||
|
|
|
|
|
|||||
| Net Income (loss) |
$ | 826 | $ | (1,472 | ) | |||
|
|
|
|
|
|||||
| Condensed balance sheet: |
||||||||
| Current assets |
$ | 25,497 | $ | 8,931 | ||||
| Noncurrent assets |
100,687 | 57,746 | ||||||
|
|
|
|
|
|||||
| Total assets |
$ | 126,184 | $ | 66,677 | ||||
|
|
|
|
|
|||||
| Current liabilities |
$ | 23,031 | $ | 13,162 | ||||
| Noncurrent liabilities |
— | — | ||||||
| Equity |
103,153 | 53,515 | ||||||
|
|
|
|
|
|||||
| Total liabilities and equity |
$ | 126,184 | $ | 66,677 | ||||
|
|
|
|
|
|||||
| 3. | Accrued liabilities |
Accrued liabilities consisted of the following at December 31, 2010 and 2009:
| 2010 | 2009 | |||||||
| Salaries, wages, payroll taxes and benefits |
$ | 1,252 | $ | 623 | ||||
| Workers’ compensation liability |
3,695 | 2,458 | ||||||
| Sales, use and other taxes |
829 | 2,211 | ||||||
| Health insurance |
735 | 784 | ||||||
| Deferred revenue |
755 | 1,251 | ||||||
| General liability insurance |
500 | 500 | ||||||
| Accrued interest |
81 | 125 | ||||||
|
|
|
|
|
|||||
| $ | 7,847 | $ | 7,952 | |||||
|
|
|
|
|
|||||
F-47
Table of Contents
Index to Financial Statements
BRONCO DRILLING COMPANY, INC.
NOTES TO CONSOLIDATED FINANCIAL STATEMENTS—(Continued)
| 4. | Long-term Debt and Warrant |
Long-term debt consists of the following:
| December 31, 2010 |
December 31, 2009 |
|||||||
| Revolving credit facility with Banco Inbursa S.A., collateralized by the Company’s assets, and matures on September 17, 2014. Loans under the revolving credit facility bear interest at variable rates as defined in the credit agreement. Presented net of discount of $3,548 and $4,455 at December 31, 2010 and 2009, respectively.(1) |
5,555 | 50,545 | ||||||
| Note payable to Ameritas Life Insurance Corp., collateralized by a building, payable in principal and interest installments of $14, interest on the note is 6.0%, maturity date of January 1, 2021.(2) |
1,270 | 1,358 | ||||||
|
|
|
|
|
|||||
| 6,825 | 51,903 | |||||||
| Less current installments |
95 | 89 | ||||||
|
|
|
|
|
|||||
| 6,730 | 51,814 | |||||||
|
|
|
|
|
|||||
| (1) | On September 18, 2009, the Company entered into a new senior secured revolving credit facility with Banco Inbursa S.A., or Banco Inbursa, as lender and as the issuing bank. The Company utilized (i) borrowings under the credit facility, (ii) proceeds from the sale of the membership interests of Bronco MX and (iii) cash-on-hand to repay all amounts outstanding under the Company’s prior revolving credit agreement with Fortis Bank SA/NV, New York Branch, which was replaced by this credit facility. |
The credit facility initially provided for revolving advances of up to $75.0 million and the borrowing base under the credit facility was initially set at $75.0 million, subject to borrowing base limitations. On February 9, 2011 we amended our credit facility which reduced the commitment to $45.0 million. The credit facility matures on September 17, 2014. Outstanding borrowings under the credit facility bear interest at the Eurodollar rate plus 5.80% per annum, subject to adjustment under certain circumstances. The effective interest rate was 6.05% at December 31, 2010. The Company incurred $2,232 in debt issue costs related to this credit facility.
The Company pays a quarterly commitment fee of 0.5% per annum on the unused portion of the credit facility and a fee of 1.50% for each letter of credit issued under the facility. In addition, an upfront fee equal to 1.50% of the aggregate commitments under the credit facility was paid by the Company at closing. The Company’s domestic subsidiaries have guaranteed the loans and other obligations under the credit facility. The obligations under the credit facility and the related guarantees are secured by a first priority security interest in substantially all of the assets of the Company and its domestic subsidiaries, including the equity interests of the Company’s direct and indirect subsidiaries. Commitment fees expense for the years ended December 31, 2010 and 2009 was $125 and $15, respectively.
The credit facility contains customary representations and warranties and various affirmative and negative covenants, including, but not limited to, covenants that restrict the Company’s ability to make capital expenditures, incur indebtedness, incur liens, dispose of property, repay debt, pay dividends, repurchase shares and make certain acquisitions, and a financial covenant requiring that the Company maintain a ratio of consolidated debt to consolidated earnings before interest, taxes, depreciation and amortization as defined in the credit agreement for any four consecutive fiscal quarters of not more than 3.5 to 1.0. The Company was in compliance with all covenants at December 31, 2010. A violation of these covenants or any other covenant in the credit facility
F-48
Table of Contents
Index to Financial Statements
BRONCO DRILLING COMPANY, INC.
NOTES TO CONSOLIDATED FINANCIAL STATEMENTS—(Continued)
could result in a default under the credit facility which would permit the lender to restrict the Company’s ability to access the credit facility and require the immediate repayment of any outstanding advances under the credit facility.
In conjunction with its entry into the credit facility, the Company entered into a Warrant Agreement with Banco Inbursa and, pursuant thereto, issued a three-year warrant (the “Warrant”) to Banco Inbursa evidencing the right to purchase up to 5,440,770 shares of the Company’s common stock, $0.01 par value per share (the “Common Stock”) subject to the terms and conditions set forth in the Warrant, including the limitations on exercise set forth below, at an exercise price of $6.50 per share of Common Stock from the date of issuance September 18, 2009, of the Warrant (the “Issue Date”) through the first anniversary of the Issue Date, $7.00 per share following the first anniversary of the Issue Date through the second anniversary of the Issue Date, and $7.50 per share following the second anniversary of the Issue Date through the third anniversary of the Issue Date. Banco Inbursa subsequently transferred the Warrant to CICSA.
In accordance with accounting standards, the proceeds from the revolving credit facility were allocated to the credit facility and Warrant based on their respective fair values. Based on this allocation, $50,321 and $4,679 of the net proceeds were allocated to the credit facility and Warrant, respectively. The Warrant has been classified as a liability on the consolidated balance sheet due to the Company’s obligation to pay the seller of the Warrant a make-whole payment, in cash, under certain circumstances. The fair value of the Warrant was determined using a pricing model based on a version of the Black Scholes model, which is adjusted to account for the dilution resulting from the additional shares issued for the Warrant. The valuation was determined by computing the value of the Warrant if exercised in Year 1—3 with the values weighted by the probability that the warrant would actually be exercised in that year. Some of the assumptions used in the model were a volatility of 45% and a risk free interest rate that ranged from 0.41% to 1.57%.
The resulting discount to the revolving credit facility is amortized to interest expense over the term of the revolving credit facility. Accordingly, the Company will recognize annual interest expense on the debt at an effective interest rate of Eurodollar rate plus 6.25%. Imputed interest expense recognized for the years ended December 31, 2010 and December 31, 2009 was $907 and $224, respectively.
In accordance with accounting standards, the Company revalued the Warrant as of December 31, 2010 and December 31, 2009 and recorded the change in the fair value of the Warrant on the consolidated statement of operations. The fair value of the Warrant was determined using a pricing model based on a version of the Black Scholes model, which is adjusted to account for the dilution resulting from the additional shares issued for the Warrant. The valuation was determined by computing the value of the Warrant if exercised in Year 1—3 with the values weighted by the probability that the warrant would actually be exercised in that year. Some of the assumptions used in the model were volatilities of 50% and 45% and a risk free interest rate that ranged from 0.22% to 0.54% and 0.40% to 1.45% for 2010 and 2009, respectively. The fair value of the Warrant was $4,407 and $2,829 at December 31, 2010 and December 31, 2009, respectively. The Company recorded a gain (loss) on the change in the fair value of the Warrant on the consolidated statement of operations in the amount of $(1,578) and $1,850 for the years ended December 31, 2010 and December 31, 2009, respectively.
| (2) | On January 2, 2007, the Company assumed a term loan agreement with Ameritas Life Insurance Corp. related to the acquisition of a building. The loan provides for term installments in an aggregate not to exceed $1,590. |
F-49
Table of Contents
Index to Financial Statements
BRONCO DRILLING COMPANY, INC.
NOTES TO CONSOLIDATED FINANCIAL STATEMENTS—(Continued)
Long-term debt maturing each year subsequent to December 31, 2010 is as follows:
| 2011 |
$ | 95 | ||
| 2012 |
100 | |||
| 2013 |
107 | |||
| 2014 |
9,216 | |||
| 2015 |
120 | |||
| 2016 and thereafter |
735 | |||
|
|
|
|||
| $ | 10,373 | |||
|
|
|
| 5. | Income Taxes |
The Company adopted ASC Topic 740 on January 1, 2007. ASC Topic 740 clarifies the accounting for uncertainty in income taxes recognized in an enterprise’s financial statements and prescribes a recognition threshold and measurement attribute for the financial statement recognition and measurement of a tax position taken or expected to be taken in a tax return. As of December 31, 2010, the Company had no unrecognized tax benefits. The Company is continuing its practice of recognizing interest and/or penalties related to income tax matters as income tax expense. As of December 31, 2010, the tax years ended December 31, 2006 through December 31, 2009 are open for examination by U.S. taxing authorities.
Income tax expense (benefit) consists of the following:
| Years Ended December 31, | ||||||||||||
| 2010 | 2009 | 2008 | ||||||||||
| Current: |
||||||||||||
| State |
$ | 212 | $ | 28 | $ | (165 | ) | |||||
| Federal |
874 | (1,419 | ) | (874 | ) | |||||||
| Deferred: |
||||||||||||
| State |
(3,133 | ) | (1,660 | ) | (432 | ) | ||||||
| Federal |
(16,088 | ) | (24,100 | ) | (3,868 | ) | ||||||
|
|
|
|
|
|
|
|||||||
| Income tax expense (benefit) |
$ | (18,135 | ) | $ | (27,151 | ) | $ | (5,339 | ) | |||
|
|
|
|
|
|
|
|||||||
F-50
Table of Contents
Index to Financial Statements
BRONCO DRILLING COMPANY, INC.
NOTES TO CONSOLIDATED FINANCIAL STATEMENTS—(Continued)
Deferred income tax assets and liabilities are as follows:
| Years Ended December 31, | ||||||||
| 2010 | 2009 | |||||||
| Deferred tax assets: |
||||||||
| Stock option expense |
$ | 2,369 | $ | 2,607 | ||||
| Alternative minimum tax credit carryforward |
— | 2,225 | ||||||
| Net operating loss carryforwards |
27,903 | 37,905 | ||||||
| Accounts receivable allowance |
341 | 1,383 | ||||||
| Tax credits |
— | — | ||||||
| Employee benefits and insurance accruals |
277 | 303 | ||||||
| Other |
2,987 | 1,093 | ||||||
|
|
|
|
|
|||||
| Total deferred tax assets |
33,877 | 45,516 | ||||||
| Deferred tax liabilities: |
||||||||
| Property and equipment, principally due to differences in depreciation and impairments |
52,712 | 76,964 | ||||||
| Other |
64 | 64 | ||||||
|
|
|
|
|
|||||
| Total deferred tax liabilities |
52,776 | 77,028 | ||||||
|
|
|
|
|
|||||
| Net deferred tax liabilities |
$ | 18,899 | $ | 31,512 | ||||
|
|
|
|
|
|||||
In assessing its ability to realize deferred tax assets, the Company considers whether it is more likely than not that some portion or all of the deferred tax assets will not be realized. Ultimate realization of deferred tax assets depends on the generation of future taxable income during the periods in which those temporary differences become deductible. The Company considers the scheduled reversal of deferred tax liabilities and projected future taxable income in making this assessment. The Company believes it is more likely than not that it will realize the benefits of these deductible differences.
The provision for income taxes on continuing operations differs from the amounts computed by applying the federal income tax rate of 35% to net income. The differences are summarized as follows:
| Years Ended December 31, | ||||||||||||
| 2010 | 2009 | 2008 | ||||||||||
| Expected tax expense (benefit) |
$ | (17,473 | ) | $ | (25,783 | ) | $ | (4,870 | ) | |||
| State income taxes (benefit) |
(2,977 | ) | (2,201 | ) | (345 | ) | ||||||
| Nondeductible officer compensation |
155 | 121 | 330 | |||||||||
| Nondeductible meals and entertainment |
26 | 19 | 68 | |||||||||
| Stock compensation adjustment |
447 | 783 | — | |||||||||
| Goodwill impairment |
— | — | 1,125 | |||||||||
| Foreign tax expense/(credit) |
1,019 | (660 | ) | (832 | ) | |||||||
| Prior year estimate adjustment |
630 | 356 | (295 | ) | ||||||||
| Other |
38 | 214 | (520 | ) | ||||||||
|
|
|
|
|
|
|
|||||||
| $ | (18,135 | ) | $ | (27,151 | ) | $ | (5,339 | ) | ||||
|
|
|
|
|
|
|
|||||||
F-51
Table of Contents
Index to Financial Statements
BRONCO DRILLING COMPANY, INC.
NOTES TO CONSOLIDATED FINANCIAL STATEMENTS—(Continued)
| 6. | Workers’ Compensation and Health Insurance |
The Company is insured under a large deductible workers’ compensation insurance policy. The policy generally provides for a $500 deductible per covered accident. The Company maintains letters of credit in the aggregate amount of $11,460 for the benefit of various insurance companies as collateral for retrospective premiums and retained losses which may become payable under the terms of the underlying insurance contracts. The letters of credit are typically renewed annually. No amounts have been drawn under the letters of credit. Accrued expenses at December 31, 2010 and 2009 included approximately $3,695 and $2,458, respectively, for estimated incurred but not reported costs and premium accruals related to our workers’ compensation insurance.
On November 1, 2005, the Company initiated a self-insurance program for major medical, hospitalization and dental coverage for employees and their dependents, which is partially funded by payroll deductions. The Company provided for both reported and incurred but not reported medical costs in the accompanying consolidated balance sheets. We have a maximum liability of $125 per employee/dependent per year. Amounts in excess of the stated maximum are covered under a separate policy provided by an insurance company. Accrued expenses at December 31, 2010 and 2009 included approximately $735 and $784, respectively, for our estimate of incurred but not reported costs related to the self-insurance portion of our health insurance.
| 7. | Transactions with Affiliates |
During 2009, the Company had 6 operating leases with affiliated entities. As of January 9, 2010, these entities are no longer affiliated entities. Related rent expense was approximately $520 for the year ended December 31, 2009.
The Company had receivables from affiliates of $1,508 and $9,620 at December 31, 2010 and 2009, respectively.
Additional information about our transactions with affiliates is included in Note 2, Equity Method Investments.
| 8. | Commitments and Contingencies |
The Company leases 14 service locations under noncancelable operating leases that have various expirations from 2011 to 2015. Related rent expense was $986, $1,194, and $1,064 for the years ended December 31, 2010, 2009, and 2008, respectively.
Aggregate future minimum lease payments under the noncancelable operating leases for years subsequent to December 31, 2010 are as follows:
| 2011 |
$ | 770 | ||
| 2012 |
554 | |||
| 2013 |
401 | |||
| 2014 |
230 | |||
| 2015 |
77 | |||
|
|
|
|||
| $ | 2,032 | |||
|
|
|
F-52
Table of Contents
Index to Financial Statements
BRONCO DRILLING COMPANY, INC.
NOTES TO CONSOLIDATED FINANCIAL STATEMENTS—(Continued)
Various claims and lawsuits, incidental to the ordinary course of business, are pending against the Company. In the opinion of management, all matters are adequately covered by insurance or, if not covered, are not expected to have a material effect on the Company’s consolidated financial position, results of operations or cash flows.
| 9. | Asset Sales and Held for Sale |
On September 21, 2010 through September 23, 2010, the Company sold at auction in separate lots to multiple bidders two complete drilling rigs and components comprising four other drilling rigs (rigs 2, 9, 52, 70, 75 and 94), and ancillary equipment. The drilling rigs and equipment sold at auction were not being utilized currently in the Company’s business. The Company received net proceeds of approximately $8,286, net of selling expenses of $817, for the drilling rigs and related equipment. The Company recorded losses of $19,892 related to the sale of the drilling rigs and ancillary equipment. The loss was based on net book values of approximately $28,178 for the drilling rigs and ancillary equipment. The Company used the entire proceeds to pay down existing indebtedness under its revolving credit facility.
In an unrelated transaction on September 23, 2010, the Company sold two drilling rigs (rigs 41 and 42) in a private sale to Windsor Permian LLC, an unaffiliated third party, for net proceeds of $7,173. The Company recorded a $1,685 loss on the sale of these assets based on a net book value of $8,858.
The decision was made by management in the third quarter to sell an additional five drilling rigs (rigs 5, 6, 7, 51, and 54). Because the drilling rigs meet the held for sale criteria, the Company is required to present such assets, comprised of property and equipment, at the lower of carrying amount or fair value less the anticipated costs to sell. The Company evaluated these assets for impairment as of September 30, 2010 and December 31, 2010, for the year ended 2010, which resulted in recognizing a $7,900 impairment charge. Rig 6 is the only drilling rig unsold at December 31, 2010 with a carrying value of $1,550, which is the anticipated sale price, and is included in Non-current assets held for sale in our Consolidated Balance Sheets. At December 31, 2010, the Company’s fair value estimate was derived from negotiated prices with interested parties. The drilling rigs and related equipment were included as part of our land drilling segment.
On November 17, 2010, the Company sold at auction in separate lots to multiple bidders two complete drilling rigs (rigs 51 & 54) and ancillary equipment. The drilling rigs and equipment sold at auction were not being utilized currently in the Company’s business. The Company received net proceeds of approximately $1,666, net of selling expenses of $115, for the drilling rigs and related equipment. The Company recorded losses of $2,169 related to the sale of the drilling rigs and ancillary equipment. The loss was based on net book values of approximately $3,835 for the drilling rigs and ancillary equipment.
On November 29, 2010, the Company sold two drilling rigs (rigs 5 and 7) and entered into a contract to sell one drilling rig (rig 6) in a private sale to Atlas Drilling, LLC, an unaffiliated third party, for estimated net proceeds of $2,700. The Company recorded a $14 gain on the sale of these assets based on a net book value of $2,686.
The drilling rigs and related equipment sold at auction and the drilling rig held for sale are being sold as part of a broader strategy by management to divest of older drilling rigs and use the proceeds to pay down existing indebtedness.
F-53
Table of Contents
Index to Financial Statements
BRONCO DRILLING COMPANY, INC.
NOTES TO CONSOLIDATED FINANCIAL STATEMENTS—(Continued)
| 10. | Discontinued Operations |
Well Servicing
In the second quarter of 2010, management determined that our well servicing business segment was no longer consistent with the Company’s long-term strategic objectives and that the Company should seek to market this business for sale. During Q1 and Q2 2010 the market for workover services continued at depressed levels within the primary geographic market of our well servicing assets (Oklahoma). Management determined that higher return projects were available within the core drilling segment of the business and chose to deploy capital in this segment rather than commit the capital required to restructure operations in the well servicing segment. In late June management made a decision to market the assets constituting the well servicing segment for sale and redeploy the proceeds to reduce debt and to support the Company’s core drilling business. As of June 30, 2010, the well servicing property and equipment was classified as held for sale in our Consolidated Balance Sheets and well servicing operating results as discontinued operations in our Consolidated Statements of Operations. Well servicing was previously presented as its own reportable segment.
Because the well servicing assets met the held for sale criteria, the Company was required to present such assets, comprised of property and equipment, at the lower of carrying amount or fair value less the anticipated cost to sell. In connection with its June 30, 2010 quarterly report, the Company evaluated well servicing’s respective assets held for sale for impairment. The Company’s analysis as of June 30, 2010 resulted in recognizing a $23,376 impairment charge ($14,329 after tax). This second quarter charge is reflected as a component of loss from discontinued operations in the Company’s Consolidated Statements of Operations for the year ended.
In September 2010, substantially all of the assets of the well servicing segment were sold at auction to multiple bidders. The Company received proceeds of $12,362, net of selling expenses of $638. The sale of the assets of the well servicing segment resulted in a loss of $8,915, which is reflected as a component of loss from discontinued operations in the Company’s Consolidated Statements of Operations. The Company used the proceeds to pay down existing indebtedness under its revolving credit facility. The Company has one workover rig held for sale at December 31, 2010, with a carrying amount of $130. The Company recorded an impairment charge of $318 related to this workover rig during the third quarter.
The results of operations for the years ended December 31, 2010, 2009 and 2008 are below:
| Year Ended December 31, | ||||||||||||
| 2010 | 2009 | 2008 | ||||||||||
| Revenue |
$ | — | $ | 3,799 | $ | 33,284 | ||||||
| Impairment of assets held for sale |
$ | 23,694 | $ | — | $ | — | ||||||
| Loss from discontinued operations before income tax |
$ | (36,383 | ) | $ | (10,094 | ) | $ | (3,555 | ) | |||
| Income tax benefit |
$ | (14,079 | ) | $ | (3,906 | ) | $ | (131 | ) | |||
| Loss on sale of well servicing assets |
$ | (8,915 | ) | $ | — | $ | — | |||||
At June 30, 2010, the Company’s fair value estimate was derived from an appraisal performed specific to the property and equipment of the Company’s well servicing segment. Refer to Note 12, Fair Value Measurements, for further discussion.
Trucking Assets
In July 2010, the Company completed the sale of all of the Company’s trucking assets, property and equipment, for $11,299 in cash, net of selling expenses of $403. As drilling activity decreased in
F-54
Table of Contents
Index to Financial Statements
BRONCO DRILLING COMPANY, INC.
NOTES TO CONSOLIDATED FINANCIAL STATEMENTS—(Continued)
2008 and 2009 the utilization of these trucking assets fell sharply. The ongoing operating losses in our trucking division required resources to be directed away from the core drilling business. As such, management made the decision in the second quarter 2010 to sell these assets as their operations were not considered core. Proceeds from this sale were used to prepay existing indebtedness under our revolving credit facility with Banco Inbursa in July 2010. Based on the proceeds received and net book value of the property and equipment in the amount of $337, the Company recognized a gain of $10,962 in the third quarter of 2010. Operating results and the gain on sale of such assets are included as a component of discontinued operations in our Consolidated Statements of Operations for all periods presented. The trucking assets and operating activities were previously presented as part of our land drilling reportable segment. The results of operations for the years ended December 31, 2010, 2009 and 2008 are below:
| Year Ended December 31, | ||||||||||||
| 2010 | 2009 | 2008 | ||||||||||
| Revenue |
$ | 1,133 | $ | 3,842 | $ | 13,907 | ||||||
| Income (loss) from discontinued operations before income tax |
$ | 10,005 | $ | (5,301 | ) | $ | 805 | |||||
| Income tax expense (benefit) |
$ | 3,873 | $ | (2,052 | ) | $ | 311 | |||||
| Gain on sale of trucking assets |
$ | 10,962 | $ | — | $ | — | ||||||
| 11. | Net Income (Loss) Per Common Share |
The following table presents a reconciliation of the numerators and denominators of the basic and diluted earnings per share (“EPS”) and diluted EPS comparisons as required by ASC Topic 260:
| Year Ended December 31, | ||||||||||||
| 2010 | 2009 | 2008 | ||||||||||
| Basic: |
||||||||||||
| Continuing operations |
(34,505 | ) | (48,142 | ) | (5,315 | ) | ||||||
| Discontinued operations |
(16,172 | ) | (9,437 | ) | (2,928 | ) | ||||||
|
|
|
|
|
|
|
|||||||
| Net loss |
$ | (50,677 | ) | $ | (57,579 | ) | $ | (8,243 | ) | |||
|
|
|
|
|
|
|
|||||||
| Weighted average shares (thousands) |
27,091 | 26,651 | 26,293 | |||||||||
|
|
|
|
|
|
|
|||||||
| Continuing operations per share |
(1.27 | ) | (1.81 | ) | (0.20 | ) | ||||||
| Discontinued operations per share |
(0.60 | ) | (0.35 | ) | (0.11 | ) | ||||||
|
|
|
|
|
|
|
|||||||
| Net loss per share |
$ | (1.87 | ) | $ | (2.16 | ) | $ | (0.31 | ) | |||
|
|
|
|
|
|
|
|||||||
| Diluted: |
||||||||||||
| Continuing operations |
(34,505 | ) | (48,142 | ) | (5,315 | ) | ||||||
| Discontinued operations |
(16,172 | ) | (9,437 | ) | (2,928 | ) | ||||||
|
|
|
|
|
|
|
|||||||
| Net Loss |
$ | (50,677 | ) | $ | (57,579 | ) | $ | (8,243 | ) | |||
|
|
|
|
|
|
|
|||||||
| Weighted average shares: |
||||||||||||
| Outstanding (thousands) |
27,091 | 26,651 | 26,293 | |||||||||
| Restricted Stock and Options (thousands) |
— | — | — | |||||||||
|
|
|
|
|
|
|
|||||||
| 27,091 | 26,651 | 26,293 | ||||||||||
|
|
|
|
|
|
|
|||||||
| Continuing operations per share |
(1.27 | ) | (1.81 | ) | (0.20 | ) | ||||||
| Discontinued operations per share |
(0.60 | ) | (0.35 | ) | (0.11 | ) | ||||||
|
|
|
|
|
|
|
|||||||
| Income (loss) per share |
$ | (1.87 | ) | $ | (2.16 | ) | $ | (0.31 | ) | |||
|
|
|
|
|
|
|
|||||||
F-55
Table of Contents
Index to Financial Statements
BRONCO DRILLING COMPANY, INC.
NOTES TO CONSOLIDATED FINANCIAL STATEMENTS—(Continued)
The weighted average number of diluted shares excludes 87,850, 89,108, and 82,962 shares for the years ended December 31, 2010, 2009 and 2008, respectively, subject to restricted stock awards due to their antidilutive effects.
| 12. | Fair Value Measurements |
Fair Value Measurements
As defined in ASC 820, fair value is defined as the price that would be received to sell an asset or paid to transfer a liability in an orderly transaction between market participants at the measurement date (referred to as an “exit price”). Authoritative guidance on fair value measurements and disclosures clarifies that a fair value measurement for a liability should reflect the entity’s non-performance risk. In addition, a fair value hierarchy is established that prioritizes the inputs to valuation techniques used to measure fair value. The hierarchy gives the highest priority to unadjusted quoted market prices in active markets for identical assets and liabilities (Level 1 measurements) and the lowest priority to unobservable inputs (Level 3 measurements). The three levels of the fair value hierarchy are:
Level 1: Unadjusted quoted prices in active markets that are accessible at the measurement date for identical, unrestricted assets or liabilities.
Level 2: Quoted prices in markets that are not active, or inputs which are observable, either directly or indirectly, for substantially the full term of the asset or liability. This category includes quoted prices for similar assets or liabilities in active markets; quoted prices for identical or similar assets or liabilities in markets that are not active; inputs other than quoted prices that are observable for the asset or liability; and inputs that are derived principally from or corroborated by observable market data by correlation or other means.
Level 3: Measured based on prices or valuation models that require inputs that are both significant to the fair value measurement and less observable from objective sources.
Fair Value on Recurring Basis
The Company issued a Warrant in conjunction with its revolving credit facility with Banco Inbursa. In accordance with accounting standards, the Company revalued the Warrant as of December 31, 2010 and recorded the change in the fair value of the Warrant on the consolidated statement of operations. The fair value of the Warrant was determined using level 3 inputs. The Company used a pricing model based on a version of the Black Scholes model, which is adjusted to account for the dilution resulting from the additional shares issued for the Warrant. The valuation was determined by computing the value of the Warrant if exercised in Year 1—3 with the values weighted by the probability that the Warrant would actually be exercised in that year. Some of the assumptions used in the model were a volatility of 50% and a risk free interest rate that ranged from 0.22% to 0.54%. The fair value of the Warrant was $4,407 at December 31, 2010. The Company recorded a change in the fair value of the Warrant on the consolidated statement of operations in the amount of $(1,578) and $1,850 for the years ended December 31, 2010 and 2009, respectively.
Fair Value on Non-Recurring Basis
On January 1, 2009, the Company adopted the provisions of ASC 820 for nonfinancial assets and liabilities measured at fair value on a non-recurring basis. Certain assets and liabilities are reported at fair value on a nonrecurring basis in the Company’s consolidated balance sheets. The Company reviews its long-lived assets to be held and used, including property plant and equipment and its investments in Challenger and Bronco MX, whenever events or circumstances indicate that the carrying value of those assets may not be recoverable.
F-56
Table of Contents
Index to Financial Statements
BRONCO DRILLING COMPANY, INC.
NOTES TO CONSOLIDATED FINANCIAL STATEMENTS—(Continued)
In the second quarter of 2010, management determined that our well servicing business segment was no longer consistent with the Company’s long-term strategic objectives and that the Company should seek to market this business for sale. Because the well servicing property and equipment met the held for sale criteria, the Company was required to present its assets held for sale at the lower of carrying amount or fair value less the anticipated cost to sell. The Company evaluated well servicing’s respective assets held for sale for impairment. The fair value of the well servicing assets was determined using level 3 inputs. The Company engaged a third party independent appraisal company to determine the fair value of the well servicing assets. The appraised value was based on an on-site inspection of the assets and market research and analysis of applicable data. The Company’s analysis as of June 30, 2010 resulted in a $23,376 impairment charge ($14,329 after tax). This charge was recorded in the second quarter of 2010 and is reflected as a component of income (loss) from discontinued operations in the Company’s Consolidated Statements of Operations.
In the third quarter of 2010, management made the decision to divest of older drilling rigs and use the proceeds to pay down existing indebtedness. Consequently, management decided to sell five drilling rigs (rigs 5, 6, 7, 51, and 54). Because the drilling rigs meet the held for sale criteria, the Company is required to present these assets held for sale at the lower of carrying amount or fair value less anticipated cost to sell. The Company evaluated these assets as of September 30, 2010, for impairment. The fair value of the drilling rigs was determined using level 3 inputs. The fair value was determined by the sale price of similar assets sold by the Company in an auction during the third quarter and negotiated prices with interested parties. The analysis as of September 30, 2010 resulted in $7,761 impairment charge. The Company recorded an additional impairment during the fourth quarter of $139.
The Company reviewed its investment in Challenger at December 31, 2010 for impairment due to the recent volatility in oil and natural gas prices, the global economic environment and the anticipated future earnings of Challenger. Fair value of the investment was estimated using a combination of income, or discounted cash flows approach, and the market approach, which utilizes comparable companies’ data. The analysis resulted in a fair value of $40,863 related to our investment in Challenger, which was above the carrying value of the investment and resulted in no impairment. The estimate of fair value required management to make many estimates and judgements, such as forecasts of future cash flows, discount rates of 15.0% and long term growth rates of 3.0% which it believes were reasonable and appropriate at December 31, 2010. Changes in such assumptions can result in an estimate of fair value that could be below the carrying amount of our investments in Challenger.
| 13. | Restricted Stock |
The Company’s board of directors and a majority of our stockholders approved our 2006 Stock Incentive Plan, which the Company refers to as the 2006 Plan, effective April 20, 2006. Effective December 10, 2010, the Company’s board of directors and a majority of our shareholders approved an amendment to the 2006 Plan to increase the shares available for issuance thereunder by 2,500,000 shares. The purpose of the 2006 Plan is to provide a means by which eligible recipients of awards may be given an opportunity to benefit from increases in value of our common stock through the granting of one or more of the following awards: (1) incentive stock options, (2) nonstatutory stock options, (3) restricted awards, (4) performance awards and (5) stock appreciation rights.
The purpose of the plan is to enable the Company, and any of its affiliates, to attract and retain the services of the types of employees, consultants and directors who will contribute to our long range success and to provide incentives that are linked directly to increases in share value that will inure to the benefit of our stockholders.
F-57
Table of Contents
Index to Financial Statements
BRONCO DRILLING COMPANY, INC.
NOTES TO CONSOLIDATED FINANCIAL STATEMENTS—(Continued)
Eligible award recipients are employees, consultants and directors of the Company and its affiliates. Incentive stock options may be granted only to our employees. Awards other than incentive stock options may be granted to employees, consultants and directors. The shares that may be issued pursuant to awards consist of our authorized but unissued common stock, and the maximum aggregate amount of such common stock that may be issued upon exercise of all awards under the plan, including incentive stock options, may not exceed 5,000,000 shares, subject to adjustment to reflect certain corporate transactions or changes in our capital structure.
Under all restricted stock awards to date, nonvested shares are subject to forfeiture for failure to fulfill service conditions. Restricted stock awards consist of our common stock that vest over a two year period. Total shares available for future stock option grants and restricted stock grants to employees and directors under existing plans were 2,549,878 at December 31, 2010. Restricted stock awards are valued at the grant date market value of the underlying common stock and are being amortized to operations over the respective vesting period. Compensation expense for the years ended December 31, 2010, 2009 and 2008 related to shares of restricted stock was $3,274, $3,301, and $5,825, respectively. Restricted stock activity for the years ended December 31, 2010, 2009 and 2008 was as follows:
| Shares | Weighted Average Grant Date Fair Value |
|||||||
| Outstanding at December 31, 2007 |
553,445 | $ | 16.64 | |||||
| Granted |
232,874 | 13.98 | ||||||
| Vested |
(321,889 | ) | 16.36 | |||||
| Forfeited/expired |
(750 | ) | 16.69 | |||||
|
|
|
|
|
|||||
| Outstanding at December 31, 2008 |
463,680 | $ | 15.22 | |||||
| Granted |
415,955 | 5.28 | ||||||
| Vested |
(375,037 | ) | 13.86 | |||||
|
|
|
|
|
|||||
| Outstanding at December 31, 2009 |
504,598 | $ | 7.67 | |||||
| Granted |
1,247,000 | 4.74 | ||||||
| Vested |
(529,102 | ) | 7.35 | |||||
| Forfeited/expired |
— | — | ||||||
|
|
|
|
|
|||||
| Outstanding at December 31, 2010 |
1,222,496 | $ | 4.82 | |||||
|
|
|
|
|
|||||
There was $3,863,209 of total unrecognized compensation cost related to nonvested restricted stock awards to be recognized over a weighted-average period of 1.18 years as of December 31, 2010.
| 14. | Fair Value of Financial Instruments |
Cash and cash equivalents, trade receivables and payables and short-term debt:
The carrying amounts of our cash and cash equivalents, trade receivables, payables and short-term debt approximate their fair values due to the short-term nature of these instruments.
Long-term debt
The carrying amount of our long-term debt approximates its fair value, as supported by the recent issuance of the debt and because the rates and terms currently available to us approximate the rates and terms of the existing debt.
F-58
Table of Contents
Index to Financial Statements
BRONCO DRILLING COMPANY, INC.
NOTES TO CONSOLIDATED FINANCIAL STATEMENTS—(Continued)
| 15. | Employee Benefit Plans |
The Company implemented a 401(k) retirement plan for its eligible employees during 2008. Under the plan, the Company matches 100% of employees’ contributions up to 5% of eligible compensation. Employee and employer contributions vest immediately. The Company’s contributions for the years ended December 31, 2010, 2009 and 2008 were $548, $628, and $1,093, respectively.
| 16. | Quarterly Results of Operations (unaudited) |
The following table summarizes quarterly unaudited financial data for our years ended December 31, 2010 and 2009:
(Amounts in thousands except per share amounts)
| First Quarter |
Second Quarter |
Third Quarter(1) |
Fourth Quarter(2) |
|||||||||||||
| 2010 |
||||||||||||||||
| Revenues |
$ | 22,295 | $ | 29,938 | $ | 34,837 | $ | 37,329 | ||||||||
| Loss from continuing operations before income tax |
(8,626 | ) | (8,907 | ) | (31,796 | ) | (3,311 | ) | ||||||||
| Income tax benefit |
(2,621 | ) | (2,341 | ) | (12,126 | ) | (1,047 | ) | ||||||||
| Loss from continuing operations |
(6,005 | ) | (6,566 | ) | (19,670 | ) | (2,264 | ) | ||||||||
| Income (loss) from discontinued operations |
(1,414 | ) | (15,371 | ) | 846 | (233 | ) | |||||||||
| Net loss |
(7,419 | ) | (21,937 | ) | (18,824 | ) | (2,497 | ) | ||||||||
| Income (loss) per common share-Basic |
||||||||||||||||
| Continuing operations |
$ | (0.23 | ) | $ | (0.24 | ) | $ | (0.72 | ) | $ | (0.08 | ) | ||||
| Discontinued operations |
(0.05 | ) | (0.57 | ) | 0.03 | (0.01 | ) | |||||||||
|
|
|
|
|
|
|
|
|
|||||||||
| Loss per common share-Basic |
$ | (0.28 | ) | $ | (0.81 | ) | $ | (0.69 | ) | $ | (0.09 | ) | ||||
|
|
|
|
|
|
|
|
|
|||||||||
| Income (loss) per common share-Diluted |
||||||||||||||||
| Continuing operations |
$ | (0.23 | ) | $ | (0.24 | ) | $ | (0.72 | ) | $ | (0.08 | ) | ||||
| Discontinued operations |
(0.05 | ) | (0.57 | ) | 0.03 | (0.01 | ) | |||||||||
|
|
|
|
|
|
|
|
|
|||||||||
| Loss per common share-Diluted |
$ | (0.28 | ) | $ | (0.81 | ) | $ | (0.69 | ) | $ | (0.09 | ) | ||||
|
|
|
|
|
|
|
|
|
|||||||||
F-59
Table of Contents
Index to Financial Statements
BRONCO DRILLING COMPANY, INC.
NOTES TO CONSOLIDATED FINANCIAL STATEMENTS—(Continued)
| First Quarter |
Second Quarter |
Third Quarter(3) |
Fourth Quarter |
|||||||||||||
| 2009 |
||||||||||||||||
| Revenues |
$ | 45,282 | $ | 25,894 | $ | 15,826 | $ | 15,894 | ||||||||
| Income (loss) from continuing operations before income tax |
1,558 | (6,753 | ) | (64,152 | ) | (5,946 | ) | |||||||||
| Income tax expense (benefit) |
1,251 | (2,361 | ) | (23,716 | ) | (2,325 | ) | |||||||||
| Income (loss) from continuing operations |
307 | (4,392 | ) | (40,436 | ) | (3,621 | ) | |||||||||
| Loss from discontinued operations |
(2,016 | ) | (2,766 | ) | (2,218 | ) | (2,437 | ) | ||||||||
| Net loss |
(1,709 | ) | (7,158 | ) | (42,654 | ) | (6,058 | ) | ||||||||
| Income (loss) per common share-Basic |
||||||||||||||||
| Continuing operations |
$ | 0.01 | $ | (0.17 | ) | $ | (1.52 | ) | $ | (0.13 | ) | |||||
| Discontinued operations |
(0.07 | ) | (0.10 | ) | (0.08 | ) | (0.10 | ) | ||||||||
|
|
|
|
|
|
|
|
|
|||||||||
| Loss per common share-Basic |
$ | (0.06 | ) | $ | (0.27 | ) | $ | (1.60 | ) | $ | (0.23 | ) | ||||
|
|
|
|
|
|
|
|
|
|||||||||
| Income (loss) per common share-Diluted |
||||||||||||||||
| Continuing operations |
$ | 0.01 | $ | (0.17 | ) | $ | (1.52 | ) | $ | (0.13 | ) | |||||
| Discontinued operations |
(0.07 | ) | (0.10 | ) | (0.08 | ) | (0.10 | ) | ||||||||
|
|
|
|
|
|
|
|
|
|||||||||
| Loss per common share-Diluted |
$ | (0.06 | ) | $ | (0.27 | ) | $ | (1.60 | ) | $ | (0.23 | ) | ||||
|
|
|
|
|
|
|
|
|
|||||||||
| (1) | Includes $7,761 of impairment of drilling rigs and related equipment and $20,809 of loss on sale of drilling rigs and related equipment. |
| (2) | Includes $2,923 of loss on sale of drilling rigs and related equipment. |
| (3) | Includes $21,247 of impairment to our Challenger Investment and $23,964 loss on Bronco MX transaction. |
| 17. | Valuation and Qualifying Accounts |
The Company’s valuation and qualifying accounts for the years ended December 31, 2010, 2009 and 2008 are as follows:
| Valuation and Qualifying Accounts | ||||||||||||||||
| Balance at Beginning of Year |
Charged to Costs and Expenses |
Deductions from Accounts |
Balance at Year End |
|||||||||||||
| Year ended December 31, 2008 |
||||||||||||||||
| Allowance for doubtful receivables |
$ | 1,834 | $ | 3,745 | $ | (1,749 | ) | $ | 3,830 | |||||||
|
|
|
|
|
|
|
|
|
|||||||||
| Year ended December 31, 2009 |
||||||||||||||||
| Allowance for doubtful receivables |
$ | 3,830 | $ | 2,134 | $ | (2,388 | ) | $ | 3,576 | |||||||
|
|
|
|
|
|
|
|
|
|||||||||
| Year ended December 31, 2010 |
||||||||||||||||
| Allowance for doubtful receivables |
$ | 3,576 | $ | 2,692 | $ | (4,577 | ) | $ | 1,691 | |||||||
|
|
|
|
|
|
|
|
|
|||||||||
| 18. | Subsequent Events |
On February 9, 2011, the Company entered into an amendment to its revolving credit facility (the “Amended Credit Facility”) with Banco Inbursa S.A., Institucion de Banca Multiple, Grupo Financiero Inbursa. The Amended Credit Facililty reduced the commitment of the lender from $75,000 to $45,000 and reduced the number of drilling rigs pledged as collateral thereunder.
F-60
Table of Contents
Index to Financial Statements
BRONCO DRILLING COMPANY, INC.
NOTES TO CONSOLIDATED FINANCIAL STATEMENTS—(Continued)
On February 25, 2011, the Company entered into a purchase and sale agreement to sell two drilling rigs (rigs 56 and 62) to Windsor Drilling LLC. The Company expects to record a loss on the sale of the drilling rigs of approximately $1,703 based on estimated proceeds of $11,500 and a net book value of $13,203.
F-61
Table of Contents
Index to Financial Statements
BRONCO DRILLING COMPANY, INC.
UNAUDITED CONSOLIDATED FINANCIAL STATEMENTS AS OF MARCH 31, 2011
Introduction
The following pages set forth the unaudited consolidated financial statements of Bronco Drilling Company, Inc. as of March 31, 2011.
The accompanying notes are an integral part of these consolidated financial statements.
F-62
Table of Contents
Index to Financial Statements
UNAUDITED CONSOLIDATED BALANCE SHEETS AS OF MARCH 31, 2011
(Amounts in thousands, except share par value)
| March 31, 2011 |
December 31, 2010 |
|||||||
| (Unaudited) | ||||||||
| ASSETS |
||||||||
| CURRENT ASSETS |
||||||||
| Cash and cash equivalents |
$ | 14,797 | $ | 11,854 | ||||
| Restricted cash |
— | 2,700 | ||||||
| Receivables |
||||||||
| Trade and other, net of allowance for doubtful accounts of $968 and $891 in 2011 and 2010, respectively |
22,796 | 24,656 | ||||||
| Affiliate receivables, net of allowance of $800 |
1,546 | 1,508 | ||||||
| Unbilled receivables |
856 | 428 | ||||||
| Income tax receivable |
5,671 | 5,700 | ||||||
| Current deferred income taxes |
2,558 | 2,765 | ||||||
| Current maturities of note receivable from affiliate |
1,639 | 1,607 | ||||||
| Prepaid expenses |
1,038 | 329 | ||||||
|
|
|
|
|
|||||
| Total current assets |
50,901 | 51,547 | ||||||
| PROPERTY AND EQUIPMENT—AT COST |
||||||||
| Drilling rigs and related equipment |
304,886 | 315,085 | ||||||
| Transportation, office and other equipment |
16,281 | 16,236 | ||||||
|
|
|
|
|
|||||
| 321,167 | 331,321 | |||||||
| Less accumulated depreciation |
104,093 | 105,242 | ||||||
|
|
|
|
|
|||||
| 217,074 | 226,079 | |||||||
| OTHER ASSETS |
||||||||
| Investment in Challenger |
38,730 | 38,730 | ||||||
| Investment in Bronco MX |
21,433 | 20,632 | ||||||
| Debt issue costs and other |
4,617 | 3,362 | ||||||
| Non-current assets held for sale and discontinued operations |
7,000 | 1,680 | ||||||
|
|
|
|
|
|||||
| 71,780 | 64,404 | |||||||
|
|
|
|
|
|||||
| $ | 339,755 | $ | 342,030 | |||||
|
|
|
|
|
|||||
| LIABILITIES AND STOCKHOLDERS’ EQUITY |
||||||||
| CURRENT LIABILITIES |
||||||||
| Accounts payable |
$ | 8,674 | $ | 7,945 | ||||
| Accrued liabilities |
8,757 | 7,847 | ||||||
| Current maturities of long-term debt |
96 | 95 | ||||||
|
|
|
|
|
|||||
| Total current liabilities |
17,527 | 15,887 | ||||||
| LONG-TERM DEBT, less current maturities |
4,150 | 6,730 | ||||||
| WARRANT |
14,690 | 4,407 | ||||||
| DEFERRED INCOME TAXES |
17,387 | 21,664 | ||||||
| COMMITMENTS AND CONTINGENCIES (Note 6) |
||||||||
| STOCKHOLDERS’ EQUITY |
||||||||
| Common stock, $.01 par value, 100,000 shares authorized; 27,598 and 27,236 shares issued and outstanding at March 31, 2011 and December 31, 2010 |
276 | 277 | ||||||
| Additional paid-in capital |
309,874 | 310,580 | ||||||
| Accumulated other comprehensive income |
1,811 | 1,012 | ||||||
| Retained earnings (Accumulated deficit) |
(25,960 | ) | (18,527 | ) | ||||
|
|
|
|
|
|||||
| Total stockholders’ equity |
286,001 | 293,342 | ||||||
|
|
|
|
|
|||||
| $ | 339,755 | $ | 342,030 | |||||
|
|
|
|
|
|||||
The accompanying notes are an integral part of these unaudited consolidated financial statements.
F-63
Table of Contents
Index to Financial Statements
UNAUDITED CONSOLIDATED STATEMENTS OF OPERATIONS AS OF MARCH 31, 2011
(Amounts in thousands, except per share amounts)
| Three Months Ended March 31, | ||||||||
| 2011 | 2010 | |||||||
| (Unaudited) | ||||||||
| REVENUES |
||||||||
| Contract drilling revenues |
$ | 37,006 | $ | 22,295 | ||||
| EXPENSES |
||||||||
| Contract drilling |
23,801 | 18,159 | ||||||
| Depreciation and amortization |
5,659 | 7,705 | ||||||
| General and administrative |
4,209 | 4,217 | ||||||
| Loss (gain) on Bronco MX transaction |
— | (1,058 | ) | |||||
| Impairment of drilling rigs and related equipment |
679 | — | ||||||
| Loss on sale of drilling rigs and related equipment |
1,175 | — | ||||||
|
|
|
|
|
|||||
| 35,523 | 29,023 | |||||||
|
|
|
|
|
|||||
| Income (loss) from continuing operations |
1,483 | (6,728 | ) | |||||
| OTHER INCOME (EXPENSE) |
||||||||
| Interest expense |
(571 | ) | (1,456 | ) | ||||
| Loss from extinguishment of debt |
(1,975 | ) | — | |||||
| Interest income |
— | 46 | ||||||
| Equity in income (loss) of Challenger |
— | (599 | ) | |||||
| Equity in income (loss) of Bronco MX |
1 | (209 | ) | |||||
| Other |
25 | 48 | ||||||
| Change in fair value of warrant |
(10,283 | ) | 272 | |||||
|
|
|
|
|
|||||
| (12,803 | ) | (1,898 | ) | |||||
|
|
|
|
|
|||||
| Loss from continuing operations before income taxes |
(11,320 | ) | (8,626 | ) | ||||
| Income tax benefit |
(3,981 | ) | (2,621 | ) | ||||
|
|
|
|
|
|||||
| Loss from continuing operations |
(7,339 | ) | (6,005 | ) | ||||
| Loss from discontinued operations, net of tax |
(94 | ) | (1,414 | ) | ||||
|
|
|
|
|
|||||
| NET LOSS |
$ | (7,433 | ) | $ | (7,419 | ) | ||
|
|
|
|
|
|||||
| Loss per common share-Basic |
||||||||
| Continuing operations |
(0.27 | ) | (0.23 | ) | ||||
| Discontinued operations |
(0.00 | ) | (0.05 | ) | ||||
|
|
|
|
|
|||||
| Loss per common share-Basic |
$ | (0.27 | ) | $ | (0.28 | ) | ||
|
|
|
|
|
|||||
| Loss per common share-Diluted |
||||||||
| Continuing operations |
(0.27 | ) | (0.23 | ) | ||||
| Discontinued operations |
(0.00 | ) | (0.05 | ) | ||||
|
|
|
|
|
|||||
| Loss per common share-Diluted |
$ | (0.27 | ) | $ | (0.28 | ) | ||
|
|
|
|
|
|||||
| Weighted average number of shares outstanding-Basic |
27,468 | 26,850 | ||||||
|
|
|
|
|
|||||
| Weighted average number of shares outstanding-Diluted |
27,468 | 26,850 | ||||||
|
|
|
|
|
|||||
The accompanying notes are an integral part of these unaudited consolidated financial statements.
F-64
Table of Contents
Index to Financial Statements
UNAUDITED CONSOLIDATED STATEMENT OF STOCKHOLDERS’ EQUITY AND COMPREHENSIVE INCOME (LOSS) AS OF MARCH 31, 2011
(Amounts in thousands)
| Common Shares |
Common Amount |
Additional Paid In Capital |
Accumulated Other Comprehensive Income |
Retained Earnings |
Total Stockholders’ Equity |
|||||||||||||||||||
| Balance as of December 31, 2010 |
27,236 | $ | 277 | $ | 310,580 | $ | 1,012 | $ | (18,527 | ) | $ | 293,342 | ||||||||||||
| Net loss |
— | — | — | — | (7,433 | ) | (7,433 | ) | ||||||||||||||||
| Other Comprehensive Income: |
||||||||||||||||||||||||
| Foreign currency translation adjustment |
— | — | — | 799 | — | 799 | ||||||||||||||||||
|
|
|
|||||||||||||||||||||||
| Total Comprehensive Income (Loss) |
(6,634 | ) | ||||||||||||||||||||||
| Stock compensation |
531 | 1 | 779 | — | — | 780 | ||||||||||||||||||
| Stock withheld for taxes |
(169 | ) | (2 | ) | (1,485 | ) | — | — | (1,487 | ) | ||||||||||||||
|
|
|
|
|
|
|
|
|
|
|
|
|
|||||||||||||
| Balance as of March 31, 2011 |
27,598 | $ | 276 | $ | 309,874 | $ | 1,811 | $ | (25,960 | ) | $ | 286,001 | ||||||||||||
|
|
|
|
|
|
|
|
|
|
|
|
|
|||||||||||||
The accompanying notes are an integral part of these unaudited consolidated financial statements.
F-65
Table of Contents
Index to Financial Statements
UNAUDITED CONSOLIDATED STATEMENT OF CASH FLOWS AS OF MARCH 31, 2011
(Amounts in thousands)
| Three Months Ended March 31, | ||||||||
| 2011 | 2010 | |||||||
| (Unaudited) | ||||||||
| Cash flows from operating activities from continuing operations: |
||||||||
| Net loss |
$ | (7,433 | ) | $ | (7,419 | ) | ||
| Adjustments to reconcile net loss to net cash provided by operating activities from continuing operations: |
||||||||
| Loss from discontinued operations, net of tax |
94 | 1,414 | ||||||
| Depreciation and amortization |
5,860 | 7,899 | ||||||
| Bad debt expense |
71 | 898 | ||||||
| Loss (gain) on sale of assets |
162 | 263 | ||||||
| Write off of debt issue costs |
1,975 | — | ||||||
| Loss on sale of drilling rigs and related equipment |
1,175 | — | ||||||
| Impairment of drilling rigs and related equipment |
679 | — | ||||||
| Equity in (income) loss of Challenger |
— | 599 | ||||||
| Equity in (income) loss of Bronco MX |
(1 | ) | 209 | |||||
| Change in fair value of warrant |
10,283 | (272 | ) | |||||
| Loss on Bronco MX transaction |
— | (1,058 | ) | |||||
| Imputed interest expense |
229 | 225 | ||||||
| Stock compensation |
780 | 395 | ||||||
| Deferred income taxes |
(3,982 | ) | (2,749 | ) | ||||
| Changes in current assets and liabilities: |
||||||||
| Receivables |
1,725 | (1,216 | ) | |||||
| Affiliate receivables |
(70 | ) | 6,885 | |||||
| Unbilled receivables |
(428 | ) | 65 | |||||
| Prepaid expenses |
(1,228 | ) | (429 | ) | ||||
| Accounts payable |
(3,648 | ) | (4,343 | ) | ||||
| Accrued expenses |
2,445 | (463 | ) | |||||
| Other |
(1,082 | ) | (65 | ) | ||||
|
|
|
|
|
|||||
| Net cash provided by operating activities from continuing operations |
7,606 | 838 | ||||||
| Cash flows from investing activities from continuing operations: |
||||||||
| Proceeds from sale of assets |
6,321 | 3,287 | ||||||
| Purchase of property and equipment |
(7,575 | ) | (7,830 | ) | ||||
|
|
|
|
|
|||||
| Net cash used in investing activities from continuing operations |
(1,254 | ) | (4,543 | ) | ||||
| Cash flows from financing activities from continuing operations: |
||||||||
| Proceeds from borrowings |
3,000 | 5,000 | ||||||
| Payments of debt |
(9,126 | ) | (22 | ) | ||||
|
|
|
|
|
|||||
| Net cash provided by (used in) financing activities from continuing operations |
(6,126 | ) | 4,978 | |||||
|
|
|
|
|
|||||
| Net increase in cash and cash equivalents from continuing operations |
226 | 1,273 | ||||||
| Cash flows from discontinued operations: |
||||||||
| Operating cash flows |
17 | (55 | ) | |||||
| Investing cash flows |
— | (47 | ) | |||||
| Financing cash flows |
— | — | ||||||
|
|
|
|
|
|||||
| Net increase (decrease) in cash and cash equivalents from discontinued operations |
17 | (102 | ) | |||||
|
|
|
|
|
|||||
| Increase in cash and cash equivalents |
243 | 1,171 | ||||||
| Beginning cash and cash equivalents |
14,554 | 9,497 | ||||||
|
|
|
|
|
|||||
| Ending cash and cash equivalents |
$ | 14,797 | $ | 10,668 | ||||
|
|
|
|
|
|||||
| Supplementary disclosure of cash flow information: |
||||||||
| Interest paid, net of amount capitalized |
$ | 526 | $ | 1,255 | ||||
| Income taxes paid |
3 | 128 | ||||||
| Supplementary disclosure of non-cash investing and financing: |
||||||||
| Purchase of property and equipment in accounts payable |
2,865 | 1,110 | ||||||
The accompanying notes are an integral part of these unaudited consolidated financial statements.
F-66
Table of Contents
Index to Financial Statements
NOTES TO UNAUDITED CONSOLIDATED FINANCIAL STATEMENTS AS OF MARCH 31, 2011
($ Amounts in thousands, except per share amounts)
Unless the context requires otherwise, a reference in this quarterly report to “Bronco,” the “Company,” “we,” “us,” and “our” are to Bronco Drilling Company, Inc., a Delaware corporation, and its consolidated subsidiaries.
| 1. | Organization and Summary of Significant Accounting Policies |
Business and Principles of Consolidation
Bronco Drilling Company, Inc. (the “Company”) provides contract land drilling services to oil and natural gas exploration and production companies. The accompanying consolidated financial statements include the Company’s accounts and the accounts of its wholly owned subsidiaries. All intercompany accounts and transactions have been eliminated in consolidation.
The Company has prepared the accompanying unaudited consolidated financial statements and related notes in accordance with accounting principles generally accepted in the United States of America for interim financial information and with the instructions of Form 10-Q and Regulation S-X. In preparing the financial statements, the Company made various estimates and assumptions that affect the amounts of assets and liabilities the Company reports as of the dates of the balance sheets and amounts the Company reports for the periods shown in the consolidated statements of operations, stockholders’ equity and cash flows. The Company’s actual results could differ significantly from those estimates. Material estimates that are particularly susceptible to significant changes in the near term relate to the Company’s recognition of revenues and accrued expenses, estimate of the allowance for doubtful accounts, estimate of asset impairments, estimate of deferred taxes and determination of depreciation and amortization expense.
In management’s opinion, the accompanying unaudited consolidated financial statements contain all adjustments (consisting of normal recurring accruals) necessary to present fairly the financial position of the Company as of March 31, 2011, the related results of operations for the three months ended March 31, 2011 and 2010 and the cash flows for the three months ended March 31, 2011 and 2010. The information included in this Quarterly Report on Form 10-Q should be read in conjunction with the Company’s Annual Report on Form 10-K for the year ended December 31, 2010.
The results of operations for the three months ended March 31, 2011 are not necessarily an indication of the results expected for the full year.
A summary of the significant accounting policies consistently applied in the preparation of the accompanying consolidated financial statements follows.
Property and Equipment
Property and equipment, including renewals and betterments, are capitalized and stated at cost, while maintenance and repairs are expensed currently. Assets are depreciated on a straight-line basis. The depreciable lives of drilling rigs and related equipment are three to 15 years. The depreciable life of other equipment is three years. Depreciation is not commenced until acquired rigs are placed in service. Once placed in service, depreciation continues when rigs are being repaired, refurbished or between periods of deployment. Assets not placed in service and not being depreciated were $20,813 and $14,111 as of March 31, 2011 and December 31, 2010, respectively.
F-67
Table of Contents
Index to Financial Statements
BRONCO DRILLING COMPANY, INC.
NOTES TO UNAUDITED CONSOLIDATED FINANCIAL STATEMENTS AS OF MARCH 31, 2011—(Continued)
The Company capitalizes interest as a component of the cost of drilling rigs constructed for its own use. For the three months ended March 31, 2011 the Company capitalized $40 of interest expense. The Company did not capitalize any interest for the three months ended March 31, 2010.
The Company evaluates for potential impairment of long-lived assets and intangible assets subject to amortization when indicators of impairment are present, as defined in ASC Topic 360, Accounting for the Impairment or Disposal of Long-Lived Assets. Circumstances that could indicate a potential impairment include significant adverse changes in industry trends, economic climate, legal factors, and an adverse action or assessment by a regulator. More specifically, significant adverse changes in industry trends include significant declines in revenue rates, utilization rates, oil and natural gas market prices and industry rig counts for drilling rigs and workover rigs. In performing an impairment evaluation, the Company estimated the future undiscounted net cash flows from the use and eventual disposition of long-lived assets and intangible assets grouped at the lowest level that cash flows can be identified. If the sum of the estimated future undiscounted net cash flows is less than the carrying amount of the long-lived assets and intangible assets for these asset grouping levels, then the Company would recognize an impairment charge. The amount of an impairment charge would be measured as the difference between the carrying amount and the fair value of these assets. See Note 7, Asset Sales and Held for Sale, for discussion of impairment of drilling rigs and related equipment due to their classification as held for sale. See Note 8, Discontinued Operations, for discussion of well servicing segment property and equipment impairment relating to its classification as held for sale. The assumptions used in the impairment evaluation for long-lived assets and intangible assets are inherently uncertain and require management judgment.
Income Taxes
Pursuant to ASC Topic 740, Income Taxes, the Company follows the asset and liability method of accounting for income taxes, under which the Company recognizes deferred tax assets and liabilities for the future tax consequences attributable to differences between the financial statement carrying amounts of existing assets and liabilities and their respective tax bases. Deferred tax assets and liabilities were measured using enacted tax rates expected to apply to taxable income in the years in which the Company expects to recover or settle those temporary differences. A statutory Federal tax rate of 35% and effective state tax rate of 3.7% (net of Federal income tax effects) were used for the enacted tax rates for all periods.
As changes in tax laws or rates are enacted, deferred income tax assets and liabilities are adjusted through the provision for income taxes. Deferred tax assets are reduced by a valuation allowance if, based on available evidence, it is more likely than not that some portion or all of the deferred tax assets will not be realized. The classification of current and noncurrent deferred tax assets and liabilities is based primarily on the classification of the assets and liabilities generating the difference.
The Company applies the provisions of ASC Topic 740 which addresses the accounting for uncertainty in income taxes recognized in an enterprise’s financial statements and prescribes a recognition threshold and measurement attribute for the financial statement recognition and measurement of a tax position taken or expected to be taken in a tax return. The Company recognizes interest and/or penalties related to income tax matters as income tax expense. As of March 31, 2011, the tax years ended December 31, 2006 through December 31, 2009 are open for examination by U.S. taxing authorities.
F-68
Table of Contents
Index to Financial Statements
BRONCO DRILLING COMPANY, INC.
NOTES TO UNAUDITED CONSOLIDATED FINANCIAL STATEMENTS AS OF MARCH 31, 2011—(Continued)
Comprehensive Income (Loss)
Comprehensive income (loss) is comprised of net income (loss) and other comprehensive income. Other comprehensive income includes the translation adjustments of the financial statements of Bronco MX at March 31, 2011. The following table sets forth the components of comprehensive income (loss):
| Three Months Ended March 31, | ||||||||
| 2011 | 2010 | |||||||
| Net loss |
$ | (7,433 | ) | $ | (7,419 | ) | ||
| Other comprehensive income—translation adjustment |
799 | 827 | ||||||
|
|
|
|
|
|||||
| Comprehensive loss |
$ | (6,634 | ) | $ | (6,592 | ) | ||
|
|
|
|
|
|||||
Equity Method Investments
Investee companies that are not consolidated, but over which the Company exercises significant influence, are accounted for under the equity method of accounting. Whether or not the Company exercises significant influence with respect to an Investee depends on an evaluation of several factors including, among others, representation on the Investee company’s board of directors and ownership level, which is generally a 20% to 50% interest in the voting securities of the Investee company. Under the equity method of accounting, an Investee company’s accounts are not reflected within the Company’s Consolidated Balance Sheets and Statements of Operations; however, the Company’s share of the earnings or losses of the Investee company is reflected in the caption “Equity in income (loss) of Challenger” and “Equity in income (loss) of Bronco MX” in the Consolidated Statements of Operations. The Company’s carrying value in an equity method Investee company is reflected in the caption “Investment in Challenger” and “Investment in Bronco MX” in the Company’s Consolidated Balance Sheets.
Recent Accounting Pronouncements
In January 2010, the FASB issued a new accounting standard which requires reporting entities to provide information about movements of assets among Levels 1 and 2 of the three-tier fair value hierarchy established by ASC 820, Fair Value Measurements. Also required is a reconciliation of purchases, sales, issuance, and settlements of financial instruments valued with a Level 3 method, which is used to price the hardest to value instruments. Entities are required to provide fair value measurement disclosures for each class of financial assets and liabilities. The guidance is effective for fiscal years beginning after December 15, 2010. The adoption of this standard did not impact our consolidated financial statements.
| 2. | Equity Method Investments |
On January 4, 2008, we acquired a 25% equity interest in Challenger Limited, or Challenger, in exchange for six drilling rigs and cash. The Company also sold to Challenger four drilling rigs and ancillary equipment. Challenger is an international provider of contract land drilling and workover services to oil and natural gas companies with its principal operations in Libya. The Company also entered into a term note with Challenger related to the sale of four drilling rigs and ancillary equipment. The term note bears interest at 8.5%. Interest and principal payments of $529 on the note are due quarterly until maturity at February 2, 2011. The note receivable is collateralized by the assets sold to Challenger. The note receivable from Challenger at March 31, 2011 and December 31, 2010 was $1,639 and $1,607, respectively.
On February 20, 2008, the Company entered into a Management Services Agreement and Master Services Agreement with Challenger. The Company agreed to make available to Challenger certain employees of the Company for the purpose of providing land drilling services, certain business consulting
F-69
Table of Contents
Index to Financial Statements
BRONCO DRILLING COMPANY, INC.
NOTES TO UNAUDITED CONSOLIDATED FINANCIAL STATEMENTS AS OF MARCH 31, 2011—(Continued)
services and managerial support to Challenger. The Company invoices Challenger monthly for the services provided. The Company had accounts receivable from Challenger of $1,546 and $1,508 at March 31, 2011 and December 31, 2010, respectively, related to these services provided.
Recent civil and political disturbances in Libya have and will continue to affect Challenger’s operations. Ongoing political unrest may result in loss of revenue and damage to Challenger’s equipment. The political turmoil in Libya and elsewhere in North Africa and impact on Challenger’s operations could negatively impact the Company’s investment in Challenger, including the loss of our investment and write off of our receivables from Challenger. Challenger was unable to provide financial statements or other financial information for the three months ended March 31, 2011 due to the events in Libya and disruptions in their operations. Because of the lack of information and uncertainties caused by the events in Libya, we have not recorded or estimated any adjustments to the carrying value of our investment in Challenger, receivable balances or equity in income (loss) of Challenger. We will continue to monitor and evaluate the developments in Libya and our investment in Challenger during 2011 and the Company intends to make required adjustments to equity in income of Challenger in the period that financial statements or other reasonable information are available.
At March 31, 2011 and December 31, 2010, the book value of the Company’s ordinary share investment in Challenger was $38,730. The Company’s 25% interest of the net assets of Challenger was estimated to be $35,428 at December 31, 2010. The basis difference between the Company’s ordinary equity investment in Challenger and the Company’s 25% interest of the net assets of Challenger primarily consists of certain property, plant and equipment and accumulated depreciation in the net amount of $3,626 and $324 at March 31, 2011. These amounts are being amortized against the Company’s 25% interest of Challenger’s net income over the estimated useful lives of 15 years for the property, plant and equipment. Amortization recorded during the three months ended March 31, 2011 and March 31, 2010 was $0 and $61, respectively. The Company recorded equity in loss of investment of $0 and $(599) for the three months ended March 31, 2011 and 2010, respectively, related to its equity investment in Challenger.
Summarized financial information of Challenger is presented below. As described above, we are unable to provide summarized financial information as of and for the three months ended March 31, 2011.
| Three Months Ended March 31, 2010 |
||||
| Condensed statement of operations: |
||||
| Revenues |
$ | 9,875 | ||
|
|
|
|||
| Gross margin |
$ | 2,030 | ||
|
|
|
|||
| Net Loss |
$ | (2,153 | ) | |
|
|
|
|||
| December 31, 2010 |
||||
| Condensed balance sheet: |
||||
| Current assets |
$ | 56,010 | ||
| Noncurrent assets |
128,829 | |||
|
|
|
|||
| Total assets |
$ | 184,839 | ||
|
|
|
|||
| Current liabilities |
$ | 21,675 | ||
| Noncurrent liabilities |
20,722 | |||
| Equity |
142,442 | |||
|
|
|
|||
| Total liabilities and equity |
$ | 184,839 | ||
|
|
|
|||
F-70
Table of Contents
Index to Financial Statements
BRONCO DRILLING COMPANY, INC.
NOTES TO UNAUDITED CONSOLIDATED FINANCIAL STATEMENTS AS OF MARCH 31, 2011—(Continued)
In September, 2009, Carso Infraestructura y Construcción, S.A.B. de C.V., or CICSA, purchased from us 60% of the outstanding membership interests of Bronco MX. Upon closing of the transaction, the Company owned the remaining 40% of the outstanding membership interests of Bronco MX. Immediately prior to the sale of the membership interests in Bronco MX to CICSA, the Company contributed six drilling rigs (Nos. 4, 43, 53, 58, 60 and 72), and the future net profit from rig leases relating to three additional drilling rigs (Nos. 55, 76 and 78), which the Company contributed to Bronco MX upon the expiration of the leases relating to such rigs.
The Company received $31,735 from CICSA in exchange for the 60% membership interest in Bronco MX, which included reimbursement for 60% of value added taxes previously paid by, or on behalf of, Bronco MX as a result of the importation to Mexico of the six drilling rigs that were contributed by the Company to Bronco MX. Upon completion of the transaction, the Company treated Bronco MX as a deconsolidated subsidiary in order to compute a loss in accordance with ASC Topic 810, Consolidation, due to the Company not retaining a controlling financial interest in Bronco MX subsequent to the sale. The Company recorded a net loss of $23,964 for the nine months ended September 30, 2009 relating to the transactions. The loss was computed based on the proceeds received from CICSA of $31,735 and the value of the Company’s 40% retained interest in Bronco MX of $21,495 less the book value of the net assets of Bronco MX, including rigs contributed to Bronco MX, of $77,194. The Company recorded a negative adjustment to the loss during the year ended 2010 of $1,487 due to post closing adjustments.
On July 1, 2010, CICSA contributed cash of approximately $45,100 in exchange for 735,356,219 shares of Bronco MX. As a result of the contribution, the Company’s membership interest in Bronco MX was decreased to approximately 20%. The Company accounted for the share issuance as if the Company had sold a proportionate amount of its shares. The Company recorded a loss on the transaction in the amount of $1,271.
Bronco MX is jointly managed, with CICSA having four representatives on its board of managers and the Company having one representative on its board of managers. The Company and CICSA, and their respective affiliates, have agreed to conduct all future land drilling and workover rig services, rental, construction, refurbishment, transportation, trucking and mobilization in Mexico and Latin America exclusively through Bronco MX, subject to Bronco MX’s ability to perform.
According to a Schedule 13D/A filed with the SEC on April 19, 2011 by Carlos Slim Helú, certain members of his family and affiliated entities (collectively, the “Slim Affiliates”), these individuals and entities collectively own approximately 19.0% of our common stock. CICSA is also a Slim Affiliate.
At March 31, 2011, the book value of the Company’s ordinary share investment in Bronco MX was $21,433. The Company recorded equity in income (loss) of investment of $1 and $(209) for the three months ended March 31, 2011 and March 31, 2010, respectively, related to its equity investment in Bronco MX. The Company’s investment in Bronco MX was increased by $799 as a result of a currency translation gain for the three months ended March 31, 2011.
Summarized financial information of Bronco MX is presented below:
| Three Months Ended | ||||||||
| March 31, 2011 | March 31, 2010 | |||||||
| Condensed statement of operations: |
||||||||
| Revenues |
$ | 8,832 | $ | 6,514 | ||||
|
|
|
|
|
|||||
| Gross margin |
$ | 337 | $ | (485 | ) | |||
|
|
|
|
|
|||||
| Net Income (loss) |
$ | 7 | $ | (521 | ) | |||
|
|
|
|
|
|||||
F-71
Table of Contents
Index to Financial Statements
BRONCO DRILLING COMPANY, INC.
NOTES TO UNAUDITED CONSOLIDATED FINANCIAL STATEMENTS AS OF MARCH 31, 2011—(Continued)
| March 31, 2011 |
December 31, 2010 |
|||||||
| Condensed balance sheet: |
||||||||
| Current assets |
$ | 29,005 | $ | 25,497 | ||||
| Noncurrent assets |
104,453 | 100,687 | ||||||
|
|
|
|
|
|||||
| Total assets |
$ | 133,458 | $ | 126,184 | ||||
|
|
|
|
|
|||||
| Current liabilities |
$ | 26,299 | $ | 23,031 | ||||
| Noncurrent liabilities |
— | — | ||||||
| Equity |
107,159 | 103,153 | ||||||
|
|
|
|
|
|||||
| Total liabilities and equity |
$ | 133,458 | $ | 126,184 | ||||
|
|
|
|
|
|||||
| 3. | Long-term Debt and Warrant |
Long-term debt consists of the following:
| March 31, 2011 |
December 31, 2010 |
|||||||
| Revolving credit facility with Banco Inbursa S.A., collateralized by the Company’s assets, and matures on September 17, 2014. Loans under the revolving credit facility bear interest at variable rates as defined in the credit agreement.(1) |
3,000 | 5,555 | ||||||
| Note payable to Ameritas Life Insurance Corp., collateralized by a building, payable in principal and interest installments of $14, interest on the note is 6.0%, maturity date of January 1, 2021.(2) |
1,246 | 1,270 | ||||||
|
|
|
|
|
|||||
| $ | 4,246 | $ | 6,825 | |||||
| Less current installments |
96 | 95 | ||||||
|
|
|
|
|
|||||
| 4,150 | 6,730 | |||||||
|
|
|
|
|
|||||
| (1) | On September 18, 2009, the Company entered into a new senior secured revolving credit facility with Banco Inbursa S.A., or Banco Inbursa, as lender and as the issuing bank. The Company utilized (i) borrowings under the credit facility, (ii) proceeds from the sale of the membership interests of Bronco MX and (iii) cash-on-hand to repay all amounts outstanding under the Company’s prior revolving credit agreement with Fortis Bank SA/NV, New York Branch, which was replaced by this credit facility. |
The credit facility initially provided for revolving advances of up to $75.0 million and the borrowing base under the credit facility was initially set at $75.0 million, subject to borrowing base limitations. On February 9, 2011 we amended our credit facility which reduced the commitment to $45.0 million. The Company incurred a loss from extinguishment of debt of approximately $1,975 related to the reduction in availability under the credit facility. The credit facility matures on September 17, 2014. Outstanding borrowings under the credit facility bear interest at the Eurodollar rate plus 5.80% per annum, subject to adjustment under certain circumstances. The effective interest rate was 6.51% at March 31, 2011.
The Company pays a quarterly commitment fee of 0.5% per annum on the unused portion of the credit facility and a fee of 1.50% for each letter of credit issued under the facility. In addition, an upfront fee equal to 1.50% of the aggregate commitments under the credit facility was paid by the Company at closing. The Company’s domestic subsidiaries have guaranteed the loans and other obligations under the credit facility. The obligations under the credit facility and the related guarantees are secured by a first priority security interest in substantially all of the assets of the Company and its domestic subsidiaries, including the equity interests of the Company’s direct and indirect subsidiaries. Commitment fees expense for the three months ended March 31, 2011 and 2010 was $50 and $10, respectively.
F-72
Table of Contents
Index to Financial Statements
BRONCO DRILLING COMPANY, INC.
NOTES TO UNAUDITED CONSOLIDATED FINANCIAL STATEMENTS AS OF MARCH 31, 2011—(Continued)
The credit facility contains customary representations and warranties and various affirmative and negative covenants, including, but not limited to, covenants that restrict the Company’s ability to make capital expenditures, incur indebtedness, incur liens, dispose of property, repay debt, pay dividends, repurchase shares and make certain acquisitions, and a financial covenant requiring that the Company maintain a ratio of consolidated debt to consolidated earnings before interest, taxes, depreciation and amortization as defined in the credit agreement for any four consecutive fiscal quarters of not more than 3.5 to 1.0. The Company was in compliance with all covenants at March 31, 2011. A violation of these covenants or any other covenant in the credit facility could result in a default under the credit facility which would permit the lender to restrict the Company’s ability to access the credit facility and require the immediate repayment of any outstanding advances under the credit facility.
In conjunction with its entry into the credit facility, the Company entered into a Warrant Agreement with Banco Inbursa and, pursuant thereto, issued a three-year warrant (the “Warrant”) to Banco Inbursa evidencing the right to purchase up to 5,440,770 shares of the Company’s common stock, $0.01 par value per share (the “Common Stock”) subject to the terms and conditions set forth in the Warrant, including the limitations on exercise set forth below, at an exercise price of $6.50 per share of Common Stock from the date of issuance of the Warrant (the “Issue Date”) through the first anniversary of the Issue Date, $7.00 per share following the first anniversary of the Issue Date through the second anniversary of the Issue Date, and $7.50 per share following the second anniversary of the Issue Date through the third anniversary of the Issue Date. Banco Inbursa subsequently transferred the Warrant to CICSA.
In accordance with accounting standards, the proceeds from the revolving credit facility were allocated to the credit facility and Warrant based on their respective fair values. Based on this allocation, $50,321 and $4,679 of the net proceeds were allocated to the credit facility and Warrant, respectively. The Warrant has been classified as a liability on the consolidated balance sheet due to the Company’s obligation to pay the seller of the Warrant a make-whole payment, in cash, under certain circumstances. The fair value of the Warrant was determined using a pricing model based on a version of the Black Scholes model, which is adjusted to account for the dilution resulting from the additional shares issued for the Warrant. The valuation was determined by computing the value of the Warrant if exercised in Year 1—3 with the values weighted by the probability that the warrant would actually be exercised in that year. Some of the assumptions used in the model were a volatility of 45% and a risk free interest rate that ranged from 0.41% to 1.57%.
The resulting discount to the revolving credit facility is amortized to interest expense over the term of the revolving credit facility. Accordingly, the Company will recognize annual interest expense on the debt at an effective interest rate of Eurodollar rate plus 6.25%. Imputed interest expense recognized for the three months ended March 31, 2011 and 2010 was $229 and $225, respectively.
In accordance with accounting standards, the Company revalued the Warrant as of March 31, 2011 and 2010 and recorded the change in the fair value of the Warrant on the consolidated statement of operations. The fair value of the Warrant was determined using a pricing model based on a version of the Black Scholes model, which is adjusted to account for the dilution resulting from the additional shares issued for the Warrant. The valuation was determined by computing the value of the Warrant if exercised in Year 2—3 with the values weighted by the probability that the Warrant would actually be exercised in that year. Some of the assumptions used in the model were volatility between 39% and 49% and a risk free interest rate that ranged from 0.16% to 0.56%. The fair value of the warrant was $14,690 at March 31, 2011. The Company recorded a change in the fair value of the Warrant on the consolidated statement of operations in the amount of $10,283 and $272 for the three months ended March 31, 2011 and 2010, respectively.
F-73
Table of Contents
Index to Financial Statements
BRONCO DRILLING COMPANY, INC.
NOTES TO UNAUDITED CONSOLIDATED FINANCIAL STATEMENTS AS OF MARCH 31, 2011—(Continued)
| (2) | On January 2, 2007, the Company assumed a term loan agreement with Ameritas Life Insurance Corp. related to the acquisition of a building. The loan provides for term installments in an aggregate not to exceed $1,590. |
Long-term debt maturing each year subsequent to March 31, 2011 is as follows:
| 2012 |
$ | 96 | ||
| 2013 |
102 | |||
| 2014 |
108 | |||
| 2015 |
3,115 | |||
| 2016 |
122 | |||
| 2017 and thereafter |
703 | |||
|
|
|
|||
| $ | 4,246 | |||
|
|
|
| 4. | Workers’ Compensation and Health Insurance |
The Company is insured under a large deductible workers’ compensation insurance policy. The policy generally provides for a $1,000 deductible per covered accident. The Company maintains letters of credit in the aggregate amount of $8,525 for the benefit of various insurance companies as collateral for retrospective premiums and retained losses which may become payable under the terms of the underlying insurance contracts. The letters of credit are typically renewed annually. No amounts have been drawn under the letters of credit. Accrued expenses at March 31, 2011 and December 31, 2010 included approximately $3,481 and $3,695, respectively, for estimated incurred but not reported costs and premium accruals related to our workers’ compensation insurance.
On November 1, 2005, the Company initiated a self-insurance program for major medical, hospitalization and dental coverage for employees and their dependents, which is partially funded by payroll deductions. The Company provided for both reported and incurred but not reported medical costs in the accompanying consolidated balance sheets. We have a maximum liability of $125 per employee/dependent per year. Amounts in excess of the stated maximum are covered under a separate policy provided by an insurance company. Accrued expenses at March 31, 2011 and December 31, 2010 included approximately $718 and $735, respectively, for our estimate of incurred but not reported costs related to the self-insurance portion of our health insurance.
| 5. | Transactions with Affiliates |
The Company had receivables from affiliates of $1,546 and $1,508 at March 31, 2011 and December 31, 2010, respectively.
Additional information about our transactions with affiliates is included in Note 2, Equity Method Investments.
| 6. | Commitments and Contingencies |
Various claims and lawsuits, incidental to the ordinary course of business, are pending against the Company. In the opinion of management, all matters are adequately covered by insurance or, if not covered, are not expected to have a material effect on the Company’s consolidated financial position, results of operations or cash flows.
F-74
Table of Contents
Index to Financial Statements
BRONCO DRILLING COMPANY, INC.
NOTES TO UNAUDITED CONSOLIDATED FINANCIAL STATEMENTS AS OF MARCH 31, 2011—(Continued)
On April 14, 2011, we entered into an Agreement and Plan of Merger with Chesapeake Energy Corporation and Nomac Acquisition, Inc., an indirect wholly owned subsidiary of Chesapeake (“Purchaser”), as previously disclosed on a Form 8-K we filed with the SEC on April 18, 2011. Under the terms of the merger agreement, Chesapeake has agreed to acquire the Company through a two-step transaction, consisting of a tender offer by the Purchaser for all of our outstanding common stock at a price of $11.00 per share without interest thereon and less any applicable withholding or stock transfer taxes, followed by the merger of the Purchaser with and into the Company, with the Company surviving as an indirect, wholly owned subsidiary of Chesapeake.
Ten putative class action lawsuits relating to the merger agreement and the transactions contemplated therein have been commenced against the Company and current members of our board of directors, including our chief executive officer (the “Individual Defendants”). Six putative class action lawsuits were filed in the District Court of Oklahoma County, Oklahoma (collectively, the “Oklahoma Suits”). Two of the Oklahoma Suits have been voluntarily dismissed. Four putative class action lawsuits were filed in the Court of Chancery of the State of Delaware (the “Delaware Suits” and together with the four remaining Oklahoma Suits, the “Class Actions”). The Delaware Suits were consolidated into a single action on May 6, 2011. The Class Actions each seek certification of a class of all holders of our common stock and variously allege, among other things, that: (1) the Individual Defendants have breached and continue to breach their fiduciary duties to our stockholders; (2) the offer and the merger are unfair to our public stockholders as the proposed transactions underestimate the value of the Company; (3) the Individual Defendants are pursuing a course of conduct that does not maximize the value of the Company; and (4) the Company aided and abetted the alleged breaches of duties by the Individual Defendants. On April 29, 2011, the Delaware Suits were amended, adding allegations that the Schedule 14D-9 filed by the Company and the Schedule TO filed by Chesapeake did not adequately describe the process that resulted in the offer and that the Schedule 14D-9 did not include adequate information concerning the fairness opinion Johnson Rice & Company L.L.C. provided to our board of directors. The Class Actions seek, among other things, an injunction prohibiting consummation of the tender offer and the merger (each as defined below), attorneys’ fees and expenses and rescission or damages in the event the proposed transactions are consummated. We believe the Class Actions are entirely without merit and intend to defend against them vigorously.
| 7. | Recent Asset Sales and Assets Held for Sale |
On March 21, 2011, the Company sold one complete drilling rig (rig 6) in a private sale to Atlas Drilling, LLC, an unaffiliated third party, for net proceeds of $1,550. The Company recorded a $4 loss on the sale of the assets based on a net book value of $1,554.
On March 31, 2011, the Company sold one complete drilling rig (rig 62) in a private sale to Windsor Drilling, LLC, an unaffiliated third party, for net proceeds of $4,651. The Company recorded a $1,175 loss on the sale of the assets based on a net book value of $5,826.
On February 25, 2011, the Company entered into an agreement with Windsor Drilling, LLC, an unaffiliated third party, to sell an additional drilling rig (rig 56). Because the drilling rig meets the held for sale criteria, the Company is required to present such assets, comprised of property and equipment, at the lower of carrying amount or fair value less the anticipated costs to sell. The Company evaluated these assets for impairment as of March 31, 2011, which resulted in recognizing a $679 impairment charge. The net book value for rig 56 was $7,000 at March 31, 2011 and is included in Non-current assets held for sale and discontinued operations on the consolidated balance sheet.
The sale of drilling rigs and related equipment sold are part of a broader strategy by management to divest of older drilling rigs and use the proceeds to pay down existing indebtedness.
F-75
Table of Contents
Index to Financial Statements
BRONCO DRILLING COMPANY, INC.
NOTES TO UNAUDITED CONSOLIDATED FINANCIAL STATEMENTS AS OF MARCH 31, 2011—(Continued)
| 8. | Discontinued Operations |
Well Servicing
In the second quarter of 2010, management determined that our well servicing business segment was no longer consistent with the Company’s long-term strategic objectives and that the Company should seek to market this business for sale. During Q1 and Q2 2010 the market for workover services continued at depressed levels within the primary geographic market of our well servicing assets (Oklahoma). Management determined that higher return projects were available within the core drilling segment of the business and chose to deploy capital in this segment rather than commit the capital required to restructure operations in the well servicing segment. In 2010 management made a decision to market the assets constituting the well servicing segment for sale and redeploy the proceeds to reduce debt and to support the Company’s core drilling business. Well servicing operating results are included in discontinued operations in our Consolidated Statements of Operations.
The results of operations for the three months ended March 31, 2011 and 2010 are below:
| Three Months Ended March 31, | ||||||||
| 2011 | 2010 | |||||||
| Revenue |
$ | — | $ | — | ||||
| Impairment of intangibles |
$ | — | $ | 224 | ||||
| Loss from discontinued operations before income tax |
$ | 549 | $ | 1,973 | ||||
Trucking Assets
In July 2010, the Company completed the sale of all of the Company’s trucking assets, property and equipment, for $11,299 in cash, net of selling expenses of $403. As drilling activity decreased in 2008 and 2009 the utilization of these trucking assets fell sharply. The ongoing operating losses in our trucking division required resources to be directed away from the core drilling business. As such, management made the decision in the second quarter 2010 to sell these assets as their operations were not considered core. Proceeds from this sale were used to prepay existing indebtedness under our revolving credit facility with Banco Inbursa in July 2010. Operating results are included as a component of discontinued operations in our Consolidated Statements of Operations for all periods presented. The trucking assets and operating activities were previously presented as part of our land drilling reportable segment. The results of operations for the three months ended March 31, 2011 and 2010 are below:
| Three Months Ended March 31, | ||||||||
| 2011 | 2010 | |||||||
| Revenue |
$ | — | $ | 203 | ||||
| Income (loss) from discontinued operations before income tax |
$ | 398 | $ | (333 | ) | |||
F-76
Table of Contents
Index to Financial Statements
BRONCO DRILLING COMPANY, INC.
NOTES TO UNAUDITED CONSOLIDATED FINANCIAL STATEMENTS AS OF MARCH 31, 2011—(Continued)
| 9. | Net Income Per Common Share |
The following table presents a reconciliation of the numerators and denominators of the basic and diluted earnings per share (“EPS”) and diluted EPS comparisons as required by ASC Topic 260:
| Three Months Ended March 31, |
||||||||
| 2011 | 2010 | |||||||
| Basic: |
||||||||
| Continuing operations |
(7,339 | ) | (6,005 | ) | ||||
| Discontinued operations |
(94 | ) | (1,414 | ) | ||||
|
|
|
|
|
|||||
| Net loss |
$ | (7,433 | ) | $ | (7,419 | ) | ||
|
|
|
|
|
|||||
| Weighted average shares (thousands) |
27,468 | 26,651 | ||||||
|
|
|
|
|
|||||
| Continuing operations per share |
(0.27 | ) | (0.23 | ) | ||||
| Discontinued operations per share |
(0.00 | ) | (0.05 | ) | ||||
|
|
|
|
|
|||||
| Net loss per share |
$ | (0.27 | ) | $ | (0.28 | ) | ||
|
|
|
|
|
|||||
| Diluted: |
||||||||
| Continuing operations |
(7,339 | ) | (6,005 | ) | ||||
| Discontinued operations |
(94 | ) | (1,414 | ) | ||||
|
|
|
|
|
|||||
| Net Loss |
$ | (7,433 | ) | $ | (7,419 | ) | ||
|
|
|
|
|
|||||
| Weighted average shares: |
||||||||
| Outstanding (thousands) |
27,468 | 26,651 | ||||||
| Restricted Stock and Options (thousands) |
— | — | ||||||
|
|
|
|
|
|||||
| 27,468 | 26,651 | |||||||
|
|
|
|
|
|||||
| Continuing operations per share |
(0.27 | ) | (0.23 | ) | ||||
| Discontinued operations per share |
(0.00 | ) | (0.05 | ) | ||||
|
|
|
|
|
|||||
| Income (loss) per share |
$ | (0.27 | ) | $ | (0.28 | ) | ||
|
|
|
|
|
|||||
The weighted average number of diluted shares excludes 464,429 and 55,873 shares for the three months ended March 31, 2011 and 2010, respectively, subject to restricted stock awards due to their antidilutive effects.
| 10. | Fair Value Measurements |
As defined in ASC 820, fair value is defined as the price that would be received to sell an asset or paid to transfer a liability in an orderly transaction between market participants at the measurement date (referred to as an “exit price”). Authoritative guidance on fair value measurements and disclosures clarifies that a fair value measurement for a liability should reflect the entity’s non-performance risk. In addition, a fair value hierarchy is established that prioritizes the inputs to valuation techniques used to measure fair value. The hierarchy gives the highest priority to unadjusted quoted market prices in active markets for identical assets and liabilities (Level 1 measurements) and the lowest priority to unobservable inputs (Level 3 measurements). The three levels of the fair value hierarchy are:
Level 1: Unadjusted quoted prices in active markets that are accessible at the measurement date for identical, unrestricted assets or liabilities.
F-77
Table of Contents
Index to Financial Statements
BRONCO DRILLING COMPANY, INC.
NOTES TO UNAUDITED CONSOLIDATED FINANCIAL STATEMENTS AS OF MARCH 31, 2011—(Continued)
Level 2: Quoted prices in markets that are not active, or inputs which are observable, either directly or indirectly, for substantially the full term of the asset or liability. This category includes quoted prices for similar assets or liabilities in active markets; quoted prices for identical or similar assets or liabilities in markets that are not active; inputs other than quoted prices that are observable for the asset or liability; and inputs that are derived principally from or corroborated by observable market data by correlation or other means.
Level 3: Measured based on prices or valuation models that require inputs that are both significant to the fair value measurement and less observable from objective sources.
Fair Value on Recurring Basis
The Company issued a Warrant in conjunction with its revolving credit facility with Banco Inbursa, which Banco Inbursa subsequently transferred to CICSA. In accordance with accounting standards, the Company revalued the Warrant as of March 31, 2011 and recorded the change in the fair value of the Warrant on the consolidated statement of operations. The fair value of the Warrant was determined using level 3 inputs. The Company used a pricing model based on a version of the Black Scholes model, which is adjusted to account for the dilution resulting from the additional shares issued for the Warrant. The valuation was determined by computing the value of the Warrant if exercised in Year 2 – 3 with the values weighted by the probability that the Warrant would actually be exercised in that year. Some of the assumptions used in the model were volatility of 39% and 49% and a risk free interest rate that ranged from 0.16% to 0.56%. The fair value of the Warrant was $14,690 at March 31, 2011. The Company recorded a change in the fair value of the Warrant on the consolidated statement of operations in the amount of $10,283 and $272 for the three months ended March 31, 2011 and 2010, respectively.
The fair values of our cash equivalents, trade receivables and trade payables approximated their carrying values due to the short-term nature of these instruments.
Fair Value on Non-Recurring Basis
In the first quarter of 2011, management entered into an agreement to sell one drilling rig (rig 56). Because the drilling rig meets the held for sale criteria, the Company is required to present these assets held for sale at the lower of carrying amount or fair value less anticipated cost to sell. The Company evaluated these assets as of March 31, 2011, for impairment. The fair value of the drilling rig was determined using the agreed upon sales price for the rig. The analysis as of March 31, 2011 resulted in a $679 impairment charge.
| 11. | Restricted Stock |
The Company’s board of directors and a majority of our stockholders approved our 2006 Stock Incentive Plan, which the Company refers to as the 2006 Plan, effective April 20, 2006. Effective December 10, 2010, the Company’s board of directors and a majority of our shareholders approved an amendment to the 2006 Plan to increase the shares available for issuance thereunder by 2,500,000 shares. The purpose of the 2006 Plan is to provide a means by which eligible recipients of awards may be given an opportunity to benefit from increases in value of our common stock through the granting of one or more of the following awards: (1) incentive stock options, (2) nonstatutory stock options, (3) restricted awards, (4) performance awards and (5) stock appreciation rights.
The purpose of the plan is to enable the Company, and any of its affiliates, to attract and retain the services of the types of employees, consultants and directors who will contribute to our long range success and to provide incentives that are linked directly to increases in share value that will inure to the benefit of our stockholders.
F-78
Table of Contents
Index to Financial Statements
BRONCO DRILLING COMPANY, INC.
NOTES TO UNAUDITED CONSOLIDATED FINANCIAL STATEMENTS AS OF MARCH 31, 2011—(Continued)
Eligible award recipients are employees, consultants and directors of the Company and its affiliates. Incentive stock options may be granted only to our employees. Awards other than incentive stock options may be granted to employees, consultants and directors. The shares that may be issued pursuant to awards consist of our authorized but unissued common stock, and the maximum aggregate amount of such common stock that may be issued upon exercise of all awards under the plan, including incentive stock options, may not exceed 2,500,000 shares, subject to adjustment to reflect certain corporate transactions or changes in our capital structure.
Under all restricted stock awards to date, nonvested shares are subject to forfeiture for failure to fulfill service conditions. Restricted stock awards consist of our common stock that vest over a two or three year period. Total shares available for future stock option grants and restricted stock grants to employees and directors under existing plans were 2,208,272 as of March 31, 2011. Restricted stock awards are valued at the grant date market value of the underlying common stock and are being amortized to operations over the respective vesting period. Compensation expense for the three months ended March 31, 2011 and 2010 was $779 and $395, respectively. Restricted stock activity for the three months ended March 31, 2011 was as follows:
| Shares | Weighted Average Grant Date Fair Value |
|||||||
| Outstanding at December 31, 2010 |
1,222,496 | $ | 4.82 | |||||
| Granted |
510,740 | 6.97 | ||||||
| Vested |
(531,167 | ) | 4.96 | |||||
| Forfeited/expired |
— | — | ||||||
|
|
|
|
|
|||||
| Outstanding at March 31, 2011 |
1,202,069 | $ | 5.70 | |||||
|
|
|
|
|
|||||
There was $6,642 of total unrecognized compensation cost related to nonvested restricted stock awards to be recognized over a weighted-average period of 1.5 years as of March 31, 2011.
| 12. | Subsequent Event |
On April 14, 2011, we entered into an Agreement and Plan of Merger with Chesapeake Energy Corporation and Nomac Acquisition, Inc., an indirect wholly owned subsidiary of Chesapeake (“Purchaser”), as previously disclosed on a Form 8-K we filed with the SEC on April 18, 2011. Under the terms of the merger agreement, Chesapeake has agreed to acquire the Company through a two-step transaction, consisting of a tender offer by the Purchaser for all of our outstanding common stock at a price of $11.00 per share without interest thereon and less any applicable withholding or stock transfer taxes, followed by the merger of the Purchaser with and into the Company, with the Company surviving as an indirect, wholly owned subsidiary of Chesapeake. If, after completion of the tender offer, stockholder adoption of the merger agreement is required under Delaware law, we have agreed to hold a meeting of our stockholders for the purpose of adopting the merger agreement. In the Merger, each outstanding share of our common stock, other than shares of our common stock owned by the Company, Chesapeake or Purchaser or their respective wholly owned subsidiaries, or by stockholders who have validly exercised their appraisal rights under Delaware law, will be converted into the right to receive cash in an amount equal to the $11.00 per share offer price, without interest thereon and less any applicable withholding or stock transfer taxes.
Purchaser commenced the tender offer on April 26, 2011. Consummation of the tender offer and the merger is subject to the satisfaction or waiver of a number of customary closing conditions set forth in the merger agreement. We currently expect that the tender offer and merger will be completed during the second quarter of 2011, however, no assurance can be given as to when, or if, the merger will occur.
F-79
Table of Contents
Index to Financial Statements
COS HOLDINGS, L.L.C.
UNAUDITED PRO FORMA FINANCIAL STATEMENTS
Introduction
The unaudited pro forma financial statements of COS Holdings, L.L.C. (“COS LLC”) as of December 31, 2011 and for the year ended December 31, 2011 have been derived from the consolidated historical financial statements of COS LLC and Bronco Drilling Company, Inc. (“Bronco”) and are qualified in their entirety by reference to such historical financial statements and related notes contained therein. The unaudited pro forma financial statements should be read in conjunction with (a) the accompanying notes, (b) the audited consolidated historical financial statements of COS LLC as of December 31, 2011 and 2010 and for the three years ended December 31, 2011, and (c) the audited consolidated financial statements of Bronco as of December 31, 2010 and 2009 and for the three years ended December 31, 2010 and unaudited interim financial statements of Bronco as of March 31, 2011 and for the three months ended March 31, 2011 and 2010, all included elsewhere in this prospectus.
The unaudited pro forma consolidated balance sheet of COS LLC was derived from the audited December 31, 2011 balance sheet of COS LLC and includes pro forma adjustments to give effect to the formation transactions described under “Organizational Structure” and the use of the estimated net proceeds from this offering as described under “Use of Proceeds” (the “Formation and Offering Transactions”) as if those transactions had taken place on December 31, 2011.
The unaudited pro forma combined statement of operations of COS LLC was derived from the statement of operations of COS LLC for the year ended December 31, 2011 and includes pro forma adjustments to give effect to (a) the acquisition of Bronco in June 2011 (the “Bronco Transaction”), (b) the transfer of land and buildings to Chesapeake in October 2011 (the “Property Transfer Transactions”), (c) the issuance by Chesapeake Oilfield Operating, L.L.C. (“COO”), our wholly owned subsidiary, of $650.0 million of 6.625% Senior Notes due 2019 in October 2011 and the use of the net proceeds therefrom to repay a portion of an intercompany promissory note owed to a wholly owned subsidiary of Chesapeake Energy Corporation (“Chesapeake”) (the “Notes Offering Transactions”), (d) COO’s entry into, and borrowings under, our $500.0 million revolving bank credit facility in November 2011 (the “Revolving Credit Facility Transactions”), and (e) the Formation and Offering Transactions as if those transactions had taken place on January 1, 2011.
The adjustments are based on currently available information and certain estimates and assumptions; therefore, actual results will differ from the pro forma adjustments. However, management believes that the assumptions provide a reasonable basis for presenting the significant effects of the transactions as contemplated and that the pro forma adjustments give appropriate effect to those assumptions and are properly applied in the unaudited pro forma financial statements.
The unaudited pro forma financial statements are not necessarily indicative of the results that actually would have occurred if the transactions had taken place on the dates indicated, nor are they indicative of future results.
F-80
Table of Contents
Index to Financial Statements
UNAUDITED PRO FORMA CONSOLIDATED BALANCE SHEET
As of December 31, 2011
| Historical COS Holdings, L.L.C. |
Adjustments for Formation and the Offering |
Pro Forma Consolidated |
||||||||||
| (In thousands) | ||||||||||||
| ASSETS |
||||||||||||
| Current Assets: |
||||||||||||
| Cash |
$ | 2,360 | $ | (a | ) | $ | ||||||
| Accounts receivable |
31,070 | — | 31,070 | |||||||||
| Affiliate accounts receivable |
172,456 | — | 172,456 | |||||||||
| Inventory |
26,693 | — | 26,693 | |||||||||
| Deferred income tax asset |
3,576 | — | 3,576 | |||||||||
| Prepaid expenses and other |
16,891 | — | 16,891 | |||||||||
| Assets held for sale |
1,360 | — | 1,360 | |||||||||
|
|
|
|
|
|
|
|||||||
| Total Current Assets |
254,406 | — | ||||||||||
|
|
|
|
|
|
|
|||||||
| Property and equipment, at cost |
1,587,870 | — | 1,587,870 | |||||||||
| Less: accumulated depreciation |
(362,290 | ) | — | (362,290 | ) | |||||||
|
|
|
|
|
|
|
|||||||
| Total Property and Equipment, Net |
1,225,580 | — | 1,225,580 | |||||||||
|
|
|
|
|
|
|
|||||||
| Goodwill |
42,370 | — | 42,370 | |||||||||
| Intangible assets, net |
15,336 | — | 15,336 | |||||||||
| Investments |
16,657 | — | 16,657 | |||||||||
| Deferred financing costs |
19,644 | — | 19,644 | |||||||||
| Other long-term assets |
24,589 | — | 24,589 | |||||||||
|
|
|
|
|
|
|
|||||||
| Total Long-Term Assets |
118,596 | — | 118,596 | |||||||||
|
|
|
|
|
|
|
|||||||
| Total Assets |
$ | 1,598,582 | $ | — | $ | |||||||
|
|
|
|
|
|
|
|||||||
| LIABILITIES AND EQUITY |
||||||||||||
| Current Liabilities: |
||||||||||||
| Accounts payable |
$ | 63,681 | $ | — | $ | 63,681 | ||||||
| Affiliate accounts payable |
38,053 | — | 38,053 | |||||||||
| Accrued liabilities |
143,180 | — | 143,180 | |||||||||
| Notes payable |
— | — | — | |||||||||
|
|
|
|
|
|
|
|||||||
| Total Current Liabilities |
244,914 | — | 244,914 | |||||||||
|
|
|
|
|
|
|
|||||||
| Long-Term Liabilities: |
||||||||||||
| Deferred income tax liabilities |
95,976 | — | 95,976 | |||||||||
| Senior notes |
650,000 | — | 650,000 | |||||||||
| Revolving credit facility |
29,000 | (a | ) | |||||||||
| Affiliate debt |
371,674 | (a | ) | |||||||||
| Other liabilities |
25,236 | — | 25,236 | |||||||||
|
|
|
|
|
|
|
|||||||
| Total Long-Term Liabilities |
1,171,886 | — | ||||||||||
|
|
|
|
|
|
|
|||||||
| Equity: |
||||||||||||
| Owner’s Equity |
181,782 | (a | ) | |||||||||
| Noncontrolling interest |
— | (a | ) | |||||||||
|
|
|
|
|
|
|
|||||||
| Total Equity |
181,782 | (a | ) | |||||||||
|
|
|
|
|
|
|
|||||||
| Total Liabilities and Equity |
$ | 1,598,582 | $ | (a | ) | $ | ||||||
|
|
|
|
|
|
|
|||||||
The accompanying notes are an integral part of these unaudited pro forma financial statements.
F-81
Table of Contents
Index to Financial Statements
UNAUDITED PRO FORMA COMBINED STATEMENT OF OPERATIONS
| Year Ended December 31, 2011 | ||||||||||||||||||||||||
| Historical COS Holdings, L.L.C. |
Historical Bronco Drilling Company, Inc. |
Pro Forma Adjustments |
COS Holdings, L.L.C. as Adjusted |
Adjustments for Formation and the Offering(a) |
Pro Forma Combined |
|||||||||||||||||||
| (In Thousands) | ||||||||||||||||||||||||
| Revenues |
$ | 1,303,496 | $ | 62,570 | $ | — | $ | 1,366,066 | $ | — | $ | 1,366,066 | ||||||||||||
| Operating Expenses: |
||||||||||||||||||||||||
| Operating costs |
987,032 | 42,925 | 6,442 | (b) | 1,036,399 | — | 1,036,399 | |||||||||||||||||
| Depreciation and amortization |
171,908 | 9,349 | (2,082 | )(c) | 180,236 | — | 180,236 | |||||||||||||||||
| 1,061 | (d) | |||||||||||||||||||||||
| General and administrative |
37,074 | 28,131 | (19,303 | )(e) | 45,902 | — | 45,902 | |||||||||||||||||
| (Gain) losses on sales of property and equipment |
(3,571 | ) | 25 | — | (3,546 | ) | — | (3,546 | ) | |||||||||||||||
| Impairments |
2,729 | 679 | — | 3,408 | — | 3,408 | ||||||||||||||||||
|
|
|
|
|
|
|
|
|
|
|
|
|
|||||||||||||
| Total Operating Expenses |
1,195,172 | 81,109 | (13,882 | ) | 1,262,399 | — | 1,262,399 | |||||||||||||||||
|
|
|
|
|
|
|
|
|
|
|
|
|
|||||||||||||
| Operating Income (Loss) |
108,324 | (18,539 | ) | 13,882 | 103,667 | — | 103,667 | |||||||||||||||||
|
|
|
|
|
|
|
|
|
|
|
|
|
|||||||||||||
| Other Income (Expense): |
||||||||||||||||||||||||
| Interest expense |
(65,072 | ) | (792 | ) | (38,322 | )(f) | (108,717 | ) | (g | ) | ||||||||||||||
| 4,428 | (h) | |||||||||||||||||||||||
| (8,959 | )(i) | |||||||||||||||||||||||
| Loss on partial sale of investment in MX |
— | — | — | — | — | — | ||||||||||||||||||
| Losses from equity investees |
— | — | — | — | — | — | ||||||||||||||||||
| Interest income |
— | — | — | — | — | — | ||||||||||||||||||
| Loss from early extinguishment of debt |
— | (4,969 | ) | 4,969 | (e) | — | — | — | ||||||||||||||||
| Change in fair value of warrant |
— | (17,356 | ) | 17,356 | (e) | — | — | — | ||||||||||||||||
| Other income (expense) |
(2,464 | ) | 485 | — | (1,979 | ) | — | (1,979 | ) | |||||||||||||||
|
|
|
|
|
|
|
|
|
|
|
|
|
|||||||||||||
| Total Other Income (Expense) |
(67,536 | ) | (22,632 | ) | (20,528 | ) | (110,696 | ) | ||||||||||||||||
|
|
|
|
|
|
|
|
|
|
|
|
|
|||||||||||||
| Income (Loss) Before Income Taxes |
40,788 | (41,171 | ) | (6,646 | ) | (7,029 | ) | |||||||||||||||||
| Income Tax Expense (Benefit) |
21,030 | (15,557 | ) | (2,525 | )(j) | 2,948 | (j | ) | ||||||||||||||||
|
|
|
|
|
|
|
|
|
|
|
|
|
|||||||||||||
| Net Income (Loss) |
19,758 | (25,614 | ) | (4,121 | ) | (9,977 | ) | |||||||||||||||||
|
|
|
|
|
|
|
|
|
|
|
|
|
|||||||||||||
| Less: Net (Loss) Attributable to Noncontrolling Interest |
(154 | ) | — | — | (154 | ) | (k | ) | ||||||||||||||||
|
|
|
|
|
|
|
|
|
|
|
|
|
|||||||||||||
| Net Income (Loss) Attributable to COS Holdings, L.L.C. |
$ | 19,912 | $ | (25,614 | ) | $ | (4,121 | ) | $ | (9,823 | ) | $ | $ | |||||||||||
|
|
|
|
|
|
|
|
|
|
|
|
|
|||||||||||||
| Pro Forma Earnings Per Common Share—Basic |
|
$ | ||||||||||||||||||||||
|
|
|
|||||||||||||||||||||||
| Pro Forma Earnings Per Common Share—Diluted |
|
$ | ||||||||||||||||||||||
|
|
|
|||||||||||||||||||||||
| Pro Forma Weighted Average Shares Outstanding—Basic |
|
$ | ||||||||||||||||||||||
|
|
|
|||||||||||||||||||||||
| Pro Forma Weighted Average Shares Outstanding—Diluted |
|
$ | ||||||||||||||||||||||
|
|
|
|||||||||||||||||||||||
The accompanying notes are an integral part of these unaudited pro forma financial statements.
F-82
Table of Contents
Index to Financial Statements
NOTES TO UNAUDITED PRO-FORMA FINANCIAL STATEMENTS
| 1. | Basis of Presentation, Transactions and the Stock Offering |
The historical financial information is derived from the consolidated historical financial statements of COS LLC and Bronco. The pro forma adjustments have been prepared (a), in the case of the pro forma consolidated balance sheet, as if the Formation and Offering Transactions had taken place on December 31, 2011 and (b), in the case of the pro forma combined statements of operations for the year ended December 31, 2011, as if the Bronco Transaction, the Property Transfer Transactions, the Notes Offering Transactions, the Revolving Credit Facility Transactions and the Formation and Offering Transactions had taken place on January 1, 2011.
| 2. | Pro Forma Adjustments and Assumptions |
The adjustments are based on currently available information and certain estimates and assumptions and therefore the actual effects of these transactions will differ from the pro forma adjustments. A general description of these transactions and adjustments is provided as follows:
| a) | Reflects (1) our receipt of net proceeds of $ million from the issuance and sale of shares of our Class A common stock in this offering at a price of $ per share, after deducting the underwriting discount and estimated offering expenses, and the use of such net proceeds to acquire limited liability company interests from COS LLC and (2) COS LLC’s use of such net proceeds as follows: approximately $ million to make a capital contribution to COO, which will use such cash to repay all outstanding borrowings under its revolving bank credit facility and for general corporate purposes; approximately $ million to repay the balance outstanding under an intercompany promissory note with Chesapeake; and approximately $ million to make a distribution to Chesapeake. |
| b) | Reflects additional rental expense associated with our use of certain land and buildings transferred to Chesapeake in the Property Transfer Transactions, in connection with which, on October 1, 2011, we transferred $94.0 million of land and buildings and $8.2 million of accumulated depreciation recorded on COS LLC’s historical consolidated balance sheets to an affiliate of Chesapeake. |
| c) | Reflects the elimination of historical depreciation expense associated with the land and buildings transferred to Chesapeake in the Property Transfer Transactions. |
| d) | Reflects adjustment to the historical depreciation expense recorded by Bronco resulting from the allocation of the purchase price paid by COS LLC for the Bronco assets acquired in the Bronco Transaction. Amortization is computed on a straight line basis over three to 15 years for drilling equipment, other property and equipment and intangible assets. |
| e) | Reflects elimination of nonrecurring charges recorded by Bronco in the Bronco Transaction resulting from the acquisition by COS LLC, including accelerated vesting of restricted stock, change of control payments, professional fees, debt extinguishment costs and changes in the fair value of warrants. |
| f) | Reflects additional interest expense and amortization of deferred financing costs associated with the Notes Offering Transaction and Revolving Credit Facility Transactions. |
| g) | Reflects the elimination of historical interest expense associated with the repayment of outstanding borrowings under our revolving bank credit facility and the outstanding balance under the intercompany promissory note with a portion of the net proceeds from this offering. |
| h) | Reflects adjustment to the historical interest expense recorded by COS LLC associated with the reduction of affiliate debt due to the Property Transfer Transactions. |
F-83
Table of Contents
Index to Financial Statements
COS HOLDINGS, L.L.C.
NOTES TO UNAUDITED PRO-FORMA FINANCIAL STATEMENTS—(Continued)
| i) | Reflects additional interest expense due to affiliate debt incurred as a result of the Bronco Transaction. |
| j) | Reflects tax effects of pro forma and formation and offering adjustments. |
| k) | Reflects COS Inc. being appointed as the sole managing member of COS LLC in connection with the closing of this offering. Accordingly, although COS Inc. will have a minority economic interest in COS LLC, COS Inc. will control the management of COS LLC. As a result, following this offering, COS Inc. will consolidate COS LLC and record a non-controlling interest for Chesapeake’s economic interest in COS LLC. |
F-84
Table of Contents
Index to Financial Statements
Shares
Chesapeake Oilfield Services, Inc.
Class A Common Stock
PROSPECTUS
Goldman, Sachs & Co.
BofA Merrill Lynch
Through and including , 2012 (the 25th day after the date of this prospectus), all dealers effecting transactions in these securities, whether or not participating in this offering, may be required to deliver a prospectus. This is in addition to a dealer’s obligation to deliver a prospectus when acting as an underwriter and with respect to an unsold allotment or subscription.
Table of Contents
Index to Financial Statements
Part II
INFORMATION NOT REQUIRED IN PROSPECTUS
ITEM 13. Other Expenses of Issuance and Distribution
The following table sets forth an itemized statement of the amounts of all expenses (excluding underwriting discounts) payable by us in connection with the registration of the Class A common stock offered hereby. With the exception of the SEC registration fee, FINRA filing fee and NYSE listing fee, the amounts set forth below are estimates.
| SEC registration fee |
$ | 98,843 | ||
| FINRA filing fee |
75,500 | |||
| NYSE listing fee |
* | |||
| Accounting fees and expenses |
* | |||
| Legal fees and expenses |
* | |||
| Printing and engraving expenses |
* | |||
| Transfer agent and registrar fees |
* | |||
| Miscellaneous |
* | |||
|
|
|
|||
| Total |
$ | * | ||
|
|
|
* To be filed by amendment
| ITEM 14. Indemnification | of Directors and Officers |
Section 1031 of the Oklahoma General Corporation Act, under which Chesapeake Oilfield Services, Inc. (“COS Inc.”) is incorporated, permits, and in some circumstances requires, us to indemnify our directors and officers. The Amended and Restated Certificate of Incorporation (“Certificate of Incorporation”) and the Amended and Restated Bylaws (“Bylaws”) of COS Inc. will provide for indemnification of directors and officers under certain circumstances. As permitted by the Oklahoma General Corporation Act and COS Inc.’s Certificate of Incorporation and Bylaws, we will also maintain insurance on behalf of our directors and officers against liability arising out of their status as such. The foregoing indemnity provisions, together with director and officer insurance and COS Inc.’s indemnification obligations under individual indemnity agreements with its directors and officers, may be sufficiently broad to indemnify such persons for liabilities under the Securities Act of 1933, as amended (the “Securities Act”).
COS Inc.’s Certificate of Incorporation and Bylaws will provide for indemnification of each of COS Inc.’s officers and directors against expenses, including attorneys’ fees, judgments, fines and amounts paid in settlement actually and reasonably incurred by them in connection with any action, suit or proceeding brought by reason of such person being or having been a director, officer, employee or agent of COS Inc., or of any other corporation, partnership, joint venture, trust or other enterprise at the request of COS Inc., other than an action by or in the right of COS Inc. To be entitled to such indemnification, the individual must have acted in good faith and in a manner he reasonably believed to be in or not opposed to the best interests of COS Inc., and with respect to any criminal action, the person seeking indemnification had no reasonable cause to believe that the conduct was unlawful. COS Inc.’s Certificate of Incorporation and Bylaws will also provide for indemnification of each of COS Inc.’s officers and directors against expenses, including attorneys’ fees, actually and reasonably incurred in connection with the defense or settlement of any action or suit by or in the right of COS Inc. brought by reason of the person seeking indemnification being or having been a director, officer, employee or agent of COS Inc., or any other corporation, partnership, joint venture, trust or other
II-1
Table of Contents
Index to Financial Statements
enterprise at the request of COS Inc. To be entitled to such indemnification, the individual must have acted in good faith and in a manner he reasonably believed to be in or not opposed to the best interests of COS Inc., except that no indemnification shall be made in respect of any claim, issue or matter as to which the individual shall have been adjudged to be liable to COS Inc., unless and only to the extent that the court in which such action was decided has determined that the person is fairly and reasonably entitled to indemnity for such expenses which the court deems proper.
COS Inc. will enter into indemnity agreements with each of its directors and executive officers. Under each proposed indemnity agreement, COS Inc. will pay on behalf of the indemnitee, subject to certain exceptions, any amount which he is or becomes legally obligated to pay because of (a) any claim or claims from time to time threatened or made against him by any person because of any act or omission or neglect or breach of duty, including any actual or alleged error or misstatement or misleading statement, which he commits or suffers while acting in his capacity as a director and/or officer of COS Inc. or an affiliate or (b) being a party, or being threatened to be made a party, to any threatened, pending or contemplated action, suit or proceeding, whether civil, criminal, administrative or investigative, by reason of the fact that he is or was an officer, director, employee or agent of COS Inc. or an affiliate or is or was serving at the request of COS Inc. as a director, officer, employee or agent of another corporation, partnership, joint venture, trust or other enterprise. The payments which COS Inc. would be obligated to make under an indemnification agreement could include damages, charges, judgments, fines, penalties, settlements and costs, cost of investigation and cost of defense of legal, equitable or criminal actions, claims or proceedings and appeals therefrom, and costs of attachment, supersedeas, bail, surety or other bonds.
Further, COS Inc. may maintain insurance on behalf of its officers, and directors against expense, liability or loss asserted incurred by them in their capacities as officers and directors, and on behalf of some of its employees for certain liabilities.
ITEM 15. Recent Sales of Unregistered Securities
On October 28, 2011, Chesapeake Oilfield Operating, L.L.C. and Chesapeake Oilfield Finance Inc. (together, the “Issuers”) completed a private offering of $650.0 million in principal amount of 6.625% Senior Notes due 2019. The initial purchasers of the senior notes in such offering were Merrill Lynch, Pierce, Fenner & Smith Incorporated, Citigroup Global Markets Inc., Credit Agricole Securities (USA) Inc., Credit Suisse Securities (USA) LLC, Goldman, Sachs & Co., Barclays Capital Inc., Capital One Southcoast, Inc., Deutsche Bank Securities Inc., Morgan Stanley & Co. LLC, RBC Capital Markets, LLC, SunTrust Robinson Humphrey, Inc., UBS Securities LLC, Wells Fargo Securities, LLC and Comerica Securities, Inc. Pursuant to a Purchase Agreement among the Issuers, the subsidiary guarantors party thereto and the initial purchasers, the Issuers sold the senior notes to the initial purchasers for $636.5 million (reflecting a discount of 2.0%), and the initial purchasers resold the senior notes at par to qualified institutional buyers under Rule 144A under the Securities Act and to certain non-U.S. persons in offshore transactions in reliance on Regulation S under the Securities Act. The foregoing issuance of securities was exempt from the registration requirements pursuant to Section 4(2) of the Securities Act and Regulation D thereunder.
Concurrently with the closing of the offering of shares of Class A common stock of COS Inc. pursuant to this Registration Statement, of the currently outstanding membership units of COS Holdings, L.L.C. held by Chesapeake Energy Corporation (“Chesapeake”) will be reclassified as “Class B Units,” which will be exchangeable for shares of COS Inc.’s Class A common stock, par value $0.001 on a one-for-one basis (the “Exchange Class A Shares”). Additionally, COS Inc. will issue Chesapeake a number of shares of COS Inc.’s Class B common stock, par value $0.001 per share (the “Class B Shares”), equal to the number of Class B Units it will hold immediately after this reclassification in exchange for the payment by Chesapeake to COS Inc. of an amount equal to the
II-2
Table of Contents
Index to Financial Statements
aggregate par value of such shares. The issuance of these Class B Shares will be exempt from registration under the Securities Act in reliance on Section 4(2) of the Securities Act and Regulation D thereunder as transactions by an issuer not involving any public offering. Chesapeake will represent that it is acquiring the Class B Shares for investment only and not with a view toward the public sale or distribution thereof. Chesapeake will receive written disclosure that the Class B Shares will not be registered under the Securities Act and that any resale must be made pursuant to a registration statement or an available exemption from the registration requirements under the Securities Act. The sale of these Class B Shares will be made without any general solicitation or advertising.
ITEM 16. Exhibits and Financial Statement Schedules
(a) Exhibits
The Index to Exhibits, which follows the signature page to this registration statement on Form S-1 and is incorporated herein by reference, sets forth a list of those exhibits filed herewith.
ITEM 17. Undertakings
The undersigned registrant hereby undertakes to provide to the underwriters at the closing specified in the underwriting agreement certificates in such denominations and registered in such names as required by the underwriters to permit prompt delivery to each purchaser.
Insofar as indemnification for liabilities arising under the Securities Act may be permitted to directors, officers and controlling persons of the registrant pursuant to the foregoing provisions, or otherwise, the registrant has been advised that in the opinion of the Securities and Exchange Commission such indemnification is against public policy as expressed in the Securities Act and is, therefore, unenforceable. In the event that a claim for indemnification against such liabilities (other than the payment by the registrant of expenses incurred or paid by a director, officer or controlling person of the registrant in the successful defense of any action, suit or proceeding) is asserted by such director, officer or controlling person in connection with the securities being registered, the registrant will, unless in the opinion of its counsel the matter has been settled by controlling precedent, submit to a court of appropriate jurisdiction the question whether such indemnification by it is against public policy as expressed in the Securities Act and will be governed by the final adjudication of such issue.
The undersigned registrant hereby undertakes that:
(1) For purposes of determining any liability under the Securities Act, the information omitted from the form of prospectus filed as part of this registration statement in reliance upon Rule 430A and contained in a form of prospectus filed by the registrant pursuant to Rule 424(b)(1) or (4) or 497(h) under the Securities Act shall be deemed to be part of this registration statement as of the time it was declared effective.
(2) For the purpose of determining any liability under the Securities Act, each post-effective amendment that contains a form of prospectus shall be deemed to be a new registration statement relating to the securities offered therein, and the offering of such securities at that time shall be deemed to be the initial bona fide offering thereof.
II-3
Table of Contents
Index to Financial Statements
SIGNATURES
Pursuant to the requirements of the Securities Act of 1933, the registrant has duly caused this registration statement on Form S-1 to be signed on its behalf by the undersigned, thereunto duly authorized in the City of Oklahoma City, State of Oklahoma, on April 16, 2012.
| CHESAPEAKE OILFIELD SERVICES, INC. | ||
| By: | /s/ JERRY L. WINCHESTER | |
| Name: | Jerry L. Winchester | |
| Title: | Chief Executive Officer | |
POWER OF ATTORNEY
KNOW ALL PERSONS BY THESE PRESENTS, that each person whose signature appears below constitutes and appoints Jerry L. Winchester and Cary D. Baetz, and each of them severally, his true and lawful attorney or attorneys-in-fact and agents, with full power to act with or without the others and with full power of substitution and resubstitution, to execute in his name, place and stead, in any and all capacities, any or all amendments (including pre-effective and post-effective amendments) to this registration statement and any registration statement for the same offering filed pursuant to Rule 462 under the Securities Act of 1933, and to file the same, with all exhibits thereto, and other documents in connection therewith, with the Securities and Exchange Commission, granting unto said attorneys-in-fact and agents and each of them, full power and authority to do and perform in the name of on behalf of the undersigned, in any and all capacities, each and every act and thing necessary or desirable to be done in and about the premises, to all intents and purposes and as fully as they might or could do in person, hereby ratifying, approving and confirming all that said attorneys-in-fact and agents or their substitutes may lawfully do or cause to be done by virtue hereof.
Pursuant to the requirements of the Securities Act of 1933, this registration statement on Form S-1 has been signed by the following persons in the capacities indicated on April 16, 2012. This document may be executed by the signatories hereto on any number of counterparts, all of which constitute one and the same instrument.
| Signature |
Title | |
| /s/ JERRY L. WINCHESTER Jerry L. Winchester |
Director and Chief Executive Officer (principal executive officer) | |
| /s/ CARY D. BAETZ Cary D. Baetz |
Chief Financial Officer (principal financial officer and principal accounting officer) | |
| /s/ AUBREY K. MCCLENDON Aubrey K. McClendon |
Director | |
| /s/ STEVEN C. DIXON Steven C. Dixon |
Director | |
| /s/ DOMENIC J. DELL’OSSO, JR. Domenic J. Dell’Osso, Jr. |
Director | |
II-4
Table of Contents
Index to Financial Statements
INDEX TO EXHIBITS
| Exhibit Number |
Description | |
| 1.1* | Form of Underwriting Agreement | |
| 3.1* | Form of Amended and Restated Certificate of Incorporation of Chesapeake Oilfield Services, Inc. | |
| 3.2* | Form of Amended and Restated Bylaws of Chesapeake Oilfield Services, Inc. | |
| 4.1* | Form of Registration Rights Agreement | |
| 5.1* | Opinion of Bracewell & Giuliani LLP as to the legality of the securities being registered | |
| 10.1* | Form of Amended and Restated Operating Agreement of COS Holdings, L.L.C. | |
| 10.2* | Master Services Agreement, dated as of October 25, 2011, between COS Holdings, L.L.C. and Chesapeake Operating, Inc. | |
| 10.3* | Services Agreement, dated as of October 25, 2011, between COS Holdings, L.L.C. and Chesapeake Operating, Inc. | |
| 10.4* | Administrative Services Agreement, dated as of October 25, 2011, between COS Holdings, L.L.C. and Chesapeake Operating, Inc. | |
| 10.5* | Master Lease Agreement, dated as of January 1, 2012, between Chesapeake Land Development Company L.L.C. and Chesapeake Oilfield Operating, L.L.C. | |
| 10.6* | Form of Tax Receivable Agreement | |
| 10.7* | Indenture, dated as of October 28, 2011, among Chesapeake Oilfield Operating, L.L.C., Chesapeake Oilfield Finance, Inc., the guarantors named therein and The Bank of New York Mellon Trust Company, N.A., as trustee | |
| 10.8* | Registration Rights Agreement, dated as of October 28, 2011, among Chesapeake Oilfield Operating, L.L.C., Chesapeake Oilfield Finance, Inc., the guarantors named therein and Merrill Lynch, Pierce, Fenner & Smith Incorporated, as the representative of the initial purchasers | |
| 10.9* | Credit Agreement, dated as of November 3, 2011, among Chesapeake Oilfield Operating, L.L.C, the lenders party thereto and Bank of America, N.A., as administrative agent and collateral agent | |
| 10.10* | Form of Director Indemnification Agreements | |
| 10.11* | Employment Agreement dated as of September 15, 2011 between Jerry L. Winchester and Chesapeake Energy Corporation | |
| 10.12* | Employment Agreement dated as of January 9, 2012 between Cary D. Baetz and COS Holdings, L.L.C. | |
| 21.1* | List of Subsidiaries of Chesapeake Oilfield Services, Inc. | |
| 23.1 | Consent of PricewaterhouseCoopers LLP | |
| 23.2 | Consent of Grant Thornton LLP | |
| 23.3* | Consent of Bracewell & Giuliani LLP (included as part of Exhibit 5.1 hereto) | |
| 24.1 | Power of Attorney (included on the signature page of the initial filing of the registration statement) | |
* To be filed by amendment.
II-5