Attached files
| file | filename |
|---|---|
| EXCEL - IDEA: XBRL DOCUMENT - Teavana Holdings Inc | Financial_Report.xls |
| EX-31.1 - EX-31.1 - Teavana Holdings Inc | d281358dex311.htm |
| EX-23.1 - EX-23.1 - Teavana Holdings Inc | d281358dex231.htm |
| EX-31.2 - EX-31.2 - Teavana Holdings Inc | d281358dex312.htm |
| EX-32.2 - EX-32.2 - Teavana Holdings Inc | d281358dex322.htm |
| EX-21.1 - EX-21.1 - Teavana Holdings Inc | d281358dex211.htm |
| EX-32.1 - EX-32.1 - Teavana Holdings Inc | d281358dex321.htm |
Table of Contents
UNITED STATES
SECURITIES AND EXCHANGE COMMISSION
Washington, D.C. 20549
FORM 10-K
(Mark One)
| x | ANNUAL REPORT PURSUANT TO SECTION 13 OR 15(D) OF THE SECURITIES EXCHANGE ACT OF 1934 |
For the fiscal year ended January 29, 2012
| ¨ | TRANSITION REPORT PURSUANT TO SECTION 13 OR 15(D) OF THE SECURITIES EXCHANGE ACT OF 1934 |
for the transition period from to
Commission File Number 001-35248
Teavana Holdings, Inc.
(Exact name of registrant as specified in its charter)
| Delaware | 20-1946316 | |
| (State or other jurisdiction of Incorporation or Organization) |
(I.R.S. Employer Identification No.) | |
| 3630 Peachtree Rd. NE, Suite 1480 Atlanta, Georgia |
30326 | |
| (Address of principal executive offices) | (Zip Code) | |
Registrant’s telephone number, including area code:
(404) 995-8200
Securities registered pursuant to Section 12(b) of the Act:
| Common Stock, par value $0.00003 per share | New York Stock Exchange | |
| (Title of class) | (Name of each exchange where registered) |
Securities registered pursuant to Section 12(g) of the Act:
None
Indicate by check mark if the registrant is a well-known seasoned issuer, as defined in Rule 405 of the Securities Act. Yes ¨ No x
Indicate by check mark if the registrant is not required to file reports pursuant to Section 13 or Section 15(d) of the Act. Yes ¨ No x
Indicate by check mark whether registrant (1) has filed all reports required to be filed by Section 13 or 15(d) of the Securities Exchange Act of 1934 during the preceding 12 months (or for such shorter period that the registrant was required to file such reports), and (2) has been subject to such filing requirements for the past 90 days. Yes x No ¨
Indicate by check mark whether the registrant has submitted electronically and posted on its corporate Web site, if any, every Interactive Data File required to be submitted and posted pursuant to Rule 405 of Regulation S-T during the preceding 12 months (or for such shorter period that the registrant was required to submit and post such files). Yes x No ¨
Indicate by check mark if disclosure of delinquent filers pursuant to Item 405 of Regulation S-K is not contained herein, and will not be contained, to the best of registrant’s knowledge, in definitive proxy or information statements incorporated by reference in Part III of this Form 10-K or any amendment to this Form 10-K. x
Indicate by check mark whether the registrant is a large accelerated filer, an accelerated filer, a non-accelerated filer, or a smaller reporting company. See the definitions of “large accelerated filer,” “accelerated filer” and “smaller reporting company” in Rule 12b-2 of the Exchange Act. (Check one):
| Large accelerated filer | ¨ | Accelerated filer | ¨ | |||
| Non-accelerated filer | x (Do not check if a smaller reporting company) | Smaller reporting company | ¨ | |||
Indicate by check mark whether the registrant is a shell company (as defined in Rule 12b-2 of the Act). Yes ¨ No x
The aggregate market value of common stock held by nonaffiliates of the registrant as of July 29, 2011, the last business day of the registrant’s most recently completed second fiscal quarter, was zero as such date was prior to the closing of the registrant’s initial public offering (the “Offering”) on August 2, 2011.
The number of shares of the registrant’s common stock outstanding as of April 9, 2012 was 38,306,996.
Documents Incorporated by Reference
Portions of the registrant’s Proxy Statement for the Annual Meeting of Stockholders to be held on June 1, 2012 (hereinafter referred to as the “Proxy Statement”) are incorporated by reference into Part III.
Table of Contents
Cautionary Statement Regarding Forward-Looking Statements
This Annual Report on Form 10-K contains forward-looking statements within the “safe harbor” provisions of the Private Securities Litigation Reform Act of 1995. All statements other than those that are purely historical are forward-looking statements. Forward-looking statements give our current expectations and projections relating to our financial condition, results of operations, plans, objectives, future performance and business. You can identify forward-looking statements by the fact that they do not relate strictly to historical or current facts. These statements may include words such as “anticipate,” “estimate,” “expect,” “project,” “plan,” “intend,” “believe,” “may,” “will,” “should,” “can have,” “likely” and other words and terms of similar meaning in connection with any discussion of the timing or nature of future operating or financial performance or other events. For example, all statements we make relating to our estimated and projected earnings, revenues, costs, expenditures, cash flows, growth rates and financial results, our plans and objectives for future operations, growth or initiatives, strategies, or the expected outcome or impact of pending or threatened litigation are forward-looking statements. All forward-looking statements are subject to risks and uncertainties that may cause actual results to differ materially from those that we expected, including, but not limited to the following:
| • | our failure to execute successfully our growth strategy; |
| • | economic conditions, and their effect on the financial and capital markets, our vendors and business partners, employment levels, consumer demand, spending patterns, inflation and the cost of goods; |
| • | our loss of key personnel or our inability to hire additional personnel; |
| • | disruptions in our supply chain and our single distribution center; |
| • | our failure to identify and respond to new and changing customer tastes, buying and economic trends; |
| • | the impact of governmental laws and regulations and the outcomes of legal proceedings; |
| • | our failure to maintain comparable levels of same-store sales; |
| • | risks and challenges in connection with sourcing merchandise from third party suppliers, including the risk that current or prospective suppliers may be unable or unwilling to supply us with adequate quantities of their teas or merchandise in a timely manner or at acceptable quality or prices, including risks related to natural or manmade causes outside of our control; |
| • | the risk of a cyber-security incident or other technological disruption; and |
| • | other factors discussed in other reports or filings filed by us with the Securities and Exchange Commission (the “SEC”). |
For a discussion of the risks, uncertainties and assumptions that could affect our future events, developments or results, you should carefully review the “Risk Factors” described under that heading below, as well as “Management’s Discussion and Analysis of Financial Condition and Results of Operations” under that heading below.
Any forward-looking statement made by us in this Annual Report on Form 10-K speaks only as of the date on which we make it. Factors or events that could cause our actual results to differ may emerge from time to time, and it is not possible for us to predict all of them. We undertake no obligation to publicly update any forward-looking statement, whether as a result of new information, future developments or otherwise, except as may be required by any applicable securities laws. You are advised, however, to consult any further disclosures we may make in our future reports to the SEC, on our website, or otherwise.
Investors should also be aware that while we do, from time to time, communicate with securities analysts and others, it is against our policy to selectively disclose to them any material nonpublic information or other confidential commercial information. Accordingly, stockholders should not assume that we agree with any statement or report issued by any analyst regardless of the content of the statement or report, as we have a policy against confirming information issued by others. Thus, to the extent that reports issued by securities analysts contain any financial projections, forecasts or opinions, such reports are not our responsibility.
Table of Contents
2011 Annual Report on Form 10-K
TABLE OF CONTENTS
| Page | ||||||
| PART I | ||||||
| Item 1. |
1 | |||||
| Item 1A. |
6 | |||||
| Item 1B. |
14 | |||||
| Item 2. |
14 | |||||
| Item 3. |
14 | |||||
| Item 4. |
14 | |||||
| PART II | ||||||
| Item 5. |
15 | |||||
| Item 6. | 17 | |||||
| Item 7. | Management’s Discussion and Analysis of Financial Condition and Results of Operations |
19 | ||||
| Item 7A. | 31 | |||||
| Item 8. | 32 | |||||
| Item 9. | Changes in and Disagreements With Accountants on Accounting and Financial Disclosure |
52 | ||||
| Item 9A. | 52 | |||||
| Item 9B. | 52 | |||||
| PART III | ||||||
| Item 10. | 52 | |||||
| Item 11. | 52 | |||||
| Item 12. | Security Ownership of Certain Beneficial Owners and Management and Related Stockholder Matters |
52 | ||||
| Item 13. | Certain Relationships and Related Transactions, and Director Independence |
52 | ||||
| Item 14. | 52 | |||||
| PART IV | ||||||
| Item 15. |
53 | |||||
Table of Contents
| Item 1. | Business. |
Our Company
Teavana is a specialty retailer of premium loose-leaf teas, authentic artisanal tea wares and other tea-related merchandise. We offer our products through 200 company-owned stores in 39 states, including one store in Canada, and 18 franchised stores primarily in Mexico, as well as through our website, www.teavana.com.
Our mission is to establish Teavana as the most recognized and respected brand in the specialty tea industry by expanding the culture of tea across the world. We have developed a distinctive strategy that we believe will continue to drive category growth, enhance our brand awareness and encourage product sampling and customer loyalty. Key elements of our business strategy are to:
| • | develop, source and offer our customers the world’s finest assortment of premium loose-leaf teas and tea-related merchandise; |
| • | create a “Heaven of Tea” retail experience in which our passionate and knowledgeable “teaologists” engage and educate customers about the ritual and enjoyment of tea; and |
| • | locate our stores in high traffic locations within malls, lifestyle centers and other high-sales-volume retail venues. |
Teavana was founded in 1997 by our Chairman and Chief Executive Officer, Andrew Mack, and his wife, Nancy Mack, who were inspired by their international travels and passion for tea. Their vision was to introduce consumers to the global tea lifestyle, highlighting the aromas, textures, tastes and healthful qualities of loose-leaf teas, while enlightening them on the origin of each tea. To further realize the vision, in 2004, we partnered with Parallel Investment Partners (“Parallel”) to obtain equity capital, strategic advice and other resources to support our accelerated growth plans, and on August 2, 2011, we completed our Offering of 8,214,287 shares of common stock at a price of $17.00 per share. Our common stock is listed on the New York Stock Exchange (“NYSE”) under the symbol “TEA.”
We operate on a fiscal calendar widely used in the retail industry that results in a given fiscal year consisting of a 52- or 53-week period ending on the Sunday closest to January 31 of the following year. For example, references to “fiscal 2011” refer to the fiscal year ended January 29, 2012. Fiscal 2011, 2010 and 2009 all contain 52 weeks.
Our Competitive Strengths
We believe that the following strengths differentiate Teavana and create the foundation for continued rapid sales and profit growth:
Market Defining Brand Driving Category Growth. We believe we are one of the world’s largest branded multi-channel specialty tea retailers. We believe our leading national presence and focus on educating consumers about the many attractive qualities of loose-leaf tea positions Teavana to drive the continued growth of the loose-leaf tea category in the United States and Canada.
“Heaven of Tea” Retail Experience. We have created a unique “Heaven of Tea” retail environment that provides a highly interactive, informative and immersive customer experience and believe this engaging retail experience introduces new customers to the tea lifestyle, encourages product trial and supports repeat visits and strong customer loyalty. This experience is cultivated by a deep rooted passion for tea, extensive training, career development and individual enrichment. To ensure the continuity of our culture and to reward our high performing team members, we typically promote from within our organization. We believe our culture helps build and support a consistent and motivated group of team members that are passionate about providing the “Heaven of Tea,” retail experience to our customers.
High-Quality Teas and Tea-Related Merchandise. We offer a unique selection of premium loose-leaf teas, authentic artisanal tea wares and other tea-related merchandise in our stores and through our website. Our differentiated offering provides a foundation for our strong brand and will continue to reinforce our market-leading position.
Powerful and Consistent Store Economics. We have a proven and highly profitable store model that has produced consistent financial results and returns. In the United States, our current store base is balanced across all of our four geographic regions, with each region producing results in line with the company average. We believe our powerful store model, deep-rooted tea enthusiast culture, highly developed store operations and a rigorous store selection process drive our consistent store financial results.
Proven and Experienced Senior Management Team. Since founding our company, Andrew Mack, our Chairman and Chief Executive Officer, has set the vision and strategic direction for Teavana and continues to drive our growth and culture. Since 2004, Mr. Mack has assembled a proven and experienced senior management team that has demonstrated its capabilities at executing our long-term growth plans. In 2005, we hired Daniel Glennon, our Executive Vice President and Chief Financial Officer, and Peter Luckhurst, our Executive Vice President of Operations. We believe our senior management team is a key driver of our success and is well-positioned to execute our strategy.
Our Growth Strategy
We are pursuing several strategies to continue our growth, including:
Expand Our Store Base. We believe there is a significant opportunity to expand our store base in the United States and Canada from 200 locations to at least 500 stores by fiscal 2015, having already identified the malls, lifestyle centers and other high-sales-volume retail venues that are suitable locations in which to open new Teavana stores. We plan to open approximately 60 stores during fiscal 2012.
Drive Comparable Store Sales. We strive to drive our comparable store sales by increasing the size and frequency of purchases by our existing customers and attracting new customers. Our “Heaven of Tea” retail experience allows us to introduce the benefits and enjoyment of our teas and tea-related merchandise to new customers while encouraging our existing customers to transition to our higher-grade teas and higher-end tea-related merchandise.
1
Table of Contents
Expand Our Online Presence. Our online platform is an extension of our brand and retail stores, serving as an educational resource and complementary sales channel for our customers.
Selectively Pursue International Expansion. As described under “International” below, given the worldwide popularity of tea, we believe international expansion represents a compelling opportunity for additional growth over the long term.
Our Retail Platform
We currently offer our premium loose-leaf teas and tea-related merchandise through our retail store base in the United States and Canada, online platform, and international and domestic franchised stores.
Our Stores
As of January 29, 2012, we operated 200 stores in 39 states, including one store in Canada. We focus on high traffic locations in malls and lifestyle centers with top-tier co-tenants, and our store base is balanced geographically across the United States. During fiscal 2011, our average store size was approximately 921 square feet; our comparable stores averaged net sales of approximately $913,000, and our stores averaged sales per gross square foot of $980.
We have pursued new store growth, having more than tripled our store base from 59 to 200 stores from fiscal 2007 to fiscal 2011. The following table shows the growth in our network of stores from fiscal 2009 through fiscal 2011:
| Fiscal Year | ||||||||||||
| 2011 | 2010 | 2009 | ||||||||||
| Stores open at beginning of year |
146 | 108 | 87 | |||||||||
| Stores opened |
54 | 38 | 21 | |||||||||
| Stores closed |
— | — | — | |||||||||
|
|
|
|
|
|
|
|||||||
| Stores open at end of year |
200 | 146 | 108 | |||||||||
| Gross square footage (in thousands) |
184 | 130 | 95 | |||||||||
Additionally, we have two franchised stores in the United States and 16 franchised stores in Mexico. Unless otherwise approved by us, our franchisees are required to sell only products purchased from us. Opening new franchise stores in the United States and Canada is not currently a significant part of our future strategy.
Distinctive Store Experience
Our stores offer a unique “Heaven of Tea” retail environment that provides a highly interactive, informative and immersive customer experience. We utilize a consistent store design to create our warm, relaxing ambiance featuring elegant blonde wood fixtures, ceramic tiled floors, soft lighting and soothing Asian music. Our store atmosphere is meant to encourage customers to slow down and interact with our teaologists around the pleasures of tea and enjoy their retail experience.
Site Selection and Expansion
We seek to open stores in locations that reinforce the premium image of our brand and support the consistent execution of our strategy, targeting high traffic locations within malls, lifestyle centers and other high-sales-volume retail venues.
We employ a rigorous analytical process to identify new store locations. We target locations based on market characteristics, mall productivity, demographic characteristics, including income and education levels, the presence of key anchor stores and co-tenants, population density and other key characteristics. We have built a proprietary retail mall database, which we use for comparison purposes and employ a proprietary regression model to evaluate projected store sales and profitability based on a number of critical inputs incorporating trade area demographics, mall tenant productivity and total anchor sales. Members of our real estate team spend considerable time evaluating prospective sites before bringing a proposal to our real estate committee. Our real estate committee, which includes our Chief Executive Officer, our two Executive Vice Presidents and our Vice President of Real Estate, approves all of our locations before a lease is signed.
Store Staffing and Operations
Each of our stores is managed by a general manager, an assistant manager and two team leads who oversee an average of eight to ten team members in each store. Each general manager is responsible for the day-to-day operations of his or her store, including the unit’s operating results, maintaining a clean and appealing store environment and the hiring, training and development of personnel. We also employ area managers, who are responsible for overseeing the operations of several stores, and regional directors, who are each responsible for overseeing several area managers and the operation of multiple stores.
We are guided by a philosophy that recognizes performance, allowing us to identify and reward team members who meet our high performance standards. We provide our store general managers with a number of analytical tools to support our store operations and assist them in attaining optimum store performance. These tools include production tools and labor scheduling programs, all of which seek to ensure that we match staffing levels to sales volume. We provide incentive bonuses to team members, assistant managers, general managers and area managers. Bonuses for store personnel, store managers and area managers are based upon achieving specified operating and financial performance goals.
2
Table of Contents
Our Online Platform
Our online platform is primarily comprised of our website, www.teavana.com, through which we provide educational resources for tea consumers and the ability to purchase the full range of our teas and tea-related merchandise. We established our current online platform in fiscal 2007, and during fiscal 2011, online sales represented 7.6% of net sales.
To replicate our “Heaven of Tea” retail experience online, our website features our full assortment of premium loose-leaf teas, tea-related merchandise and tea gift sets. Online customers can view our virtual “Wall of Tea” that allows them to select teas from our assortment and read about the ingredients and healthful qualities that pertain to the tea they have selected. In addition to being able to purchase our premium teas on a one-time basis, our customers can also establish automatic purchase and delivery of their favorite teas through our online replenishment program. To drive increased sales through our online platform, we utilize online-specific marketing and promotional programs. We also utilize various social media and mobile applications as part of our online platform, including a mobile website, iPhone, iPad and Android applications, a Facebook fan page and a presence on Twitter. In addition, we employ banner advertisements, search engine optimization and pay-per-click arrangements to help drive traffic to our website.
Through our online platform, we can target a broader audience of customers and tea enthusiasts who may not live near one of our retail locations. We believe our online platform and our stores are complementary, as our online platform provides our store customers an additional channel through which to purchase our teas and tea-related merchandise while also helping drive awareness of and traffic to our stores.
International
We currently have 16 franchised stores in Mexico through an international development agreement with Casa Internacional del Te, S.A. de C.V. (“Casa Internacional”). The agreement with Casa Internacional grants the exclusive right to open franchised Teavana locations in that country for a term of 15 years. We also operate one company-owned store in Canada as of January 29, 2012 and on September 2, 2011 entered into an international development agreement with the Alshaya Group to open Teavana-branded stores in the Middle East. We expect to continue to selectively expand our global presence through additional company-owned stores, franchise arrangements and/or acquisition.
Our Culture
We have developed a distinctive culture that inspires in our team members a passion for tea and the tea lifestyle. Our culture is also focused on extensive training, career development and individual enrichment. We seek to attract passionate and motivated team members who are driven to succeed and share our vision of creating in our stores a “Heaven of Tea” experience for our customers.
To support the tea culture globally, we donate approximately 1% of annual net profits to the Cooperative for Assistance and Relief Everywhere, Inc., or “CARE,” through our Teavana Equatrade program. CARE seeks to overcome poverty by funding programs supporting dignity, tolerance and social justice. We believe that giving back to tea-growing regions worldwide helps the global tea community thrive.
Our Teas and Tea-Related Merchandise
We offer in our stores and through our website more than 100 varieties of premium loose-leaf teas, tea wares such as handcrafted cast-iron, clay and ceramic tea pots, and other tea-related merchandise. We also offer a selection of fresh-brewed teas. Tea, tea-related merchandise and beverages accounted for 55%, 41% and 4% of total consolidated net sales, respectively, in fiscal 2011.
Teas
We provide our customers a diverse selection of over 100 loose-leaf teas from around the world. Our overall tea selection is comprised of approximately 20% single-estate teas and 80% specially blended teas. Our offering is comprised of teas from the following three main groups:
| • | Single-estate teas. Our single-estate teas, which are the teas that originate wholly from an individual tea plantation, estate or garden, are produced from the Camellia Sinensis bush. We offer four types of single-estate teas – white, green, oolong, and black – each with its own distinctive characteristics arising from the climate, soil, altitude, growing conditions, when and how the tea is harvested, and the processing method used. |
| • | Single-estate blended teas. We offer blends that combine our single-estate teas with spices, herbs, flower petals, essential oils of fruits and other flavorings. We work in close collaboration with third-party blenders to develop our specially blended teas, and spend significant amounts of time perfecting the balance of flavors, aromas and colors to create unique teas that we believe will appeal to our customers. |
| • | Herbal blended teas. Herbal teas are not technically “teas,” as they are not produced from the Camellia Sinensis bush, but are herbal infusions generally made from other sources such as the Rooibos bush and Honeybush from South Africa, the Maté shrub from Argentina and other ingredients including dried fruits, herbs and even flowers. Herbal teas, aside from Maté, are generally caffeine-free and can be brewed individually or blended with other types of tea to create an aromatic and flavorful beverage. |
Tea-Related Merchandise
We offer in our stores and through our website a carefully selected assortment of artisanal tea wares and other tea-related merchandise that provide our customers the ability to brew and consume our premium loose-leaf teas and more broadly experience tea cultures from around the globe. The majority of our tea-related merchandise is Teavana-branded. We also offer a selection of our teas and tea-related merchandise in the form of prepackaged gift sets.
Our tea wares and other tea-related merchandise are grouped into five main categories: (1) teapots, (2) tea cups and mugs, (3) tea accessories, (4) tea décor and media and (5) tea foods.
Beverages
We offer made-to-order fresh-brewed teas in each of our stores. Our customers may select any of the varieties of loose-leaf single-estate and blended teas that we offer. Customers can choose to have their beverage served hot or cold.
3
Table of Contents
Product Selection, Development and Sourcing
We select and develop an extensive offering of premium loose-leaf teas, authentic artisanal tea wares and other tea-related merchandise. Our merchandising team travels across global tea regions seeking superior teas and high quality traditional tea merchandise. Our product offering reflects tea communities in Japan, China, India, South Korea and Europe, and we often explore different tea cultures from which to introduce new teas and tea-related merchandise to our customers. We also work with our supplier partners to develop special tea blends and innovative products that we sell on an exclusive basis.
Teas
Our merchandising team selects the highest grades of single-estate teas sourced from tea gardens and brokers in tea-producing regions around the world. Although most tea trades in the commodity market, premium loose-leaf teas of the quality we seek trade on a negotiated basis at a substantial premium to commodity tea prices. Tea supply and price can be affected by multiple factors, including weather, political and economic conditions, and currency fluctuations. Our merchandising team also focuses on the creation of our special tea blends using multiple varieties of single-estate teas and herbal teas, which are combined with spices, herbs, flower petals, essential oils of fruits and other natural flavorings. We have long-standing collaborative relationships with tea blenders from across the globe with which we collaborate to develop our blends. Our team spends significant amounts of time tasting, or “cupping,” blends under development to perfect the balance of flavors, aromas and colors. To provide our customers a fresh tea selection over time, we introduce new teas usually two to three times per year, and seek to replace 10-20% of our “Wall of Tea” selections every year.
Tea-Related Merchandise
Our merchandising team seeks to select high quality tea-related merchandise to enhance the enjoyment and experience of tea for our customers. We travel throughout the world seeking out what we believe is the finest tea-related merchandise available.
Quality Control
As part of our quality control, we test our teas and tea-related merchandise to ensure compliance with our stringent quality standards. We perform extensive sampling of teas during the buying process. In addition, our teas undergo rigorous testing based on food safety specifications established by European Union regulations for the presence of pesticides. We use a third-party testing program that samples each batch of teas received at our distribution center. We also have strict quality control around the manufacture of our tea-related merchandise.
Sourcing
We do not own or operate any tea estates, blending operations or manufacturing facilities; instead, we source our products from over 100 vendors across the globe. During fiscal 2011, our two largest vendors represented approximately 24% and 16%, respectively, of our total purchases of inventory goods. Approximately 95% of our purchases are paid for in US dollars, with the balance being denominated primarily in Euros and Japanese yen.
Distribution
We distribute our loose-leaf teas and tea-related merchandise to our stores and our e-commerce customers from our distribution center in Stratford, Connecticut. Our products are typically shipped to our stores via a third-party national transportation provider multiple times per week.
We have identified the need to expand our distribution center in order to support our near-term growth. We have signed commitments to expand our distribution center, for a modest capital outlay, during fiscal 2012 to support our growing operations through the first quarter of fiscal 2013. We are continuing to evaluate our long-term distribution needs.
Marketing and Advertising
Our marketing strategy currently emphasizes utilization of our website and social media and mobile applications to create a community of tea enthusiasts, build customer loyalty and promote our brand awareness. For example, we provide updates on teas, tea news, tea-making, tea gift ideas and related topics via our “Heaven of Tea” blog on our website, our Facebook page and our presence on Twitter. We have introduced our PerfecTea® Touch application, which can be downloaded free of charge on the Apple iPhone and iPad and in the Android market. This application enables customers to shop our teas and tea-related merchandise, locate a store and obtain information on blending our teas, and provides them with built-in music-accompanied timers to help brew the perfect cup of tea. Additionally, we utilize banner advertisements, search engine optimization and pay-per-click arrangements to help drive traffic to our website.
Information Technology Systems
Our information technology systems provide a full range of business process support to our stores, our store operations and store support center teams. We utilize a combination of industry standard and customized software systems to provide various functions related to:
| • | point of sale; |
| • | inventory management; |
| • | warehouse management; and |
| • | accounting and financial reporting. |
Through our point of sale system, we are able to facilitate the operations of our stores, and through our warehouse management systems, we can efficiently manage our inventory of loose-leaf teas and tea-related merchandise from our store support center.
4
Table of Contents
Competition
The US tea market is highly fragmented. We compete directly with a large number of relatively small independently-owned tea retailers. Additionally, relatively low barriers to entry in the tea and beverage retail market may encourage other tea and beverage retailers who may have greater financial, marketing and operating resources than we do to enter the specialty tea retail market. As we continue to expand geographically, we expect to encounter additional regional and local competitors. We also compete indirectly with other vendors of loose-leaf, bagged and ready-to-drink teas, such as supermarkets, club stores, wholesalers and internet suppliers, as well as with houseware retailers and suppliers that offer tea wares and related accessories.
In addition, we compete with numerous other mall-based retailers for retail real estate locations for our stores.
Trademarks and Other Intellectual Property
We regard intellectual property and other proprietary rights as important to our success. We own several trademarks and service marks that have been registered with the US Patent and Trademark Office, including Teavana®, Heaven of Tea®, Wall of Tea® and the names of most of the varieties of single-estate teas and specially blended teas that we sell. We have also registered trademarks on our stylized logos. We have applications pending with the US Patent and Trademark Office for a number of additional marks, including additional varieties of our single-estate teas and blended teas. We also own domain names, including www.teavana.com, for our primary trademarks and own unregistered copyright rights in our website content. In addition, we have registered or made application to register one or more of our marks in a number of foreign countries and expect to continue to do so in the future as we expand internationally. There can be no assurance that we can obtain the registration for the marks in every country where registration has been sought or may be sought in the future.
We also rely upon trade secrets and know-how to develop and maintain our competitive position. We protect our intellectual property rights through a variety of methods including trademark and trade secret laws, as well as confidentiality agreements and proprietary information agreements with vendors, team members, consultants and others who have access to our proprietary information.
We must constantly protect against any infringement by competitors. If a competitor infringes on our trademark rights, we may have to litigate to protect our rights, in which case, we may incur significant expenses and divert significant attention from our business operations.
Government Regulation
We are subject to labor and employment laws, laws governing advertising, privacy laws, safety regulations and other laws, including consumer protection regulations that regulate retailers and/or govern the promotion and sale of merchandise and the operation of stores and warehouse facilities. We monitor changes in these laws and believe that we are in material compliance with applicable laws.
Insurance
We use a combination of insurance and self-insurance for a number of risk management activities including workers’ compensation, general liability, automobile liability and employee-related health care benefits. We believe that we have adequately reserved for our self-insurance liability related to medical coverage of our team members. We evaluate our insurance requirements on an ongoing basis to ensure we maintain adequate levels of coverage.
Employees
As of January 29, 2012, we employed 473 full-time and 2,179 part-time employees, of whom 2,517 were employed in our retail channel and 135 were employed in corporate, distribution and direct channel support functions. None of our employees are represented by a labor union. We consider our relationship with our employees to be very good.
Properties
We do not own any real property. Our store support center is located in Atlanta, Georgia and is leased under a lease agreement expiring in 2024. The approximately 30,000 square foot space includes a simulated store that provides a forum for training and planning visual and marketing concepts prior to their execution in our stores.
Our approximately 123,000 square foot distribution center is located in Stratford, Connecticut. Our distribution center is leased under a lease agreement expiring in 2016 and 2020 (as to different portions of the facility).
As of January 29, 2012, we operated 200 company-owned stores in 39 states, including one store in Canada. All of our stores are leased from third parties, and the leases typically have ten-year terms. Some of our leases have early cancellation clauses, which permit the lease to be terminated by us or the landlord if certain sales levels are not met in specific periods or if a shopping center does not meet specified occupancy standards. In addition to future minimum lease payments, some of our store leases provide for additional rental payments based on a percentage of net sales if sales at the respective stores exceed specified levels, as well as the payment of common area maintenance charges, real property insurance and real estate taxes. Many of our lease agreements have defined escalating rent provisions over the initial term and any extensions.
Seasonality
Our business is seasonal and, historically, we have realized a higher portion of our net sales, net income and operating cash flows in the fourth fiscal quarter, due to the impact of the holiday selling season.
Available Information
Our Annual Report on Form 10-K, Quarterly Reports on Form 10-Q, Current Reports on Form 8-K, and all amendments to those reports and the Proxy Statement are made available, free of charge, on our corporate web site, www.teavana.com, as soon as reasonably practicable after such reports have been filed with or furnished to the SEC. We intend to use our website as a means of disclosing material non-public information and for complying with our disclosure obligations under Regulation FD. Such disclosures will be included on our website in the “Investor Relations” sections. Accordingly, investors should monitor such portions of our website, in addition to following our press releases, SEC filings and public conference calls and webcasts.
5
Table of Contents
Our Code of Business Conduct and Ethics (the “Code”) and Board of Directors Committee Charters (for each of our Audit, Compensation and Corporate Governance and Nominating Committees) are also available on our website. The Committee Charters and the Code can be found at www.teavana.com, under the “Investor Relations, Corporate Governance” tab. Any amendments and waivers to the Code will also be available on our website.
All of these documents are available in print to any stockholder who requests them via our website or by writing to Teavana Holdings, Inc., c/o General Counsel, 3630 Peachtree Rd NE, Suite 1480, Atlanta, Georgia 30326.
The public may also read and copy any materials that we have filed with the SEC at the SEC’s Public Reference Room at 100 F Street, NE, Washington, D.C. 20549. In addition, these materials may be obtained at the web site maintained by the SEC at www.sec.gov. The public may obtain information on the operation of the SEC’s Public Reference room by calling the SEC at 1-800-SEC-0330.
The content of our web site (www.teavana.com) is not intended to be incorporated by reference in this Annual Report on Form 10-K.
| Item 1A. | Risk Factors. |
We may not be able to implement successfully our growth strategy on a timely basis or at all, which could harm our results of operations.
Our continued growth depends, in large part, on our ability to open new stores and to operate those stores successfully. We believe there is a significant opportunity to expand our store base in the United States and Canada from 200 locations as of January 29, 2012 to at least 500 stores by the end of fiscal 2015. We plan to open approximately 60 stores in fiscal 2012.
Our ability to successfully open and operate new stores depends on many factors, including:
| • | the identification and availability of suitable sites for store locations, primarily in high-traffic shopping malls; |
| • | the negotiation of acceptable lease terms; |
| • | the maintenance of adequate distribution capacity, information technology systems and other operational system capabilities; |
| • | the hiring, training and retention of store management and other qualified personnel; |
| • | the effective management of inventory to meet the needs of our stores on a timely basis; and |
| • | the availability of sufficient levels of cash flow and financing to support our expansion. |
In addition, on a selective basis, we will continue to seek franchisees to operate stores under the Teavana brand in international markets. However, if we are unable to identify suitable franchisees, or if our franchisees fail to operate their stores successfully or consistent with our brand image, our international franchising strategy may not enhance our results of operations. New stores contemplated under our existing international development agreement or any future such agreements may not open on the anticipated development schedule or at all.
Accordingly, we cannot assure you that we will achieve our planned growth or, even if we are able to grow our store base as planned, that any new stores will perform as planned. If we fail to successfully implement our growth strategy, we will not be able to sustain the rapid growth in sales and profits growth that we expect, which would likely have an adverse impact on the price of our common stock.
The planned addition of a significant number of new stores each year will require us to expand and improve our operations and could strain our operational, managerial and administrative resources, which may adversely affect our business.
Our growth strategy calls for the opening of a significant number of new stores each year. Our planned expansion will place increased demands on our operational, managerial, administrative and other resources, which may be inadequate to support our expansion. Our senior management team has limited experience opening the number of new stores annually that we contemplate opening in fiscal 2012 and beyond, and may be unable to effectively address challenges involved with such expansion. Managing our growth effectively will require us to continue to enhance our store management systems, financial and management controls and information technology systems and to hire, train and retain regional directors, area managers, store general managers and other personnel. Our planned near-term store growth will also require expansion of and improvement to our current distribution center. Implementing new systems, controls and procedures and these additions to our infrastructure and any changes to our existing operational, managerial, administrative and other resources could negatively impact our results of operations and financial condition.
As we expand our store base we may not experience the same sales per square foot, increases in comparable store sales or profitability that we have experienced in the past.
As we continue to expand our store base, it may become more difficult to identify additional suitable sites for new stores, and we will target an increasing number of shopping malls with lower average sales per square foot than the malls in which we are currently located. The sales per square foot and net sales from such new locations will likely be lower than our existing stores. While our average sales-per-comparable-store is currently $913,000 for fiscal 2011, our new store model projects average first year sales per store of $600,000 to $700,000. Additionally, new stores generally have lower gross margins and higher operating expenses, as a percentage of sales, than our more mature stores. New stores may not achieve sustained sales and operating levels consistent with our mature store base on a timely basis or at all. There may be a negative impact on our results from a lower level of gross margin contribution by our new stores, along with the impact of related pre-opening costs. Any failure to open and operate successfully new stores in the time frames and at the sales, cost and gross margin levels estimated by us could result in a decline in our operating results and therefore have an adverse impact on the price of our common stock.
6
Table of Contents
Further, given that we (1) forecast the number of stores that we open each year to become a smaller percentage of our existing store base, (2) first-year sales for new stores to be lower than we have historically experienced, and (3) comparable store sales to grow at less than historical rates, we anticipate that our future sales growth will be at less than historical levels. If our future comparable store sales or average sales per square foot decline or fail to meet market expectations, the price of our common stock could decline. A variety of factors affect comparable store sales and average sales per square foot, including current national and regional economic conditions, pricing, inflation and weather conditions. Many retailers have been unable to sustain high levels of comparable store sales growth during and after periods of substantial expansion.
Any decrease in customer traffic in the shopping malls or other locations in which our stores are located could cause our sales to be less than expected.
Our stores are located primarily in enclosed shopping malls and other shopping centers. Net sales at these stores are derived, to a significant degree, from the volume of traffic in those shopping malls and centers and in the surrounding area. Our stores benefit from the current popularity of shopping malls and centers as shopping destinations and their ability to generate consumer traffic in the vicinity of our stores. Our sales volume and traffic may be adversely affected by, among other things:
| • | economic downturns nationally or regionally; |
| • | high fuel prices; |
| • | changes in consumer demographics; |
| • | a decrease in popularity of shopping malls or of higher-end retail concepts in the shopping malls and centers in which our stores are located; |
| • | the closing of a shopping mall’s “anchor” stores or other key tenants; or |
| • | deterioration in the financial condition of shopping mall and center operators or developers which could, for example, limit their ability to maintain and improve their facilities. |
A reduction in consumer traffic as a result of these or any other factors could have a material adverse effect on us.
In addition, severe weather conditions and other catastrophic occurrences in areas in which we have stores may have a material adverse effect on our results of operations. Such conditions may result in physical damage to our stores, loss of inventory, closure of one or more of our stores or an insufficient labor pool in our markets. Any of these factors may disrupt our business and have a material adverse effect on our financial condition and results of operations.
Our success depends substantially upon the continued retention of our senior management and other key personnel.
Our future success is substantially dependent on the continued service of certain members of our senior management, including Andrew Mack, our founder and Chief Executive Officer, Daniel Glennon, our Executive Vice President and Chief Financial Officer, and Peter Luckhurst, our Executive Vice President of Operations. These executives and other key personnel have been primarily responsible for determining the strategic direction of our business and for executing our growth strategy and are integral to our brand and culture and the positive business reputation we enjoy with our customers and vendors. The loss of the services of any of these executives or other key personnel could have a material adverse effect on our business and prospects, as we may not be able to find suitable individuals to replace them on a timely basis, if at all. In addition, any such departure could be viewed in a negative light by investors and analysts, which could cause the price of our common stock to decline. Additionally, if we are unable to continue to attract or retain highly qualified personnel, the development, growth and future success of our business could be adversely affected.
If we are unable to attract, assimilate and retain team members that embody our culture, including store personnel and store and area managers and regional directors, we may not be able to grow or successfully operate our business.
Our success depends in part upon our ability to attract, train, assimilate and retain a sufficient number of team members, including store personnel, store managers, area managers and regional directors, who understand and appreciate our culture and are able to represent our brand effectively and establish credibility with our customers. We have historically promoted substantially all of our store managers, area managers and regional directors from our pool of existing team members and expect to continue to rely heavily upon such talent pool to support our growth plans. If we are unable to hire and retain store personnel capable of consistently providing a high level of customer service, as demonstrated by their enthusiasm for our culture, understanding of our customers and knowledge of the loose-leaf tea and tea-related merchandise we offer, our ability to open new stores may be impaired, the performance of our existing and new stores could be materially adversely affected and our brand image may be negatively impacted. Any failure to meet our staffing needs or any material increases in team member turnover rates could have a material adverse effect on our business or results of operations.
We have only one distribution center, and if we encounter difficulties associated with such facility or if it were forced to shut down for any reason, we could face shortages of inventory that would have a material adverse effect on our business operations.
Our only distribution center is located in Stratford, Connecticut. This single distribution center currently supports our entire business. Substantially all of our teas and tea-related merchandise are shipped to the distribution center from our vendors, and then shipped from our distribution center to our stores and e-commerce customers. Our success depends on the timely and frequent receipt of merchandise by our stores, often multiple times per week. The efficient flow of such merchandise requires that we have adequate capacity in our distribution center to support our current level of operations and the anticipated increased levels that may follow from our growth plans. If the operation of our distribution center were to be disrupted or if it were to shut down for any reason or its contents were to be destroyed or damaged, due to fire, severe weather or other natural disaster, we could face shortages of inventory, resulting in “out-of-stock” conditions in our stores, and would incur additional cost to replace any destroyed or damaged product. Such an event may negatively impact our sales and may cause us to incur significantly higher costs and longer lead times associated with delivering products to our stores and e-commerce customers. This could have a material adverse effect on our business and harm our reputation.
7
Table of Contents
Any failure to expand our distribution center’s capacity on a timely basis would have an adverse effect on our growth strategy and results of operations.
We have identified the need to expand our current distribution center and/or open a second distribution center in order to support our growth. If we are unable to successfully implement our planned near-term and long-term expansion of our distribution capability, the efficient flow of our merchandise could be disrupted, which could materially hurt our business. Our long-term need for increased distribution capacity may require us to obtain additional financing. Appropriate locations or financing for the construction or lease of such additional real estate may not be available at reasonable costs or at all. Our failure to secure additional distribution capacity when necessary could impede our growth plans, as a result of which our financial condition and operating results could be adversely affected.
Because our business is highly concentrated on a single, discretionary product category, premium loose-leaf teas and tea-related merchandise, we are vulnerable to changes in consumer preferences and in economic conditions affecting disposable income that could harm our financial results.
Our business is not diversified and consists primarily of developing, sourcing, marketing and selling premium loose-leaf teas and tea-related merchandise. Consumer preferences often change rapidly and without warning, moving from one trend to another among many retail concepts. Therefore, our business is substantially dependent on our ability to educate consumers on the many positive attributes of tea, anticipate shifts in consumer tastes and help drive growth of the overall tea market. Any future shifts in consumer preferences away from the consumption of beverages brewed from premium loose-leaf teas would also have a material adverse effect on our results of operations.
Consumer purchases of specialty retail products, including our products, are historically affected by economic conditions such as changes in employment, salary and wage levels, the availability of consumer credit, inflation, interest rates, tax rates, fuel prices and the level of consumer confidence in prevailing and future economic conditions. These discretionary consumer purchases may decline during recessionary periods or at other times when disposable income is lower. In addition, increases in utility, fuel, commodity price and corporate income tax levels could affect our cost of doing business, including transportation costs of our third-party service providers, causing our suppliers and such service providers to seek to recover these increases through increased prices charged to us. Our financial performance may become susceptible to economic and other conditions in regions or states where we have a significant number of stores. Our continued success will depend, in part, on our ability to anticipate, identify and respond quickly to changing consumer preferences and economic conditions.
Our success depends, in part, on our ability to source, develop and market new varieties of loose-leaf teas and tea-related merchandise that meet our high standards and customer preferences.
We currently offer more than 100 varieties of loose-leaf teas and a wide assortment of tea-related merchandise. Our success depends in part on our ability to continually innovate, develop, source and market new varieties of loose-leaf teas and tea-related merchandise that both meet our standards for quality and appeal to customers’ preferences. Failure to innovate, develop, source, market and price new varieties of tea and tea-related merchandise that consumers want to buy could lead to a decrease in our sales and profitability.
We may experience negative effects to our brand and reputation from real or perceived quality or health issues with our teas and tea-related merchandise, which could have an adverse effect on our operating results.
We believe our customers rely on us to provide them with premium loose-leaf teas and high-quality tea-related merchandise. Concerns regarding the safety of our teas and tea-related merchandise or the safety and quality of our supply chain could cause shoppers to avoid purchasing certain products from us or to seek alternative sources of tea, even if the basis for the concern has been addressed or is outside of our control. Adverse publicity about these concerns, whether or not ultimately based on fact, and whether or not involving teas or tea-related merchandise sold at our stores, could discourage consumers from buying our teas and tea-related merchandise and have an adverse effect on our brand, reputation and operating results.
Furthermore, the sale of tea entails a risk of product liability claims and the resulting negative publicity. Tea supplied to us may contain contaminants that, if not detected by us, could result in illness or death upon their consumption. We cannot assure you that product liability claims will not be asserted against us or that we will not be obligated to perform product recalls in the future.
We may also be subject to involuntary product recalls or may voluntarily conduct a product recall, such as the 2011 voluntary recall of our organic peppermint loose-leaf tea following notification by one of our suppliers of possible contamination of its product by Salmonella. The costs associated with any future product recall could, individually and in the aggregate, be significant in any given fiscal year. In addition, any product recall, regardless of direct costs of the recall, may harm consumer perceptions of our teas and tea-related merchandise and have a negative impact on our future sales and results of operations.
Any loss of confidence on the part of our customers in the safety and quality of our teas and tea-related merchandise would be difficult and costly to overcome. Any such adverse effect could be exacerbated by our position in the market as a purveyor of premium loose-leaf teas and high-quality tea-related merchandise and could significantly reduce our brand value. Issues regarding the safety of any teas or tea-related merchandise sold by us, regardless of the cause, could have a substantial and adverse effect on our sales and operating results.
A shortage in the supply, a decrease in quality or an increase in the price of teas and tea-related merchandise as a result of weather conditions, earthquakes, crop disease, pests or other natural or manmade causes outside of our control could impose significant costs and losses on our business.
The supply and price of tea is subject to fluctuation, depending on demand and other factors outside of our control. The supply, quality and price of our teas and tea-related merchandise can be affected by multiple factors in tea-producing countries, including political and economic
8
Table of Contents
conditions, civil and labor unrest, adverse weather conditions, including floods, drought and temperature extremes, earthquakes, tsunamis, and other natural disasters and related occurrences. This risk is particularly true with respect to regions or countries from which we source a significant percentage of our products. In extreme cases, entire tea harvests may be lost or production of tea-related merchandise may be negatively impacted in some geographic areas. These factors can increase costs and decrease sales, which may have a material adverse effect on our business, results of operations and financial condition.
Tea may be vulnerable to crop disease and pests, which may vary in severity and effect. The costs to control disease and pest damage vary depending on the severity of the damage and the extent of the plantings affected. Moreover, there can be no assurance that available technologies to control such conditions will continue to be effective. These conditions can increase costs and decrease sales, which may have a material adverse effect on our business, results of operations and financial condition.
Because we rely on a limited number of third-party suppliers and manufacturers to produce the majority of our teas and tea-related merchandise, we may not be able to obtain quality products on a timely basis or in sufficient quantities.
We rely on a limited number of vendors to supply us with single-estate and specially blended teas and tea-related merchandise on a continuous basis. Our financial performance depends in large part on our ability to purchase tea in sufficient quantities at competitive prices from these vendors. We do not have long-term purchase contracts or other contractual assurances of continued supply, pricing or exclusive access to products from these vendors.
Any of our suppliers or manufacturers could discontinue supplying us with loose-leaf tea or tea-related merchandise in sufficient quantities for a variety of reasons. The benefits we currently experience from our supplier and manufacturer relationships could be adversely affected if they:
| • | raise the prices they charge us; |
| • | discontinue selling products to us; |
| • | sell similar or identical products to our competitors; or |
| • | enter into arrangements with competitors that could impair our ability to sell our suppliers’ products, including by giving our competitors exclusive licensing arrangements or exclusive access to tea blends and other products or limiting our access to such arrangements or blends or other products. |
During fiscal 2011, our two largest vendors represented approximately 24% and 16%, respectively, of our total inventory purchases. Any disruption to either of these relationships would have a material adverse effect on our business.
Events that adversely affect our vendors could impair our ability to obtain inventory in the quantities that we desire. Such events include difficulties or problems with our vendors’ businesses, finances, labor relations, ability to import raw materials, costs, production, insurance and reputation, as well as natural disasters or other catastrophic occurrences.
If we experience significant increased demand for our teas and tea-related merchandise, or need to replace an existing vendor, there can be no assurance that additional supplies or additional manufacturing capacity will be available when required on terms that are acceptable to us, or at all, or that any vendor would allocate sufficient capacity to us in order to meet our requirements, fill our orders in a timely manner or meet our strict quality requirements. Even if our existing vendors are able to expand their capacity to meet our needs or we are able to find new sources of supply, we may encounter delays in production, inconsistencies in quality and added costs as a result of the time it takes to train our suppliers and manufacturers in our methods, products and quality control standards. Any delays, interruption or increased costs in the supply of loose-leaf teas or the manufacture of our tea-related merchandise could have an adverse effect on our ability to meet customer demand for our products and result in lower net sales and profitability both in the short and long term.
We may face increased competition from other tea and beverage retailers, which could adversely affect us and our growth plans.
As we continue to drive growth in the loose-leaf tea category in the United States and Canada, our success, combined with relatively low barriers to entry, may encourage new competitors to enter the market. The financial, marketing and operating resources of some of these new market entrants may be greater than our own. We must spend significant resources to differentiate our customer experience, which is defined by a wide selection of premium loose-leaf teas, high quality tea-related merchandise and superior customer service from experienced and knowledgeable teaologists who are passionate about tea. Despite these efforts, our competitors may still be successful in attracting our customers.
We rely significantly on information technology systems and any failure, inadequacy, interruption or security failure of those systems could harm our ability to operate our business effectively.
We rely on our information technology systems to effectively manage our business data, communications, point-of-sale, supply chain, order entry and fulfillment, inventory and warehouse management and other business processes. The failure of our systems to perform as we anticipate could disrupt our business and result in transaction errors, processing inefficiencies and the loss of sales, causing our business to suffer. In addition, our information technology systems may be vulnerable to damage or interruption from circumstances beyond our control, including fire, natural disasters, systems failures, viruses and cyber security breaches, including breaches of our transaction processing or other systems that could result in the compromise of confidential customer data. Any such damage or interruption could have a material adverse effect on our business, cause us to face significant fines, customer notice obligations or costly litigation, harm our reputation with our customers, require us to expend significant time and expense developing, maintaining or upgrading our information technology systems or prevent us from paying our vendors or team members, receiving payments from our customers or performing other information technology, administrative or outsourcing services on a timely basis. Recently, data security breaches suffered by well-known companies and institutions have attracted a substantial
9
Table of Contents
amount of media attention, prompting new federal and state laws and legislative proposals addressing data privacy and security, as well as increased data protection obligations imposed on merchants by credit card issuers. As a result, we may become subject to more extensive requirements to protect the customer information that we process in connection with the purchase of our products.
In addition, we sell merchandise over the Internet through our website, www.teavana.com. Our website operations may be affected by our reliance on third-party hardware and software providers, technology changes, risks related to the failure of computer systems through which we conduct our website operations, telecommunications failures, electronic break-ins and similar disruptions. Furthermore, our ability to conduct our website operations may be affected by liability for on-line content and state and federal privacy laws.
Fluctuations in our results of operations for the fourth fiscal quarter would have a disproportionate effect on our overall financial condition and results of operations.
Our business is seasonal, and historically, we have realized a higher portion of our net sales, net income and operating cash flows in the fourth fiscal quarter, due to the impact of the holiday selling season and colder weather. Any factors that harm our fourth fiscal quarter operating results, including disruptions in our supply chain, adverse weather or unfavorable economic conditions, could have a disproportionate effect on our results of operations for the entire fiscal year.
In order to prepare for our peak shopping season, we must order and maintain higher quantities of inventory than we would carry at other times of the year. As a result, our working capital requirements also fluctuate during the year, increasing in the second and third fiscal quarters in anticipation of the fourth fiscal quarter. Any unanticipated decline in demand for our loose-leaf teas and tea-related merchandise during our peak shopping season could require us to sell excess inventory at a substantial markdown, which could diminish our brand and reduce our net sales and gross profit.
Our quarterly results of operations may also fluctuate significantly as a result of a variety of other factors, including the timing of new store openings and the sales contributed by new stores. As a result, historical period-to-period comparisons of our sales and operating results are not necessarily indicative of future period-to-period results. You should not rely on the results of a single fiscal quarter, particularly the fourth fiscal quarter holiday season, as an indication of our annual results or our future performance.
Third-party failure to deliver merchandise from our distribution center to our stores and e-commerce customers could result in lost sales or reduced demand for our teas and tea-related merchandise.
We currently rely upon a national third-party transportation provider for substantially all of our product shipments from our distribution center to our stores and e-commerce customers. Our utilization of its delivery services for shipments, or those of any other shipping companies we may elect to use, is subject to risks, including increases in fuel prices, which would increase our shipping costs, and employee strikes and inclement weather, which may impact the provider’s ability to provide delivery services that adequately meet our shipping needs. If we change shipping companies, we could face logistical difficulties that could adversely affect deliveries, and we would incur costs and expend resources in connection with such change. Moreover, we may not be able to obtain terms as favorable as those we receive from the national third-party transportation provider that we currently use, which in turn would increase our costs and thereby adversely affect our operating results.
Our ability to source our teas and tea-related merchandise profitably or at all could be hurt if new trade restrictions are imposed or existing trade restrictions become more burdensome.
All of our loose-leaf teas are currently grown, and a substantial majority of our tea-related merchandise is currently manufactured, outside of the United States. The United States and the countries in which our products are produced or sold internationally have imposed and may impose additional quotas, duties, tariffs, or other restrictions or regulations, or may adversely adjust prevailing quota, duty or tariff levels. Countries impose, modify and remove tariffs and other trade restrictions in response to a diverse array of factors, including global and national economic and political conditions, which make it impossible for us to predict future developments regarding tariffs and other trade restrictions. Trade restrictions, including tariffs, quotas, embargoes, safeguards and customs restrictions, could increase the cost or reduce the supply of teas and tea-related merchandise available to us or may require us to modify our supply chain organization or other current business practices, any of which could harm our business, financial condition and results of operations.
Fluctuations in foreign currency exchange rates may affect our price negotiations with our third-party suppliers and manufacturers.
Substantially all of our suppliers and manufacturers are located outside of the United States, and changes in the exchange rates between the US dollar and the Euro, Japanese yen and Chinese Renminbi may have a significant, and potentially adverse, effect on our price negotiations with such parties. If the US dollar weakens against any such currencies, our suppliers and manufacturers may attempt to renegotiate the terms of their arrangements with us, which may have a negative effect on our operating results.
Our international expansion and operations in foreign markets expose us to risks associated with international sales and operations.
We intend to continue to expand internationally and operate in select foreign markets. Managing a global organization is difficult, time consuming and expensive. Our inexperience in operating our business globally increases the risk that any future international expansion efforts that we may undertake will not be successful. In addition, conducting international operations subjects us to risks such as the lack of familiarity with and unexpected changes in foreign regulatory requirements; difficulties in managing and staffing international operations; fluctuations in currency exchange rates; potentially adverse tax consequences, including foreign value added tax systems, and restrictions on repatriation of earnings; the burdens of complying with a wide variety of foreign laws and legal standards; increased financial accounting and reporting burdens and complexities; and political, social and economic instability abroad. Operating in international markets also requires significant management attention and financial resources. The investment and additional resources required to establish operations and manage growth in other countries may not produce desired levels of revenue or profitability.
10
Table of Contents
We may not be able to protect our intellectual property adequately, which could harm the value of our brand and adversely affect our business.
We believe that our intellectual property has substantial value and has contributed significantly to the success of our business. In particular, our trademarks, including our registered Teavana and Teavana logo design trademarks and the names of most of the varieties of specially blended teas that we sell, are valuable assets that reinforce the distinctiveness of our brand and our customers’ favorable perception of our stores.
From time to time, third parties have used names similar to ours, have applied to register trademarks similar to ours and, we believe, have infringed or misappropriated our intellectual property rights. Third parties have also, from time to time, opposed our trademarks and challenged our intellectual property rights. We respond to these actions on a case-by-case basis, including where appropriate by commencing litigation.
We cannot assure you that the steps we have taken to protect our intellectual property rights are adequate, that our intellectual property rights can be successfully defended and asserted in the future or that third parties will not infringe upon or misappropriate any such rights. Our trademark rights and related registrations may continue to be challenged in the future and could be canceled or narrowed. Our failure to protect our trademarks could prevent us in the future from challenging third parties who use names and logos similar to our trademarks, which may in turn cause customer confusion, negatively affect customers’ perception of our brand, stores and products, and adversely affect our sales and profitability. Moreover, intellectual property proceedings and infringement claims could result in a significant distraction for management and have a negative impact on our business.
In addition, although we have also taken steps to protect our intellectual property rights internationally, the laws of certain foreign countries may not protect intellectual property to the same extent as do the laws of the United States. Other entities may have rights to trademarks that contain portions of our marks or may have registered similar or competing marks in foreign countries. There may also be other prior registrations in other foreign countries of which we are not aware. We may need to expend additional resources to defend our trademarks in these countries, and the inability to defend such trademarks could impair our brand or significantly adversely affect the growth of our business internationally.
We are subject to the risks associated with leasing substantial amounts of space and are required to make substantial lease payments under our operating leases. Any failure to make these lease payments when due would likely harm our business, profitability and results of operations.
We do not own any real estate. Instead, we lease all of our company-owned store locations, our store support center in Atlanta, Georgia and our distribution center in Stratford, Connecticut. Our store leases typically have ten-year terms and generally require us to pay relatively high total rent per square foot that is reflective of our small average store square footage and premium locations within the mall or center. Many of our lease agreements have defined escalating rent provisions over the initial term and any extensions. As our stores mature and as we expand our store base, our lease expense and our cash outlays for rent under our lease agreements will increase. Our substantial operating lease obligations could have significant negative consequences, including:
| • | requiring that an increased portion of our cash from operations and available cash be applied to pay our lease obligations, thus reducing liquidity available for other purposes; |
| • | increasing our vulnerability to adverse general economic and industry conditions; |
| • | limiting our flexibility to plan for or react to changes in our business or in the industry in which we compete; and |
| • | limiting our ability to obtain additional financing. |
We depend on cash flow from operations to pay our lease expenses, finance our growth capital requirements and fulfill our other cash needs. If our business does not generate sufficient cash flow from operating activities to fund these requirements, we may not be able to achieve our growth plans, fund our other liquidity and capital needs or ultimately service our lease expenses, which would harm our business.
If an existing or future store is not profitable, and we decide to close it, we may nonetheless remain committed to perform our obligations under the applicable lease including, among other things, paying the base rent for the balance of the lease term. Moreover, even if a lease has an early cancellation clause, we may not satisfy the contractual requirements for early cancellation under that lease. In addition, as our leases expire, we may fail to negotiate renewals on commercially acceptable terms or at all, which could cause us to close stores in desirable locations. Even if we are able to renew existing leases, the terms of such renewal may not be as attractive as the expiring lease, which would materially and adversely affect our results of operations. Of our 200 company-owned stores as of January 29, 2012, two leases expire in fiscal 2012. Our inability to enter into new leases or renew existing leases on terms acceptable to us or be released from our obligations under leases for stores that we close could materially adversely affect us.
Our franchisees may take actions that could harm our business or brand, and franchise regulations and contracts limit our ability to terminate or replace under-performing franchises.
As of January 29, 2012 we had two franchised stores in the United States and 16 franchised stores in Mexico. We also have an international development agreement with the Alshaya Group to open stores in the Middle East that we entered into on September 2, 2011. Franchisees are independent business operators and are not our employees or agents, and we do not exercise control over the day-to-day operations of their retail stores. We provide training and support to franchisees and set and monitor operational standards, but the quality of franchise store operations may fluctuate or decline due to various factors beyond our control. For example, franchisees may not operate stores in a manner consistent with our standards and requirements, or may not hire and train qualified employees, which could harm their sales and, as a result, harm our results of operations or our brand image.
Franchisees, as independent business operators, may from time to time disagree with us and our strategies regarding the business or our interpretation of our respective rights and obligations under applicable franchise agreements. This may lead to disputes with our franchisees from time to time, regarding the collection of royalty payments or other matters related to the franchisee’s operation of the franchise store. Such disputes could divert the attention of our management from our operations, which could cause our business, financial condition, results of operations or cash flows to suffer.
11
Table of Contents
In addition, as a franchisor, we are subject to US federal, US state and foreign laws regulating the offer and sale of franchises. These laws impose registration and extensive disclosure requirements on the offer and sale of franchises, frequently apply substantive standards to the relationship between franchisor and franchisee and limit the ability of a franchisor to terminate or refuse to renew a franchise. We may therefore be required to retain an underperforming franchise and may be unable to replace the franchisee, which could harm our results of operations or our brand image. We cannot predict the nature and effect of any future legislation or regulation or any changes to existing legislation or regulation on our franchise operations.
The terms of our revolving credit facility may restrict our current and future operations, which could adversely affect our ability to respond to changes in our business and to manage our operations.
Our revolving credit facility contains, and any additional debt financing we may incur would likely contain, covenants requiring us to maintain or adhere to certain financial ratios or limits and covenants that restrict our operations, including limitations on our ability to grant liens, incur additional debt, pay dividends, redeem our common stock, make certain investments and engage in certain merger, consolidation or asset sale transactions. Complying with these covenants could adversely affect our ability to respond to changes in our business and manage our operations. A failure by us to comply with the financial ratios and restrictive covenants contained in our revolving credit facility and any future debt instruments could result in an event of default. Upon the occurrence of an event of default, the lenders could elect to declare all amounts outstanding to be due and payable and exercise other remedies as set forth in our revolving credit facility and any future debt instruments. If the indebtedness under our revolving credit facility and any future debt instruments were to be accelerated, our future financial condition could be materially adversely affected.
Risks Related to Ownership of Our Common Stock
Our stock price may continue to be volatile or may decline regardless of our operating performance or other factors.
Shares of our common stock were sold in our Offering commencing on July 28, 2011 at a price of $17.00 per share, and our common stock has subsequently traded as high as $29.35 and as low as $14.28 during the period from our initial public offering to January 29, 2012. There have also been significant intra-day price swings, and there can be no assurance that the market price of our common stock will not continue to be volatile. The market price of our common stock may fluctuate substantially in response to a number of factors, many of which we cannot control. These factors include:
| • | market conditions or trends in our industry or the economy as a whole and, in particular, in the specialty retail sales environment; |
| • | the timing, performance and successful integration of any new stores that we open; |
| • | seasonal fluctuations; |
| • | changes in key personnel; |
| • | our levels of comparable store sales; |
| • | actions by competitors or other shopping mall tenants; |
| • | the public’s response to press releases or other public announcements by us or third parties, including our filings with the SEC; |
| • | any future guidance we may provide to the public, any changes in such guidance or any difference between our guidance and actual results; and |
| • | future sales of our common stock by our officers, directors or significant stockholders. |
In addition, the stock markets, including the NYSE, have experienced extreme price and volume fluctuations that have affected and continue to affect the market prices of equity securities of many retail companies. In the past, stockholders have instituted securities class action litigation following periods of market volatility. If we were involved in securities litigation, we could incur substantial costs and our resources, and the attention of management could be diverted from our business.
Future sales of our common stock, or the perception in the public markets that these sales may occur, may depress our stock price.
The market price of our common stock could decline significantly as a result of sales of a large number of shares of our common stock in the market. The sales, or the perception that these sales might occur, could depress the market price. These sales, or the possibility that these sales may occur, also might make it more difficult for us to sell equity securities in the future at a time and at a price that we deem appropriate.
As of January 29, 2012, we had 38,281,836 shares of common stock outstanding, which are freely tradable without restriction under the Securities Act of 1933, as amended, except for any shares of common stock held or acquired by our directors, executive officers and other affiliates, the sale of which are restricted under the Securities Act. In addition, shares subject to outstanding options under our 2004 Management Incentive Plan and our 2011 Equity Incentive Plan and shares reserved for future issuance under our 2011 Equity Incentive Plan will become eligible for sale in the public market in the future, subject to certain legal and contractual limitations. If our existing stockholders sell substantial amounts of our common stock in the public market, or if the public perceives that such sales could occur, this could have an adverse impact on the market price of our common stock, even if there is no relationship between such sales and the performance of our business.
Also, in the future, we may issue shares of our common stock in connection with investments or acquisitions. The amount of shares of our common stock issued in connection with an investment or acquisition could constitute a material portion of our then outstanding shares of our common stock.
12
Table of Contents
Approximately 56.2% of our voting power is controlled by one principal stockholder whose interests may conflict with those of our other stockholders.
As of January 29, 2012, Andrew Mack, our founder and Chief Executive Officer, holds approximately 56.2% of our voting power. So long as Mr. Mack continues to hold, directly or indirectly, shares of common stock representing more than 50% of the voting power of our common stock, he will be able to exercise control over all matters requiring stockholder approval, including the election of directors, amendment of our amended and restated certificate of incorporation and approval of significant corporate transactions and will have significant control over our management and policies. Mr. Mack’s control may have the effect of delaying or preventing a change in control of our company or discouraging others from making tender offers for our shares, which could prevent stockholders from receiving a premium for their shares. These actions may be taken even if other stockholders oppose them. The interests of Mr. Mack may not be consistent with your interests as a stockholder.
In addition, a fund advised by Parallel holds approximately 18.1% of our voting power, and has significant influence over our management and policies by virtue of Parallel’s managing partner’s, Barron Fletcher’s, position on our Board of Directors.
Failure to establish and maintain adequate internal controls in accordance with the Sarbanes-Oxley Act of 2002 and other regulations could have a material adverse effect on our business and stock price.
As a public company, we are required to establish and maintain an adequate internal control structure and procedures for financial reporting and to assess the effectiveness of our internal control procedures in order to satisfy the requirements of the Sarbanes-Oxley Act of 2002 (“SOX”). In addition, for the first time, in fiscal 2012, our independent registered public accounting firm will be required to issue a report that addresses the effectiveness of our internal controls over financial reporting. During the course of assessing our internal controls, we or our independent registered public accounting firm may identify deficiencies that we may not be able to remediate in time to meet our deadline for compliance with SOX. Establishing, maintaining and assessing the effectiveness of our internal controls can divert our management’s attention from other matters that are important to the operation of our business. We also expect regulations to continue to increase our legal and financial compliance costs, to make it more difficult to attract and retain qualified officers and members of our Board of Directors, particularly to serve on our audit committee, and to make some activities more difficult, time consuming and costly. We may not be able to conclude on an ongoing basis that we have effective internal controls over financial reporting, or our independent registered public accounting firm may not be able or willing to issue an unqualified report on the effectiveness of our internal controls over financial reporting. If we or our independent registered public accounting firm conclude that our internal controls over financial reporting are not effective, we cannot be certain as to the timing of remediation actions or their effect on our operations because there is presently no precedent available by which to measure compliance adequacy.
If we are unable to conclude that we have effective internal controls over financial reporting, our independent auditors may be unable to provide us with an unqualified report on the effectiveness of our internal controls over financial reporting or we may be required to restate our financial statements or fail to meet our public reporting obligations. As a result, investors could lose confidence in our reported financial information, which could have a negative effect on the trading price of our stock.
In addition, we are subject to compliance with the Payment Card Industry Data Security Standard (PCI DSS) as well as rules for publically traded companies set forth by the New York Stock Exchange. Failure to comply with these regulations could have a material adverse impact on our financial condition or the price of our common stock.
If securities or industry analysts do not publish research or publish inaccurate or unfavorable research about our business, our stock price and trading volume could decline.
The trading market for our common stock is influenced by the research and reports that industry or securities analysts publish about us or our business. If one or more of these analysts ceases coverage of our company or fails to publish reports on us regularly, we could lose visibility in the financial markets, which in turn could cause our stock price or trading volume to decline. Moreover, if our operating results do not meet the expectations of the investor community, or one or more of the analysts who cover our company downgrades our stock, our stock price could decline.
We do not expect to pay any cash dividends for the foreseeable future.
For the foreseeable future, we intend to retain any earnings to finance the development and expansion of our business, and we do not anticipate paying any cash dividends on our common stock. Any determination to pay dividends in the future will be at the discretion of our Board of Directors and will depend upon results of operations, financial condition, contractual restrictions, including under our revolving credit facility and other indebtedness we may incur, restrictions imposed by applicable law and other factors our Board of Directors deems relevant. Accordingly, if you purchase shares, realization of a gain on your investment will depend on the appreciation of the price of our common stock, which may never occur. Investors seeking cash dividends in the foreseeable future should not purchase our common stock.
Certain provisions of our corporate governing documents and Delaware law could discourage, delay or prevent a merger or acquisition at a premium price.
Our amended and restated certificate of incorporation and amended and restated bylaws contain provisions that may make the acquisition of our company more difficult without the approval of our Board of Directors. These include provisions that:
| • | authorize the issuance of undesignated preferred stock, the terms of which may be established and the shares of which may be issued without stockholder approval, and which may include super voting, special approval, dividend, or other rights or preferences superior to the rights of the holders of common stock; |
| • | classify our Board of Directors into three separate classes with staggered terms; |
13
Table of Contents
| • | prohibit stockholders from acting by written consent after Mr. Mack ceases to own more than 50% of the total voting power of our shares, which will then require all stockholder actions to be taken at a meeting of our stockholders after such time; |
| • | provide that the Board of Directors is expressly authorized to make, alter, or repeal our amended and restated bylaws; and |
| • | establish advance notice requirements for nominations for elections to our Board of Directors or for proposing matters that can be acted upon by stockholders at stockholder meetings. |
In addition, we are governed by Section 203 of the Delaware General Corporation Law, which, subject to some specified exceptions, prohibits “business combinations” between a Delaware corporation and an “interested stockholder,” which is generally defined as a stockholder who becomes a beneficial owner of 15% or more of a Delaware corporation’s voting stock, for a three-year period following the date that the stockholder became an interested stockholder. Section 203 could have the effect of delaying, deferring or preventing a change in control that our stockholders might consider to be in their best interests.
These and other provisions of the Delaware General Corporation Law and our amended and restated certificate of incorporation and amended and restated bylaws could delay, defer or prevent us from experiencing a change of control or changes in our Board of Directors and management and may adversely affect our stockholders’ voting and other rights. Any delay or prevention of a change of control transaction or changes in our Board of Directors and management could deter potential acquirers or prevent the completion of a transaction in which our stockholders could receive a substantial premium over the then current market price for their shares of our common stock.
| Item 1B. | Unresolved Staff Comments. |
None.
| Item 2. | Properties. |
We do not own any real property. Our store support center is located in Atlanta, Georgia and is leased under a lease agreement expiring in 2024. The approximately 30,000 square foot space includes a simulated store that provides a forum for training and planning visual and marketing concepts prior to their execution in our stores.
Our approximately 123,000 square foot distribution center is located in Stratford, Connecticut. Our distribution center is leased under a lease agreement expiring in 2016 and 2020 (as to different portions of the facility).
As of January 29, 2012, we operated 200 stores in 39 states, including one store in Canada. All of our stores are leased from third parties, and the leases typically have ten-year terms. Some of our leases have early cancellation clauses, which permit the lease to be terminated by us or the landlord if certain sales levels are not met in specific periods or if a shopping center does not meet specified occupancy standards. In addition to future minimum lease payments, some of our store leases provide for additional rental payments based on a percentage of net sales if sales at the respective stores exceed specified levels, as well as the payment of common area maintenance charges, real property insurance and real estate taxes. Many of our lease agreements have defined escalating rent provisions over the initial term and any extensions.
| Item 3. | Legal Proceedings. |
From time to time in the normal course of business, we are involved in legal proceedings. We evaluate the need for loss accruals under the requirements of the Financial Accounting Standards Board’s (“FASB”) Accounting Standards Codification (“ASC”) Topic No. 450- Contingencies (“ASC 450”). We record an estimated loss for any claim, lawsuit, investigation or proceeding when it is probable that a liability has been incurred and the amount of loss can be reasonably estimated. If the reasonable estimate of a probable loss is a range, and no amount within the range is a better estimate, then we record the minimum amount in the range as the loss accrual. If a loss is not probable or a probable loss cannot be reasonably estimated, no liability is recorded.
On December 28, 2011, a putative class action lawsuit styled Chavez v. Teavana Corp., alleging wage and hour violations of the California Labor Code for General Managers in California, was filed in the Superior Court of California, County of Los Angeles. The plaintiff seeks on behalf of herself and other putative class members, compensatory damages, restitution, punitive and exemplary damages, penalties, interest and other relief. We dispute the material allegations in the complaint and intend to defend the action vigorously. Due to inherent uncertainties of litigation and because the lawsuit is in early procedural stages, we cannot at this time accurately predict the ultimate outcome, or any potential liability, of the matter.
We are also subject to other legal proceedings and claims that arise in the ordinary course of our business. These include claims resulting from “slip and fall” accidents, employment related claims and claims from guests or team members alleging illness or injury or other operational concerns. To date, no claims of these types of litigation, certain of which are covered by insurance policies, have had a material effect on our results of operation. While it is not possible to predict the outcome of these other suits, legal proceedings and claims with certainty, we do not believe that they would have a material adverse effect on our financial position and results of operations.
| Item 4. | Mine Safety Disclosures. |
Inapplicable.
14
Table of Contents
| Item 5. | Market for Registrant’s Common Equity, Related Stockholder Matters and Issuer Purchases of Equity Securities. |
Our common stock has been listed on the NYSE under the symbol “TEA” since July 28, 2011 in connection with our initial public offering, which had a price of $17.00 per share. Before then, there was no public market for our common stock. The following table sets forth the high and low sales prices of our common stock per share, as shown in the New York Stock Exchange Composite Transactions listed in the Wall Street Journal.
Fiscal Year ended January 29, 2012:
| High | Low | |||||||
|
2nd Quarter (commencing July 28, 2011) |
$ | 29.35 | $ | 17.00 | ||||
|
3rd Quarter |
$ | 29.01 | $ | 18.52 | ||||
|
4th Quarter |
$ | 24.07 | $ | 14.28 | ||||
There were approximately 14 common stockholders of record on April 9, 2012.
Dividends
The continued operation and expansion of our business will require substantial funding. Accordingly, we do not anticipate that we will pay any cash dividends on shares of our common stock for the foreseeable future. Any determination to pay dividends in the future will be at the discretion of our Board of Directors and will depend upon results of operations, financial condition, contractual restrictions, including our senior secured credit facility and other indebtedness we may incur, restrictions imposed by applicable law and other factors our Board of Directors deems relevant.
Securities Authorized for Issuance Under Equity Compensation Plans
See Item 12. “Security Ownership of Certain Beneficial Owners and Management and Related Stockholder Matters” for information regarding securities authorized for issuance under our equity compensation plans.
Stock Price Performance Graph
The following graph compares the cumulative stockholder return on our common stock from July 28, 2011 (our first date of trading in connection with our initial public offering) through January 29, 2012, with the return on (i) the S&P Retail Index and (ii) the Russell 3000 Index over the same period. This graph assumes an initial investment of $100 at the closing price on July 28, 2011, in our common stock, the S&P Retail Index and the Russell 3000 Index and assumes the reinvestment of dividends, if any. The graph also assumes that the initial price of our common stock on July 28, 2011, was the closing price of $29.35 per share and that the initial prices of the S&P Retail Index and the Russell 3000 Index on July 28, 2011, were the closing prices on the previous trading day.
The comparisons shown in the graph below are based on historical data. We caution that the stock price performance presented in the graph below is not necessarily indicative of, or is it intended to forecast, the potential future performance of our common stock. Information used in the graph was obtained from a third party website; as such we do not assume responsibility for any errors or omissions in such information.
15
Table of Contents
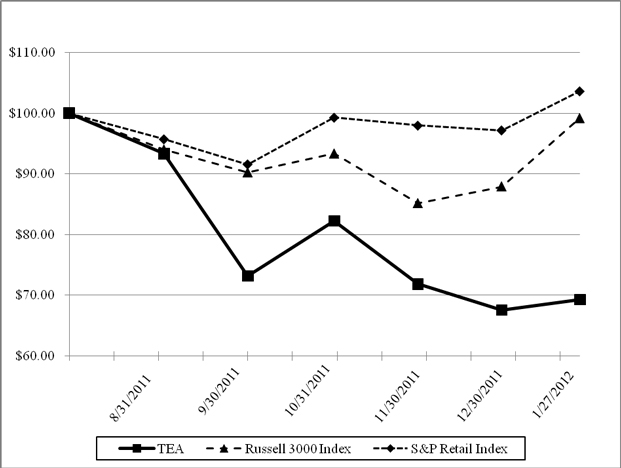
| * | $100 invested on July 28, 2011 in stock or index, including reinvestment of dividends. The 2011 fiscal year ended on January 29, 2012; however the last trading day within the fiscal year was January 27, 2012. |
| 7/28/2011 | 8/31/2011 | 9/30/2011 | 10/31/2011 | 11/30/2010 | 12/30/2011 | 1/27/2012 | ||||||||||||||||||||||
| Teavana Holdings, Inc. |
$ | 100.00 | $ | 93.35 | $ | 73.17 | $ | 82.23 | $ | 71.83 | $ | 67.55 | $ | 69.28 | ||||||||||||||
| Russell 3000 Index |
$ | 100.00 | $ | 93.99 | $ | 90.23 | $ | 93.32 | $ | 85.15 | $ | 87.91 | $ | 99.17 | ||||||||||||||
| S&P Retail Index |
$ | 100.00 | $ | 95.71 | $ | 91.55 | $ | 99.28 | $ | 97.97 | $ | 99.17 | $ | 103.65 | ||||||||||||||
Unregistered Sales of Equity Securities
Not applicable.
Issuer Repurchases of Equity Securities
Not applicable.
16
Table of Contents
| Item 6. | Selected Consolidated Financial Data. |
The following selected financial data are derived from the consolidated financial statements of the company. We have also included certain non-financial operating data to enhance your understanding of our business. The data set forth below should be read in conjunction with “Management’s Discussion and Analysis of Financial Condition and Results of Operations” in Item 7 and the company’s consolidated financial statements and related notes herein. The historical results presented below are not necessarily indicative of results of operations to be expected for any future period.
| Fiscal Year Ended | ||||||||||||||||||||
| January 29, 2012 |
January 30, 2011 |
January 31, 2010 |
February 1, 2009 |
February 3, 2008 |
||||||||||||||||
| (dollars in thousands, except per share and store data) | ||||||||||||||||||||
| Consolidated Statement of Operations Data: |
||||||||||||||||||||
| Net sales |
$ | 168,100 | $ | 124,701 | $ | 90,262 | $ | 63,861 | $ | 47,203 | ||||||||||
| Cost of goods sold (exclusive of depreciation shown separately below) |
60,903 | 46,275 | 36,435 | 27,193 | 19,972 | |||||||||||||||
|
|
|
|
|
|
|
|
|
|
|
|||||||||||
| Gross profit |
107,197 | 78,426 | 53,827 | 36,668 | 27,231 | |||||||||||||||
| Selling, general and administrative expense |
69,681 | 50,571 | 38,142 | 29,242 | 22,232 | |||||||||||||||
| Depreciation and amortization expense |
5,927 | 4,361 | 3,489 | 2,666 | 2,022 | |||||||||||||||
|
|
|
|
|
|
|
|
|
|
|
|||||||||||
| Income from operations |
31,589 | 23,494 | 12,196 | 4,760 | 2,977 | |||||||||||||||
| Interest expense, net |
1,673 | 2,585 | 2,435 | 2,061 | 1,592 | |||||||||||||||
|
|
|
|
|
|
|
|
|
|
|
|||||||||||
| Income before income taxes |
29,916 | 20,909 | 9,761 | 2,699 | 1,385 | |||||||||||||||
| Provision for income taxes |
12,157 | 8,906 | 4,470 | 1,502 | 1,007 | |||||||||||||||
|
|
|
|
|
|
|
|
|
|
|
|||||||||||
| Net income |
$ | 17,759 | $ | 12,003 | $ | 5,291 | $ | 1,197 | $ | 378 | ||||||||||
|
|
|
|
|
|
|
|
|
|
|
|||||||||||
| Net income per share: |
||||||||||||||||||||
| Basic |
$ | 0.47 | $ | 0.33 | $ | 0.14 | $ | 0.03 | $ | 0.01 | ||||||||||
| Diluted |
$ | 0.46 | $ | 0.32 | $ | 0.14 | $ | 0.03 | $ | 0.01 | ||||||||||
| Weighted average shares outstanding: |
||||||||||||||||||||
| Basic |
37,481,072 | 36,749,460 | 36,749,460 | 36,749,460 | 36,749,460 | |||||||||||||||
| Diluted |
38,419,308 | 37,725,067 | 37,322,198 | 37,095,308 | 36,750,645 | |||||||||||||||
| Consolidated Balance Sheet Data (end of period): |
||||||||||||||||||||
| Cash and cash equivalents |
$ | 17,818 | $ | 7,901 | $ | 1,314 | $ | 1,168 | $ | 761 | ||||||||||
| Total assets |
95,618 | 64,126 | 41,767 | 35,353 | 25,535 | |||||||||||||||
| Series A redeemable preferred stock (1) |
— | 12,992 | 10,848 | 9,058 | 7,564 | |||||||||||||||
| Total debt |
— | 1,000 | 1,250 | 5,535 | 875 | |||||||||||||||
| Class B redeemable common stock (2) |
— | 81,401 | 21,888 | 15,808 | 12,160 | |||||||||||||||
| Total stockholders’ (deficit) equity |
$ | 67,002 | $ | (55,059 | ) | $ | (7,706 | ) | $ | (7,086 | ) | $ | (4,842 | ) | ||||||
| Consolidated Statement of Cash Flows Data: |
||||||||||||||||||||
| Net cash provided by (used in): |
||||||||||||||||||||
| Operating activities |
$ | 20,955 | $ | 19,397 | $ | 11,071 | $ | 4,951 | $ | 3,767 | ||||||||||
| Investing activities |
(17,566 | ) | (12,560 | ) | (6,640 | ) | (8,798 | ) | (3,529 | ) | ||||||||||
| Financing activities |
6,525 | (250 | ) | (4,285 | ) | 4,254 | (547 | ) | ||||||||||||
|
|
|
|
|
|
|
|
|
|
|
|||||||||||
| Effect of exchange rates on cash and cash equivalents: |
3 | — | — | — | — | |||||||||||||||
|
|
|
|
|
|
|
|
|
|
|
|||||||||||
| Increase (decrease) in cash and cash equivalents |
$ | 9,917 | $ | 6,587 | $ | 146 | $ | 407 | $ | (309 | ) | |||||||||
|
|
|
|
|
|
|
|
|
|
|
|||||||||||
| Store Data (unaudited): |
||||||||||||||||||||
| Number of stores at end of period |
200 | 146 | 108 | 87 | 59 | |||||||||||||||
| Comparable store sales growth for period, including e-commerce (3) |
8.6 | % | 11.4 | % | 10.7 | % | 6.4 | % | 11.2 | % | ||||||||||
| Comparable store sales growth for period, excluding e-commerce (4) |
5.5 | % | 8.7 | % | 6.9 | % | 3.0 | % | 8.4 | % | ||||||||||
| Average net sales per comparable store (in thousands) (5) |
$ | 913 | $ | 862 | $ | 808 | $ | 783 | $ | 775 | ||||||||||
| Gross square footage at end of period (in thousands) |
184 | 130 | 95 | 77 | 54 | |||||||||||||||
| Sales per gross square foot (6) |
$ | 980 | $ | 994 | $ | 935 | $ | 866 | $ | 860 | ||||||||||
| (1) | Our Series A redeemable preferred stock was issued on December 15, 2004 with a mandatory redemption date upon the earlier of a public offering or December 15, 2011. The Series A redeemable preferred stock had an original redemption value of $10,683 with annual accretion at a rate of 5% and also contained a liquidation preference of $1.00 per share. The liquidation preference, or “Redemption Value,” increased annually based on the accretion of the shares, however, the cumulative annual accretion of the Redemption Value was forgiven at the Redemption Date because we achieved certain financial targets, as specified in our amended and restated certificate of incorporation adopted on the date that the Series A redeemable preferred stock was issued. As such, upon consummation of the Offering, we redeemed all outstanding shares of the Series A redeemable preferred stock for an aggregate Redemption Value of $10,683. The excess accretion above the Redemption Value of the Series A redeemable preferred stock of $3,534 was also reclassified into additional paid-in capital. See Note 5, “Common and Preferred Stock and Stockholders’ Equity,” within our consolidated financial statements included in this Annual Report on Form 10-K. |
| (2) | Because our Class B redeemable common stock was subject to redemption at the option of the holder, it had been historically classified as temporary equity and remeasured at fair value at each reporting period with changes in fair value recorded directly to equity based on the change in the underlying fair value of our common stock. Concurrent with the Offering as described in Note 5, “Common and Preferred Stock and Stockholders’ Equity,” in our consolidated financial statements and footnotes thereto included in this Annual Report on Form 10-K, all shares of our Class B redeemable common stock were converted into shares of Class A common stock, and subsequently common stock, resulting in the corresponding reclassification of the temporary equity balance into additional paid-in capital. |
17
Table of Contents
| (3) | Comparable store sales, including e-commerce, includes comparable store sales from all company-owned stores that have been open for at least 15 full fiscal months and sales from our website www.teavana.com. |
| (4) | Comparable store sales, excluding e-commerce, include net sales from all company-owned stores that have been open for at least 15 full fiscal months. Comparability is typically achieved 12 months after the initial three-month period from the opening during which new stores typically experience higher-than-average sales volumes. |
| (5) | Average net sales per comparable store is calculated by dividing total sales per period for stores open 15 full fiscal months or more as of the beginning of each respective period by the total number of such stores. This methodology excludes the effects of the initial three month period of higher-than-average sales volumes and also excludes e-commerce sales. |
| (6) | Sales per gross square foot is calculated by dividing total net sales for all stores, comparable and non-comparable, by the average gross square footage for the period. Average gross square footage for the period is calculated by dividing the sum of the total gross square footage at the beginning and at the end of each period divided by two. |
18
Table of Contents
| Item 7. | Management’s Discussion and Analysis of Financial Condition and Results of Operations. |
You should read the following discussion together with “Selected Consolidated Financial Data,” and the historical financial statements and related notes included elsewhere in this Annual Report on Form 10-K. The statements in this discussion regarding industry outlook, our expectations regarding our future performance, liquidity and capital resources and other non-historical statements in this discussion are forward-looking statements within the meaning of the Private Securities Litigation Reform Act of 1995. These forward-looking statements are subject to numerous risks and uncertainties, including, but not limited to, the risks and uncertainties described in Part I — Item 1A “Risk Factors”. Our actual results may differ materially from those contained in or implied by any forward-looking statements.
We operate on a fiscal calendar widely used by the retail industry that results in a given fiscal year consisting of a 52- or 53-week period ending on the Sunday closest to January 31 of the following year. For example, references to “fiscal 2011” refer to the fiscal year ended January 29, 2012. Fiscal 2011, 2010 and 2009 all contain 52 weeks.
Overview
Teavana is a specialty retailer offering more than 100 varieties of premium loose-leaf teas, authentic artisanal tea wares and other tea-related merchandise. We offer our products through 200 company-owned stores in 39 states and Canada and 18 franchised stores primarily in Mexico, as well as through our website, www.teavana.com.
We have experienced sales and profit growth during the last five years. We increased our sales from $47.2 million in fiscal 2007 to $168.1 million in fiscal 2011, representing a 37.4 % compound annual growth rate. Over that same period, we more than tripled our store base from 59 stores to 200 stores. In fiscal 2011, our sales grew 34.8 % over fiscal 2010, while our comparable store sales, including e-commerce, increased 8.6%. Comparable store sales, excluding e-commerce, increased by 5.5% during fiscal 2011 over comparable store sales for fiscal 2010. Our net income was $17.8 million in fiscal 2011, representing a 48.0% growth rate over fiscal 2010. In fiscal 2011, our stores averaged sales per gross square foot of $980 as compared to $994 in fiscal 2010.
We intend to continue our profitable growth in the future. We believe that there is significant opportunity to expand our store base in the United States and Canada from 200 locations to at least 500 company-owned stores by fiscal 2015, having already identified the malls, lifestyle centers and other high-sales-volume retail venues that are suitable locations in which to open Teavana stores. As of January 29, 2012, we have executed lease agreements for the opening of 30 stores in fiscal 2012 and one store in fiscal 2013, and we plan to open approximately 60 stores in fiscal 2012. We have not executed lease agreements for the remaining store locations we need to reach our expansion target of at least 500 stores by fiscal 2015. We expect to continue to drive our comparable store sales by increasing the size and frequency of purchases by our existing customers and attracting new customers. We intend to expand our online presence, which we believe is an extension of our brand and retail stores that allow us to reach new and existing customers and build brand awareness in locations where we currently do not have stores. Finally, given the worldwide popularity of tea, we will continue to selectively pursue international expansion, which we believe represents a compelling opportunity for additional growth over the long-term.
We have a proven and highly profitable store model that has produced consistent financial results and returns. We seek to open stores in locations that reinforce the premium image of our brand by targeting high traffic locations within malls, lifestyle centers and other high-sales-volume retail venues. New stores have historically averaged a payback period of less than one and a half years. Our current store base is balanced across all four geographic regions of the country, with each region producing results approximately in line with the company average. As we continue to expand our store base, we will target an increasing number of shopping malls with lower average sales per square foot than the malls in which we currently are located. As a result, our new store model anticipates a target store size of 900 to 1,000 square feet that achieves annual sales of $600,000 to $700,000 in the first year of operation, which is below the historical average for our new stores. Our new store model also assumes an average new store investment of approximately $200,000 to $250,000. Our new store investment includes our store buildout (net of tenant allowances), inventory and cash pre-opening costs. We anticipate our new store investment under our new store model will be lower than our historical average for new stores given that our average build out cost per new store has decreased and our average tenant allowance per new store has increased in recent years. We target an average payback period of 18 months on our new store investment.
Given that we forecast the number of stores that we open each year to become a smaller percentage of our existing store base, first-year sales to be lower than we have historically experienced, and comparable store sales to grow at less than historical rates, we anticipate that our future growth in sales and operating margins will be at less than historical levels. Although we expect our leverage of corporate and other fixed costs to increase in the future, we anticipate that our operating margins will grow at less than our historical growth rate due to increased costs to operate as a public company, including payroll, legal, insurance and other regulatory costs, as well as, to a lesser extent, growth in other administrative costs as we selectively add to our store support functions to maintain our continued growth.
Our planned store expansion will place increased demands on our operational, managerial, administrative and other resources. Managing our growth effectively will require us to continue to enhance our store management systems, financial and management controls and information technology systems and to hire, train and retain store management and store support center personnel.
We have recently invested capital to continue building the infrastructure necessary to support our future growth, and we expect to incur additional capital expenditures related to the expansion of and improvements to our infrastructure in future periods. In fiscal 2011, we continued to expand our store support center and distribution center. We will continue to evaluate the need for further expansion of our distribution center and/or addition of a second distribution center in another region of the United States. The timing and amount of investments in our infrastructure could affect the comparability of our results of operations in future periods.
19
Table of Contents
How We Assess the Performance of Our Business
In assessing the performance of our business and our progress against our growth strategy, we consider a variety of performance and financial measures. The key measures that we utilize to evaluate the performance of our business and the execution of our strategy are set forth below:
Net Sales
Net sales constitute gross sales net of any returns and discounts. Net sales consist of sales from comparable stores and non-comparable stores, and other sales.
The specialty retail industry is cyclical, and consequently our net sales are affected by general economic conditions. Purchases of premium loose-leaf tea and tea-related merchandise can be impacted by a number of factors that influence the levels of consumer spending, including economic conditions and the level of disposable consumer income, consumer debt, interest rates and consumer confidence.
Our business is also seasonal, and as a result, our net sales fluctuate from quarter to quarter. Net sales are traditionally highest in the fourth fiscal quarter, which includes the holiday sales period from Thanksgiving through the end of December, and tend to be lowest in the second and third fiscal quarters.
Comparable store sales. Comparable store sales, excluding e-commerce, include net sales from all company-owned stores that have been open for at least 15 full fiscal months, as in our experience, our new stores generally open with higher than average sales volumes in the initial months following their opening. This trend usually extends for a period of at least three months, and comparability is typically achieved 12 months after the initial three-month period from the date of opening. Comparable store sales, including e-commerce, includes sales from all company-owned stores that have been open for at least 15 full fiscal months and sales from our website, www.teavana.com. There may be variations in the way in which other specialty retailers calculate comparable or “same store” sales. As a result, data in this Annual Report on Form 10-K regarding our comparable store sales may not be comparable to similarly titled data made available from other retailers.
Measuring the change in year-over-year comparable store sales allows us to evaluate how our stores, including e-commerce, are performing. Various factors affect comparable store sales, including:
| • | consumer preference, buying and economic trends; |
| • | our ability to anticipate and respond effectively to consumer preference, buy and economic trends; |
| • | our ability to provide a product offering that generates new and repeat visits to our stores; |
| • | the customer experience we provide in our stores; |
| • | the level of traffic near our locations in the shopping malls and centers in which we operate; |
| • | the number of customer transactions and the average ticket in our stores; |
| • | the pricing of our teas and tea related merchandise; |
| • | the length of time of individual store operations; |
| • | our ability to obtain and distribute products efficiently; |
| • | our opening of new stores in the vicinity of our existing stores; and |
| • | the opening or closing of competitor stores in the vicinity of our stores. |
Non-comparable store sales. Non-comparable store sales include sales from stores not included in comparable store sales. As we pursue our growth strategy, we expect that a significant percentage of our net sales increase will continue to come from non-comparable store sales. Accordingly, non-comparable store sales are an additional key measure we use to assess the success of our growth strategy.
Adverse economic conditions in fiscal 2008 resulted in slightly lower comparable store sales growth than in prior periods due to decreased levels of consumer spending, disposable income and confidence. The reduced growth in comparable store sales in fiscal 2008 was offset by our growth in non-comparable store sales resulting in total sales growth in fiscal 2008 consistent with pre-economic downturn levels. Improved economic conditions in fiscal 2009-2010 helped drive an increase in our comparable store sales growth. We do not anticipate economic conditions in the immediate future to have a significant impact, positively or negatively, on our growth.
20
Table of Contents
Other sales. Other sales include sales through our website at www.teavana.com, sales related to our franchised operations, gift card breakage revenue and, through the end of fiscal 2010, wholesale and e-commerce sales of teas and merchandise under the brand name SpecialTeas (we ceased material selling under the SpecialTeas brand name on January 30, 2011). Sales related to our franchised operations consist of initial franchise fees received in connection with newly franchised stores that are recognized as revenue when the obligations under the related franchise agreement are met, continuing royalty fees, wholesale sales of our teas and tea-related merchandise to franchise stores and recognition of deferred revenue related to the initial development fee paid at inception by our business partner under our international development agreements.
Gross Profit
Gross profit is equal to our net sales minus our cost of goods sold. Gross margin is gross profit as a percentage of our net sales. Cost of goods sold includes the direct costs of our products, freight and shipping costs, distribution center costs and occupancy costs for stores in operation. The components of cost of goods sold may not be comparable to those of other retailers.
Our cost of goods sold is substantially higher in higher-volume quarters because cost of goods sold generally increases as net sales increases. Changes in the product mix of sales, such as shifts in the proportion of tea to merchandise sales, may also impact our overall gross margin. As our stores mature, they have historically experienced a sales mix shift away from tea-related merchandise towards higher margin loose-leaf teas, increasing overall gross margins. In general, this trend is the result of the evolution in our customers’ buying patterns as they graduate from purchases with a greater focus on merchandise with which to prepare and enjoy tea towards transactions centered more on replenishing their favorite teas and experimenting with new blends.
Selling, General and Administrative Expense
Selling, general and administrative expense consists primarily of store operating expenses, store pre-opening expenses and other administrative expenses. Store operating expenses are generally the largest component of selling, general and administrative expense and consist of all store expenses other than occupancy-related costs (which are included in cost of goods sold). Store pre-opening costs are expensed as incurred and represent the costs of a store prior to its opening date including occupancy, payroll and other operating costs. Other administrative expenses include professional fees, travel costs, occupancy and payroll costs (both cash and stock-based) for our store support center and other administrative expenses.
Selling, general and administrative expense typically does not vary proportionally with net sales to the same degree as our cost of goods sold. Accordingly, this expense as a percentage of net sales is usually higher in lower-volume quarters and lower in higher-volume quarters. We expect that our selling, general and administrative expense will increase in future periods as we selectively add to our corporate and store support functions to support continuing growth and, to a lesser extent, to cover additional legal, accounting, insurance and other regulatory costs as a result of being a public company. The components of selling, general and administrative expense may not be comparable to those of other retailers.
Depreciation and Amortization Expense
Depreciation and amortization expense consists primarily of depreciation of our leasehold improvements and equipment and to a lesser extent, amortization of our finite-lived assets. We expect that depreciation expense will continue to increase as we open more stores.
21
Table of Contents
Results of Operations
The following tables summarize key components of our results of operations for the periods indicated:
| Fiscal Year Ended | ||||||||||||
| January 29, 2012 | January 30, 2011 | January 31, 2010 | ||||||||||
| (dollars in thousands, except per share and store data) | ||||||||||||
| Consolidated Statement of Operations Data: |
||||||||||||
| Net sales |
$ | 168,100 | $ | 124,701 | $ | 90,262 | ||||||
| Cost of goods sold (exclusive of depreciation shown separately below) |
60,903 | 46,275 | 36,435 | |||||||||
|
|
|
|
|
|
|
|||||||
| Gross profit |
107,197 | 78,426 | 53,827 | |||||||||
| Selling, general and administrative expense |
69,681 | 50,571 | 38,142 | |||||||||
| Depreciation and amortization expense |
5,927 | 4,361 | 3,489 | |||||||||
|
|
|
|
|
|
|
|||||||
| Income from operations |
31,589 | 23,494 | 12,196 | |||||||||
| Interest expense, net |
1,673 | 2,585 | 2,435 | |||||||||
|
|
|
|
|
|
|
|||||||
| Income before income taxes |
29,916 | 20,909 | 9,761 | |||||||||
| Provision for income taxes |
12,157 | 8,906 | 4,470 | |||||||||
|
|
|
|
|
|
|
|||||||
| Net income |
$ | 17,759 | $ | 12,003 | $ | 5,291 | ||||||
|
|
|
|
|
|
|
|||||||
| Net income per share: |
||||||||||||
| Basic |
$ | 0.47 | $ | 0.33 | $ | 0.14 | ||||||
| Diluted |
$ | 0.46 | $ | 0.32 | $ | 0.14 | ||||||
| Weighted average shares outstanding: |
||||||||||||
| Basic |
37,481,072 | 36,749,460 | 36,749,460 | |||||||||
| Diluted |
38,419,308 | 37,725,067 | 37,322,198 | |||||||||
| Percentage of Net Sales: |
||||||||||||
| Net sales |
100.0 | % | 100.0 | % | 100.0 | % | ||||||
| Cost of goods sold (exclusive of depreciation shown separately below) |
36.2 | % | 37.1 | % | 40.4 | % | ||||||
|
|
|
|
|
|
|
|||||||
| Gross profit |
63.8 | % | 62.9 | % | 59.6 | % | ||||||
| Selling, general and administrative expense |
41.5 | % | 40.6 | % | 42.2 | % | ||||||
| Depreciation and amortization expense |
3.5 | % | 3.5 | % | 3.9 | % | ||||||
|
|
|
|
|
|
|
|||||||
| Income from operations |
18.8 | % | 18.8 | % | 13.5 | % | ||||||
| Interest expense, net |
1.0 | % | 2.1 | % | 2.7 | % | ||||||
|
|
|
|
|
|
|
|||||||
| Income before income taxes |
17.8 | % | 16.8 | % | 10.8 | % | ||||||
| Provision for income taxes |
7.2 | % | 7.1 | % | 4.9 | % | ||||||
|
|
|
|
|
|
|
|||||||
| Net income |
10.6 | % | 9.6 | % | 5.9 | % | ||||||
|
|
|
|
|
|
|
|||||||
| Store Data (unaudited): |
||||||||||||
| Number of stores at end of period |
200 | 146 | 108 | |||||||||
| Comparable store sales growth for period, including e-commerce (1) |
8.6 | % | 11.4 | % | 10.7 | % | ||||||
| Comparable store sales growth for period, excluding e-commerce (2) |
5.5 | % | 8.7 | % | 6.9 | % | ||||||
| Average net sales per comparable store (in thousands) (3) |
$ | 913 | $ | 862 | $ | 808 | ||||||
| Gross square footage at end of period (in thousands) |
184 | 130 | 95 | |||||||||
| Sales per gross square foot (4) |
$ | 980 | $ | 994 | $ | 935 | ||||||
| (1) | Includes comparable store sales from all company-owned stores that have been open for at least 15 full fiscal months and sales from our website www.teavana.com. |
| (2) | Comparable store sales, excluding e-commerce, include net sales from all company-owned stores that have been open for at least 15 full fiscal months. Comparability is typically achieved 12 months after the initial three-month period from opening during which new stores typically experience higher-than-average sales volumes. |
| (3) | Average net sales per comparable store is calculated by dividing total sales per period for stores open 15 full fiscal months or more as of the beginning of each respective fiscal period by the total number of such stores. This methodology excludes the effects of the initial three-month period of higher-than-average sales volumes and also excludes e-commerce sales. |
| (4) | Sales per gross square foot is calculated by dividing total net sales for all stores, excluding e-commerce, by the average gross square footage for the period. Average gross square footage for the period is calculated by dividing the sum of the total gross square footage at the beginning and at the end of each period by two. |
22
Table of Contents
| Fiscal Year Ended | ||||||||||||
| January 29, 2012 | January 30, 2011 | January 31, 2010 | ||||||||||
| Product Categories (unaudited): |
||||||||||||
| Tea |
55 | % | 56 | % | 54 | % | ||||||
| Merchandise |
41 | % | 40 | % | 42 | % | ||||||
| Beverage |
4 | % | 4 | % | 4 | % | ||||||
|
|
|
|
|
|
|
|||||||
| 100 | % | 100 | % | 100 | % | |||||||
Fiscal 2011 Compared to Fiscal 2010
Net Sales
Net sales increased by 34.8%, or $43.4 million, to $168.1 million in fiscal 2011 from $124.7 million in fiscal 2010, resulting from a $36.4 million increase in non-comparable store sales, a $5.6 million increase in comparable store sales, excluding e-commerce, and a $1.4 million increase in other sales.
Non-comparable store sales increased by $36.4 million in fiscal 2011 due to sales from 54 new stores that were not open in fiscal 2010 and sales from 8 stores that had not yet become comparable stores in fiscal 2011. There were 62 non-comparable stores as of January 29, 2012 compared to 41 as of January 30, 2011.
Comparable store sales, including e-commerce, increased by 8.6% in fiscal 2011 due to a 6.4% increase in the average transaction size at our comparable stores and through our website, coupled with a 2.2% increase in the number of transactions due primarily to the growth of our e-commerce business.
Comparable store sales, excluding e-commerce, increased by 5.5%, or $5.6 million, in fiscal 2011 due to a 6.1% increase in the average transaction size at our comparable stores and a 0.6% decrease in the number of transactions. Transaction size at our comparable stores increased to $40 in fiscal 2011 from $38 in fiscal 2010. There were 138 comparable stores open as of January 29, 2012 compared to 105 as of January 30, 2011.
Other sales increased by $1.4 million due primarily to an increase of $4.0 million in e-commerce sales, partially offset by a decrease of $2.6 million in other sales driven primarily by the elimination of the SpecialTeas brand at the end of fiscal 2010.
Gross Profit
Gross profit increased by 36.7%, or $28.8 million, to $107.2 million in fiscal 2011 from $78.4 million in fiscal 2010. Gross margin increased to 63.8% in fiscal 2011 from 62.9% in fiscal 2010, due primarily to an increase in product margins primarily in our merchandise category attributable to our direct sourcing initiative. We do not expect the increase in product margins experienced during the previous two fiscal years to continue as the gains from the initiative driving these increases have been fully realized.
Selling, General and Administrative Expense
Selling, general and administrative expense increased by 37.8%, or $19.1 million, to $69.7 million in fiscal 2011 from $50.6 million in fiscal 2010. As a percentage of net sales, selling, general and administrative expense increased to 41.5% in fiscal 2011 from 40.6% in fiscal 2010. The components that contributed to this increase are described below.
Store operating expenses increased by 39.3%, or $13.4 million, in fiscal 2011 due primarily to the operation of 200 stores as of January 29, 2012 compared to the operation of 146 stores as of January 30, 2011. As a percentage of net sales, store operating expenses increased to 28.2% in fiscal 2011 from 27.3% in fiscal 2010 due partially to net sales from stores comprising a larger percentage of our total net sales driven by the elimination of the SpecialTeas brand at the end of fiscal 2010. Store operating expenses as a percentage of net sales from stores increased to 30.8% in fiscal 2011 from 30.4% in fiscal 2010 due primarily to higher training and related costs.
Store pre-opening expenses increased by 46.2%, or $0.8 million, in fiscal 2011 due primarily to the timing of store openings and the number of store openings. We opened 54 new stores in fiscal 2011 compared to 38 new stores in fiscal 2010. As a percentage of net sales, store pre-opening expenses increased to 1.4% in fiscal 2011 from 1.3% in fiscal 2010 due primarily to the timing of store openings.
Other administrative expenses increased by 33.4%, or $4.9 million, in fiscal 2011 due primarily to the increased cost to support 200 stores in fiscal 2011 compared to 146 stores in fiscal 2010, coupled with additional costs associated with being a public company. As a percentage of net sales, other administrative expenses remained relatively flat at 11.9% for fiscal 2011 as compared to 12.0% in fiscal 2010.
23
Table of Contents
Depreciation and Amortization Expense
Depreciation and amortization expense increased by 35.9%, or $1.5 million, to $5.9 million in fiscal 2011 from $4.4 million in fiscal 2010. The increase in depreciation and amortization expense was due primarily to approximately $5.0 million in additional capital expenditures during fiscal 2011 as compared to fiscal 2010. As a percentage of net sales, depreciation and amortization expense remained flat at 3.5% for fiscal 2011 and 2010.
Interest Expense, Net
Interest expense, net decreased by 35.3%, or $0.9 million, to $1.7 million in fiscal 2011 from $2.6 million in fiscal 2010 due primarily to the elimination of approximately $0.9 million in accretion from our Series A redeemable preferred stock. The Series A redeemable preferred stock was redeemed at the consummation of our Offering on August 2, 2011, as more fully explained in Note 5 – “Common and Preferred Stock and Stockholders’ Equity” in the notes to our consolidated financial statements included in this Annual Report on Form 10-K.
Provision for Income Taxes
Our provision for income taxes increased by 36.5%, or $3.3 million, to $12.2 million in fiscal 2011 from $8.9 million in fiscal 2010. The increase in our provision for income taxes was due primarily to the $9.0 million increase in our income before income taxes. Our effective tax rates were 40.6% and 42.6% for fiscal 2011 and fiscal 2010, respectively. There was a favorable impact to the effective tax rate for fiscal 2011 as compared to fiscal 2010 as a result of the non-deductible accretion related to our Series A redeemable preferred stock representing a lower percentage of our income before income taxes in fiscal 2011 than in fiscal 2010. This decrease was partially offset by an increase in the overall state income tax rate, which is primarily attributable to increased profitability in higher tax rate state jurisdictions in which income is earned. The Series A redeemable preferred stock was fully redeemed at the consummation of the Offering as more fully explained in Note 5 – “Common and Preferred Stock and Stockholders’ Equity” included in this Annual Report on Form 10-K, and will not subsequently impact our effective tax rate.
Net Income
As a result of the foregoing, net income increased by 48.0%, or $5.8 million, to $17.8 million in fiscal 2011 from $12.0 million in fiscal 2010. Net income as a percentage of net sales increased to 10.6% in fiscal 2011 from 9.6% in fiscal 2010.
Fiscal 2010 Compared to Fiscal 2009
Net Sales
Net sales increased by 38.2%, or $34.4 million, to $124.7 million in fiscal 2010 from $90.3 million in fiscal 2009, resulting from a $24.8 million increase in non-comparable store sales, a $6.5 million increase in comparable store sales and a $3.1 million increase in other sales.
Non-comparable store sales increased by $24.8 million in fiscal 2010 due to sales from 38 new stores that were not open in fiscal 2009 and sales from three stores that had not yet become comparable stores in fiscal 2010. There were 41 non-comparable stores as of January 30, 2011 compared to 31 as of January 31, 2010.
Comparable store sales, including e-commerce, increased by 11.4% in fiscal 2010 due to a 7.2% increase in the average transaction size at our comparable stores and through our website, coupled with a 4.6% increase in the number of transactions due primarily to the growth in our e-commerce sales.
Comparable store sales, excluding e-commerce, increased by 8.7%, or $6.5 million, in fiscal 2010 due to an 8.1% increase in the average transaction size at our comparable stores and a 0.6% increase in the number of transactions. Transaction size at our comparable stores increased to $36 in fiscal 2010 from $33 in fiscal 2009. There were 105 comparable stores open as of January 30, 2011 compared to 77 as of January 31, 2010.
Other sales increased by $3.1 million due primarily to an increase of $2.6 million in e-commerce sales and to a lesser extent, increases in sales to and royalties from franchisees and revenue from gift-card breakage.
The increase in the tea category as a percentage of net sales and the corresponding decrease in the merchandise category in fiscal 2010 were due primarily to the sales mix shift towards tea that our stores generally experience as they mature.
Gross Profit
Gross profit increased by 45.7%, or $24.6 million, to $78.4 million in fiscal 2010 from $53.8 million in fiscal 2009. Gross margin increased to 62.9% in fiscal 2010 from 59.6% in fiscal 2009, due primarily to the sales mix shift from merchandise towards higher-margin tea that our stores generally experience as they mature. The improvement in gross margin was also driven by an increase in product margins primarily in our merchandise category, as well as a reduction of our store occupancy costs as a percentage of net sales.
Selling, General and Administrative Expense
Selling, general and administrative expense increased by 32.6%, or $12.4 million, to $50.6 million in fiscal 2010 from $38.1 million in fiscal 2009. As a percentage of net sales, selling, general and administrative expense decreased to 40.6% in fiscal 2010 from 42.2% in fiscal 2009. The components that contributed to this increase are described below.
24
Table of Contents
Store operating expenses increased by 32.9%, or $8.4 million, in fiscal 2010 due primarily to the operation of 146 stores as of January 30, 2011 compared to the operation of 108 stores as of January 31, 2010. As a percentage of net sales, store operating expenses decreased to 27.3% in fiscal 2010 from 28.3% in fiscal 2009.
Store pre-opening expenses increased by 96.0%, or $0.8 million, in fiscal 2010 due primarily to the timing of the opening of 38 new stores in fiscal 2010 compared to the timing of the opening of 21 new stores in fiscal 2009. As a percentage of net sales, store pre-opening expenses increased to 1.3% in fiscal 2010 from 0.9% in fiscal 2009.
Other administrative expenses increased by 27.3%, or $3.2 million, in fiscal 2010 due primarily to the increased cost to support 146 stores in fiscal 2010 compared to 108 stores in fiscal 2009, including an increase in occupancy expense attributable to the relocation and expansion of our store support center in fiscal 2010. As a percentage of net sales, other administrative expenses decreased to 12.0% in fiscal 2010 from 13.0% in fiscal 2009.
Depreciation and Amortization Expense
Depreciation and amortization expense increased by 25.0%, or $0.9 million, to $4.4 million in fiscal 2010 from $3.5 million in fiscal 2009. The increase in depreciation and amortization expense was due primarily to capital expenditures of $12.6 million incurred in fiscal 2010 to build new stores and, to a lesser extent, for leasehold improvements at our new store support center. As a percentage of net sales, depreciation and amortization expense decreased to 3.5% in fiscal 2010 from 3.9% in fiscal 2009.
Interest Expense, Net
Interest expense, net increased by 6.2%, or $0.2 million, to $2.6 million in fiscal 2010 from $2.4 million in fiscal 2009 due primarily to an increase of approximately $0.4 million in accretion from our Series A redeemable preferred stock, partially offset by a decrease in interest expense of approximately $0.2 million on our revolving credit facility due to a lower average balance of borrowings throughout fiscal 2010. The Series A redeemable preferred stock was redeemed at the consummation of our Offering as more fully explained in Note 5 – “Common and Preferred Stock and Stockholders Equity,” in the notes to our consolidated financial statements included in this Annual Report on Form 10-K.
Provision for Income Taxes
Our provision for income taxes increased by 99.2%, or $4.4 million, to $8.9 million in fiscal 2010 from $4.5 million in fiscal 2009. The increase in our provision for income taxes was due primarily to the $11.1 million increase in our income before income taxes. Our effective tax rates were 42.6% and 45.8% for fiscal 2010 and fiscal 2009, respectively. Our effective tax rate decreased due primarily to non-deductible accretion related to our Series A redeemable preferred stock representing a lower percentage of our income before income taxes in fiscal 2010 than in fiscal 2009. The Series A redeemable preferred stock was redeemed at the consummation of our Offering, as more fully explained in Note 5 – “Common and Preferred Stock and Stockholders’ Equity,” in the notes to our consolidated financial statements included in this Annual Report on Form 10-K and will not impact our effective tax rate in periods subsequent to the Offering.
Net Income
As a result of the foregoing, net income increased by 126.9%, or $6.7 million, to $12.0 million in fiscal 2010 from $5.3 million in fiscal 2009. Net income as a percentage of net sales increased to 9.6% in fiscal 2010 from 5.9% in fiscal 2009.
Liquidity and Capital Resources
Our primary sources of liquidity are cash flows from operations and borrowings under our revolving credit facility. Our primary cash needs are for capital expenditures and working capital needs.
Capital expenditures typically vary depending on the timing of new store openings and infrastructure-related investments. During fiscal 2012, we plan to spend approximately $20.0 million on capital expenditures. We expect to devote approximately 80% of this capital expenditure budget to construct and open approximately 60 new stores and renovate a small number of existing stores, with the remainder projected to be spent primarily on continued investment in our information technology systems and on the expansion and improvement of our distribution center.
Our primary working capital requirements are for the purchase of inventory and payment of payroll, rent and other store operating costs. Our working capital requirements fluctuate during the year, rising in the second and third fiscal quarters as we take title to increasing quantities of inventory in anticipation of our peak shopping season in the fourth fiscal quarter. Fluctuations in working capital are also driven by the timing of new store openings.
Historically, we have funded our capital expenditures and working capital requirements during the fiscal year with borrowings under our revolving credit facility, which we have typically paid down at the end of the fiscal year with cash generated during our peak selling season in the fourth quarter. Our utilization of our revolving credit facility, and therefore the amount of indebtedness outstanding under it, has tended to be highest in the beginning of the fourth quarter of each fiscal year.
We believe that our cash position and net cash provided by operating activities and availability under our revolving credit facility will be adequate to finance our planned capital expenditures and working capital requirements for the foreseeable future.
25
Table of Contents
Cash Flows
A summary of our cash flows provided by and used in operating, investing and financing activities is presented in the following table:
| Fiscal Year Ended | ||||||||||||
| January 29, 2012 | January 30, 2011 | January 31, 2010 | ||||||||||
| (dollars in thousands) | ||||||||||||
| Cash flows provided by (used in): |
||||||||||||
| Operating activities |
$ | 20,955 | $ | 19,397 | $ | 11,071 | ||||||
| Investing activities |
(17,566 | ) | (12,560 | ) | (6,640 | ) | ||||||
| Financing activities |
6,525 | (250 | ) | (4,285 | ) | |||||||
|
|
|
|
|
|
|
|||||||
| Effect of exchange rates on cash and cash equivalents |
3 | — | — | |||||||||
|
|
|
|
|
|
|
|||||||
| Increases in cash and cash equivalents |
$ | 9,917 | $ | 6,587 | $ | 146 | ||||||
|
|
|
|
|
|
|
|||||||
Operating Activities
Cash flows from operating activities consist primarily of net income adjusted for non-cash items, including depreciation and amortization expense, non-cash interest expense, stock-based compensation expense, deferred taxes and the effect of working capital changes.
| Fiscal Year Ended | ||||||||||||
| January 29, 2012 | January 30, 2011 | January 31, 2010 | ||||||||||
| (dollars in thousands) | ||||||||||||
| Cash flows from operating activities: |
||||||||||||
| Net income |
$ | 17,759 | $ | 12,003 | $ | 5,291 | ||||||
| Adjustments to reconcile net income to net cash provided by operating activities: |
||||||||||||
| Depreciation and amortization expense |
5,927 | 4,361 | 3,489 | |||||||||
| Non-cash interest expense |
1,327 | 2,279 | 1,925 | |||||||||
| Stock-based compensation |
790 | 157 | 169 | |||||||||
| Excess tax benefit from stock option exercises |
(2,925 | ) | — | — | ||||||||
| Deferred income taxes |
1,940 | (253 | ) | 532 | ||||||||
| Other |
160 | 130 | — | |||||||||
| Change in working capital |
(4,023 | ) | 720 | (335 | ) | |||||||
|
|
|
|
|
|
|
|||||||
| Net cash provided by operating activities |
20,955 | $ | 19,397 | $ | 11,071 | |||||||
|
|
|
|
|
|
|
|||||||
Net cash provided by operating activities increased by $1.6 million to $21.0 million in fiscal 2011 from $19.4 million in fiscal 2010. This increase was primarily due to a $5.8 million increase in net income, partially offset by an increase in cash used by working capital components less the net effect of the other adjustments detailed in the table above. The increase in cash used by net working capital components at the end of fiscal 2011 is primarily related to additional inventory and vendor purchases and other prepayments, partially offset by increases in our deferred rent, deferred tax liability and accounts payable balances all associated with the growth of our business.
Net cash provided by operating activities increased by $8.3 million to $19.4 million in fiscal 2010 from $11.1 million in fiscal 2009, due primarily to a $6.7 million increase in net income and, to a lesser extent, a $2.4 million increase in depreciation and amortization expense, non-cash interest expense, change in working capital and other, partially offset by a decrease of approximately $0.8 million related to deferred income taxes and stock-based compensation.
Investing Activities
Cash flows from investing activities consist primarily of capital expenditures for new and, to a lesser extent, existing stores, as well as for investments in our store support center, information technology systems and our distribution center to support our planned growth.
Capital expenditures increased by $5.0 million, to $17.6 million in fiscal 2011 from $12.6 million in fiscal 2010. This increase was due primarily to the opening of 54 new stores, and to a lesser extent, the expansion of our store support center and expansion and improvement of our distribution center during fiscal 2011. We opened 54 new stores during fiscal 2011 as compared to 38 stores during fiscal 2010.
Capital expenditures increased by $6.0 million, to $12.6 million in fiscal 2010 from $6.6 million in fiscal 2009. This increase was due primarily to the opening of 38 new stores, and to a lesser extent, to the relocation and expansion of our store support center.
26
Table of Contents
Financing Activities
Cash flows from financing activities consist primarily of borrowings and payments on our revolving credit facility and its related financing costs. In addition, we completed our Offering on August 2, 2011, which resulted in net proceeds to us of $15.1 million after deducting underwriting discounts and other legal and related costs of the transaction.
| Fiscal Year Ended | ||||||||||||
| January 29, 2012 | January 30, 2011 | January 31, 2010 | ||||||||||
| (dollars in thousands) | ||||||||||||
| Cash flows from financing activities: |
||||||||||||
| Proceeds from revolving credit facility |
$ | 181,414 | $ | 132,239 | $ | 93,980 | ||||||
| Payments on revolving credit facility |
(182,414 | ) | (132,239 | ) | (98,265 | ) | ||||||
| Payments on note payable |
— | (250 | ) | — | ||||||||
| Proceeds from initial public offering, net |
15,079 | — | — | |||||||||
| Proceeds from stock options exercised |
637 | — | — | |||||||||
| Payment to redeem Series A redeemable preferred stock liability |
(10,683 | ) | — | — | ||||||||
| Cash paid for financing costs |
(433 | ) | — | — | ||||||||
| Excess tax benefit from stock option exercises |
2,925 | — | — | |||||||||
|
|
|
|
|
|
|
|||||||
| Net cash provided by (used in) financing activities |
$ | 6,525 | $ | (250 | ) | $ | (4,285 | ) | ||||
|
|
|
|
|
|
|
|||||||
Net cash provided by financing activities increased by $6.8 million during fiscal 2011 as a result of $6.5 million in cash provided by financing activities compared to a $0.3 million use of cash from financing activities in fiscal 2010. This increase was primarily attributable to the net proceeds of approximately $15.1 million from our Offering, consummated on August 2, 2011, and proceeds of approximately $0.6 million from options exercised with or after our Offering. The net proceeds from our Offering were used by us primarily to redeem the Series A preferred stock liability of approximately $10.7 million and repay amounts outstanding on our revolving credit facility. The exercise of stock options also resulted in the recognition of a tax benefit of approximately $2.9 million.
Net cash used in financing activities decreased by $4.0 million to $0.3 million in fiscal 2010 from $4.3 million in fiscal 2009 due primarily to reductions in net payments on our revolving credit facility of $4.3 million. This decrease in net cash used in financing activities was partially offset by the payment of a $0.3 million note payable in fiscal 2010.
Revolving Credit Facility
On June 12, 2008, we entered into a loan and security agreement with Fifth Third Bank for a three-year revolving credit facility. On April 22, 2011, we entered into an amendment to the existing loan and security agreement, which extends the maturity of this facility until April 22, 2016. On October 6, 2011, we entered into a second amendment to the loan and security agreement that, among other things, permitted the creation of a subsidiary and certain inter-company transfers.
Under the amended revolving credit facility, our borrowing capacity is equal to the lesser of (i) the Maximum Revolving Facility (as defined), less the undrawn face amount of any letters of credit outstanding at the time a drawdown on the revolving credit facility is made, and (ii) the Borrowing Base (as defined). The Maximum Revolving Facility is equal to $40.0 million. The Borrowing Base is defined as the sum of (i) 200% of Consolidated EBITDA (as defined) for the most recent trailing twelve-month period for which financial statements are available, minus (ii) the aggregate undrawn face amount of any letters of credit outstanding at the time a drawdown on the revolving credit facility is made, minus (iii) such reserves as may be established by the lender in its Permitted Discretion (as defined) but not to exceed 35% of the Borrowing Base. The credit facility includes a $5.0 million sublimit for the issuance of letters of credit.
Indebtedness incurred under the revolving credit facility bears interest at a rate of LIBOR (subject to a minimum level of 1.5%) plus an applicable margin of 4.50% or at a rate of the lender’s base commercial lending rate plus an applicable margin of 3.00%. The interest rate on outstanding borrowings under our revolving credit facility under the amended loan and security agreement was 6.25%, under the lender’s base commercial lending rate, as of January 29, 2012. Our excess borrowing capacity was $39.9 million as of January 29, 2012, with no amounts drawn on our revolving credit facility as of this date and undrawn face amounts on letters of credit of $0.1 million as of this date. As inventory levels and capital expenditures increase during the third quarter, draws on our amended credit facility increase. During fiscal 2011, the maximum amount drawn on the credit facility was approximately $8.5 million, but remained below these levels for the majority of the fiscal year.
The amended loan and security agreement includes certain financial covenants. The financial covenants include the requirements to: (i) maintain a ratio of Consolidated Free Cash Flow to Consolidated Fixed Charges (as such terms are defined); (ii) maintain a ratio of Debt (as defined) to Consolidated EBITDA; (iii) limit our annual Consolidated Capital Expenditures (as defined); and (iv) limit our Consolidated Net Capital Expenditures (defined as Consolidated Capital Expenditures minus a specified amount of capital expenditures related to new-store openings determined on the basis of our Consolidated Leverage Ratio).
27
Table of Contents
The amended loan and security agreement includes customary negative and affirmative covenants. The negative covenants include, among others, limitations on: indebtedness; the payment of dividends; liens; the disposition of assets; consolidations and mergers; loans and investments; transactions with affiliates; restricted payments; sale-leaseback transactions; incurrence of certain restrictions by subsidiaries; other negative pledges; and foreign assets. The affirmative covenants include, among others, the requirement to provide audited annual and unaudited monthly financial statements, quarterly and annual compliance certificates, and other financial and operating information. Indebtedness incurred under the amended loan and security agreement is collateralized by substantially all of our assets. As of January 29, 2012, we believe we were in compliance with the financial covenants and other covenants applicable to us under the amended loan and security agreement.
Off-Balance Sheet Arrangements
As of and for the three fiscal years ended January 29, 2012, except for operating leases entered into in the normal course of business, we were not party to any material off-balance sheet arrangements that are reasonably likely to have a current or future effect on our financial condition, net sales, expenses, results of operations, liquidity, capital expenditures or capital resources.
Contractual Obligations and Commitments
The following table summarizes our contractual obligations as of January 29, 2012, and the effect such obligations are expected to have on our liquidity and cash flows in future periods.
| Payments due by Period | ||||||||||||||||||||
| Total Obligations |
<1 Year | 2-3 Years | 4-5 Years | Thereafter | ||||||||||||||||
| (dollars in thousands) | ||||||||||||||||||||
| Operating lease obligations (1) |
140,331 | 14,709 | 34,286 | 32,997 | 58,339 | |||||||||||||||
| Construction-related obligations |
3,684 | 3,684 | — | — | — | |||||||||||||||
| Purchase obligations (2) |
6,753 | 6,753 | — | — | — | |||||||||||||||
|
|
|
|
|
|
|
|
|
|
|
|||||||||||
| Total contractual obligations |
$ | 150,768 | $ | 25,146 | $ | 34,286 | $ | 32,997 | $ | 58,339 | ||||||||||
|
|
|
|
|
|
|
|
|
|
|
|||||||||||
| (1) | Operating lease obligations reflect base rent and exclude insurance, taxes, maintenance and other related leasing costs. Other related leasing costs including insurance, taxes and maintenance comprise approximately 40% of the base rent obligation. |
| (2) | Purchase obligations consist primarily of inventory purchase orders. Our inventory purchase orders are cancellable with limited or no recourse available to the vendor until the inventory is shipped to us. |
Critical Accounting Policies and Estimates
Overview
We have identified the policies below as critical to our business operations and understanding of our results of operations. The impact and any associated risks related to these policies on our business operations are discussed throughout “Management’s Discussion and Analysis of Financial Condition and Results of Operations” where such policies affect our reported and expected financial results. Our consolidated financial statements, which have been prepared in accordance with US generally accepted accounting principles (“US GAAP”), require us to make estimates and judgments that affect the reported amounts of assets, liabilities, revenues, expenses, cash flows and related disclosures. We base our estimates on historical experience and various other assumptions that we believe to be reasonable under the circumstances. Actual results may differ from these estimates. For a detailed discussion on the application of these and other accounting policies, See Note 1, “Business and Summary of Significant Accounting Policies,” in our consolidated financial statements included elsewhere in this Annual Report on Form 10-K.
We believe that our most critical accounting policies relate to the following:
| • | Inventory |
| • | Income Taxes |
| • | Self-Funded Insurance |
| • | Fair Value Measurements |
| • | Stock-based Compensation |
Inventory
Our inventory consists of tea and tea-related merchandise and is stated at the lower of cost (weighted-average method for stores and FIFO for warehouse) or market (net realizable value). Market value is determined based on replacement cost. We directly import the majority of our inventory and include the related costs of freight to our distribution center and shipping costs from our distribution center to our stores in our capitalized cost of inventory. We review our inventory levels to identify slow-moving or obsolete tea and tea-related merchandise and use the reserve method to account for such inventory and inventory shrinkage. The reserve method requires judgment based on inventory balances and
28
Table of Contents
historical trends of product sales and product mix. We believe that our assumptions are reasonable based on our experience, although actual results may have a positive or negative material impact on the net realizable value of inventory. For example, if future demand or market conditions for our products are less favorable than forecasted or if unforeseen circumstances impact the demand of the inventory, we may be required to record additional reserves which would negatively impact the results of operations in the period the write-downs were recorded. Additionally, we do not believe that our tea and tea related merchandise inventories are subject to significant risk of obsolescence in the near term, and we have the ability to adjust purchasing practices based on anticipated sales trends and general economic conditions. However, changes in consumer purchasing patterns or deterioration in product quality could result in the need for additional reserves. Changes to the inventory reserve are recorded in cost of goods sold in the consolidated statements of operations.
Income Taxes
We use the asset and liability method of accounting for income taxes under which deferred tax assets and liabilities are provided on temporary differences between the tax basis of assets and liabilities and their reported amounts in the financial statements at the enacted tax rate expected to be in effect when the taxes are actually paid. The value of our deferred tax assets assumes that we will be able to generate sufficient future taxable income in certain tax jurisdictions, based on estimates and assumptions. If these estimates and related assumptions change in the future, we may be required to record a valuation allowance against our deferred tax assets resulting in an increase to our provision for income taxes that would be charged to earnings in the period such determination is made. We recognize interest and penalties associated with unrecognized tax positions within our provision for income taxes.
In January 2007, we adopted new accounting guidance for income taxes with respect to unrecognized tax positions as set forth by the Financial Accounting Standards Board, or FASB, in ASC 740-Accounting for Income Taxes (“ASC 740”). As a result of the new guidance, a tax position is recognized as a benefit only if it is “more likely than not” that the tax position would be sustained in a tax examination, with a tax examination being presumed to occur under ASC 740. The amount recognized is the largest amount of tax benefit that has a greater than 50% cumulative likelihood of being realized on examination. For tax positions not meeting the “more likely than not” test, no tax benefit is recorded. The accounting for ASC 740-10, Accounting for Uncertain Tax positions, will continue to require significant judgment by management in accounting for uncertainty in income taxes recognized in the financial statements. Additionally, resolution of these uncertainties in a manner inconsistent with our expectations could have a material impact on our results of operations.
Additionally, the calculation of tax liabilities involves significant judgment in estimating the impact of certain uncertainties in the application of Generally Accepted Accounting Principles in the US and complex tax laws. Resolution of these uncertainties in a manner inconsistent with management’s expectations could have a material impact on the company’s financial condition and results of operations. See Note 1, “Business and Summary of Significant Accounting Policies,” in our consolidated financial statements included elsewhere in this Annual Report on Form 10-K.
Self-Funded Medical Insurance
In fiscal 2010, we moved from a fully insured to a self-funded medical insurance plan. We contracted with an administrative service company, or a “third party administrator,” to supervise and administer the program and act as its fiduciary and representative. We have reduced our risk under this self-funded plan by purchasing both specific and aggregate stop-loss insurance coverage for individual claims and total annual claims in excess of prescribed limits. We record estimates for claim liabilities based on information provided by the third party administrator, historical claims experience, the life cycle of claims, expected costs of claims incurred but not paid and expected costs to settle unpaid claims. Although we believe that we have the ability to reasonably estimate losses related to claims, actual claims experience may differ from our initial estimates. This liability is subject to a total limitation that varies based on employee enrollment and factors that are established at each annual contract renewal. Costs related to the administration of the plan and related claims are expensed as incurred. As facts change, such as the regulatory environment, discount rates, projected exposure, including payroll, as well as the frequency, lag and severity of claims, it may become necessary to make adjustments to assumptions used in the calculation of the related liability that could be material to our results of operations and financial condition.
Fair Value Measurements
The guidance for fair value measurements establishes the authoritative definition of fair value, sets out a framework for measuring fair value and outlines the required disclosures regarding fair value measurements. Fair value is the price that would be received to sell an asset or paid to transfer a liability in the principal or most advantageous market for the asset or liability in an orderly transaction between market participants at the measurement date. We use a three-tier fair value hierarchy based upon observable and non-observable inputs as described further in Note 6 – “Fair Value Measurements” in our consolidated financial statements included in this Annual Report on Form 10-K.
Our financial instruments have historically consisted primarily of our Class B redeemable common stock, classified as temporary equity and measured using Level 3 inputs. To determine the estimated fair value of our Class B redeemable common stock at January 30, 2011 and up to the commencement of public trading of our common stock on July 28, 2011; we performed contemporaneous valuations using the market approach under the assumption that we would complete an initial public offering within the first half of fiscal 2011 given we had selected investment banks to assist us in this process and had agreed upon a timeline with these investment banks to complete an initial public offering within this
29
Table of Contents
timeframe. These valuations utilized the forecasts we prepared for our selection process with investment banks and the resulting initial public offering valuation metrics and methodologies presented to us by these investment banks. In particular, we considered the public market valuations of other high-growth specialty retailers and the corresponding ratios of market value to variables such as current and projected net income and revenue for these comparable companies. We applied these multiples to both our current and projected financial performance to determine our estimated enterprise value. Management’s estimate of fair value related to the Class B redeemable common stock did not differ significantly from the Offering Price once our stock became publically traded. As a result, the trading of our common stock, a similar instrument, provided a quoted price for our Class B redeemable common stock. On August 2, 2011, in conjunction with the Offering as more fully described in Note 5 – “Common and Preferred Stock and Stockholders’ Equity,” in our consolidated financial statements included in this Annual Report on Form 10-K, all shares of our Class B redeemable common stock were converted into shares of Class A common stock and subsequently common stock, resulting in the reclassification of temporary equity into additional paid-in capital. Due to this reclassification into permanent equity upon redemption of the Class B redeemable common stock, fair value re-measurement is no longer required for periods subsequent to the Offering. As such, because the company’s balances measured at fair value on a recurring basis consisted solely of the Class B redeemable common stock, there were no financial instruments of this nature as of January 29, 2012.
Stock-based Compensation
Our stock-based awards are accounted for under the provisions of FASB ASC Topic No. 718—Stock Compensation. We measure and recognize stock-based compensation expense based on the fair value measurement for all stock-based payment awards made to our employees and directors, primarily stock options, over the service period for which the awards are expected to vest. We calculate the fair value of each stock option award on the date of grant using the Black-Scholes option pricing model. The determination of the fair value of stock option awards on the date of grant using an option-pricing model is affected by our stock price as well as a number of highly judgmental assumptions including expected term, expected volatility, risk-free interest rate and dividend yield. The expected term reflects the application of the simplified method defined as the average of the contractual term of the options and the weighted-average vesting period for all option tranches. The expected volatility incorporates the historical volatility of similar entities whose share prices are publically available. We plan to continue to use comparable volatilities of other companies until we believe we have sufficient historical data to derive an accurate measure of volatility from our own stock price. Volatility is one of the more sensitive inputs to calculate the grant date fair value of our option grants. While we are not aware of any news or disclosures by our peers that may impact their respective volatility, there is a risk that our peer group volatility may increase, thereby increasing any prospective future compensation expense that will result from future option grants. We use a risk-free interest rate based on US Treasury instruments whose maturities are commiserate to the expected term of the award being valued. The expected dividend yield is based on our expectation of not paying dividends on common stock for the foreseeable future. If any of these assumptions used in the Black-Scholes option pricing model change significantly, future stock-based compensation expense may differ materially in future periods as compared to amounts historically and currently recorded. Additionally, future stock-based compensation cost will increase when we grant additional equity awards to employees or directors and modifications or repurchases of awards may require us to incur additional cost.
In addition, we are required to estimate the expected forfeiture rate and therefore only recognize compensation expense associated with options expected to vest. We estimate the forfeiture rate based on historical experience and update annually for actual forfeitures. To the extent our actual forfeiture rate is different from our estimates, stock-based compensation expense may be adjusted.
Recent Accounting Pronouncements
In addition to the accounting pronouncements discussed above in conjunction with our critical accounting policies, we believe the following accounting pronouncements not yet adopted are important to an understanding of our consolidated financial statements.
Accounting Pronouncements Not Yet Adopted
In May 2011, the FASB issued Accounting Standards Update, (“ASU”) Topic No. 2011-04—Amendments to Achieve Common Fair Value Measurement and Disclosure Requirements in U.S. GAAP and IFRSs (“ASU 2011-04”), which amends certain accounting and disclosure requirements related to fair value measurements. This guidance is effective for interim and annual reporting periods beginning after December 15, 2011, which corresponds to our first quarter of fiscal 2012. We expect adoption to have no material impact on our consolidated financial statements.
In June 2011, the FASB issued ASU 2011-05—Presentation of Comprehensive Income (“ASU 2011-05”), which was issued to enhance comparability between entities that report under US GAAP and IFRS, and to provide a more consistent method of presenting non-owner transactions that affect an entity’s equity. ASU 2011-05 eliminates the option to report other comprehensive income and its components in the statement of changes in stockholders’ equity as a single line item, but requires presentation of the total comprehensive income, the components of net income and the components of other comprehensive income either in a single continuous statement or in two separate but consecutive statements. This pronouncement is effective for fiscal years, and interim periods within those years, beginning after December 15, 2011, which corresponds to our first quarter of fiscal 2012. Early adoption of the new guidance is permitted and full retrospective application is required. We do not expect adoption to have a material impact on our consolidated financial statements.
Additionally, ASU 2011-12 – Comprehensive Income: Deferral of the Effective Date for Amendments to the Presentation of Reclassifications of Items out of Accumulated Other Comprehensive Income in ASU 2011-05 (“ASU 2011-12”) was issued on December 23, 2011 and has deferred the specific requirement within ASU 2011-05 to present, on the face of the financial statements, items that are reclassified
30
Table of Contents
from accumulated other comprehensive income to net income separately with their respective components of net income and other comprehensive income. Entities should continue to report reclassifications out of accumulated comprehensive income consistent with the presentation requirements in effect prior to the issuance of ASU 2011-05. We do not expect this deferral to have a material impact on our consolidated financial statements.
In September 2011, the FASB issued ASU Topic No. 2011-08, Intangibles – Goodwill and Other (“ASU 2011-08”). ASU 2011-08 is intended to simplify goodwill impairment testing by permitting an entity to first perform a qualitative assessment to determine whether it is more likely than not that the fair value of a reporting unit is less than the carrying value before performing the two-step goodwill impairment test that currently exists. The amendment includes a number of events and circumstances for an entity to consider in conducting the qualitative assessment. This pronouncement is effective for fiscal years, and interim periods within those years, beginning after December 15, 2011, which corresponds to our first quarter of fiscal 2012. We will adopt the amendment in the first quarter of fiscal 2012 and do not expect its adoption to have a material impact on our consolidated financial statements.
There were various other accounting standards and interpretations issued during fiscal 2011 that we have not yet been required to adopt, none of which are expected to have a material impact on our consolidated financial statements.
| Item 7A. | Quantitative and Qualitative Disclosures About Market Risk. |
Market risk represents the risk of loss that may impact our financial position due to adverse changes in financial market prices and rates. Our market risk exposure is primarily a result of fluctuations in interest rates and foreign currency exchange rates. We do not hold or issue financial instruments for trading purposes.
Interest Rate Risk
Our revolving credit facility carries floating interest rates that are tied to LIBOR or our lender’s base commercial lending rate (prime), and therefore, our consolidated statements of operations and cash flows will be exposed to changes in interest rates. We do not use derivative financial instruments for speculative or trading purposes; however, this does not preclude our adoption of specific hedging strategies in the future. A 10% increase or decrease in market interest rates would not have a material impact on our financial condition, results of operations or cash flows.
Foreign Exchange Risk
Except for our Canadian stores, one of which was in operation on January 29, 2012, we do not currently generate any portion of our net sales in any currency other than the US dollar. We currently source a portion of our inventory of teas and tea-related merchandise in Europe and Japan and incur a limited portion of those related costs in Euro and in Japanese yen. Historically, we have not been impacted materially by fluctuations in the US Dollar/Euro and US Dollar/Japanese yen exchange rates and do not expect to be impacted materially for the foreseeable future. However, if our purchases of inventory in Euro and in Japanese yen increase, and to the extent that we commence generating significant net sales outside of the United States that are denominated in currencies other than the US dollar, our results of operations could be adversely impacted by changes in exchange rates. We do not currently hedge foreign currency fluctuations and do not intend to do so for the foreseeable future.
31
Table of Contents
| Item 8. | Financial Statements and Supplementary Data. |
INDEX TO CONSOLIDATED FINANCIAL STATEMENTS
| 33 | ||||
| Consolidated Balance Sheets as of January 29, 2012 and January 30, 2011 |
34 | |||
| 35 | ||||
| 36 | ||||
| 37 | ||||
| 38 | ||||
32
Table of Contents
REPORT OF INDEPENDENT REGISTERED PUBLIC ACCOUNTING FIRM
To the Board of Directors and Shareholders of
Teavana Holdings, Inc.
We have audited the accompanying consolidated balance sheets of Teavana Holdings, Inc. and Subsidiaries (a Delaware corporation) (collectively, the “Company”) as of January 29, 2012 and January 30, 2011, and the related consolidated statements of operations, redeemable common stock and stockholder’s equity (deficit), and cash flows for each of the three years in the period ended January 29, 2012. These financial statements are the responsibility of the Company’s management. Our responsibility is to express an opinion on these financial statements based on our audits.
We conducted our audits in accordance with the standards of the Public Company Accounting Oversight Board (United States). Those standards require that we plan and perform the audit to obtain reasonable assurance about whether the financial statements are free of material misstatement. The Company is not required to have, nor were we engaged to perform an audit of its internal control over financial reporting. Our audit included consideration of internal control over financial reporting as a basis for designing audit procedures that are appropriate in the circumstances, but not for the purpose of expressing an opinion on the effectiveness of the Company’s internal control over financial reporting. Accordingly, we express no such opinion. An audit also includes examining, on a test basis, evidence supporting the amounts and disclosures in the financial statements, assessing the accounting principles used and significant estimates made by management, as well as evaluating the overall financial statement presentation. We believe that our audits provide a reasonable basis for our opinion.
In our opinion, the consolidated financial statements referred to above present fairly, in all material respects, the financial position of Teavana Holdings, Inc. and Subsidiaries as of January 29, 2012 and January 30, 2011, and the results of their operations and their cash flows for each of the three years in the period ended January 29, 2012, in conformity with accounting principles generally accepted in the United States of America.
/s/ GRANT THORNTON LLP
Atlanta, Georgia
April 13, 2012
33
Table of Contents
CONSOLIDATED BALANCE SHEETS
(dollars in thousands, except per share data)
| January 29, 2012 |
January 30, 2011 |
|||||||
| Assets |
||||||||
| Current assets |
||||||||
| Cash and cash equivalents |
$ | 17,818 | $ | 7,901 | ||||
| Prepaid expenses and other current assets |
2,475 | 2,333 | ||||||
| Prepaid rent |
1,856 | 1,400 | ||||||
| Inventory |
25,676 | 16,928 | ||||||
| Deferred tax asset, current |
1,839 | 1,629 | ||||||
|
|
|
|
|
|||||
| Total current assets |
49,664 | 30,191 | ||||||
| Property and equipment, net |
42,785 | 31,028 | ||||||
| Goodwill |
2,394 | 2,394 | ||||||
| Other non-current assets |
775 | 513 | ||||||
|
|
|
|
|
|||||
| Total assets |
$ | 95,618 | $ | 64,126 | ||||
|
|
|
|
|
|||||
| Liabilities, Redeemable Common Stock and Stockholders’ Equity (Deficit) |
||||||||
| Current liabilities |
||||||||
| Accounts payable |
$ | 3,898 | $ | 3,631 | ||||
| Income taxes payable |
1,821 | 4,809 | ||||||
| Deferred revenue |
1,813 | 1,344 | ||||||
| Series A redeemable preferred stock, $.0001 par value; no shares and 10,683,333 shares authorized, issued and outstanding as of January 29, 2012 and January 30, 2011, respectively |
— | 12,992 | ||||||
| Other current liabilities |
5,034 | 5,539 | ||||||
|
|
|
|
|
|||||
| Total current liabilities |
12,566 | 28,315 | ||||||
| Long-term liabilities |
||||||||
| Deferred rent |
12,905 | 7,524 | ||||||
| Deferred tax liability, non-current |
2,570 | 420 | ||||||
| Long-term debt |
— | 1,000 | ||||||
| Other long-term liabilities |
575 | 525 | ||||||
|
|
|
|
|
|||||
| Total long-term liabilities |
16,050 | 9,469 | ||||||
|
|
|
|
|
|||||
| Total liabilities |
28,616 | 37,784 | ||||||
|
|
|
|
|
|||||
| Commitments and contingencies (Note 13) |
||||||||
| Redeemable common stock |
||||||||
| Class B redeemable common stock, $.00003 par value; no shares and 50,000,000 shares authorized as of January 29, 2012 and January 30, 2011, respectively; no shares and 9,005,217 shares issued and outstanding as of January 29, 2012 and January 30, 2011, respectively |
— | 81,401 | ||||||
| Stockholders’ equity (deficit) |
||||||||
| Class A common stock, $.00003 par value; no shares and 50,000,000 shares authorized as of January 29, 2012 and January 30, 2011, respectively; no shares and 27,744,243 shares issued and outstanding as of January 29, 2012 and January 30, 2011, respectively |
— | 1 | ||||||
| Common stock, $.00003 par value; 100,000,000 shares and no shares authorized as of January 29, 2012 and January 30, 2011, respectively; 38,281,836 shares and no shares issued and outstanding as of January 29, 2012 and January 30, 2011, respectively |
1 | — | ||||||
| Additional paid-in capital |
276,782 | — | ||||||
| Accumulated deficit |
(209,792 | ) | (55,060 | ) | ||||
| Accumulated other comprehensive income |
11 | — | ||||||
|
|
|
|
|
|||||
| Total stockholders’ equity (deficit) |
67,002 | (55,059 | ) | |||||
|
|
|
|
|
|||||
| Total liabilities, redeemable common stock and stockholders’ equity (deficit) |
$ | 95,618 | $ | 64,126 | ||||
|
|
|
|
|
|||||
The accompanying notes are an integral part of these consolidated financial statements
34
Table of Contents
CONSOLIDATED STATEMENTS OF OPERATIONS
(dollars in thousands, except per share data)
| Fiscal Year Ended | ||||||||||||
| January 29, 2012 | January 30, 2011 | January 31, 2010 | ||||||||||
| Net sales |
$ | 168,100 | $ | 124,701 | $ | 90,262 | ||||||
| Cost of goods sold (exclusive of depreciation shown separately below) |
60,903 | 46,275 | 36,435 | |||||||||
|
|
|
|
|
|
|
|||||||
| Gross profit |
107,197 | 78,426 | 53,827 | |||||||||
| Selling, general and administrative expense |
69,681 | 50,571 | 38,142 | |||||||||
| Depreciation and amortization expense |
5,927 | 4,361 | 3,489 | |||||||||
|
|
|
|
|
|
|
|||||||
| Income from operations |
31,589 | 23,494 | 12,196 | |||||||||
| Interest expense, net |
1,673 | 2,585 | 2,435 | |||||||||
|
|
|
|
|
|
|
|||||||
| Income before income taxes |
29,916 | 20,909 | 9,761 | |||||||||
| Provision for income taxes |
12,157 | 8,906 | 4,470 | |||||||||
|
|
|
|
|
|
|
|||||||
| Net income |
$ | 17,759 | $ | 12,003 | $ | 5,291 | ||||||
|
|
|
|
|
|
|
|||||||
| Net income per share: |
||||||||||||
| Basic |
$ | 0.47 | $ | 0.33 | $ | 0.14 | ||||||
| Diluted |
$ | 0.46 | $ | 0.32 | $ | 0.14 | ||||||
| Weighted average shares outstanding: |
||||||||||||
| Basic |
37,481,072 | 36,749,460 | 36,749,460 | |||||||||
| Diluted |
38,419,308 | 37,725,067 | 37,322,198 | |||||||||
The accompanying notes are an integral part of these consolidated financial statements
35
Table of Contents
CONSOLIDATED STATEMENTS OF CHANGES IN REDEEMABLE COMMON STOCK
AND STOCKHOLDERS’ EQUITY (DEFICIT)
(dollars in thousands, except share data)
| Class B Redeemable Common Stock |
Total Redeemable Common Stock |
Class
A Common Stock |
Common Stock | Additional Paid- In Capital |
Accumulated Other Comprehensive Income |
Accumulated Deficit |
Total Stockholders’ Equity (Deficit) |
|||||||||||||||||||||||||||||||||||||
| Shares | Amount | Shares | Amount | Shares | Amount | |||||||||||||||||||||||||||||||||||||||
| Balance, February 1, 2009 |
9,005,217 | $ | 15,808 | $ | 15,808 | 27,744,243 | $ | 1 | — | $ | — | $ | — | $ | — | $ | (7,087 | ) | $ | (7,086 | ) | |||||||||||||||||||||||
| Net income |
— | — | — | — | — | — | — | — | — | 5,291 | 5,291 | |||||||||||||||||||||||||||||||||
| Change in fair value of class B redeemable common stock |
— | 6,080 | 6,080 | — | — | — | — | (169 | ) | — | (5,911 | ) | (6,080 | ) | ||||||||||||||||||||||||||||||
| Stock-based compensation |
— | — | — | — | — | — | — | 169 | — | — | 169 | |||||||||||||||||||||||||||||||||
|
|
|
|
|
|
|
|
|
|
|
|
|
|
|
|
|
|
|
|
|
|
|
|||||||||||||||||||||||
| Balance, January 31, 2010 |
9,005,217 | $ | 21,888 | $ | 21,888 | 27,744,243 | $ | 1 | — | $ | — | $ | — | $ | — | $ | (7,707 | ) | $ | (7,706 | ) | |||||||||||||||||||||||
| Net income |
— | — | — | — | — | — | — | — | — | 12,003 | 12,003 | |||||||||||||||||||||||||||||||||
| Change in fair value of class B redeemable common stock |
— | 59,513 | 59,513 | — | — | — | — | (157 | ) | — | (59,356 | ) | (59,513 | ) | ||||||||||||||||||||||||||||||
| Stock-based compensation |
— | — | — | — | — | — | — | 157 | — | — | 157 | |||||||||||||||||||||||||||||||||
|
|
|
|
|
|
|
|
|
|
|
|
|
|
|
|
|
|
|
|
|
|
|
|||||||||||||||||||||||
| Balance, January 30, 2011 |
9,005,217 | $ | 81,401 | $ | 81,401 | 27,744,243 | $ | 1 | — | $ | — | $ | — | $ | — | $ | (55,060 | ) | $ | (55,059 | ) | |||||||||||||||||||||||
| Comprehensive income: |
||||||||||||||||||||||||||||||||||||||||||||
| Net income |
— | — | — | — | — | — | — | — | — | 17,759 | 17,759 | |||||||||||||||||||||||||||||||||
| Foreign currency translation adjustment |
— | — | — | — | — | — | — | — | 11 | — | 11 | |||||||||||||||||||||||||||||||||
|
|
|
|||||||||||||||||||||||||||||||||||||||||||
| Total Comprehensive income |
17,770 | |||||||||||||||||||||||||||||||||||||||||||
| Change in fair value of Class B redeemable common stock |
— | 172,546 | 172,546 | — | — | — | — | (55 | ) | — | (172,491 | ) | (172,546 | ) | ||||||||||||||||||||||||||||||
| Stock-based compensation |
— | — | — | — | — | — | — | 790 | — | — | 790 | |||||||||||||||||||||||||||||||||
| Stock issued for stock option exercises |
— | — | — | — | — | 460,947 | — | 637 | — | — | 637 | |||||||||||||||||||||||||||||||||
| Excess tax benefit from stock option exercises |
— | — | — | — | — | — | — | 2,925 | — | — | 2,925 | |||||||||||||||||||||||||||||||||
| Issuance of common stock in initial public offering (net of issuance costs) |
— | — | — | — | — | 1,071,429 | — | 15,079 | — | — | 15,079 | |||||||||||||||||||||||||||||||||
| Reclassification of Class B redeemable common stock to Class A common stock |
(9,005,217 | ) | (253,947 | ) | (253,947 | ) | 9,005,217 | — | — | — | 253,947 | — | — | 253,947 | ||||||||||||||||||||||||||||||
| Reclassification of Class A common stock to common stock |
— | — | — | (36,749,460 | ) | (1 | ) | 36,749,460 | 1 | — | — | — | — | |||||||||||||||||||||||||||||||
| Excess accretion of Series A redeemable preferred stock above redemption value |
— | — | — | — | — | — | — | 3,534 | — | — | 3,534 | |||||||||||||||||||||||||||||||||
| Other |
— | — | — | — | — | — | — | (75 | ) | — | — | (75 | ) | |||||||||||||||||||||||||||||||
|
|
|
|
|
|
|
|
|
|
|
|
|
|
|
|
|
|
|
|
|
|
|
|||||||||||||||||||||||
| Balance, January 29, 2012 |
— | $ | — | $ | — | — | $ | — | 38,281,836 | $ | 1 | $ | 276,782 | $ | 11 | $ | (209,792 | ) | $ | 67,002 | ||||||||||||||||||||||||
|
|
|
|
|
|
|
|
|
|
|
|
|
|
|
|
|
|
|
|
|
|
|
|||||||||||||||||||||||
The accompanying notes are an integral part of these consolidated financial statements
36
Table of Contents
CONSOLIDATED STATEMENTS OF CASH FLOWS
(dollars in thousands)
| Fiscal Year Ended | ||||||||||||
| January 29, 2012 | January 30, 2011 | January 31, 2010 | ||||||||||
| Cash flows from operating activities: |
||||||||||||
| Net income |
$ | 17,759 | $ | 12,003 | $ | 5,291 | ||||||
| Adjustments to reconcile net income to net cash provided by operating activities: |
||||||||||||
| Depreciation and amortization expense |
5,927 | 4,361 | 3,489 | |||||||||
| Non-cash interest expense |
1,327 | 2,279 | 1,925 | |||||||||
| Stock-based compensation |
790 | 157 | 169 | |||||||||
| Excess tax benefit from stock option exercises |
(2,925 | ) | — | — | ||||||||
| Deferred income taxes |
1,940 | (253 | ) | 532 | ||||||||
| Other |
160 | 130 | — | |||||||||
| Changes in operating assets and liabilities: |
||||||||||||
| Prepaid expenses and other assets |
(117 | ) | (1,114 | ) | 46 | |||||||
| Prepaid rent |
(456 | ) | (338 | ) | (276 | ) | ||||||
| Inventory |
(8,748 | ) | (5,313 | ) | (3,646 | ) | ||||||
| Accounts payable |
13 | 669 | (1,558 | ) | ||||||||
| Income taxes payable |
(63 | ) | 815 | 2,772 | ||||||||
| Deferred revenue |
469 | 260 | 326 | |||||||||
| Deferred rent |
5,381 | 3,673 | 1,124 | |||||||||
| Other liabilities |
(502 | ) | 2,068 | 877 | ||||||||
|
|
|
|
|
|
|
|||||||
| Net cash provided by operating activities |
20,955 | 19,397 | 11,071 | |||||||||
| Cash flows from investing activities: |
||||||||||||
| Purchase of property and equipment |
(17,566 | ) | (12,560 | ) | (6,640 | ) | ||||||
|
|
|
|
|
|
|
|||||||
| Net cash used in investing activities |
(17,566 | ) | (12,560 | ) | (6,640 | ) | ||||||
| Cash flows from financing activities: |
||||||||||||
| Proceeds from revolving credit facility |
181,414 | 132,239 | 93,980 | |||||||||
| Payments on revolving credit facility |
(182,414 | ) | (132,239 | ) | (98,265 | ) | ||||||
| Payment on note payable |
— | (250 | ) | — | ||||||||
| Proceeds from initial public offering, net |
15,079 | — | — | |||||||||
| Proceeds from stock option exercises |
637 | — | — | |||||||||
| Payment to redeem Series A redeemable preferred stock |
(10,683 | ) | — | — | ||||||||
| Cash paid for financing costs |
(433 | ) | — | — | ||||||||
| Excess tax benefit from stock option exercises |
2,925 | — | — | |||||||||
|
|
|
|
|
|
|
|||||||
| Net cash provided by (used in) financing activities |
6,525 | (250 | ) | (4,285 | ) | |||||||
|
|
|
|
|
|
|
|||||||
| Effect of exchange rates on cash and cash equivalents: |
3 | — | — | |||||||||
| Net increase in cash and cash equivalents |
9,917 | 6,587 | 146 | |||||||||
| Cash and cash equivalents, beginning of fiscal period |
7,901 | 1,314 | 1,168 | |||||||||
|
|
|
|
|
|
|
|||||||
| Cash and cash equivalents, end of fiscal period |
$ | 17,818 | $ | 7,901 | $ | 1,314 | ||||||
|
|
|
|
|
|
|
|||||||
| Supplemental disclosure of cash flows informaton: |
||||||||||||
| Cash paid for interest |
$ | 342 | $ | 331 | $ | 510 | ||||||
| Cash paid for income taxes |
10,280 | 8,344 | 1,166 | |||||||||
| Non-cash change in fair value of Class B redeemable common stock |
$ | 172,546 | $ | 59,513 | $ | 6,080 | ||||||
The accompanying notes are an integral part of these consolidated financial statements
37
Table of Contents
Notes to Consolidated Financial Statements
(dollars in thousands, except per share and store data)
| 1. | Business and Summary of Significant Accounting Policies |
Nature of Business
Teavana Holdings, Inc. (the “Company” or “Teavana”) is a specialty retailer of premium loose-leaf teas, authentic artisanal tea wares and other tea-related merchandise. The Company offers its products through 200 Company-owned stores in 39 states, including one store in Canada, and 18 franchised stores primarily in Mexico, as well as through its website, www.teavana.com.
Segment Reporting
The Financial Accounting Standards Board’s (“FASB”) Accounting Standards Codification (“ASC”) Topic No. 280, Segment Reporting (“ASC 280”), establishes standards for reporting information about a company’s operating segments. The Company determined its operating segments on the same basis that it uses to evaluate performance internally. The Company’s reporting segments are the operation of its company-owned stores and its e-commerce website, which have been aggregated into one reportable financial segment. Management bases this aggregation on the following factors (i) the merchandise offered at stores and through the e-commerce business is largely the same, (ii) the majority of its e-commerce customers are also customers of retail locations, (iii) the product margins and sales mix of the stores and e-commerce business are similar and (iv) the distribution methods are the same for both revenue streams. During the year, the Company opened one store in Canada, however all significant identifiable assets are located in the United States. Net revenues and assets generated and held at the Canadian store are considered to be de minimis as of and for fiscal 2011.
Principles of Consolidation
The consolidated financial statements include all the accounts of the Company and its wholly-owned subsidiaries. All intercompany transactions and balances have been eliminated in consolidation.
The financial statements of any foreign subsidiaries have been translated into US dollars in accordance with the FASB’s ASC Topic No. 830-30 Translation of Financial Statements (“ASC 830-30”). Under ASC 830-30, the financial position and results of operations of the Company’s foreign subsidiaries are measured using the subsidiary’s local currency as the functional currency. Revenues and expenses have been translated into US dollars at average exchange rates prevailing during the period, and assets and liabilities have been translated at the rates of exchange as of the balance sheet date. The resulting translation gain and loss adjustments are recorded directly as a separate component of stockholders’ equity.
Fiscal Year
The Company’s fiscal year is 52 or 53 weeks ending on the Sunday nearest to January 31 of the following year. These consolidated financial statements include 52 weeks in each of the years ended January 29, 2012 (“fiscal 2011” or “2011”), January 30, 2011 (“fiscal 2010” or “2010”) and January 31, 2010 (“fiscal 2009” or “2009”).
Seasonality
Teavana’s business is seasonal and has historically realized a higher portion of the Company’s sales, net income and operating cash flows in the fourth fiscal quarter due primarily to the holiday selling season. As a result, the Company’s working capital requirements fluctuate during the year increasing in the second and third fiscal quarters in anticipation of this peak selling season.
Use of Estimates
The preparation of financial statements in conformity with accounting principles generally accepted in the United States of America (“US GAAP”) requires management to make estimates and assumptions that affect the reported amounts of assets and liabilities and disclosures of contingent assets and liabilities at the date of the financial statements and the reported amounts of revenues and expenses during the reporting period. Actual results could differ from those estimates.
Cash and cash equivalents
Cash and cash equivalents include cash on hand, cash on deposit with banks and financial instruments with original maturities of three months or less, and credit and debit card transactions in transit. Credit and debit card transactions are typically paid to the Company two to three business days subsequent to the sale transaction. Amounts due from credit and debit card transactions totaled $2,023 and $1,476 on January 29, 2012 and January 30, 2011, respectively.
38
Table of Contents
Teavana Holdings, Inc.
Notes to Consolidated Financial Statements – (continued)
(dollars in thousands, except per share and store data)
Concentration of Credit Risk
The Company maintains cash balances at more than one financial institution. The Company places its cash with high credit quality financial institutions. The credit risk is the amount on deposit in excess of federally insured limits. The Company has not experienced any losses in such accounts. The Dodd-Frank Wall Street Reform and Consumer Protection Act provides temporary, unlimited deposit insurance coverage for non-interest bearing transaction accounts at all FDIC-insured depository institutions through December 31, 2012. The Company believes it is not exposed to any significant credit risks on cash since its deposits are maintained with FDIC-insured depository institutions in noninterest-bearing accounts.
Vendor Concentration
The percentage of inventory purchased from the Company’s top two vendors each fiscal year is as follows:
| Fiscal Year | % of Vendor Purchases | |||
| 2011 | 24% and 16 | % | ||
| 2010 | 25% and 15 | % | ||
| 2009 | 16% and 14 | % | ||
Accounts Receivable
Accounts receivable are generated primarily through sales to franchisees and retailers and are presented at estimated net realizable value based on a specific review of outstanding customer balances and historical customer write-off amounts. A provision for doubtful accounts is charged to operations at the time management determines these accounts may become uncollectible. No allowance was provided as of January 29, 2012 and January 30, 2011, respectively.
Inventory
The Company’s inventories are stated at the lower of cost, weighted-average method for stores and first-in, first-out (FIFO) basis for its warehouse, or market, based on replacement cost. The Company records inventory purchases when title and risk of loss transfer to the Company, which generally is at the time they are delivered to the carrier for shipment to the Company.
The Company reviews its inventory to identify and record reserves for obsolete inventory and inventory shrinkage at each reporting date.
Property and Equipment
Property, plant and equipment is stated at cost less accumulated depreciation. Expenditures for replacements are capitalized, and the replaced items are retired. Repairs that significantly extend the lives of equipment are capitalized, while routine repairs and maintenance are expensed when incurred. When property and equipment are retired, sold, or otherwise disposed of, the resulting gain or loss is recognized in selling, general and administrative expense in our consolidated statements of operations and the corresponding cost and accumulated depreciation is removed from our consolidated balance sheet. Depreciation is computed using the straight-line method over the estimated lives of the related assets generally ranging from three to ten years. Leasehold improvements are depreciated over the shorter of the estimated useful lives of the assets or the lease term.
| Life | ||
| Store equipment |
3 to 8 years | |
| Office equipment |
3 to 8 years | |
| Warehouse equipment |
3 to 10 years | |
| Leasehold improvements |
Lesser of asset life or life of lease, generally 5 to 10 years | |
Goodwill
The Company accounts for goodwill in accordance with ASC Topic No. 350, Intangibles – Goodwill and Other (“ASC 350”). The Company does not amortize goodwill. Management reviews goodwill for impairment annually on October 1 or whenever events or changes in circumstances indicate that the carrying value may not be recoverable. In testing for impairment, management calculates the fair value of the reporting units to which the goodwill relates based on the fair value of the Company as a whole. The fair value of the Company is the amount for which the Company could be sold in a current transaction between willing parties. If the reporting unit’s carrying value exceeds its fair value, goodwill is written down to its implied fair value. The Company has concluded that there were no impairment losses during fiscal 2011, 2010 and 2009.
Impairment of Long-Lived Assets
The Company assesses its long-lived assets, principally property and equipment, for possible impairment whenever events or changes in circumstances, such as unplanned negative cash flows, indicate the carrying value of an asset or asset group may not be recoverable. If circumstances indicate impairment, the carrying amount of the asset is written down to fair value. The Company identified no such impairment losses during fiscal 2011, 2010 and 2009.
39
Table of Contents
Teavana Holdings, Inc.
Notes to Consolidated Financial Statements – (continued)
(dollars in thousands, except per share and store data)
Self-Funded Medical Insurance
During fiscal 2010, the Company moved from a fully insured to a self-funded medical insurance plan. The Company contracted with an administrative service company or a “third party administrator” to supervise and administer the program and act as the Company’s fiduciary and representative. The Company has reduced its risk under this self-funded plan by purchasing both specific and aggregate stop-loss insurance coverage for individual claims and total annual claims in excess of prescribed limits. The Company records estimates for claim liabilities based on information provided by the third-party administrators, historical claims experience, the life cycle of claims, expected costs of claims incurred but not paid, and expected costs to settle unpaid claims. The Company monitors its estimated insurance-related liabilities on a monthly basis. As facts change, it may become necessary to make adjustments to these estimates that could be material to the Company’s results of operations and financial condition. This liability is subject to a total limitation that varies based on employee enrollment and factors that are established at each annual contract renewal. Actual claims experience may differ from the Company’s estimates. Costs related to the administration of the plan and related claims are expensed as incurred. The total liability for self-funded medical insurance was $350 and $275 as of January 29, 2012 and January 30, 2011, respectively, and is included within other current liabilities in the consolidated balance sheets.
Revenue Recognition
Revenue from the sale of the Company’s products is recognized upon customer receipt of the product when collection of the associated receivables is reasonably assured, persuasive evidence of an arrangement exists, the sales price is fixed and determinable and ownership and risk of loss have been transferred to the customer, in accordance with ASC 605-10-S25, Revenue Recognition-Overall (“ASC 605”), which is generally the point of sale. Sales are recognized in revenue upon the delivery of product to customers if in stores, or upon the shipment of products to customers through our ecommerce medium. Amounts related to shipping and handling that are billed to customers are reflected in net sales and the related direct costs of the sales process are reflected in cost of goods sold. The Company presents sales taxes on a net basis. “Tea-of-the-month” club subscription sales are carried as a liability, and classified as deferred revenue in the consolidated balance sheet, and recognized as revenue as products are shipped to customers over the subscription period. Our policy is not to allow the return of tea and food products and certain merchandise items once they have been purchased by or delivered to the customers. A number of other merchandise items can be returned within 30 days. To date, product returns have been immaterial.
Additionally, the Company sells gift cards with no expiration dates or administrative fees to customers. The Company recognizes income from gift cards when they are redeemed by the customer. In addition, the Company recognizes income from unredeemed gift cards (“gift card breakage”) when it can determine that the likelihood of the gift card being redeemed is remote. The Company recognizes revenue from gift card breakage based on historical redemption rates. The Company accumulated sufficient historical data to determine the gift card breakage rate during fiscal 2010. Revenue from gift card breakage is included in net sales in the consolidated statements of operations. During fiscal 2011 and 2010, the Company recognized $83 and $249, respectively in net sales related to the recognition of revenue from gift card breakage. The deferred revenue attributable to gift cards and Tea-of-the-month club subscriptions at January 29, 2012 and January 30, 2011 was $1,813 and $1,344, respectively.
Franchise and Royalty Fees
As of January 29, 2012, Teavana had 16 and 2 franchised stores in Mexico and the United States, respectively. On September 2, 2011, the Company signed a 10 year franchise development agreement with the Alshaya group for the development of Teavana stores within the countries of Bahrain, Kuwait, the Kingdom of Saudi Arabia, Qatar, United Arab Emirates, Egypt, Lebanon and Jordan with the first anticipated store opening in fiscal 2012. The Company’s franchise agreements generally provide franchise rights for a period of 10 to 15 years. Initial franchise fees received in connection with newly franchised stores are recognized when obligations of the related franchise agreement are met. Continuing royalty fees are reported monthly when earned and are computed based on a certain percentage of the franchise store’s net sales. Franchise royalty income of $284, $248 and $151 for fiscal 2011, 2010 and 2009, respectively, is included in net sales in the consolidated statements of operations. Deferred revenue attributable to the initial development fee for the Company’s franchised locations at January 29, 2012 and January 30, 2011 was $575 and $525, respectively. Deferred revenue from this initial development fee was recognized in the amounts of $75, $75 and $38 in fiscal 2011, 2010 and 2009, respectively, and is included within net sales in the consolidated statements of operations.
Cost of Goods Sold
Cost of goods sold includes the direct costs of our products, freight and shipping costs, distribution center costs and occupancy costs for stores in operation. Cost of goods sold excludes depreciation and amortization expenses.
Selling, General and Administrative Expense
Selling, general and administrative expense consists primarily of store operating expenses, store pre-opening expenses and other administrative expenses. Store pre-opening costs are expensed as incurred.
Stock-based Compensation
The Company grants stock options for a fixed number of shares to key employees and certain directors. The Company accounts for stock options in accordance with ASC 718, Compensation – Stock Compensation (“ASC 718”). ASC 718 requires compensation costs related to stock-based payments, including stock options and other equity awards, to be measured based on the grant date fair value of the awards expected to vest, with the cost recognized over the requisite service period.
40
Table of Contents
Teavana Holdings, Inc.
Notes to Consolidated Financial Statements – (continued)
(dollars in thousands, except per share and store data)
Accrued Compensated Absences
The Company provides its employees with paid leave that varies in duration based on years of service to the Company. After 90 days of service, the Company grants leave benefits to all full-time employees. The Company accrues the value of the annual leave ratably over the year in which the employees’ services are performed. The Company’s policy provides for a carry-forward of unused balances of up to 40 hours as of October 31st each year. The Company had $417 and $351 accrued for paid leave as of January 29, 2012 and January 30, 2011, respectively, and is included within other current liabilities in the consolidated balance sheets.
Leases
The Company has operating lease agreements with various landlords. These agreements generally have scheduled rent increases. The Company recognizes lease expenses on a straight-line basis over the term of the occupancy of the lease, beginning when the Company is granted possession of the leased premises. Tenant allowances are recorded as deferred rent and are amortized as a reduction of rent expense over the term of the occupancy of the lease.
Advertising Costs
Advertising costs consist primarily of advertising expense associated with e-commerce operations, and to a lesser extent, the Company’s store leases and are expensed as incurred. Total advertising expense was $2,792, $2,430 and $1,354 for fiscal 2011, 2010 and 2009, respectively, and is included in selling, general and administrative expense and cost of goods sold (in the case of advertising expense associated with store leases) in the consolidated statements of operations.
Capitalized Financing Costs
Costs associated with the establishment of the revolving credit facility (see Note 4 – “Long Term Debt”) are capitalized and amortized to interest expense using the straight-line method through the end of its agreement date. Interest expense recognized for capitalized financing costs amounted to $101, $135 and $135 in fiscal 2011, 2010 and 2009, respectively. Capitalized financing costs are included in other non-current assets in the consolidated balance sheets.
Income Taxes
The Company’s income tax policy is to record the estimated future tax effects of temporary differences between the tax bases of assets and liabilities and amounts reported in the accompanying consolidated balance sheets, as well as operating loss and tax credit carry-forwards. The value of the Company’s deferred tax assets assumes that the Company will be able to generate sufficient future taxable income in applicable tax jurisdictions, based on the Company’s estimates and assumptions. The Company has concluded that a valuation allowance is not necessary as of January 29, 2012 and January 30, 2011, respectively.
The calculation of income tax liabilities involves significant judgment in estimating the impact of uncertainties in the application of complex tax laws. We also make a provision for uncertain income tax positions in accordance with the ASC topic No. 740 – Accounting for Income Taxes (“ASC 740”). The impact of an uncertain income tax position on an income tax return must be recognized at the largest amount that has a greater than 50% cumulative probability to be sustained upon audit by the relevant taxing authority. An uncertain income tax position will not be recognized if it has less than a 50% likelihood of being sustained. The new threshold and measurement attribute prescribed by the FASB will continue to require significant judgment by management. The Company records interest and penalties, if any, associated with unrecognized tax positions within the provision for income taxes in the consolidated statements of operations.
Net income per Share
Basic net income per share is calculated using the weighted average number of common shares outstanding for the period. Diluted net income per common share is calculated using the weighted average number of common shares outstanding plus the additional dilution for all potentially dilutive stock options using the treasury stock method.
Accounting Pronouncements Not Yet Adopted
In May 2011, the FASB issued Accounting Standards Update, (“ASU”) Topic No. 2011-04 – Amendments to Achieve Common Fair Value Measurement and Disclosure Requirements in US GAAP and IFRSs, which amends certain accounting and disclosure requirements related to fair value measurements. This guidance is effective for interim and annual reporting periods beginning after December 15, 2011, which corresponds to the Company’s first quarter of fiscal 2012. The Company will adopt the amendment in the first quarter of fiscal 2012 and expects no material impact on the Company’s consolidated financial statements.
In June 2011, the FASB issued ASU 2011-05 – Presentation of Comprehensive Income (“ASU 2011-05”), which was issued to enhance comparability between entities that report under US GAAP and IFRS, and to provide a more consistent method of presenting non-owner transactions that affect an entity’s equity. ASU 2011-05 eliminates the option to report other comprehensive income and its components in the statement of changes in stockholders’ equity as a single line item, but requires presentation of the total comprehensive income, the components of net income and the components of other comprehensive income either in a single continuous statement or in two separate but consecutive statements. This pronouncement is effective for fiscal years, and interim periods within those years, beginning after December 15, 2011, which
41
Table of Contents
Teavana Holdings, Inc.
Notes to Consolidated Financial Statements – (continued)
(dollars in thousands, except per share and store data)
corresponds to the Company’s first quarter of fiscal 2012. However ASU 2011-12 – Comprehensive Income: Deferral of the Effective Date for Amendments to the Presentation of Reclassifications of Items out of Accumulated Other Comprehensive Income in Accounting Standards Update No. 2011-05 (“ASU 2011-12”) has deferred the specific requirement within ASU 2011-05 to present on the face of the financial statements items that are reclassified from accumulated other comprehensive income to net income separately with their respective components of net income and other comprehensive income. Entities should continue to report reclassifications out of accumulated other comprehensive income consistent with the presentation requirements in effect before ASU 2011-05. The Company will adopt the disclosure requirements of this pronouncement in the first quarter of fiscal 2012, but expects no material impact on the Company’s consolidated financial statements.
In September 2011, the FASB issued ASU No 2011-08, Intangibles – Goodwill and Other (“ASU 2011-08”). ASU 2011-08 is intended to simplify goodwill impairment testing by permitting an entity to first perform a qualitative assessment to determine whether it is more likely than not that the fair value of a reporting unit is less than the carrying value before performing the two-step goodwill impairment test that currently exists. The amendment includes a number of events and circumstances for an entity to consider in conducting the qualitative assessment. This pronouncement is effective for fiscal years, and interim periods within those years, beginning after December 15, 2011, which corresponds to the Company’s first quarter of fiscal 2012. The Company will adopt the amendment in the first quarter of fiscal 2012 and expects no material impact on the Company’s consolidated financial statements.
The FASB issues ASUs to amend the authoritative literature in the Accounting Standards Codification. There have been a number of ASUs to date that amend the original text of the ASC. Except for the ASUs listed above, those issued to date either (i) provide supplemental guidance, (ii) are technical corrections, or (iii) are not applicable to the Company. Additionally, there were various other accounting standards and interpretations issued during fiscal 2011 that the Company has not yet been required to adopt, none of which is expected to have a material impact on the Company’s consolidated financial statements and the notes thereto going forward.
| 2. | Property and Equipment |
Property and equipment consists of the following:
| January 29, 2012 |
January 30, 2011 |
|||||||
| Leasehold improvements |
$ | 52,872 | $ | 38,282 | ||||
| Equipment |
9,292 | 6,395 | ||||||
|
|
|
|
|
|||||
| 62,164 | 44,677 | |||||||
| Less - Accumulated depreciation |
(19,379 | ) | (13,649 | ) | ||||
|
|
|
|
|
|||||
| Property and equipment, net |
$ | 42,785 | $ | 31,028 | ||||
|
|
|
|
|
|||||
Depreciation expense was $5,911, $4,315, and $3,407 for fiscal 2011, 2010 and 2009, respectively.
| 3. | Other Current Liabilities |
Other current liabilities consist of the following:
| January 29, 2012 |
January 30, 2011 |
|||||||
| Accrued compensation and payroll taxes |
$ | 2,747 | $ | 2,235 | ||||
| Sales tax payable |
707 | 472 | ||||||
| Accrued inventory in-transit |
163 | 1,441 | ||||||
| Other current liabilities |
1,417 | 1,391 | ||||||
|
|
|
|
|
|||||
| $ | 5,034 | $ | 5,539 | |||||
|
|
|
|
|
|||||
| 4. | Long-term Debt |
On June 12, 2008, the Company established a three-year revolving credit facility by entering into a loan and security agreement (the “Amended Credit Agreement”) with Fifth Third Bank. On April 22, 2011, the Company entered into an amendment to the Credit Agreement that, among other things, extended its term for five years through April 22, 2016, and on October 6, 2011, the Company entered into a second amendment to the Credit Agreement that, among other things, permitted the creation of a subsidiary and certain inter-company transfers. The Amended Credit Agreement provides for a revolving credit facility up to $40,000 through April 22, 2016. The borrowing capacity is equal to the lesser of (i) the maximum revolving facility, less the undrawn face amount of any letters of credit outstanding and (ii) the borrowing base. The borrowing base is defined as the sum of (i) 200% of Consolidated adjusted EBITDA (as defined) for the most recent twelve month trailing period for which financial statements are available, minus (ii) the aggregate undrawn face amount of any outstanding letters of credit at the time a drawdown on the revolving credit facility is made, minus (iii) such reserves as may be established by the lender in its discretion, but not to exceed 35% of the Borrowing Base. The revolving credit facility includes a $5,000 sublimit for the issuance of letters of credit. The Amended Credit Agreement is secured by substantially all of the assets of the Company. The revolving credit facility under the Amended Credit Agreement had no amounts outstanding, undrawn face amounts on letters of credit of $128 and availability of $39,872 on January 29, 2012.
42
Table of Contents
Teavana Holdings, Inc.
Notes to Consolidated Financial Statements – (continued)
(dollars in thousands, except per share and store data)
The revolving credit facility in the Amended Credit Agreement bears interest at a rate of LIBOR, subject to a minimum level of 1.5% plus an applicable margin of 4.5% or at a rate of the lender’s base commercial lending rate (prime), plus a margin of 3.0%. There were no amounts outstanding under the revolving credit facility as of January 29, 2012.
The Amended Credit Agreement specifies certain financial and non-financial covenants that the Company must comply with. The Company was in compliance with these covenants on all respective measurement dates. The Amended Credit Agreement does not permit the payment of any dividends, and thus 100% of the Company’s net income is restricted for purposes of dividend payments. The restriction on the payment of dividends applies to the Company and all of its subsidiaries. The Amended Credit Agreement also restricts all of the subsidiaries of the Company from making loans or advances to the Company in excess of certain limits as defined by the amendment executed on October 6, 2011. The restricted net assets of the subsidiaries are the same as the consolidated net assets, as presented in the accompanying consolidated balance sheets. Teavana Holdings, Inc. has no operations or operating revenues and the expenses of Teavana Holdings, Inc. are de minimis by virtue of the fact that the management and directors of the Company are compensated by its subsidiary, Teavana Corporation. Teavana Holdings, Inc. has no assets outside of its investments in subsidiaries, and no other material liabilities. Teavana Holdings, Inc. is a co-obligor under the Amended Credit Agreement with Fifth Third Bank.
Deferred financing costs totaling $433 were incurred in connection with the first amendment to the Credit Agreement and will be amortized to interest expense over the five-year term of the facility using the straight-line method. The unamortized loan costs from the original Credit Agreement will continue to be amortized over the remaining term of the amended facility. Interest expense relating to deferred financing costs and interest incurred on borrowings under the Amended Credit Agreement totaled $447, $466 and $645 during fiscal 2011, 2010 and 2009, respectively.
| 5. | Common and Preferred Stock and Stockholders’ Equity |
On August 2, 2011, the Company completed an initial public offering (the “Offering”) of 8,214,287 shares of common stock at a price of $17.00 per share. The common stock was listed on the New York Stock Exchange under the symbol “TEA.” Of the 8,214,287 shares sold in the Offering, the Company issued 1,071,429 primary shares, and 7,142,858 shares were sold by selling stockholders of the Company, including 1,071,429 shares sold pursuant to the exercise in full of the underwriters’ over-allotment option. The Company received proceeds of approximately $15,079, net of approximately $3,135 in underwriting discounts and legal, accounting and other fees incurred in connection with the Offering. The proceeds of the Offering were used principally for the redemption of all outstanding shares of the Series A redeemable preferred stock, to pay Offering-related expenses, and to repay all outstanding indebtedness under the Amended Credit Agreement that existed as of the date of the Offering. The Company did not receive any proceeds from the shares sold by the selling stockholders. Concurrent with the Offering, all shares of Class B redeemable common stock were automatically converted into an equivalent number of Shares of Class A common stock, which resulted in the concurrent corresponding reclassification of the aggregate fair value of the Class B redeemable common stock from temporary equity into additional paid-in capital within stockholders’ equity and the immediate subsequent reclassification of all outstanding shares of Class A common stock into common stock. Also upon consummation of the Offering, the Company redeemed all outstanding shares of the Series A redeemable preferred stock for an aggregate Redemption Value (as defined below) of $10,683. The excess accretion above the Redemption Value of the Series A redeemable preferred stock of $3,534 was also reclassified into additional paid-in capital.
In connection with the consummation of the Offering, the Company filed an amended and restated certificate of incorporation (the “Amended Certificate”) with the Secretary of State of the State of Delaware. The Amended Certificate provided the Board of Directors with the authority to issue 100,000,000 shares of common stock and 5,000,000 shares of preferred stock. Each share of common stock entitles the holder to one vote. Holders of common stock are entitled to receive, on a pro rata basis, any dividends declared by the Board of Directors. In the event of a liquidation, dissolution or winding up of the Company, holders of common stock are entitled to share ratably in the assets remaining after payment of liabilities. In regards to preferred stock, the Board of Directors are authorized to fix the preferences, powers and relative participating, option or other special rights and qualifications, limitations or restrictions thereof, including the dividend rate, conversion rights, voting rights, redemption rights and liquidation preferences. As such, any preferred stock issued may rank senior to the common stock with respect to the payment of dividends or amounts upon liquidation, dissolution, winding up or voting. As a result of the aforementioned Offering and certain subsequent stock option exercises, the Company had 38,281,836 shares of common stock and no shares of preferred stock outstanding as of January 29, 2012.
Immediately prior to the Offering, the Company had 27,758,129 shares of Class A common stock, 9,005,217 shares of Class B redeemable common stock and 10,683,333 shares of Series A redeemable preferred stock outstanding. The shares of Class B redeemable common stock were to be converted into an equivalent number of shares of Class A common stock at any time at the option of the holder and would automatically convert upon (i) the sale, transfer, assignment or conveyance to a competitor or (ii) the consummation of a liquidity event (as defined) or a public offering (as defined). Due to this contingent redemption feature, prior to the completion of the Offering, the Class B redeemable common stock was historically classified in the consolidated balance sheets as temporary equity rather than stockholders’ equity, with adjustments to the fair value of the Class B redeemable common stock made at each reporting date.
The Series A redeemable preferred stock was issued on December 15, 2004 with a mandatory redemption date upon the earlier of a liquidity event (as defined) or December 15, 2011 (“Redemption Date”). The Series A redeemable preferred stock contained a liquidation preference of $1.00 per share, with annual accretion at a rate of 5% and accretion of a debt discount from December 15, 2004 through the Redemption Date that is included in interest expense in the consolidated statements of operations. The liquidation preference, or “Redemption Value,” increased annually based on the accretion of the shares; however, the annual accretion of the Redemption Value was forgiven at the Redemption Date because the Company achieved certain financial targets, as specified in the Company’s Amended Certificate. Prior to the Offering, in accordance with ASC 480, Distinguishing Liabilities from Equity, the Company classified the Series A redeemable preferred stock as a liability on its consolidated balance sheet. The Redemption Value as of January 31, 2011 was $13,722.
43
Table of Contents
Teavana Holdings, Inc.
Notes to Consolidated Financial Statements – (continued)
(dollars in thousands, except per share and store data)
Additionally, on July 13, 2011, the Board of Directors and stockholders of the Company approved a 3.70294176910785-for-1 stock split for each outstanding share of Class A and Class B common stock, subsequently converted to common stock, with effect from filing of a Certificate of Amendment with the Secretary of State for the State of Delaware. The stock split became effective on July 26, 2011. As of this date, all issued and outstanding shares of common stock and stock options exercisable were retroactively adjusted to reflect this stock split for all periods presented.
| 6. | Fair Value Measurements |
The guidance for fair value measurements establishes the authoritative definition of fair value, sets out a framework for measuring fair value and outlines the required disclosures regarding fair value measurements. Fair value is the price that would be received to sell an asset or paid to transfer a liability in the principal or most advantageous market for the asset or liability in an orderly transaction between market participants at the measurement date. The Company uses a three-tier fair value hierarchy based upon observable and non-observable inputs as follows:
| • | Level 1: Quoted market prices in active markets for identical assets or liabilities. |
| • | Level 2: Inputs other than Level 1 that are either directly or indirectly observable. |
| • | Level 3: Unobservable inputs developed using the Company’s estimates and assumptions which reflect those that market participants would use. |
The Company’s financial instruments have historically consisted solely of its Class B redeemable common stock, classified as temporary equity. Concurrent with the Offering as described in Note 5 – “Common and Preferred Stock and Stockholders’ Equity,” all shares of the Class B redeemable common stock were converted into shares of Class A common stock, and subsequently common stock, resulting in the corresponding reclassification of temporary equity into additional paid-in capital. As such, because historically the Company’s balances measured at fair value on a recurring basis consisted solely of the Class B redeemable common stock, there were no financial instruments requiring fair value measurement on a recurring basis as of January 29, 2012. The following table summarizes the Company’s balances measured at fair value as of January 29, 2012 and January 30, 2011:
| Fair Value Hierarchy Category | ||||||||||||
| Level 1 | Level 2 | Level 3 | ||||||||||
| January 29, 2012 |
$ | — | $ | — | $ | — | ||||||
| January 30, 2011 |
— | — | 81,401 | |||||||||
The following table presents the change in the estimated fair value of the Class B redeemable common stock measured using significant unobservable inputs (Level 3):
| January 29, 2012 | January 30, 2011 | January 31, 2010 | ||||||||||
| Fair value measurement at beginning of period |
$ | 81,401 | $ | 21,888 | $ | 15,808 | ||||||
| Change in fair value recorded in accumulated deficit |
172,546 | 59,513 | 6,080 | |||||||||
|
|
|
|
|
|
|
|||||||
| Fair value measurement at end of period |
$ | 253,947 | [1] | $ | 81,401 | $ | 21,888 | |||||
|
|
|
|
|
|
|
|||||||
| (1) | The Class B redeemable common stock was redeemed on August 2, 2011, the date of the consummation of the Offering. As such, this represents the fair value as of that date immediately prior to redemption. |
Historically, the Class B redeemable common stock has been measured at fair value at each reporting period with changes in fair value recorded directly to equity based on the change in the underlying fair value of the Company’s common stock during each fiscal period presented. The Class B redeemable common stock was classified to permanent equity, no longer requiring fair value measurement on a recurring basis, concurrent with the Offering.
| 7. | Net income per share |
The following table sets forth the computation of basic and diluted net income per share in accordance with ASC 260, Earnings per Share (“ASC 260”). Basic net income per share is calculated by dividing net income by the weighted average common shares outstanding during the period. Diluted net income per share is calculated by dividing net income by the weighted average number of common shares plus potentially dilutive common shares, primarily consisting of the Company’s non-qualified stock options, outstanding during the period. The treasury stock method was used to determine the dilutive effect of the stock options. The following table details the calculation of basic and diluted net income per share:
| Fiscal Year Ended | ||||||||||||
| January 29, 2012 | January 30, 2011 | January 31, 2010 | ||||||||||
| Numerator: |
$ | 17,759 | $ | 12,003 | $ | 5,291 | ||||||
|
|
|
|
|
|
|
|||||||
| Denominator: |
||||||||||||
| For basic net income per share - weighted average shares basis |
37,481,072 | 36,749,460 | 36,749,460 | |||||||||
| Effect of dilutive stock options |
938,236 | 975,607 | 572,738 | |||||||||
|
|
|
|
|
|
|
|||||||
| For diluted net income per share - adjusted weighted average shares basis |
$ | 38,419,308 | $ | 37,725,067 | $ | 37,322,198 | ||||||
|
|
|
|
|
|
|
|||||||
| Net income per share: |
||||||||||||
| Basic |
$ | 0.47 | $ | 0.33 | $ | 0.14 | ||||||
| Diluted |
$ | 0.46 | $ | 0.32 | $ | 0.14 | ||||||
44
Table of Contents
Teavana Holdings, Inc.
Notes to Consolidated Financial Statements – (continued)
(dollars in thousands, except per share and store data)
As of January 29, 2012, the Company had 38,281,836 shares of common stock outstanding. As of January 30, 2011, the Company had 27,744,243 and 9,005,217 shares of Class A common stock and Class B redeemable common stock, respectively, outstanding. The Class A common stock and Class B redeemable common stock shared equally in rights to dividends, undistributed earnings and voting rights. As a result, the two class method has historically not been required for computation of net income per share.
Anti-dilutive common stock options totaling 285,361 were excluded from the weighted average shares outstanding for the diluted per share calculation as of January 29, 2012.
| 8. | Leases |
The Company has entered into operating leases for its stores, distribution center and store support center. Initial lease terms for stores are generally ten years with rent escalations and no renewal options. Rent expense for leases with rent escalations is recognized on a straight-line basis over the term of the occupancy of the lease. The leases are net leases under which the Company pays the taxes, insurance and common area maintenance costs. The leases may also provide for both minimum rent payments and contingent rentals based on a percentage of sales in excess of specified amounts. In certain leases, the landlord also charges the Company a portion of its marketing expense.
Total minimum and contingent rent expense for fiscal 2011, 2010 and 2009 were as follows:
| Fiscal Year Ended | ||||||||||||
| January 29, 2012 | January 30, 2011 | January 31, 2010 | ||||||||||
| Minimum rentals |
$ | 14,013 | $ | 11,000 | $ | 8,464 | ||||||
| Contingent rentals |
303 | 127 | 51 | |||||||||
|
|
|
|
|
|
|
|||||||
| Total |
$ | 14,316 | $ | 11,127 | $ | 8,515 | ||||||
|
|
|
|
|
|
|
|||||||
Future minimum lease payments for non-cancelable operating leases with an initial term of one year or more are as follows as of January 29, 2012:
| Fiscal year |
Amount | |||
| 2012 |
$ | 14,709 | ||
| 2013 |
16,946 | |||
| 2014 |
17,340 | |||
| 2015 |
17,135 | |||
| 2016 |
15,862 | |||
| Thereafter |
58,339 | |||
|
|
|
|||
| $ | 140,331 | |||
|
|
|
|||
| 9. | Stock-based Compensation |
Under the Company’s 2004 Management Incentive Plan (the “2004 Plan”), adopted on December 15, 2004, up to 1,851,471 stock options may be granted to certain employees and outside directors or advisors to purchase a fixed number of shares of the Company’s common stock at prices not
45
Table of Contents
Teavana Holdings, Inc.
Notes to Consolidated Financial Statements – (continued)
(dollars in thousands, except per share and store data)
less than 100% of the estimated fair market value at the date of grant. All stock-based awards issued under the plan are non-qualified stock options. On July 18, 2011, the Board of Directors and stockholders authorized the establishment of the Teavana 2011 Equity Incentive Plan (the “2011 Plan”), effective immediately after the SEC’s declaration of effectiveness of the Registration Statement and immediately prior to the pricing of the Offering, both of which took place on July 27, 2011. Under the 2011 Plan, up to 750,000 equity awards, including stock options, stock appreciation rights, restricted or unrestricted stock awards, restricted stock units, performance awards or other stock-based awards, may be granted to certain employees and outside directors to purchase a fixed number of shares of the Company’s common stock at prices not less than 100% of the estimated fair market value at the date of the grant. All shares of stock issued upon exercise of stock options under the 2004 and 2011 Plans will be newly issued shares. Share options forfeited or canceled are eligible for reissuance under the 2011 Plan. Also, concurrent with the pricing of the Offering on July 27, 2011, the Board of Directors authorized a grant to certain members of the Company’s management, certain other employees and outside directors of 580,500 non-qualified stock options to purchase an equal number of shares of common stock. Other immaterial grants were authorized and made subsequent to the Offering during fiscal 2011.
The Company accounts for stock-based awards in accordance with ASC 718. ASC 718 requires measurement of compensation cost for all stock-based awards at fair value on the grant date (or measurement date, if different) and recognition of compensation expense, net of forfeitures, over the requisite service period for awards expected to vest. Stock-based compensation expense was $790, $157, and $169 in fiscal 2011, 2010 and 2009, respectively and is recognized on a pre-tax basis. Upon consummation of the Offering, the Company recognized $173 in compensation expense resulting from the accelerated vesting of all unvested stock options to purchase shares of common stock granted under the 2004 Plan. As such, vesting of approximately 162,466 options was accelerated and the options became exercisable, subject to certain provisions at the closing of the Offering.
The fair value of stock options granted under the 2004 and 2011 Plans was estimated at the date of grant using the Black-Scholes option pricing model. The Black-Scholes option pricing model was developed for use in estimating the fair value of traded options. Stock option pricing models require the input of highly subjective assumptions, including the expected volatility of the stock price. The Company’s stock has only been publically traded since July 28, 2011; therefore, changes in these subjective input assumptions may affect the grant date fair value estimates. These assumptions were based on management’s best estimate and available information at the time of grant. The Company estimated the fair value of options granted under the 2011 Plan with the following assumptions:
| January 29, 2012 | January 30, 2011 | January 31, 2010 | ||||||||||
| Expected life (years) (1) |
6.25 Years | N/A | 6.25 Years | |||||||||
| Risk-free interest rate (2) |
1.4%-1.6 | % | N/A | 2.3 | % | |||||||
| Volatility (3) |
54.0 | % | N/A | 53.0 | % | |||||||
| Dividend yield (4) |
0 | % | N/A | 0 | % | |||||||
| 1) | Represents the period of time stock options are expected to remain outstanding. As the Company has only awarded “plain vanilla options” as described in ASC 718-10-S99, Compensation – Stock Compensation: Overall: SEC Materials, the Company used the “simplified” method for determining the expected life of the options granted. The simplified method calculates the expected term as the sum of the vesting term and the original contract term divided by two. The Company will continue to use the simplified method until such time that it has sufficient historical data for options to accurately estimate the expected term of stock-based awards. |
| 2) | Based on the US Treasury yield curve in effect at the time of grant with a term consistent with the expected life of stock options. |
| 3) | Expected stock price volatility incorporated historical and implied volatility of similar entities whose share prices are publicly available. The Company plans to use peer company volatility for the foreseeable future until sufficient historical data is available. |
| 4) | The Company has not paid regular dividends on its common stock and does not expect to pay dividends on its common stock in the foreseeable future. |
46
Table of Contents
Teavana Holdings, Inc.
Notes to Consolidated Financial Statements – (continued)
(dollars in thousands, except per share and store data)
The following table represents stock options granted, exercised, repurchased or forfeited under the 2004 and 2011 Plans during fiscal 2011, 2010 and 2009. There were no options that expired during these fiscal periods.
| Stock Options | Weighted Average Exercise Price |
|||||||
| Outstanding at February 1, 2009 |
1,670,027 | $ | 1.24 | |||||
| Granted |
181,444 | 2.43 | ||||||
| Exercised |
— | — | ||||||
| Repurchased or forfeited |
— | — | ||||||
|
|
|
|||||||
| Outstanding at January January 31, 2010 |
1,851,471 | $ | 1.36 | |||||
| Granted |
— | — | ||||||
| Exercised |
— | — | ||||||
| Repurchased or forfeited |
— | — | ||||||
|
|
|
|||||||
| Outstanding at January 30, 2011 |
1,851,471 | $ | 1.36 | |||||
| Granted |
585,500 | 16.98 | ||||||
| Exercised |
(460,947 | ) | 1.38 | |||||
| Repurchased or forfeited |
(68,719 | ) | 11.76 | |||||
|
|
|
|||||||
| Outstanding at January 29, 2012 |
1,907,305 | $ | 5.77 | |||||
|
|
|
|||||||
Under the 2004 and 2011 Plans, options generally become exercisable over a four-year period and expire ten years from the date of grant. Additionally, stock option grants generally vest 25% on each anniversary of the grant date, commencing with the first anniversary of the grant date (in the case of the 580,500 options granted under the 2011 Plan concurrent with the pricing of the Offering commencing with the first anniversary of the closing of that transaction on August 2, 2012). The following is a summary of the changes in the Company’s non-vested stock options during the fiscal 2011, 2010 and 2009:
| Number of Stock Options |
Weighted-Average Grant-Date Fair Value |
|||||||
| Non-vested stock options outstanding at February 1, 2009 |
806,778 | $ | 0.57 | |||||
| Granted |
181,444 | 1.29 | ||||||
| Vested |
(396,676 | ) | 0.53 | |||||
| Forfeited |
— | — | ||||||
|
|
|
|||||||
| Non-vested stock options outstanding at January 31, 2010 |
591,546 | $ | 0.81 | |||||
| Granted |
— | — | ||||||
| Vested |
(222,177 | ) | 0.73 | |||||
| Forfeited |
— | — | ||||||
|
|
|
|||||||
| Non-vested stock options outstanding at January 30, 2011 |
369,369 | $ | 0.86 | |||||
| Granted |
585,500 | 8.91 | ||||||
| Vested |
(355,483 | ) | 0.87 | |||||
| Forfeited |
(59,386 | ) | 7.01 | |||||
|
|
|
|||||||
| Non-vested stock options outstanding at January 29, 2012 |
540,000 | $ | 8.91 | |||||
|
|
|
|||||||
The total fair value of stock options that vested during the year ended January 29, 2012 was $309. As of January 29, 2012, there was $3,962 of unrecognized compensation cost related to non-vested stock option awards. The compensation cost is expected to be recognized through fiscal 2015 based on existing vesting terms with the weighted average remaining expense recognition period being approximately 2.01 years with a total intrinsic value related to these options of $1,155 as of January 29, 2012.
47
Table of Contents
Teavana Holdings, Inc.
Notes to Consolidated Financial Statements – (continued)
(dollars in thousands, except per share and store data)
The options outstanding at January 29, 2012, by exercise price, are summarized below:
| Number of Stock Options Outstanding |
Stock Options Exercisable |
Exercise Price | Average Remaining Contractual Life (in Years) |
|||||||||||
| 911,854 | 911,854 | $ | 1.12 | 3.90 | ||||||||||
| 100,450 | 100,450 | 1.35 | 5.75 | |||||||||||
| 210,647 | 210,647 | 1.62 | 6.17 | |||||||||||
| 14,812 | 14,812 | 1.76 | 6.58 | |||||||||||
| 129,542 | 129,542 | 2.43 | 7.75 | |||||||||||
| 535,000 | — | 17.00 | 9.50 | |||||||||||
| 5,000 | — | 15.11 | 9.88 | |||||||||||
|
|
|
|
|
|
|
|
|
|||||||
| 1,907,305 | 1,367,305 | 6.12 | ||||||||||||
|
|
|
|
|
|||||||||||
There were 1,367,305 options exercisable as of January 29, 2012 with a weighted average exercise price of $1.34 per share and intrinsic value of $24,497. Additionally, 460,947 options were exercised during fiscal 2011 with an intrinsic value of $7,707. The exercise of these stock options gave rise to a tax benefit of $2,925.
The Company has calculated its additional paid-in capital pool (“APIC pool”) based on the actual income tax benefits received from exercises of stock options granted under ASC 718 using the long method. The APIC pool is available to absorb future tax.
| 10. | Related Party Transactions |
In December 2007, the Company made a loan in the principal amount of $50 at an annual interest rate of 10% to an officer of the Company. On March 21, 2011, the Company forgave the entire principal amount of the loan, plus accrued and unpaid interest thereon, in consideration of the Company’s repurchase of unexercised options to purchase 9,332 shares of the Company’s Class A Common Stock granted in June 2005.
The Company has employment contracts with two executive officers who are also holders of common stock. The contracts provide for severance compensation if the executives are terminated.
In December 2004, the Company entered into a contract with SKM Growth Investors, L.P., to provide financial advisory and management services, the predecessor entity to Parallel Investment Partners, LLC. Parallel manages certain investments on behalf of SKM Equity Fund III, L.P., a private-equity investment fund that holds substantially all of the ownership interest in one of the Company’s stockholders. The fee was $115 for fiscal 2011 and $250 for fiscal years 2010 and 2009. This contract was terminated in connection with The Company’s Offering in August 2011.
| 11. | Income Taxes |
The components of income before income taxes for fiscal 2011, 2010 and 2009, respectively, are as follows:
| Fiscal Year Ended | ||||||||||||
| January 29, 2012 | January 30, 2011 | January 31, 2010 | ||||||||||
| (dollars in thousand) | ||||||||||||
| Domestic |
$ | 30,074 | $ | 20,909 | $ | 9,761 | ||||||
| Foreign |
(158 | ) | — | — | ||||||||
|
|
|
|
|
|
|
|||||||
| Total income before income taxes: |
$ | 29,916 | $ | 20,909 | $ | 9,761 | ||||||
|
|
|
|
|
|
|
|||||||
The significant components of the provision for income taxes are as follows:
| Fiscal Year Ended | ||||||||||||
| January 29, 2012 | January 30, 2011 | January 31, 2010 | ||||||||||
| Current: |
||||||||||||
| Federal |
$ | 7,855 | $ | 7,183 | $ | 3,106 | ||||||
| State |
2,362 | 1,976 | 832 | |||||||||
|
|
|
|
|
|
|
|||||||
| Total current |
10,217 | 9,159 | 3,938 | |||||||||
|
|
|
|
|
|
|
|||||||
| Deferred: |
||||||||||||
| Federal |
2,089 | 188 | 486 | |||||||||
| Foreign |
(42 | ) | — | — | ||||||||
| State |
(107 | ) | (441 | ) | 46 | |||||||
|
|
|
|
|
|
|
|||||||
| Total deferred |
1,940 | (253 | ) | 532 | ||||||||
|
|
|
|
|
|
|
|||||||
| Total |
$ | 12,157 | $ | 8,906 | $ | 4,470 | ||||||
|
|
|
|
|
|
|
|||||||
48
Table of Contents
Teavana Holdings, Inc.
Notes to Consolidated Financial Statements – (continued)
(dollars in thousands, except per share and store data)
The provision for income taxes recorded differs from the federal statutory rate primarily due to state income tax expense and nondeductible expense, which primarily consists of the accretion of the Series A redeemable preferred stock. The reconciliation to the federal statutory rate is as follows:
| Fiscal Year Ended | ||||||||||||
| January 29, 2012 | January 30, 2011 | January 31, 2010 | ||||||||||
| Provision at federal statutory rate |
35.0 | % | 35.0 | % | 34.0 | % | ||||||
| State income taxes, net |
4.7 | % | 4.5 | % | 4.7 | % | ||||||
| Series A preferred stock accretion |
1.4 | % | 3.6 | % | 6.2 | % | ||||||
| Other, net |
-0.5 | % | -0.5 | % | 0.9 | % | ||||||
|
|
|
|
|
|
|
|||||||
| Effective tax rate |
40.6 | % | 42.6 | % | 45.8 | % | ||||||
|
|
|
|
|
|
|
|||||||
The deferred income tax assets and liabilities as presented in the accompanying balance sheets consisted of the following amounts:
| January 29, 2012 | January 30, 2011 | |||||||
| Deferred income tax assets: |
||||||||
| Deferred rent liability |
$ | 5,047 | $ | 2,931 | ||||
| Inventory reserve |
1,816 | 1,274 | ||||||
| Deferred revenue |
447 | 633 | ||||||
| Stock compensation expense |
629 | 318 | ||||||
| Accrued vacation |
99 | 87 | ||||||
| Foreign net operating losses |
44 | — | ||||||
| Other liabilities |
234 | 263 | ||||||
|
|
|
|
|
|||||
| Total deferred income tax assets |
8,316 | 5,506 | ||||||
|
|
|
|
|
|||||
| Deferred income tax liabilities: |
||||||||
| Depreciation |
(8,471 | ) | (3,873 | ) | ||||
| Prepaid expenses |
(576 | ) | (424 | ) | ||||
|
|
|
|
|
|||||
| Total deferred income tax liability |
(9,047 | ) | (4,297 | ) | ||||
|
|
|
|
|
|||||
| Net deferred tax (liabilities)/assets |
$ | (731 | ) | $ | 1,209 | |||
|
|
|
|
|
|||||
| Deferred income tax asset, current |
$ | 1,839 | $ | 1,629 | ||||
| Deferred income tax liability, non-current |
(2,570 | ) | (420 | ) | ||||
|
|
|
|
|
|||||
| Net deferred tax (liabilities)/assets |
$ | (731 | ) | $ | 1,209 | |||
|
|
|
|
|
|||||
In assessing the realizability of deferred tax assets, the Company considers whether it is more likely than not that some portion or all of the deferred tax assets will not be realized. The ultimate realization of deferred tax assets is dependent upon the generation of future taxable income during the periods in which those temporary differences become deductible. The Company has determined that no such valuation allowance is necessary as of January 29, 2012 and January 30, 2011
The Company adopted ASC 740-10, Accounting for Income Taxes, related to unrecognized tax benefits on January 29, 2007 with no cumulative effect adjustment recorded at adoption. In accordance with ASC 740-10, the Company adjusts for such liabilities when its judgment changes as of the result of the evaluation of new information. As of January 29, 2012, and for all periods presented, the Company has no liability with respect to unrecognized tax benefits.
The Company’s income taxes payable have been reduced by the tax benefits from the Company’s Management Incentive Plans through which employees and certain directors are granted stock-based awards. For all awards granted, primarily the Company’s non-qualified stock options, the Company receives an income tax benefit calculated as the difference between the fair market value of the stock issued at the time of the exercise and the option price, tax effected. The Company generated net excess tax benefits from stock options exercised of $2,925 during fiscal 2011, which were reflected as increases to additional paid-in capital. There were no stock option exercises during fiscal 2010.
The Company and its subsidiaries are subject to US federal income tax regulations, as well as, income tax regulations of multiple state and foreign jurisdictions with varying statutes of limitation. The Company’s tax years for fiscal 2009 through 2011 generally remain subject to examination by federal and most state taxing authorities. The audit of the Company’s US income tax return for fiscal 2007 was completed in fiscal 2009. The Company has foreign net operating loss carry forwards of $44 that expire in 2022.
| 12. | Employee Benefit Plan |
The Company established the Teavana Corporation Retirement Savings Plan (the “Teavana 401(k) Plan”) on July 1, 2006. Under this plan, employees of the Company who are 21 years of age or older and that have completed six months of service are eligible to participate. The Company matches 100% of participant contributions up to 1% of participant compensation and 50% of participant contributions from 1% to 6% of a participant’s compensation.
Company contributions to the Teavana 401(k) Plan were $510, $416 and $334 during fiscal 2011, 2010 and 2009, respectively.
49
Table of Contents
Teavana Holdings, Inc.
Notes to Consolidated Financial Statements – (continued)
(dollars in thousands, except per share and store data)
| 13. | Commitments and Contingencies |
From time to time in the normal course of business, the Company is involved in legal proceedings. The Company evaluates the need for loss accruals under the requirements of FASB ASC 450 – Contingencies. The Company records an estimated loss for any claim, lawsuit, investigation or proceeding when it is probable that a liability has been incurred and the amount of loss can be reasonably estimated. If the reasonable estimate of a probable loss is a range, and no amount within the range is a better estimate, then the Company records the minimum amount in the range as the loss accrual. If a loss is not probable or a probable loss cannot be reasonably estimated, no liability is recorded.
On December 28, 2011, a putative class action lawsuit styled Chavez v. Teavana Corp. alleging wage and hour violations of the California Labor Code for General Managers in California was filed in the Superior Court of California, County of Los Angeles. The plaintiff seeks on behalf of herself and other putative class members, compensatory damages, restitution, putative and exemplary damages, penalties, interest and other relief. The Company disputes the material allegations in the complaint and intends to defend the action vigorously. Due to inherent uncertainties of litigation and because the lawsuit is in early procedural stages, the Company cannot at this time accurately predict the ultimate outcome, or any potential liability, of the matter.
The Company is also subject to other legal proceedings and claims that arise in the ordinary course of its business. These include claims resulting from “slip and fall” accidents, employment related claims and claims from guests or team members alleging illness or injury or other operational concerns. To date, no claims of these types of litigation, certain of which are covered by insurance policies, have had a material effect on the Company. While it is not possible to predict the outcome of these other suits, legal proceedings and claims with certainty, management does not believe that they would have a material adverse effect on the Company’s financial position and results of operations.
| 14. | Subsequent Events |
The Company has evaluated subsequent events from the balance sheet date through the date the consolidated financial statements were available to be issued and concluded that no additional material subsequent events have occurred that would require recognition in the consolidated financial statements or disclosure in the notes to the consolidated financial statements.
50
Table of Contents
| 15. | Selected Quarterly Financial Data (unaudited) |
The following table sets forth certain unaudited consolidated quarterly financial information (in thousands, except store data) for each of the four quarters in fiscal 2011 and 2010, respectively. In our opinion, the following selected unaudited consolidated quarterly statements of operations data have been prepared on the same basis as the audited consolidated financial statements included in this Form 10-K and reflect all necessary adjustments, consisting of only normal recurring adjustments, necessary for fair presentation of these data. Operating results for any fiscal quarter are not necessarily indicative of results for the full year. Historical results are not necessarily indicative of results to be expected for future periods.
| Fiscal 2011 | Fiscal 2010 | |||||||||||||||||||||||||||||||
| First Quarter |
Second Quarter |
Third Quarter |
Fourth Quarter |
First Quarter |
Second Quarter |
Third Quarter |
Fourth Quarter |
|||||||||||||||||||||||||
| Net sales |
$ | 34,939 | $ | 31,313 | $ | 33,426 | $ | 68,422 | $ | 25,773 | $ | 22,982 | $ | 24,746 | $ | 51,200 | ||||||||||||||||
| Gross profit |
22,488 | 19,127 | 20,677 | 44,905 | 15,752 | 13,526 | 14,509 | 34,639 | ||||||||||||||||||||||||
| Income from operations |
6,456 | 2,332 | 1,612 | 21,189 | 3,979 | 1,657 | 1,278 | 16,580 | ||||||||||||||||||||||||
| Net income |
$ | 3,323 | $ | 1,031 | $ | 936 | $ | 12,469 | $ | 1,927 | $ | 579 | $ | 340 | $ | 9,157 | ||||||||||||||||
| Percentage of net sales: |
||||||||||||||||||||||||||||||||
| Net sales |
100.0 | % | 100.0 | % | 100.0 | % | 100.0 | % | 100.0 | % | 100.0 | % | 100.0 | % | 100.0 | % | ||||||||||||||||
| Gross profit |
64.4 | % | 61.1 | % | 61.9 | % | 65.6 | % | 61.1 | % | 58.9 | % | 58.6 | % | 67.7 | % | ||||||||||||||||
| Income from operations |
18.5 | % | 7.4 | % | 4.9 | % | 31.0 | % | 15.4 | % | 7.2 | % | 5.2 | % | 32.4 | % | ||||||||||||||||
| Net income |
9.5 | % | 3.3 | % | 2.8 | % | 18.2 | % | 7.5 | % | 2.5 | % | 1.4 | % | 17.9 | % | ||||||||||||||||
| Net income per share: |
||||||||||||||||||||||||||||||||
| Basic |
$ | 0.09 | $ | 0.03 | $ | 0.02 | $ | 0.33 | $ | 0.05 | $ | 0.02 | $ | 0.01 | $ | 0.25 | ||||||||||||||||
| Diluted |
$ | 0.09 | $ | 0.03 | $ | 0.02 | $ | 0.32 | $ | 0.05 | $ | 0.02 | $ | 0.01 | $ | 0.24 | ||||||||||||||||
| Selected store data: |
||||||||||||||||||||||||||||||||
| Number of stores at end of period |
161 | 179 | 196 | 200 | 118 | 128 | 141 | 146 | ||||||||||||||||||||||||
| Comparable store sales growth for period, including e-commerce (1) |
9.1 | % | 8.7 | % | 8.5 | % | 8.6 | % | 18.6 | % | 9.1 | % | 7.7 | % | 10.6 | % | ||||||||||||||||
| Comparable store sales growth for period, excluding e-commerce (2) |
6.0 | % | 6.9 | % | 6.0 | % | 4.4 | % | 15.7 | % | 6.9 | % | 5.9 | % | 7.5 | % | ||||||||||||||||
| (1) | Comparable store sales, including e-commerce, includes comparable store sales from all company-owned stores that have been open for at least 15 full fiscal months and sales from our website www.teavana.com. |
| (2) | Comparable store sales, excluding e-commerce, include sales from company-owned stores that have been open for at least 15 full fiscal months. Comparability is typically achieved 12 months after the initial three-month period from opening during which new stores generally experience higher-than-average sales volumes. |
51
Table of Contents
| Item 9. | Changes in and Disagreements With Accountants on Accounting and Financial Disclosure. |
None.
| Item 9A. | Controls and Procedures. |
Our management has evaluated, under the supervision and with the participation of our Chief Executive Officer and Chief Financial Officer, the effectiveness of our disclosure controls and procedures, as defined in Rule 13(a)-15(e), as of the end of the period covered by this Annual Report on Form 10-K pursuant to Rule 13a-15(b) of the Securities Exchange Act of 1934, as amended (the “Exchange Act”). Based on that evaluation, our Chief Executive Officer and Chief Financial Officer have concluded that our disclosure controls and procedures as of the end of the period covered by this Annual Report on Form 10-K are effective in providing reasonable assurance that information required to be disclosed in our Exchange Act reports is (1) recorded, processed, summarized and reported in a timely manner and (2) accumulated and communicated to our management, including our Chief Executive Officer and Chief Financial Officer, as appropriate to allow timely decisions regarding required disclosure. Our management, including our Chief Executive Officer and Chief Financial Officer, does not expect that our disclosure controls and procedures will prevent or detect all error and all fraud. While our disclosure controls and procedures are designed to provide reasonable assurance of their effectiveness, because of the inherent limitations in all control systems, no evaluation of controls can provide absolute assurance that all control issues and instances of fraud, if any, within the Company have been detected. There were no changes in our internal control over financial reporting during the quarter ended January 29, 2012 that have materially affected or are reasonably likely to materially affect our internal control over financial reporting.
This Annual Report on Form 10-K does not include a report of management’s assessment regarding internal control over financial reporting or an attestation report of the Company’s registered public accounting firm, due to a transition period established by the rules of the SEC for newly public companies.
| Item 9B. | Other Information. |
None.
| Item 10. | Directors, Executive Officers and Corporate Governance. |
The information required by this item is included in the “Our Board of Directors”, “Information Concerning Executive Officers”, “Section 16(a) Beneficial Ownership Reporting Compliance”, “Board Committees and Meetings”, and “Director Compensation” sections of the Company’s Proxy Statement to be filed with the SEC within 120 days of the end of the fiscal year ended January 29, 2012 in connection with the Company’s 2012 Annual Meeting of Stockholders to be held in June 2012, and is incorporated by reference herein.
We have adopted a Code of Business Conduct and Ethics, which applies to all employees including our principal executive officer and principal financial officer and persons performing similar functions. The Code is available on our website, www.teavana.com, under “Investor Relations, Corporate Governance” and in print to any person who requests it. Any amendments to, or waivers from, a provision of our Code that applies to our principal executive officer, principal financial officer or persons performing similar functions and that relates to any element of the Code enumerated in paragraph (b) of Item 406 of Regulation S-K will be disclosed by posting such information on our website.
| Item 11. | Executive Compensation. |
The information required by this item is included in the “Executive Compensation Discussion and Analysis,”, “Summary Compensation Table” and “Grants of Plan-Based Awards” sections of the Company’s Proxy Statement to be filed with the SEC within 120 days of the end of the fiscal year ended January 29, 2012 in connection with the Company’s 2012 Annual Meeting of Stockholders to be held in June 2012, and is incorporated by reference herein.
| Item 12. | Security Ownership of Certain Beneficial Owners and Management and Related Stockholder Matters. |
The information required by this item is included in the “Security Ownership of Officers, Directors and Principal Stockholders,” and “Equity Compensation Plan Information” sections of the Company’s Proxy Statement to be filed with the SEC within 120 days of the end of the fiscal year ended January 29, 2012 in connection with the Company’s 2012 Annual Meeting of Stockholders to be held in June 2012, and is incorporated by reference herein.
| Item 13. | Certain Relationships and Related Transactions, and Director Independence. |
The information required by this item is included in the “Director Independence” and “Compensation Committee Interlocks and Insider Participation” sections of the Company’s Proxy Statement to be filed with the SEC within 120 days of the end of the fiscal year ended January 29, 2012 in connection with the Company’s 2012 Annual Meeting of Stockholders to be held in June 2012, and is incorporated by reference herein.
| Item 14. | Principal Accountant Fees and Services. |
The information required by this item is included in the “Fee Information” portion of Proposal 4 – “Ratification of Independent Registered Public Accounting Firm” to be included in the Company’s Proxy Statement to be filed with the SEC within 120 days of the end of the fiscal year ended January 29, 2012 in connection with the Company’s 2012 Annual Meeting of Stockholders to be held in June 2012, and is incorporated by reference herein.
52
Table of Contents
| Item 15. | Exhibits, Financial Statement Schedules. |
(a) The following documents are filed as part of this Form 10-K:
1. Financial Statements: See “Index to Consolidated Financial Statements” in Part II, Item 8 of this Form 10-K for a list of the Financial Statements required to be filed herewith.
2. Financial Statement Schedule: All Schedules are omitted because they are not required or because the information is immaterial or provided elsewhere in the consolidated financial statements or notes thereto.
3. Exhibits: See Exhibit Index following the signature page of this Annual Report on Form 10-K.
53
Table of Contents
SIGNATURE
Pursuant to the requirements of Section 13 or 15(d) of the Securities Exchange Act of 1934, as amended, the registrant has duly caused this report to be signed on its behalf by the undersigned thereunto duly authorized.
| TEAVANA HOLDINGS, INC. | ||
| By: | /s/ Daniel P. Glennon | |
| Daniel P. Glennon | ||
| Executive Vice President and Chief Financial Officer | ||
| (Principal Financial and Accounting Officer) | ||
| Date: | April 13, 2012 | |
Pursuant to the requirements of the Securities Exchange Act of 1934, this report has been signed below by the following persons on behalf of the registrant and in the capacities and on the dates indicated.
| Signature |
Title |
Date | ||
| /s/ Andrew T. Mack |
Chairman and Chief Executive Officer | April 13, 2012 | ||
| Andrew T. Mack | (principal executive officer) | |||
| /s/ Daniel P. Glennon |
Chief Financial Officer | April 13, 2012 | ||
| Daniel P. Glennon | (principal financial officer and principal accounting officer) | |||
| /s/ Robert J. Dennis |
Director | April 13, 2012 | ||
| Robert J. Dennis | ||||
| /s/ F. Barron Fletcher III |
Director | April 13, 2012 | ||
| F. Barron Fletcher III | ||||
| /s/ John E. Kyees |
Director | April 13, 2012 | ||
| John E. Kyees | ||||
| /s/ Michael J. Nevins |
Director | April 13, 2012 | ||
| Michael J. Nevins | ||||
| /s/ Thomas A. Saunders III |
Director | April 13, 2012 | ||
| Thomas A. Saunders III | ||||
54
Table of Contents
Exhibit Index
| 3.1 | Registrant’s Amended and Restated Certificate of Incorporation, incorporated by reference to Exhibit 3.1 to the Registrant’s Form S-1/A (SEC File No. 333-173775) filed on July 26, 2011. | |
| 3.2 | Registrant’s Amended and Restated By-laws, incorporated by reference to Exhibit 3.2 to the Registrant’s Form S-1/A (SEC File No. 333-173775) filed on July 26, 2011. | |
| 4.1 | Specimen Common Stock Certificate, incorporated by reference to Exhibit 4.1 to the Registrant’s Form S-1/A (SEC File No. 333-173775) filed on July 12, 2011. | |
| 4.2 | Registration Rights Agreement, dated December 17, 2004, among Teavana Holdings, Inc. and the parties listed therein, incorporated by reference to Exhibit 4.2 to the Registrant’s Form S-1 (SEC File No. 333-173775) filed on April 28, 2011. | |
| 10.1 | 2004 Management Incentive Plan, incorporated by reference to Exhibit 10.1 to the Registrant’s Form S-1 (SEC File No. 333-173775) filed on April 28, 2011. | |
| 10.2 | Form of 2004 Management Incentive Plan Option Award Agreement (Employees), incorporated by reference to Exhibit 10.2 to the Registrant’s Form S-1 (SEC File No. 333-173775) filed on April 28, 2011. | |
| 10.3 | Form of 2004 Management Incentive Plan Option Award Agreement (Directors), incorporated by reference to Exhibit 10.3 to the Registrant’s Form S-1 (SEC File No. 333-173775) filed on April 28, 2011. | |
| 10.4 | Teavana Holdings, Inc. 2011 Equity Incentive Plan, incorporated by reference to Exhibit 10.4 to the Registrant’s Form S-1/A (SEC File No. 333-173775) filed on July 18, 2011. | |
| 10.5 | Form of Nonstatutory Stock Option Agreement under 2011 Equity Incentive Plan, incorporated by reference to Exhibit 10.5 to the Registrant’s Form S-1/A (SEC File No. 333-173775) filed on July 18, 2011. | |
| 10.6 | Form of Directors’ and Officers’ Indemnity Agreement, incorporated by reference to Exhibit 10.6 to the Registrant’s Form S-1/A (SEC File No. 333-173775) filed on July 12, 2011. | |
| 10.7 | Amended and Restated Employment Agreement, dated as of April 22, 2011, between Teavana Holdings, Inc. and Andrew T. Mack, incorporated by reference to Exhibit 10.7 to the Registrant’s Form S-1 (SEC File No. 333-173775) filed on April 28, 2011. | |
| 10.8 | Amended and Restated Employment Agreement, dated as of April 22, 2011, between Teavana Holdings, Inc. and Juergen T. Link, incorporated by reference to Exhibit 10.8 to the Registrant’s Form S-1 (SEC File No. 333-173775) filed on April 28, 2011. | |
| 10.9 | Employment Agreement, dated as of April 22, 2011, between Teavana Holdings, Inc. and Daniel P. Glennon, incorporated by reference to Exhibit 10.9 to the Registrant’s Form S-1 (SEC File No. 333-173775) filed on April 28, 2011. | |
| 10.10 | Employment Agreement, dated as of April 22, 2011, between Teavana Holdings, Inc. and Peter M. Luckhurst, incorporated by reference to Exhibit 10.10 to the Registrant’s Form S-1 (SEC File No. 333-173775) filed on April 28, 2011. | |
| 10.11 | Agreement of Lease, dated February 2, 2006, between 500 Long Beach LLC and ST Acquisition Company, incorporated by reference to Exhibit 10.11 to the Registrant’s Form S-1 (SEC File No. 333-173775) filed on April 28, 2011. | |
| 10.12 | Lease Modification Agreement, dated April 1, 2008, between 500 Long Beach LLC and ST Acquisition Company, incorporated by reference to Exhibit 10.11 to the Registrant’s Form S-1 (SEC File No. 333-173775) filed on April 28, 2011. | |
| 10.13 | Agreement of Lease, dated August 12, 2009, between 600 Long Beach LLC and ST Acquisition Company, incorporated by reference to Exhibit 10.13 to the Registrant’s Form S-1/A (SEC File No. 333-173775) filed on June 9, 2011. | |
| 10.14 | Lease Modification and Extension Agreement, dated April 5, 2010, between 600 Long Beach LLC and ST Acquisition Company, incorporated by reference to Exhibit 10.14 to the Registrant’s Form S-1 (SEC File No. 333-173775) filed on April 28, 2011. | |
| 10.15 | Lease Modification Agreement, dated September 13, 2011, between 600 Long Beach LLC and ST Acquisition Company, and incorporated by reference to Exhibit 10.1 to the Registrant’s Form 8-K (SEC File No. 001-35248) filed on September 14, 2011.
| |
55
Table of Contents
| 10.16 | Lease Agreement, dated August 5, 2010, between 3630 Peachtree Road Holdings Limited Partnership and Teavana Corporation, incorporated by reference to Exhibit 10.15 to the Registrant’s Form S-1 (SEC File No. 333-173775) filed on April 28, 2011. | |
| 10.17 | Loan and Security Agreement, dated as of June 12, 2008, among Teavana Holdings, Inc., Teavana Corporation, ST Acquisition Company, Teavana Franchising Corporation and Teavana International, Inc., as obligors, and Fifth Third Bank as lender, incorporated by reference to Exhibit 10.16 to the Registrant’s Form S-1/A (SEC File No. 333-173775) filed on June 9, 2011. | |
| 10.18 | Amendment No. 1 to Loan and Security Agreement, dated as of April 22, 2011, among Teavana Holdings, Inc., Teavana Corporation, ST Acquisition Company, Teavana International, Inc. Teavana Gift Company, as obligors, and Fifth Third Bank as lender, incorporated by reference to Exhibit 10.17 to the Registrant’s Form S-1 (SEC File No. 333-173775) filed on April 28, 2011. | |
| 10.19 | Amendment No. 2 to Loan and Security Agreement, dated as of October 6, 2011, among Teavana Corporation, ST Acquisition Company, Teavana Holdings, Inc., Teavana Franchising Company, Teavana International, Inc. and Teavana Gift Company, as obligors, and Fifth Third Bank as lender, Exhibit 10.1 to the Registrant’s Form 8-K (SEC File No. 001-35248) filed on October 6, 2011. | |
| 21.1 | Subsidiaries of the Registrant.* | |
| 23.1 | Consent of Grant Thornton LLP.* | |
| 31.1 | Certification of Chief Executive Officer pursuant to Rule 13a-14(a)/15d-14(a) of the Securities Exchange Act of 1934, as amended, as adopted pursuant to Section 302 of the Sarbanes-Oxley Act of 2002.* | |
| 31.2 | Certification of Chief Financial Officer pursuant to Rule 13a-14(a)/15d-14(a) of the Securities Exchange Act of 1934, as amended, as adopted pursuant to Section 302 of the Sarbanes-Oxley Act of 2002.* | |
| 32.1 | Certification of Chief Executive Officer pursuant to 18 U.S.C. Section 1350, as adopted pursuant to Section 906 of the Sarbanes-Oxley Act of 2002.* | |
| 32.2 | Certification of Chief Financial Officer pursuant to 18 U.S.C. Section 1350, as adopted pursuant to Section 906 of the Sarbanes-Oxley Act of 2002.* | |
| 101 | Interactive Data File** | |
| * | Filed herewith. |
| ** | Pursuant to Rule 406T of SEC Regulation S-T, the Interactive Data Files on Exhibit 101 hereto are deemed not filed or part of a registration statement or prospectus for purposes of Sections 11 or 12 of the Securities Act of 1933, as amended, are deemed not filed for purposes of Section 18 of the Securities Exchange Act of 1934, as amended, and otherwise are not subject to liability under these Sections. |
56