Attached files
| file | filename |
|---|---|
| 8-K - FORM 8-K - WEC ENERGY GROUP, INC. | d327378d8k.htm |
 April 2012
Exhibit 99.1 |
 2
Cautionary Statement Regarding Forward-Looking Information
Much of the information contained in this presentation is forward-looking
information based upon management’s current expectations and
projections that involve risks and uncertainties. Forward-looking information includes, among other
things, information concerning earnings per share, rate case activity, earnings per
share growth, cash flow, dividend growth and dividend payout ratios, debt
repayment, share repurchases, construction costs and capital expenditures,
investment opportunities, rate base, future electric sales and the capital
structure. Readers are cautioned not to place undue reliance on this
forward-looking information. Forward-looking information is not a guarantee of future performance
and
actual
results
may
differ
materially
from
those
set
forth
in
the
forward-looking
information.
In
addition
to
the
assumptions
and
other
factors
referred
to
in
connection
with
the
forward-looking
information,
including,
without
limitation,
rate recovery of any costs above the PSCW approved amount for the Oak Creek
expansion; PSCW approval of utility construction projects, including
infrastructure upgrades; and continued growth in earnings from ATC, factors that could
cause Wisconsin Energy's actual results to differ materially from those
contemplated in any forward-looking information or otherwise affect our
future results of operations and financial condition include, among others, the following: general
economic conditions; business, competitive and regulatory conditions in the
deregulating and consolidating energy industry, in general, and, in
particular, in the company’s service territories; timing, resolution and impact of pending and
future rate cases and other regulatory decisions; availability of the
company’s generating facilities; unanticipated changes in purchased
power costs; unanticipated changes in coal or natural gas prices and supply and transportation availability;
key
personnel
changes;
the
ability
to
recover
fuel
and
purchased
power
costs;
varying
weather
conditions;
catastrophic
weather-related
or
terrorism-related
damage;
cyber-security
threats;
construction
risks,
including
those
associated
with
the
construction of new environmental controls and renewable generation; adverse
interpretation or enforcement of permit conditions by permitting agencies;
equity and bond market fluctuations; the investment performance of the company’s
pension and other post-retirement benefit plans; the impact of recent and
future federal, state and local legislative and regulatory changes; current
and future litigation, regulatory investigations, proceedings or inquiries, including FERC
matters and IRS audits and other tax matters; the effect of accounting
pronouncements issued periodically by standard setting bodies, including any
requirement for U.S. registrants to follow International Financial Reporting Standards instead
of GAAP; foreign governmental, economic, political and currency risks; and other
factors described under the heading “Factors
Affecting
Results,
Liquidity
and
Capital
Resources”
in
Management’s
Discussion
and
Analysis
of
Financial
Condition and Results of Operations and under the headings “Cautionary
Statement Regarding Forward-Looking Information”
and “Risk Factors”
contained in Wisconsin Energy's Form 10-K for the year ended December 31, 2011
and in subsequent reports filed with the Securities and Exchange
Commission. Wisconsin Energy expressly disclaims any obligation to
publicly update or revise any forward-looking information. |
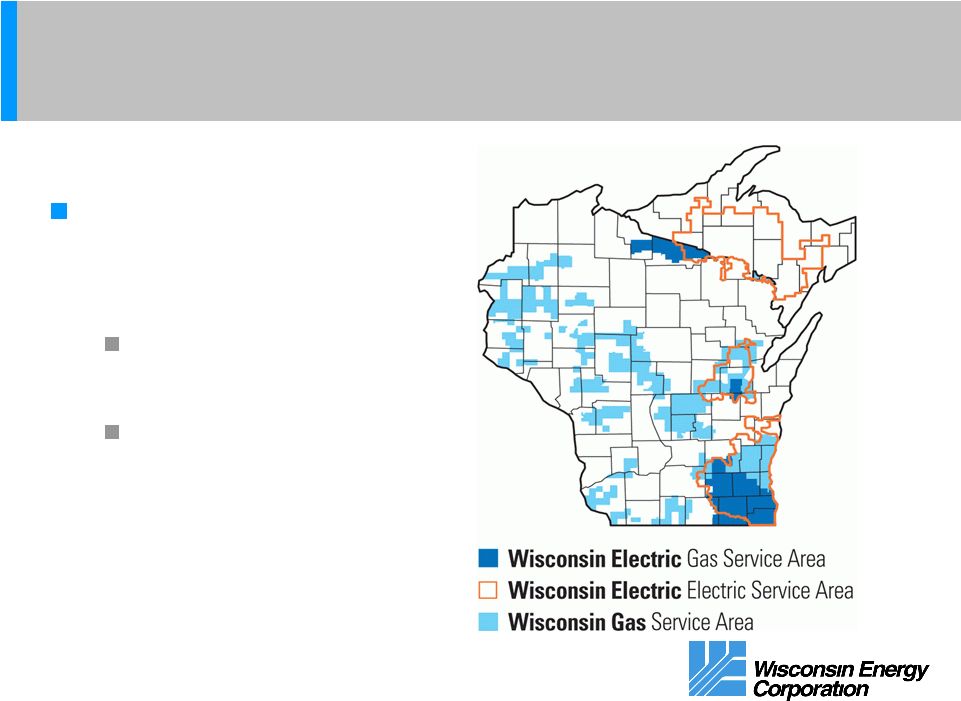 3
Largest electric and
gas company in
Wisconsin
1.1 million electric
customers
1.0 million natural
gas customers
Retail Electric and Gas Utilities |
 4
Investment Thesis
Solid Growth with a Low Risk Profile
Wisconsin Energy is positioned to deliver strong earnings
and dividend growth with a lower than average risk profile
Targeted EPS growth
of 4 -
6%
Double digit dividend growth
-
moving to a 60% dividend
payout ratio in 2014
Proven management team that has delivered strong
financial results and operational excellence
Constructive regulatory climate |
 5
A Track Record of Performance
Consistent Annual Earnings and Dividends Growth
Wisconsin Energy is the only
company in the indices
below that has grown earnings per share and dividends
per share every year since 2003
S&P Utilities Index
S&P Electric Index
Philadelphia Utility Index
Dow Jones Utilities Average
*Sources:
Bloomberg Financial News Service
Barclays Capital |
 6
Projected Earnings Base for 2011 –
2013
Major Segment Contributions
2011A
2012E
2013E
Electric and Gas Utilities
$1.44
$1.46 to $1.51
$6.8 billion rate
base
Power the Future
(1)
$0.66
$0.67
$0.68
Wholesale Electric Transmission
(2)
$0.16
$0.17
$0.18
Unallocated holding company debt
(3)
($0.08)
($0.06)
($0.05)
$2.18
$2.24 to $2.29
(1)
Includes allocation of approximately $375 million of 6.25% rate holding company
debt (2)
26.2% investment in ATC
(3)
Includes unallocated holding company debt and other miscellaneous corporate
costs |
 7
2012 Q1 Update
Reaffirming annual guidance
In our 8-K filing on March 29:
We re-affirmed our 2012 annual earnings guidance of
$2.24 -
$2.29 per share
We lowered our Q1 earnings guidance to 72 -
73
cents from 75 –
78 cents per share
2011-2012 winter was the warmest in more than 100 years
Q1 2011 earnings were 72 cents per share |
 8
2012 Q1 Update
Reaffirming annual guidance
Despite the warmest winter in more than 100 years,
we have reaffirmed our 2012 annual earnings
guidance
Key drivers for the remainder of the year:
Fuel recoveries
Interest savings (timing of long-term debt issuances)
Cost control |
 9
Forecast of Electric Sales
2012 vs. 2011 Actual and Normalized
2012 Forecast vs.
2011 Actual
2012 Forecast vs.
2011 Normalized
Residential
-1.1%
0.0%
Small C&I
0.9%
0.6%
Large C&I (ex. Mines)
-2.3%
-2.4%
Total Large C&I
-7.1%
-7.2%
Total Retail
-0.8%
-2.4% |
 10
Dividend Growth
Accelerating Dividend Payout
The directors raised the quarterly dividend in January
to 30 cents a share –
equivalent to an annual rate of
$1.20 a share
15.4 percent increase over the 2011 amount
Our policy is to move to a dividend payout ratio that is
competitive with our peers
Trending to a 60 percent payout ratio in 2014
This policy should support average annual dividend
increases of more than 10 percent from 2012 to 2014 |
 11
Share Repurchases
$100 Million Repurchased in 2011
To maintain appropriate financial strength and provide
value to our investors, we are implementing a share
repurchase plan
Buy back up to $300 million of Wisconsin Energy common stock
through open market purchases or privately negotiated
transactions through the end of 2013
Through December 2011 repurchased approximately 3.2 million
shares at an average price of $30.79 a share
The final size of the program will be based on actual
capital spending
We do not expect to issue any additional shares |
 12
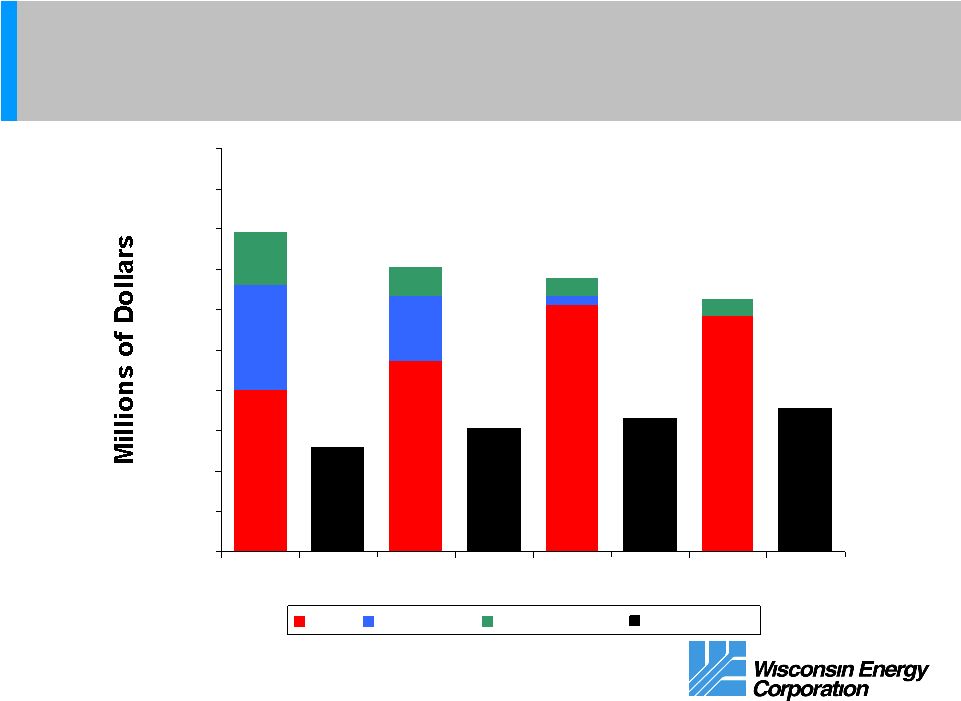
Retail Electric and Gas Utilities
Expected Levels of Investment and Depreciation
$401
$473
$611
$586
$260
$161
$24
$131
$71
$43
$39
$260
$305
$330
$355
$0
$100
$200
$300
$400
$500
$600
$700
$800
$900
$1,000
2011A
2012E
2013E
2014E
Base
Renewable
Environmental
Depreciation
*Total depreciation expense is expected to be $305, $330 and $355 million in 2012,
2013, and 2014 respectively for utilities on a combined basis.
$792
$705
$678
$625 |
 13
Rate Case Activity
Wisconsin Jurisdiction
Filed rate case on March 23, 2012, for a net customer bill
increase of 3.6% in 2013 and an additional bill increase of 3.6%
in 2014 --
after applying the expected proceeds from a renewable
energy tax grant
Non-fuel rate increase prior to credits: 6.2% or $173 million in 2013
and 1.3% or $37 million in 2014
Key driver is recovery of costs for approved projects:
Air quality controls at Oak Creek
Glacier Hills Wind Park
Biomass Plant
Finalization of Oak Creek Expansion costs
Also filed our 2013 fuel cost plan |
 14
Rate Case Activity
Michigan Jurisdiction
Filed rate case on July 5, 2011
Requested $17.5 million annually --
a 9.9% increase
Increase of $7.7 million took effect in January 2012
The commission approved a self-implementation of $5.7 million
(3.2% increase) offset by the Michigan portion of the DOE
settlement
Results in a net interim increase of 1.7%
In addition, approximately $2.0 million of renewable cost
recovery was included in the Michigan PSCR effective
January 1, 2012
Requested a 10.4% ROE
Final rates expected to be effective July 2012 |
 15
Retail Electric and Gas Utilities
Wolverine Joint Venture
In January, we announced that a joint venture with
Wolverine Power Cooperative at the Presque Isle
Power Plant is being explored
Wolverine would fund the cost of environmental upgrades
and become a part owner of the plant
WEC would continue to operate the plant
Expect a decision to be reached later this year
Regulatory approvals would be required
The joint venture would reduce our ownership in the
plant, but would not reduce rate base
Our 2012–2016 capital budget would not be materially
impacted
Timing of the construction would be dependent upon
final EPA regulation |
 16
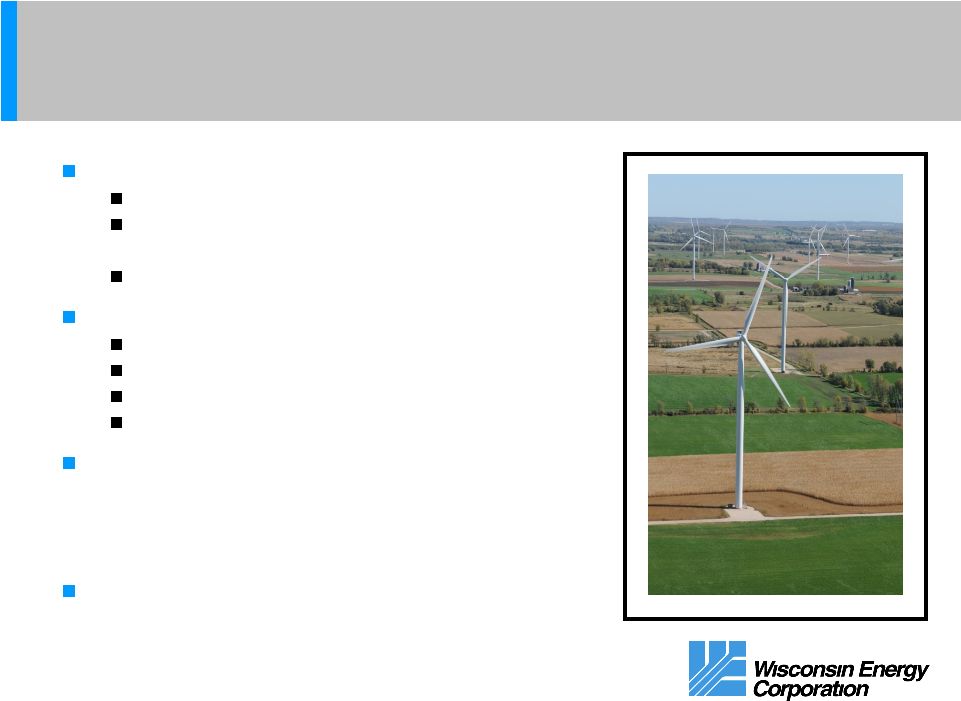
Renewable Energy
Summary of New Investments
Glacier Hills
162 MW
Final investment is expected to be below
the PSCW approved amount of $364 million
Completed in December of 2011
Biomass
50MW
Estimated investment of $245-$255 million
Approved by PSCW and Domtar Inc.
Expected completion by the end of 2013
Wisconsin Electric has executed 165MW of
renewable energy transactions to help
achieve compliance with the Wisconsin
Renewable Portfolio Standard
We expect to be in compliance with the
Standard through 2016 |
 17
Power the Future Investments
PTF Plants Represent a Key Investment in the Energy Future of Wisconsin
Natural Gas
Coal
Capacity
1,090 MW
1,030 MW
1
Investment
$664 million
$2.0 billion
ROE
12.7%
12.7%
Equity
53%
55%
Initial Lease Term
25 Years
30 Years
In-service Dates
Unit 1 –
July 16, 2005
Unit 2 –
May 23, 2008
Unit 1 –
February 2, 2010
Unit 2 –
January 12, 2011
2012 Estimated
Net Income
$37 million
2
$118 million
2
1
All capacity and investment amounts reflect WEC ownership only.
Demonstrated capacity for
the
coal
units
is
1,056
MW
–
value
shown
in
table
is
amount
guaranteed
in
lease
agreement.
2
Includes allocation of holding company debt. |
 18
Power the Future
Oak Creek Expansion –
Accelerated Depreciation
In December 2011, the Internal Revenue Service confirmed
that accelerated depreciation can be applied to our recently
completed expansion units at the Oak Creek site
We expect to see a $285 million cash timing benefit by the
end of 2014
In total, we expect approximately $600M of free cash flow after
capex and dividends over the five-year period 2012-2016
Cash from accelerated depreciation will be used to:
Support a higher level of investment in our core business
Reduce debt levels at the holding company
Fund our revised dividend policy
Deferred tax impact will not
affect our rate base |
 19
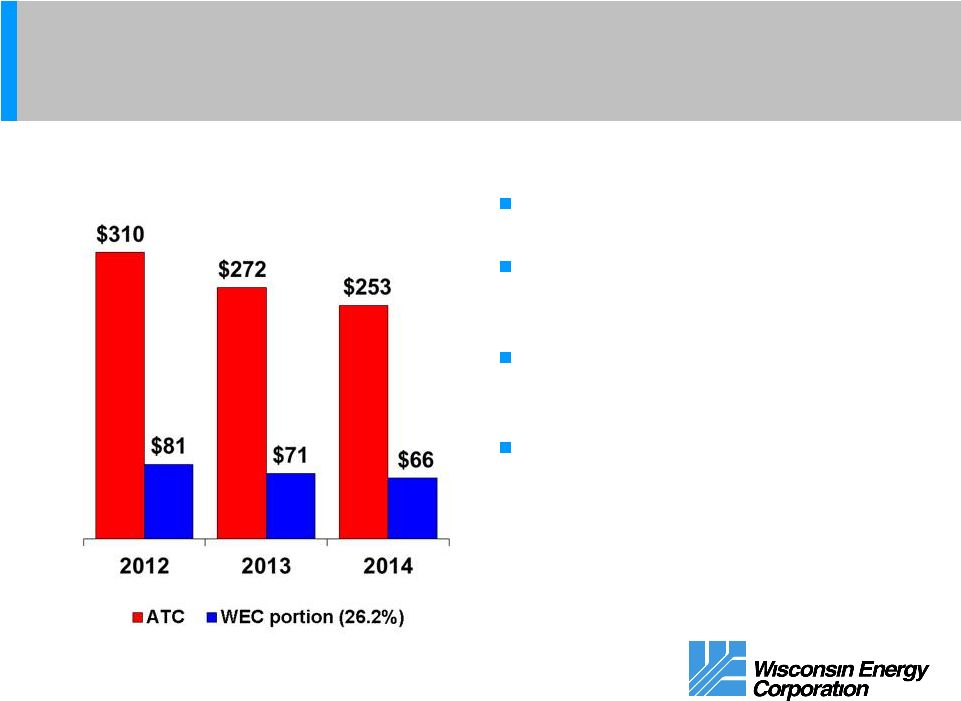
Wholesale Electric Transmission
ATC Expected Growth
Key Assumptions
ATC rate base at year end 2012 is
projected to be about $2.7 billion
ATC projects a need for $3.8-$4.4
billion of transmission improvements
in its footprint from 2011 to 2020
Implies average $38 million effective
annual rate base growth for WEC
from 2012 to 2014
Excludes potential transmission
projects outside ATC’s traditional
footprint
Projected Capital Expenditures
(Millions of Dollars) |
 20
Potential Investment Opportunities
Multiple Options Being Evaluated
Investment in fuel blending at new Oak Creek
coal units
Additional investment in aging gas and electric
distribution infrastructure
Renewable energy investments beyond 2016
Investment in aging generation facilities such as
hydro rebuilds
Investment required to meet future EPA rules
Divestiture of energy assets by the State of Wisconsin |
 21
Key Takeaways on Wisconsin Energy
Solid Growth with a Low Risk Profile
Power the Future program now complete
Highly visible earnings and strong cash flow
Well managed utility franchises with rate base growth
Investment in American Transmission Company
provides an additional regulated growth opportunity
Positioned to deliver among the best risk-adjusted
returns in the industry
Positive free cash flow
Best in class dividend growth story |
 Appendix |
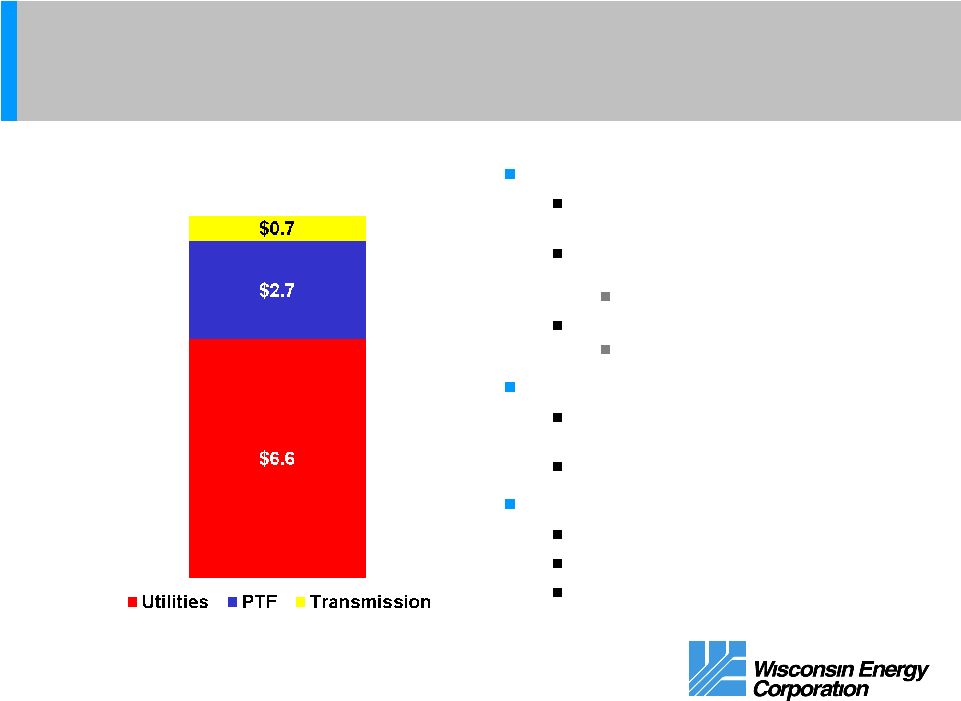 23
Overview of Wisconsin Energy
Estimated Rate Base and Power the Future Investment at 12/31/12
Retail Electric and Gas Utilities
Wisconsin, Michigan, and FERC
jurisdictions
48.5% to 53.5% equity for Wisconsin
Electric
10.4% allowed ROE
45% to 50% equity for Wisconsin Gas
10.5% allowed ROE
Power the Future
53% to 55% equity levels in lease
agreements
12.7% ROE fixed in lease agreements
Wholesale Electric Transmission
FERC jurisdictional
50% equity level for rates
12.2% ROE with true-up
Note: Value for retail electric and gas utilities represents rate base.
Power the Future value is book value of investment.
Wholesale electric transmission is 26.2% of ATC’s rate base.
$10.0 Billion |
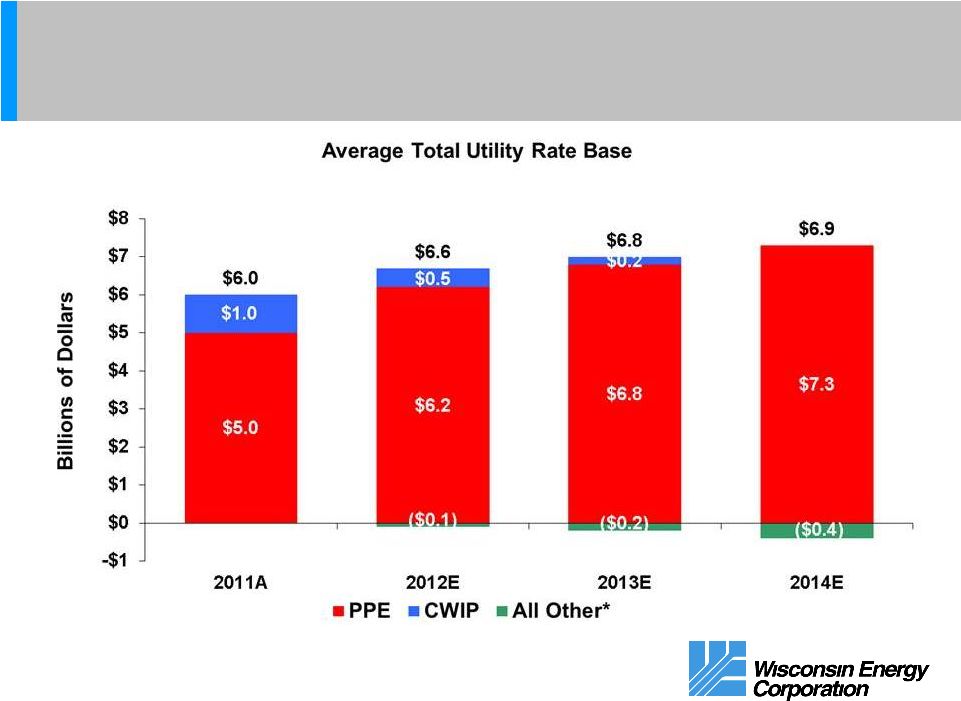 24
Retail Electric and Gas Utilities
Projected Rate Base
*All other is comprised of customer advances, def. taxes,
inventory and implied working capital. |
 25
Wholesale Electric Transmission
DATC
Non-exclusive joint venture between Duke Energy and ATC
(DATC) announced in April 2011
Adds potential investment opportunities outside ATC’s
current footprint
Ownership is split 50/50 between Duke and ATC
In September, DATC submitted the first set of proposed
transmission projects to MISO’s Midwest Transmission
Expansion Plan
Seven new transmission lines, located in five Midwestern states
Total cost of approximately $4 billion
Phased in over the next 10 years
Projects are subject to regulatory approval
Potential impact on WEC
No significant capital deployment expected until 2015
Earnings impact anticipated in 2015 and beyond |
 26
Regulatory Environment
Wisconsin Commissioners
Name
Party
Began
Serving
Term
Ends
Phil
Montgomery
Chairman
R
03/2011
03/2017
Eric Callisto
D
05/2008
03/2015
Ellen Nowak
R
07/2011
03/2013
Wisconsin Commission
3 Commissioners
Gubernatorial appointment,
Senate confirmation
Chairman: Gubernatorial
appointment
Terms
6 year—staggered terms
Michigan Commission
3 Commissioners
Gubernatorial appointment,
Senate confirmation
Chairman: Gubernatorial
appointment
Terms
6 year—staggered terms
Michigan Commissioners
Name
Party
Began
Serving
Term
Ends
John D.
Quackenbush
Chairman
R
10/2011
07/2017
Greg R. White
I
12/2009
07/2015
Orjiakor Isiogu
D
8/2007
07/2013 |
 27
Political Environment
During the summer of 2011, nine Senators were recalled
Seven retained their seats (4 GOP, 3 DEM)
Two GOP Senators were defeated
The WI State Senate is 16 GOP and 16 DEM
The Government Accountability Board (GAB) has received six
recall petitions filed on January 17, 2012
Governor, Lieutenant Governor and four Republican State Senators
As of March 30
th
the board had unanimously passed motions certifying
all six petitions
Key Dates
May 8
th
recall primaries
June 5
th
general elections
November 6
th
general elections |
 Wisconsin
Energy Electric Retail Customer Base
C&I Sector
Small & Large
% of 2011
Electric
C&I Sales
Office
12.2%
Mining
11.9%
Retail
6.1%
Primary Metals
5.9%
Health Care
5.5%
Paper & Products
5.5%
Food
4.7%
Education
4.7%
28 |
 29
Financing Policy
Capital Structure Goals
Maintain our current credit ratings
Debt/Capital Ratio as of 12/31/2011
Actual ratio was 57.1%
Adjusted ratio was 54.4%
Adjusted assumes half of $500 million of hybrid
securities are treated as common equity |