Attached files
| file | filename |
|---|---|
| 8-K - FORM 8-K - MOSAIC CO | d329439d8k.htm |
| EX-99.1 - TRANSCRIPT OF CONFERENCE CALL OF THE MOSAIC COMPANY - MOSAIC CO | d329439dex991.htm |
 The Mosaic Company
Earnings
Conference
Call
–
3
rd
Quarter
Fiscal
2012
Thursday,
March
29,
2012
Exhibit 99.2
Jim Prokopanko, President and Chief Executive Officer
Larry
Stranghoener,
Executive
Vice
President
and
Chief
Financial
Officer
Laura Gagnon, Vice President Investor Relations |
 This presentation contains forward-looking statements within the meaning of
the Private Securities Litigation Reform Act of 1995. Such statements
include, but are not limited to, statements about future financial and operating results. Such statements are based upon the
current beliefs and expectations of The Mosaic Company’s management and are
subject to significant risks and uncertainties. These risks and
uncertainties include but are not limited to the predictability and volatility of, and customer expectations about, agriculture,
fertilizer,
raw
material,
energy
and
transportation
markets
that
are
subject
to
competitive
and
other
pressures
and
economic
and
credit
market conditions; the level of inventories in the distribution channels for crop
nutrients; changes in foreign currency and exchange rates; international
trade risks; changes in government policy; changes in environmental and other governmental regulation, including
greenhouse gas regulation, implementation of the U.S. Environmental Protection
Agency’s numeric water quality standards for the discharge of
nutrients into Florida lakes and streams or possible efforts to reduce the flow of excess nutrients into the Gulf of Mexico;
further developments in judicial or administrative proceedings; difficulties or
delays in receiving, increased costs of or challenges to necessary
governmental permits or approvals; the effectiveness of the Company’s processes for managing its strategic priorities;
adverse weather conditions affecting operations in Central Florida or the Gulf
Coast of the United States, including potential hurricanes or excess
rainfall; actual costs of various items differing from management’s
current estimates, including, among others, asset retirement, environmental
remediation, reclamation or other environmental regulation, or Canadian resources taxes and royalties;
accidents and other disruptions involving Mosaic’s operations, including
brine inflows at its Esterhazy, Saskatchewan potash mine and other
potential mine fires, floods, explosions, seismic events or releases of hazardous or volatile chemicals, as well as other risks and
uncertainties reported from time to time in The Mosaic Company’s reports
filed with the Securities and Exchange Commission. Actual results may
differ from those set forth in the forward-looking statements. Safe
Harbor Statement 2 |
 Ongoing business strength
despite near-term market challenges
Strong execution
Market impacts
South Fort Meade litigation
resolved [pending court approval]
Lower potash volumes
Potash expansion on track
Higher raw materials costs
MicroEssentials
®
expansion on
track for 4Q12 completion
Operational excellence delivering
benefits
Increased dividend 150%*
*The declaration and payment of future dividends is subject to approval by
Mosaic’s Board of Directors. These can be no assurance that the
Company and Board of Directors will declare future dividends. |
 Resolving Near-term
Market Challenges
•
Indian subsidy known
•
China-Canpotex contract signed
•
Phosphate raw material spot prices down
Long-term market conditions remain
attractive |
 Expecting a strong spring
season in North America
•
Farm economics remain compelling
•
Farmers have incentive to plant more
acres and maximize yields
•
Expect early start due to warm weather
Mosaic is well positioned for the spring
season |
 Fourth quarter outlook
The issue is timing, not tonnes
6
Price
risk
aversion
remains
high,
impacting
timing
of
fertilizer
purchases
and willingness to hold inventories
Potash Fourth Quarter 2012 Guidance
Sales volume 1.7
–
2.2 million tonnes
MOP
selling
price
$420
–
$450
per
tonne
Up
from
1.1
million
tonnes
in
3Q
Reflecting mix change from 3Q
Phosphates Fourth Quarter 2012 Guidance
Sales
volume
2.3
–
2.7
million
tonnes
DAP
selling
price
$460
-
$490
per
tonne
~Flat with 2.6 million tonnes in 3Q
Down from $536
per tonne in 3Q |
 Financial Results Review
7 |
 Net Sales reflect delayed purchasing
8
Q3 FY12
Q3 FY12 vs.
Q3 FY11
Revenue
$2.2 billion
(1)%
Phosphates
$1.7 billion
13%
Potash
$553 million
(27) %
•
Phosphates sales volume:
–
2.6 million tonnes, up 9%
•
DAP price (FOB Central FL):
–
$536 / tonne, down 1%
•
Potash sales volume:
–
1.1 million tonnes, down 41%
•
MOP price (FOB Mine):
–
$453 / tonne, up 27% |
 Earnings reflect higher Phosphates raw
material costs and lower Potash volumes
9
Q3 FY12
Gross margin
Q3 FY12 vs.
Q3 FY11
Consolidated
24%
$522 million
(39)%
Phosphates
16%
$259 million
(43)%
Potash
49%
$270 million
(34)% |
 Net Earnings and EPS
Reported Earnings
($ in million except per share)
Q3 FY12
Earnings Before Taxes
$355
Net Earnings
$273
EPS
$0.64
Impact of Notable Items
$(0.08)
10 |
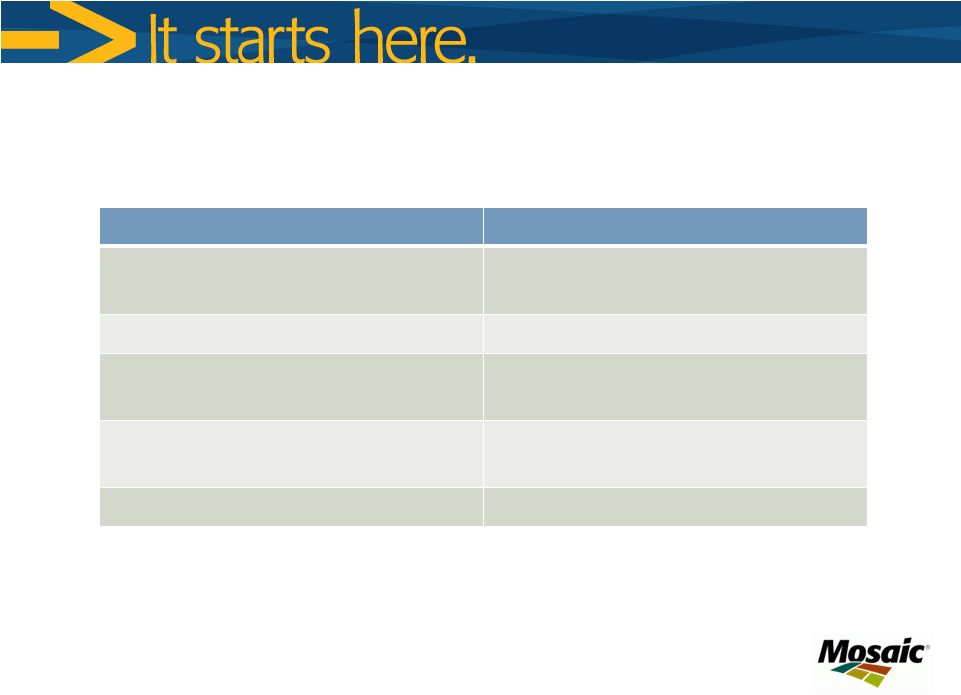
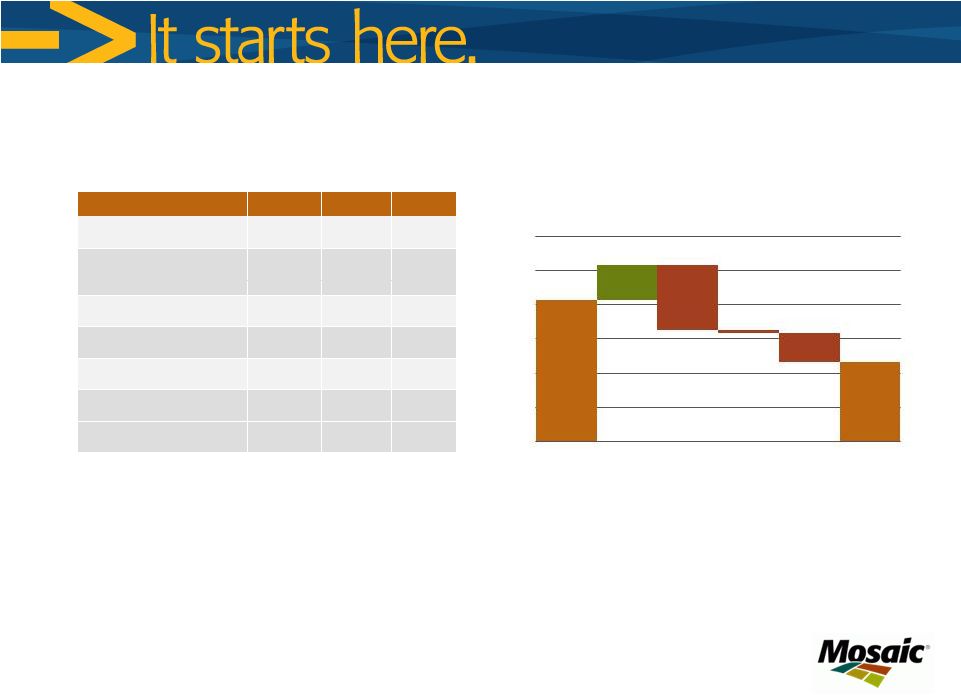 Potash Segment Highlights
11
In millions, except MOP price
Q3 FY12
Q2 FY12
Q3 FY11
Net sales
$553
$839
$758
Gross Margin
$270
$394
$412
Percent of net sales
49%
47%
54%
Operating earnings
$234
$358
$414
Sales volumes
1.1
1.8
1.9
Production volume
1.8
1.8
2.0
Production operating rate
79%
78%
90%
Avg MOP selling price
$453
$440
$358
Third quarter year over year highlights:
•
Operating earnings reflect lower sales volumes; expected to resume in 4Q
•
Operating rates reflect announced curtailments of up to 20% in January through
March 2012 •
Average selling price driven by industrial and export average price increases
Q/Q 0
100
200
300
400
500
600
Q3 FY11 OE
Sales Sales volumes
price
Resource
taxes
Other
Q3 FY12 OE
OPERATING EARNINGS BRIDGE
$ IN MILLIONS |
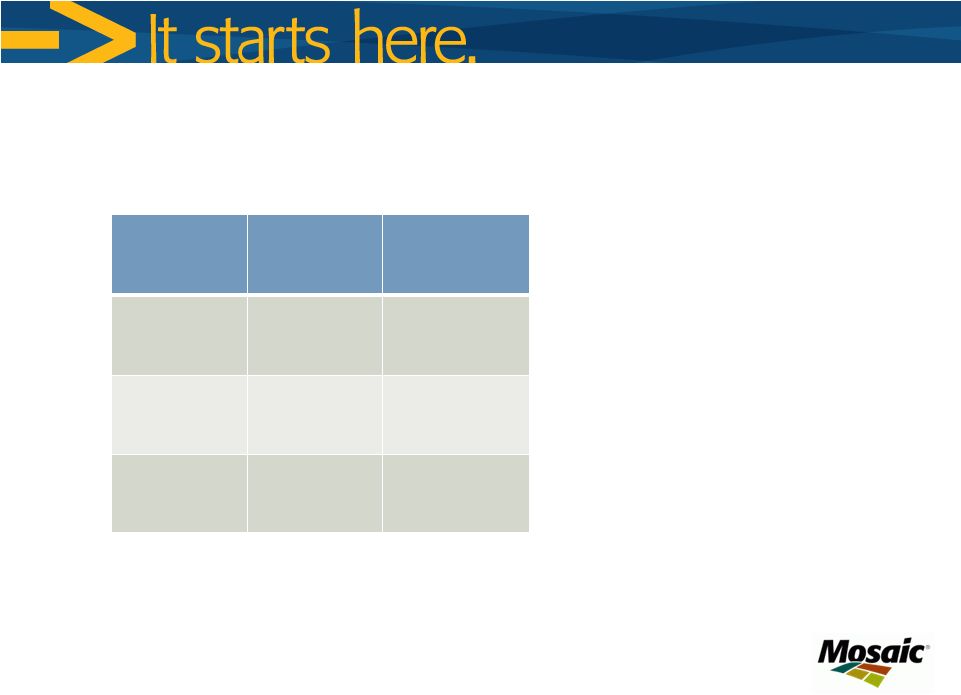
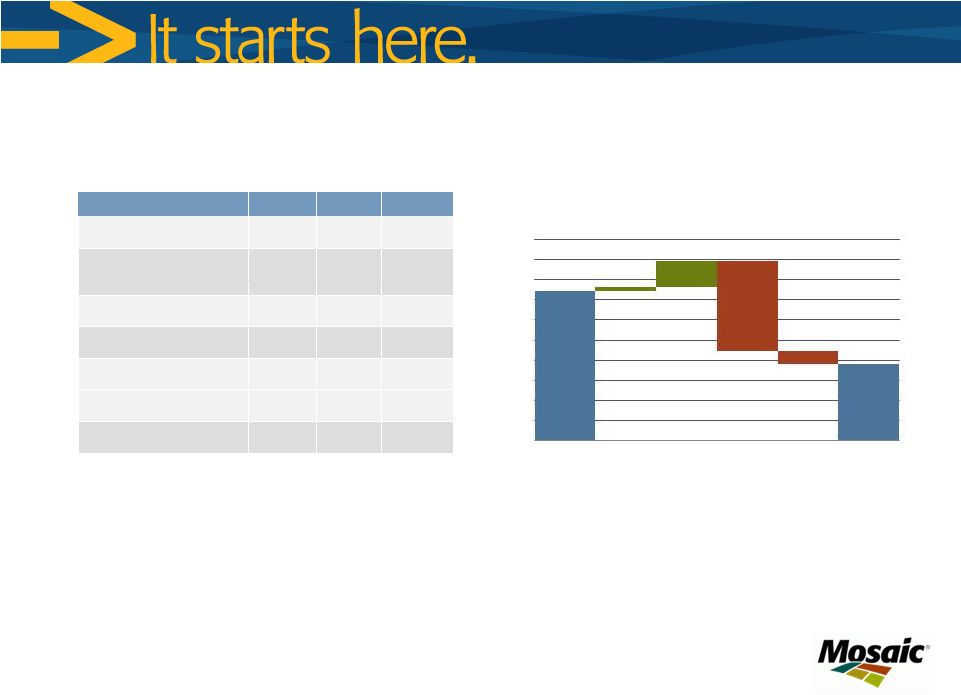 Phosphates Segment Highlights
12
In millions, except DAP price
Q3 FY12
Q2 FY12
Q3 FY11
Net sales
$1,652
$2,179
$1,458
Gross Margin
$259
$476
$454
percent of net sales
16%
22%
31%
Operating earnings
$190
$432
$372
Sales volumes
2.6
3.2
2.4
NA production volume
(a)
2.0
2.1
2.0
Finished product
operating rate
81%
86%
83%
Avg DAP selling price
$536
$611
$543
(a)
Includes crop nutrient dry concentrates and animal feed ingredients
Third quarter year over year highlights:
•
Operating
earnings
are
down
49
percent,
primarily
as
a
result
of
higher
raw
material
costs
reflected
in
the
income statement
•
Full
benefits
from
the
Faustina
ammonia
plant
are
expected
to
be
realized
in
Q4
FY12
•
Finished product operating rate of 81 percent includes the impact of the
previously announced curtailment of 250,000 tonnes in January through March
2012 0
50
100
150
200
250
300
350
400
450
500
Q3 FY11
OE
Sales
price
Sales
volumes
Raw
materials
Other
Q3 FY12
OE
OPERATING EARNINGS BRIDGE
$ IN MILLIONS |
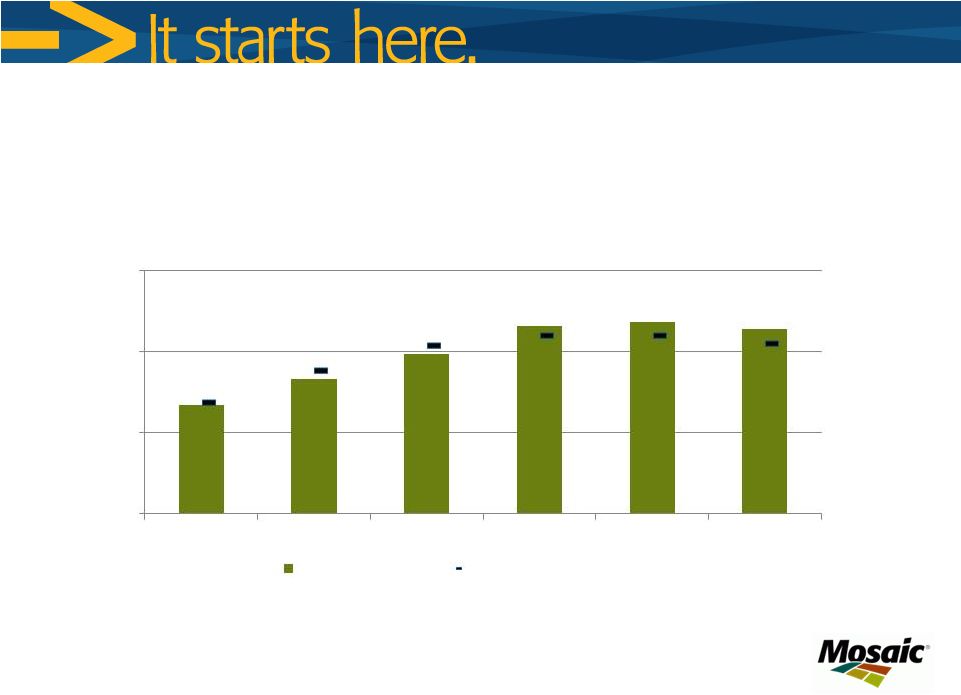
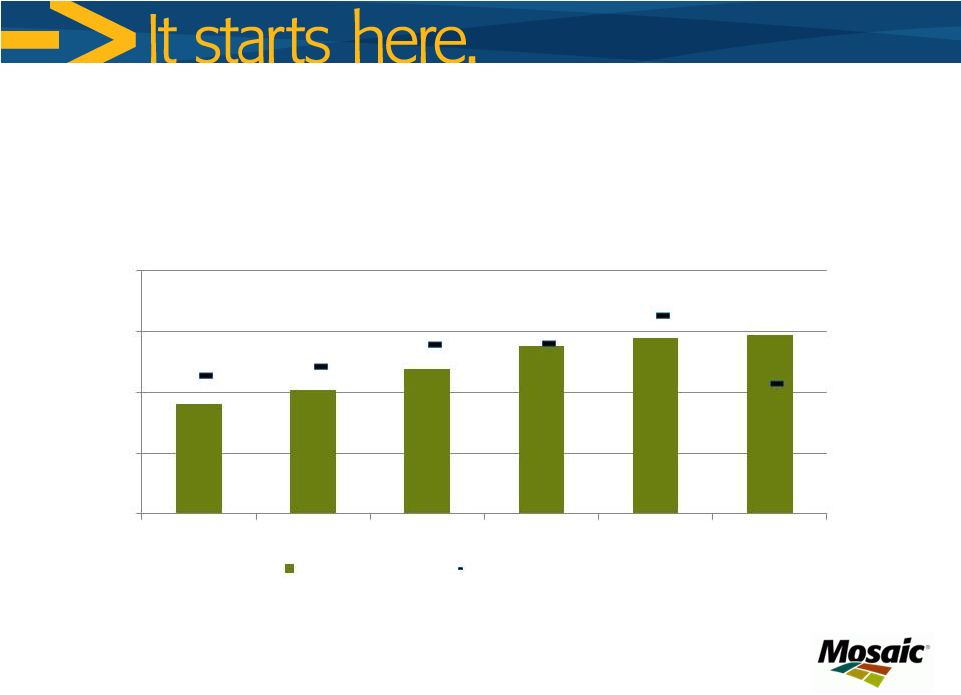 Phosphate Raw Material Costs
13
Ammonia
$/tonne
Realized costs of raw materials in COGS lag spot prices by approximately 3 months.
Realized ammonia costs, in most periods shown, include a benefit of our
manufacture of ammonia at Faustina. $431
$589
$0
$200
$400
$600
$800
Q2 FY11
Q3 FY11
Q4 FY11
Q1 FY12
Q2 FY12
Q3 FY12
Realized in COGS
Average Purchase Price |
 Phosphate Raw Material Costs
14
Sulfur Costs
$/long ton
Realized costs of raw materials in COGS lag spot prices by approximately 3 months.
Sulfur realized prices include storage, conversion and transformation costs
of $10 - $15 / ton.
$228
$211
$0
$100
$200
$300
Q2 FY11
Q3 FY11
Q4 FY11
Q1 FY12
Q2 FY12
Q3 FY12
Realized in COGS
Average Purchase Price |
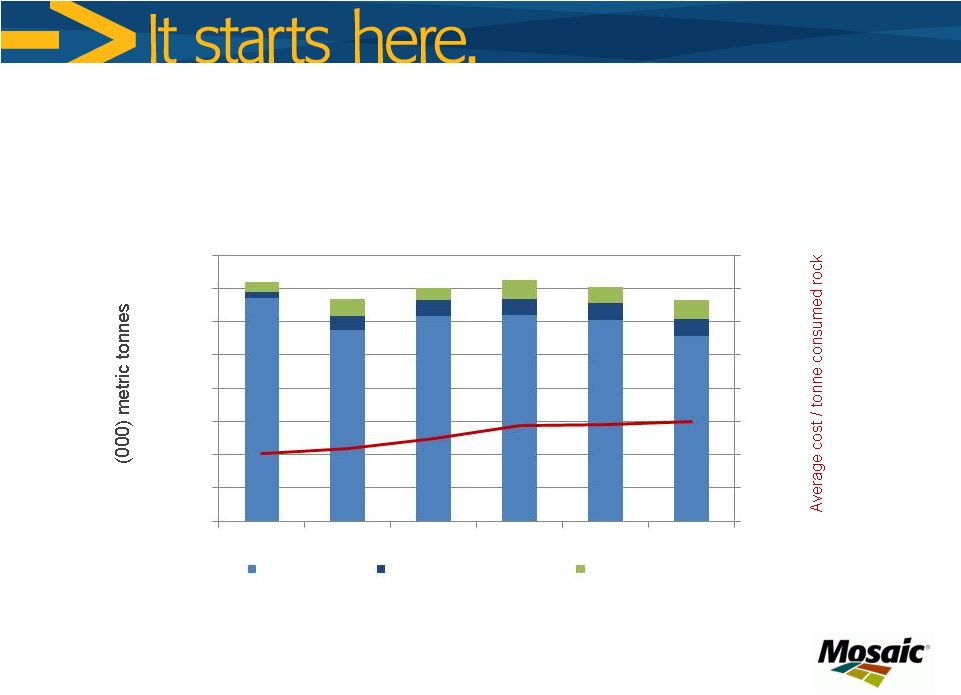 Phosphate Rock Sourcing
15
Rock Mix used in U.S. Operations
$-
$25
$50
$75
$100
-
500
1,000
1,500
2,000
2,500
3,000
3,500
4,000
Q2 FY11
Q3 FY11
Q4 FY11
Q1 FY12
Q2 FY12
Q3 FY12
US mined rock
Purchased Miski Mayo rock
Other purchased rock |
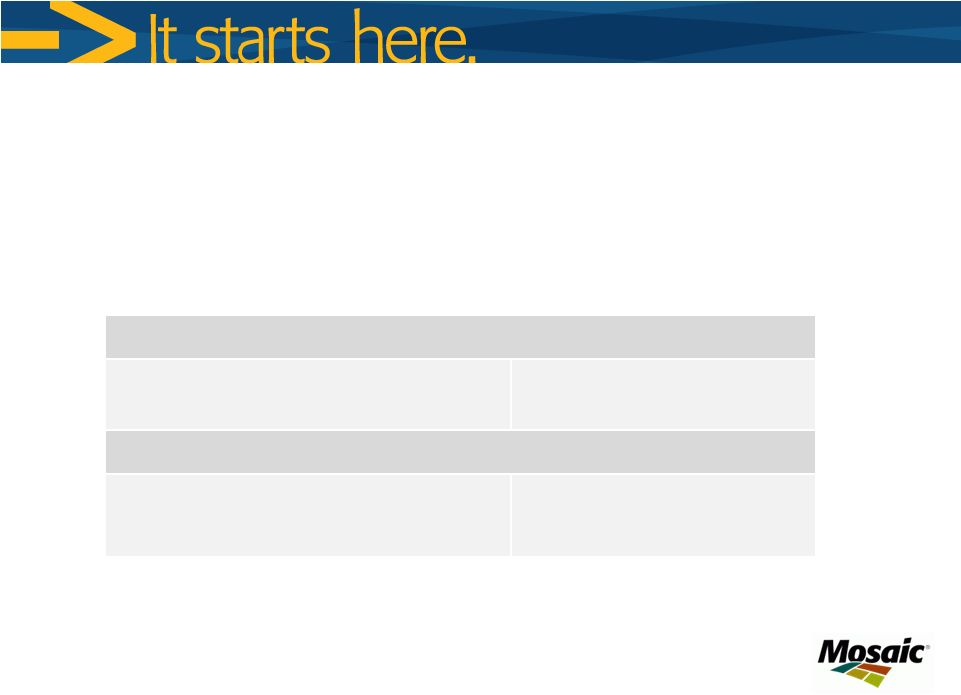
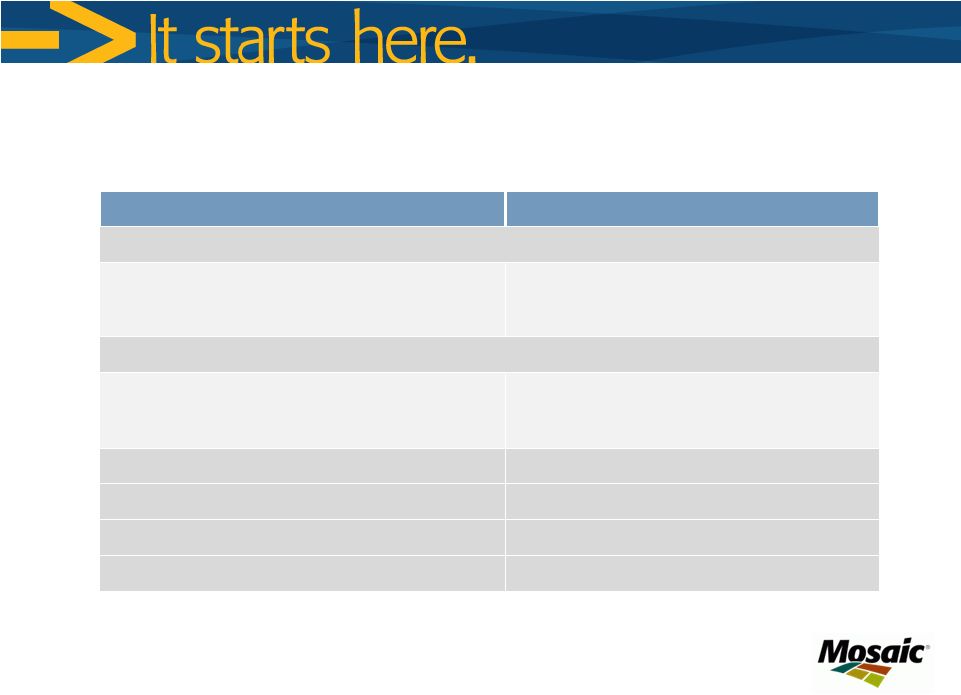 Category
Guidance –
Fiscal 2012
Potash
Q4 Sales volume 1.7 –
2.2 million tonnes
Q4 MOP selling price $420 –
$450 per tonne
Q4 Operating rate above 70 percent
Phosphates
Q4 Sales volume
2.3
–
2.7
million tonnes
Q4 DAP selling price $460 -
$490 per tonne
Q4 Operating rate above 80 percent
Capital Expenditures
$1.6 -
$1.7 billion
Canadian Resource Taxes and Royalties
$310
–
$360
million
SG&A
$400
–
$430
million
Effective Tax Rate
Upper 20 percent range
Financial Guidance Summary
16 |
 The Mosaic Company
Thank you |
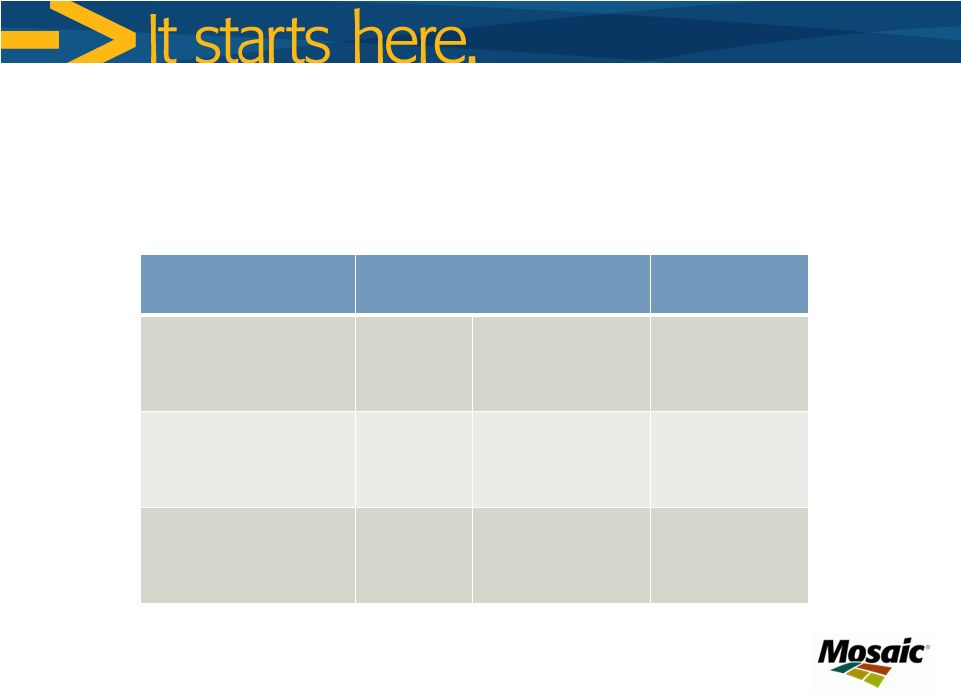
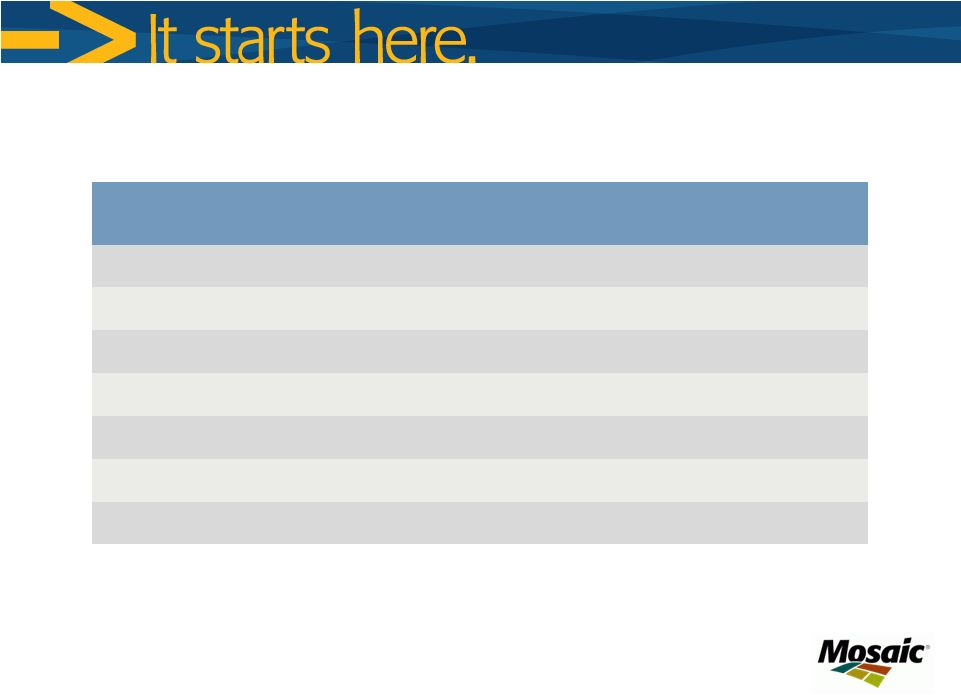 Earnings
Sensitivity
to
Key
Drivers
(a)
18
Change
Estimated Change in
Pre-Tax Earnings
($ in millions)
Estimated
Change in Annual
EPS
MOP Price ($/tonne)
$50
$313
$0.51
Potash Volume (000 tonnes)
500
$159
$0.26
DAP Price ($/tonne)
$50
$407
$0.66
Phosphates Volume (000 tonnes)
500
$99
$0.16
Sulfur ($/lt)
$25
$86
$0.14
Ammonia ($/tonne)
$25
$37
$0.06
Natural Gas ($/mmbtu)
$1.00
$31
$0.05
(a)
These factors do not change in isolation; actual results could vary from the above
estimates |