Attached files
Table of Contents
UNITED STATES
SECURITIES AND EXCHANGE COMMISSION
Washington, D.C. 20549
FORM 10-K
(Mark One)
| x | ANNUAL REPORT PURSUANT TO SECTION 13 OR 15(d) OF THE SECURITIES EXCHANGE ACT OF 1934 |
For the fiscal year ended December 31, 2011
or
| ¨ | TRANSITION REPORT PURSUANT TO SECTION 13 OR 15(d) OF THE SECURITIES EXCHANGE ACT OF 1934 |
For the transition period from to
Commission File Number 000-52642
Westway Group, Inc.
(Exact name of registrant as specified in its charter)
| Delaware | 20-4755936 | |
| (State or other jurisdiction of incorporation or organization) |
(I.R.S. Employer Identification No.) | |
| 365 Canal Street, Suite 2900, New Orleans, LA |
70130 | |
| (Address of principal executive offices) | (Zip Code) | |
(504) 525-9741
(Registrant’s telephone number, including area code)
Securities registered pursuant to Section 12(b) of the Act:
| Title of each class |
Name of exchange on which registered | |
| Class A Common Stock, $0.0001 par value | The NASDAQ Stock Market LLC |
Securities registered pursuant to Section 12(g) of the Act: None
Indicate by check mark if the registrant is a well-known seasoned issuer, as defined in Rule 405 of the Securities Act. ¨ Yes x No
Indicate by check mark if the registrant is not required to file reports pursuant to Section 13 or Section 15(d) of the Act. ¨ Yes x No
Indicate by check mark whether the registrant (1) has filed all reports required to be filed by Section 13 or 15(d) of the Securities Exchange Act of 1934 during the preceding 12 months (or for such shorter period that the registrant was required to file such reports), and (2) has been subject to such filing requirements for the past 90 days. x Yes ¨ No
Indicate by check mark whether the registrant has submitted electronically and posted on its corporate Web site, if any, every Interactive Data File required to be submitted and posted pursuant to Rule 405 of Regulation S-T (§232.405 of this chapter) during the preceding 12 months (or for such shorter period that the registrant was required to submit and post such files). x Yes ¨ No
Indicate by check mark if disclosure of delinquent filers pursuant to Item 405 of Regulation S-K (§ 229.405 of this chapter) is not contained herein, and will not be contained, to the best of registrant’s knowledge, in definitive proxy or information statements incorporated by reference in Part III of this Form 10-K or any amendment to this Form 10-K. ¨
Indicate by check mark whether the registrant is a large accelerated filer, an accelerated filer, a non-accelerated filer, or a smaller reporting company. See the definitions of “large accelerated filer,” “accelerated filer” and “smaller reporting company” in Rule 12b-2 of the Exchange Act. (Check one):
| Large accelerated filer | ¨ | Accelerated filer | ¨ | |||
| Non-accelerated filer | ¨ (Do not check if a smaller reporting company) | Smaller reporting company | x | |||
Indicate by check mark whether the registrant is a shell company (as defined in Rule 12b-2 of the Exchange Act). ¨ Yes x No
The aggregate market value of the voting and non-voting common equity held by non-affiliates of the registrant computed by reference to the price at which the registrant’s Class A Common Stock, par value $0.0001 per share, was last sold as of June 30, 2011, the last business day of the registrant’s most recently completed second fiscal quarter, was $30.0 million.
As of March 16, 2012, 14,205,995 shares of our Class A common stock, par value $0.0001 per share, and 13,144,677 shares of our Class B common stock, par value $0.0001 per share, were outstanding. The number of shares of our Class A common stock outstanding stated above includes 1,000,000 shares issued to Shermen WSC Holding LLC and held in escrow.
DOCUMENTS INCORPORATED BY REFERENCE
Portions of the registrant’s definitive proxy statement for its 2012 annual meeting of stockholders, which is anticipated to be filed with the Securities and Exchange Commission by April 30, 2012, are incorporated by reference into Part III of this Form 10-K.
Table of Contents
Westway Group, Inc. Index to Form 10-K
1
Table of Contents
Unless the context otherwise requires, when used in this annual report on Form 10-K:
| • | the “Company” or “we” or “us” or “our” or “Westway Group, Inc.” means the public company now named Westway Group, Inc. together with its wholly-owned subsidiaries; |
| • | the “acquired business” or “predecessor” means the bulk liquid storage and liquid feed supplements businesses, prior to acquisition, that were acquired by the Company from the ED&F Man group in the 2009 business combination; |
| • | the “2009 business combination” means the set of transactions consummated on May 28, 2009, by which the Company (which was then a “special purpose acquisition” corporation) acquired the acquired business; |
| • | “ED&F Man” means ED&F Man Holdings Limited, on an unconsolidated basis; |
| • | “ED&F Man group” means ED&F Man and its direct and indirect subsidiaries; and |
| • | “Agman” means Agman Louisiana, Inc, a subsidiary of ED&F Man and member of the ED&F Man group which was named Westway Holdings Corporation before June 17, 2010; |
| • | “Class A common stock” means our Class A Common Stock, par value $0.0001 per share (this class is listed on NASDAQ; generally, shares of this class automatically convert into shares of Class B common stock at any time they become owned by a member of the ED&F Man group); |
| • | “Class B common stock” means our Class B Common Stock, par value $0.0001 per share (this class is not listed on NASDAQ; generally, shares of this class automatically convert into shares of Class A common stock at any time they cease to be owned by a member of the ED&F Man group); and |
| • | “Series A Convertible Preferred Stock” means our Series A Perpetual Convertible Preferred Stock, par value $.0001 per share (this class is not listed on NASDAQ). |
SPECIAL NOTE REGARDING FORWARD-LOOKING STATEMENTS
This Annual Report on Form 10-K includes statements regarding our future performance, liquidity, and capital resources, our plans and objectives for future operations, and assumptions relating to the foregoing. Such statements are “forward-looking” within the meaning of the Private Securities Litigation Reform Act of 1995, Section 21E of the Securities Exchange Act of 1934, and Section 27A of the Securities Act of 1933. Our use of words such as “believe,” “expect,” “anticipate,” “intend,” “aim,” “will,” “shall,” “may,” “should,” “could,” “would,” “plan,” “estimate,” “continue,” “foresee,” or the negative of such terms, or other similar expressions, often further identify a statement as a forward-looking statement.
We have based our forward-looking statements on our current expectations and projections about future events, trends, and uncertainties. Our forward-looking statements are not guarantees of future performance and are subject to risks, uncertainties and assumptions. There are a number of important factors that could cause our actual results and financial position to differ materially from those contemplated by our forward-looking statements, including, among other things, the risk factors discussed in the “Risk Factors” section of this Form 10-K.
Our business is highly complex and competitive, with many different factors affecting results. Any or all of our forward-looking statements may turn out to be wrong, and actual results may differ materially from those expressed or implied by our forward-looking statements. They can be affected by inaccurate assumptions or by known or unknown risks, uncertainties and other factors, many of which are beyond our control. We undertake no obligation to publicly update or revise any forward-looking statements, whether as a result of new information, future events, or otherwise.
1
Table of Contents
PART I
| ITEM 1. | BUSINESS |
Background
We are a leading provider of bulk liquid storage and related value-added services. Our bulk liquid storage business is a global business with locations at key port and terminal sites throughout North America and in Western Europe and Asia. Our infrastructure includes a network of 25 terminals offering approximately 363 million gallons of bulk liquid storage capacity to manufacturers and consumers of agricultural and industrial liquids. Our bulk liquid storage business has maintained a long-term presence in a number of highly strategic, deep water ports around the world. This locational advantage provides our international customer base with access to these strategic storage locations, as well as the highest level of our service for these important markets.
We are also a leading manufacturer and distributor of liquid animal feed supplements. Through our 35 facilities in North America, western Canada, and eastern Australia, we produce approximately 1.8 million tons of liquid feed supplements annually. By using formulation processes that are tailored specifically to the needs of our customers, we blend molasses and essential nutrients to form feed rations that help to maximize the genetic potential of livestock. We sell our liquid animal feed supplements to distributors, dealers, and directly to end users, such as “ranchers,” and feed manufacturers, primarily supplying the beef and dairy livestock industries. Our liquid feed supplements business is the leading North American manufacturer of liquid feed products and the only supplier with a true national U.S. footprint.
Our Management Team
We have an experienced senior management team comprised of James B. Jenkins as Chief Executive Officer, Thomas A. Masilla Jr. as Chief Financial Officer, Gene McClain as President of our bulk liquid storage business, and Steve Boehmer as President of our liquid feed supplements business. Mr. Jenkins has worked in the commodities industry for 29 years, and Messrs. McClain and Boehmer have 31 and 35 years of relevant industry experience, respectively. Mr. Masilla possesses over 35 years of extensive executive and financial management experience in publicly-traded commercial banking and real estate entities.
We benefit from the skill, experience, and commitment of a talented and experienced staff of middle managers across our various functions and geographies. In particular, our Company has a highly skilled health, safety, environmental, and quality team, which provides continual reviews of policy and regulatory compliance. By this means, our staff contribute to minimizing our exposure to injury and loss, ensuring the highest quality of service to our customers, and overseeing the physical integrity of our facilities. Our management team also has years of experience in successfully designing and executing numerous acquisitions, new site openings, facility expansions, and new product introductions.
2
Table of Contents
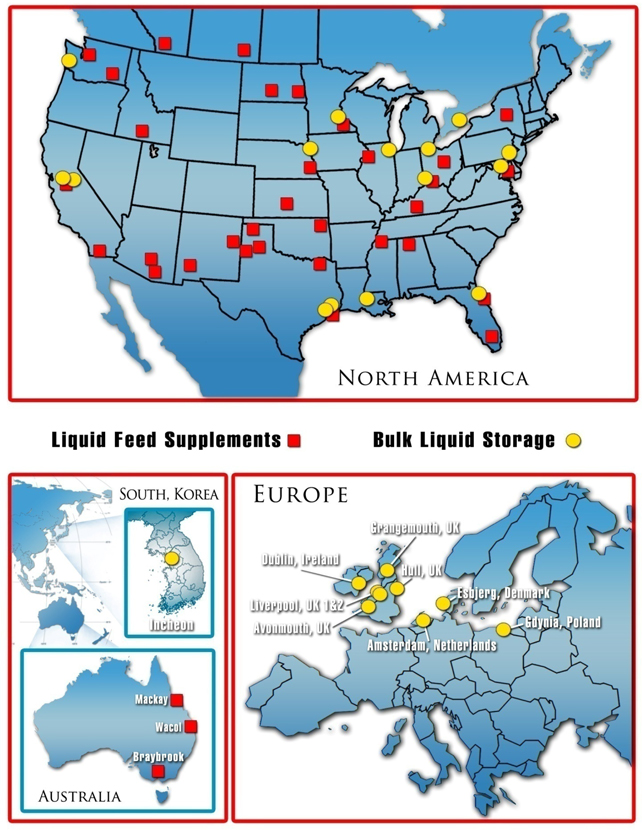
Global Footprint Locations
3
Table of Contents
Recent Developments
In 2011, we have focused on the expansion of our bulk liquid storage capacity, improving liquidity for our stockholders, and simplifying our capital structure.
First Quarter 2011 Highlights
| • | Gene McClain was appointed President of Westway Terminal Company. Mr. McClain has 31 years of extensive experience in the terminal industry. |
| • | Construction began on four new tanks at our Houston 1, TX terminal, totaling approximately 4.0 million gallons of capacity in the aggregate, as well as on two new dock lines. |
| • | Westway Terminal Company LLC, a wholly owned subsidiary of the Company, received the Responsible Care Partner of the Year Award. This award is the American Chemistry Council’s top partner award, presented to three partner companies for their record of performance and dedication to safety. |
Second Quarter 2011 Highlights
| • | 11.1 million of our publicly traded warrants expired in accordance with their terms. The combination of this expiration and the successful warrant tender offer completed in 2010 has significantly simplified our capital structure. |
| • | Westway Terminal Company LLC received the Safety Improvement Award from the International Liquid Terminals Association (ILTA). This award reflects the commitment, dedication, and collaborative effort of our employees aimed at the continual improvement of our health, safety, environmental and security performance. |
| • | We created a new Corporate Business Development team which will focus on the identification, evaluation and execution of strategic growth opportunities for our liquid feed supplement and liquid storage subsidiaries as well as growth in other strategic areas. |
| • | Mr. Anthony J. Andrukaitis was elected to the Board of Directors of the Company. He brings extensive knowledge and experience, including skills in finance, marketing, and operations as well as experience in both domestic and international terminal operations. |
Third Quarter 2011 Highlights
| • | The Company and its bank syndicate amended certain key terms of the Company’s existing $200 million credit facility. The modifications included, among other items, extension of the maturity date to July 6, 2015, reduction of the interest rate and commitment fee payable, relaxation of certain key financial covenants, permission to pay dividends, and addition of a $50 million accordion feature to the current facility. |
| • | The Board of Directors declared our first quarterly dividend of $0.04 per share of common stock, payable in cash or common stock, to holders of our common stock and participating preferred stock. This dividend, which has since continued through the first quarter of 2012, is consistent with our goal of building shareholder value, both in terms of our stock price as well as liquidity in the trading volume of our stock. |
| • | In our bulk liquid storage business, 2.5 million gallons of new tank capacity was added and leased at our Houston 2, TX terminal. |
| • | Also in our bulk liquid storage business, three tanks (totaling 1.4 million gallons) of nine tanks scheduled to be finalized in the second half of 2011 at our Amsterdam, Netherlands terminal were completed and leased. |
| • | Mr. Paul Chatterton was elected to the Board of Directors of the Company. Mr. Chatterton previously served in a senior management role for Westway Terminals from 1997 through 2007. His addition to the Board brings extensive knowledge and experience in both domestic and international terminal operations. |
Fourth Quarter 2011 Highlights
| • | In our bulk liquid storage business, 8.0 million gallons of new tank capacity were completed and leased at our Houston 1, TX terminal. We also began constructing six new 1 million gallon tanks and three new dock lines as well as the associated inbound and outbound marine and land traffic infrastructure at our Houston 1, TX terminal. We are in Phase 7 of the Houston 1 expansion program, and this phase will maximize utilization of our existing land bank, as well as improve economic efficiencies at this site. The Houston 1 facility has continued at near 100% utilization, with demand for storage exceeding the phased nature of our expansion program at this site. |
4
Table of Contents
| • | Also in our bulk liquid storage business, we began constructing four new 630,000 gallon tanks at the Houston 2 facility— which is Phase 6 in this expansion program. The Houston 2 facility has continued at near 100% utilization due to strong demand for non-fuel product storage in this market. |
| • | Also in our bulk liquid storage business, two new tanks (totaling 900,000 gallons) at our Amsterdam, Netherlands terminal were completed and leased. |
| • | Our liquid feed supplements business began production of low moisture tubs at our Catoosa, OK facility. This new product will expand our sales and serves to complement our existing chemical tub product line. |
| • | Our liquid feed supplements business also completed research and commenced sales of an environmentally friendly “Eco Tub” container. The “Eco Tub” container has been very well received by the industry and improved our sales during the period. |
| • | The National Safety Council recognized eleven of our facilities with their prestigious Safety Leadership Award. This award is presented to a facility that has achieved five consecutive years without a fatality or occupational injury. |
Since January 1, 2012
| • | In our bulk liquid storage business, the remaining four new tanks, totaling 1.9 million gallons, at our Amsterdam, Netherlands terminal were completed as part of a nine- tank project. |
Risks
Our statements about our corporate plans, including our expansion plans, their expected completion dates, and their effect on our terminal capabilities, storage capacity, and liquid animal feed production are forward-looking. Important factors that could cause our actual results to differ materially from these statements include changes in demand for bulk liquid storage or for liquid animal feed supplements, delays in construction or increased construction costs due to weather, disputes with contractors, or opposition by environmental groups, and unanticipated changes in our results of operations or general market conditions in the future. For a more detailed description of risks that we face, please see the “Risk Factors” section, Item 1A of this Form 10-K.
Bulk Liquid Storage Business
Overview
Our bulk liquid storage business owns and/or operates a network of facilities located in North America, Western Europe, and Asia, providing storage and related services to manufacturers and purchasers of bulk liquid products. Our customers represent a diverse group of multi-national, national, and regional corporations. Our value-added services are customer specific and include transloading and blending of bulk liquids as well as acting as regional distribution centers for our customers on an entirely outsourced basis. Underpinning all of our services is our foremost objective, which is to differentiate our service quality by achieving the highest level of customer satisfaction. We often coordinate closely with our customers’ technical services and product handling experts in designing and adapting the customized product handling systems required for each customer’s specific product. By this means, our facilities often become critical links in the distribution chains of our customers. Our proprietary systems, rapid execution, and superior commodity management expertise has led to many long-term customer relationships.
Services—by Product Stored
We provide bulk liquid storage services for a wide range of products. This diverse product servicing portfolio helps to minimize our exposure to significant customer and product risk.
The eight product groups stored by our bulk liquid storage business worldwide are:
| • | Molasses and Liquid Animal Feed Products. Historically, storage of molasses for the liquid feed supplements and yeast production industries has comprised a major single component of our and our predecessor’s bulk liquid storage business. We are well positioned in this product category, given our and our predecessor’s significant experience handling highly viscous liquids and our specialized infrastructure that includes large, positive displacement pumps and custom tank design. |
| • | Vegetable Oils, Tallows, and Greases. For decades, we or our predecessor have handled customer requirements for storage and transportation of vegetable oils, tallows and greases. These products are utilized in the food, biofuels, industrial soaps, detergent, and biochemical industries and require specialized services such as heated tankage and kosher certification. |
5
Table of Contents
| • | Lignin Sulphonate, Calcium Chloride, and Liquid Fertilizers. Our experience with non-hazardous bulk solutions such as calcium chloride, urea ammonium nitrate, and lignin sulphonate is extensive. These products are tied to basic industries such as agriculture and paper production. Because many of these products are corrosive, specialized tank linings are required to maintain quality control and safe handling. |
| • | Petroleum, Petro-Chemicals, Waxes, and Petroleum Oil. Our position in this category is primarily concentrated in storing niche products, such as paraffin waxes and lubrication oils, derived from the petroleum refining process for candle, coatings and automotive markets, in addition to certain other heavy industries. The heat and viscosity requirements of these products lend themselves to our high value-added service model. Generally, we do not handle petroleum fuels, gasoline, or traditional petro-chemicals (e.g. benzene or toluene). |
| • | Chemicals. Since the mid 1990s, we or our predecessor have expanded our storage services into a more diverse range of chemical products, for producers and distributors serving manufacturing and industrial markets. Subsequent improvements in industry-specific expertise have provided us with the experience necessary to handle these products. We conduct a thorough risk analysis when evaluating all new chemical opportunities to ensure minimal safety and environmental risk. |
| • | Caustics. Chloralkali products, including sodium and potassium hydroxide, are stored on behalf of industrial use producers and distributors and were the first product category that our predecessor commenced to store for external customers in the 1970s. Specialized heated tanks, linings and piping systems are utilized to protect product quality and ensure efficient handling of products for municipalities and the sanitation and paper production industries, as well as for others. |
| • | Methyl Esters (Bio-diesel). We or our predecessor have been handling methyl esters since 2002 on behalf of producers and distributors. Our employees are familiar with the unique properties of methyl esters, and we have systems to ensure that our quality control and safe handling standards are maintained. These systems include standardized handling procedures and the use of specialized equipment to prevent moisture intrusion. |
| • | Asphalts. We handle asphalt products which are used in roadways and in roofing applications. Our Baltimore, MD and St. Paul, MN facilities have special systems constructed to handle asphalts. We employ hot oil systems, tank heating coils, insulated tanks and pipelines needed to keep these products flowing properly through our facilities. |
Services—by Activity Performed
We provide our customers with a broad range of value-added services across all stages of the bulk liquid storage chain:
| Storage |
Handling |
Receipt/ Distribution |
Transloading |
Other | ||||
| Carbon tanks |
Additive injection | Marine | Rail to truck | Audit Documentation | ||||
| Stainless tanks |
Custom blending | Rail | Truck to rail | FEMAS certification | ||||
| Dry air treatment |
Direct transfer | Truck | Lightering | Food grading | ||||
| Foam systems |
Filtration | GMP certification | ||||||
| Radar gauging |
Heating | ISO certification | ||||||
| Hot oil systems |
Piggable lines | Marketing | ||||||
| Nitrogen blanketing |
Recirculation | Responsible Care - | ||||||
| Lined tanks |
Dilutions | Partner | ||||||
| Stainless piping |
ISO containers | |||||||
| Custom build |
Flexi bags |
We work closely with our customers to design service packages and contracts that meet their specific storage and handling requirements. This process involves varying degrees of complexity across our customer base and generates many long-term collaborative relationships. For example, some customers require only basic storage services, such as tank storage, product receipt and delivery services, and occasional transloading. Others have more complex requirements, including the provision of temperature regulation, blending, or sampling services. Our breadth of services and flexibility differentiates us in the marketplace and provides a distinct advantage when competing for new business.
6
Table of Contents
Customers
Our customer-focused approach has resulted in a number of long-standing relationships with major customers. In 2011, the ED&F Man group, a related party, accounted for 17% of the revenues of our bulk liquid storage business. The loss of the ED&F Man group or any of our next three top customers would have a material adverse effect on our bulk liquid storage business. As discussed in more detail below in the subsection entitled “Our Commercial Relationship with the ED&F Man Group,” we have a long-term contractual relationship as a supplier of bulk liquid storage to the ED&F Man group. Our bulk liquid storage business is not dependent on any other single or small number of customers whose loss would have a material adverse effect on the business.
A large proportion of our bulk liquid storage business’ revenues are derived from services for highly-regarded multi-national corporations. Our relationships with these customers have resulted in longer term contracts. Approximately 68% of our bulk liquid storage contracts had initial terms of two years or more in duration and approximately 56% had initial terms of three years or longer as of December 31, 2011. The initial duration of our storage contracts is set out below in more detail:
Initial Duration of Storage Contracts—Terminals Worldwide as of December 31, 2011
| > 5 Years |
10 | % | ||
| 3 to 5 Years |
46 | % | ||
| 2 to < 3 Years |
12 | % | ||
| 1 to < 2 Years |
28 | % | ||
| < 1 Year |
4 | % |
Competition
Competitive Conditions
Our bulk liquid storage business competes in international, national, regional, and local markets, throughout the United States, Eastern Canada, portions of Western Europe, and Korea. The competitive environment in which we operate, the number of competitors, and our market position vary across different markets.
In the international market, competitors include multi-national providers such as Oil Tanking, Stolt Nielsen S.A., LBC Holdings LLC and Royal Vopak N.V. At locations in Europe, such as Denmark and Poland, competition also derives from smaller independent storage businesses and former state-owned installations. In the United States, at a national level, major competitors include Nu Star Energy L.P., Kinder Morgan Energy Partners, International-Matex Tank Terminals (50% owned by Macquarie Infrastructure Company LLC), and TransMontaigne.
The principal competition for each of our facilities comes from other third-party bulk liquid storage facilities located in the same regional or local market. In regional and local markets, we face competition from independent storage businesses operating in a number of markets served by us, such as Simon Storage Ltd. (owned by Interpipeline Fund) in the United Kingdom. In some regional and local markets, such as St. Paul, MN, Jacksonville, FL, and Toledo, OH, our facilities represent a significant proportion of available bulk liquid storage capacity. In other markets, such as Houston, TX, our facilities represent only a small proportion of available bulk liquid storage capacity and have numerous competitors with facilities of similar or larger size and with similar capabilities.
Across product groups, our bulk liquid storage business competes with companies having a primary focus in the storage of specific products, such as hydrocarbons and derivatives, as well as with businesses providing a broader range of services.
We also compete for acquisition and expansion opportunities with other companies involved in the bulk liquid storage business.
Principal Methods of Competition
Independent terminal owners principally compete on the basis of the location and versatility of terminals, service, and price. A favorably located terminal will have access to various cost-effective transportation modes both to and from the terminal. Transportation modes typically include waterways, railroads, and roadways.
An important competitive element is the operator’s ability to offer complex handling requirements for diverse products. A terminal operator that can handle many types of products and provide a broad range of high quality services has a distinct advantage over a less versatile terminal operator. Our terminals handle a broad spectrum of specialty products through a number of features, including rail capacity, dedicated pipelines, on-scale top-loading of trucks, heating capacity, and multiple tank sizes, including small and medium capacity tanks.
7
Table of Contents
A terminal operator’s ability to provide attractive pricing is often dependent on the quality, versatility, and reputation of the facilities owned by the operator. Although many products require modest terminal modification, our versatile storage capabilities typically require less modification prior to usage, ultimately making the storage cost to our customer more attractive.
Factors Affecting Competitive Position
Positive factors pertaining to our competitive position are discussed at length below in the subsection entitled “Competitive Strengths.” Negative factors pertaining to our competitive position include the fact that some of our competitors are larger than we are, have greater financial resources, have lower costs of capital, control more storage capacity, and accordingly sometimes are able to offer a better price or greater storage capacity. There are also occasions where a competitor has a facility in a location that enables it to serve a particular customer’s need more economically than our nearest facility. These negative factors are further described in the “Risk Factors” section of this Form 10-K.
Competitive Strengths
Broad Geographic Footprint and Strategic Location of Facilities
Our bulk liquid storage business is one of the few service providers capable of providing truly international service across a broad range of agricultural and industrial liquids. We own and/or operate 25 terminal locations globally, with a presence in the U.S., eastern Canada, Western Europe and South Korea. Together these facilities provide approximately 363 million gallons of total bulk liquid storage capacity. Many of our storage facilities are located in important strategic deep water ports, such as Houston, TX; Philadelphia, PA; Jacksonville, FL; Baltimore, MD; and Grays Harbor, WA in the U.S., as well as Amsterdam, Netherlands; Gydnia, Poland; and Liverpool, U.K. in Europe. Moreover, we have numerous in-fill growth opportunities on available land at our existing sites.
We benefit from a broad geographic footprint and the extensive experience of our management team. We operate in a variety of regional, national and international markets. Our bulk liquid storage business offers our customers a truly global storage solution with a high level of expertise across multiple markets. Our strategic locations of bulk liquid storage terminals and the barriers to entry at these locations constitute advantages for our bulk liquid storage business. Our good relationships with regulators and port authorities and our extensive experience with permitting processes bolster these advantages.
Differentiated Service Offering
We provide a differentiated service to manufacturers, bulk liquid traders, and those corporations looking to minimize cost and maximize flexibility of service in the bulk liquid storage market.
We offer numerous tailored services such as heating, blending, sampling and transloading (the transfer of products from one transportation vehicle, such as a rail car or a ship, to a truck) and have customized our service contracts to meet specific customer requirements.
The range of our service offerings and our attention to customer service enables us to differentiate ourselves in the marketplace and to maintain our leading positions in many of the bulk liquid storage markets where we compete.
Strong Relationships with Blue-Chip Customers
Our business approach, which focuses on being a long-term partner rather than merely an industrial supplier, reinforces the strategic nature of our relationships with our customers. We have developed long-standing relationships with numerous well-established global customers, many of whom have been doing business with us (or our predecessor) for more than 10 years. Our ability to attract and retain blue-chip customers is the direct result of our unparalleled customer service. Maintenance of important customer relationships with long-term contracts provides us with stable revenue and income streams.
Storage Relationship with the ED&F Man Group
We have an important global relationship with the ED&F Man group as their principal supplier of storage requirements. This relationship is discussed in more detail below in the subsection entitled “Our Commercial Relationship with the ED&F Man Group.”
8
Table of Contents
Growth Strategies
Increase Volumes of Existing Services
We expect that global demand for our bulk liquid storage service should continue to increase over the long-term, although such demand may vary in particular years depending on global economic conditions. Despite uncertainty that may affect the overall economy, our growth is expected to be driven by the underlying expansion of long-term demand for a wide variety of agricultural and industrial raw materials that will need bulk liquid storage.
Given the high levels of utilization of our storage facilities, we believe one key to increasing the volume of our storage services is to increase our storage capacity in appropriate locations. In structuring our capacity to accommodate higher levels of demand, we expect to utilize the capital resources provided by our internally generated cash flow and our bank credit facility to finance increased total bulk liquid storage capacity.
When evaluating new development opportunities, we analyze a series of objective criteria including the potential benefits of additional infrastructure, logistics capability, overall environmental conditions, political stability, and payback period. Through this process, we assess the acceptability of projected financial returns, as well as the level of potential execution risk. In addition, prior to construction or expansion of any facilities, we will typically secure an indication of appropriate interest from potential customers in order to ensure that our investments will be supported by contracted base revenues.
Pursue Acquisitions
Our management maintains an active dialogue with potential acquisition targets and frequently explores opportunities in the context of our strategic goals and financial return expectations. Additionally, our staff has experience in acquiring and integrating new businesses into our operations, which has increased the size and scope of our business, and we expect to continue to pursue this strategy as appropriate opportunities surface in the future. When evaluating potential acquisitions, we expect to focus our resources on increasing our storage capacity in key markets that will enhance our scope of service offerings, as well as gaining entrance to new strategically attractive markets where we are not currently represented.
Develop New Services
We are committed to developing a range of services that will contribute long-term profitable growth to the Company. We will strive to offer new or expanded customer services through our high-quality infrastructure and state-of-the-art technical competencies. For example, in Houston we developed a custom designed base oil blending system which was built to provide optimal market flexibility to one of our customers. This base oil blending system provides a customer with a long-term technical solution to meet the demands of their market and provides Westway with a solid long-term contractual source of revenue and earnings.
Expand into Complementary Businesses
We believe that our international network of facilities, extensive management experience, and core operating capabilities in the storage of liquid products creates numerous opportunities for us to expand profitably into businesses that are vertically and/or horizontally complementary to our existing business mix.
Pursue International Joint Venture and Royalty Agreements
We intend to actively explore joint ventures and strategic alliances with business partners that will enable us to expand our interests and geographic network. We are exploring alliance agreements with companies that would utilize our tank capacity for both raw materials and finished product storage. By this means, we want to position ourselves as a critical component of a new partner’s supply chain with the goal of creating new multi-site commercial relationships.
Liquid Feed Supplements Business
Overview
Through our 35 facilities in North America, western Canada, and eastern Australia, we provide liquid feed supplements to the lower 48 U.S. states, five Canadian provinces, northern Mexico, and eastern Australia. We compete in these markets by using formulation processes that are tailored specifically to the needs of customers. We blend molasses and other essential nutrients to form feed rations that help to maximize the genetic potential of livestock. Typically, these supplements contain concentrated forms of protein, energy, minerals, and vitamins, which normally comprise 5-10% of an animal’s daily diet. Beef cattle, dairy cattle, and horses consume the majority of our liquid feed supplements. We continue to invest in research to develop new products and manufacturing processes, which allows us to maintain our competitive position.
9
Table of Contents
Our manufacturing and distribution locations allow us to provide nutritional liquid feed supplements to the majority of the U.S. livestock markets. In addition, eight of our facilities and joint venture facilities are positioned at deep water port locations, facilitating the cost-effective receipt of off-shore ingredients such as molasses and condensed molasses solubles. These deep water port terminals provide a barrier to new entry into the North American liquid feed supplements business. The balance of our manufacturing locations are either strategically located on navigable inland river systems or have direct railroad access.
Products
Our finished products provide supplemental nutrients that allow livestock to achieve their genetic potential. We use specialized manufacturing of complex formulations of several basic raw ingredients, including proteins, minerals, and vitamins, to produce complex liquid and block supplements for sale to livestock feed operators, dry feed mills, and distributors. We also produce less complex products that are utilized as ingredients in livestock feeds specifically to enhance the appearance, preserve the product, improve the palatability, or act as a binding agent for other dry feed ingredients. Specialized least-cost formulation programs allow us to maximize margins while providing the best performing product for the customer.
Our product classes and their more specific subcategories are as follows:
Complex Liquid Feed Protein Supplements, Suspensions, and Mill Products
| • | Liquid Protein Supplements. Liquid lick tanks supplements are typically fed “free choice” in pastures. Free choice consumption is normally considered to average 2 lbs. per animal, per day, and is controlled through the formulation of the liquid supplement. These pastures are normally low in nutrients such as protein, energy, phosphorus, and other minerals. Accordingly, the nutrient-dense liquid feed supplements provide a way to balance the nutritional requirements of livestock, allowing them to reproduce or gain weight at an optimum rate. In applications where liquid protein supplements are part of a complete ration, the inclusion rate of the supplement depends on the nutrient profile of the other dry feed ingredients. Nutrient profiles of the supplement can be adjusted to balance the nutrients of the dry feed ingredients. Livestock that consume the complete ration form of liquid feed supplements are normally held in confinement rather than in open pasture. Liquid protein supplements are utilized in virtually all regions of the United States and western Canada. They are marketed through both distributor and dealer networks as well as sold directly from us to the end users. |
| • | Liquid Suspension Products. Liquid suspension products are the most complex liquid feed supplements that we manufacture. Thixotropic technology allows insoluble ingredients such as calcium carbonate, potassium chloride, feathermeal, and salt to be suspended in a liquid supplement that can “flow.” These supplements provide a wide range of minerals, proteins, and medications, and are mainly utilized in confined beef feeding operations and large dairies. The largest concentrations of customers of our liquid suspension products are in the Texas panhandle and northern California. In Texas, such supplements are sold directly to the end user, whereas in northern California they are marketed through large distributors. |
| • | Mill Products. Mill products are specialized molasses-based products sold to dry feed milling companies and mixed by them with other dry feed ingredients. These specialized products are used in two primary types of applications in the dry feed milling industry: texturized horse feed and pelleted products fed to different classes of livestock. Our “E-Z Glo” product is a mill product fortified with high-quality vegetable oil, minerals, and preservatives that is included in texturized horse feed as 5-15% of overall product content. Our “Pellet Partner” product is a mill product containing liquid lignin, a by-product from the timber industry, that is used to bind dry feed ingredients to form pellets or cubes. Mill products are utilized in dry feed mills throughout the United States. They are mainly sold directly to the feed mills. |
Molasses and Molasses Blends
| • | Molasses. Molasses is a standardized 79.5 brix product that is sold predominantly to the commercial dry feed industry. Standardized molasses is typically used for a coating on textured feeds and dry feed products. |
| • | Blends. Blends are the simplest form of value-added products. Typically blends include molasses blended with one or more of the following ingredients: corn steep liquor, condensed molasses solubles, whey permeate, distillers’ solubles, lignin sulphonate, and/or glycerine. Blends are normally utilized in complete feed rations to reduce the dust and improve the palatability of the ration. Virtually all blends are incorporated into livestock rations that do not use a protein supplement or a suspension and are consumed in confined feeding operations. We use distribution and direct supply formats for the sale of blends. |
10
Table of Contents
Other
| • | Blocks/Tubs. Blocks, or tubs as they are sometimes referred to, are a solid feed supplement that is fed, unmixed with any other food, as a free choice protein supplement to cattle on pasture or improved pastures. The primary package size is 200 lbs. and is marketed through a series of distributors and local farm stores. The majority of our blocks are toll manufactured for other feed companies, sold through their respective labels, and fed primarily to beef cattle, dairy cattle, and horses, with some products sold for sheep, goats, and wild game. |
| • | Dried Products. Dried products result from mixing ground soybean hulls and sunflower hulls with cane molasses and drying the mix through a rotating drum drier. Dried products are typically used either as sweeteners for dry feed rations, or as binding agents for other dry feed ingredients in the manufacture of solid feed supplements known as “blocks.” Target customers include small confined feeding operators that use dried products as sweeteners, and specialty small block manufacturers that use dried products as a binder and sweetener. All dried product marketing to confined feeding operators is done through a series of distributors. The majority of our dried products are consumed by beef and dairy cattle, with little consumed by horses, sheep, goats, swine, or poultry. |
| • | Other Ingredients. This category is comprised of liquid whey permeate, renewable fuel by-products, and other liquid ingredients sold typically directly to customers. |
Champion Liquid Feeds Pty Ltd
In addition to serving markets in North America, we also have a presence in the Australian feed market through our 50% interest in Champion. Champion was formed in 2001 for the purpose of manufacturing and distributing liquid feed supplements in eastern Australia. During 2010, Gardner Smith (Holdings) Pty Ltd acquired our prior joint venture partner’s 50% ownership in Champion. Gardner Smith has a significant presence in the agricultural liquid storage business in Australia and New Zealand. Champion is able to supply a complete range of liquid feed supplements to Victoria, New South Wales, and Queensland.
Customers
Our liquid feed supplements business is not dependent on any single or few customers whose loss would have a material adverse effect on the business.
Sources and Availability of Raw Materials
Molasses is one of our primary inputs. We have a long term supply agreement through May 2019 with the ED&F Man group to provide us with heavy brix cane molasses based on formula pricing determined in part by prices charged by the ED&F Man group to third parties. Under the agreement, the ED&F Man group must maintain books and records sufficient to be audited in accordance with generally accepted auditing standards. The ED&F Man group must also arrange for independent verification on a quarterly basis of the prices charged to their customers by a reputable independent certified public accounting firm and provide the reports of such information to us. This agreement is expected to provide us with the majority of our molasses needs in 2012. We expect that we will be able to obtain a sufficient supply of molasses for the foreseeable future. In addition we purchase significant volumes of other food and agricultural raw materials through fixed or indexed pricing mechanisms. We expect that we will be able to obtain sufficient supplies of needed ingredients in 2012 and the foreseeable future.
Intellectual Property
The collective body of our intellectual property, including patents and trademarks, affords us the opportunity to profitably utilize a wide range of human-food industry by-products and other co-products to help meet the needs of the livestock industry as well as certain other industries. However, our overall success is not dependent upon any single portion of our intellectual property.
Seasonality
The liquid feed supplement business, which is predominately driven by cattle feeding, is typically stronger in the fall and winter months (feed season) because many cattle are fed on natural grasses during the spring and summer months. Range cattle are typically fed liquid supplements during late fall and winter as grass nourishment diminishes and/or is dormant due to weather conditions. This seasonality is also impacted by the “calving season”. Range cattle “typically” calve in the January through March time frame, requiring heavier supplementation during the late gestation/lactation period. This seasonality is also driven in part by the colder weather which requires more feed for body maintenance purposes.
11
Table of Contents
Competition
Competitive Conditions
We are the largest producer of liquid feed supplements in North America. Our business operates in a highly competitive environment, and our competition in North America falls into three categories: the commercial liquid feed industry, the commercial dry feed industry, and the commodity brokerage industry. Regionally, we compete against a number of smaller liquid animal feed companies.
Principal Methods of Competition
We operate in markets with competition based on price, quality, and service. We focus on managing our input costs, utilizing the best of available co-product streams, improving efficiencies via technological advancements, pursing research and development, and making productivity enhancements.
Factors Affecting Our Competitive Position
Positive factors pertaining to our competitive position are discussed at length below in the subsection entitled “Competitive Strengths.” Negative factors pertaining to our competitive position include competitors who are larger, vertically integrated, and have greater financial resources and lower costs of capital than us. Accordingly, these competitors are sometimes able to offer a better price. There are also occasions where a competitor has a facility in a location that enables it to serve a particular customer’s need more economically than our nearest facility. These negative factors are further described in the “Risk Factors” section of this Form 10-K.
Competitive Strengths
Broad Geographic Footprint and Strategic Location of Facilities
Through our liquid feed supplements business, we own and/or operate 35 facilities—32 located throughout the U.S. and western Canada, and three joint venture facilities in eastern Australia. Together the facilities provide on an annual basis approximately 1.8 million tons of liquid feed supplements production.
Our liquid feed supplements business has the broadest geographic coverage of any North American liquid feed supplements manufacturer, and we are the only producer capable of servicing all lower 48 U.S. states, as well as five provinces in Canada and parts of northern Mexico. Moreover, our seven deep-water port locations together with a key alliance at the Melbourne, Australia port gives us a competitive advantage over other liquid feed supplements companies in markets we serve. We expect to continue leveraging our network and extensive market knowledge to explore expansion opportunities on a global scale in the years to come.
Differentiated Product Offering
We offer a broad range of liquid feed supplements, ranging from simple molasses-based blends and mill products to highly complex suspension products. Further, our research and development skill and proprietary manufacturing processes allow us to customize our feed products to meet specific customer nutritional requirements and to respond to the changing availability and cost of ingredients. The range of our product offerings and our attention to customer service enable us to differentiate ourselves in the marketplace and to maintain our leading market position in the liquid feed supplements industry.
Strong Relationships with Blue-Chip Customers
Our business approach, which focuses on being a long-term partner rather than merely an industrial supplier, reinforces the strategic nature of our relationships with our customers. We have developed long-standing relationships with numerous well-established global customers, many of whom have been doing business with us (or our predecessor) for more than 10 years. Our ability to attract and retain blue-chip customers is the direct result of our unparalleled customer service.
Feed Relationship with the ED&F Man Group
We have an important global relationship with the ED&F Man group as an important supplier of cane molasses for our liquid feed supplements business. This relationship is described in more detail below in the subsection entitled “Our Commercial Relationship with the ED&F Man Group.”
12
Table of Contents
Growth Strategies
Increase Volumes of Existing Products
We expect that global demand for our liquid feed supplements products will continue to increase over the long-term, although such demand may vary in particular years depending on global economic conditions. In the long-term, we expect the liquid feed supplements business to continue to benefit from increasing global demand for animal feed containing higher protein content. In the near term of 2012, however, we expect the low U.S. beef cattle numbers and declining dairy profits will continue, which in turn could negatively affect the demand for animal feed, including liquid feed supplements. However, in anticipation of a growing long-term demand, we expect to utilize the capital resources provided by our internally generated cash flow and our bank credit facility to finance increased production.
When evaluating new development opportunities, we analyze a series of objective criteria including the potential benefits of complementary products and services, additional infrastructure, logistics capability, overall environmental conditions, political stability, and payback period. Through this process, we assess acceptability of projected financial returns and the potential level of execution risk of possible transactions.
Pursue Acquisitions
The liquid feed supplement industry is highly fragmented in nature with numerous small and mid-sized companies operating in North America. We believe this market fragmentation provides us with significant expansion opportunities. Our management team maintains an active dialogue with potential acquisition targets and frequently explores opportunities in the context of our strategic goals and financial return expectations. Additionally we have experience in acquiring and integrating new businesses which have increased the size and scope of our operations, and expect to continue to pursue this strategy as new opportunities become available in the market. When evaluating potential acquisitions, we focus on those opportunities which will increase production capacity in key markets that enhance our product offerings, and those which will provide new entry into strategically attractive markets where we are not currently represented.
Develop New Products
We expect to dedicate appropriate resources to developing a range of products that will contribute long-term profitable growth to the Company. We will continue to leverage our strong research and development capabilities to design products that incorporate and/or expand on new technologies, as well as source raw materials that have not been previously utilized. We will focus on products that provide the most significant potential for profit and have the most potential to differentiate us in the marketplace. For example, we are currently exploring opportunities related to emerging liquid byproducts from the biofuel industry, edible packaging alternatives, and new applications for low-cost suspension products for the beef industry. Additionally, we have expanded our product offering to include low moisture tubs. We believe this product line is complementary to our existing poured tub product line.
Expand into Complementary Businesses
We believe our international network of facilities, extensive management experience, and core operating capabilities in the manufacturing and distribution of liquid products create numerous opportunities for us to profitably expand into businesses that are vertically and/or horizontally complementary to our existing business mix.
Pursue International Joint Venture and Royalty Agreements
We intend to actively explore joint ventures and strategic alliances with global business partners to expand our interests and geographic network. Currently, we are expanding our geographic footprint in Mexico. Mexico, which has approximately 1/3 the beef cattle/dairy cattle numbers as the U.S., is a largely untapped liquid supplement market. We believe our existing US infrastructure, technologies, and staff can be utilized to expand into this country. By combining our expertise with those of our joint venture partners, we will continue to create successful liquid feed manufacturing capabilities that are poised for future growth in the international marketplace. We are also actively seeking opportunities to leverage our technological leadership in liquid feed supplements by establishing royalty agreements with complementary organizations for the manufacturing and distribution of our products on a worldwide basis.
Our Commercial Relationship with the ED&F Man Group
Our commercial relationship with the ED&F Man group provides a number of benefits to both our bulk liquid storage and liquid feed supplements businesses. In particular, the benefits of being a supplier of bulk liquid storage to the ED&F Man group, combined with the quality and quantity of molasses supplied to our liquid feed supplements business by the ED&F Man group, provides us with a degree of certainty in the operation of our businesses and our ability to service our many customers in the future.
13
Table of Contents
Bulk Liquid Storage Arrangements
Our long-term relationship as a supplier of bulk liquid storage to the ED&F Man group’s various trading divisions has been a contributor to our performance. The long-term contract setting forth our supplier status is the storage alliance agreement, the initial term of which runs until May 28, 2029, after which the agreement provides for automatic renewals for successive ten year periods, unless either party gives at least three years notice of non-renewal. The storage alliance agreement is described in “Certain Relationships and Related Transactions—Related Transactions—Storage Strategic Alliance Agreement and Terminal Service Agreement” in the prospectus we filed with the SEC on August 7, 2009. The ED&F Man group has global expansion opportunities, and as their storage supplier, we expect to capitalize on these opportunities which will provide additional business for both our existing and new locations.
Molasses Supply Arrangements
Molasses is an important ingredient utilized in our liquid feed supplement formulations. We and the ED&F Man group have a long-term molasses supply agreement, pursuant to which the ED&F Man group is our primary supplier of cane molasses. The initial term of the agreement runs until May 28, 2019, after which the agreement provides for automatic renewals for successive one-year periods unless either party gives notice of non-renewal. The long-term molassess supply agreement is described in “Certain Relationships and Related Transactions—Related Transactions—Molasses Supply Agreement” in the prospectus we filed with the SEC on August 7, 2009. Effective October 2011, an addendum to this molasses supply agreement was renewed, with a one-year term that slightly modifies the pricing mechanism.
Insurance Participation Agreement
We have a participation agreement with a captive insurance company owned by the ED&F Man group. The captive underwrites the self-insured portion of certain risks insured by us through the captive and charges a premium for the first layer of claims exposure. Under this agreement all of our transactions are partitioned into a separate operational cell from the ED&F Man group’s business.
Employees
As of March 16, 2012, we had 496 employees, of which 495 are full-time employees.
Regulation and Safety
We are required to comply with the health and safety regulations and requirements of each of the jurisdictions in each of the countries in which we operate. In order to comply with their requirements, management focuses on the issue of health and safety from the top down, identifying key operational risks and seeking to ensure that our policy, process and practice are in conformity with legal and normal business practices. The risks relating to the safe handling, storage and regulation of each of our bulk liquid storage and liquid feed supplements operations are managed on a centralized basis for both of our businesses. The regulatory and legal environments within which liquid products are handled by our businesses differ with the geography, markets, product offerings, and sophistication within which we operate.
We are required to comply with Federal Food and Drug Administration requirements as well as local State feed control requirements in the U.S. To meet and exceed these requirements, we have developed and implemented an extensive Standard Operating Procedures Manual, which comprises all aspects of quality, FDA regulation, training, manufacturing, administrative, and security compliance.
In addition, we comply with applicable health and safety requirements in Europe and elsewhere by following our European Health, Safety, Environmental, and Quality (“HSEQ”) policy, including local legal requirements that govern the care and safeguarding of the health and safety of our employees and the environment.
Our compliance with Federal, State, foreign, and local regulations relating to the protection of the environment is not expected to have a material effect upon our capital expenditures, earnings, or competitive position.
Forward-Looking Statements
This Item 1 of our Form 10-K contains numerous forward-looking statements, including our statements about future growth in demand for various products and services and about our plans, intentions, or hopes to increase storage and production volumes, open new facilities, expand terminal capacity through site development, market products in other nations, expand our liquid supplement business, pursue acquisitions, invest in the development of and develop new products and services, and explore joint venture and strategic alliance opportunities. There are a number of important factors that could cause actual results to differ materially from our forward-looking statements, including the factors discussed at length in the “Risk Factors” section, Item 1A of this Form 10-K.
14
Table of Contents
Information Available on Our Website
We make available free of charge on or through our website, as soon as reasonably practicable after we electronically file with or furnish to the SEC, our annual report on Form 10-K and our quarterly reports on Form 10-K and any amendments thereof, and (via a link to EDGAR) our current reports on Form 8-K and any amendments thereof. Our internet address is www.westway.com. Additionally, we have adopted a Code of Conduct and Ethics, applicable to all employees, officers and directors, which is available on our website, along with our corporate governance principles, audit committee charter, nominating committee charter, compensation committee charter, and whistle blower policy.
| ITEM 1A. | RISK FACTORS |
You should carefully consider each of the following risks. These risks constitute important factors that could cause our actual results to differ materially from those indicated by our forward-looking statements in this Form 10-K.
The realization of any of the following risks may significantly and adversely affect our business, prospects, financial condition, or operating results, as well as the trading price of our common stock. Moreover, some of the risks described below may to some degree already have occurred or be occurring. For further information regarding our actual recent experience, please see Items 7 and 7A of this Form 10-K.
The risks and uncertainties described below are not the only ones that we face. We are also subject to risks that affect many other companies, such as general economic conditions and geopolitical events. Additional risks and uncertainties not presently known to us or that we currently believe to be immaterial also may adversely affect our business. In describing these risk factors, we are not undertaking to address or update each factor in future filings or communications regarding our business or results.
Risks Related to Our Business and Operations Generally
The proposals received by our Board of Directors, and the related Special Committee process, could materially and adversely affect our business and financial results. In addition, there can be no assurance that any definitive offers will be made, or, if made, that any transactions will be consummated.
As described in “Management’s Discussion and Analysis of Financial Condition and Results of Operations,” our Board of Directors has received (1) an unsolicited preliminary offer from ED&F Man, our largest stockholder, to acquire our animal feed supplements business and certain non-core bulk liquid storage terminals and (2) an unsolicited proposal from an infrastructure investment fund to acquire us for $6.00 per common share, $6.00 for each outstanding Series A Convertible Preferred share and $1.00 for each outstanding Founder Warrant, contingent upon the consummation of the proposed transaction to sell our animal feed supplements business and certain non-core bulk liquid storage terminals to ED&F Man. Our Board of Directors has initiated a process to explore strategic alternatives for the company as a whole and formed a Special Committee of independent directors to direct the strategic review process. The Special Committee has retained Evercore Partners as financial advisor to assist it during this process.
No definitive timetable has been set for evaluation of ED&F Man’s proposal. The Special Committee reviewed the infrastructure investment fund proposal with Evercore Partners and determined that it substantially undervalued the bulk liquid storage business and did not provide any basis to begin discussions or negotiations.
The process undertaken by the Special Committee could cause distractions and disruptions in our business. We may encounter difficulty retaining officers and other key employees who may be concerned about their future roles with us if a transaction were completed. Further, the costs associated with the evaluation of proposals and any related process is expected to be considerable, regardless of whether any transaction is consummated. All of the foregoing could materially and adversely affect our business and financial results. In addition, there is no assurance that any definitive offer for a change of control transaction will be made, or, if made, that any change of control transaction will be consummated. If a change of control transaction does not occur, the share price of our Class A common stock may decline to the extent that the current market price of our Class A common stock reflects an expectation that a transaction will be completed.
15
Table of Contents
Divestitures of any of our businesses could have a material adverse effect on our business, results of operations and financial condition.
We continually evaluate the performance of our businesses and may determine to sell a business. Divestitures may result in significant write-offs or impairment of assets, including goodwill or other intangible assets. Divestitures may involve additional risks, including separation of operations and personnel, diversion of management attention, disruption of our businesses or loss of key employees. We may not successfully manage those or other risks we may confront in divesting a business, which could have a material adverse effect on our business, results of operations and financial condition.
Our business has an important business relationship and dependence on the ED&F Man group.
Our liquid feed supplements business relies to a significant extent on the ED&F Man group as a supplier of raw cane molasses, which is used as a component of our liquid feed supplements products. We intend to continue sourcing a substantial portion of this raw material from the ED&F Man group in the future. We have a long-term supply agreement with the ED&F Man group whereby they supply us with heavy brix cane molasses. In the event that we are unable to purchase this raw material on reasonable terms from the ED&F Man group, we may be unable to find suitable alternatives to meet our needs, which could adversely affect our financial condition and results of operations.
The ED&F Man group is also an important customer of our bulk liquid storage business. We expect to derive a significant portion of our revenue from this relationship for the foreseeable future. Events that adversely affect the business operations of the ED&F Man group at times can adversely affect our financial condition and results of operations. We are indirectly subject to the business risks of the ED&F Man group, which are not always similar to the business risks we face directly. In addition, if the ED&F Man group is unable to meet its contractual commitments to us for any reason, then our revenue and cash flow could be negatively affected.
We may not be successful in identifying sufficient suitable development or acquisition opportunities, or purchasing or financing such opportunities on an acceptable basis.
Part of our business strategy includes developing or acquiring additional assets that complement our existing asset base, including developing or acquiring additional terminal, transportation, and storage facilities and the expansion of our existing liquid storage capacity. We may not be able to identify sufficient suitable development or acquisition opportunities. We may not be able to purchase or finance some potential developments or acquisitions on terms that we find acceptable. Additionally, we compete against other companies for development locations and acquisitions, and sometimes we are outbid by competitors. We can provide no assurance that we will be successful in the acquisition or development of assets and businesses appropriate for our growth strategy.
Cost overruns and delays in our expansion activities could adversely affect our business.
We currently have several significant expansion projects underway or planned. A variety of factors outside of our control, including weather or natural disasters, shortages of materials, construction equipment, or skilled labor; unforeseen engineering, geological, or environmental problems; poor performance by or disputes with contractors; opposition by environmental groups; or difficulties in obtaining permits or other regulatory approvals, at times may result in delays in construction or increased construction costs that may have an adverse effect on our return on investment, results of operations, or cash flows.
We may enter into agreements for or consummate acquisitions with little or no notice to our stockholders.
We regularly consider and enter into discussions regarding potential acquisitions. Any such transaction would be subject to negotiation of mutually agreeable terms and conditions and approval of the parties’ respective boards of directors. The acquisition of a business or assets can be effected quickly, may occur at any time, and may be significant in size relative to our existing assets or operations. Our capitalization and results of operations may change significantly as a result of these activities, and you generally will not have the opportunity to evaluate the economic, financial, and other relevant information that we will consider in connection with any future acquisitions or development opportunities, even though you may have the opportunity to evaluate material information in certain circumstances, such as when the approval of our common stockholders is required.
Our future developments or acquisitions may substantially increase the levels of our indebtedness and contingent liabilities, may impose substantial costs and delays, and may cause other unanticipated adverse impacts. We may not be able to integrate effectively and efficiently any future operations that we may develop or acquire.
Unexpected costs or challenges may arise whenever businesses with different operations and management are combined. For example, the incurrence of substantial unforeseen environmental and other liabilities, including liabilities arising from a newly-developed site or the operation of an acquired business or asset prior to our acquisition for which we are
16
Table of Contents
not indemnified, or for which indemnity is inadequate, may adversely affect our ability to realize the anticipated benefit from the development or acquisition. Inefficiencies and difficulties at times arise because of our unfamiliarity with new assets and new geographic areas of acquired locations or businesses. With acquisitions in particular, successful business combinations typically require our management and other personnel to devote significant amounts of time to integrating the acquired business or assets with our existing operations. These efforts at times temporarily distract our attention from day-to-day business, the development or acquisition of new properties, and other business opportunities. To the extent we do not successfully integrate any past or future acquisitions, or there is any significant delay in achieving such integration, our business and financial condition may be adversely affected. As previously mentioned our Amsterdam, Netherlands terminal tank expansion was delayed from its original schedule due to the extensive permitting process in the Netherlands.
We are the borrower under a credit facility with a syndicate of banks as the lenders. The amount we borrow under this facility or its terms may restrict our operating flexibility, could adversely affect our financial health, and could prevent us from fulfilling certain financial obligations.
We are the borrower under a credit agreement dated as of November 12, 2009, with JPMorgan Chase Bank, N.A., as administrative agent, Regions Bank, as syndication agent, Capital One, N.A., Rabobank Nederland, SunTrust Bank, and Compass Bank (doing business as BBVA Compass), as documentation agents, and the lenders from time to time party thereto (currently, JPMorgan Chase Bank, N.A., Regions Bank, Capital One, N.A., Rabobank Nederland, Suntrust Bank, Compass Bank, Whitney National Bank, and CoBank ACB) (the “Credit Agreement”). The Credit Agreement was delivered and became effective on November 16, 2009 and has been amended several times.
This revolving credit facility, which now totals $200 million, is scheduled to mature on July 6, 2015. The facility provides for loans at variable rates of interest, and is secured by most of our assets, various pledges of equity, and various guarantees by subsidiaries in our group. For a discussion of the terms of the credit agreement and its security, see the “Liquidity and Capital Resources” section of the “Management’s Discussion and Analysis of Financial Condition and Results of Operations” part of this Form 10-K.
Our borrowings under this credit facility are being used primarily for working capital and to assist us in funding capital expenditures, including acquisitions. As of December 31, 2011, our total indebtedness under this facility was $93.5 million, leaving $106.5 million available for additional borrowing, along with a $50 million accordion. The amount we borrow under this facility could significantly affect our operating flexibility, our financial health, and our ability to fulfill certain financial obligations. For example, the more we borrow under the facility:
| • | the more difficult it may be for us to satisfy our current and future debt obligations; |
| • | the more dependent we may be on the credit facility and the more any default under or termination of the credit facility may adversely affect us; |
| • | the greater the portion of cash flows from operating activities we must dedicate to the payment of principal and interest on the indebtedness, thereby reducing the funds available for other purposes; |
| • | the more we may be at a competitive disadvantage to competitors who are not as leveraged; and |
| • | the more vulnerable we are to interest rate fluctuations, as the indebtedness under the facility bears interest at variable rates. |
Likewise, the terms of the credit agreement may restrict our operating flexibility, financial health, or ability to fulfill certain financial obligations. For example, the terms of the credit agreement since the last amendment in July 2011:
| • | include not only first priority liens and security interests on the majority of our assets, but also a negative pledge on substantially all our non-mortgaged assets that restricts the encumbrance of such assets, subject to narrow exceptions; |
| • | require us to maintain certain financial covenants, including (a) a maximum consolidated total leverage ratio (as defined in the amended credit agreement) of no more than 3.75 to 1 at the end of each quarter; and (b) a minimum consolidated interest coverage ratio (as defined in the credit agreement) of not less than 3.0 to 1 at the end of each quarter; |
| • | put restrictions on our ability to make capital expenditures, dispose of assets, incur indebtedness, encumber assets, pay dividends, redeem securities, make investments, change the nature of our business, acquire or dispose of a subsidiary, enter into transactions with affiliates, enter into hedging agreements, or merge, consolidate, liquidate, or dissolve; |
| • | provide for the possibility of acceleration of our debt and the termination of all loan commitments under the facility upon the occurrence of an event of default; and |
17
Table of Contents
| • | require the consent of each lender directly affected with respect to most time extensions or forgiveness of any amounts owed. |
Our acquisition strategy and expansion programs require access to new capital. Volatility in the credit markets or more expensive capital could impair our ability to grow.
Our business strategies include acquiring additional terminal, transportation and storage facilities and the expansion of our existing liquid storage capacity. Although the bank syndicate credit facility into which we entered in November 2009 provides significant financing for corporate purposes, including future acquisitions and expansion, additional funds may be required to grow our business further and fully implement these strategies. Any equity or additional debt financing to raise such additional funds is subject to availability and may not be available on favorable terms. An inability to access the equity capital markets may result in a substantial increase in leverage and have a detrimental impact on our creditworthiness. If adequate additional financing cannot be obtained, our business strategies may not be able to be fully implemented or implemented in the expected time frame and our financial condition and results of operations could be adversely affected.
Our business involves many hazards and operational risks inherent in the storage and handling of liquid products, which could result in substantial liabilities and increased operating costs.
Our operations are subject to the many hazards inherent in the storage and handling of liquid products on an industrial scale, including, but not limited to:
| • | leaks or accidental releases of products or other materials into the environment, whether as a result of human error or otherwise; |
| • | extreme weather or environmental conditions, such as hurricanes, tropical storms, rising water, and earthquakes. |
| • | explosions, fires, accidents, mechanical malfunctions, faulty measurement, and other operating errors; and |
| • | acts of war, terrorism, or vandalism. |
Whenever any of these events occurs, substantial losses may be incurred as a result of personal injury or loss of life, severe damage to or destruction of storage tanks, processing facilities, or related property and equipment, or pollution or other environmental damage. These events may result in curtailment or suspension of related operations and potentially substantial unanticipated costs for the repair or replacement of property and environmental cleanup. In addition, whenever there are accidental releases or spills of products at our liquid storage facilities, we may be faced with third-party costs and liabilities, including those relating to claims for damages to property and persons. Furthermore, events like hurricanes can affect large geographical areas, which may cause us to suffer additional costs and delays in connection with subsequent repairs and operations, because contractors and other resources may not be available or are only available at substantially increased costs following widespread catastrophes.
Our business depends, in part, upon certain individuals who may not necessarily continue to be affiliated with us.
We are dependent, in part, on the efforts of key members of our management team, including Messrs. James Jenkins, Thomas Masilla, Stephen Boehmer, and Gene McClain. The loss of services of one or more of these individuals, each of whom has substantial experience, could have an adverse effect on our business strategies and the growth and development of our business. If one or more of these individuals were no longer affiliated with us, or if we ceased to receive advisory services from them, our inability to recruit other employees of equivalent talent could have an adverse effect on our financial condition and results of operations.
Proposed changes in U.S. federal income tax laws may affect our future operations.
The U.S. administration’s proposed fiscal year budget possesses certain general changes to existing corporate tax laws. It is uncertain if these proposed tax laws will be enacted, how soon any such change could become effective, or the effect, if any, on our financial condition.
18
Table of Contents
Risks Related to Our Bulk Liquid Storage Business
The obligations of several of our significant customers under their liquid storage services agreements with us may be reduced or suspended in some circumstances, which could adversely affect our financial condition and results of operations.
Our agreements with several of our significant customers provide that, when any of a number of events, referred to as events of force majeure, occur and the event renders performance impossible with respect to a facility, usually for a specified minimum period of days, customer obligations are to be temporarily suspended with respect to that facility. In that case, a significant customer’s minimum revenue commitment may be reduced or the contract may be subject to termination. As a result, our revenue and results of operations may be adversely affected.
If one or more of our significant customers do not continue to engage us to provide services after the expiration of those customers’ current liquid storage services agreements with us and we are unable to secure comparable alternative arrangements, our financial condition and results of operations could be adversely affected.
Our liquid storage services agreements with our customers ordinarily provide for terms of between 12 and 36 months. After the expiration of each of these liquid storage services agreements, the customer may elect not to continue to engage us to provide services. In addition, if a significant customer does re-engage us, the terms of any renegotiated agreement may be less favorable to us than the agreement it replaces. In either case, we may not be able to generate sufficient additional revenue from third parties to replace any shortfall in revenue or increase in costs. Additionally, substantial costs may be incurred whenever modifications to liquid storage facilities are required in order to attract substitute customers or provide alternative services. Whenever a significant customer does not extend or renew its liquid storage services agreement, whenever we extend or renew the liquid storage services agreement on less favorable terms, and whenever substantial costs are incurred to attract substitute customers, our financial condition and results of operations are adversely affected.
Competition from other businesses providing liquid storage that are able to supply our significant customers may adversely affect our financial condition and results of operations.
We face competition from other liquid storage facilities that at times are able to supply customers with integrated liquid storage services on a more competitive basis. We compete with multi-national, national, and regional liquid storage companies, of widely varying sizes, financial resources, and experience. Our ability to compete at times is affected by factors beyond our control, including, but not limited to:
| • | price competition from liquid storage and transportation companies, some of which are substantially larger than we are and have greater financial resources and control substantially greater product storage capacity; |
| • | the perception by a customer that another company provides better service; and |
| • | the availability of alternative supply points or supply points located closer to a customer’s operations. |
Whenever we are unable to compete effectively with services offered by other enterprises, our financial condition and results of operations may be adversely affected.
Some of our liquid storage facilities have been in service for many years, which can result in increased maintenance, remediation expenditures, or obsolescence which can adversely affect our results of operations.
Our liquid storage assets are generally long-lived assets. As a result, some of these assets have been in service for many years. The age and condition of these assets sometimes results in increased maintenance, remediation expenditures, or obsolescence. Increases in these expenditures or obsolescence adversely affect our financial condition, results of operations, and cash flows.
The impact of environmental regulation on our liquid storage facilities may adversely affect our level of cash flow and net income.
Compliance with environmental regulations incurs operating and capital costs. Our business operations are subject to federal, state, local, and some foreign laws and regulations relating to environmental protection. For example, whenever an accidental leak, release, or spill of chemicals or other products occurs at one of our liquid storage facilities, we may experience significant operational disruptions and may have to pay a significant amount to clean up the leak, release or spill or pay for government penalties, address natural resource damage, compensate for human exposure or property damage, or a combination of these measures. The resulting costs and liabilities may negatively affect our level of cash flow and net income. The impact of U.S. Environmental Protection Agency current standards or increased future environmental measures may increase our costs significantly whenever new environmental laws and regulations become effective.
The profitability of our bulk liquid storage business can be significantly affected by changes in the exchange rates between the United States dollar and the currencies used in foreign countries in which we operate.
Almost one-third of our bulk liquid storage operations are outside of the United States. As a result, we hold assets, incur liabilities, earn revenues, and pay expenses in a variety of foreign currencies, including most notably the euro and the British pound. The financial statements of our foreign subsidiaries are translated into United States dollars in preparing our consolidated financial statements. Thus, our profitability is impacted by changes in foreign currency exchange rates. For example, in 2011, higher foreign exchange rates for the euro, British pound, and Canadian dollar resulted in a combined positive impact on our bulk liquid storage earnings outside of the U.S. of approximately 4%.
19
Table of Contents
Foreign exchange rates may vary quite significantly from period to period. We do not presently hedge against the risks of foreign currency fluctuations, but we are continuing to evaluate the possible future use of foreign currency hedging strategies. For more information regarding our exposure to foreign currency exchange rate risk, please see “Quantitative and Qualitative Disclosures about Market Risk” in Part II, Item 7A of this Form 10-K.
Risks Related to Our Liquid Feed Supplements Business
Our liquid feed supplements business is highly affected by agricultural commodity prices and by raw material prices, which are in turn affected by a variety of factors beyond our control and subject to significant volatility and uncertainty.
Our liquid feed supplements business is affected by variations in supply and demand which significantly impact our input prices and the prices at which we sell our products. These variations have resulted in fluctuations in the liquid feed supplements business’ profitability and will likely continue to do so.
Prices paid for our inputs are influenced by a variety of factors beyond our control, including weather, economic conditions, government agricultural policies and programs, competing demands from the biofuels industry, and changes in global supply and demand.
The price we charge for liquid feed supplements is influenced by a variety of factors beyond our control, including the weather; economic conditions in the beef and dairy cattle industries; government agricultural programs and policies; changes in global demand resulting from population growth and changes in standards of living; and general economic, market and regulatory factors.
The significance and relative effect of these factors on our input price and the price of liquid feed supplements is difficult to predict. These factors can cause volatility in the agricultural commodity industry and, consequently, in our financial condition and results of operations.
The supply of, demand for, and price of agricultural products and raw materials are often affected by the weather.
Weather conditions have historically caused volatility in the agricultural commodity industry and consequently in that segment of our operating results related to liquid feed supplements. Weather conditions can affect the demand for our products, such as by affecting the primary natural source of animal nutrition, grass. For example, in 2009 and the first quarter of 2010, adverse weather effects, including a drought in central and southern Texas, led to reduced cattle herds, which affected the demand for our products.
Weather conditions have also at times caused crop failures or significantly reduced harvests, which can adversely affect the supply and pricing of the agricultural raw materials that we use as inputs for our business.
We are subject to animal feed industry risks.
We are subject to animal feed industry risks. These risks include, but are not limited to, product spoilage or contamination, government regulation of the animal feed industry including processing and labeling regulations, shifting customer preferences and concerns including concerns regarding genetically modified organisms as well as other environmental concerns, and potential product liability claims. To the extent realized, these risks adversely affect our financial condition and results of operations.
The sale of feed products for livestock involves the risk of injury to the animals as well as human consumers of the animals. Such hazards may result from tampering by unauthorized third parties; product contamination (such as listeria, E. coli. and salmonella) or spoilage; the presence of foreign objects, substances, chemicals, and other agents; residues introduced during the growing, storage, handling or transportation phases; or products that are improperly formulated or do not contain the proper mixture of ingredients. Whenever any of these or similar hazards occur, depending on the circumstances, consumption of our products may cause serious health-related illnesses and we may be subject to claims or lawsuits relating to such matters. Any sale by us of adulterated or defective products, including products manufactured wholly or in part by third parties, may lead to an increased risk of exposure to product liability claims, product recalls, governmental fines or other sanctions, and increased scrutiny by Federal and state regulatory agencies. Such claims or liabilities may not be covered by our insurance or by any rights of indemnity or contribution.
20
Table of Contents
In addition, even if a product liability claim is not successful or is not fully pursued, the negative publicity surrounding any assertion that our products caused illness or injury could have a material adverse effect on our reputation with existing and potential customers and on our brand image. Furthermore, the outbreak of disease in livestock or poultry, even if unrelated to our products, may adversely affect demand for liquid feed supplements used in livestock and poultry feed. A decrease in demand for our liquid feed supplements would adversely affect our revenues and results of operations.
Government policies and regulations affecting the agricultural sector and related industries could adversely affect our financial condition and results of operations.
Agricultural production and trade flows are significantly affected by government policies and regulations. Governmental policies affecting the agricultural industry, such as taxes, tariffs, duties, subsidies and import and export restrictions on agricultural commodities and commodity products, often influence industry profitability, the planting of certain crops or grazing of certain types of livestock versus other uses of agricultural resources, whether unprocessed or processed commodity products are traded, and the volume and types of imports and exports. In addition, international trade disputes at times adversely affect agricultural commodity trade flows by limiting or disrupting trade between countries or regions. Government policies have in the past and may in the future adversely affect the supply of, demand for, and prices of our products, restrict our ability to do business in existing and target markets, and harm our financial condition and results of operations.
Competition in the industry may reduce our sales and margins.
In the liquid feed supplements business, we are the largest producer of liquid feed products in North America. Our business operates in a highly competitive environment. We compete with companies that have substantial capital resources, research and development staffs, facilities, diversity of product lines and brand recognition. Competition as to any of our products at times results in reduced prices that reduce our sales and margins. Our competitors at times succeed in entering markets in which we have a competitive advantage. Our competitors may succeed in developing new or enhanced products which are better than ours. Our competitors may at times be more successful in marketing, distributing, and selling their products. These events at times have an adverse effect on our results of operations or financial condition.
Risks Related to Ownership of Our Securities
We may not continue to pay quarterly dividends at the same rate or form or in any amount in the future.
We declared our first quarterly dividend on August 30, 2011. The Company’s declaration of a quarterly dividend or the adoption of a dividend policy does not commit the board of directors to declare future dividends, and plans for future dividends may be revised by the board of directors. Dividend declarations and the rate and form of any future dividends are limited by the discretion of the Company’s board of directors, and may be affected by a number of factors, including the Company’s then current and prospective financial condition, results of operations, cash flows, and liquidity, and its capital spending programs, including the level and timing of its acquisition activity. The amount of future dividends payable in cash is also subject to the constraints of our credit facility and the ability of the Company to pay or otherwise satisfy the accrued preferred cash dividends of our Series A Convertible Preferred Stock, which is currently held by the ED&F Man group.
Our issuance of preferred stock could adversely affect our common stockholders.
Our certificate of incorporation authorizes the issuance of shares of preferred stock with such designations, preferences and relative, participating, optional or special rights and such qualifications, limitations or restrictions as may be determined from time to time by our board of directors. Accordingly, our board of directors is empowered, without stockholder approval, to issue preferred stock with dividends, liquidation, conversion, voting or other rights that may adversely affect the relative voting power or other rights of the holders of our common stock. Preferred stock may be used as a method of or have the effect of discouraging, delaying or preventing a change in control, which may have the effect of discouraging bids for us and thereby potentially prevent stockholders from receiving the maximum value for their shares. Pursuant to our certificate of incorporation, our board of directors is authorized to issue 40,000,000 shares of preferred stock. As of March 16, 2012, all 40,000,000 shares of preferred stock are designated as Series A Perpetual Convertible Preferred Stock, par value $.0001 per share, which we refer to herein as the “Series A Convertible Preferred Stock,” of which 32,929,553 are currently issued and outstanding and another 205,959 are scheduled to be issued on or shortly following April 1, 2012, leaving another 6,864,488 available to be issued.
21
Table of Contents
Our outstanding founder warrants may be exercised in the future, which would result in dilution to our stockholders and increase the number of shares of our Class A common stock eligible for future resale in the public market, which could also have an adverse effect on the market price of our Class A common stock.
At March 16, 2012, there were outstanding founder warrants (i.e., warrants that were sold to a number of our current and former directors and officers through our sponsor, Shermen WSC Holding LLC) to purchase approximately 5.2 million shares of our Class A common stock at $5.00 per share, with a cashless exercise provision. One third of these warrants are scheduled to expire on each of May 24, 2012, 2013, and 2014.
As of the close of business on March 16, 2012, there were approximately 14.2 million shares of our Class A common stock outstanding, at a market price of $5.80 per share.
It is likely that the warrants will be exercised only if the market price of our Class A common stock is above the warrant’s exercise price. To the extent the warrants are exercised, additional shares of our Class A common stock will be issued, which will result in dilution to our stockholders and will increase the number of shares of Class A common stock eligible for resale in the public market. Sales of such shares of Class A common stock in the public market could adversely affect the market price of our Class A common stock.
A substantial number of shares of our Class B common stock were issued to an ED&F Man subsidiary in connection with the 2009 business combination, which shares, if sold to persons who are not affiliated with ED&F Man, will automatically convert into shares of our Class A common stock. Such sales and conversions could adversely affect the price of our Class A common stock.
At the closing of the 2009 business combination, we issued approximately 12.6 million shares, and since then, an additional 520,674 shares, of our Class B common stock to a wholly-owned subsidiary of ED&F Man then named Westway Holdings Corporation and since re-named Agman Louisiana, Inc. (which we refer to herein as “Agman”). These shares remained outstanding as of March 16, 2012.
Subject to conditions set forth in our certificate of incorporation, shares of our Class B common stock, if sold by Agman to a person not affiliated with ED&F Man, will automatically convert into shares of our Class A common stock. In February 2010 we registered shares of our Class A common stock for issuance upon such sales by Agman. Any such sales by Agman may adversely affect the price of our Class A common stock.
A substantial number of shares of our Series A preferred stock were issued to an ED&F Man subsidiary in connection with the 2009 business combination. Any shares of Series A preferred stock that are sold to persons who are not affiliated with ED&F Man will become convertible into shares of Class A common stock. Such sales and conversions may adversely affect the price of our Class A common stock.
At the closing of the 2009 business combination, we issued approximately 30.9 million shares, and since then, approximately an additional 2.0 million shares, of our Series A Convertible Preferred Stock to Agman, a subsidiary of ED&F Man. Although approximately 13.0 million of these shares were delivered to an escrow agent for deposit into an escrow account, to be released to Agman only upon our achievement of certain earnings or share price targets (discussed in the next subsection), the remaining approximate 19.9 million shares of our Series A Convertible Preferred Stock were issued without being subject to the escrow agreement. These shares remained outstanding as of March 16, 2012.
Subject to conditions set forth in our certificate of incorporation, shares of our Series A Convertible Preferred Stock are convertible into shares of our common stock. In particular, shares of our Series A Convertible Preferred Stock held by ED&F Man or its affiliates are convertible by them only into Class B common stock, and then only up to an amount that would result in their holding, collectively, 49.5% of our common stock. On the other hand, shares of our Series A Convertible Preferred Stock, if sold by Agman to a person not affiliated with ED&F Man, will be convertible into shares of our Class A common stock. Any such sales by Agman may adversely affect the price of our Class A common stock.
Agman will not be able to transfer any of its shares of Series A Convertible Preferred Stock held in escrow unless and until such shares are released to Agman upon the achievement by us of the earnings or share price targets (discussed in the next subsection).
22
Table of Contents
A substantial number of shares of our Series A Convertible Preferred Stock and Class A common stock are held in escrow and may be released upon our achievement of certain earnings or share price targets or the occurrence of certain events resulting in a change of control of the Company. The release of shares from escrow may adversely affect the market price of our Class A common stock.
Approximately 13.0 million shares of our Series A Convertible Preferred Stock issued to Agman, a subsidiary of ED&F Man, and 1 million shares of our Class A common stock issued to our sponsor Shermen WSC Holdings LLC are currently being held in escrow, and may be released to their respective owners upon our achievement of certain earnings or share price performance targets or the occurrence of certain events resulting in a change of control of the Company. Placement in escrow does not affect the voting rights or conversion rights of the escrowed shares, but does place restrictions on access to dividends and salability. The release of shares from escrow may adversely affect the market price of our Class A common stock.
Generally, the earnings and share price performance targets and the amounts of shares to be released upon their achievement are as follows:
—if the closing share price of our common stock on any five trading days within a seven trading day consecutive period has exceeded $6.50 per share, or our reported EBITDA (as defined) has exceeded $52 million for any 12 month period, then approximately 4.3 million shares of the Series A Convertible Preferred Stock in escrow and any accrued dividends thereon are to be released to Agman and 958,333 shares of the common stock in escrow and any dividends thereon are to be released to Shermen WSC Holding LLC.
—if the closing share price of our common stock on any five trading days within a seven trading day consecutive period has exceeded $7.00 per share, or our reported EBITDA (as defined) has exceeded $57 million for any 12 month period, then another approximately 4.3 million shares of our Series A Convertible Preferred Stock and any accrued dividends thereon are to be released to Holdings Agman and another 41,667 shares of our common stock and any dividends thereon are to be released to Shermen WSC Holding LLC.
—if the closing share price of our common stock on any five trading days within a seven trading day consecutive period has exceeded $7.50 per share, or our reported EBITDA (as defined) has exceeded $62 million for any 12 month period, then the final approximately 4.3 million shares of our Series A Convertible Preferred Stock and any accrued dividends thereon are to be released to Agman.
For purposes of the earnings targets, “EBITDA” is defined in the stock escrow agreement to mean income (loss) before net interest (defined as the aggregate of interest expense and interest income), income tax, and depreciation and amortization (as further defined by certain accounting principles). For a more detailed description of the earnings and share price performance targets, please see “Certain Relationships and Related Transactions—Related Transactions—Stock Escrow Agreement” in the Prospectus filed by us with the SEC on August 7, 2009.
Because the release of a substantial number of shares held in escrow to the ED&F Man group and Shermen WSC Holding LLC may result from our achievement of certain earnings or share price targets or the occurrence of certain events resulting in a change of control of the Company, certain of our officers and directors associated with the ED&F Man group or Shermen WSC Holding LLC may have the incentive to take actions intended to cause the achievement of these targets or the occurrence of such events, even if such actions would not be in our best interests.
As discussed in more detail in the preceding subsection, approximately 13.0 million shares of our Series A Convertible Preferred Stock issued to Agman, a subsidiary of ED&F Man, and 1 million shares of our common stock issued to our sponsor, Shermen WSC Holding LLC, are being held in escrow, and may be released upon our achievement of certain earnings or share price targets or upon the occurrence of certain events resulting in a change of control of the Company. Because the majority of our directors and some of our officers, including our chief executive officer, have interests in, or are affiliated with, either the ED&F Man group or Shermen WSC Holding LLC, such directors and officers may have the incentive to direct us to take actions intended to cause us to achieve the earnings or share price targets described in the preceding subsection or to undergo a change of control, even if such actions are not in our long-term interest.
We may issue additional equity securities which may dilute your interest.
Pursuant to our 2010 Incentive Compensation Plan, we may grant stock awards to our employees and directors. Moreover, to expand our business, we may offer and issue additional equity or equity-linked securities. Upon such issuances, holders of our securities may experience a dilution in their ownership percentage or in the net book value per share held by them. The number of shares that we may issue for cash without stockholder approval is limited by the rules of the NASDAQ stock exchange; however, there are exceptions which allow companies to issue a limited number of equity securities which could result in some dilution.
23
Table of Contents
The limited liquidity for our Class A common stock may affect your ability to sell your shares at a satisfactory price or in a timely manner.
On December 21, 2009, our Class A common stock became listed on the Nasdaq Capital Market, trading under the symbol “WWAY.” Before that date, our common stock was quoted on the Over-the-Counter Bulletin Board. Notwithstanding the listing of our Class A common stock on Nasdaq, we cannot assure you that a regular trading market for our Class A common stock will develop on Nasdaq or elsewhere or, if developed, that any market will be sustained. As of December 31, 2011, we had approximately 14.0 million shares of our Class A common stock outstanding. The daily trading volume in our Class A common stock during 2011 was usually less than 10,000 shares, although it was occasionally in excess of 100,000 shares. In the absence of adequate public trading activity, you may be unable to liquidate your investment in us at a satisfactory price or in a desired timeframe.
The value of our Class A common stock may be adversely affected by market volatility.
The thin trading market for our Class A common stock may cause its price to be more volatile. Even if a more active trading market develops, the market price of shares of our Class A common stock may be volatile and could be subject to significant fluctuations. In addition, the trading volume in shares of our Class A common stock may fluctuate and cause significant price variations to occur. We cannot assure you that the market price of our shares will not fluctuate or decline in the future.
If our securities are delisted from trading on Nasdaq, our investors’ ability to make transactions in our securities could be limited.
Nasdaq has established certain standards for the continued listing of a security on the Nasdaq Capital Market. The standards for continued listing include, among other things, that the company have at least 300 public holders, that there be at least 500,000 publicly held shares with a market value of at least $1,000,000, that the minimum bid price for the listed securities be at least $1.00 per share, and that the company adhere to various corporate governance requirements. If we cease to meet the standards for continued listing and our securities are delisted from Nasdaq, the price of our securities and ability of holders to sell such securities may be adversely affected.
Our stock ownership is highly concentrated, with ED&F Man and its affiliates owning 48.1% of our outstanding common stock (total of Class A and Class B) as of March 16, 2012. This level of ownership, combined with other rights that were granted to the ED&F Man group at the closing of the 2009 business combination, allow it to exert influence over our affairs.
ED&F Man and its affiliates own 48.1% of our common stock as of March 16, 2012. Subject to the provisions of our certificate of incorporation, for so long as ED&F Man and its affiliates own at least 35% of the outstanding shares of our common stock, the holders of our Class B common stock (currently Agman, a subsidiary of ED&F Man) have the right to elect three of the seven members of our board of directors. This right allows the ED&F Man group to have a significant impact on the determination of our corporate and management policies, including any potential acquisitions, asset sales, and other significant corporate transactions. We entered into a Stockholder’s Agreement, dated May 28, 2009, with Agman, which provides that Agman, so long as it and its affiliated entities collectively own more than a specified percentage of our outstanding common stock (assuming conversion of the Series A Convertible Preferred Stock held by ED&F Man and its affiliates into shares of our common stock), has certain informational rights (if at least 15%) and certain veto rights (if at least 20%) regarding our operations and activities. See “Certain Relationships and Related Transactions—Related Transactions—Stockholder’s Agreement” in the Prospectus filed by the Company with the SEC on August 7, 2009.
Agman has the voting power significantly to influence our policies, business, and affairs and to influence the outcome of any corporate transaction or other matter, including mergers, consolidations, and the sale of all or substantially all of our assets. This voting power may decrease the ability of our other stockholders to influence our affairs, and may have the effect of delaying, deterring, or preventing a change of control that otherwise could result in a premium in the price of our common stock.
The interests of the ED&F Man group may not coincide with the interests of other holders of our common stock. The ED&F Man group is the largest supplier to our liquid feed supplements business and the largest customer of our bulk liquid storage business. While our certificate of incorporation contains provisions on interested transactions designed to minimize conflicts, the ED&F Man group may have a view on our strategies and policies that is different from that of our other stockholders.
24
Table of Contents
Our certificate of incorporation provides that the holders of our Class A common stock are entitled to elect four of the seven members of our board of directors in three classes. This partial classification of our board of directors may make it more difficult to change our management or effect a change in control.
Pursuant to our amended and restated certificate of incorporation, the holders of our Class A common stock are entitled to elect four of the seven members of our board of directors in three classes. Messrs. Francis Jenkins, Jr., Moshenek, and Toffolon were previously elected by the holders of our Class A common stock. The fourth director elected by our Class A common stock resigned in June 2010; after his replacement resigned, James Jenkins was appointed by our Board of Directors in August 2011 to serve the remainder of the term. Mr. Toffolon is a Class I Director and is to serve until our 2013 annual meeting of stockholders. Mr. Moshenek is a Class II Director and is to serve until our 2014 annual meeting of stockholders. Messrs. Francis Jenkins, Jr. and James Jenkins, who are not related, are Class III Directors and are to serve until our 2012 annual meeting of stockholders.
If any person or group other than ED&F Man and its subsidiaries at any time acquires or proposes to acquire or publicly announces its intention to acquire 20% or more of our voting power, the holders of our Class B common stock (who must be ED&F Man and its affiliates) may, by notice to us, elect to cause a change in the way our directors are classified and elected, so that, among other things:
| • | the term of office of each of the three directors elected by the holders of the Class B common stock would upon delivery of that notice become classified along with that of our other directors, with each of the three directors becoming a member of the class of directors which was elected at the last annual meeting of our stockholders prior to the notice; and |
| • | the holders of our Class B common stock and the holders of our Series A Convertible Preferred Stock (voting on an as-converted basis) would, subject to the limits on their combined voting power, vote together with the holders of our Class A common stock and not separately by class or series, in any election of our directors held at any meeting of our stockholders following that notice. |
Our classified board structure and the rights of the holders of our Class B common stock and our Series A Convertible Preferred Stock to change the classification of directors are intended to provide us with a greater likelihood of continuity of board governance and the retention of important management. A classified board of directors may also serve to deter hostile takeovers or proxy contests because a person could only seek to change, in any given year, no more than a portion of the members of the board of directors entitled to be elected by the holders of our Class A common stock. These provisions or measures may also limit the ability of our stockholders to sell their shares at a premium over the then current market price by discouraging a third party from seeking to obtain control of us.
Certain of our directors and executive officers own securities of ED&F Man or one or more of ED&F Man’s affiliates and, thus, may have interests that are different from, or in addition to, the interests of our other stockholders.
James Jenkins, our chief executive officer and a director, Gene McClain, our Terminal Company President, Stephen Boehmer, our Feed Company President, and Phil Howell and Paul Chatterton, two more of our directors, own securities of ED&F Man. The ownership of such securities, in connection with the possibility that the interests of the ED&F Man group may not coincide with the interests of our other stockholders, may provide these directors and executive officers with interests that are different from our non-ED&F Man associated stockholders.
We are a holding company with no business operations of our own and depend on our subsidiaries for cash.
We are a holding company with no material assets other than equity in our wholly-owned subsidiaries. Accordingly, all of our operations are conducted by our wholly-owned subsidiaries and their subsidiaries. We currently expect that the earnings and cash flow of our subsidiaries will primarily be retained and used by them in their operations, including servicing any debt obligations that they have now or may have in the future. Our subsidiaries may not be able to generate sufficient cash flow to distribute funds to us in order to allow us to pay future dividends on, or make any distributions with respect to, our common stock.
Our certificate of incorporation grants the holders of our Series A Convertible Preferred Stock certain rights that could limit our ability to take specified actions, including the payment of dividends to holders of our common stock.
The respective rights, preferences, and limitations of the different classes of our common and preferred stock are governed by our certificate of incorporation. Certain of the rights granted to the holders of our Series A Convertible Preferred Stock could limit our ability to take specified corporate actions. For instance, in the event that holders of shares of Series A Convertible Preferred Stock have not received a quarterly dividend owed on these shares, we would be prohibited from declaring or paying dividends to the holders of our common stock, until such quarterly dividend is paid (or waived).
25
Table of Contents
In addition, while the holders of Series A Convertible Preferred Stock are not generally entitled to vote on matters submitted to a vote of holders of our common stock, holders of our Series A Convertible Preferred Stock, voting as a single and separate class, have the right to approve, among other things, our ability to:
| • | amend, alter, or repeal any provision of our certificate of incorporation or by-laws (by any means, including by merger, consolidation, reclassification or otherwise) so as to, or in a manner that would, adversely affect the preferences, rights, privileges, or powers of the holders of our Series A Convertible Preferred Stock or in a manner inconsistent with the stockholder’s agreement between us and Agman (a subsidiary of ED&F Man); |
| • | reclassify any common stock or any other security junior to our Series A Convertible Preferred Stock into shares or other securities having any preference or priority as to payment of dividends, or the distribution of assets or profits superior to, or on parity with, any such preference or priority of the shares of our Series A Convertible Preferred Stock; |
| • | create, increase the number of authorized shares of or issue, or obligate ourselves to issue, any class of equity securities or series of preferred stock, including any security convertible into or exchangeable or exercisable for any equity security, having any preference or priority superior to or on parity with our Series A Convertible Preferred Stock; |
| • | increase the number of authorized shares of preferred stock or Series A Convertible Preferred Stock; |
| • | conduct an offer to repurchase shares of our common stock; or |
| • | sell, convey, or otherwise dispose of or encumber all, or substantially all, of our assets, or enter into a transaction resulting in our acquisition by another person (except for any such transaction after which our stockholders would own more than half of the voting securities of the surviving entity or its parent and that would not entail a change in our certificate of incorporation or bylaws that would require the consent of the holders of our Series A Convertible Preferred Stock). |
| ITEM 1B. | UNRESOLVED STAFF COMMENTS |
Not Applicable
| ITEM 2. | PROPERTIES |
Bulk Liquid Storage
We benefit from a significant, long-term presence in many major international coastal locations. Typically, our coastal operations utilize storage locations owned by us or land leased to us under long-term arrangements with state or city run port authorities in the United States or by port authorities in Europe.
All of our 25 bulk liquid storage locations are either owner-occupied or operated under lease agreements with tightly mandated maintenance, building, and usage control. The leases normally provide for a fixed annual rent cost, based on quantifiable inflation adjusted arrangements, and significant lease periods, often in excess of ten years. For all properties, we attach a high degree of importance to protecting and maintaining owned or leased public land and the environment.
Our larger bulk liquid storage facility locations ranked by storage capacity at December 31, 2011, whether owned or leased by us, are as follows:
| Bulk Liquid Storage Facility Location |
Storage Capacity (Million Gallons) |
% of Total Storage Capacity (1) |
Owned or Leased | |||
| Houston 1, TX |
66 | 18% | Owned (80%) and leased (20%) | |||
| Houston 2, TX |
38 | 11% | Owned (19%) and leased (81%) | |||
| Cincinnati, OH |
37 | 10% | Owned (100%) | |||
| Amsterdam, Netherlands |
29 | 8% | Leased | |||
| Philadelphia, PA |
20 | 5% | Leased | |||
| Baltimore, MD |
19 | 5% | Leased | |||
| Port Allen, LA |
19 | 5% | Leased | |||
| Hamilton, Canada |
16 | 4% | Leased | |||
| Jacksonville, FL |
15 | 4% | Leased |
| (1) | Capacity details are expressed as a function of the 363 million total gallons of storage currently available to us. |
26
Table of Contents
| • | Houston 1, TX. The Houston 1 facility is our largest terminal location globally, having approximately 66 million gallons of capacity. This facility provides deep water access through two docks on the Houston ship channel and uses two tracts of land leased from the Port of Houston. Historically, this terminal has represented a primary molasses hub, and now serves a broad range of customers and industries. Houston as a whole is considered to be the single most concentrated bulk liquid storage location in the United States. |
| • | Houston 2, TX. The Houston 2 facility, which is located two miles from the Houston 1 facility, is a two berth, deep water terminal also located on the Houston ship channel. Its storage capacity comprises approximately 38 million gallons. The facility serves the same markets as the Houston 1 facility. |
| • | Cincinnati, OH. The Cincinnati facility is located immediately west of downtown Cincinnati and has approximately 37 million gallons of capacity. The facility is suitably located on the Ohio River and accommodates barge, rail and truck transportation modes. This convenient location of the terminal allows for easy access to the Ohio Valley and beyond. Of the approximate 28 acres of land owned by us, roughly 8 acres are available for additional terminal expansion. |
| • | Amsterdam, Netherlands. The Amsterdam facility is our largest single storage capacity outside of North America and is considered by us to be one of our significant strategic investments. Due to its location within the key shipping area of Amsterdam, Antwerp, and Rotterdam, historic demand for storage has usually been high. The facility currently provides capacity of approximately 29 million gallons. |
| • | Philadelphia, PA. The Philadelphia facility comprises a 10-acre deep water site on the Delaware River, and provides approximately 20 million gallons of storage serving regional agriculture and oil refining markets. Other specialty products, including plasticizers, non-petroleum oils, and construction products are also stored in Philadelphia. |
| • | Baltimore, MD. The Baltimore facility comprises 7 acres of deep water storage. The facility has storage capacity of approximately 19 million gallons and serves large regional agriculture, construction materials, lubrication oils, and specialty chemicals markets requiring storage for export and domestic use. |
| • | Port Allen, LA. The Port Allen facility comprises an approximately 19 million gallon deep water terminal located on the Mississippi River. The facility is one of our largest molasses terminals and serves the Louisiana sugar industry as well as chemical and now petroleum oil markets. |
| • | Hamilton, Canada. The Hamilton facility provides approximately 16 million gallons of capacity on a 7 acre site on the Great Lakes. The facility serves a large local tallow production industry, as well as typical agricultural markets. |
| • | Jacksonville, FL. The Jacksonville facility provides us with approximately 15 million gallons of bulk liquid storage capacity. The facility has traditionally served local agricultural markets and the pulp and paper industry. |
The vast majority of our tanks are constructed from carbon steel and incorporate a variety of internal lining systems that are used to protect the tanks and to preserve the quality of the stored products. We store a considerable number of products requiring the application of heat to preserve the product characteristics. We use a combination of internal steam coils, external heat exchangers, and hot water circulating systems when storing heat-sensitive products. Facility upgrades required to meet the needs of certain stored chemicals are performed as necessary and include leak prevention, automated gauging and loading, vapor control, and fire prevention. We believe that our facilities are well maintained, suitable for our business, and occupy sufficient space to meet our operating needs.
We are a Responsible Care partner company that is committed to safeguarding the health, safety, and security of our employees, customers, and neighbors. We focus on protecting the environment by minimizing the impact of our bulk liquid storage and distribution operations. We are committed to the Responsible Care Guiding Principles and to the implementation of the Responsible Care Management System to facilitate continual improvement of our health, safety, environment, and security performance.
We believe that we have satisfactory title to the properties we own and use in our businesses, subject to liens for current taxes, liens incident to minor encumbrances, and easements and restrictions, which do not materially detract from the value of such property or the interests in those properties or the use of such properties in our businesses. In compliance with a credit agreement entered into by us in November 2009, we have granted first priority mortgage liens on the fee or leasehold interests, as applicable, in four terminal facilities (two in Houston, Texas, one in Cincinnati, Ohio, and one in Grays Harbor, Washington).
27
Table of Contents
Our bulk liquid storage capacity utilization percentage was approximately 91% at December 31, 2011, which has decreased from our December 31, 2010 capacity utilization of 96% in part due to 10.5 million gallons, or 2.9% of total capacity temporarily taken out of service for normal maintenance along with timing differences as contracts turn over. At December 31, 2010, only 3.4 million gallons, or 1.0% of total capacity, were temporarily taken out of service for normal maintenance.
Liquid Feed Supplements
Our 35 liquid feed facilities are strategically located throughout the continental United States, western Canada, and eastern Australia, allowing us to provide nutritional livestock supplements to the majority of the North American livestock marketplace as well as eastern Australia.
Our liquid feed supplements business is built around a number of geographical markets categorized by the livestock operations and products that are typical to each. The functionality of each facility is dependent on the demographics of the livestock industry in its geographic area. Plants supplying free choice protein supplements (liquid or block) are located in areas of large free-grazing ranches or smaller hobby farm/ranch operations. Ten of our manufacturing facilities produce suspension supplements, which are the most complex liquid feed supplements, and are located in the densely-confined livestock feeding areas, such as the northern Texas panhandle and north-central California. Other products, such as fortified molasses for the dry feed milling industry or general-purpose molasses blends, are generally manufactured at our plant locations.
We own 15 of our operating liquid facilities and lease the remaining facilities. Typically, our leases of liquid feed supplement facilities are from major port authorities and railroad companies of the United States, although a small number are from private individuals or leasing companies (such as office buildings and toll mill sites). The majority of our leases are more than 10 years in length with a small number that are only one year in duration but subject to normal annual rollover. Our leases from port authorities typically contain a ten year primary period, normally with two five-year renewals at our option and exercise of a renewal requires formal notification from us. All our leases from railroad companies are currently annual leases with evergreen (automatic renewal) provisions incorporating annual inflation increases. All of our leases include provisions for removing equipment and returning the site to the conditions prior to execution of the original lease, together with provisions for regular testing and remediation of soil quality. We believe that our facilities are well maintained, suitable for our business, and occupy sufficient space to meet our operating needs.
Our larger liquid feed supplements manufacturing facilities based on their official name plate capacity, whether owned or leased by us, are as follows:
| Liquid Feed Supplement Facility Location |
Owned/ Leased |
Products Manufactured |
Name Plate Capacity (tons/year) |
% of total |
||||||||||||
| Stockton, CA |
Owned | LS, S | 320,000 | 11 | % | |||||||||||
| Clovis, NM |
Owned | Other | 320,000 | 11 | % | |||||||||||
| Hereford, TX |
Owned | LS, S | 200,000 | 7 | % | |||||||||||
| Dimmitt, TX |
Owned | LS, S | 175,000 | 6 | % | |||||||||||
| Houston, TX |
Owned | LS | 175,000 | 6 | % | |||||||||||
| Baltimore, MD |
Leased | LS | 175,000 | 6 | % | |||||||||||
LS—Liquid Feed Supplements including liquid protein supplements, mill products, and blends (molasses plus one or two other ingredients)
S—Suspensions
Other—Dried molasses, blocks, and whey
Total annual production was approximately 1.8 million tons, each ton comprising 2000 lbs. in weight.
Our liquid feed supplements manufacturing facilities can be classified into three broad groupings: liquid feed supplements plants, suspension plants, and other plants. Common infrastructure at all sites includes relatively large, steel storage tanks that are typically designed to store viscous liquid products that are heated and have an air agitation system. Typical customer purchases utilize truck transportation of approximately 24 tons each and require a finished feed tank capacity of approximately 5,000-6,000 gallons. We have systems in place to manage “traceability” of all finished product shipments for the benefit of our customers.
Liquid Feed Supplement Plants. Liquid supplement plants typically manufacture liquid protein supplements, feed mill products, or simple blends. Twenty-four of our plants have the ability to manufacture liquid protein supplements.
28
Table of Contents
Suspension Plants. Suspension plants require specific dry ingredient storage infrastructure and mixing systems. Suspension formulations normally contain up to 30% insoluble feed ingredients, such as calcium carbonate, potassium chloride, and protein meals. These dry feed ingredients are finely ground and suspended in various liquid ingredients. Ten of our plants have the ability to manufacture suspension products.
Other Plants. Other plants consist of facilities that manufacture dried molasses, blocks, and whey. Five of our plants fall into this grouping, as well as one joint venture site.
We currently have obtained FCI (Facility Certification Institute) certification for all of our U.S. owned and leased manufacturing sites.
We believe that we have satisfactory title to the properties we own and use in our businesses, subject to liens for current taxes, liens incident to minor encumbrances, and easements and restrictions, which do not materially detract from the value of such property or the interests in those properties or the use of such properties in our businesses. In compliance with a credit agreement entered into by us in November 2009, we have granted first priority mortgage liens on the fee or leasehold interests, as applicable, in two feed facilities (one in Houston, Texas, and one in Cincinnati, Ohio).
| ITEM 3. | LEGAL PROCEEDINGS |
There are no pending legal proceedings to which we are a party, or of which any of our property is the subject, or known by us to be contemplated by governmental authorities, that are material to us, our business, or our financial condition. Moreover, we are not a party to any administrative or judicial proceeding arising under environmental laws or regulations to which a governmental authority is a party, nor are we required to pay any of the penalties set forth in Section 6707A(e)(2) of the Internal Revenue Code.
| ITEM 4. | MINE SAFETY DISCLOSURES |
Not Applicable
PART II
| ITEM 5. | MARKET FOR REGISTRANT’S COMMON EQUITY, RELATED STOCKHOLDER MATTERS AND ISSUER REPURCHASES OF EQUITY SECURITIES |
Market Information
The shares of our Class A common stock are currently listed for trading on the NASDAQ stock market under the symbol WWAY. Our Class A common stock is contained in the Russell Microcap Index.
Our publicly-traded warrants (WWAYW) and units (WWAYU) ceased trading on NASDAQ following the expiration of the warrants on May 24, 2011. Each warrant entitled the holder to purchase from us one share of our Class A common stock at an exercise price of $5.00. Each unit consisted of one share of our Class A common stock and two warrants.
The public trading market for our Class A common stock is somewhat volatile and reflects relatively thin trading at this time. Our Class B common stock, Series A Convertible Preferred stock, and Founder Warrants are not publicly traded.
29
Table of Contents
The following table sets forth the quarterly high and low sales prices of our Class A common stock, warrants, and units as reported on the NASDAQ stock market for the period from January 1, 2010 through December 31, 2011:
| Class A Common Stock | Warrants | Units | Dividiends Declared | |||||||||||||||||||||||||
| High | Low | High | Low | High | Low | |||||||||||||||||||||||
| 2010 First Quarter |
5.20 | 4.02 | 0.33 | 0.12 | 6.01 | 6.01 | — | |||||||||||||||||||||
| 2010 Second Quarter |
4.51 | 3.48 | 0.29 | 0.10 | 6.01 | 6.01 | — | |||||||||||||||||||||
| 2010 Third Quarter |
4.14 | 2.80 | 0.18 | 0.07 | 6.01 | 6.01 | — | |||||||||||||||||||||
| 2010 Fourth Quarter |
4.31 | 3.20 | 0.18 | 0.09 | 6.01 | 6.01 | — | |||||||||||||||||||||
| 2011 First Quarter |
4.45 | 3.70 | 0.20 | 0.01 | 55.07 | 3.47 | — | |||||||||||||||||||||
| 2011 Second Quarter |
4.85 | 4.02 | 0.07 | 0.00 | 4.60 | 4.00 | — | |||||||||||||||||||||
| 2011 Third Quarter (1,2) |
4.99 | 4.16 | — | — | — | — | 0.04 | |||||||||||||||||||||
| 2011 Fourth Quarter (1,2) |
6.60 | 3.78 | — | — | — | — | 0.04 | |||||||||||||||||||||
| (1) | Our warrants (WWAYW) and units (WWAYU) ceased trading on NASDAQ following the expiration of the warrants on May 24, 2011. |
| (2) | We initiated quarterly dividend payments to our shareholders in the third quarter of 2011 and we have continued payments in each subsequent quarter. Future dividend payments will be at the discretion of our Board, after considering various factors, including our earnings, capital requirements, financial position, contractual restrictions and other relevant business considerations, and subject to our compliance with, or waiver by Agman of, certain provisions in our charter. We cannot assure shareholders or potential investors that dividends will be declared or paid any time in the future. |
Holders
As of March 16, 2012, there were approximately 939 holders of record of our Class A common stock. There were also 1 holder of record of our Class B common stock, 1 holder of record of our Series A preferred stock, and 2 holders of record of our Founder Warrants. It is possible that the actual number of holders of our Class A common stock is substantially different than indicated because of such class A common stock being held beneficially.
Dividends
We initiated a quarterly dividend of $0.04 per share of common stock to our Common Class A, Common Class B, and Series A Convertible Preferred shareholders in the third quarter of 2011, payable in cash or common stock at the election of the stockholders. We have continued these dividends in each subsequent quarter.
There are restrictions that currently materially limit our ability to pay cash dividends on our common stock and which we believe are likely to limit the future payment of dividends on our common stock. These restrictions are briefly described below.
Our credit agreement with the bank syndicate limits the declaration and payment of dividends on our common stock to no more than 50% of the preceding year’s Net Income (as defined in our amended credit facility).
Our certificate of incorporation provides that no cash dividends may be declared or paid on any share of our Class A common stock or Class B common stock unless a like dividend is declared or paid on shares of both classes of common stock simultaneously.
Our certificate of incorporation further provides that our Series A Convertible Preferred stock shall rank senior and prior to our common stock with respect to the payment of cash dividends in the amount of $0.0344 per share of Series A Convertible Preferred stock (referred to as “base dividends”) that accrue on a quarterly basis, cumulatively, until May 28, 2016, whether or not earned or declared, and whether or not there are any profits, surplus, or other of our funds legally available for the payment of dividends. Our certificate of incorporation further provides that we may pay or set aside funds for the payment of a cash dividend in respect of our common stock if, and only if, (i) all accrued and unpaid base dividends on the Series A Convertible Preferred stock have been declared and paid for all prior Series A dividend periods and (ii) our board of directors has declared, and we pay, contemporaneously with the payment of such dividend, the accrued, but unpaid, portion of each base dividend payable to the holders of Series A Convertible Preferred stock with respect to the Series A dividend period in which such payment of a cash dividend in respect of our common stock would occur. Pursuant to a series
30
Table of Contents
of waiver agreements between the Company and Agman Louisiana Inc., a subsidiary of ED&F Man that holds all of the shares of our Series A Convertible Preferred Stock, Agman agreed to accept, in lieu and satisfaction of the entire $12.4 million of dividends accruing but unpaid on Agman’s shares of Series A Convertible Preferred Stock from their original issuance on May 28, 2009 through March 31, 2012, a total of 2,248,682 additional shares of our Series A Convertible Preferred Stock.
Our certificate of incorporation further provides that no cash dividend may be declared, set aside, or paid on our common stock for so long as any shares of our Series A Convertible Preferred stock are outstanding, unless we have obtained the written consent or affirmative vote of holders of at least a majority of the voting power of the outstanding shares of Series A Convertible Preferred stock, voting separately as a single class. Moreover, the holders of shares of Series A Convertible Preferred Stock are entitled to participate equally and ratably with the holders of shares of common stock in all cash dividends paid on the shares of common stock, as if immediately prior to each dividend record date for the common stock, the shares of Series A Convertible Preferred Stock then outstanding were converted into shares of common stock.
Repurchases of Equity Securities
The table below provides information on purchases made by the Company or any affiliated purchaser thereof during the indicated months of shares of the Company’s equity securities that were registered pursuant to section 12 of the Exchange Act.
| Period |
(a) Total number of shares or other units purchased |
(b) Average price paid per share or unit ($) |
(c) Total number of shares or units purchased as part of publicly announced plans or programs |
(d) Maximum number (or approximate dollar value) of shares or units that may yet be purchased under the plans or programs |
||||||||||||
| 10-1-11 to 10-30-11 (1) |
11,700 | 4.11 | 11,700 | 171,426 | ||||||||||||
|
(2) |
23,144 | 4.00 | — | — | ||||||||||||
| 11-1-11 to 11-30-11 |
— | — | — | — | ||||||||||||
| 12-1-11 to 12-31-11 (3) |
1,199 | 5.60 | — | — | ||||||||||||
| (1) | On December 15, 2010, we announced that our Board of Directors approved a stock repurchase program for our repurchase of up to 500,000 shares of our Class A common stock. The indicated shares were repurchased under the program during the period indicated. The program was suspended as of October 21, 2011. |
| (2) | On October 18, 2011 Thomas A. Masilla Jr. directed the Company to withhold 23,144 shares to satisfy the tax withholding on newly vested shares. |
| (3) | On December 31, 2011 Gene McClain directed the Company to withhold 1,199 shares to satisfy the tax withholding on newly vested shares. |
| ITEM 6. | SELECTED FINANCIAL DATA |
Not Applicable
31
Table of Contents
| ITEM 7. | MANAGEMENT DISCUSSION AND ANALYSIS OF FINANCIAL CONDITION AND RESULTS OF OPERATIONS |
In Management’s Discussion and Analysis of Financial Condition and Results of Operations, the “Company,” “we,” “us” and “our” refer to Westway Group Inc. and its consolidated subsidiaries. The following discussion should be read in conjunction with the consolidated financial statements and notes thereto included in Item 8 of this Form 10-K. The results of operations reported and summarized below are not necessarily indicative of future operating results (refer to “Forward Looking Statements” for further discussion).
Overview
Westway Group, Inc., together with its wholly-owned subsidiaries (the “Company” or “we” or “us” or “our”) is a global provider of bulk liquid storage and related value-added services and the largest manufacturer and distributor of liquid feed supplements for the livestock industry in North America. Our Class A common stock is currently traded on the NASDAQ stock market under the symbol “WWAY”.
Lines of Business, Locations of Operations, and Principal Products and Services
We currently own and/or operate an extensive global network of 25 operating bulk liquid storage facilities, providing approximately 363 million gallons of total bulk liquid storage capacity, and 35 operating liquid feed supplement facilities, selling approximately 1.8 million tons of liquid feed supplements annually.
Our bulk liquid storage business is a global business with infrastructure that includes a network of 25 terminals offering storage to manufacturers and consumers of agricultural and industrial liquids, located at key port and terminal locations throughout North America, in Western Europe, and in Asia. We coordinate closely with our customers in designing and adapting the customized product handling systems required for their specific products. Our value-added services are customer specific and also include transloading of bulk liquids and acting as regional distribution centers for our customers. A key strategic aspect of our storage business is the fact that it has maintained a long-term presence in a number of highly critical, deep water ports from which it can offer its international customers access to multiple storage locations combined with the highest level of service in these important markets.
Our liquid feed supplements business produces liquid animal feed supplements that are sold to distributors, dealers, and directly to end users, such as “ranchers,” and feed manufacturers, primarily supplying the beef and dairy livestock industries. By using formulation processes that are tailored specifically to the needs of our customers, we blend molasses and essential nutrients to form feed rations that help livestock to reach their genetic potential. Our 35 manufacturing and distribution locations allow us to provide nutritional liquid feed supplements to the majority of the U.S. and Canadian livestock market. In addition, 7 of our facilities are positioned at deep water port locations, allowing for the more efficient receipt of imported ingredients such as molasses and condensed molasses solubles, and therefore provide a competitive advantage to us since a substantial portion of the molasses consumed for livestock supplements in the U.S. is imported. The balance of our manufacturing locations are either strategically located on navigable inland river systems or have direct railroad access. We believe that our liquid feed supplements business is the leading North American manufacturer of liquid animal feed supplements and the only such supplier with a true national footprint in the U.S.
Our Corporate segment includes unallocated general and administrative expenses including, in part, executive, legal, finance, information technology, human resources, and health, safety, environmental, and quality expenses, as well as interest expenses related to corporate debt.
The Company is headquartered in New Orleans, LA and has 496 employees worldwide as of March 16, 2012, of which 495 are full-time employees.
2011 Significant Achievements
| • | Bulk Liquid Storage Projects—We completed multiple expansion projects during 2011, which included projects at our Houston 1, TX terminal adding 8.0 million gallons of storage capacity and two new dock lines, our Houston 2, TX terminal adding 2.5 million gallons of storage capacity, and our Amsterdam, Netherlands terminal adding 2.3 million gallons of storage capacity. All of the completed tanks at these expansion projects have been subsequently leased. The remaining 1.9 million gallons of storage capacity under construction at our Amsterdam, Netherlands terminal at the end of 2011 were completed in the first quarter of 2012. Additionally, we began several new construction projects, including capacity expansion at our Houston 1 terminal to add 6.0 million gallons of storage capacity and three new docks lines, as well as the associated inbound and outbound marine and land traffic infrastructure. We also began construction at our Houston 2 terminal to add 2.5 million gallons of storage capacity. |
32
Table of Contents
| • | Quarterly Dividend—The Board of Directors declared our first quarterly dividend in August 2011 (and another subsequently in November 2011 and February 2012) of $0.04 per share of common stock, payable in cash or common stock to holders of our common stock and participating preferred stock. This dividend is consistent with our goal of building shareholder value, both in terms of our stock price and liquidity in the trading volume of our stock. By this means, we are providing a reward to our current shareholder base and are working to broaden our existing shareholder base to include more investors that focus on income, as well as growth, in their investment decisions. |
| • | Expanded Credit Facility—In July 2011, the Company and its bank syndicate amended certain key terms of the Company’s existing $200 million credit facility. The modifications included, among other items, the extension of the maturity date to July 6, 2015, the reduction of the interest rate and commitment fee payable, the relaxation of certain key financial covenants, the ability to pay dividends, and the addition of a $50 million accordion feature to the current facility. |
| • | Liquid Feed Supplement Achievements—In 2011, our liquid feed supplement business had an exceptional year, with a three-year high in total volume sold of 1.8 million tons, dollar gross profit of $50.8 million, and operating income of $13.4 million. We expanded our product offering to include low moisture tubs and believe this product line is complementary to our existing poured tub product line. Our new low moisture tub product line was introduced in December and will begin contributing to revenue and volume in 2012. Additionally, we completed research and commenced sales on a new environmentally-friendly “Eco Tub” container in the 4th quarter of 2011. |
| • | Safety Awards—We received three safety awards during 2011. Our Terminal Company received the Responsible Care Partner of the Year Award from the American Chemistry Council, which award is presented annually to three partner companies for their record of performance and dedication to safety. Our Terminal Company also received the Safety Improvement Award from the International Liquid Terminals Association (ILTA), which reflects the commitment, dedication, and collaborative effort of our employees with respect to the continual improvement of our health, safety, environmental and security performance. In addition, the National Safety Council recognized eleven of our facilities with its prestigious Safety Leadership Award. This award is presented to a facility that has achieved five consecutive years without a fatality or occupational injuries that result in days away from work. |
For more detailed information on 2011 events, please see our Recent Developments section in Item 1.
Commercial Arrangements with the ED&F Man Group
The ED&F Man group is our largest stockholder, owning 100% of our outstanding Class B common stock, which constitutes 48.1% of all of our outstanding common stock, and 100% of our outstanding Series A Convertible Preferred Stock, a portion of which was deposited into escrow for release upon the achievement of certain earnings or stock price targets.
We have a commercial relationship with the ED&F Man group which centers on the following agreements.
Bulk Liquid Storage Arrangements
We and the ED&F Man group have a long-term storage agreement that addresses our supplier status. The initial term of the agreement runs until May 28, 2029, after which the agreement provides for automatic renewals for successive ten year periods, unless either party gives at least three years notice of non-renewal. In 2011, our bulk liquid storage net revenue earned from the ED&F Man group was $15.0 million, representing 17% of our total bulk liquid storage revenue. Our long-term relationship as a supplier of bulk liquid storage to the ED&F Man group’s various trading divisions has contributed to our performance. We believe that our relationship with the ED&F Man group provides us with global expansion opportunities. As a supplier, we expect to capitalize on the relationship, which should provide new business to both our existing and new locations.
Molasses Supply Arrangements
Molasses is an important ingredient utilized in our liquid feed supplement formulations. We and the ED&F Man group have a long-term molasses supply agreement, pursuant to which the ED&F Man group is our primary supplier of cane molasses. The initial term of the agreement runs until May 28, 2019, after which the agreement provides for automatic renewals for successive one-year periods unless either party gives at least one year’s notice of non-renewal. Effective
33
Table of Contents
October 2011, an addendum to this molasses supply agreement was renewed, with a one-year term that slightly modifies the pricing mechanism. In 2011, our cost of purchases from the ED&F Man group was $87.6 million, representing 33% of total liquid feed supplements cost of sales.
Insurance Participation Agreement
We have a participation agreement with a captive insurance company owned by the ED&F Man group. The captive underwrites the self-insured portion of certain risks insured by us through the captive and charges a premium for the first layer of claims exposure. Under this agreement, all of our transactions are portioned into a separate operation cell from the ED&F Man group’s business.
Treasury Management Services
In connection with transitional treasury management services provided by ED&F Man Treasury Management plc (“ED&F Man Treasury”), an affiliate of the ED&F Man group, our international subsidiaries had cash on deposit with ED&F Man Treasury, bearing interest at the one-month LIBOR rate, in 2010 and the first half of 2011. This agreement was terminated during the first half of 2011 after transitioning these treasury management services to JPMorgan Chase Bank.
Strategic Review
On December 15, 2011, we announced the receipt of an unsolicited preliminary offer from ED&F Man, our largest stockholder, to acquire our animal feed supplements business and certain non-core bulk liquid storage terminals. Our Board of Directors has initiated a process to explore strategic alternatives for the company as a whole, including alternatives for the bulk liquid storage business. Our Board of Directors formed a Special Committee of independent directors to direct the strategic review process. The special committee has retained Evercore Partners as financial advisor to assist it during this process.
On December 21, 2011, we announced the receipt of an unsolicited proposal from an infrastructure investment fund to acquire us for $6.00 per common share, $6.00 for each outstanding Series A Convertible Preferred share and $1.00 for each outstanding Founder Warrant. The proposal was contingent upon the consummation of the proposed transaction to sell our animal feed supplements business and certain non-core bulk liquid storage terminals to ED&F Man. The special committee reviewed the unsolicited proposal with Evercore Partners and determined that it substantially undervalued the bulk liquid storage business and did not provide any basis to begin discussions or negotiations.
We have not set a timetable for evaluation of ED&F Man’s proposal or completion of the strategic review process. There can be no assurance that any definitive offer will be made, that any agreement will be executed or that any transactions will be approved or consummated. See the “Risk Factors” section, item 1A of this Form 10-K for more details.
Critical Accounting Estimates
The preparation of financial statements in accordance with U.S. generally accepted accounting principles (“U.S. GAAP”) requires management to make assumptions, judgments, and other estimates that affect the amounts reported in the financial statements. In any given period, the actual facts and results could differ materially from the estimates used in preparing financial statements.
A detailed summary of our significant accounting policies appears in Note 3 to our consolidated financial statements included in this Form 10-K. Certain of these policies involve accounting estimates that we deem critical due to the subjectivity, complexity, or difficulty of the assumptions, judgments, or other estimates required to be made; the degree of uncertainty at the time the assumption, judgment, or other estimate is made; and the likelihood that materially different amounts could be reported using different assumptions, judgments, or other estimates.
Management periodically discusses the development, selection, application, and disclosure of our key accounting policies, as well as the critical accounting estimates, with the Audit Committee of the Board of Directors. The accounting estimates we currently consider to be critical are as follows:
Acquisitions
Our acquisitions of businesses that result in our control of these businesses are accounted for under the purchase method of accounting. The amounts assigned to the identifiable assets acquired and liabilities assumed in connection with acquisitions are based on estimated fair values as of the date of the acquisition, with the remainder, if any, recorded as goodwill. The fair values are determined by our management, taking into consideration information supplied by the
34
Table of Contents
management of the acquired business and other relevant information. Such information includes valuations supplied by independent appraisal for significant business combinations. The valuations are based on one or more of three methods: future cash flow projections for the acquired assets, discounted to present value (income approach), the price at which comparable assets are purchased under similar circumstances (market approach), and an estimate of the current cost to purchase or replace the asset (cost approach). The determination of fair value requires significant judgment by management.
Goodwill and Indefinite-Lived Intangible Assets
We perform an impairment review of goodwill and certain indefinite lived intangible assets at least annually and also whenever certain events or changes in circumstances indicate that the carrying value of the goodwill or intangible asset is greater than its fair value.
Factors we consider important that could trigger an interim impairment review include significant underperformance relative to historical or projected future operating results, identification of other impaired assets within a reporting unit, the disposition of a significant portion of a reporting unit, significant adverse changes in business climate or regulations, significant changes in senior management, significant changes in the manner of our use of assets or the strategy for our overall business, significant negative industry or economic trends, a significant decline in our stock price for a sustained period, a decline in our credit rating, or a reduction of our market capitalization relative to net book value. Determining whether a triggering event has occurred requires management to make significant judgments.
Our annual impairment review is based on a combination of the income approach, which estimates the fair value of our reporting units based on projected discounted cash flows, and the market approach, which estimates the fair value of our reporting units based on comparable market multiples. The determination of the fair value of the reporting units requires us to make significant estimates and assumptions. These estimates and assumptions primarily include but are not limited, in the case of the market approach, to the selection of appropriate peer group companies and control premiums appropriate for acquisitions in the industries in which we compete, and in the case of the income approach, to the selection of the discount rate, terminal growth rates, forecasts of revenue and expense growth rates, changes in working capital, depreciation and amortization, and capital expenditures. Due to the inherent uncertainty involved in making our estimates, actual financial results could differ from those estimates. Changes in assumptions concerning future financial results or other underlying assumptions could have a significant impact on either the fair value of a reporting unit or the amount of any possible goodwill impairment charge.
For purposes of goodwill assignment and subsequent review, it is necessary to determine appropriate reporting units for the Company. The determination of reporting units is based on whether discrete financial information is available which management regularly reviews, along with aggregation criteria based on geographic location, sizes, and economic characteristics. We determined that it was appropriate to use 21 reporting units, consisting of one reporting unit for our liquid feed supplements business and 20 reporting units related to our bulk liquid storage sites. Our five bulk liquid storage operating facilities located in the United Kingdom have been grouped into a single reporting unit due to their similar location, size, and economic characteristics. Goodwill was originally allocated between our two businesses acquired, bulk liquid storage and liquid feed supplements, based on fair value concepts including a combination of income, market, and cost approaches. With respect to our bulk liquid storage business, we further allocated the goodwill to the United Kingdom reporting unit and the other 19 bulk liquid storage reporting units based on historical profitability percentages.
As of October 1, 2011, our 21 reporting units had an aggregate goodwill balance of $88.7 million prior to our annual impairment assessment. We performed our annual goodwill impairment assessment as of October 1, 2011 and compared the fair value of each reporting unit using equal weighting to the income and market approaches to its carrying value as of October 1, 2011. This indicated that out of the 21 reporting units, three reporting units, our Gdynia, Poland, our Esbjerg, Denmark and our Riverdale, IL terminals, had a carrying value which exceeded their fair value. We then determined the implied fair value of goodwill of each of these three reporting units by comparing the fair value of the reporting unit to the aggregate fair value of all the assets and liabilities of the reporting unit. In each case, we determined that the implied fair value of goodwill of each of these three reporting units was zero. We therefore recorded a non-cash impairment charge to our goodwill of approximately $3.1 million, which was the entire amount of goodwill that had been allocated to these three reporting units. We recorded this impairment as a separate line item in total operating expenses on the Consolidated Statements of Operations.
The impairment of the $1.0 million goodwill at our Gdynia, Poland reporting unit, which consists of 10 storage tanks with an aggregate capacity of 7.9 million gallons, was primarily due to a continued decline in the Polish economy and the consequent reductions in our future revenue projections for the facility. Over the last year, a number of companies engaged in the production and movement of liquids used as feed stocks for other products have opted to use transloading to rail for immediate shipment to fill just-in-time requirements of end users. As such, utilization at this location has declined and customers have been reluctant in the near term to sign long term storage leases until general economic conditions improve.
35
Table of Contents
The impairment of the $1.2 million goodwill at our Esbjerg, Denmark reporting unit, which consists of 12 storage tanks with an aggregate capacity of 4.8 million gallons, was primarily due to reductions in our future revenue projections for the facility as a result of local market conditions and changes to assumptions regarding future rates and product mixes.
The impairment of the $900,000 goodwill at our Riverdale, IL reporting unit, which consists of 16 storage tanks with an aggregate capacity of 5.7 million gallons, was primarily due to local competitive market conditions and the consequent reductions in future revenue projections for the facility as a result of changes to assumptions regarding rates and utilization.
As of October 1, 2011, the fair value of our other 18 reporting units exceeded their respective carrying values. The fair value of our liquid feed supplements segment reporting unit exceeded its carrying value with coverage of 110% (coverage of 100% equals 1 to 1). The fair values of two of our bulk liquid storage reporting units exceeded their respective carrying values with coverage less than 110% and the average amount of goodwill allocated to each was $4.1 million. All other reporting units had fair values that exceeded their respective carrying values with coverages greater than 110%. As of October 1, 2011, the amount of goodwill allocated to our liquid feed supplements reporting unit was $21.4 million and the amount of goodwill allocated to our bulk liquid storage segment business as a whole, after applying the impairment charge, was $64.7 million. Key assumptions that drive the fair value of our reporting units include projected revenue and expense growth rates, discount rates, and weighted average cost of capital. Potential events and circumstances that could negatively affect these assumptions, and adversely affect the fair values, are discussed at length in the “Risk Factors” section, Item 1A of this Form 10-K.
Property, Plant & Equipment
When purchased, the values of our property, plant & equipment are recorded initially at historical cost. However, when an item is acquired as part of the acquisition of a business, as has been the case for most of our property, plant & equipment, its value is initially recorded according to its estimated fair value. This value reflects management’s assumptions about the assumptions that would be made by market participants if they were to buy or sell each identified asset on an individual basis. Once an item is initially recorded, however purchased, it is later depreciated using the straight-line method over its estimated useful life, subject to adjustments due to economic or functional obsolescence.
The major portion of our property, plant & equipment consists of storage tanks that were acquired through acquisitions. We estimated the fair value of each such tank by estimating the cost to construct or buy a similar asset of equivalent utility at current prices. In order to establish a depreciation schedule, we also estimated the remaining useful lives of the storage tanks. The estimation of useful lives of such length is inherently uncertain, difficult, and imprecise. Factors such as changes in competition, regulation, or environmental matters may cause us to change our estimates. Changes in the estimated useful lives of the property, plant and equipment could have a material adverse effect on our results of operations.
U.S. GAAP requires write-downs to be recorded on property, plant & equipment used in operations when indicators of impairment are present and the undiscounted cash flows estimated to be generated by those assets are less than the assets’ carrying amount. In assessing potential impairment, we consider the operating performance and projected undiscounted cash flows of the relevant assets. If the projected undiscounted cash flows are estimated to be less than the assets’ carrying value, we have to record impairment charges equal to the excess of the carrying value over the fair value of the assets. Our assessment of property, plant & equipment impairment did not result in any write-downs.
Income Taxes
We record deferred tax assets or liabilities based on differences between the financial reporting and tax basis of assets and liabilities using currently enacted rates and laws that we assume will be in effect when we expect the differences to reverse in the future. Due to changing tax laws and different rates of tax in the many US states and foreign jurisdictions where we operate, significant judgment is required to estimate the effective tax rate expected to apply to these differences.
Valuation allowances are established, when necessary, to reduce deferred tax assets to the amount expected to be realized. We consider many factors when assessing the likelihood of future realization, including our recent cumulative earnings experience by taxing jurisdiction, expectations of future taxable income, the carryforward periods available for tax reporting purposes and other relevant factors.
We comply with accounting standards that prescribe a recognition threshold and a measurement attribute for the financial statement recognition and measurement of tax positions taken or expected to be taken in a tax return. For those benefits to be recognized, a tax position must be more-likely-than-not to be sustained upon examination by taxing authorities.
36
Table of Contents
Results of Operations
The following is a discussion of actual operating results for 2011, compared to actual operating results for 2010.
NET REVENUE
| Year Ended December 31, |
||||||||||||
| (in thousands) |
2011 | 2010 | Change | |||||||||
| Net revenue |
$ | 407,430 | $ | 342,658 | $ | 64,772 | ||||||
Total net revenue, including transactions between us and the ED&F Man group, increased $64.8 million, or 19%, to $407.4 million in 2011 when compared to $342.7 million in 2010, primarily due to higher liquid feed supplement volume. Net revenue from third parties increased $62.1 million or 19%, to $392.1 million in 2011 when compared to $329.9 million in 2010. Net revenue from related parties, which accounted for 4% of total net revenue in 2011 and 2010, increased by $2.6 million or 21%, to $15.3 million in 2011, when compared to $12.7 million in 2010.
The bulk liquid storage segment represented 22% and 26% of total net revenue in 2011 and 2010 respectively, while the liquid feed supplement segment represented the remaining 78% and 74% of total net revenue for these periods.
Bulk Liquid Storage
In the bulk liquid storage business, net revenue increased by $395,000 to $89.0 million in 2011 from $88.6 million in 2010.
Bulk liquid storage net revenue within the U.S. accounted for 70% and 69% of total bulk liquid storage net revenue in 2011 and 2010 respectively. During 2011, bulk liquid storage net revenue within the U.S. increased $1.5 million, or 2%, compared to 2010, reflecting the expansion of our Port Allen, LA, Sioux City, IA, and Houston, TX facilities. We continued to experience healthy market conditions at most of our locations in the U.S. and we are continuing to experience high contract renewal percentages with annual price escalations. We are continuing to expand our Houston, TX facilities, with a total of 8.5 million gallons of storage capacity currently under construction.
Bulk liquid storage net revenue from outside the U.S. accounted for the remaining 30% and 31% of total bulk liquid storage net revenue in 2011 and 2010 respectively. During 2011, bulk liquid storage net revenue from outside the U.S decreased 4% compared to 2010. The decrease in revenue was primarily due to a softening in certain markets due to various local issues, including volatility in oil industry pricing and renewable energy subsidies. This has led to continued localized excesses in the supply of storage. This decrease was partially offset by an increase in revenue in the United Kingdom due to favorable demand for storage there, as well as by a combination of fluctuating exchange rates in the Euro, Pound Sterling and Canadian Dollar in 2011. These fluctuating exchange rates had a combined positive impact on bulk liquid storage net revenue outside of the U.S. of approximately 4% during 2011 compared to these rates during 2010. The Company’s European activities are focused on developing new bulk liquid storage customers, including opportunities in markets such as the United Kingdom. We expect, however, that the overall state of the European storage market will be healthy and the current over supply situation is expected to be corrected as oil markets stabilize.
Our total global storage capacity (net of disposals and not including construction in progress) as of December 31, 2011 increased to approximately 363 million gallons, which includes 10.5 million gallons of capacity temporarily taken out of service for normal maintenance. The percentage capacity utilization of our bulk liquid storage facilities was approximately 91% as of December 31, 2011, compared to 96% as of December 31, 2010. The lower utilization was in part due to the 10.5 million gallons, or 2.9% of total capacity, being temporarily taken out of service for normal maintenance along with timing differences as contracts turn over. At December 31, 2010, only 3.4 million gallons, or 1.0% of total capacity, were temporarily taken out of service for normal maintenance.
We believe that capacity and capacity utilization are key to the profitability of our bulk liquid storage business. Once the fixed cost of constructing a terminal has been incurred, the marginal revenues received for storage services exceed the marginal cost of providing each additional increment of storage service. We are continuing to evaluate opportunities to increase our bulk liquid storage capacity, including possible future projects for greenfield expansions and targeted infill development. Additionally, we are evaluating growth opportunities by identifying new strategic locations to either acquire existing bulk liquid terminals from third parties or construct new bulk liquid terminals on available land.
Liquid Feed Supplements
In 2011, net revenue for the liquid feed supplements business totaled $318.4 million, an increase of $64.4 million or 25% compared to net revenue of $254.0 million in 2010. Revenue was generated mainly from liquid feed supplement product sales, with a small proportion of revenue arising from solid or more traditional animal feeds. Volume in 2011 increased 13% to 1.8 million tons compared to 1.6 million tons in 2010 due to increased demand for lower cost alternatives to high priced dry commodities. Geographically, 98% of liquid feed supplement total net revenue was realized in the United States for 2011 and 2010, with the remaining 2% realized outside of the United States.
37
Table of Contents
We view volume, dollar gross profit and gross profit margin percentage as key performance indicators to the profitability of our liquid feed supplements business. Once the fixed costs of an operating facility are covered, all revenue that exceeds the variable costs contributes incrementally to the profitability of our business. Generally, revenues are a partial indicator of performance because large fluctuations can occur from period to period due to general seasonal trends, as well as the volatility in the prices of underlying commodity ingredients which affect both competitive pricing strategies and the cost of sales. Gross profit margin percentage is another indicator to monitor our cost of sales, which in the liquid feed supplements business, can be somewhat volatile due to market conditions.
COST OF SALES
| Year
Ended December 31, |
||||||||||||
| (in thousands) |
2011 | 2010 | Change | |||||||||
| Costs of sales |
$ | 267,577 | $ | 206,842 | $ | 60,735 | ||||||
| Liquid feed supplement volume (tons) |
1,837 | 1,625 | 212 | |||||||||
| Dollar gross profit |
$ | 50,842 | $ | 47,200 | $ | 3,642 | ||||||
In 2011, cost of sales for our liquid feed supplements business, including related party purchases from the ED&F Man group, totaled $267.6 million, an increase of $60.7 million or 29%, compared to cost of sales of $206.8 million in 2010. The increase in costs of sales was primarily due to the higher volume and an increase in input costs. Costs of sales include the cost of molasses and other ingredients in our liquid feed supplement operations, as well as promotional expenses.
Dollar gross profit (net revenue including from related parties, less cost of sales) in our liquid feed supplements business increased $3.6 million or 8%, to $50.8 million in 2011, compared to $47.2 million in 2010, as a result of higher sales volume in 2011.
Gross profit margin percentage (net revenue including from related parties, minus cost of sales, divided by net revenue) for the liquid feed supplements business was 16.0% in 2011 compared to 18.6% in 2010. This percentage decrease was primarily due to higher input costs as well as a higher proportion of lower margin products in the mix of overall sales. The decrease was also partially due to certain other income items recognized in 2010 that had a positive impact on gross profit margin percentage in 2010 and were not repeated in 2011.
OTHER OPERATING COST AND EXPENSES
| Year Ended December 31, |
||||||||||||
| (in thousands) |
2011 | 2010 | Change | |||||||||
| Other operating costs and expenses |
$ | 58,268 | $ | 56,928 | $ | 1,340 | ||||||
Other operating costs and expenses in 2011 were $58.3 million, an increase of $1.3 million or 2%, from $56.9 million in 2010. The increase in 2011 was primarily due to higher bulk liquid storage operating costs and expenses in both the U.S. and Europe during 2011 as compared to 2010.
Bulk liquid storage other operating costs and expenses in the U.S. increased due to additional bulk liquid storage facility costs relating to the Port Allen, LA and Houston, TX expansions, as well as a $411,000 insurance claim recovery in 2010 that offset expenses for that time period, whereas no such recoveries of this size were experienced in 2011.
Bulk liquid storage other operating costs and expenses outside of the U.S. increased due to additional other operating costs at our United Kingdom bulk liquid storage facilities, as well as from fluctuating exchange rates in the Euro, Pound Sterling and Canadian Dollar. These rates together increased bulk liquid storage other operating costs and expenses outside of the U.S. by approximately 4% in 2011 compared to these rates in 2010.
These factors were partially offset by a 3% decrease in liquid feed supplement other operating costs and expenses resulting from facility efficiencies and product mix changes.
Of the total other operating costs and expenses, the bulk liquid storage segment represented 65% and 63% in 2011 and 2010 respectively, and the liquid feed supplement segment represented 35% and 37%. Major components of other operating costs and expenses included payroll, repairs, utilities, and insurance.
38
Table of Contents
DEPRECIATION AND AMORTIZATION
| Year Ended December 31, |
||||||||||||
| (in thousands) |
2011 | 2010 | Change | |||||||||
| Depreciation and amortization |
$ | 25,694 | $ | 25,595 | $ | 99 | ||||||
Depreciation and amortization costs increased by $99,000 to $25.7 million in 2011 from $25.6 million in 2010. The increase was mainly due to our recent completion of new capital investments in the United States and Europe, including the expansion of our Port Allen, LA, Sioux City, IA, and Houston, TX facilities. This was partially offset by a one-time expense of $1.2 million in additional depreciation recorded during the second quarter of 2010 as a result of the cumulative impact of purchasing accounting requirements from 2009 relating to the Company finalizing the assumptions used in assigning useful lives to the property, plant, and equipment acquired in the May 28, 2009 business combination.
Of the total depreciation, the bulk liquid storage segment represented 78% and 80% in 2011 and 2010 respectively, and the liquid feed supplement segment represented 19% for the same periods. The Corporate non-operating segment represented the remaining 3% and 1% in 2011 and 2010, relating mainly to information technology software.
SELLING, GENERAL, AND ADMINISTRATIVE ESPENSES
| Year Ended December 31, |
||||||||||||
| (in thousands) |
2011 | 2010 | Change | |||||||||
| Selling, general and administrative expenses |
$ | 33,852 | $ | 34,026 | $ | (174 | ) | |||||
Selling, general and administrative expenses in 2011 decreased by $174,000, to $33.9 million, compared to $34.0 million in 2010. Public company corporate-related fees including legal and advisory services decreased by $1.1 million in 2011 compared to 2010 as a result of cost control measures implemented during the year and one-time projects in 2010 that were not repeated in 2011. This decrease was partially offset by higher U.S. employee medical claim activity in 2011 and moderate increases in personnel related costs since 2010.
Of the total selling, general, and administrative expenses, the bulk liquid storage segment represented 19% and 22% in 2011 and 2010 respectively, the liquid feed supplement segment represented 36% and 33%, and the corporate segment represented the remaining 45% for the periods. Selling, general, and administrative expenses include costs associated with payroll, office, and other administrative expenses of our bulk liquid storage and liquid feed supplement operations, as well as corporate general and administrative costs.
GOODWILL IMPAIRMENT
| Year Ended December 31, |
||||||||||||
| (in thousands) |
2011 Actual |
2010 Actual |
Change | |||||||||
| Goodwill impairment |
$ | 3,095 | $ | 2,062 | $ | 1,033 | ||||||
During the fourth quarter of 2011, we performed our annual goodwill impairment assessment. It was determined that goodwill impairment existed at our Gdynia, Poland, our Esbjerg, Denmark, and our Riverdale, IL facilities. As a result, we recorded a non-cash impairment charge to goodwill of $3.1 million which extinguished the entire amount of goodwill at these reporting units. The impairment was primarily due to reductions in our future revenue projections for these facilities as a result of local market conditions and changes to assumptions about future conditions at these facilities such as rates, utilization, and product mixes. No other goodwill adjustments were necessary for our other 18 reporting units in 2011. In 2010, we recorded a non-cash impairment charge to goodwill of $2.1 million relating to our Dublin, Ireland facility. For a more detailed discussion of our recent goodwill impairment assessments, see “Critical Accounting Estimates – Goodwill and Indefinite-Lived Intangible Assets.”
39
Table of Contents
FOUNDER WARRANT EXPENSE
| Year Ended December 31, |
||||||||||||
| (in thousands) |
2011 | 2010 | Change | |||||||||
| Founder warrant expense |
$ | — | $ | 1,381 | $ | (1,381 | ) | |||||
During 2010, our shareholders approved the Founder Warrant Amendment which extended the expiration dates of, and otherwise amended, the outstanding founder warrants. As a result, the Company recognized a non-cash expense of $1.4 million in 2010 which is equal to the increase in value of the founders warrants as of the date the amendment was approved. There was no such expense 2011.
OPERATING INCOME
| Year Ended December 31, |
||||||||||||
| (in thousands) |
2011 | 2010 | Change | |||||||||
| Operating income |
$ | 18,944 | $ | 15,824 | $ | 3,120 | ||||||
Operating income increased by $3.1 million or 20%, to $18.9 million in 2011 from $15.8 million in 2010. This increase was due in part to an increase in liquid feed supplement gross profit and an increase in bulk liquid storage net revenue within the U.S. The increase was also due in part to a one-time founder warrant expense of $1.4 million in 2010 and lower liquid feed supplement other operating costs and expenses in 2011 as compared to 2010. These factors were partially offset by lower bulk liquid storage revenue outside of the U.S. and higher total bulk liquid storage other operating costs and expenses and goodwill impairment charges during 2011 compared 2010.
Operating income in 2011 was comprised of operating income of $21.6 million from the bulk liquid storage segment and $13.4 million from the liquid feed supplements segment, less corporate costs of $16.0 million. Operating income in 2010 was comprised of operating income of $22.9 million from the bulk liquid storage segment and $10.0 million from the liquid feed supplements segment, less corporate costs of $17.0 million.
INTEREST EXPENSE, NET
| Year Ended December 31, |
||||||||||||
| (in thousands) |
2011 | 2010 | Change | |||||||||
| Interest, net |
$ | (4,393 | ) | $ | (5,119 | ) | $ | 726 | ||||
Interest expense decreased by $726,000 or 14%, to $4.4 million in 2011 compared to $5.1 million in 2010. The decrease was primarily due to the reduction of interest rates and commitment fees payable as a result of the recent amendment to our credit facility signed in July 2011. This amendment also extended the maturity of the overall facility and resulted in a longer amortization period for debt financing costs.
LOSS ON DISPOSAL OF PROPERTY, PLANT & EQUIPMENT
| Year Ended December 31, |
||||||||||||
| (in thousands) |
2011 | 2010 | Change | |||||||||
| Loss on disposal of property, plant & equipment |
$ | (1,384 | ) | $ | (947 | ) | $ | (437 | ) | |||
Loss on disposal of property, plant & equipment increased $437,000 to $1.4 million in 2011 compared to $947,000 in 2010. These losses resulted from the disposition of obsolete equipment during the period which no longer had a useful life.
INCOME TAXES
| Year Ended December 31, |
||||||||||||
| (in thousands) |
2011 | 2010 | Change | |||||||||
| Income tax provision |
$ | (7,511 | ) | $ | (3,650 | ) | $ | (3,861 | ) | |||
40
Table of Contents
Our income tax provision of $7.5 million for 2011 increased by $3.9 million from $3.7 million for 2010. This increase was primarily due to a $1.2 million normal increase in our tax provision due to our increase in income (before income tax provision and equity in loss of unconsolidated subsidiary) and a $1.1 million increase in U.S. tax provision on foreign earnings (due to distributions from our foreign subsidiaries to our U.S. parent).
EQUITY IN LOSS OF UNCONSOLIDATED SUBSIDIARY, NET
| Year Ended December 31, |
||||||||||||
| (in thousands) |
2011 | 2010 | Change | |||||||||
| Equity in loss of unconsolidated subsidiary, net |
$ | (590 | ) | $ | (433 | ) | $ | (157 | ) | |||
Equity in loss of unconsolidated subsidiary increased $157,000 to a cumulative loss of $590,000 in 2011 compared to a cumulative loss of $433,000 in 2010. This represents our portion of the losses in the 50:50 joint venture that we have in Australia. Feed volumes in the joint venture were down due to severe unseasonable weather conditions in Australia during the first part of 2011 as well as lower cattle headcount in the Australian market. Initiatives to address these conditions include the implementation of a more structured product pricing mechanism, better product mix determination and additional product line development, restructuring of the sales department, additional operating cost control measures, and introduction of lower cost commodity inputs.
NET INCOME ATTRIBUTABLE TO WESTWAY GROUP, INC.
| Year Ended December 31, |
||||||||||||
| (in thousands) |
2011 | 2010 | Change | |||||||||
| Net income attributable to Westway Group, Inc. |
$ | 4,940 | $ | 5,678 | $ | (738 | ) | |||||
Net income attributable to Westway Group, Inc. decreased by $738,000 to $4.9 million in 2011 as compared to $5.7 million in 2010. This decrease is primarily due to an increase in income tax provision of $3.9 million and an increase in the loss on disposal of obsolete property, plant, and equipment of $437,000, partially offset by an increase in operating income of $3.1 million and a decrease in interest expense of $726,000.
PREFERRED DIVIDENDS ACCRUED
| Year Ended December 31, |
||||||||||||
| (in thousands) |
2011 | 2010 | Change | |||||||||
| Preferred dividends accrued |
$ | (4,458 | ) | $ | (4,250 | ) | $ | (208 | ) | |||
Accruals for preferred dividends increased slightly to $4.5 million in 2011 compared to $4.3 million in 2010. The increase of $208,000 was the result of dividends accruing on an additional 1.8 million shares of Series A Convertible Preferred Stock issued in 2011 in satisfaction of outstanding unpaid accrued dividends.
NET INCOME (LOSS) APPLICABLE TO COMMON AND PARTICIPATING STOCKHOLDERS
| Year Ended December 31, |
||||||||||||
| (in thousands) |
2011 | 2010 | Change | |||||||||
| Net income applicable to participating stockholders |
$ | 2,577 | $ | — | $ | 2,577 | ||||||
| Net income (loss) applicable to common stockholders |
$ | (2,095 | ) | $ | 1,428 | $ | (3,523 | ) | ||||
Net income applicable to participating stockholders was $2.6 million in 2011, due to $2.6 million of common dividends paid to participating stockholders. No common dividends were paid in 2010.
Net income (loss) applicable to common stockholders decreased by $3.5 million to a loss of $2.1 million in 2011 as compared to income of $1.4 million in 2010. This decrease was due to an increase in net income applicable to participating stockholders of $2.6 million (as a result of common dividends paid to participating stockholders), a decrease in net income attributable to Westway Group, Inc. of $738,000, and an increase in preferred dividends accrued of $208,000.
41
Table of Contents
Trends in Results of Operations
In our bulk liquid storage business, global demand has generally remained strong, notably in the U.S. and the United Kingdom. Contracts continue to renew at a high percentage and at higher rates due to contract escalations. We do, however, recognize softness in certain European markets due to various local issues, including volatility in oil industry pricing and renewable energy subsidies. This has led to continued localized excesses in the supply of storage. We believe, however, that the overall state of the storage market is healthy and the current over supply situation in Europe is expected to be corrected as energy markets stabilize.
Our liquid feed supplements business achieved higher sales volume in 2011 as compared to 2010 by providing our customers with products that met their price points and business needs in a changing market environment. Although our gross profit margin percentage has decreased compared to prior years as a result of competitive pricing, we have increased volumes and dollar gross profit in 2011 by offering our liquid feed alternatives in a market experiencing high priced dry feed commodities. One of our new liquid feed supplement projects to expand our product offering to include low moisture tubs was completed in December 2011 and will begin contributing revenue in 2012. This project was initially expected to come online during the summer months of 2011, however, due to extended research, this project was delayed.
The liquid feed supplement business is normally affected by seasons of the year, primarily due to the availability of pasture grass for livestock grazing. Traditionally, the demand for our liquid feed supplements is lower during the spring and summer months when pasture grasses are more prevalent, absent extreme or unusual weather conditions, while the stronger demand occurs in the fall and winter months. During the summer of 2011, our liquid feed supplement revenue exhibited an atypical increase stemming from a different variable than seasonality. More specifically, general economic conditions caused livestock owners and producers to seek lower cost alternatives to high priced dry commodities, particularly those that are corn based. Our feed staff implemented a strategy to provide such products that would fill this demand, albeit at lower profit margins but at higher volume levels. It is possible that this competitive advantage may continue into the future, depending on economic and market conditions, in addition to the normal seasonal pattern of stronger demand in the fall and winter.
Liquidity and Capital Resources
General
Cash and Working Capital
During 2011, our cash and cash equivalents increased by $827,000 to a total of $13.5 million at December 31, 2011, of which $5.3 million was held by foreign subsidiaries. This increase was the result of cash provided by operating activities of $38.7 million, cash used in investing activities of $39.1 million, cash provided by financing activities of $1.4 million, and a negative exchange rate effect of $127,000.
Our working capital (by which we mean total current assets less total current liabilities) increased from $27.5 million at December 31, 2010 to $37.0 million at December 31, 2011.
Total net trade accounts receivable, including amounts due from related parties, increased 18% to $47.3 million at December 31, 2011 from $40.1 million at December 31, 2010, due primarily to higher sales volume and sales prices in the liquid feed supplement business.
Our inventories increased 28% to $19.8 million at December 31, 2011 from $15.5 million at December 31, 2010, due primarily to an increase in purchased raw material volumes and prices.
Total trade accounts payable, including amounts due to related parties, increased 28% to $21.7 million at December 31, 2011 from $16.9 million at December 31, 2010, due primarily to increased volumes and input prices in the liquid feed supplement business.
Total accrued expenses and other current liabilities decreased 12% to $28.4 million at December 31, 2011 from $32.3 million at December 31, 2010, due primarily to the issuance of Series A Convertible Preferred Stock during 2011 in satisfaction of all outstanding accrued dividends through December 31, 2010 that totaled $6.8 million. This was partially offset by an increase in dividends payable relating to the quarterly dividends declared in the second half of 2011 as well as an increase in goods received and not yet invoiced as a result of higher sales volume and sales prices in the liquid feed supplements business.
Sources
Our capital requirements have been financed primarily with cash flows from operations, periodically supplemented by borrowings from our credit facilities.
42
Table of Contents
On July 6, 2011, the Company and its bank syndicate amended the Company’s $200 million credit facility to make the following changes:
| • | extended the maturity date to July 6, 2015; |
| • | reduced the interest spread added to the interest rate index available under the Credit Agreement that the Company uses from a fixed 3.5% over the LIBOR index to a spread ranging from 2.25% to 3.0% over LIBOR, based on the Consolidated Total Leverage Ratio at the end of each fiscal quarter; |
| • | added a new accordion feature to the Company’s existing $200 million line of credit to permit the Company to expand the credit facility in an aggregate amount of up to an additional $50 million; |
| • | reduced the annual commitment fee payable on the average daily unused amount of the revolving credit facility from 0.625% to 0.5%; |
| • | amended the Consolidated Total Leverage Ratio covenant to require a maximum ratio of 3.75 to 1.0 until the maturity date, in replacement of a maximum ratio that declined to 3.25 to 1.0 over time; |
| • | provided the Company a limited right to pay dividends of cash, equity or any combination thereof to the holders of its common and preferred stock, subject to certain terms and conditions; and |
| • | in connection with the granting of the right to pay dividends, amended the definition of Consolidated Interest Coverage Ratio, which shows the relation between the Company’s EBITDA and its consolidated interest expense, to require the deduction from EBITDA of the amount paid by the Company as dividends, if any, before computing the ratio. |
At December 31, 2011, we had $106.5 million of borrowing capacity available under our $200 million bank revolving credit facility. We have the option, subject to certain conditions, to increase the credit facility by up to $50 million (the “accordion” feature).
Our internal sources of liquidity generally include our cash balances, our cash equivalents (which are readily convertible to cash), and our current cash flows from operations. Our external sources of liquidity include our bank revolving credit facility. Our available sources of liquidity include the balance still available to be drawn down under the credit facility.
Uses
During 2011 we used cash to fund ongoing operations, including paying for purchases of raw materials, leases of land and equipment, and payroll, to fund capital expenditures for maintenance, expansions, and acquisitions, to pay debt service and taxes, to repurchase shares of our Class A common stock, and to pay cash dividends.
Trends
The cash flows from operations of the bulk liquid storage and liquid feed supplements businesses have been positive for each 12 month fiscal year for the last 3 years. We expect cash flows from operations to be positive for the next twelve months. We also note that the capital expenditures of our two businesses for expansion and acquisitions are likely to increase, consistent with our growth strategy.
Cash Flows
Operating Activities
Consolidated cash provided by operating activities mainly comprises the cash from operations of our bulk liquid storage and liquid feed supplements businesses, partially offset by expenses paid at the corporate level, such as professional fees and interest on amounts borrowed on our credit facility.
Our net cash provided by operating activities during 2011 was $38.7 million, an increase of $4.3 million compared to $34.4 million net cash provided by operations for 2010. This increase in operating cash flow compared to 2010 is largely due to an increase in net income before certain adjustments including goodwill impairment, deferred income taxes, and loss on disposal of property, plant, and equipment, partially offset by the aggregate net change in working capital items.
Cash provided by operating activities was generated primarily from bulk liquid storage rentals, throughput fees, and ancillary service fees and sales of liquid feed supplements. Cash was used in operating activities mainly for costs of raw materials, maintenance expenses, payroll costs, utilities, professional services, interest, and taxes.
43
Table of Contents
Investing Activities
Our investing activities resulted in net cash used of $39.1 million for 2011, compared to net cash used of $22.6 million for 2010. This change is due to increased capital expenditures, primarily in our bulk liquid storage segment in the United States and Amsterdam, Netherlands. Historically, cash used in our investing activities has primarily been spent on acquisitions of businesses and on expansion of our existing facilities.
Capital Expenditures
During 2011, capital expenditures for our bulk liquid storage and liquid feed supplements businesses were $32.2 million and $6.3 million, respectively, with our corporate office capital expenditures totaling $695,000.
Consistent with our strategy of investment in deep water locations and expansion of existing sites in our bulk liquid storage business, in 2011, we spent $10.1 million to complete construction of our Houston #1 facility expansion, $3.0 million to expand our Houston #2 facility, and $7.0 million to expand our Amsterdam facility. In addition, we spent $9.9 million on maintenance capital expenditures on equipment relating to our bulk liquid storage business.
In our liquid feed supplements business, we spent $1.8 million in expansion related projects, primarily the construction of facilities to produce our new low moisture tubs, as well as additional storage tanks at various locations. We spent $4.4 million of maintenance capital expenditures on equipment in 2011 as well.
Financing Activities
Our financing activities resulted in net cash provided of $1.4 million for 2011, compared to net cash used of $8.3 million for 2010. The difference between the periods is primarily due to additional borrowings on our credit facility during 2011, partially offset by payments used to purchase 34,874,820 of our publicly traded warrants during 2010 for $4.5 million.
Proceeds from borrowings under our credit facility increased to $89.9 million for 2011 compared to $53.0 million for 2010 primarily due to higher liquid feed supplement ingredient prices and purchase volumes which required additional financing. The proceeds of the credit facility are used by the Company for general corporate purposes, which includes among other things working capital and capital expenditures. Repayments on our credit facility for 2011 totaled $84.9 million compared to $56.1 million for 2010. This increase was due to higher liquid feed supplement sales prices and volumes which enabled us to repay more on our credit facility.
Significant non-cash financing activities in 2011 included the issuance of 1.8 million newly-issued shares of Series A Convertible Preferred Stock, with a fair value of $10.1 million, the accrual of $4.5 million of preferred dividends, and the issuance of 322,879 shares of common stock valued at $1.3 million as a result of the dividends declared in 2011.
Effect of Exchange Rate Changes on Cash and Cash Equivalents
During 2011, the effect of exchange rate changes decreased our cash and cash equivalents by $127,000 primarily due to the strengthening of the U.S. dollar against other foreign currencies including the Euro, Canadian Dollar, and Polish Zloty during this period. During 2010, the effect of exchange rate changes decreased our cash and cash equivalents by $543,000 primarily due to the strengthening of the U.S. dollar against the Euro and Pound Sterling during this period.
Bank Syndicate Credit Facility
On July 6, 2011, we and our bank syndicate amended various terms of our existing $200 million credit facility. The modifications included, among other items, the extension of the maturity date to July 6, 2015, the reduction of the interest rate and commitment fees payable, the relaxation of certain key financial covenants, and the addition of a new $50 million accordion feature to the current facility. Up to $10 million of the bank credit facility remains available for the issuance of letters of credit, and we may still make short-term borrowings of up to $10 million under a “swingline” facility. As of December 31, 2011, the total balance outstanding on the bank credit facility was $93.5 million.
The interest rate for each loan is, at our option, either (a) LIBOR, adjusted by the statutory reserve rate, plus 2.25% to 3.0% per year, or (b) 1.25% to 2.00% per year plus the highest of (i) JP Morgan Chase’s public prime rate, (ii) the federal funds effective rate plus 0.5%, and (iii) the one-month LIBOR adjusted by the statutory reserve rate plus 1.0%. The precise rate varies based on the consolidated total leverage ratio at the end of each fiscal quarter. We must pay a commitment fee of 0.50% per year on the average daily unused amount of the credit facility. The revolving credit facility is secured by (a) guarantees by all of our domestic wholly-owned subsidiaries (one of which owns all our foreign subsidiaries); (b) first priority liens on substantially all our domestic personal property; (c) pledge of 100% of the equity of all our domestic wholly-owned subsidiaries and 65% of the equity of our foreign wholly-owned subsidiary that owns all our other foreign subsidiaries; and (d) first mortgage liens on our fee or leasehold interests in 7 facilities, then having a fair market value of approximately $120 million.
44
Table of Contents
The credit facility includes various customary covenants and other provisions, including a negative pledge on substantially all our non-mortgaged assets restricting their encumbrance, and restrictions on our ability to make capital expenditures, dispose of assets, incur indebtedness, encumber assets, pay dividends, redeem securities, make investments, change the nature of our business, acquire or dispose of a subsidiary, enter into transactions with affiliates, enter into hedging agreements, or merge, consolidate, liquidate, or dissolve. We also must maintain certain financial covenants, including (a) a specially-defined maximum consolidated total leverage ratio, measured quarterly, of no more than 3.75 to 1 as of December 31, 2011 and, (b) a specially-defined minimum consolidated interest coverage ratio, measured quarterly, of not less than 3.0 to 1. Our actual ratios with respect to these two financial covenant tests as of December 31, 2011 were 1.93 to 1 and 11 to 1, respectively.
Events of default include, among other things, covenant violations, events having a material adverse effect, and change of control (specially defined). Based on our December 31, 2011 financial position and the current market conditions for our products and services, we anticipate that we will be able to comply with our covenants through 2012.
Future Cash Flows
This section consists almost entirely of forward-looking statements. Important factors that could cause our actual results to differ materially from the statements in this section include changes in the expected profitability of one or both of our businesses, changes in the amount or timing of our expected investments, or changes in the amount or timing of our expected draws under our credit facilities.
Capital Expenditures
In the normal course of business, we make investments in the properties and facilities utilized by our bulk liquid storage and liquid feed supplements businesses. As a result, at any given time, we have outstanding contracts with third parties reflecting long-term commitments for capital expenditures not yet incurred. At December 31, 2011, these commitments totaled $7.7 million in the aggregate.
For 2012, we expect that capital expenditures for expansion and maintenance will be consistent with 2011. We continue to evaluate our capital budget and may make changes as economic conditions warrant.
Maintenance capital expenditures include the refurbishment of storage tanks, piping, and dock facilities, and environmental capital expenditures, principally for improvements in containment measures.
Currently, we are in the process of expanding the capacity of several of our terminal sites. At our Houston 1, TX facility, we are constructing six new 1 million gallon tanks and three new dock lines as well as the associated inbound and outbound marine and land traffic infrastructure. We are also constructing four new 630 thousand gallon tanks at our Houston 2, TX facility. Completion of these projects is on schedule and expected in the latter half of 2012.
Other Uses
In addition to maintenance and expansion and acquisition capital expenditures, we expect to use our available cash flow to pay operating expenses, interest payments, tax payments, and discretionary debt principal payments, as well as any cash dividends.
As part of our operating expenses, we expect to continue to make significant purchases of raw materials for our liquid feed supplements business. We have a long-term molasses supply agreement with the ED&F Man group, pursuant to which the ED&F Man group is expected to continue to be our primary supplier of cane molasses.
Also as part of operating expenses, we expect to continue to make significant lease payments. We have operating leases on 21 bulk liquid storage facilities and 12 liquid feed supplements processing and distribution facilities. Typically our leases extend beyond five years.
Any liquidity in excess of our operating expenses, planned capital expenditures, and interest, tax, and cash dividend payments is expected to be utilized to repay part of our credit facility or to finance the implementation of our growth strategy, which at this time is principally focused on expanding our bulk liquid storage business. Our expansion and acquisition capital expenditures can generally be accelerated or scaled back depending on our liquidity.
45
Table of Contents
Sources
We expect our principal sources of liquidity in 2012 to be our cash from operations supplemented by our credit facility, on which the available borrowing capacity on December 31, 2011 was $106.5 million, not including the $50 million accordion feature. We are not predicting any material changes in the mix or relative cost of our capital resources in 2012 from December 31, 2011.
We expect our cash flow from operating activities to be positive for 2012 as a whole. As cash flow from operations is a key source of liquidity for us, decreases in demand for our products or services would reduce the availability of funds, especially any decrease in demand for bulk liquid storage services by the ED&F Man group, our largest customer.
We expect that our operating expenses, maintenance capital expenditures, interest payments, tax payments, and cash dividends will generally be funded by cash from operating activities in 2012.
We believe cash generated from operations, combined with our availability to draw on our current credit facility, will be sufficient to fund our expansion and acquisition capital expenditures in 2012.
We expect that our debt principal payments will generally be funded by refinancing as such principal payments come due.
Short-term Adequacy
We believe that our current cash and cash equivalents, credit facility, and the cash flow we anticipate to generate from operating activities will provide us with sufficient liquidity to satisfy our working capital needs, to make our planned capital expenditures, to pay cash dividends, and to meet our commitments for the next 12 months. We do not expect that we will be in breach of any covenants relating to our outstanding debt during this period.
Cash generated from operating activities can fluctuate depending on global economic conditions. If the availability of credit is tightened due to economic conditions, this could affect the demand of some of our customers for our products and services. Nonetheless, we expect to have sufficient access to cash to complete our committed expansion projects in 2012.
Long-term Adequacy
Beyond 2012, we expect to have the ability to generate sufficient liquidity and capital resources to meet our future cash requirements, including our debt obligations, for the reasonably foreseeable future. We base our assessment of the sufficiency of our liquidity and capital resources on the following assumptions:
| • | our businesses should continue to generate sufficient operating cash flow on an annual basis; |
| • | the ongoing maintenance capital expenditures associated with our businesses should be readily funded from their annual operating cash flow or available financing; and |
| • | we expect be able to refinance or extend maturing debt on appropriate terms that can be supported by the performance of our businesses. |
We believe that our financing arrangements provide us with sufficient financial flexibility to fund our operations, debt service requirements, capital expenditure plans, and cash dividends. Our ability to access additional debt or equity capital in the long-term depends on the availability of capital markets, our operating and financial performance, and pricing on commercially reasonable terms. From time-to-time, we review our long-term financing and capital structure. As a result of our review, we may periodically explore alternatives to our current capital structure and financing, including the issuance of additional equity or long-term debt, refinancing our credit facility, and other restructurings or financings. In addition, we may from time to time seek to repurchase a portion of our outstanding equity, including common stock and/or warrants, in open market purchases, privately negotiated transactions, or otherwise; and our board of directors may also review our corporate dividend policy. These matters, if any, will depend on prevailing market conditions, contractual restrictions, government regulations, bank covenants, and other factors. The amount of these activities may be material and may involve significant amounts of cash and/or financing availability.
Off Balance Sheet Arrangements
With the exception of operating lease commitments described in Note 14, “Commitments and Contingencies,” of our financial statements, we do not have any other off balance sheet arrangements.
46
Table of Contents
Factors that Affect Financial Performance
The Company’s performance is affected by a number of factors that cause fluctuation in the results of operations and overall financial performance. The most significant factors are described below.
Bulk Liquid Storage
In our bulk liquid storage business, we have long standing relationships with a range of customers, a number of which are significant both in overall market position and contribution to the Company. Contracts are typically in excess of one year in length and provide a significant pipeline of future revenue, in respect of which both cost and revenue structures utilize inflationary pricing mechanisms. Although customer retention has historically been high, changes in the customer base can occur and could have an impact on profitability.
We have foreign currency exposure, which can have either favorable or unfavorable impact on our earnings from time to time, but the majority of our transactions are conducted and reported in U.S. dollars. Refer to Item 7A, “Quantitative and Qualitative Disclosures About Market Risk” in this Form 10-K for further discussion of foreign currency exchange risk.
Wherever possible we endeavor to secure contractual commitments with third parties prior to construction in order to minimize the delay between construction of facilities and achievement of profitable levels of utilization. Results can be adversely affected when utilization rates are low.
Our performance is linked to the underlying economic demand for access to the regional supply chain network and logistics infrastructure for delivering goods and services to the market. Our storage rates are driven by customer demand and the available bulk liquid storage capacity at each of our regional terminal locations. Fluctuations in commodity pricing and commodity imbalances can increase or reduce the market demand for storage.
Liquid Feed Supplements
Our liquid feed supplements business provides a range of liquid feed supplements to customers both large and small across a wide range of regions within the United States, Canada, and eastern Australia. Historically, customer relationships usually are long and, although particular sales are not generally contracted in excess of one month ahead of delivery, the relationships usually result in stable income streams. Even so, changes in the customer base do occur and do have an impact on our profitability. The business can be significantly affected by the overall health of the cattle and dairy markets.
Our performance is also affected by the underlying price of the agricultural by-products utilized in the business. The market prices of non-liquid feed stocks that compete directly with the liquid feed supplements business are dependent on conditions affecting their supply overall, such as climatic conditions that drive crop yield, quality, and availability. Accordingly, conditions of good or poor supply affect the demand for liquid feed supplements and pricing in turn. The liquid feed supplements business is potentially more affected by changes in the availability and quality of agricultural commodities because of its higher proportion of agricultural commodity costs to its total costs.
The liquid feed supplements business can be significantly affected by adverse weather conditions such as droughts, hard winters, and flooding. Moreover, the months of April through July are traditionally seasonal low months for our liquid feed supplements business. The second quarter is historically weaker than the first quarter, and the fall and winter months are normally the strongest.
Corporate
Borrowings under our corporate revolving credit facility bear interest at a variable rate based on LIBOR or short-term U.S. market rates, at our option. We currently do not hedge our exposure to interest rates, but we do review this matter on a periodic basis. If market interest rates were to increase or decrease, there is a potential impact in our earnings. Refer to Item 7A, “Quantitative and Qualitative Disclosures About Market Risk” in this Form 10-K for further discussion of interest rate risk.
Overall
The Company is subject to a number of risks that have the potential to influence the future profitability of both operating segments, as described below.
Our businesses operate in environments that require strict adherence to environmental protection and health and safety regulation. A significant event such as contamination, leakage, or other material damage has the potential to significantly harm our financial performance. We believe that our compliance with each of these requirements is at or above the best practice requirements and that we have a strong track record in this regard.
47
Table of Contents
Price inflation that is not directly linked to agricultural commodities, such as consumer price inflation, can also affect the overall performance of the Company, particularly as it is reflected in employee compensation, energy, maintenance and construction costs. We do not consider the Company to be unduly affected by this factor compared with our competitors or the industry at large.
Finally, for additional information regarding important risks that may affect our business, financial condition, and operating results, see Part I, Item 1A, “Risk Factors” in this Form 10-K.
Future Application of Accounting Standards
Management does not believe that there are any accounting standards that have been issued, are required to be adopted by the Company in the future, and are reasonably likely to have a material impact on the information reported in our future financial statements.
| ITEM 7A. | QUANTITATIVE AND QUALITATIVE DISCLOSURES ABOUT MARKET RISKS |
We are exposed to market risks, including interest rate, foreign currency, and commodity risks. We neither hold nor issue financial instruments for trading purposes, and we have not entered into any derivative financial instrument transactions to manage or reduce market risk.
Our objective in managing our exposure to fluctuations in interest rates, foreign currency exchange rates, and commodity prices is to decrease the volatility of our earnings and cash flows affected by potential changes in underlying rates and prices. We monitor these risks and manage such risks on specific transactions. The risk management process primarily uses analytical techniques and sensitivity analysis.
Adverse effects of potential changes in market risks to which we are exposed are discussed below. The following discussion does not, however, consider the effects of the reduced level of overall economic activity that could exist following such changes, such as a significant increase in interest rates. Further, in the event of changes of such magnitude, we would likely take actions to mitigate our exposure to such changes.
A limitation that may cause the sensitivity analyses discussed below not to reflect fully the net market risk of the Company arises from assuming that hypothetical changes in market rates and prices move in the same direction within each risk category. The resulting sensitivity analyses do not incorporate information regarding the sign and amount of co-movements in prices or rates.
Except for any historical facts, this Item 7A consists of forward-looking statements. Important factors that could cause our actual results to differ materially include any significant actions the Company may take in the future to manage its exposure to market risk, any entry by the Company into a new credit facility on significantly different terms than the existing credit facility, and any substantial changes in the worldwide geographic distribution of our business.
Interest Rate Risk
The fair value of our cash and cash equivalents at December 31, 2011, approximated its carrying value due to the short-term duration of the cash-equivalent financial instruments. Our earnings are exposed to interest rate risk associated with borrowings under our revolving credit facility. Borrowings under our revolving credit facility bear interest at a variable rate based on LIBOR or short-term U.S. market rates, at our option. We currently do not use derivative instruments to manage our interest rate risk, but we may in the future. We continuously monitor our level of borrowings to evaluate our potential exposure to interest rate risk, including our assessment of the current and future economic environment.
At December 31, 2011, we had outstanding borrowings of approximately $93.5 million under our revolving credit facility. Based on the outstanding balance of our variable-interest-rate debt at December 31, 2011 and 2010, if both LIBOR and short-term U.S. market interest rates were to increase or decrease by 100 basis points, the potential annual decrease or increase, respectively, in our 2011 and 2010 pre-tax earnings would each be approximately $900,000, and in our after-tax net earnings would each be approximately $600,000. We are assuming a constant outstanding principal balance under our revolving credit facility and a hypothetical shift in market interest rates in the indicated direction throughout 2011 and 2010, respectively. Changes in our outstanding principal balance or other changes in interest rates would lead to different results.
Foreign Currency Exchange Rate Risk
Our foreign operations represent approximately 13% of our total bulk liquid storage and liquid feed supplements segments operating income and approximately 24% of our asset base. We maintain various operations in multiple foreign locations detailed in the table below. These foreign operations generally incur local operating costs and generate revenues in
48
Table of Contents
currencies other than the U.S. Dollar. These foreign currency revenues and expenses expose us to foreign currency risk and give rise to foreign currency exchange gains and losses. We do not presently hedge against the risks of foreign currency fluctuations. In the event of significant fluctuations in foreign currencies, we may experience declines in revenue and adverse impacts on operating results and such changes could be material. To manage foreign currency risk, we closely monitor the working capital requirements of our foreign operations, as well as movements in foreign exchange rates. We are continuing to evaluate the possible future use of foreign currency hedging strategies where we deem appropriate.
The following table lists the foreign countries in which we do business and the functional currency of each:
| Foreign Countries |
Functional Currencies | |
| Canada | Canadian Dollar | |
| United Kingdom | British Pound | |
| Netherlands | Euro | |
| Ireland | Euro | |
| Denmark | Danish Krone | |
| Poland | Polish Zloty | |
| Korea | Korean Won | |
| Australia | Australian Dollar |
We have identified the Canadian Dollar, the British Pound, and the Euro as the currencies with the most potential to impact our net earnings. A hypothetical 15% increase or decrease in all three of these foreign currency exchange rates against the U.S. dollar, would have potentially increased or decreased, respectively, our annual pre-tax earnings (which are expressed in U.S. dollars) by approximately $1.1 million and $1.2 million respectively for the years ended December 31, 2011 and 2010, and our after-tax net earnings by approximately $700,000 and $800,000 respectively.
Our accumulated other comprehensive income as presented in our consolidated statements of stockholders’ equity and statements of comprehensive income includes unrealized gains and losses from foreign currency translation. The assets, liabilities and results of operations of certain of our foreign subsidiaries are measured using their functional currency, which is the currency of the foreign economic environment in which they operate. Upon consolidating these subsidiaries, their assets and liabilities are translated to U.S. dollars at currency exchange rates as of the balance sheet date, their revenue and expenses are translated at the weighted average currency exchange rate for the applicable reporting period, and their stockholder’s equity accounts are translated at historical exchange rates during the applicable reporting periods. Gains or losses from translation of foreign subsidiaries are included in accumulated other comprehensive income.
Translation adjustments included in accumulated other comprehensive income as of December 31, 2011 were $2.8 million of unrealized losses primarily due to the strengthening of the U.S. dollar against other foreign currencies including the Euro, Canadian Dollar and Polish Zloty. This exchange rate change negatively impacted the net assets used in our foreign operations and held in local currencies, resulting in a change in cumulative translation adjustments to a $2.5 million unrealized loss as of December 31, 2011, compared to a $231,000 unrealized gain as of December 31, 2010. We do not presently hedge against the risks of foreign currency fluctuations but are continuing to evaluate the possible future use of foreign currency hedging strategies where we deem appropriate.
Commodity Price Risk
In the normal course of operations, our business is exposed to market risks arising from adverse changes in the prices of the commodities stored, consumed, and produced in our business.
Bulk Liquid Storage
We do not face significant risks relating directly to short-term movements in commodity prices in our bulk liquid storage business, as we primarily store and/or handle products for a fee and are not engaged in significant unmatched purchases and resale of commodity products.
Liquid Feed Supplements
The liquid feed supplements business is potentially more affected by changes in the prices of commodities because it directly consumes and produces for sale various agricultural commodities. It has a high proportion of agricultural commodity costs to its total costs. However, our liquid feed supplements business does not utilize many fixed-price long-term supply or purchase contracts, but mainly uses short-term contracts or floating-price long-term contracts. We believe we have adequate primary and secondary sources of supply for each of our key commodity ingredients and that, in periods of rising prices, we expect to recover a majority of the increased cost in the form of higher selling prices. However, recoveries typically lag the effect of cost increases due to the nature of our markets.
49
Table of Contents
Typically the majority of our raw material inputs are purchased from markets that can be volatile and are not provided the protections of standard risk management tools. Many of these ingredients are purchased from the food industry (corn, soybean, sugar milling), as well as from other industrial production. As such, the ingredients purchased by us are by-product streams ancillary to our suppliers’ main product stream and do not necessarily synchronize with the seasonality of our business. This requires us to make future purchase and storage commitments based upon knowledge of our industry as well as the production and pricing of numerous other industries.
50
Table of Contents
| ITEM 8. | FINANCIAL STATEMENTS AND SUPPLEMENTARY DATA |
REPORT OF INDEPENDENT REGISTERED PUBLIC ACCOUNTING FIRM
The Stockholders and Board of Directors
Westway Group, Inc.
We have audited the accompanying consolidated balance sheets of Westway Group, Inc. as of December 31, 2011 and 2010, and the related consolidated statements of operations, stockholders’ equity, comprehensive income, and cash flows for each of the two years in the period ended December 31, 2011. These financial statements are the responsibility of the Company’s management. Our responsibility is to express an opinion on these financial statements based on our audits.
We conducted our audits in accordance with the standards of the Public Company Accounting Oversight Board (United States). Those standards require that we plan and perform the audit to obtain reasonable assurance about whether the financial statements are free of material misstatement. We were not engaged to perform an audit of the Company’s internal control over financial reporting. Our audits included consideration of internal control over financial reporting as a basis for designing audit procedures that are appropriate in the circumstances, but not for the purpose of expressing an opinion on the effectiveness of the Company’s internal control over financial reporting. Accordingly, we express no such opinion. An audit also includes examining, on a test basis, evidence supporting the amounts and disclosures in the financial statements, assessing the accounting principles used and significant estimates made by management, and evaluating the overall financial statement presentation. We believe that our audits provide a reasonable basis for our opinion.
In our opinion, the financial statements referred to above present fairly, in all material respects, the consolidated financial position of Westway Group Inc. at December 31, 2011 and 2010, and the consolidated results of its operations and its cash flows for each of the two years in the period ended December 31, 2011, in conformity with U.S. generally accepted accounting principles.
/s/ Ernst & Young LLP
New Orleans, Louisiana
March 30, 2012
51
Table of Contents
CONSOLIDATED BALANCE SHEETS
(in thousands, except share data)
| As of | ||||||||
| December 31, 2011 |
December 31, 2010 |
|||||||
| ASSETS |
||||||||
| Current assets: |
||||||||
| Cash and cash equivalents |
$ | 13,479 | $ | 12,652 | ||||
| Trade accounts receivable from third parties, net |
45,579 | 37,297 | ||||||
| Trade accounts receivable from related parties |
1,752 | 2,769 | ||||||
| Inventories |
19,789 | 15,463 | ||||||
| Other current assets |
6,495 | 8,493 | ||||||
|
|
|
|
|
|||||
| Total current assets |
87,094 | 76,674 | ||||||
| Investment in unconsolidated subsidiary |
3,449 | 4,277 | ||||||
| Property, plant and equipment, net |
323,458 | 313,491 | ||||||
| Goodwill |
85,883 | 89,217 | ||||||
| Other intangibles, net |
7,912 | 8,221 | ||||||
| Other non-current assets |
4,235 | 3,341 | ||||||
|
|
|
|
|
|||||
| Total assets |
$ | 512,031 | $ | 495,221 | ||||
|
|
|
|
|
|||||
| LIABILITIES AND STOCKHOLDERS’ EQUITY |
||||||||
| Current liabilities: |
||||||||
| Trade accounts payable to third parties |
$ | 14,134 | $ | 8,009 | ||||
| Trade accounts payable to related parties |
7,568 | 8,909 | ||||||
| Accrued expenses and other current liabilities |
28,395 | 32,276 | ||||||
|
|
|
|
|
|||||
| Total current liabilities |
50,097 | 49,194 | ||||||
| Borrowings under credit facilities |
93,534 | 88,534 | ||||||
| Deferred income taxes |
71,565 | 64,624 | ||||||
| Other long-term liabilities |
702 | 660 | ||||||
|
|
|
|
|
|||||
| Total liabilities |
215,898 | 203,012 | ||||||
|
|
|
|
|
|||||
| Stockholders’ equity: |
||||||||
| Preferred stock: none authorized or outstanding at December 31, 2011. (December 31, 2010: $0.0001 par value; 7,000,000 shares authorized; none outstanding) |
— | — | ||||||
| Series A Convertible Preferred stock: $0.0001 par value; 40,000,000 authorized; 32,724,874 outstanding at December 31, 2011. (December 31, 2010: $0.0001 par value; 33,000,000 authorized; 30,886,830 outstanding) |
187,387 | 177,291 | ||||||
| Common Stock: $0.0001 par value; 235,000,000 shares authorized; 26,892,179 outstanding at December 31, 2011 represented by 13,993,369 Class A and 12,898,810 Class B shares. (December 31, 2010: $0.0001 par value; 235,000,000 shares authorized; 26,841,580 shares outstanding represented by 14,217,577 Class A and 12,624,003 Class B shares) |
3 | 3 | ||||||
| Additional paid-in capital |
127,026 | 131,039 | ||||||
| Accumulated other comprehensive income (loss) |
(2,538 | ) | 231 | |||||
| Retained earnings (accumulated deficit) |
(2,600 | ) | (3,082 | ) | ||||
| Treasury stock at cost – 2,335,569 shares at December 31, 2011. (December 31, 2010: 2,335,569 shares) |
(14,013 | ) | (14,013 | ) | ||||
|
|
|
|
|
|||||
| Total Westway Group, Inc. stockholders’ equity |
295,265 | 291,469 | ||||||
| Non-controlling interest |
868 | 740 | ||||||
|
|
|
|
|
|||||
| Total stockholders’ equity |
296,133 | 292,209 | ||||||
|
|
|
|
|
|||||
| Total liabilities and stockholders’ equity |
$ | 512,031 | $ | 495,221 | ||||
|
|
|
|
|
|||||
The accompanying notes are an integral part of these consolidated financial statements.
52
Table of Contents
CONSOLIDATED STATEMENTS OF OPERATIONS
(in thousands, except per share amounts)
| Year Ended December 31, | ||||||||
| 2011 | 2010 | |||||||
| Net revenue |
||||||||
| Bulk liquid storage |
$ | 74,049 | $ | 76,466 | ||||
| Liquid feed supplements |
318,097 | 253,531 | ||||||
| Related parties |
15,284 | 12,661 | ||||||
|
|
|
|
|
|||||
| Total net revenue |
407,430 | 342,658 | ||||||
| Costs of sales – liquid feed supplements |
||||||||
| Third parties |
180,012 | 140,464 | ||||||
| Related parties |
87,565 | 66,378 | ||||||
|
|
|
|
|
|||||
| Total costs of sales – liquid feed supplements |
267,577 | 206,842 | ||||||
| Other operating costs and expenses |
58,268 | 56,928 | ||||||
| Depreciation and amortization |
25,694 | 25,595 | ||||||
| Selling, general and administrative expenses |
33,852 | 34,026 | ||||||
| Goodwill impairment |
3,095 | 2,062 | ||||||
| Founder warrant expense |
— | 1,381 | ||||||
|
|
|
|
|
|||||
| Total operating expenses |
388,486 | 326,834 | ||||||
|
|
|
|
|
|||||
| Operating income |
18,944 | 15,824 | ||||||
|
|
|
|
|
|||||
| Other expense |
||||||||
| Interest, net |
(4,393 | ) | (5,119 | ) | ||||
| Loss on disposal of property, plant & equipment |
(1,384 | ) | (947 | ) | ||||
|
|
|
|
|
|||||
| Total other expense |
(5,777 | ) | (6,066 | ) | ||||
| Income before income tax provision and equity in loss of unconsolidated subsidiary |
13,167 | 9,758 | ||||||
| Income tax provision |
(7,511 | ) | (3,650 | ) | ||||
| Equity in loss of unconsolidated subsidiary, net |
(590 | ) | (433 | ) | ||||
|
|
|
|
|
|||||
| Net income |
5,066 | 5,675 | ||||||
|
|
|
|
|
|||||
| Net (income) loss attributable to non-controlling interest |
(126 | ) | 3 | |||||
|
|
|
|
|
|||||
| Net income attributable to Westway Group, Inc. |
4,940 | 5,678 | ||||||
| Preferred dividends accrued |
(4,458 | ) | (4,250 | ) | ||||
| Net income applicable to participating stockholders |
2,577 | — | ||||||
|
|
|
|
|
|||||
| Net income (loss) applicable to common stockholders |
$ | (2,095 | ) | $ | 1,428 | |||
|
|
|
|
|
|||||
| Earnings (loss) per share of common stock: |
||||||||
| Basic |
$ | (0.08 | ) | $ | 0.02 | |||
| Diluted |
$ | (0.08 | ) | $ | 0.02 | |||
| Dividends declared per share |
$ | 0.08 | $ | — | ||||
The accompanying notes are an integral part of these consolidated financial statements.
53
Table of Contents
CONSOLIDATED STATEMENTS OF COMPREHENSIVE INCOME
(in thousands)
| Year Ended December 31, | ||||||||
| 2011 | 2010 | |||||||
| Net income |
$ | 5,066 | $ | 5,675 | ||||
| Other comprehensive income (loss) net of tax effect: |
||||||||
| Foreign currency translation |
(2,767 | ) | (2,166 | ) | ||||
|
|
|
|
|
|||||
| Comprehensive income |
2,299 | 3,509 | ||||||
| Comprehensive (income) loss attributable to non-controlling interest |
(128 | ) | 3 | |||||
|
|
|
|
|
|||||
| Comprehensive income attributable to Westway Group Inc. |
$ | 2,171 | $ | 3,512 | ||||
|
|
|
|
|
|||||
The accompanying notes are an integral part of these consolidated financial statements.
54
Table of Contents
CONSOLIDATED STATEMENTS OF STOCKHOLDERS’ EQUITY
For the period from December 31, 2009 to December 31, 2011
(in thousands)
| Westway Group, Inc. Stockholders’ Equity | Non- controlling Interest |
Total Stockholders’ Equity |
||||||||||||||||||||||||||||||||||||||||||||||||||||||
| (in thousands, |
Series
A Convertible Preferred Stock |
Common Stock Class A |
Common Stock Class B |
Additional Paid-In Capital |
Retained Earnings (Accumulated Deficit) |
Accumulated Other Comprehensive Income |
Common Stock Held in Treasury |
Total Westway Group, Inc. stockholders’ equity |
||||||||||||||||||||||||||||||||||||||||||||||||
| Number of Shares |
Value | Number of Shares |
At Par Value |
Number of Shares |
At Par Value |
Number of Shares |
At Cost | |||||||||||||||||||||||||||||||||||||||||||||||||
| Balance, December 31, 2009 |
30,887 | $ | 177,291 | 13,941 | $ | 2 | 12,624 | $ | 1 | $ | 133,456 | $ | (4,284 | ) | $ | 2,397 | 2,352 | $ | (14,115 | ) | $ | 294,748 | $ | 613 | $ | 295,361 | ||||||||||||||||||||||||||||||
| Issuance of class A common shares from treasury |
17 | (31 | ) | (17 | ) | 102 | 71 | 71 | ||||||||||||||||||||||||||||||||||||||||||||||||
| Reclassification of additional paid in capital to retained earnings relating to treasury stock |
195 | (195 | ) | — | — | |||||||||||||||||||||||||||||||||||||||||||||||||||
| Restricted stock activity, net of shares forfeited |
258 | 541 | 541 | 541 | ||||||||||||||||||||||||||||||||||||||||||||||||||||
| Founder warrant extension |
1,381 | 1,381 | 1,381 | |||||||||||||||||||||||||||||||||||||||||||||||||||||
| Warrant tender |
2 | (4,534 | ) | (4,534 | ) | (4,534 | ) | |||||||||||||||||||||||||||||||||||||||||||||||||
| Convertible preferred dividend accrued |
(4,250 | ) | (4,250 | ) | (4,250 | ) | ||||||||||||||||||||||||||||||||||||||||||||||||||
| Non-controlling interest adjustment |
130 | 130 | ||||||||||||||||||||||||||||||||||||||||||||||||||||||
| Comprehensive income: |
||||||||||||||||||||||||||||||||||||||||||||||||||||||||
| Net income |
5,678 | 5,678 | (3 | ) | 5,675 | |||||||||||||||||||||||||||||||||||||||||||||||||||
| Foreign currency translation |
(2,166 | ) | (2,166 | ) | (2,166 | ) | ||||||||||||||||||||||||||||||||||||||||||||||||||
|
|
|
|
|
|
|
|
|
|
|
|
|
|
|
|
|
|
|
|
|
|
|
|
|
|
|
|
|
|||||||||||||||||||||||||||||
| Balance, December 31, 2010 |
30,887 | $ | 177,291 | 14,218 | $ | 2 | 12,624 | $ | 1 | $ | 131,039 | $ | (3,082 | ) | $ | 231 | 2,335 | $ | (14,013 | ) | $ | 291,469 | $ | 740 | $ | 292,209 | ||||||||||||||||||||||||||||||
|
|
|
|
|
|
|
|
|
|
|
|
|
|
|
|
|
|
|
|
|
|
|
|
|
|
|
|
|
|||||||||||||||||||||||||||||
55
Table of Contents
| (in thousands, except per share data) |
Westway Group, Inc. Stockholders’ Equity | Non- controlling Interest |
Total Stockholders’ Equity |
|||||||||||||||||||||||||||||||||||||||||||||||||||||
| Series A Convertible Preferred Stock |
Common Stock Class A |
Common Stock Class B |
Additional Paid-In Capital |
Retained Earnings (Accumulated Deficit) |
Accumulated Other Comprehensive Income (Loss) |
Common Stock Held in Treasury |
Total Westway Group, Inc. stockholders’ equity |
|||||||||||||||||||||||||||||||||||||||||||||||||
| Number of Shares |
Value | Number of Shares |
At Par Value |
Number of Shares |
At Par Value |
Number of Shares |
At Cost | |||||||||||||||||||||||||||||||||||||||||||||||||
| Balance, December 31, 2010 |
30,887 | $ | 177,291 | 14,218 | $ | 2 | 12,624 | $ | 1 | $ | 131,039 | $ | (3,082 | ) | $ | 231 | 2,335 | $ | (14,013 | ) | $ | 291,469 | $ | 740 | $ | 292,209 | ||||||||||||||||||||||||||||||
| Convertible preferred shares issued |
1,838 | 10,096 | 10,096 | 10,096 | ||||||||||||||||||||||||||||||||||||||||||||||||||||
| Convertible preferred dividend accrued |
(4,458 | ) | (4,458 | ) | (4,458 | ) | ||||||||||||||||||||||||||||||||||||||||||||||||||
| Dividends on common and convertible preferred shares |
48 | 275 | (3,457 | ) | (3,457 | ) | (3,457 | ) | ||||||||||||||||||||||||||||||||||||||||||||||||
| Restricted stock activity, net of shares forfeited |
56 | 916 | 916 | 916 | ||||||||||||||||||||||||||||||||||||||||||||||||||||
| Purchase and retirement of common stock |
(329 | ) | (1,472 | ) | (1,472 | ) | (1,472 | ) | ||||||||||||||||||||||||||||||||||||||||||||||||
| Comprehensive income: |
||||||||||||||||||||||||||||||||||||||||||||||||||||||||
| Net income |
4,940 | 4,940 | 126 | 5,066 | ||||||||||||||||||||||||||||||||||||||||||||||||||||
| Foreign currency translation |
(2,769 | ) | (2,769 | ) | 2 | (2,767 | ) | |||||||||||||||||||||||||||||||||||||||||||||||||
|
|
|
|
|
|
|
|
|
|
|
|
|
|
|
|
|
|
|
|
|
|
|
|
|
|
|
|
|
|||||||||||||||||||||||||||||
| Balance, December 31, 2011 |
32,725 | $ | 187,387 | 13,993 | $ | 2 | 12,899 | $ | 1 | $ | 127,026 | $ | (2,600 | ) | $ | (2,538 | ) | 2,335 | $ | (14,013 | ) | $ | 295,265 | $ | 868 | $ | 296,133 | |||||||||||||||||||||||||||||
|
|
|
|
|
|
|
|
|
|
|
|
|
|
|
|
|
|
|
|
|
|
|
|
|
|
|
|
|
|||||||||||||||||||||||||||||
The accompanying notes are an integral part of these consolidated financial statements.
56
Table of Contents
CONSOLIDATED STATEMENTS OF CASH FLOWS
(in thousands)
| Year Ended December 31, | ||||||||
| 2011 | 2010 | |||||||
| Cash flows from operating activities: |
||||||||
| Net income |
$ | 5,066 | $ | 5,675 | ||||
| Adjustments to reconcile net income to net cash provided by operating activities: |
||||||||
| Deferred income taxes |
6,816 | 2,425 | ||||||
| Provision for doubtful accounts receivable |
492 | 177 | ||||||
| Goodwill impairment |
3,095 | 2,062 | ||||||
| Depreciation and amortization |
25,694 | 25,595 | ||||||
| Amortization of deferred financing costs |
1,152 | 1,145 | ||||||
| Equity in loss of unconsolidated investments |
843 | 433 | ||||||
| Loss on disposal of property, plant & equipment |
1,384 | 947 | ||||||
| Founder warrant expense |
— | 1,381 | ||||||
| Stock compensation |
1,210 | 610 | ||||||
| Changes in operating assets and liabilities, net of effects of acquisitions: |
||||||||
| Accounts receivable |
(7,757 | ) | 3,037 | |||||
| Inventory |
(4,326 | ) | 4,944 | |||||
| Other current assets |
2,738 | 2,245 | ||||||
| Accounts payable |
4,263 | (12,926 | ) | |||||
| Accrued expenses and other current liabilities |
(2,001 | ) | (3,371 | ) | ||||
|
|
|
|
|
|||||
| Net cash provided by operating activities |
38,669 | 34,379 | ||||||
|
|
|
|
|
|||||
| Cash flows from investing activities |
||||||||
| Capital expenditures for property, plant and equipment, net of sales proceeds |
(39,149 | ) | (22,588 | ) | ||||
|
|
|
|
|
|||||
| Net cash used in investing activities |
(39,149 | ) | (22,588 | ) | ||||
|
|
|
|
|
|||||
| Cash flows from financing activities: |
||||||||
| Proceeds from credit facility |
89,916 | 53,040 | ||||||
| Payments on credit facility |
(84,916 | ) | (56,139 | ) | ||||
| Purchase and cancellation of Class A common stock |
(1,472 | ) | — | |||||
| Payment of cash dividends |
(522 | ) | — | |||||
| Purchase of public warrants |
— | (4,532 | ) | |||||
| Payment of deferred financing costs |
(1,572 | ) | (675 | ) | ||||
|
|
|
|
|
|||||
| Net cash provided by (used in) financing activities |
1,434 | (8,306 | ) | |||||
|
|
|
|
|
|||||
| Effects of exchange rate changes on cash and cash equivalents |
(127 | ) | (543 | ) | ||||
|
|
|
|
|
|||||
| Net increase in cash and cash equivalents |
827 | 2,942 | ||||||
|
|
|
|
|
|||||
| Cash and cash equivalents, beginning of period |
12,652 | 9,710 | ||||||
|
|
|
|
|
|||||
| Cash and cash equivalents, end of period |
$ | 13,479 | $ | 12,652 | ||||
|
|
|
|
|
|||||
| Supplemental disclosures of cash flow information: |
||||||||
| Cash paid for income taxes |
$ | 1,517 | $ | 2,880 | ||||
| Cash paid for interest |
3,610 | 4,140 | ||||||
| Non-cash financing and investing activities: |
||||||||
| Preferred dividends accrued |
$ | 4,458 | $ | 4,250 | ||||
| Series A Convertible Preferred stock issued to ED&F Man group |
10,096 | — | ||||||
| Common stock issued as dividend |
1,299 | — | ||||||
The accompanying notes are an integral part of these consolidated financial statements.
57
Table of Contents
NOTES TO CONSOLIDATED FINANCIAL STATEMENTS
1. DESCRIPTION OF BUSINESS
Westway Group, Inc., together with its wholly-owned subsidiaries (the “Company” or “we” or “us”), is a leading provider of bulk liquid storage and related value-added services, and a leading manufacturer and distributor of liquid animal feed supplements. The Company owns and/or operates an extensive global network of operating facilities providing bulk liquid storage and producing liquid feed supplements. The bulk liquid storage business is a global business with terminal locations at key port and terminal sites throughout North America and in Western Europe and Asia, offering storage to manufacturers and consumers of agricultural and industrial liquids. The liquid feed supplements business produces liquid animal feed supplements through blending liquid by-products and essential nutrients to form feed rations that help to maximize the genetic potential of livestock, and are sold directly to end users, primarily supplying the beef and dairy livestock industries.
2. BASIS OF PRESENTATION
The accompanying consolidated financial statements have been prepared in accordance with U.S. generally accepted accounting principles (“U.S. GAAP”) and pursuant to the rules of the U.S. Securities and Exchange Commission (“SEC”). The information furnished herein reflects all adjustments which are, in the opinion of management, necessary for a fair statement of the results for the periods reported. With the exception of certain adjustments associated with the acquisition of the acquired business, all such adjustments are, in the opinion of management, of a normal recurring nature. The consolidated financial statements include the consolidated results of operations and the consolidated assets and liabilities of the Company, including its wholly-owned and majority-owned subsidiaries. The Company eliminated all significant intercompany accounts and transactions among our wholly owned subsidiaries.
3. SUMMARY OF SIGNIFICANT ACCOUNTING POLICIES
Basis of Consolidation
The consolidated financial statements include the accounts of Westway Group, Inc. and its wholly-owned and majority-owned subsidiaries. All intercompany transactions have been eliminated in consolidation. Investments in which the Company has a 20% to 50% voting interest and where the Company exercises significant influence over the investee are accounted for using the equity method. The Company has a 51% ownership in Sunnyside Feed LLC (“Sunnyside”) and consolidates 100% of the assets and liabilities of Sunnyside in the balance sheets as well as 100% of the income or loss from operations. The other 49% interest of Sunnyside is shown separately, as a non-controlling interest, in the statements of operations and the balance sheets, respectively.
Use of Estimates
The preparation of the financial statements in conformity with U.S. GAAP requires management to make estimates and assumptions that affect the reported amounts of assets and liabilities and disclosure of contingent assets and liabilities at the date of the financial statements and the reported amounts of revenue and expenses during the reporting period. Actual results could differ from those estimates. Significant estimates include allowances for doubtful accounts, useful lives for depreciation and amortization, purchase price accounting valuations of the acquired business, asset impairments, valuation of goodwill, deferred taxes and tax contingency reserves, and other contingent liabilities.
Revenue Recognition
The Company recognizes revenue in accordance with SEC Staff Accounting Bulletin No. 104, “Revenue Recognition”, and U.S. GAAP, at prices fixed by contract or purchase orders and upon delivery of the service or product to the customer.
The Company generates revenue through contracts from its bulk liquid storage business by providing three primary types of services: fixed income, volume or throughput income, and income from ancillary services. Fixed income services generate revenue from storage services at each of the Company’s terminals and are based on a fixed fee per month for tank rental, input/output from storage tanks, or combination of both. The Company recognizes revenue from fixed income contracts in the period the service is rendered. Volume services generate revenue based
58
Table of Contents
on the volume of liquid entering or exiting at each terminal location and is based on tonnage. The Company recognizes revenue for volume services as the volumes are entered into or withdrawn from its storage facilities. Ancillary income services generate revenue from customer-specific storage requirements including energy, overtime, and other infrastructure costs. Revenue relating to ancillary income services is recognized based on terms stipulated in the customer contract and are recorded at the time the service is provided. Provisions for ancillary services may be included in fixed price storage services or in volume or throughput income services. Revenue is recorded for the services available under each contract as the services are provided.
The Company generates revenue from its liquid feed supplements business through sales of liquid and dry animal feed supplements. Revenue is recognized upon delivery. Shipping and handling costs are included within cost of sales in the statements of operations.
Revenue is recorded net of any discounts, volume rebates, and sales taxes.
Cash and Cash Equivalents
Cash and cash equivalents consist of all highly liquid investments in third party money market funds, deposits, and investments available for current use with an initial maturity of three months or less.
Investments
Investments in which the Company retains a 20% to 50% voting interest and exercises significant influence over the investee are accounted for using the equity method. The Company has evaluated its relationships with investees and has determined that these entities are not variable interest entities and therefore are not required to be consolidated in the financial statements. Accordingly, the Company’s proportional share of the respective investments earnings or losses is included in the caption “equity in earnings (loss) of unconsolidated subsidiary, net” in its statements of operations. The Company evaluates its investments for potential impairment indicators on an ongoing basis. This evaluation requires the exercise of judgment based upon the specific facts and circumstances of each investment. If impairment indicators exist, the Company will evaluate whether the impairment is other-than-temporary.
Accounts Receivable
The Company maintains an allowance for estimated potential credit losses on accounts receivable. Management reviews the composition of accounts receivable and analyzes historical bad debts, customer concentrations, customer credit worthiness, current economic trends, and changes in customer payment patterns to evaluate the adequacy of the allowance. Losses on accounts receivable are charged against the allowance when, in management’s judgment, further collection efforts would not result in a reasonable likelihood of collection. Consistent with industry practices, we generally require payment from our customers within 30 days. As of December 31, 2011 and 2010, our allowance for doubtful accounts was $421,000 and $292,000 respectively.
Inventories
Inventories, principally raw materials which include molasses and other supplements held for use and sale in the liquid feed supplements business, are stated at the lower of cost (weighted average) or market value. As inventory is usually not blended until ordered by the customer, work-in-progress and finished goods are generally not significant. Management compares the cost of inventories, as determined by the weighted average cost method, with the market value, and any allowance determined appropriate is made by writing down the inventories to their market value, if lower than cost. Costs include those costs incurred in bringing the inventories to their present location and condition.
Property, Plant & Equipment
Property, plant and equipment are stated at cost. Expenditures on maintenance and repairs are charged to earnings as incurred; additions, renewals and improvements are capitalized. When property, plant and equipment is retired or otherwise disposed of, the related cost and accumulated depreciation are removed from the respective accounts, and any gain or loss is included as a component of non-operating income. Additionally, when assets are decommissioned, the costs are charged to operating expense when incurred. Estimated useful lives are periodically reviewed and, when warranted, are updated. Land is not depreciated. Assets under construction are not depreciated until the facility is fully commissioned, and it is the Company’s policy to capitalize interest cost incurred on debt
59
Table of Contents
during the construction of major projects. Depreciation of property, plant and equipment is disclosed within total operating expenses using the straight-line method for all assets with estimated lives as follows:
| Buildings | 20-39 years | |
| Leasehold improvements | Shortest of the asset’s estimated useful life, the length of the lease, or 15 years | |
| Equipment, including tanks, and vehicles | 3 to 39 years |
Asset Retirement Obligations
The Company records the fair value of a liability for an asset retirement obligation in the period in which it is incurred. Asset retirement obligations represent the costs to remove tangible long-lived assets required by law, regulatory rule or contractual agreement. When the liability is initially recorded, the Company capitalizes the cost by increasing the carrying amount of the related long-lived asset, which is then depreciated over the useful life of the related asset. The liability is increased over time through income such that the liability will equate to the future cost to retire the long-lived asset at the expected retirement date. Upon settlement of the liability, the Company settles the obligation for its recorded amount or realizes a gain or loss upon settlement.
The Company has asset retirement obligations with respect to certain of our assets due to various legal obligations to clean and/or dispose of those assets at the time they are retired. However, these assets can be used for extended and indeterminate periods of time as long as they are leased, properly maintained and/or upgraded. It is the Company’s practice and current intent to maintain such assets and continue making improvements to the assets based on technological advances. As a result, the Company believes that these assets have indeterminate lives for purposes of estimating asset retirement obligations, because dates or ranges of dates upon which the Company would retire these assets cannot reasonably be estimated at this time. Accordingly, the Company generally has not recorded an asset retirement obligation, or corresponding asset, relating to this type of obligation because the future dismantlement and removal dates of long-lived assets, and the amount of any associated costs, are indeterminable. When a date or range of dates can reasonably be estimated for the retirement of any asset, the Company estimates the cost of performing the retirement activities and records a liability for the fair value of that cost using established present value techniques.
Goodwill and Intangible Assets
Goodwill represents the excess of the amount we paid to acquire a company over the estimated fair value of tangible assets and identifiable intangible assets acquired, less liabilities assumed. The costs of intangible assets with determinable useful lives are amortized over their estimated useful lives.
Impairment of Long-Lived Assets, Goodwill, and Other Intangible Assets
Long-Lived Assets
Long-lived assets are reviewed for impairment whenever events or changes in circumstances indicate that their carrying amount may not be recoverable in accordance with U.S. GAAP. An impairment loss would be determined when estimated undiscounted future pre-tax cash flows from the use of the asset or group of assets are less than its carrying amount. In estimating future undiscounted cash flows, the Company uses historical cash flows, the expected growth rate of revenue and expenses, the expected effect of capital expenditures, and the estimated remaining useful life of the asset, holding periods, and future market and economic conditions. Measurement of an impairment loss is based on the excess of the carrying amount of the asset or group of assets over the long-lived asset fair value.
Goodwill and Other Intangible Assets
Goodwill and certain indefinite lived intangible assets are tested for impairment at least annually or when there is a triggering event that indicates impairment. Goodwill is considered impaired when the carrying amount of a reporting unit’s goodwill exceeds its implied fair value, as determined under a two-step approach. The first step is to determine the estimated fair value of each reporting unit with goodwill. The reporting units of the Company, for purposes of the impairment test, are those components of operating segments for which discrete financial information is available and segment management regularly reviews the operating results of that component. Components are combined into a single reporting unit when they have similar economic characteristics. The Company determined that it was appropriate to use 21 reporting units, consisting of one reporting unit for all of the liquid feed supplements sites and 20 reporting units for the bulk liquid storage sites. The Company’s five bulk liquid storage operating facilities located in the United Kingdom have been grouped into a single reporting unit.
60
Table of Contents
The Company estimates the fair value of each reporting unit based on an income approach, which estimates the fair value of the reporting units based on projected discounted cash flows, and a market approach, which estimates the fair value of our reporting units based on comparable market multiples. If the recorded net assets of the reporting unit are less than the reporting unit’s estimated fair value, then no impairment is indicated. Alternatively, if the recorded net assets of the reporting unit exceed its estimated fair value, then goodwill is assumed to be impaired and a second step is performed. In the second step, the implied fair value of goodwill is determined by deducting the estimated fair value of all tangible and identifiable intangible net assets of the reporting unit from the estimated fair value of the reporting unit. If the recorded amount of goodwill exceeds this implied fair value, an impairment charge is recorded for the excess.
Business Combinations
The Company accounts for business combinations under the provisions of U.S. GAAP that provide companies with the principles and requirements on how an acquirer recognizes and measures in its financial statements the identifiable assets acquired, liabilities assumed, and any noncontrolling interest in the acquiree, as well as the recognition and measurement of goodwill acquired in a business combination. U.S. GAAP also requires certain disclosures to enable users of the financial statements to evaluate the nature and financial effects of a business combination. Acquisition costs associated with a business combination will generally be expensed as incurred.
Our acquisitions of business resulting in our control are accounted for under the purchase method of accounting. The amounts assigned to the identifiable assets acquired and liabilities assumed in connection with acquisitions are based on estimated fair values as of the date of the acquisition, with the remainder, if any, recorded as goodwill. The fair values are determined by our management, taking into consideration information supplied by the management of the acquired business and other relevant information. Such information includes valuations supplied by independent appraisals for significant business combinations. The determination of fair value requires significant judgment by management. In accordance with generally accepted accounting principles, the final allocation is expected to be made within one year of the acquisition.
Fair Value Measurements
U.S. GAAP establishes a framework for measuring fair value and mandates disclosures about fair value measurements. U.S. GAAP defines fair value as the price that would be received to sell an asset or paid to transfer a liability in an orderly transaction between market participants. A fair value measurement assumes that the transaction to sell the asset or transfer the liability occurs in the principal market for the asset or liability or, in the absence of a principal market, the most advantageous market for the asset or liability. Under U.S. GAAP, the price in the principal (or most advantageous) market used to measure the fair value of the asset or liability is not adjusted for transaction costs. An orderly transaction is a transaction that assumes exposure to the market for a period prior to the measurement date to allow for marketing activities that are usual and customary for transactions involving such assets and liabilities; it is not a forced transaction. Market participants are buyers and sellers in the principal market that are (i) independent, (ii) knowledgeable, and (iii) able and willing to complete a transaction.
61
Table of Contents
U.S. GAAP requires the use of valuation techniques that are consistent with one or more of the market approach, the income approach, or the cost approach. The market approach uses prices and other relevant information generated by market transactions involving identical or comparable assets and liabilities. The income approach uses valuation techniques to convert future projected amounts, such as cash flows or earnings, to a single present value on a discounted basis. The cost approach is based on the amount that currently would be required to replace the service capacity of an asset (replacement cost). Valuation techniques should be consistently applied. Inputs to valuation techniques refer to the assumptions that market participants would use in pricing the asset or liability. Inputs may be observable, meaning those that reflect the assumptions market participants would use in pricing the asset or liability developed based on market data obtained from independent sources, or unobservable, meaning those that reflect the reporting entity’s own assumptions about the assumptions market participants would use in pricing the asset or liability developed based on the best information available in the circumstances. In that regard, U.S. GAAP establishes a fair value hierarchy for valuation inputs that gives the highest priority to quoted prices in active markets for identical assets or liabilities and the lowest priority to unobservable inputs. The fair value hierarchy is as follows:
Level 1 Inputs—Unadjusted quoted prices in active markets for identical assets or liabilities that the reporting entity has the ability to access at the measurement date.
Level 2 Inputs—Inputs other than quoted prices included in Level 1 that are observable for the asset or liability, either directly or indirectly. These might include quoted prices for similar assets or liabilities in active markets, quoted prices for identical or similar assets or liabilities in markets that are not active, inputs other than quoted prices that are observable for the asset or liability (including interest rates, volatilities, prepayment speeds, credit risks) or inputs that are derived principally from or corroborated by market data by correlation or other means.
Level 3 Inputs—Unobservable inputs for determining the fair values of assets or liabilities that reflect an entity’s own assumptions about the assumptions that market participants would use in pricing the assets or liabilities.
These fair value principles of U.S. GAAP are utilized in the accounting for acquired businesses.
Fair Value of Financial Instruments
The Company measures the fair value of financial instruments in accordance with U.S. GAAP. The carrying value of cash, accounts receivable, accounts payable, and accrued liabilities approximates their fair values because of their short term to maturity. The fair value of the Company’s other liabilities, recalculated at current interest rates, approximates their carrying value.
Debt Issuance Costs
Deferred financing costs consist of fees paid by the Company as part of the establishment, exchange and/or modification of the Company’s long-term credit facility. Such costs are being amortized using the straight-line method over the term of the facility.
Defined Contribution and Other Benefit Plans
The Company accounts for the cost of its defined contribution plans on an accrual basis in accordance with U.S. GAAP. The cost to the Company under defined contribution plans for the year ended December 31, 2011 was $2.8 million and $2.9 million for the year ended December 31, 2010.
Stock-Based Compensation
The Company calculates stock-based compensation expense utilizing fair value-based methodologies and recognizes the expense over the vesting period of such awards. Compensation expense recorded for awards that do not vest is reversed in the period that it is determined that the award will not vest.
Income taxes
U.S. GAAP requires an asset and liability approach to financial accounting and reporting for income taxes. Deferred income tax assets and liabilities are computed for differences between the financial statement and tax bases of assets and liabilities that will result in future taxable or deductible amounts, based on enacted tax laws and rates applicable to the periods in which the differences are expected to affect taxable income. Valuation allowances are
62
Table of Contents
established, when necessary, to reduce deferred tax assets to the amount expected to be realized. The Company considers many factors when assessing the likelihood of future realization including its recent cumulative earnings experience by taxing jurisdiction, expectations of future taxable income, the carryforward periods available for tax reporting purposes and other relevant factors.
The Company complies with the provisions of U.S. GAAP that prescribes a recognition threshold and a measurement attribute for the financial statement recognition and measurement of tax positions taken or expected to be taken in a tax return. For those benefits to be recognized, a tax position must be more-likely-than-not to be sustained upon examination by taxing authorities. There were no unrecognized tax benefits as of December 31, 2011 and 2010. The Company recognizes accrued interest and penalties related to unrecognized tax benefits as income tax expense. No amounts were accrued for the payment of interest and penalties at December 31, 2011and 2010.
Foreign Currency Translation and Transactions
The consolidated financial statements of the Company have been prepared in U.S. dollars (“dollars”), as the dollar is the Company’s reporting currency. Since the Company’s operations are funded in U.S. dollars and a substantial portion of its costs is incurred in U.S. dollars, management believes that the dollar is the primary currency of the economic environment in which the Company operates.
In accordance with U.S. GAAP, the assets, liabilities and results of operations of certain Company foreign subsidiaries are measured using their functional currency which is the currency of the foreign economic environment in which they operate. Upon consolidating these subsidiaries with the Company, their assets and liabilities are translated to U.S. dollars at currency exchange rates as of the balance sheet date, revenue and expenses are translated at the weighted average currency exchange rate for the applicable reporting period, and stockholder’s equity accounts are translated at historical exchange rates during the applicable reporting periods. Translation adjustments resulting from the process of translating these subsidiaries’ financial statements are reported in other comprehensive income (loss) in the statements of stockholders’ equity and in the statements of comprehensive income. Upon disposal or liquidation of a foreign subsidiary, these cumulative translation adjustments are recognized as income or expense.
Certain Company subsidiaries enter into transactions denominated in currencies other than their functional currency. Changes in currency exchange rates between the subsidiary’s functional currency and the currency in which a transaction is denominated are recognized in the statement of operations in the period in which the currency rates change.
Comprehensive Income
U.S. GAAP requires that comprehensive income, which is the total of net income and all other non-owner changes in capital, be displayed in the financial statements. The components of the Company’s comprehensive income as presented in the statements of stockholders’ equity and in the statements of comprehensive income include net income and unrealized gains and losses from foreign currency translation.
Segment Reporting
U.S. GAAP requires a company to report financial and descriptive information about its specified operating segments. Operating segments are components of an enterprise for which separate financial information is available and is evaluated regularly by the chief operating decision maker in deciding how to allocate resources and in assessing performance. The Company has determined that it has two reportable operating segments—Bulk Liquid Storage and Liquid Feed Supplements, and one non-operating segment—Corporate. The Company does not allocate corporate administrative and general expenses, interest income, or interest expense to the two operating segments.
Commitments and Contingencies
The Company leases land, office space, and equipment under non-cancelable operating leases with various expiration dates. The Company is responsible for maintenance costs and property taxes on certain of the operating leases. The Company has not entered into any capital leases as defined by U.S. GAAP.
63
Table of Contents
Earnings per share
The Company complies with the accounting and disclosure provision of U.S. GAAP that requires dual presentation of basic and diluted income per common share for all periods presented and uses the two-class method to calculate diluted earnings per share. Basic earnings per share represents income available to common shareholders divided by the weighted average number of common shares outstanding during the period. Diluted earnings per share reflect additional common shares that would have been outstanding if dilutive potential common shares had been issued, as well as any adjustment to income that would result from the assumed issuance. Potential common shares that may be issued by the Company relate to outstanding preferred stock, unissued restricted stock, and warrants and are determined using the two-class method. See Note 7 for additional information on the Company’s calculation of earnings per share.
Concentration of credit risk
The Company is exposed to concentrations of credit risk associated with its cash and cash equivalents. The Company minimizes its credit risk relating to these positions by primarily conducting business with large, well-established financial institutions. The Company has not experienced losses on these accounts, and management believes the Company is not exposed to significant risks on such accounts.
The Company is also exposed to concentrations of credit risk relating to its receivables due from customers in the bulk liquid storage and liquid feed supplement industries. The Company does not generally require collateral or other security to support its outstanding receivables. The Company minimizes its credit risk relating to receivables by performing ongoing credit evaluations and, to date, credit losses have not been material. The Company provides storage of liquid products to the ED&F Man group, an affiliated customer that accounted for 17% of total bulk liquid storage revenue for the year ended December 31, 2011. At December 31, 2011, 4% of the Company’s accounts receivables were due from the ED&F Man group. See Related-Party Transactions (Note 6) for further discussions of affiliate transactions.
Subsequent Events
In accordance with U.S. GAAP, the Company evaluates events or transactions that occur during the period after the balance sheet date for potential recognition or disclosure in the financial statements.
Recent Accounting Developments
Presentation of Comprehensive Income
In June 2011, the FASB issued updated guidance to increase the prominence of items reported in other comprehensive income by eliminating the option of presenting components of comprehensive income as part of the statement of changes in shareholders’ equity. The updated guidance requires that all nonowner changes in shareholders’ equity be presented either as a single continuous statement of comprehensive income or in two separate but consecutive statements. The updated guidance is to be applied retrospectively and is effective for the quarter ending March 31, 2012. The Company has adopted this guidance for the year ended December 31, 2011; it did it not have any impact on the Company’s results of operations, financial position or liquidity.
Intangibles—Goodwill and Other
In September 2011, the FASB issued updated guidance that modifies the manner in which the two-step impairment test of goodwill is applied. Under the updated guidance, an entity may assess qualitative factors (such as changes in management, key personnel, strategy, key technology, or customers) that may impact a reporting unit’s fair value and to determine whether it is more likely than not that the fair value of a reporting unit is less than its carrying value, including goodwill. Unless an entity determines that it is not more likely than not, it must perform an impairment test.
The first step of the impairment test involves comparing the estimated fair value of a reporting unit to its carrying value, including goodwill. If the carrying value of a reporting unit exceeds the estimated fair value, a second step must be performed to measure the amount of goodwill impairment, if any. In the second step, the
64
Table of Contents
implied fair value of the reporting unit’s goodwill is determined in the same manner as goodwill is measured in a usiness combination (i.e., by measuring the fair value of the reporting unit’s assets, liabilities and unrecognized intangible assets and determining the remaining amount ascribed to goodwill), and the amount of the implied goodwill is compared to the carrying amount of the goodwill. If the carrying value of the reporting unit goodwill exceeds the implied fair value of that goodwill, an impairment loss is recognized in an amount equal to the excess.
The updated guidance is effective for the quarter ending March 31, 2012. The adoption of this guidance is not expected to have a material effect on the Company’s results of operations, financial position or liquidity.
4. ACQUISITIONS
Bulk Liquid Storage and Liquid Feed Supplements Businesses
On May 28, 2009, the Company completed the acquisition of the bulk liquid storage and liquid feed supplements businesses of the ED&F Man group by effecting mergers of the two principal subsidiaries of ED&F Man engaged in the bulk liquid storage and liquid feed supplements businesses (Westway Terminal Company, Inc. and Westway Feed Products, Inc.) into two of the Company’s wholly-owned subsidiaries (now named Westway Terminal Company LLC and Westway Feed Products LLC) and by purchasing the equity interests of the other subsidiaries of ED&F Man engaged in the bulk liquid storage or liquid feed supplements businesses. The total consideration for this acquisition totaled $345.2 million. Included in this total as contingent consideration, was 12.2 million shares of Series A Convertible Preferred Stock totaling $69.9 million which was placed into escrow and will be released to a subsidiary of ED&F Man upon the achievement of certain earnings or share price targets. The Company finalized the purchase price allocation for this acquisition in 2010.
Southside River-Rail Inc.
On October 15, 2009, the Company, through its wholly-owned subsidiary Westway Terminal Cincinnati LLC, completed the acquisition of the storage assets and property of Southside River-Rail Terminal, Inc. located in Cincinnati, Ohio. The purchase price for this acquisition was approximately $19.9 million in cash. The Company finalized the purchase price allocation for this acquisition in 2010.
5. GOODWILL AND OTHER INTANGIBLE ASSETS
Goodwill
The Company performed an annual goodwill impairment assessment as of October 1, 2011 using the two-step process required by ASC 350. We determined that it was appropriate to use 21 reporting units, consisting of one reporting unit for our liquid feed supplements business and 20 reporting units principally related to our bulk liquid storage sites. The determination of reporting units is based on whether discrete financial information is available which management regularly reviews, along with aggregation criteria based on geographic location, sizes, and economic characteristics. Our five bulk liquid storage operating facilities located in the United Kingdom have been grouped into a single reporting unit due to their similar economic characteristics.
As of October 1, 2011, the Company’s 21 reporting units had an aggregate goodwill balance of $88.7 million prior to our annual impairment assessment. The Company performed its annual goodwill impairment assessment as of October 1, 2011 using equal weighting of the income and market approaches to determine the fair value of the reporting units. The Company performed “Step 1” and compared the weighted average fair value of each reporting unit of accounting to its carrying value as of October 1, 2011. Step 1 indicated that out of the 21 reporting units, three reporting units, our Gdynia, Poland, our Esbjerg, Denmark, and our Riverdale, IL sites, had a carrying value which exceeded their fair value. Accordingly, the Company performed “Step 2” in relation to these three reporting units. The second step determined the implied fair value of goodwill of these three reporting units by comparing the fair value of each reporting unit to the aggregate fair value of all the assets and liabilities of the reporting unit. In the “Step 2” impairment analysis, the Company compared the implied fair value of goodwill in these three reporting units to their respective carrying values. The Company determined that the implied fair value of goodwill of each of these three reporting units was zero and therefore recorded a non-cash impairment charge to our goodwill of approximately $3.1 million, which was the entire amount of goodwill that had been allocated to these three reporting units. The Company recorded this impairment as a separate line item in total operating expenses on the Consolidated Statements of Operations.
65
Table of Contents
The impairment of the goodwill at these three reporting units, which consists of 10 storage tanks in Gdynia, Poland with an aggregate capacity of 7.9 million gallons, 12 storage tanks in Esbjerg, Denmark with an aggregate capacity of 4.8 million gallons, and 16 storage tanks in Riverdale, IL with an aggregate capacity of 5.7 million gallons, was primarily due to reductions in our future revenue projections for these facilities as a result of local market conditions and changes to assumptions about future conditions at these facilities such as rates, utilization, and product mixes. No other goodwill adjustments were necessary for our other 18 reporting units in 2011. In 2010, we recorded a non-cash impairment charge to goodwill of $2.1 million relating to our Dublin, Ireland facility.
The following table reflects goodwill activity for fiscal years 2011 and 2010:
| December 31, 2009 |
$ | 89,970 | ||
|
|
|
|||
| Currency translation |
(102 | ) | ||
| Purchase price accounting adjustment |
1,411 | |||
| Goodwill impairment |
(2,062 | ) | ||
|
|
|
|||
| December 31, 2010 |
$ | 89,217 | ||
|
|
|
|||
| Currency translation |
(239 | ) | ||
| Goodwill impairment |
(3,095 | ) | ||
|
|
|
|||
| December 31, 2011 |
$ | 85,883 | ||
|
|
|
Other Intangible Assets
Other intangible assets consist of the following (in thousands):
| December 31, | ||||||||
| 2011 | 2010 | |||||||
| Liquid feed supplements tradename |
$ | 7,836 | $ | 7,836 | ||||
| Non-compete agreements |
612 | 596 | ||||||
|
|
|
|
|
|||||
| Other intangible assets |
8,448 | 8,432 | ||||||
| Less accumulated amortization |
(536 | ) | (211 | ) | ||||
|
|
|
|
|
|||||
| Other intangible assets, net |
$ | 7,912 | $ | 8,221 | ||||
The liquid feed supplements tradename has an indefinite useful life and is not subject to amortization. However, we evaluate the remaining useful life of this intangible asset and test for impairment periodically as required. The non-compete agreements have finite useful lives and we amortize these agreements using the straight-line method over their respective useful lives. The useful lives for our non-compete agreements are based on their contractual terms.
6. RELATED-PARTY TRANSACTIONS
Prior to the business combination in May 2009, as a consequence of being owned by ED&F Man, the acquired business maintained a commercial relationship with the ED&F Man group. After the business combination, this relationship has continued, with the Company acting as a supplier of storage services to the ED&F Man group and the ED&F Man group acting as a provider of molasses requirements to the liquid feed supplements business.
During each of the financial periods presented, the Company provided storage of liquid products to the ED&F Man group. For the years ended December 31, 2011 and 2010, bulk liquid storage net revenue earned from the ED&F Man group by the Company was $15.0 million and $12.2 million, respectively, representing 17% and 14% of total bulk liquid storage net revenue.
In addition, during each of the financial periods presented, the Company acquired molasses from the ED&F Man group for our liquid feed supplements business. For the years ended December 31, 2011 and 2010, our costs of purchases from the ED&F Man group were $87.6 million and $66.4 million respectively, representing 33% and 32% of total liquid feed supplement cost of sales. These costs are included in cost of sales in the consolidated statements of income.
66
Table of Contents
As a consequence of these relationships, the consolidated financial statements of the Company include amounts owing from the ED&F Man group and amounts payable to the ED&F Man group in respect of the bulk liquid storage and liquid feed supplements businesses. At December 31, 2011 and 2010, 4% and 7% of the Company’s trade accounts receivables were due from the ED&F Man group respectively. At December 31, 2011 and 2010, 35% and 53% of the Company’s trade accounts payables were due to the ED&F Man group respectively.
In connection with transitional treasury management services provided by the ED&F Man group, at December 31, 2010, the Company had net deposits of $4.7 million, in cash from the Company’s international subsidiaries, held with ED&F Man Treasury, bearing interest at the one-month LIBOR rate. This agreement was terminated during the first half of 2011 after transitioning these treasury management services to JP Morgan Chase Bank.
The Company also incurred service charges in respect of directly attributable divisional and central ED&F Man corporate costs in each financial period for services rendered to the Company’s bulk liquid storage and liquid feed supplements businesses. The Company has recharged the ED&F Man group in respect to transitional services provided, consisting of human resources, information technology, accounting administration, invoicing, and other services. This shared service agreement was terminated in the first half of 2010.
The Company has a participation agreement with a captive insurance company owned by the ED&F Man group. The captive underwrites the self-insured portion of certain risks insured by the Company through the captive and charges a premium for the first layer of claims exposure. Under this agreement all of the Company’s transactions are partitioned into a separate operational cell from the ED&F Man group’s business.
Pursuant to a series of waiver agreements between the Company and Agman, Agman agreed to accept, in lieu and satisfaction of the entire $10.1 million of dividends accruing but unpaid on Agman’s shares of Series A Convertible Preferred Stock from their original issuance on May 28, 2009 through September 30, 2011, a total of 1,838,044 additional shares of our Series A Convertible Preferred Stock.
As part of the quarterly dividend paid on October 24, 2011 which was payable in cash or common stock at the election of each stocholder, the Company paid to Agman a dividend valued at $1.8 million, comprised of cash totaling $704,297 (of which $510,944 was deposited into escrow) and 274,807 shares of Class B Common Stock.
In connection with the 2009 business combination, the Company and Agman entered into a stockholder’s agreement granting to Agman certain rights to information, rights to approve a variety of fundamental corporate actions and other transactions generally outside the ordinary course of business, and the right to approve the appointment, removal, compensation, and benefits of the Company’s CEO.
In April 2010, the Company began a three-year, triple-net lease of its Port of Inchon, South Korea terminal to the ED&F Man group, which includes an option to purchase the terminal.
7. EARNINGS (LOSS) PER SHARE
The Company calculated earnings (loss) per common share in accordance with U.S. GAAP under the two-class method. The two-class method is an earnings allocation formula that treats a participating security as having rights to earnings that otherwise would have been available to common stockholders. This method determines basic earnings (loss) per share for common stock and participating securities by adjusting for dividends declared (or accumulated) and participation rights in undistributed earnings. The Company’s participating securities are the Series A Convertible Preferred Stock and restricted stock awards. Restricted stock awards are considered participating securities because they receive non-forfeitable rights to dividends before vesting at the same rate as common stock.
The numerator was adjusted for dividends declared on participating securities, as well as for the undistributed earnings (loss) allocated to participating securities, for the twelve months ended December 31, 2011 and 2010, in order to calculate net income (loss) applicable to common stockholders.
In calculating the basic weighted average number of common shares outstanding, the Series A Convertible Preferred Stock and restricted stock awards were excluded, as they are participating securities and not included in calculating the earnings (loss) per common share under the two-class method. In calculating the diluted weighted average number of common shares outstanding, the Company did not include any additional securities related to common stock, as this would be anti-dilutive. The Company’s 5,214,286 founder warrants with an exercise price of
67
Table of Contents
$5.00 could potentially dilute earnings per common share in the future. They have not been added to the diluted weighted average number of common shares for the twelve months ended December 31, 2011 and 2010 since the average market price of our common stock during these periods was below this price. Additionally, the founder warrants could have a potentially less dilutive effect because they have a cashless exercise provision.
The calculation of basic and diluted earnings (loss) per common share is as follows (in thousands except share amounts):
| Year Ended December 31, | ||||||||
| 2011 | 2010 | |||||||
| Numerator |
||||||||
| Net income attributable to Westway Group, Inc. |
$ | 4,940 | $ | 5,678 | ||||
| Preferred dividends accrued |
(4,458 | ) | (4,250 | ) | ||||
| Dividends to participating securities (1) |
(2,621 | ) | — | |||||
| Undistributed (earnings) loss allocated to participating securities (2) |
44 | (768 | ) | |||||
|
|
|
|
|
|||||
| Net income (loss) applicable to common stockholders - Basic & Diluted |
(2,095 | ) | 660 | |||||
|
|
|
|
|
|||||
| Denominator |
||||||||
|
|
|
|
|
|||||
| Weighted average number of common shares outstanding - Basic & Diluted |
26,521,991 | 26,601,736 | ||||||
|
|
|
|
|
|||||
| Basic and Diluted Earnings (Loss) Per Common Share |
||||||||
| Earnings (loss) per common share—Basic |
$ | (0.08 | ) | $ | 0.02 | |||
| Earnings (loss) per common share—Diluted |
$ | (0.08 | ) | $ | 0.02 | |||
| Dividends declared per share |
$ | 0.08 | $ | — | ||||
| (1) | Participating dividends related to the Series A Convertible Preferred Stock and the unvested restricted shares were $2,604,000 and $17,000 respectively for the year ending December 31, 2011, which amounts to $2,621,000. |
| (2) | Undistributed losses allocated to the unvested restricted shares for the year ended December 31, 2011 were $44,000. Undistributed earnings allocated to the unvested restricted shares for the year ended December 31, 2010 were approximately $2,000. Undistributed earnings allocated to the Series A Convertible Preferred Stock for the year ended December 31, 2010 were $766,000. This amounts to undistributed earnings allocated to participating securities of $768,000 for the year ended December 31, 2010. |
8. INVESTMENTS
Investment in unconsolidated subsidiary
The acquired business had formed, without initial investment, Champion Liquid Feeds (“CLF”), a 50:50 joint venture with a dry feed distributor in Australia. During 2010, Gardner Smith (Holdings) Pty Ltd acquired the prior joint venture partner’s 50% ownership in CLF. The Company uses the equity method to account for its share in CLF.
Activity in the investment in unconsolidated subsidiary account is as follows:
| Year ended December 31, 2011 |
Year ended December 31, 2010 |
|||||||
| At start of year |
$ | 4,277 | $ | 4,368 | ||||
| Foreign exchange |
15 | 528 | ||||||
| Loss for the year |
(843 | ) | (619 | ) | ||||
|
|
|
|
|
|||||
| At end of year |
$ | 3,449 | $ | 4,277 | ||||
|
|
|
|
|
|||||
68
Table of Contents
9. PROPERTY, PLANT AND EQUIPMENT, NET
The bulk liquid storage segment’s property, plant, and equipment consists principally of storage tanks, related equipment, and leasehold improvements. The liquid feed supplements segment’s property, plant, and equipment consists principally of liquid feed tanks, related equipment, and buildings. The Company’s property, plant and equipment balances net of accumulated depreciation were as follows (in thousands):
| December 31, 2011 |
December 31, 2010 |
|||||||
| Land |
$ | 12,749 | $ | 12,749 | ||||
| Property, plant and equipment—Bulk liquid storage |
293,258 | 272,208 | ||||||
| Property, plant and equipment—Liquid feed supplements |
60,950 | 55,168 | ||||||
| Property, plant and equipment—Corporate |
1,473 | 1,099 | ||||||
|
|
|
|
|
|||||
| 368,430 | 341,224 | |||||||
| Less: accumulated depreciation |
(60,174 | ) | (36,204 | ) | ||||
| Assets under construction, including capitalized interest of $319 and $52 for 2011 and 2010, respectively |
15,202 | 8,471 | ||||||
|
|
|
|
|
|||||
| Property, plant and equipment, net |
$ | 323,458 | $ | 313,491 | ||||
|
|
|
|
|
|||||
Depreciation expense was $25.2 million and $25.4 million for the years ended December 31, 2011 and December 31, 2010 respectively.
10. INVENTORIES
A summary of inventories were as follows (in thousands):
| December 31, 2011 |
December 31, 2010 |
|||||||
| Finished goods |
$ | 2,580 | $ | 1,089 | ||||
| Raw materials |
16,458 | 13,710 | ||||||
| Other |
751 | 664 | ||||||
|
|
|
|
|
|||||
| Total inventories |
$ | 19,789 | $ | 15,463 | ||||
|
|
|
|
|
|||||
Other inventory consists of packaging and other operating supplies.
11. BORROWINGS UNDER CREDIT FACILITY
Bank Syndicate Credit Facility
On July 6, 2011, the Company and its bank syndicate amended various terms of the Company’s existing $200 million credit facility. The modifications included, among other items, the extension of the maturity date to July 6, 2015, the reduction of the interest rate and commitment fees payable, the relaxation of certain key financial covenants, and the addition of a new $50 million accordion feature to the current facility. Up to $10 million of the bank credit facility remains available for the issuance of letters of credit and the Company may still make short-term borrowings of up to $10 million under a “swingline” facility.
The interest rate for each loan is, at our option, either (a) LIBOR, adjusted by the statutory reserve rate, plus 2.25% to 3.0% per year, or (b) 1.25% to 2.00% per year plus the highest of (i) JP Morgan Chase’s public prime rate, (ii) the federal funds effective rate plus 0.5%, and (iii) the one-month LIBOR adjusted by the statutory reserve rate plus 1.0%. The precise rate varies based on the consolidated total leverage ratio at the end of each fiscal quarter. We must pay a commitment fee of 0.50% per year on the average daily unused amount of the credit facility. The revolving credit facility is secured by (a) guarantees by all of our domestic wholly-owned subsidiaries (one of which owns all our foreign subsidiaries); (b) first priority liens on substantially all our domestic personal property; (c) pledge of 100% of the equity of all our domestic wholly-owned subsidiaries and 65% of the equity of our foreign wholly-owned subsidiary that owns all our other foreign subsidiaries; and (d) first mortgage liens on our fee or leasehold interests in 7 facilities.
As of December 31, 2011, the total balance outstanding on the credit facility was $93.5 million.
69
Table of Contents
Financial Covenants
Financial covenants in the credit facility required the Company to have a maximum consolidated total leverage ratio and a minimum consolidated interest coverage ratio. Other covenants include restrictions on our ability to, among other things, pay dividends (other than in accordance with our current dividend policy). The credit facility also limits the declaration and payment of dividends on our common stock to no more than 50% of the preceding year’s Net Income (as defined in our amended credit facility). Failure to meet these or any of the other covenants could result in additional costs and fees to amend the credit facility or could result in termination of the credit facility.
As of December 31, 2011, we were in compliance with all covenants and financial ratio requirements related to our credit facility.
Deferred Financing Costs
We capitalize financing costs we incur related to implementing and amending our debt. We record these costs as other assets on our Consolidated Balance Sheets and amortize them over the contractual life of the related debt. The changes in deferred financing costs are as follows (in thousands):
| Year Ended December 31, 2011 |
Year Ended December 31, 2010 |
|||||||
| Balance at beginning of year |
$ | 2,560 | $ | 3,010 | ||||
| Financing costs deferred |
1,585 | 695 | ||||||
| Less accumulated amortization |
(1,152 | ) | (1,145 | ) | ||||
|
|
|
|
|
|||||
| Balance at end of year |
$ | 2,993 | $ | 2,560 | ||||
|
|
|
|
|
|||||
Mortgages
On February 10, 2010, the Company entered into an aggregate of seven mortgages in compliance with the bank syndicate credit facility. The Company entered into seven first priority mortgage liens on its fee or leasehold interests, as applicable, in certain terminal and feed facilities. The facilities include two terminal facilities and one feed facility in Houston, Texas; a terminal facility and a feed facility in Cincinnati, Ohio; and a terminal facility in Grays Harbor, Aberdeen, Washington.
12. INCOME TAXES
The provision for income taxes consisted of provisions for federal, state and foreign income taxes. The Company operates globally with operations in various locations outside the United States. Accordingly, the effective income tax rate is a composite rate reflecting the earnings in the various locations and the applicable rates.
Income before income taxes and equity losses is attributable to the following jurisdictions (in thousands):
| Year Ended December 31, | ||||||||
| 2011 | 2010 | |||||||
| United States |
$ | 10,583 | $ | 5,313 | ||||
| Foreign |
2,584 | 4,445 | ||||||
|
|
|
|
|
|||||
| Total |
$ | 13,167 | $ | 9,758 | ||||
|
|
|
|
|
|||||
The benefit (provision) for income taxes consisted of the following (in thousands):
| Year Ended December 31, | ||||||||
| 2011 | 2010 | |||||||
| Current benefit (provision) |
||||||||
| Federal |
$ | — | $ | — | ||||
| State and local |
(289 | ) | (128 | ) | ||||
| Foreign |
(403 | ) | (1,095 | ) | ||||
|
|
|
|
|
|||||
| Total current |
$ | (692 | ) | $ | (1,223 | ) | ||
| Deferred benefit (provision) |
||||||||
| Federal |
(6,455 | ) | (2,292 | ) | ||||
| State and local |
(689 | ) | (113 | ) | ||||
| Foreign |
325 | (22 | ) | |||||
|
|
|
|
|
|||||
| Total deferred |
(6,819 | ) | (2,427 | ) | ||||
|
|
|
|
|
|||||
| Income tax benefit (provision) |
$ | (7,511 | ) | $ | (3,650 | ) | ||
|
|
|
|
|
|||||
| Effective tax rate benefit (provision) |
(57 | %) | (37 | %) | ||||
70
Table of Contents
The actual income tax provision differs from the amounts computed by applying the U.S. federal statutory rate of 34% for both 2011 and 2010 to income before income taxes and equity losses as follows:
| Year ended December 31, | ||||||||
| 2011 | 2010 | |||||||
| Income tax provision applying U.S. federal statutory rate |
$ | (4,476 | ) | $ | (3,318 | ) | ||
| (Increase)/decrease in provision resulting from: |
||||||||
| Foreign income taxed at different rates |
1,195 | 1,246 | ||||||
| Valuation allowance for certain losses and credits |
(77 | ) | (222 | ) | ||||
| Goodwill impairment charge not deductible for tax purposes |
(1,052 | ) | (701 | ) | ||||
| Expenses which are not deductible for tax purposes |
(168 | ) | (137 | ) | ||||
| State income tax, net of federal |
(252 | ) | (160 | ) | ||||
| U.S. tax on foreign earnings |
(1,461 | ) | (355 | ) | ||||
| Change in tax rates |
(306 | ) | — | |||||
| Other |
(914 | ) | (3 | ) | ||||
|
|
|
|
|
|||||
| Actual income tax provision |
$ | (7,511 | ) | $ | (3,650 | ) | ||
|
|
|
|
|
|||||
The difference in the actual income tax provision from the federal statutory amount in 2011 was principally due to residual U.S. taxes applicable to the distribution of foreign earnings which were subject to tax rates lower than the U.S. tax rate, combined with goodwill impairment charges that were not deductible for tax purposes. The difference in the actual income tax provision from the federal statutory amount in 2010 was principally due to goodwill impairment charges that were not deductible for tax purposes.
We made payments related to taxes totaling $1.5 million in 2011 and $2.9 million in 2010.
The net deferred tax liability consists of the following deferred tax liabilities:
| December 31, | ||||||||
| 2011 | 2010 | |||||||
| Property and equipment |
$ | (75,193 | ) | $ | (68,449 | ) | ||
| Goodwill |
(1,906 | ) | (1,702 | ) | ||||
| Other |
(262 | ) | (242 | ) | ||||
|
|
|
|
|
|||||
| Total deferred tax liabilities |
(77,361 | ) | (70,393 | ) | ||||
|
|
|
|
|
|||||
| Net operating loss carryforwards |
3,620 | 1,902 | ||||||
| Foreign tax credit carryforwards |
1,097 | 2,730 | ||||||
| Amounts not yet deductible for tax purposes |
959 | 1,024 | ||||||
| Other |
120 | 279 | ||||||
| Less valuation reserve |
— | (166 | ) | |||||
|
|
|
|
|
|||||
| Total deferred tax assets |
5,796 | 5,769 | ||||||
|
|
|
|
|
|||||
| Net deferred tax assets (liabilities) |
$ | (71,565 | ) | $ | (64,624 | ) | ||
71
Table of Contents
At December 31, 2011, the Company had $8.2 million in U.S. federal income tax net operating loss carryforwards, $1.7 million in Australia income tax net operating loss carryforwards, and $13.7 million in various state income tax net operating loss carryforwards and various allowable state deductions. Of these U.S. federal income tax net operating loss carryforwards, $3.4 million expires in 2029, $2.1 million expires in 2030 and $2.7 million expires in 2031. The state income tax net operating loss carryforwards expire at various times ranging from 2014 to 2029. The deferred tax asset of $766,000, included in net operating loss carryforwards, reflects the expected future benefit for the state loss carryforwards and allowable deductions. The Australian income tax net operating loss carryforwards do not expire.
The Company also had foreign tax credit carryforwards of $1.1 million at December 31, 2011, of which $833,000 expires in 2020 and $267,000 expires in 2021.
At December 31, 2011, the Company had $812,000 of unrecognized U.S. income taxes on foreign earnings since these earnings are being reinvested in the Company’s foreign operations.
13. EQUITY
Common Stock
During 2011, 214,745 shares of Class A common stock were granted under the Company’s 2010 Incentive Compensation Plan.
In August and November 2011, the Company declared a $0.04 dividend payable in cash or common stock to holders of common stock and participating preferred stock.
On December 15, 2010, the Company announced that its Board of Directors approved a stock repurchase program for the repurchase of up to 500,000 shares of our Class A common stock. 328,574 shares were repurchased under the program during the year ending December 31, 2011. The program has been suspended as of October 21, 2011.
If ED&F Man or any of its affiliates acquires beneficial ownership of shares of Class A Common Stock, these shares will automatically convert into an equal number of shares of Class B Common Stock. If any shares of Class B Common Stock cease to be owned beneficially or of record by ED&F Man or any of its affiliates, these shares will automatically convert into an equal number of shares of Class A Common Stock.
Series A Convertible Preferred Stock
Stock Escrow Agreement
On May 28, 2009, the Company delivered to an escrow agent for deposit into an escrow account 12,181,818 of the 30,886,830 newly issued shares of Series A Convertible Preferred Stock issued to Agman as part of consideration for the 2009 business combination, pursuant to a stock escrow agreement. During 2011, the Company delivered to an escrow agent for deposit into an escrow account an additional 724,792 shares of Series A Convertible Preferred stock to Agman. These shares will be released to Agman only upon the achievement by the Company of certain earnings or share price targets as determined in the Stock Escrow Agreement. As of December 31, 2011, neither of these achievements was met.
Dividend Rights
For a period of seven years following the business combination, shares of Series A Convertible Preferred Stock accrue dividends at the rate of $.0344 per share per quarter. Holders of shares of Series A Convertible Preferred Stock are entitled to participate equally and ratably with the holders of shares of common stock in all dividends and distributions paid on shares of our common stock (as if, immediately prior to each record date for payment of such dividend or distribution, the shares of Series A Convertible Preferred Stock then outstanding were converted into shares of the Company’s common stock). In addition, no dividends will be able to be paid to holders of shares of the Company’s common stock, unless and until the Company has complied with the obligation to pay the quarterly dividend on shares of the Series A Convertible Preferred Stock.
72
Table of Contents
Liquidation Rights
In the event of any voluntary or involuntary liquidation, dissolution or winding up of the Company, the holders of shares of Series A Convertible Preferred Stock will be entitled to receive the greater of (a) $5.50 per such share of Series A Convertible Preferred Stock, in each case plus an amount equal to any dividends accrued thereon and remaining unpaid thereon and (b) at any time, the payment such holders would have received had such holders, immediately prior to such liquidation, dissolution or winding up, converted such share of Series A Convertible Preferred Stock into shares of Common Stock, in each case, before any payment or distribution of any assets or profits of the Company is made or set apart for holders of any Series A Junior Securities. If the assets distributable in any such event to the holders of the Series A Convertible Preferred Stock are insufficient to permit the payment to such holders of the full preferential amounts to which they may be entitled, such assets shall be distributed ratably among the holders of the Series A Convertible Preferred Stock in proportion to the full preferential amount each such holder would otherwise be entitled to receive.
Conversion Rights
At present Agman, a subsidiary of ED&F Man, is the sole holder of our Series A Convertible Preferred Stock. As such, Agman has the right, at any time and from time to time, to convert any or all of its shares of Series A Convertible Preferred Stock into an equal number of shares of our Class B common stock (subject to adjustment for accrued base dividends, stock splits, subdivisions, reclassifications, and combinations). However, Agman is unable to exercise such conversion rights to the extent it would result in the ED&F Man group (including Agman) and certain individual affiliates thereof owning more than 49.5% of our outstanding common stock.
Approval Rights; Dividends on Escrowed Shares
As the sole holder of our Series A Convertible Preferred Stock, Agman has no right to vote in such capacity for the election of any directors or on matters presented for stockholder action generally, but its approval in such capacity is required for the Company to take a number of specific actions, including any action to amend, alter or repeal any provision of its certificate of incorporation or by-laws in a manner inconsistent with the stockholder’s agreement between the Company and Agman. With respect to any shares of Series A Convertible Preferred Stock held in escrow pursuant to the stock escrow agreement, any dividends or distributions on those shares are to accrue on the Company’s books and records, but not be paid unless and until those shares are released from escrow upon the achievement by the Company of certain earnings or share price targets.
Waivers Relating to Dividends
On December 14, 2010, the Company entered into a Waiver by and between the Company and Agman Louisiana Inc. (the “Preferred Stockholder”), pursuant to which, among other things, the Company issued an additional 1,229,932 shares of the Company’s Series A Perpetual Convertible Preferred Stock in January 2011 to the Preferred Stockholder in satisfaction of any and all outstanding accrued but unpaid dividends on the Preferred Stockholder’s shares of Series A Preferred Stock through December 31, 2010 totaling $6.8 million. The Company also agreed to and did issue subsequent to December 31, 2010, an additional 270,499 shares of Series A Preferred Stock to the Preferred Stockholder, constituting satisfaction in full for any and all outstanding accrued but unpaid dividends on the Preferred Stockholder’s shares of Series A Preferred Stock for the period January 1, 2011 through May 1, 2011 totaling $1.5 million. Of these total 1,500,431 shares, 908,658 were delivered to Agman and 591,773 were delivered to the escrow agent for deposit in the escrow account under the Stock Escrow Agreement dated May 28, 2009 among the Company, Agman, Shermen WSC Holding LLC, and the escrow agent.
In October 2011, the Company issued 337,613 shares of Series A Convertible Preferred Stock in the name of Agman constituting satisfaction in full for the $1.9 million of outstanding accrued but unpaid preferred stock dividends on Agman’s shares of Series A Convertible Preferred Stock through September 30, 2011. Of these 337,613 shares, 204,594 were delivered to Agman and 133,019 were delivered to the escrow agent for deposit in the escrow account. The foregoing 337,613 shares were issued in accordance with a Waiver agreement between the Company and Agman dated August 30, 2011.
On November 9, 2011, the Company entered into another Waiver by and between the Company and Agman, pursuant to which the Company agreed to issue 204,679 additional shares of Series A Convertible Preferred Stock to Agman on or shortly following January 1, 2012, in satisfaction in full of the accrued preferred stock dividends through December 31, 2011, based on a valuation of $5.50 per share of the Series A Convertible Preferred Stock, and in exchange for a waiver by Agman of the Company’s compliance with the negative covenants set forth in the Company’s Amended and Restated Certificate of Incorporation and the Stockholder’s Agreement dated as of May 28, 2009, between the Company and Agman, in connection with, and Agman’s consent to and approval of, the declaration and payment of the dividends described in the preceding paragraphs.
73
Table of Contents
Securities Law Compliance
The shares have been and will be issued in private placements not involving a public offering under the Securities Act of 1933. The Company has not engaged in general solicitation or advertising with regard to the described issuances of its shares of Series A Preferred Stock and has not offered securities to the public in connection with the issuances.
Corporate Authority
On November 9, 2011, the Board of Directors of the Company adopted a resolution, in accordance with its Amended and Restated Certificate of Incorporation and applicable law, to increase the number of shares of the Company’s Preferred Stock designated as Series A Convertible Preferred Stock from 33 million to 40 million. Following this action of the Board, all 40 million authorized shares of Preferred Stock have been designated as Series A Convertible Preferred Stock. The additional 7 million authorized shares of Series A Convertible Preferred Stock have all of the same rights and privileges as the outstanding shares of Series A Convertible Preferred Stock, and are available to be issued by the Company at the discretion of the Board.
Warrants and Units
Certain of the directors and officers of the Company purchased through Shermen WSC Holding LLC, in a private placement, 5,214,286 founder warrants immediately prior to our initial public offering in 2007 at a price of $0.70 per founder warrant (an aggregate purchase price of approximately $3,650,000) from the Company and not as part of the offering. Each founder warrant is exercisable for one share of common stock at an exercise price of $5.00 per share. Each founder warrant is exercisable at any time and was originally scheduled to expire on May 24, 2011. These certain directors and officers agreed that these founder warrants purchased by them would not be sold or transferred until the completion of a business combination. At the annual shareholder meeting held on June 30, 2010, the shareholders approved the Founder Warrant Amendment which extended the expiration dates of, and otherwise amended, the outstanding founder warrants to expire one-third May 24, 2012, one-third May 24, 2013, and one-third May 24, 2014. As a result, the Company recognized a one-time, non-cash expense of $1.4 million during the year ended December 31, 2010 which is equal to the increase in value of the Founders Warrants as of the date the amendment was approved. The Founder Warrant Amendment was also recorded as an increase in stockholders’ equity (specifically, as additional paid-in capital) equal to the increase in fair value of $1.4 million.
In August 2010, the Company commenced a tender offer to purchase up to 45,999,900 outstanding publicly-traded warrants. Ultimately, by the expiration of the Company’s tender offer in September 2010, 34,107,870 warrants were tendered, and they were exchanged shortly thereafter for an aggregate purchase price of approximately $4.4 million and 1,715 shares of our Class A common stock. During the fourth quarter of 2010, the Company purchased an additional 818,450 of the remaining public warrants outstanding at a price of $0.13 per warrant for an aggregate purchase price of $106,000. The remainder of the public warrants expired on May 24, 2011.
In connection with our initial public offering of units in 2007, the Company granted the representatives of the underwriters an option to purchase an aggregate of 700,000 units, with an option purchase price of $7.50 per unit. Each unit consisted of one share of common stock and two warrants. The terms of the units subject to this option were similar to the units sold in the Company’s initial public offering and the exercise price for each warrant in the unit was $6.25 per share. This option to purchase units was exercisable at any time, in whole or in part, and did expire on May 24, 2011.
14. COMMITMENTS AND CONTINGENCIES
The following table sets forth our non-cancelable operating lease commitments as of December 31, 2011 (in thousands):
| Operating Lease Commitments |
||||
| 2012 |
$ | 6,621 | ||
| 2013-2014 |
8,042 | |||
| 2015-2016 |
5,860 | |||
| Thereafter |
18,767 | |||
|
|
|
|||
| Total |
$ | 39,290 | ||
|
|
|
|||
74
Table of Contents
The Company has a substantial property portfolio, with major deep water port locations in the United States, the United Kingdom, the Netherlands and elsewhere in Europe, along with liquid feed supplements processing and distribution facilities in the United States and Canada. Many of the bulk liquid storage and liquid feed supplements facilities are situated on land that is leased from port authorities under operating leases. The Company also has a small number of facilities leases and leases with railroad companies. Total rental expense under operating leases amounted to $4.3 million and $3.9 million for the years ended December 31, 2011 and 2010.
In the normal course of business, we make investments in the property and facilities utilized by the bulk liquid storage and liquid feed supplements businesses. As a result, at any point in the financial calendar, we have outstanding contracts with third parties reflecting the cost of committed capital expenditures not yet incurred. At December 31, 2011 and 2010, the aggregate amount of these commitments totaled $7.7 million and $6.7 million respectively.
The Company and the ED&F Man group have established a long-term molasses supply agreement, pursuant to which the ED&F Man group is a supplier of cane molasses to the Company.
From time to time, the Company is subject to various claims and litigation arising in the ordinary course of business, including product liability, property, and terminal operator’s liability. While the outcome of any litigation is inherently unpredictable, the Company does not believe, based on currently available facts, that the ultimate resolution of any of these matters will have a material adverse impact on the financial condition, results of operations or cash flows.
15. SHARE BASED COMPENSATION
The Company’s shareholders in 2010 approved the Westway Group Inc. 2010 Incentive Compensation Plan, which contains restricted stock awards. This plan is administered by the Compensation Committee of the Board of Directors, which selects persons eligible to receive awards and determines the number of shares and/or options subject to each award and the terms, conditions and other provisions of the awards. The holders of the restricted stock are eligible to receive dividends, if paid, and have the right to vote the shares. The fair value of the restricted stock shares awarded under these plans is recorded as unearned share-based compensation, a contra-equity account. The unearned compensation related to these awards is amortized to compensation expense over the vesting period (generally three years). The total share-based compensation expense for these awards is determined based on the market price of the Company’s common stock at the date of grant applied to the total number of shares granted and is amortized over the vesting period. As of December 31, 2011 and 2010, unearned share-based compensation associated with these awards totaled $774,483 and $1,011,596 respectively. The weighted average grant date fair value of the restricted stock granted during the years ended December 31, 2011 and 2010 were $4.42 and $4.06 respectively.
The following table represents the compensation expense related to restricted stock grants that was included in selling, general and administrative expense in the accompanying consolidated statements of income for the periods indicated below (in thousands).
| Year Ended December 31, 2011 |
Year Ended December 31, 2010 |
|||||||
| Compensation expense related to restricted stock |
$ | 1,210 | $ | 593 | ||||
The following table represents unvested restricted stock activity (in number of shares) for the periods indicated.
| Year Ended December 31, 2011 |
Year Ended December 31, 2010 |
|||||||
| Balance at beginning of year |
346,938 | — | ||||||
| Granted (1) |
229,965 | 606,001 | ||||||
| Forfeited |
(62,189 | ) | (196,874 | ) | ||||
| Vested |
(171,654 | ) | (62,189 | ) | ||||
|
|
|
|
|
|||||
| Balance at end of year |
343,060 | 346,938 | ||||||
|
|
|
|
|
|||||
| (1) | Granted shares include actual shares granted of 15,220 and 418,756, as well as unissued shares granted of 214,745 and 187,245 relating to the 2010 Incentive Compensation Plan based on 2011 and 2010 Company target performance levels respectively. |
75
Table of Contents
The total fair value of shares vested during 2011 and 2010 totaled $742,000 and $255,000, respectively.
16. BUSINESS SEGMENTS
The Company operates its business in two reportable operating segments: bulk liquid storage and liquid feed supplements. These businesses represent distinct businesses that are managed separately because of differing products and services. Each of these businesses has distinct operating, marketing and sales strategies, and our chief operating decision maker reviews the performance of these businesses based on these segments. The Company also has one non-operating segment—Corporate.
These segments follow the accounting principles described in note 3. Intersegment revenues are accounted for at prices which reflect market.
Bulk Liquid Storage
Our bulk liquid storage segment generates revenue through contracts by providing three primary types of services: fixed income, volume or throughput income, and income from ancillary services. Each of these sources of income is recorded net of any discounts, volume rebates, and sales taxes. These sources of income reflect the individual nature of the Company’s relationships with its global, regional or local customer bases, which typically comprise contracts spanning one or more years. Contracts vary according to the provision of services, ranging from the simple transloading of products from delivery into storage, but more typically extend into more complex product management and storage services.
Fixed income services generate revenue from storage services at each of our terminals and are based on a fixed fee per month for tank rental, input/output from storage tanks or combination of both. We recognize revenue from fixed income services in the period the service is rendered.
Volume services generate revenue based on the volume of liquid entering or exiting at each terminal location and is based on tonnage. We recognize revenue for volume services as the volumes are entered into or withdrawn from its storage facilities.
Ancillary income services generate revenue from customer-specific storage requirements including energy, overtime, and other infrastructure costs. Revenue relating to ancillary income services is recognized based on terms stipulated in the customer contract and are recorded at the time the service is provided. Provisions for ancillary services may be included in fixed price storage services or in volume or throughput income services.
Revenue is recorded for the services available under each contract as the services are provided. Bulk liquid storage services are provided through a number of international locations, but are currently managed as one business from our headquarters in New Orleans, Louisiana.
Liquid Feed Supplements
The liquid feed supplements segment generates income from the sale of liquid feed supplements, with a small proportion of income arising from the sale of solid or more traditional animal feeds. The business is focused on the processing of animal feeds from their raw liquid constituents into a blended product that varies according to customer and livestock requirements. Revenue is recorded net of any discounts, volume rebates, and sales taxes. Shipping and handling costs are included within cost of sales in the consolidated statements of income. Our liquid feed supplements segment incorporates a research and development program focused on delivering product that is distinct, based on customer, livestock and geographical requirements, and is capable of being varied to reflect commodity prices or other factors. The liquid feed supplements segment is organized around a series of broad regional territories in the United States that reflect the characteristics of beef cattle, dairy and feedlot markets. The liquid feed supplements segment is currently managed from, and headquartered in, Tomball, TX.
76
Table of Contents
Corporate
Corporate operating expenses are not allocated to the Company’s two reportable operating segments. The corporate segment includes interest expenses related to corporate debt and unallocated general and administrative expenses including, in part, executive, legal, finance, information technology, human resource, and health, safety, environmental, and quality expenses.
Results of Operations by Business Segment
The Company’s operations by business segment are as follows (in thousands):
Year Ended December 31, 2011
| Bulk Liquid Storage | Liquid Feed Supplements |
Corporate | Total | |||||||||||||
| Total net revenue (1) |
$ | 89,011 | $ | 318,419 | $ | — | $ | 407,430 | ||||||||
| Total cost of sales (1) |
— | 267,577 | — | $ | 267,577 | |||||||||||
| Other operating costs and expenses |
37,747 | 20,554 | (33 | ) | $ | 58,268 | ||||||||||
| Depreciation and amortization |
20,123 | 4,786 | 785 | $ | 25,694 | |||||||||||
| Selling, general & administrative expenses |
6,453 | 12,120 | 15,279 | $ | 33,852 | |||||||||||
| Goodwill impairment |
3,095 | — | — | $ | 3,095 | |||||||||||
| Income / (expense) from operations |
$ | 21,593 | $ | 13,382 | $ | (16,031 | ) | $ | 18,944 | |||||||
| Interest, net |
25 | (4 | ) | (4,414 | ) | $ | (4,393 | ) | ||||||||
| Loss on disposal of property, plant & equipment |
(993 | ) | (391 | ) | — | $ | (1,384 | ) | ||||||||
| Total non-operating (expense) / income |
(968 | ) | (395 | ) | (4,414 | ) | $ | (5,777 | ) | |||||||
| Income (loss) before taxes |
$ | 20,625 | $ | 12,987 | $ | (20,445 | ) | $ | 13,167 | |||||||
| Capital expenditures |
$ | 32,236 | $ | 6,287 | $ | 695 | $ | 39,218 | ||||||||
| Plant, property & equipment – net |
$ | 270,597 | $ | 51,778 | $ | 1,083 | $ | 323,458 | ||||||||
| Goodwill and intangibles |
$ | 64,445 | $ | 29,274 | $ | 76 | $ | 93,795 | ||||||||
| Total assets |
$ | 350,331 | $ | 143,325 | $ | 18,375 | $ | 512,031 | ||||||||
| (1) | After intersegment eliminations |
Year Ended December 31, 2010
| Bulk Liquid Storage | Liquid Feed Supplements |
Corporate | Total | |||||||||||||
| Total net revenue (1) |
$ | 88,616 | $ | 254,042 | $ | — | $ | 342,658 | ||||||||
| Total cost of sales (1) |
— | 206,842 | — | 206,842 | ||||||||||||
| Other operating costs and expenses |
35,781 | 21,101 | 46 | 56,928 | ||||||||||||
| Depreciation and amortization |
20,448 | 4,797 | 350 | 25,595 | ||||||||||||
| Selling, general & administrative expenses |
7,419 | 11,349 | 15,258 | 34,026 | ||||||||||||
| Goodwill impairment |
2,062 | — | — | 2,062 | ||||||||||||
| Founder warrant expense |
— | — | 1,381 | 1,381 | ||||||||||||
| Income / (expense) from operations |
22,906 | 9,953 | (17,035 | ) | 15,824 | |||||||||||
| Interest, net |
(17 | ) | (3 | ) | (5,099 | ) | (5,119 | ) | ||||||||
| Loss on disposal of property, plant & equipment |
(236 | ) | (711 | ) | — | (947 | ) | |||||||||
|
Total non-operating (expense) / income |
(253 | ) | (714 | ) | (5,099 | ) | (6,066 | ) | ||||||||
| Income (loss) before taxes |
$ | 22,653 | $ | 9,239 | $ | (22,134 | ) | $ | 9,758 | |||||||
| Capital expenditures |
$ | 17,217 | $ | 4,909 | $ | 462 | $ | 22,588 | ||||||||
| Plant, property & equipment—net |
$ | 262,255 | $ | 50,577 | $ | 659 | $ | 313,491 | ||||||||
| Goodwill and intangibles |
$ | 67,790 | $ | 29,285 | $ | 363 | $ | 97,438 | ||||||||
| Total assets |
$ | 350,970 | $ | 129,386 | $ | 14,865 | $ | 495,221 | ||||||||
| (1) | After intersegment eliminations |
77
Table of Contents
The following table presents revenues from external customers attributable to individual countries that represent at least 10% of net revenues based on each principal place of business for the years indicated:
| Year ended December 31, | ||||||||
| 2011 | 2010 | |||||||
| United States |
$ | 372,819 | $ | 307,117 | ||||
| International |
34,611 | 35,541 | ||||||
|
|
|
|
|
|||||
| Total |
$ | 407,430 | $ | 342,658 | ||||
The following table presents long lived-assets attributable to individual countries that represent at least 10% of total long-lived assets based on each principal place of business for the years indicated:
| December 31, | ||||||||
| 2011 | 2010 | |||||||
| United States |
$ | 235,469 | $ | 225,077 | ||||
| International |
91,438 | 92,691 | ||||||
|
|
|
|
|
|||||
| Total |
$ | 326,907 | $ | 317,768 | ||||
|
|
|
|
|
|||||
78
Table of Contents
17. QUARTERLY FINANCIAL DATA (UNAUDITED)
The following tables set forth a summary of the Company’s quarterly financial information for each of the four quarters ended December 31, 2011 and December 31, 2010 (in thousands, except per share amounts):
| Year Ended December 31, 2011 | ||||||||||||||||
| First Quarter | Second Quarter | Third Quarter | Fourth Quarter (1) | |||||||||||||
| Net Revenues |
$ | 94,091 | $ | 93,053 | $ | 103,042 | $ | 117,244 | ||||||||
| Cost of sales |
58,946 | 60,254 | 68,393 | 79,984 | ||||||||||||
| Operating income |
5,667 | 3,614 | 5,872 | 3,791 | ||||||||||||
| Net income (loss) |
2,108 | 1,744 | 3,047 | (1,833 | ) | |||||||||||
| Net income (loss) attributable to Westway Group, Inc. |
2,066 | 1,750 | 3,030 | (1,906 | ) | |||||||||||
| Earnings (loss) per common share—basic |
$ | 0.02 | $ | 0.01 | $ | 0.02 | $ | (0.16 | ) | |||||||
| Earnings (loss) per common share—diluted |
$ | 0.02 | $ | 0.01 | $ | 0.02 | $ | (0.16 | ) | |||||||
| Year Ended December 31, 2010 | ||||||||||||||||
| First Quarter | Second Quarter (2) | Third Quarter | Fourth Quarter (3) | |||||||||||||
| Net Revenues |
$ | 93,442 | $ | 75,643 | $ | 77,287 | $ | 96,286 | ||||||||
| Cost of sales |
57,007 | 44,708 | 46,079 | 59,048 | ||||||||||||
| Operating income (loss) |
7,458 | (466 | ) | 2,347 | 6,485 | |||||||||||
| Net income (loss) |
4,157 | (1,275 | ) | 888 | 1,905 | |||||||||||
| Net income (loss) attributable to Westway Group, Inc. |
4,154 | (1,260 | ) | 891 | 1,893 | |||||||||||
| Earnings (loss) per common share—basic |
$ | 0.05 | $ | (0.09 | ) | $ | (0.01 | ) | $ | 0.01 | ||||||
| Earnings (loss) per common share—diluted |
$ | 0.05 | $ | (0.09 | ) | $ | (0.01 | ) | $ | 0.01 | ||||||
| (1) | Includes goodwill impairment of $3.1 million. |
| (2) | Includes one-time founder warrant expense of $1.4 million. |
| (3) | Includes goodwill impairment of $2.1 million. |
Basic and diluted earnings (loss) per share are computed independently for each of the quarters presented. Therefore, the sum of quarterly basic and diluted per share information may not equal annual basic and diluted earnings per share.
18. SUBSEQUENT EVENTS
On January 1, 2012 the Company issued an additional 204,679 shares of the Company’s Series A Convertible Preferred Stock to Agman in satisfaction for any and all outstanding accrued but unpaid dividends on Agman’s Series A Convertible Preferred Stock through December 31, 2011 totaling $1.1 million.
On January 16, 2012 the Company paid a $0.04 dividend declared November 9, 2011. The dividend was comprised of a combination of cash in the amount of $388,229 and 268,962 common shares, based on the elections of the Company’s shareholders. An additional $556,264 remains as a payable for the Class A common shares and Series A Convertible Preferred shares held in escrow, which are subject to the terms of the stock escrow agreement.
On February 13, 2012, the Company’s Board of Directors declared a quarterly dividend of $0.04 per share of common stock payable on April 23, 2012 to holders of record of the Company’s common stock and participating preferred stock on February 27, 2012. The dividend will be payable in cash or shares of the Company’s common stock, or a combination thereof, at the election of each shareholder, subject to a limitation on the aggregate amount of cash payable in satisfaction of the dividend.
On February 29, 2012, the Company disposed of its investment in Sunnyside Feed, LLC, a 51% owned joint venture which is located in Mandan, North Dakota. This investment no longer met the requirements of the Company’s overall business strategy and was sold for approximately its carrying value.
| ITEM 9. | CHANGES IN AND DISAGREEMENTS WITH ACCOUNTANTS ON ACCOUNTING AND FINANCIAL DISCLOSURE |
Not Applicable
79
Table of Contents
| ITEM 9A. | CONTROLS AND PROCEDURES |
Evaluation of Disclosure Controls and Procedures
Based on management’s evaluation (with the participation of our Chief Executive Officer (CEO) and Chief Financial Officer (CFO)), as of the end of the period covered by this report, our CEO and CFO have concluded that our disclosure controls and procedures (as defined in Rules 13a-15(e) and 15d-15(e) under the Securities Exchange Act of 1934, as amended (the Exchange Act)) are effective to provide reasonable assurance that information required to be disclosed by us in reports that we file or submit under the Exchange Act is recorded, processed, summarized, and reported within the time periods specified in Securities and Exchange Commission rules and forms and is accumulated and communicated to management, including our principal executive officer and principal financial officer, as appropriate to allow timely decisions regarding required disclosure.
Report of Management on Internal Control over Financial Reporting
Management is responsible for establishing and maintaining adequate internal control over financial reporting for the Company. To evaluate the effectiveness of the Company’s internal control over financial reporting, management used the Internal Control—Integrated Framework issued by the Committee of Sponsoring Organizations of the Treadway Commission. Based on that evaluation, management concluded that the Company’s internal control over financial reporting was effective as of December 31, 2011.
This annual report does not include an attestation report of the Company’s registered public accounting firm regarding internal control over financial reporting. Management’s report was not subject to attestation by the Company’s registered public accounting firm because the Company is a smaller reporting company.
Changes in Internal Control over Financial Reporting During the Last Fiscal Quarter
During the fourth quarter of 2011, no change in our internal control over financial reporting occurred that materially affected, or is reasonably likely to materially affect, our internal control over financial reporting.
Inherent Limitations on Effectiveness of Controls
Because of inherent limitations, disclosure controls and procedures provide only reasonable, and not absolute, assurance that their objectives are met.
| ITEM 9B. | OTHER INFORMATION |
None.
80
Table of Contents
PART III
| ITEM 10. | DIRECTORS, EXECUTIVE OFFICERS AND CORPORATE GOVERNANCE |
Information with respect to this item is incorporated herein by reference to Westway Group Inc.’s Proxy Statement for its Annual Meeting of Stockholders to be held in 2012.
We have adopted a Code of Conduct and Ethics that applies to all of our employees, including our principal executive officer, principal financial officer, principal accounting officer, controller, and any persons performing similar functions. Our Code of Conduct and Ethics is posted on our internet website, which is www.westway.com. Also, we will provide to any person without charge, upon request, a copy of our Code of Conduct and Ethics; such request may be made by sending a letter to Tom Masilla, Westway Group, Inc., 365 Canal Street, Suite 2900 New Orleans, LA 70130. We intend to satisfy the disclosure requirement under Item 10 of Form 8-K regarding an amendment to, or waiver from, certain provisions of our Code of Conduct and Ethics by posting any such information on our internet website.
| ITEM 11. | EXECUTIVE COMPENSATION |
Information with respect to this item is incorporated herein by reference to Westway Group Inc.’s Proxy Statement for its Annual Meeting of Stockholders to be held in 2012.
| ITEM 12. | SECURITY OWNERSHIP OF CERTAIN BENEFICIAL OWNERS AND MANAGEMENT AND RELATED STOCKHOLDER MATTERS |
Information with respect to this item is incorporated herein by reference to Westway Group Inc.’s Proxy Statement for its Annual Meeting of Stockholders to be held in 2012.
| ITEM 13. | CERTAIN RELATIONSHIPS AND RELATED TRANSACTIONS, AND DIRECTOR INDEPENDENCE |
Information with respect to this item is incorporated herein by reference to Westway Group Inc.’s Proxy Statement for its Annual Meeting of Stockholders to be held in 2012.
| ITEM 14. | PRINCIPAL ACCOUNTANT FEES AND SERVICES |
Information with respect to this item is incorporated herein by reference to Westway Group Inc.’s Proxy Statement for its Annual Meeting of Stockholders to be held in 2012.
81
Table of Contents
PART IV
| ITEM 15. | EXHIBITS AND FINANCIAL STATEMENT SCHEDULES |
List of Financial Statements Filed as Part of this Report
The following consolidated financial statements are filed in Item 8 of Part II of this report:
| Financial Statement |
Page | |||
| 52 | ||||
| 53 | ||||
| 54 | ||||
| 55 | ||||
| 57 | ||||
List of Financial Statement Schedules Filed as Part of this Report
Financial statement schedules have not been included because they are not required, not applicable, immaterial, or the information required has been included elsewhere herein.
List of Exhibits Filed as Part of this Report
See the Exhibit Index following the Signature page, which index is hereby incorporated by reference.
82
Table of Contents
Pursuant to the requirements of Section 13 or 15(d) of the Securities Exchange Act of 1934, the registrant has duly caused this report to be signed on its behalf by the undersigned, thereunto duly authorized.
| WESTWAY GROUP, INC. | ||||||
| March 30, 2012 | By: | /s/ JAMES B. JENKINS | ||||
| James B. Jenkins | ||||||
| Chief Executive Officer and Director | ||||||
Pursuant to the requirements of the Securities Exchange Act of 1934, this report has been signed below by the following persons on behalf of the registrant and in the capacities and on the dates indicated.
| March 30, 2012 | By: | /S/ FRANCIS P. JENKINS, JR. | ||||
| Francis P. Jenkins, Jr. | ||||||
| Chairman and Director | ||||||
| March 30, 2012 | By: | /S/ G. KENNETH MOSHENEK | ||||
| G. Kenneth Moshenek | ||||||
| Director | ||||||
| March 30, 2012 | By: | /S/ PAUL CHATTERTON | ||||
| Paul Chatterton | ||||||
| Director | ||||||
| March 30, 2012 | By: | /S/ ANTHONY J. ANDRUKAITIS | ||||
| Anthony J. Andrukaitis | ||||||
| Director | ||||||
| March 30, 2012 | By: | /S/ PHILIP A. HOWELL | ||||
| Philip A. Howell | ||||||
| Director | ||||||
| March 30, 2012 | By: | /S/ JAMES B. JENKINS | ||||
| James B. Jenkins | ||||||
| Director and Chief Executive Officer | ||||||
| March 30, 2012 | By: | /S/ JOHN E. TOFFOLON, JR. | ||||
| John E. Toffolon, Jr. | ||||||
| Director | ||||||
| March 30, 2012 | By: | /S/ THOMAS A. MASILLA, JR. | ||||
| Thomas A. Masilla, Jr. | ||||||
| Chief Financial Officer and Principal Accounting Officer | ||||||
83
Table of Contents
The descriptions of various agreements in this Form 10-K do not purport to describe all of the terms of the agreements and are qualified in their entirety by reference to the complete text of the agreements themselves. The agreements listed below have been filed to provide investors with information regarding their terms, but not to provide any other factual information about the Company or the other parties to the agreements. The representations and warranties and other provisions of the agreements allocate risks and establish rights and obligations among the parties thereto, and may apply standards of materiality that are different from what may be material to investors. Moreover, information concerning the subject matter of the representations, warranties, and other provisions may change after the date of the agreements, which subsequent information may or may not be fully reflected in the Company’s public disclosures. Accordingly, the representations and warranties and other provisions of the agreements may not describe the actual state of affairs as of the date they were made or at any other time, and should not be relied on by investors as statements of fact.
| Exhibit |
Exhibit Title | |
| 2.1 | Amended and Restated Transaction Agreement, dated May 1, 2009, among Westway Group, Inc. (formerly named Shermen WSC Acquisition Corp.), Terminal Merger Sub LLC, Feed Merger Sub LLC, ED&F Man Holdings Limited, Agman Louisiana, Inc. (formerly named Westway Holdings Corporation), Westway Terminal Company Inc. and Westway Feed Products, Inc. (incorporated by reference to Exhibit 2.1 of the Company’s Current Report on Form 8-K filed with the SEC on May 8, 2009) | |
| 3.1 | Amended and Restated Certificate of Incorporation, filed with the Secretary of State of the State of Delaware on May 28, 2009, as amended by that certain Certificate of Amended and Restated Certificate of Incorporation of Westway Group, Inc., filed with the Secretary of State of the State of Delaware on July 12, 2010 (incorporated by reference to Exhibit 3.1 of the Company’s Quarterly Report on Form 10-Q filed with the SEC on August 9, 2010) | |
| 3.2 | Certificate of Designation of Series A Perpetual Convertible Preferred Stock of Westway Group, Inc. dated November 11, 2011 (incorporated by reference to Exhibit 3.2 of the Company’s Quarterly Report on Form 10-Q filed with the SEC on November 14, 2011) | |
| 3.3 | Amended and Restated By-laws, dated as of November 4, 2010 (incorporated by reference to Exhibit 3.2 of the Company’s Quarterly Report on Form 10-Q filed with the SEC on November 9, 2010) | |
| 4.1 | Credit Agreement, dated as of November 12, 2009, among Westway Group, Inc. as borrower, JPMorgan Chase Bank, N.A., as administrative agent, Regions Bank, as syndication agent, CoBank ACB, Rabobank Nederland, SunTrust Bank, and Compass Bank (doing business as BBVA Compass), as documentation agents, and the lenders from time to time parties thereto (incorporated by reference to Exhibit 4.1 of the Company’s Current Report on Form 8-K filed with the SEC on November 17, 2009) | |
| 4.2 | First Amendment to Credit Agreement, dated as of June 22, 2010, among Westway Group, Inc. as borrower, JPMorgan Chase Bank, N.A., as administrative agent, and the lenders from time to time party thereto (incorporated by reference to Exhibit 4.5 of the Company’s Annual Report on Form 10-K filed with the SEC on March 31, 2011) | |
| 4.3 | Second Amendment to Credit Agreement, dated as of November 5, 2010, among Westway Group, Inc. as borrower, JPMorgan Chase Bank, N.A., as administrative agent, and the lender’s from time to time party thereto (incorporated by reference to Exhibit 4.3 of the Company’s Quarterly Report on Form 10-Q filed with the SEC on November 9, 2010) | |
| 4.4 | Third Amendment to Credit Agreement, dated as of December 13, 2010, among Westway Group, Inc. as borrower, five of its subsidiaries as guarantors, JPMorgan Chase Bank, N.A., as administrative agent, and the lenders from time to time party thereto (incorporated by reference to Exhibit 4.7 of the Company’s Annual Report on Form 10-K filed with the SEC on March 31, 2011) | |
| 4.5 | Fourth Amendment to Credit Agreement, dated as of July 6, 2011, among Westway Group, Inc., as borrower, five of its subsidiaries as guarantors, JPMorgan Chase Bank, N.A., as administrative agent, and the lenders from time to time party thereto (incorporated by reference to Exhibit 4.1 of the Company’s Current Report on Form 8-K filed with the SEC on July 8, 2011) | |
84
Table of Contents
| Exhibit |
Exhibit Title | |
| 10.1 | Stock Escrow Agreement, dated May 28, 2009, among Westway Group, Inc., Agman Louisiana, Inc. (formerly named Westway Holdings Corporation), Shermen WSC Holding LLC, and Continental Stock Transfer & Trust Company (incorporated by reference to Exhibit 10.1 of the Company’s Quarterly Report, as Amended, on Form 10-Q/A filed with the SEC on August 17, 2009) | |
| 10.2 | Stockholder’s Agreement, dated May 28, 2009, between Westway Group, Inc. and Agman Louisiana, Inc. (formerly named Westway Holdings Corporation) (incorporated by reference to Exhibit 10.2 of the Company’s Quarterly Report, as Amended, on Form 10-Q/A filed with the SEC on August 17, 2009) | |
| 10.3 | Registration Rights Agreement, dated May 28, 2009, among Westway Group, Inc., Agman Louisiana, Inc. (formerly named Westway Holdings Corporation), and certain employees of ED&F Man Holdings Limited or one or more of its affiliates (incorporated by reference to Exhibit 10.3 of the Company’s Quarterly Report, as Amended, on Form 10-Q/A filed with the SEC on August 17, 2009) | |
| 10.4 | †Molasses Supply Agreement, dated May 28, 2009, between Westway Feed Products LLC (an affiliate of Westway Group, Inc.) and ED&F Man Liquid Products Corporation (a wholly owned subsidiary of ED&F Man Holdings Limited)(incorporated by reference to Exhibit A to Exhibit 2.1 of the Company’s Current Report on Form 8-K filed with the SEC on January 20, 2009) | |
| 10.5 | †Storage Strategic Alliance Agreement, dated May 28, 2009, between Westway Terminal Company LLC (a wholly owned subsidiary of Westway Group, Inc.) and ED&F Man Holdings Limited (incorporated by reference to Exhibit I to Exhibit 2.1 of the Company’s Current Report on Form 8-K filed with the SEC on January 20, 2009) | |
| 10.6 | Credit Agreement, dated as of November 12, 2009, among Westway Group, Inc. as borrower, JPMorgan Chase Bank, N.A., as administrative agent, Regions Bank, as syndication agent, CoBank ACB, Rabobank Nederland, SunTrust Bank, and Compass Bank (doing business as BBVA Compass), as documentation agents, and the lenders from time to time parties thereto (incorporated by reference to Exhibit 4.1 of the Company’s Current Report on Form 8-K filed with the SEC on November 17, 2009) | |
| 10.7 | First Amendment to Credit Agreement, dated as of June 22, 2010 among Westway Group, Inc. as borrower, JPMorgan Chase Bank, N.A., as administrative agent, and the lenders from time to time party thereto (incorporated by reference to Exhibit 4.5 of the Company’s Annual Report on Form 10-K filed with the SEC on March 31, 2011) | |
| 10.8 | Second Amendment to Credit Agreement, dated as of November 5, 2010, among Westway Group, Inc. as borrower, JPMorgan Chase Bank, N.A., as administrative agent, and the lender’s from time to time party thereto (incorporated by reference to Exhibit 4.3 of the Company’s Quarterly Report on Form 10-Q filed with the SEC on November 9, 2010) | |
| 10.9 | Third Amendment to Credit Agreement, dated as of December 13, 2010, among Westway Group, Inc. as borrower, five of its subsidiaries as guarantors, JPMorgan Chase Bank, N.A., as administrative agent, and the lenders from time to time party thereto (incorporated by reference to Exhibit 4.7 of the Company’s Annual Report on Form 10-K filed with the SEC on March 31, 2011) | |
| 10.10 | Fourth Amendment to Credit Agreement, dated as of July 6, 2011, among Westway Group, Inc., as borrower, five of its subsidiaries as guarantors, JPMorgan Chase Bank, N.A., as administrative agent, and the lenders from time to time party thereto (incorporated by reference to Exhibit 4.1 of the Company’s Current Report on Form 8-K filed with the SEC on July 8, 2011) | |
| 10.11 | Founder Warrant Agreement, dated as of May 30, 2007, between Westway Group, Inc. (formerly named Shermen WSC Acquisition Corp.) and Continental Stock Transfer & Trust Company, as warrant agent (incorporated by reference to Exhibit 10.18 of the Company’s Annual Report on Form 10-K filed with the SEC on March 31, 2011) | |
| 10.12 | Amendment No. 1 to Founder Warrant Agreement, dated August 30, 2010, between Westway Group, Inc. and Continental Stock Transfer & Trust Company (incorporated by reference to Exhibit 4.1 of the Company’s Current Report on Form 8-K filed with the SEC on August 31, 2010) | |
85
Table of Contents
| Exhibit |
Exhibit Title | |
| 10.13 | Registration Rights Agreement dated as of May 30, 2007, among Westway Group, Inc. (formerly named Sherman WSC Acquisition Corp.), Sherman Acquisition Holding LLC, John E. Toffolon, Jr., Joseph Prochaska, and Donald Pottinger (incorporated by reference to Exhibit 10.20 of the Company’s Annual Report on Form 10-K filed with the SEC on March 31, 2011) | |
| 10.14 | Guarantee and Collateral Agreement, dated as of November 12, 2009, among Westway Group, Inc., Westway Terminal Company LLC, Westway Terminal Cincinnati LLC, Westway Feed Products, LLC, Westway International Holdings, Inc., and Westway Holdings International, LLC, as grantors, in favor of JPMorgan Chase Bank, N.A., as administrative agent, for the lenders from time to time parties to the Credit Agreement (incorporated by reference to Exhibit 4.2 of the Company’s Current Report on Form 8-K filed with the SEC on November 17, 2009) | |
| 10.15 | Deed of Pledge over Membership Interests, dated November 12, 2009, between Westway International Holdings, Inc., as pledgor, JPMorgan Chase Bank, N.A., as pledgee, and Westway Netherlands Cooperatief U.A. (incorporated by reference to Exhibit 4.3 of the Company’s Current Report on Form 8-K filed with the SEC on November 17, 2009) | |
| 10.16 | Deed of Trust, Security Agreement, Fixture Filing, and Assignment of Leases and Rents, executed as of February 10, 2010 by Westway Feed Products LLC to Jack Smith, Trustee, for the benefit of JPMorgan Chase Bank, N.A., as administrative agent for the lenders from time to time parties to the Credit Agreement (incorporated by reference to Exhibit 10.1 of the Company’s Current Report on Form 8-K filed with the SEC on February 17, 2010) | |
| 10.17 | Leasehold Deed of Trust, Security Agreement, Fixture Filing, and Assignment of Leases and Rents, executed as of February 10, 2010 by Westway Terminal Company LLC to Jack Smith, Trustee, for the benefit of JPMorgan Chase Bank, N.A., as administrative agent for the lenders from time to time parties to the Credit Agreement (incorporated by reference to Exhibit 10.2 of the Company’s Current Report on Form 8-K filed with the SEC on February 17, 2010) | |
| 10.18 | Deed of Trust, Security Agreement, Fixture Filing, and Assignment of Leases and Rents, executed as of February 10, 2010 by Westway Terminal Company LLC to Jack Smith, Trustee, for the benefit of JPMorgan Chase Bank, N.A., as administrative agent for the lenders from time to time parties to the Credit Agreement (incorporated by reference to Exhibit 10.3 of the Company’s Current Report on Form 8-K filed with the SEC on February 17, 2010) | |
| 10.19 | Leasehold Deed of Trust, Security Agreement, Fixture Filing, and Assignment of Leases and Rents, executed as of February 10, 2010 by Westway Terminal Company LLC to Jack Smith, Trustee, for the benefit of JPMorgan Chase Bank, N.A., as administrative agent for the lenders from time to time parties to the Credit Agreement (incorporated by reference to Exhibit 10.4 of the Company’s Current Report on Form 8-K filed with the SEC on February 17, 2010) | |
| 10.20 | Open-End Mortgage, Security Agreement, Fixture Filing, and Assignment of Leases and Rents, executed as of February 10, 2010 by Westway Feed Products LLC for the benefit of JPMorgan Chase, N.A., as administrative agent for the lenders from time to time parties to the Credit Agreement (incorporated by reference to Exhibit 10.5 of the Company’s Current Report on Form 8-K filed with the SEC on February 17, 2010) | |
| 10.21 | Open-End Mortgage, Security Agreement, Fixture Filing, and Assignment of Leases and Rents, executed as of February 10, 2010 by Westway Terminal Cincinnati LLC for the benefit of JPMorgan Chase, N.A., as administrative agent for the lenders from time to time parties to the Credit Agreement (incorporated by reference to Exhibit 10.6 of the Company’s Current Report on Form 8-K filed with the SEC on February 17, 2010) | |
| 10.22 | Leasehold Deed of Trust, Security Agreement, Fixture Filing, and Assignment of Leases and Rents, executed as of February 10, 2010 by Westway Terminal Company LLC to Chicago Title Insurance Company, Trustee, for the benefit of JPMorgan Chase, N.A., as administrative agent for the lenders from time to time parties to the Credit Agreement (incorporated by reference to Exhibit 10.7 of the Company’s Current Report on Form 8-K filed with the SEC on February 17, 2010) | |
| 10.23 | Complete Separation Agreement and General Release between Peter J.M. Harding and Westway Group, Inc. dated June 25, 2010 (incorporated by reference to Exhibit 10.1 of the Company’s Current Report on Form 8-K filed with the SEC on June 29, 2010) | |
86
Table of Contents
| Exhibit |
Exhibit Title | |
| 10.24 | Severance Agreement between Thomas A. Masilla, Jr. and Westway Group, Inc. dated June 26, 2010 (incorporated by reference to Exhibit 10.3 of the Company’s Current Report on Form 8-K filed with the SEC on June 29, 2010) | |
| 10.25 | Severance Agreement between Wayne Driggers and Westway Group, Inc. dated June 26, 2010 (incorporated by reference to Exhibit 10.2 of the Company’s Current Report on Form 8-K filed with the SEC on June 29, 2010) | |
| 10.26 | Consulting Agreement between Wayne Driggers and Westway Group, Inc. dated September 16, 2010 (incorporated by reference to Exhibit 10.1 of the Company’s Current Report on Form 8-K filed with the SEC on September 17, 2010) | |
| 10.27 | Termination of Consulting Agreement and General Release between Wayne Driggers and Westway Group, Inc. dated April 12, 2011 (incorporated by reference to Exhibit 10.2 of the Company’s Quarterly Report on Form 10-Q filed with the SEC on August 15, 2011) | |
| 10.28 | Amended and Restated Offer to Purchase and Exchange dated September 8, 2010, as amended (incorporated by reference to Exhibit (a)(1)(E) of the Company’s Amendment No. 3 to Tender Offer Statement on Schedule TO-I/A filed with the SEC on September 8, 2010, as amended by Amendment No. 4 to Tender Offer Statement on Schedule TO-I/A filed with the SEC on September 17, 2010) | |
| 10.29 | Amended and Restated Letter of Transmittal (including Guidelines of the Internal Revenue Service for Certification of Taxpayer Identification Number on Substitute Form W-9) (incorporated by reference to Exhibit (a)(1)(F) of the Company’s Amendment No. 3 to Tender Offer Statement on Schedule TO-I/A filed with the SEC on September 8, 2010) | |
| 10.30 | Waiver dated as of December 14, 2010, by and between Westway Group, Inc. and Agman Louisiana Inc. (incorporated by reference to Exhibit 10.36 of the Company’s Annual Report on Form 10-K filed with the SEC on March 31, 2011) | |
| 10.31 | Waiver dated as of May 1, 2011 and executed on June 23, 2011, by and between Agman Louisiana Inc. and Westway Group, Inc. (incorporated by reference to Exhibit 4.1 of the Company’s Quarterly Report on Form 10-Q filed with the SEC on August 15, 2011) | |
| 10.32 | Waiver dated as of August 11, 2011 by and between Agman Louisiana Inc. and Westway Group, Inc. (incorporated by reference to Exhibit 4.2 of the Company’s Quarterly Report on Form 10-Q filed with the SEC on November 14, 2011) | |
| 10.33 | Waiver dated as of August 30, 2011 by and between Agman Louisiana Inc. and Westway Group, Inc. (incorporated by reference to Exhibit 10.1 of the Company’s Current Report on Form 8-K filed with the SEC on August 31, 2011) | |
| 10.34 | Waiver dated as of November 8, 2011 by and between Agman Louisiana Inc. and Westway Group, Inc. (incorporated by reference to Exhibit 4.4 of the Company’s Quarterly Report on Form 10-Q filed with the SEC on November 14, 2011) | |
| 10.35 | Waiver dated as of February 13, 2012 by and between Agman Louisiana Inc. and Westway Group, Inc. (incorporated by reference to Exhibit 10.1 to the Company’s Current Report on Form 8-K filed with the SEC on February 15, 2012) | |
| 10.36* | Westway Group, Inc. 2010 Incentive Compensation Plan, as amended by the Board of Directors of the Company on March 24, 2011 and by the Stockholders of the Company at the Annual Meeting of Stockholders on June 16, 2011 | |
| 10.37* | Restricted Stock Award Agreement dated as of October 7, 2010 between Westway Group, Inc. and Tom Masilla under the Westway Group, Inc. 2010 Incentive Compensation Plan (incorporated by reference to Exhibit 10.38 of the Company’s Annual Report on Form 10-K filed with the SEC on March 31, 2011) | |
| 10.38* | Restricted Stock Award Agreement dated as of October 7, 2010 between Westway Group, Inc. and Stephen Boehmer under the Westway Group. Inc. 2010 Incentive Compensation Plan (incorporated by reference to Exhibit 10.39 of the Company’s Annual Report on Form 10-K filed with the SEC on March 31, 2011) | |
87
Table of Contents
| Exhibit |
Exhibit Title | |
| 10.39* | Form of Award Agreement for 2010 incentive awards under the Westway Group, Inc. 2010 Incentive Compensation Plan (incorporated by reference to Exhibit 10.40 of the Company’s Annual Report on Form 10-K filed with the SEC on March 31, 2011) | |
| 10.40* | Award Agreement dated November 4, 2010 between Westway Group, Inc. and James Jenkins under the Westway Group, Inc. 2010 Incentive Compensation Plan (incorporated by reference to Exhibit 10.41 of the Company’s Annual Report on Form 10-K filed with the SEC on March 31, 2011) | |
| 10.41* | Award Agreement dated March 31, 2011 between Westway Group, Inc. and James B. Jenkins under the Westway Group, Inc. 2010 Incentive Compensation Plan | |
| 10.42* | Award Agreement dated March 31, 2011 between Westway Group, Inc. and Thomas A. Masilla Jr. under the Westway Group, Inc. 2010 Incentive Compensation Plan | |
| 10.43* | Award Agreement dated September 30, 2011 between Westway Group, Inc. and Gene McClain under the Westway Group, Inc. 2010 Incentive Compensation Plan | |
| 10.44* | Award Agreement dated September 30, 2011 between Westway Group, Inc. and Steve Boehmer under the Westway Group, Inc. 2010 Incentive Compensation Plan | |
| 10.45 | Terminal Service Agreement No. 899, dated September 6, 2001, between Westway Terminal Company LLC (formerly Westway Terminal Company, Inc.) (a wholly owned subsidiary of Westway Group, Inc.) and ED&F Man Liquid Products L.L.C. (formerly Westway Trading Corporation) (incorporated by reference to Exhibit 10.42 to the Company’s Annual Report on Form 10-K filed with the SEC on March 31, 2011) | |
| 21.1 | List of Subsidiaries | |
| 23.1 | Consent of Ernst & Young LLP | |
| 31.1 | Certification of Principal Executive Officer, pursuant to Section 302 of the Sarbanes-Oxley Act of 2002 | |
| 31.2 | Certification of Principal Financial Officer, pursuant to Section 302 of the Sarbanes-Oxley Act of 2002 | |
| 32.1 | Certification of Principal Executive Officer, pursuant to Section 906 of the Sarbanes-Oxley Act of 2002 | |
| 32.2 | Certification of Principal Financial Officer, pursuant to Section 906 of the Sarbanes-Oxley Act of 2002 | |
| 101 | Interactive data files pursuant to Rule 405 of Regulation S-T: (i) the Consolidated Balance Sheets at December 31, 2011 and 2010, (ii) the Consolidated Statements of Operations for the years ended December 31, 2011 and 2010, (iii) the Consolidated Statements of Comprehensive Income for the years ended December 31, 2011 and 2010, (iv) the Consolidated Statements of Stockholders’ Equity for the years ended December 31, 2011 and 2010, (v) the Consolidated Statements of Cash Flows for the years ended December 31, 2011 and 2010, and (vi) the notes to the Consolidated Financial Statements, tagged as blocks of text. | |
| † | Portions of such exhibit have been omitted pursuant to a separate confidential treatment request and such information has been filed separately with the SEC. |
| * | Compensatory plan or arrangement required to be identified pursuant to Item 15(a)(3) of Form 10-K. |
88