Attached files
| file | filename |
|---|---|
| EXCEL - IDEA: XBRL DOCUMENT - SCIENTIFIC LEARNING CORP | Financial_Report.xls |
| EX-31.2 - EXHIBIT 31.2 - SCIENTIFIC LEARNING CORP | ex31_2.htm |
| EX-32.1 - EXHIBIT 32.1 - SCIENTIFIC LEARNING CORP | ex32_1.htm |
| EX-32.2 - EXHIBIT 32.2 - SCIENTIFIC LEARNING CORP | ex32_2.htm |
| EX-31.1 - EXHIBIT 31.1 - SCIENTIFIC LEARNING CORP | ex31_1.htm |
| EX-23.1 - EXHIBIT 23.1 - SCIENTIFIC LEARNING CORP | ex23_1.htm |
| EX-10.22 - EXHIBIT 10.22 - SCIENTIFIC LEARNING CORP | ex10_22.htm |
| EX-10.20 - EXHIBIT 10.20 - SCIENTIFIC LEARNING CORP | ex10_20.htm |
| EX-10.17 - EXHIBIT 10.17 - SCIENTIFIC LEARNING CORP | ex10_17.htm |
| EX-10.21 - EXHIBIT 10.21 - SCIENTIFIC LEARNING CORP | ex10_21.htm |
UNITED STATES
SECURITIES AND EXCHANGE COMMISSION
WASHINGTON, D.C. 20549
FORM 10-K
x ANNUAL REPORT PURSUANT TO SECTION 13 OR 15(d) OF THE SECURITIES EXCHANGE ACT OF 1934 FOR THE FISCAL YEAR ENDED DECEMBER 31, 2011
or
o TRANSITION REPORT PURSUANT TO SECTION 13 OR 15(D) OF THE SECURITIES EXCHANGE ACT OF 1934 FOR THE TRANSITION PERIOD FROM TO .
COMMISSION FILE NO. 000-24547
SCIENTIFIC LEARNING CORPORATION
(Exact name of registrant as specified in its charter)
|
DELAWARE
|
94-3234458
|
|
(State or other jurisdiction of incorporation or organization)
|
(IRS Employer Identification Number)
|
300 Frank H. Ogawa Plaza, Suite 600
Oakland, CA 94612
510-444-3500
(Address of Registrant’s principal executive offices, including zip code, and telephone number, including area code)
Securities registered pursuant to Section 12 (b) of the Act:
|
Title of Each Class
|
Name of Each Exchange on which Registered
|
|
Common Stock, par value $0.001 per share
|
NASDAQ Global Market
|
Securities registered pursuant to Section 12 (g) of the Act: NONE
Indicate by check mark if the registrant is a well-known seasoned issuer, as defined in Rule 405 of the Securities Act. Yes: o No: x
Indicate by check mark if the registrant is not required to file reports pursuant to Section 13 or Section 15(d) of the Act. Yes: o No: x
Indicate by check mark whether the registrant (1) has filed all reports required to be filed by Section 13 or 15(d) of the Securities Exchange Act of 1934 during the preceding 12 months (or for such shorter period that the registrant was required to file such reports), and (2) has been subject to such filing requirements for the past 90 days. Yes: x No: o
Indicate by check mark whether the registrant has submitted electronically and posted on its corporate Web site, if any, every Interactive Data File required to be submitted and posted pursuant to Rule 405 of Regulation S-T during the preceding 12 months (or for such shorter period that the registrant was required to submit and post such files). Yes: x No: o
Indicate by check mark if disclosure of delinquent filers pursuant to Item 405 of Regulation S-K is not contained herein, and will not be contained, to the best of the registrant's knowledge in definitive proxy or information statements incorporated by reference in Part III of this Form 10-K or any amendment to this Form 10-K. o
Indicate by check mark whether the registrant is a large accelerated filer, an accelerated filer a non-accelerated filer, or a smaller reporting company. (See the definitions of “large accelerated filer,” “accelerated filer” and “smaller reporting company” in Rule 12b-2 of the Exchange Act). (Check one):
Large accelerated filer o Accelerated filer o Non-accelerated filer o Smaller reporting company x
Indicate by check mark whether the registrant is a shell company (as defined in Rule 12b-2 of the Exchange Act). Yes: o No: x
The aggregate market value of the voting and non-voting common equity held by non-affiliates of the registrant, based upon the closing sale price of the Common Stock on June 30, 2011 as reported on the Nasdaq Global Market was approximately $37,862,195. Shares of Common Stock held by each director and executive officer and certain persons who owned 5% or more of the registrant's outstanding Common Stock on that date have been excluded in that such persons may be deemed to be affiliates. This determination of affiliate status is not necessarily a conclusive determination for other purposes.
As of March 16, 2012 the Registrant had outstanding 19,032,438 shares of Common Stock.
DOCUMENTS INCORPORATED BY REFERENCE
Portions of the Proxy Statement for the Registrant's 2012 Annual Meeting of Stockholders are incorporated by reference in Part III.
TABLE OF CONTENTS
|
PART I
|
PAGE NO.
|
||
|
Item 1.
|
1
|
||
|
Item 1A.
|
8
|
||
|
Item 1B.
|
13
|
||
|
Item 2.
|
13
|
||
|
Item 3.
|
13
|
||
|
Item 4.
|
13
|
||
|
PART II
|
|||
|
Item 5.
|
15
|
||
|
Item 6.
|
17
|
||
|
Item 7.
|
18
|
||
|
Item 7A.
|
29
|
||
|
Item 8.
|
30
|
||
|
Item 9.
|
53
|
||
|
Item 9A.
|
53
|
||
|
Item 9B.
|
53
|
||
|
PART III
|
|||
|
Item 10.
|
54
|
||
|
Item 11.
|
54
|
||
|
Item 12.
|
54
|
||
|
Item 13.
|
54
|
||
|
Item 14.
|
54
|
||
|
PART IV
|
|||
|
Item 15.
|
55
|
||
|
56
|
Forward Looking Statements
Some of the statements contained in this Annual Report on Form 10-K are forward-looking statements that involve risk and uncertainties. The statements contained in this Annual Report on Form 10-K that are not purely historical are forward-looking statements within the meaning of Section 27A of the Securities Act of 1933, as amended, and Section 21E of the Securities Exchange Act of 1934, as amended, including, without limitation, statements regarding our expectations, beliefs, intentions or strategies regarding the future. In some cases, you can identify forward-looking statements by terminology such as “may,” “will,” “should,” “expects,” “plans,” “anticipates,” “believes,” “intends,” “estimates,” “predicts,” “potential,” or “continue” or the negative of these terms or other comparable terminology. These statements are subject to known and unknown risks, uncertainties and other factors, which may cause our actual results to differ materially from those implied by the forward-looking statements. Important factors that may cause actual results to differ from expectations include those discussed in this Annual Report on Form 10-K in Item 1A – “Risk Factors”. All forward-looking statements included in this Annual Report on Form 10-K are based on information available to us on the date thereof, and we assume no obligation to update any such forward-looking statements.
PART I
ITEM 1. BUSINESS
Overview
We are an education company that accelerates learning by applying proven research on how the brain learns in online and on-premise software solutions. Our results show that learners who use our products can realize achievement gains of up to 2 years in as little as 3 months and maintain an accelerated rate of learning even after product use ends. We provide our learning solutions primarily to U.S. K-12 schools in traditional brick-and-mortar, virtual or blended learning settings and also to parents and learning centers, in more than 40 countries around the world.
We are highly differentiated because of our continuous focus on the “science of learning” - combining advances in the field of brain research with standards-based learning objectives to achieve dramatic student gains. At December 31, 2011, proof that our products produce substantial academic gains was demonstrated in 263 efficacy studies, including randomized controlled trials and longitudinal studies, representing results from approximately 95,000 aggregate participants. These studies show gains for students at all K-12 grade levels, for at-risk, special education, English language, Title One (low income, under achieving), and a variety of other students. Gains have been demonstrated throughout the United States and in ten other countries. The studies show that these gains endure over time.
2011 marked the start of our transition to a software as a service (SaaS) model. Our easy-to-use and easy-to-access web-based platforms, initially introduced in mid-2011 and improved in January 2012, are able to effectively deliver individualized learning opportunities to a large number of students simultaneously. Our Fast ForWord educational software products are now available on our browser-based SciLEARN Enterprise software platform and our on-demand platform MySciLEARN On Demand. The SciLEARN Enterprise and MySciLEARN platforms meet the needs of institution and district-wide installations by providing scalability, remote access, centralized reporting, asynchronous online professional development, and ease of administration for multiple campuses.
Markets
Our products are available worldwide to educational institutions, speech and language clinics, learning centers and parents.
United States K-12 Market
Our sales are concentrated in K-12 schools in the United States, which in 2011 were estimated to total over 116,000 schools serving approximately 55 million students in almost 14,000 school districts. In each of the last three fiscal years, the U.S. K-12 sector has represented approximately 87% of our sales.
Historically, we have focused our selling efforts on district-level administrators. Under our new selling model, initial selling efforts are also directed to building level principals and lead teachers for small initial purchases. After such initial implementations, we then seek to expand throughout the school and/or district based on the demonstrated efficacy of the products.
We market our products primarily as learning acceleration solutions, to be used in a blended model with existing teaching and curriculum materials, at both the elementary and secondary school levels. Despite a national focus on reading and increased school district accountability, independent evaluations of student performance have demonstrated little improvement in reading results. According to the U.S. Department of Education (USDE), in 2011, 67% of fourth graders in the United States were not “proficient” in reading and 33% performed below the “basic” level. Between 2009 and 2011, there was no change in average 4th grade reading scores. United States K-12 public schools are funded primarily through state and local tax revenues, but also receive funding from the federal government through a variety of programs, many of which target children who are poor and/or are struggling academically. The funding for a substantial portion of our K-12 sales has historically come from federal sources, in particular IDEA (special education) and Title One funding. The amount of this funding varies from time to time, as do the rules governing the use of this funding; the temporary additional American Recovery and Reinvestment Act (ARRA) education funding expired in 2011. There has been much recent discussion about changes to the federal No Child Left Behind Act, and the administration has granted 10 states waivers from certain requirements, but there has been no legislative agreement on significant changes. State and local funding for schools continues to be significantly impacted by decreases in tax revenues due to the recent recession. While education spending remains an important priority, over half the states have reduced their funding to schools compared to 2008, resulting in teacher layoffs, program restrictions and overall expense reductions.
Other Markets
In addition to selling to K-12 schools, we also sell to and through private practice professionals and learning centers. These speech and language and other professionals recommend the use of our products to appropriate clients and then supervise the use of the software, often in connection with their other services. In 2011, over 380 non-school professionals and entities in the United States and Canada (North America) offered our products.
In 2009, we began selling web-based products and tutoring services directly to parents. These products are designed to meet the needs of learners who want to “stay ahead” or “catch up” and are delivered via a SaaS (software as a service) model.
Sales to countries other than the United States and Canada are a small but growing part of our business, which we serve through a network of value-added resellers (VARs). During 2011, products were marketed to customers in 43 countries. As of December 31, 2011, we were represented by 22 VARs.
Our strategy for international markets thus far has been conservative, so that we do not divert resources from our U.S. K-12 market. However, we believe the potential international opportunity is significant. Outside of North America, our products are used in three primary applications: (1) in tutoring and learning centers to strengthen academic skills, (2) by clinical professionals with impaired children, and (3) assisting in the acquisition of English as a second language. About one-fourth to one-third of the worldwide population now understands and speaks English to some degree, and English is the international language of business, travel, and diplomacy. While our products, in and of themselves, do not provide all the components necessary to teach English to non-native speakers, they have been demonstrated to be extremely effective in assisting in English language instruction, through building the necessary underlying cognitive, acoustic processing, fluency and other skills needed to learn and speak English. Strategic initiatives with VARs in China and Southeast Asia have included the creation of franchise-based, “business-in-a-box” learning center models where our products are augmented by direct instruction and other supplementary activities to achieve measurable results in English improvement for students age 5-14.
Transition
Historically, the majority of our sales have been large transactions from U.S. K-12 school districts. In the recent and current economic conditions, it has been more challenging to close large transactions as district leaders feel pressure to fund only basic needs. In response, we have diversified our business model to target both building and district level decision-makers. We released our new platforms, SciLEARN Enterprise in late 2010 and MySciLEARN on demand in 2011, allowing us to better address the U.S. K-12 school and district markets and the international, consumer and virtual school markets with improved access and ease-of-use. Our current technology activities are focused on expanding these robust and scalable platforms while allowing us to rapidly add new products. As our model continues to become more diversified, we expect to become increasingly less dependent on large transactions and to significantly increase our subscription base with more predictable transactions and recurring revenue.
Products
Our products unify advances in the field of brain research with standards-based learning objectives to achieve enduring student gains. Our solutions augment any curricular approach and when blended with high-quality teacher led instruction, build learning capacity by systematically and rigorously developing the academic and cognitive skills required for lifelong learning success.
Fast ForWord products
Our flagship Fast ForWord family of products was built on the foundation that the learning brain can improve through exercise - the concept of brain fitness. These products apply learning principles that have been established through neuroscience and cognitive research as critical to learning new tasks: frequency and intensity of exercises, adaptivity to the students’ individual performance, timely motivation and simultaneous development of multiple skills. The Fast ForWord products are now web-based, improving ease-of-use, access and overall effectiveness of the products.
Fast ForWord Language and Literacy products
The Fast ForWord Language products for elementary learners and the Literacy products for adolescent learners build foundational reading and language skills to help districts move below grade level learners to be successful learners in the general classroom. These products include Fast ForWord Language v2, Fast ForWord Language to Reading v2, Fast ForWord Literacy and Fast ForWord Literacy Advanced.
The exercises in the Fast ForWord Language v2 product specifically focus on oral language comprehension and listening, including phonological awareness, listening accuracy and comprehension, working memory, and familiarity with language structures. The content and exercises of the Literacy product are similar to those of Language v2, but have been adapted to maximize impact for adolescents and English language learners. The Fast ForWord Language to Reading v2 product helps students make the link between spoken and written language, using exercises that focus on listening comprehension, sound letter recognition, phonological awareness, beginning word recognition and English language conventions. The Literacy Advanced software includes content and exercises similar to those in the Fast ForWord Language to Reading with a user interface that is designed to appeal to adolescents, emphasizing phonemic awareness, decoding, word recognition, sequential and inferential comprehension and the ability to sequence multi-step instructions.
Fast ForWord Reading products
The Fast ForWord Reading products build learning capacity through developing cognitive skills using exercises focused on critical “reading to learn” abilities. The Reading product exercises focus on phonemic awareness, phonics and decoding, spelling, vocabulary, fluency and comprehension. The Fast ForWord Reading products begin with Reading Readiness, which prepares the student for reading, focusing on phonemic identification, categorization and blending, letter names, sound and letter correspondence, rapid letter/word recognition, and oral vocabulary. The products continue with levels 1 through 5, which focus on reading skills and tasks of increasing complexity. The exercises in the Reading 5 product carry a significant working memory load, as they build vocabulary, improve critical thinking and abstract reasoning, improve composition skills, and focus on accuracy, fluency and comprehension.
Reading Assistant products
Reading Assistant provides a one-on-one reading tutor for every learner. This unique software combines advanced speech verification technology with scientifically-based interventions to provide help just when a learner needs it, strengthening their reading fluency, vocabulary and comprehension. Reading fluency is the ability of a student to read quickly enough to garner meaning from a text, and is reported to have a high correlation with overall reading proficiency. However, to become a fluent reader, students must frequently read aloud and receive timely feedback and assistance with their reading. Providing effective fluency training for all students is a challenge in the classroom because teachers do not have enough resources and/or time to give the consistent and rigorous one-on-one attention a child needs to improve his or her reading fluency. Reading Assistant addresses this problem by acting as a personal tutor – saving time for teachers and engaging learners.
MySciLEARN, Progress Tracker and Reading Progress Indicator
Progress Tracker, our Internet-based data analysis and reporting tool, analyzes student learning results to provide diagnostic and prescriptive intervention information and allows educators to track and report their students’ learning progress. Progress Tracker provides detailed reports at the student, classroom, school, and district level, and can be reported by subgroup, providing a tool for educators to analyze student progress towards required goals. The MySciLEARN reporting tab also provides a subset of this information, but in a more easy-to-understand user interface. We expect that the MySciLEARN reports will eventually replace Progress Tracker because of their improved ease-of-use.
Reading Progress Indicator is a reliable and valid assessment of a student’s reading skills. It is designed to be quick and convenient to administer before and after product use, to rapidly demonstrate the effectiveness of our products and place students in the right product sequence.
BrainSpark™ products and BrainPro™ services
The BrainSpark products and BrainPro services are based on our flagship Fast ForWord family of products.
The BrainSpark products are targeted at learners ages five through thirteen who are at or above grade level and want to improve their overall learning potential. BrainSpark is cross-training for the brain; the products exercise two or more “learning muscles” within each game exercise. The BrainSpark products can be purchased directly online and accessed via a web-browser from a computer.
BrainPro services are targeted at learners who are below grade level and want to catch up. BrainPro learners access our Fast ForWord family of products from home and work with a certified tutor remotely. The BrainPro tutor is responsible for defining a customized program and goals and helping the learner achieve progress toward the learning goals with the help of the parents.
KinderSpark iPad Application Series
The KinderSpark series was launched in October 2011 with Eddy’s Number Party!, the first app within the series. The KinderSpark series is designed to be a collection of engaging iPad games for children aged 3-6 that help them build kindergarten readiness skills and excel in learning by combining proven research on how the brain learns, input from education experts, and fun.
License Terms
We license our products in a variety of configurations to meet our customers’ needs. Schools typically purchase site or per student licenses, which are available either as a perpetual or subscription license. Most customers also purchase implementation services, which we believe are important to encourage successful use of the products.
Products licensed for administration by private practice professionals and parents are generally purchased on a per student basis. Products licensed by International VARs are generally purchased on a per student, per month subscription basis.
Services and Support
We believe that training and implementation support is important to achieving appropriate product use in schools, where a limited school day and competing priorities makes it challenging for educators to devote the time and resources needed for a solid implementation. As of December 31, 2011, our service and support organization included 49 employees supplemented by 22 independent contractors who provide on-site customer training, consulting and technical support services.
Services
To facilitate effective implementation, we offer on-site product training, technical installation, implementation management, consulting, and web-based synchronous and asynchronous professional development services. We also offer a Leadership and Accountability service focused at the district level, which provides administrators a detailed overview of the implementation at each of their schools, consulting on data analysis and interpretation, intervention and motivation strategies, connecting with classroom teachers and other topics of interest to the customer.
We host user conferences and a spectrum of both live and web-based forums, workshops, and seminars for customers and prospective customers. At these gatherings, speakers provide information on advances in research on how the brain learns, and current customers offer actual case studies on how our products impact student achievement. These sessions also provide our customers with opportunities to network and develop informal support relationships.
Support
For customers who purchase our support services, we provide software technical update releases, and extensive telephone, email, and chat support. Through our new MySciLearn platform and our customer support website, we provide extensive web-based implementation and technical resources.
Warranty
We generally provide a warranty that our software products operate substantially as described in the manuals and guides that accompany the software for a period of ninety days. The warranty excludes damage from misuse, accident, and certain other circumstances. To date, we have not experienced any significant warranty expense.
Sales and Marketing
We sell to our principal market, K-12 schools and districts throughout the United States, using a diversified sales channel. Our inside sales personnel target smaller districts and building-level decision-makers while our field sales personnel target district-level decision-makers at the larger school districts. We also sell to K-12 schools in Canada using our inside sales team.
We emphasize our highly differentiated message of “accelerating learning” through web-based marketing efforts to reach more educators quickly while targeting specific audiences with research results and success stories most relevant to their areas of responsibility and expertise.
Although our focus on improved sales force productivity includes a balance of smaller sales with shorter cycles to get started in new accounts, the majority of our annual booked sales are from existing customers who have a year or more of positive experience with our programs, expanding to new sites and adding products and services to existing sites.
We sell to clinical professionals and learning centers principally through direct marketing (mail, web and telesales) and conferences (both industry conferences and an annual forum we conduct ourselves). In 2009, we began selling directly to parents online with our e-learning offering, BrainSpark™, and our remote tutoring service, BrainPro™.
We also maintain a network of independent VARs outside North America. As of December 31, 2011, we had relationships with 22 VARs. To date, booked sales outside North America have not been significant. We are building this channel in response to the growing demand for English fluency around the world. We believe that our Fast ForWord and Reading Assistant products offer unique value in quickly “rewiring” the brain for English. We also believe that the international market has significant potential growth opportunities, and we are positioning ourselves to take advantage of these in the future.
Competition
Districts and schools employ a wide variety of learning programs and methods for their students. The market for supplemental and intervention educational products is fragmented and competitive, with no single company or product with a dominant market share.
The critical factors for K-12 school districts are the perceived ability of the product to improve student performance, impact teacher productivity and fit into the traditional school day. Attributes that influence the district’s assessment of these factors include the ability to deliver measurable improvements in student achievement, cost, ease-of-use, reputation, existing relationships with customers, completeness of the product offering, ability to provide effective and efficient product implementation, and ability to work with the other components of the school curriculum. We believe that generally we compete favorably on the basis of these factors.
Our patented products are highly differentiated by their proven results and focus on the development of learning capacity. With recent improvements in ease-of-use and access, we compete vigorously for available funding against other companies offering educational products and programs, as well as with providers of traditional methods of teaching. Many of the companies providing these competitive offerings are much larger than us, are more established in the school market than we are, offer a broader range of products to schools, and have greater financial, technical, marketing and distribution resources than we do. Competitors may enter our market segment and offer actual or claimed results similar to those achieved by our products. In addition, although the traditional approaches to learning are fundamentally different from the approach we take, the traditional methods are more widely known and accepted and, therefore, represent significant competition for available funds.
Product Development; New Products
The markets in which we compete are characterized by frequent product introductions and evolving educational standards and approaches. Our future success will depend in part on our ability to continue to enhance and update our existing products and to develop and successfully introduce new products. Most of our development leadership and personnel is located at our headquarters in Oakland, CA.
In 2010, we established a wholly-owned foreign subsidiary in Shanghai, China to provide research and development services to us, initially focused on Reading Assistant. As of December 31, 2011, 61 of our employees were engaged in research and development activities, which include product development, product management, and outcomes research. We also use extensive 3rd-party resources to supplement our employees in such areas as quality assurance, design and content development. Our research and development expenses were approximately $10.3 million, $7.9 million and $6.4 million for the years ended December 31, 2011, 2010 and 2009, respectively.
Development Strategy
Over the past several years, our development efforts have focused on broadening our product solution and making our products more effective and easier to use and access. Recently, our focus has been transitioning our products to a web-based platform. The first milestone in this effort was achieved in 2010 with the release of SciLEARN Enterprise, a browser-based platform hosted by the school district or learning institution. In 2011 we released MySciLEARN (originally SciLEARN On Demand), a browser-based platform hosted by us. These two platforms achieve our plan to roll out hosted offerings that expand our per student licensing option to the broader U.S. K-12 market and that we believe will more effectively address newer markets outside U.S. K-12.
During 2011, the Company also revamped its Lab to the Learner program for development of new products. Lab to the Learner is a collaborative effort between Scientific Learning and a network of scientists and research partners to create new applications based on the latest scientific research and methodologies. Most recently launched in conjunction with this program was Eddy’s Number Party!, Scientific Learning’s first iPad app, which was made available first as an individual app and will later be combined into a more comprehensive institutional program called KinderSpark for use in pre-K and K classrooms. Eddy’s Number Party! rose to as high as the fifth most popular paid Education iPad app during its first week after release.
During 2012, major planned development milestones include the launch of the Reading Assistant product on the SciLEARN Enterprise and MySciLEARN platforms, the first KinderSpark institutional program, as well as continued expansion of MySciLEARN.
Intellectual Property
Our intellectual property strategy addresses both product technology and product concepts. Our policy is to protect our proprietary rights in our products and technology through a combination of patents, trademarks, copyrights, trade secret laws, confidentiality procedures, and contractual provisions.
At December 31, 2011, we held the rights to 81 issued patents and 12 pending applications. These include 58 issued U.S. patents and 7 pending U.S. applications that we own or co-own. We also held 5 issued patents from other countries and had 5 applications pending abroad. We were the exclusive licensee under 11 issued U.S. patents and 7 issued foreign patents.
Our U.S. patents relating to the Fast ForWord products expire between 2014 and 2026; the Reading Assistant patents expire in 2024.
The 18 patents that we license are owned by the Regents of the University of California (“the Regents”) and Rutgers, the State University of New Jersey (collectively the “University patents”), and relate to the basic speech and sound modification and adaptive technology developed at those institutions. In 2011, approximately 49% of our product booked sales was derived from selling products that use the licensed inventions. This license is exclusive and extends for the life of the University patents, which expire in 2014, subject to the right of the Regents to terminate in case of default and our right to terminate at any time upon 60 days written notice. If we were to lose our rights under this license, it would materially harm our business. This license requires payment of royalties based upon cumulative net booked sales of our products, subject to certain minimum royalty amounts. For the remainder of the license term, the minimum annual royalty payment is $150,000. In fiscal 2011, 2010 and 2009, we had approximately $0.4 million, $0.5 million and $0.8 million, respectively in royalty expense under the license.
We also have 14 U.S. trademark registrations, including registrations for marks including “Fast ForWord,” our most important trademark.
Posit Science Corporation
In September 2003, we transferred certain of our technology to Posit Science Corporation (PSC) for use in the healthcare field. PSC’s products based on our technology primarily focus on combating age-related cognitive decline and enhancing cognitive abilities as people age. The transaction included a license of the patents we own and certain software we developed, a sublicense of the patents we license from the universities, and the sale of some research-related assets. All of the rights licensed to PSC are limited to a specified healthcare field and most of the licenses are exclusive in that field. For these rights, PSC paid us a one-time initial fee, issued us shares in PSC and has an ongoing royalty obligation. PSC has also agreed to cross-license any patents issued to PSC. We retain all rights to our technology outside of the specified healthcare field.
Dr. Michael M. Merzenich, who is one of our founders and a former officer and director of ours, is also a founder, director and significant stockholder of PSC.
Seasonality
Our quarterly booked sales and revenue fluctuate seasonally, reflecting a number of factors including school purchasing practices, budget cycles and instructional periods. Historically, our booked sales have been lowest in the first and fourth quarters of the year and highest in the second or third quarter of the year.
Backlog
Our deferred revenue was approximately $17.3 million as of December 31, 2011, and $21.9 million as of December 31, 2010. These deferred revenues are primarily composed of professional development and technical services that have not yet been performed and the portion of multi-year sales, subscription and term-based sales, support and Progress Tracker sales not yet recognized as revenue. Approximately $12.6 million of our deferred revenue as of December 31, 2011 is expected to be recognized within the next 12 months.
Employees
As of December 31, 2011 we had 240 full-time equivalent employees, compared to 214 at December 31, 2010. None of our employees are represented by a union or subject to collective bargaining agreements.
General
Scientific Learning is a Delaware corporation formed in 1997 and is a successor to Scientific Learning Principles Corporation, a California corporation. Our web address is www.scilearn.com.
Item 1A. Risk Factors
RISK FACTORS
The following factors as well as other information contained in this report should be considered in making any investment decision related to our common stock. If any of the following risks actually occurs, our business, financial condition and results of operations could be materially and adversely affected and the trading price of our common stock could decline.
Sales of our products depend on the availability and extent of government funding for public school reading intervention purchases, which is variable and outside the control of both us and our direct customers. If such funding becomes less available, our public school customers may be unable to purchase our products and services on a scale or at prices that we anticipate, which would materially and adversely impact our revenue and net income.
United States public schools are funded primarily through state and local tax revenues, which are devoted primarily to school building costs, teacher salaries and general operating expenses. Public schools also receive funding from the federal government through a variety of federal programs, many of which target children who are poor and/or are struggling academically. Federal funds typically are restricted to specified uses.
The funding for a substantial portion of our K-12 sales typically comes from federal sources, in particular IDEA (special education) and Title One funding. The amount of this funding varies from time to time, as do the rules governing the use of this funding. The federal budget deficit and competing federal priorities could adversely impact the ongoing level of federal education funding. The temporary additional American Recovery and Reinvestment Act (ARRA) education funding expired in 2011. There has been much recent discussion, and the administration has granted 10 states waivers from certain requirements, but there has been no legislative agreement about changes to the No Child Left Behind Act of 2001. A cutback in federal education funding or a change in the funding rules to allow general rather than restricted uses of federal funding could have a materially adverse impact on our revenue.
State education funding continues to be significantly impacted by state budget difficulties. According to the Center on Budget and Policy Priorities, in the 2011-2012 school year, elementary and high schools in at least 37 states are receiving less state funding than in the prior school year, and in at least 30 states, school funding now stands below 2008 levels. These reductions have resulted in teacher layoffs, program restrictions and overall expense reductions. While state revenues have begun to grow since their low in 2010, as of the third quarter of 2011, state revenues remained 7 percent below pre-recession levels, again according to the Center on Budget and Policy Priorities. While education spending remains an important priority for states, it faces competition from demands for, among other things, relief for the unemployed and homeowners and rising healthcare costs. Continued pressure on state budgets and state education funding could have a materially adverse impact on our revenue.
Our sales cycle has tended to be long and somewhat unpredictable, which may result in delayed or lost sales, materially and adversely impacting our revenue and profitability.
More than 87% of our 2011 booked sales came from the K-12 market in the U.S. and Canada. In that market we have historically depended on a relatively small number of large transactions for a significant part of our sales. These types of sales require multiple levels of approval in a political environment, resulting in a time-consuming sales cycle that can be difficult to predict, particularly in a tight funding environment. Therefore, we may devote significant time and energy to a particular customer sale over the course of many months, and then not make the sale when expected or at all. In 2011, we had three transactions over $500,000, compared to five such transactions in 2010.
We may not be successful in executing our transition to a new business model.
We are completing the development of our new on-demand offerings to transition the business away from our historic sales model and to make us less dependent on large U.S. K-12 transactions. In 2011, we began selling our flagship Fast ForWord on-demand, and in January 2012, we launched Fast ForWord on our improved MySciLEARN on-demand platform. We expect our on-demand offerings to allow us to better address the international, consumer and virtual school markets, as well as the U.S. K-12 market we now principally serve and to allow us to significantly increase the number of smaller, more predictable transactions and recurring revenue. In order to successfully accomplish this transition, we need to rapidly increase our transaction volume, sell to and achieve acceptance with new types of customers, and complete our product development in a timely manner, including launching our Reading Assistant product on-demand. We may find our marketing and sales efforts in this market less effective or more expensive than we have planned. If we fail to achieve the level of market acceptance that we expect, we may be unable to achieve our planned level of sales and revenue.
It is difficult to accurately forecast our future financial results. This may cause us to fail to achieve the financial performance anticipated by investors and financial analysts, which could cause the price of our stock to decline.
Our revenue and results of operations are difficult to predict and may fluctuate substantially from quarter to quarter and from year to year. In 2011, we had a net loss of $6.5 million compared to a net loss of $9.7 million in 2010 (which included a non-cash impairment charge of $3.9 million) and net income of $4.8 million in 2009. In the past, our sales strategy has primarily emphasized district-level, multi-site transactions. The receipt or implementation of a single large order, or conversely its loss or delay, significantly impacted the level of sales booked and revenue recognized in a given quarter. In 2012, our sales focus has shifted to substantially increasing our volume of significantly smaller sales, an emphasis which began with our on-demand launch in June, 2011. We expect that this will make us less dependent on large unpredictable sales, but this is a new model for us, and the speed and extent of our transition is uncertain.
Our expense levels are based on our expectations of future revenue and are primarily fixed in the short term. We may not be able to adjust spending in a timely manner to compensate for any unexpected revenue shortfall, which could cause our net income to fluctuate unexpectedly.
Failure to achieve the financial results expected by investors and financial analysts in a given quarter could cause an immediate and significant decline in the trading price of our common stock.
Our cash flow is highly variable and may not be sufficient to meet all of our objectives.
During 2011, we used $7.2 million cash in operations, while in 2010, we used $4.2 million and in 2009 we generated $14.5 million in cash from operations. During 2012, we expect to fund our operations primarily through a combination of our current cash balances, including approximately $6.5 million in net proceeds from a private offering of our common stock completed on March 28, 2012 and cash available under our credit line.
Historically, we have used cash in our operations during the first half of the year and built cash in the second half. This pattern results largely from our seasonally low sales in the first and fourth calendar quarters, which reflects our industry pattern, and the time needed to collect on sales made towards the end of the second quarter.
On March 28, 2012, we closed our sale of 4,176,420 shares of company common stock at a price of $1.73 per share in a private transaction to several investors, which resulted in approximately $6.5 million in net proceeds to us. As a part of the transaction, we issued warrants to the investors for an aggregate of 2,505,852 additional shares of Common Stock. The warrants have an exercise price of $1.82 per share and are exercisable until 60 months after issuance.
We recently amended our credit line with Comerica Bank (Comerica), which has provided us with a line of credit since 2004. Our amended line of credit has a limit of $5 million, and expires December 31, 2013. On March 15, 2012, we borrowed $3.0 million under the line of credit and we are in compliance with all applicable covenants of the credit line.
Borrowings under the line are subject to reporting covenants requiring the provision of financial statements to Comerica and financial covenants requiring us to maintain a specified minimum adjusted quick ratio and a specified level of net worth. The required levels vary over the course of the year. If we do not comply with the covenants, we risk being unable to borrow under the credit line.
Funding our liquidity needs will require us to achieve certain levels of booked sales, collections, and expenses. If we are unable to achieve the required levels, or are unable to obtain waivers or amendments from Comerica in the event we do not comply with our covenants, we would be required to obtain additional debt or equity financing from other sources, to reduce expenses, or to sell assets. Reducing our expenses could adversely affect our operations. We cannot assure you that we will be able to secure additional debt or equity financing or sell assets on acceptable terms, if at all. In addition, raising additional equity financing could result in substantial dilution of our current equity holders and in the net tangible book value per share of such holdings.
To grow our K-12 business, we need to increase acceptance of our products among K-12 education purchasers. Failure to do so would materially and adversely impact our growth prospects.
Our Fast ForWord products use an approach that differs from the approaches that schools have traditionally used to address reading problems. In particular, our products, which are designed to develop the brain to process more efficiently, are based on neuroscience research and focus on building cognitive skills. These concepts may be unfamiliar to educators. K-12 educational practices are generally slow to change, and it can be difficult to convince educators of the value of a substantially different approach.
In order to obtain the best student results from using our product, schools must follow a recommended protocol for Fast ForWord use, which requires at least 30 minutes per day out of a limited and already crowded school day. Our recommendation that schools follow a prescribed protocol in using our products may limit the number of schools willing to purchase from us. In addition, if our products are not used in accordance with the protocol, they may not produce the expected student results, which may lead to customer dissatisfaction and decreased revenue.
Our products are generally implemented in a computer lab with a lab coach or teacher rather than in the classroom with the students’ regular classroom teachers. To reach a broader group of customers, encourage additional sales from existing customers and improve student achievement results, we need to better engage classroom teachers in the products’ implementation, in an effective and efficient manner.
If we are unable to convince our market of the value of our significantly different approach and otherwise overcome the challenges identified above, our growth prospects could be materially and adversely impacted.
If we determine that any of our intangible assets, including technology purchased in acquisitions, or goodwill are impaired, we would be required to take a charge to earnings, which could have a material adverse effect on our results of operations.
We recorded a significant amount of goodwill and other intangible assets, such as core technology, related to our acquisition of the Soliloquy product line in January 2008. We periodically evaluate goodwill and all significant intangible assets for impairment. Because of our decision to migrate the core technology associated with the Reading Assistant product acquired from Soliloquy to a web-enabled delivery platform, we determined it was necessary to assess the recoverability of the asset group associated with generating Reading Assistant cash flows. Based on our impairment analysis, we incurred non-cash charges of $3.9 million related to the write-down of the Soliloquy core technology asset group in the fourth quarter of 2010.
At December 31, 2010, after we recorded this impairment charge, we had $4.6 million of goodwill and $1.0 million of intangible assets. Significant judgments are required to evaluate goodwill and intangible assets for impairment, including estimating future cash flows, projecting future sales, forecasting industry trends and market conditions, and making other assumptions. Changes in these estimates and assumptions could materially affect our impairment determinations, which could result in non-cash charges that would adversely affect our results of operations.
Concentration of our sales in the K-12 market exposes our business to risks specific to that market.
More than 87% of our 2011 booked sales came from the K-12 market in the United States and Canada. Because of the concentration of our sales in this market, we are particularly exposed to its risks. For example, the K-12 market is characterized by its dependence on federal funding and state and local tax revenues; a political environment, particularly when large transactions are involved; and a generally conservative approach to change. All of these attributes, particularly in the current economic and political environment, can result in a time-consuming and unpredictable sales cycle for large transactions.
We rely on studies of student performance results to demonstrate the effectiveness of our products. If the validity of these studies or the conclusions that we draw from them are challenged, our reputation could be harmed and our business prospects and financial results could be materially and adversely affected.
We rely heavily on statistical studies of student results on assessments to demonstrate that our products lead to improved student achievement, which involves certain risks. For example, a school may fail to appropriately implement the products or adhere to the product protocol, resulting in a study that does not produce substantial student improvements. In addition, some studies on which we rely may be challenged because the studies use a limited sample size, lack a randomly selected control group, include assistance or participation from us or our scientists, or have other design characteristics that are not optimal. These challengers may assert that these studies are not sufficiently rigorous or free from bias, and may lead to criticism of the validity of the studies and the conclusions that we draw from them. Our sales and marketing efforts, as well as our reputation, could be adversely impacted if the studies upon which we rely to demonstrate the effectiveness of our products, or the conclusions we draw from those studies, are seen to be insufficient.
We may not be able to develop new and improved products and services as needed to address changing market trends or emerging technologies in a timely and cost effective manner.
We need to design, develop and introduce new and improved products and services on a cost effective basis and on a timeline that keeps pace with changing market trends and emerging technology developments. We had significant product introductions in 2011, and are planning additional product improvements and introductions in 2012. We may encounter unexpected difficulties developing new products and improvements that could delay our introduction of new products and services or cause their development to be more costly than planned. Additionally, our product changes may not receive the market acceptance we anticipate. If we fail to develop products and services cost effectively that respond to technology and market developments, we may lose market share and revenue, and our business could materially suffer.
If our operations are disrupted due to weaknesses in our technology infrastructure, our business could be harmed.
Providing our products and services and conducting our general business operations both substantially rely on computer and network systems. Over the past several years, our computer and network systems became outdated, and we have experienced disruptions in both our customer and internal network services due to hardware failures. We have now modernized much of our hardware infrastructure, and are completing a major upgrade to our business software platforms. In addition, our disaster recovery capability, while improved, does not permit us to recover immediately from certain sorts of disasters. We believe that our business is becoming increasingly dependent on our hardware and software infrastructure, and as a result, the reliability of our systems has become increasingly important. If our customer systems are disrupted, we may be required to issue credits, customers may elect not to renew their contracts or not to purchase additional licenses, we may lose sales to potential customers and we may be subject to liability. If our internal systems are disrupted, we may lose productivity and incur delays in product development, sales operations or other functions.
If our products contain errors or if customer access to our web-delivered products and services is disrupted, we could lose new sales and be subject to significant liability claims.
Because our software products are complex, they may contain undetected errors or defects, known as bugs. Bugs can be detected at any point in a product’s life cycle, but are more common when a new product is introduced or when new versions are released. We expect that, as we have experienced in the past, despite our testing, errors will be found in new products and product enhancements in the future. We launched important product revisions in 2011 and expect additional important launches in 2012.
Many of our products and services rely on the World Wide Web in order to function. Unanticipated problems affecting our network systems, third-party facilities, telecommunications or electricity supply could cause interruptions or delays in the delivery of these products. We have experienced problems due to power loss in the past, and we will continue to be exposed to the risk of access failure in the future.
If there are significant errors in our products or problems with customer access to our web-delivered products and services, we could be required to issue credits or we could experience delays in or loss of market acceptance of our products, diversion of our resources, decreases in expansions or renewals, injury to our reputation, increased service expenses or payment of damages.
Our product development office in China exposes us to risks specific to China, including those associated with currency exchange rates, Chinese government regulations and business practices, and intellectual property.
We established a wholly-owned subsidiary in Shanghai, China in 2010, which provides us with product development services. Previously, substantially all of our operations were located in the United States, and our sales outside the United States and Canada were made in U.S. Dollars to local distributors. Our Chinese operation conducts its operations in Chinese RMB, and therefore exposes us to the risk of unexpected and possibly sudden increases in expenses caused by shifts in currency exchange rates. In addition, Chinese government regulations and business practices are quite different from those in the U.S., and operating under those regulations and challenges may pose unexpected costs, delays or difficulties. Further, intellectual property protection is not as strong in China as in the U.S., and operating a product development group in China may increase our risk of infringement or misappropriation of our intellectual property by others.
Claims relating to data collection from our user base may subject us to liabilities and additional expense.
Schools and clinicians that use our products frequently use students’ names to register them in our products and enter into our database academic, diagnostic and/or demographic information about the students. In addition, the results of student use of our products are uploaded to our database. We have designed our system to safeguard this personally-identifiable information, but the protection of such information is an area of increasing public concern and significant government regulation, including but not limited to the Children’s Online Privacy Protection Act. If our privacy protection measures prove to be ineffective, we could be subject to liability claims for unauthorized access to or misuses of personally-identifiable information stored in our database. We may also face additional expenses to analyze and comply with increasing regulation in this area.
We may not be able to compete effectively in the education market.
The market in which we operate is very competitive. We compete vigorously for the funding available to schools, not only against other software-based reading intervention products but also against print and service-based offerings from other companies and against traditional methods of teaching language and reading. Many of the companies providing these competitive offerings are much larger than we are, are more established in the school market than we are, offer a broader range of products to schools, have already offered more web-based products, and have greater financial, technical, marketing and distribution resources than we do. In addition, although traditional approaches to language and reading are fundamentally different from our approach, the traditional methods are more widely known and accepted and, therefore, represent significant competition for available funds.
If we lose key personnel or are unable to hire additional qualified personnel as necessary, we may not be able to achieve our business goals, which could materially and adversely affect our financial results and share price.
We depend on the performance of our senior management, sales, marketing, development, research, educational, finance and other administrative personnel with extensive experience in our industry and with our Company. The loss of key personnel could harm our ability to execute our business strategy, which could adversely affect our financial results and share price. In addition, we believe that our future success will depend in large part on our continued ability to identify, hire, retain and motivate highly skilled employees who are in great demand. We cannot assure you that we will be able to do so.
If we are unable to maintain our access to the intellectual property rights that we license from third parties, our sales and net income will be materially and adversely affected.
Our most important products are based on licensed inventions owned by the University of California and Rutgers, the State University of New Jersey. These licensed patents expire in 2014. In 2011, we generated approximately 49% of our booked sales from products that use this licensed technology. The University patents are the earliest and in some ways the broadest of our patents. We have additional patents that we own with later expiration dates that we believe afford substantial continuing patent coverage for the same products. However, once the University patents expire, it may be more difficult to prevent others from marketing similar products.
We also have incorporated technology and content licensed from other third parties as part of our products and services. If we were to lose our rights under any of our in-licenses (whether through expiration of our exclusive license period, expiration of the underlying patent’s exclusivity, invalidity or unenforceability of the underlying patents, a breach by us of the terms of the license agreements or otherwise), such a loss of these licensed rights or a requirement that we must re-negotiate these licenses could materially harm our booked sales, our revenue and our net income.
If we are unable to adequately protect our intellectual property rights or if we infringe on the rights of others, we could become subject to significant liabilities, need to seek licenses or lose our rights to sell our products.
Our ability to compete effectively depends in part on whether we are able to maintain the proprietary aspects of our technology and to operate without infringing on the proprietary rights of others. It is possible that our issued patents will be found invalid or will not offer sufficient protection against competitors, that our trademarks will be challenged or infringed, or that our pending patent applications will not result in the issuance of patents. If others are able to develop similar products due to the expiration, unenforceability or invalidity of the underlying patents, the resulting competition could materially harm our sales. The Company historically has not registered its copyrights in the United States, which may make it difficult to collect damages from a third party that may be infringing a Company copyright.
In addition, we could become party to patent or trademark infringement claims, litigation or interference proceedings. These proceedings could result from claims that we are violating the rights of others or may be necessary to enforce our own rights. Any such proceedings would result in substantial expense and significant diversion of management effort, and the outcome of any such proceedings cannot be accurately predicted. An adverse determination in such proceedings could subject us to significant liabilities or require us to seek licenses from third parties, which may not be available on commercially reasonable terms or at all. In addition, competitors may design around our technology or develop competing technologies. Intellectual property rights may also be unavailable or limited in some foreign countries, which could make it easier for competitors to capture or increase their market share with respect to related technologies. Further, if unauthorized copying or misuse of our products were to occur to a substantial degree, our sales could be adversely affected.
Our common stock is thinly traded and its price is volatile.
Our common stock presently trades on the Nasdaq Global Market, and our trading volume is generally low. For example during 2011, our average daily trading volume was approximately 9,300 shares. As a result, the ability of holders of our common stock to sell such common stock and thereby monetize their investment may be limited. In addition, the market price of our common stock has been highly volatile since we became publicly traded and could continue to be subject to wide fluctuations.
The ownership of our common stock is concentrated.
At December 31, 2011, Trigran Investments owned approximately 27% of our outstanding stock, and our executive officers and directors held approximately 11% of the outstanding stock. As a result, these stockholders are able to exercise significant influence over all matters requiring stockholder approval, including the election of directors and approval of significant corporate transactions, and may have interests that diverge from those of other stockholders. This concentration of ownership may also delay, prevent or deter a change in control of the Company.
As of March 28, 2012, after our completed offering of common stock, Trigran Investments owned approximately 25% of our outstanding stock, and our executive officers and directors held approximately 9% of the outstanding stock.
ITEM 1B. UNRESOLVED STAFF COMMENTS
Not applicable
ITEM 2. PROPERTIES
We currently have the following leased properties:
|
|
1.
|
A lease for approximately 30,500 square feet of office space in Oakland, California for our headquarters that expires in December 2013. The lease includes two five-year options to extend the term of the lease.
|
|
|
2.
|
A lease for approximately 6,200 square feet of office space in Tucson, Arizona for our support center that expires in May 2013.
|
|
|
3.
|
A lease for an office in Shanghai, China for 2,500 square feet that expires in May 2012 to be used for research and development.
|
We believe our facilities are sufficient for our operations currently and should be adequate to meet our needs for at least the next year.
ITEM 3. LEGAL PROCEEDINGS
None.
ITEM 4. MINE SAFETY DISCLOSURES
Not applicable.
EXECUTIVE OFFICERS
The following table sets forth information concerning our executive officers:
|
Name
|
Age
|
Title
|
||
|
D. Andrew Myers
|
40
|
President and Chief Executive Officer
|
||
|
Linda L. Carloni
|
58
|
Senior Vice President, General Counsel and Corporate Secretary
|
||
|
Robert E. Feller
|
43
|
Chief Financial Officer, Senior Vice President and Treasurer
|
||
|
Dr. William M. Jenkins
|
61
|
Senior Vice President and Chief Scientific Officer
|
||
|
Jessica Lindl
|
38
|
Senior Vice President, Marketing and Inside Sales
|
||
|
Ronald Park
|
45
|
Chief Technical Officer
|
D. Andrew Myers joined us as President and Chief Operating Officer in January 2008 and became our Chief Executive Officer in January 2009. Prior to joining us, Mr. Myers worked at Pearson Education since 1996. His last position was as Senior Vice President, Digital Product Development for Pearson Curriculum, where he was responsible for integrating the technology teams from six preceding business units into a digital development group of 275 employees. From August 2004 to March 2007, Mr. Myers was the Chief Operations Officer for Pearson Digital Learning, where he was responsible for setting product, financial, technical and operational strategies for that 580-employee business unit. From 2002 to 2004, Mr. Myers served as Vice President Sales for Pearson Digital Learning. Mr. Myers started with Pearson as a sales representative in 1996. Pearson Education is the education division of Pearson PLC, an international media company. Mr. Myers holds an MBA from the Haas School of Business at the University of California Berkeley and a BS in finance from the University of Utah.
Linda L. Carloni joined us as General Counsel in October 1999, became our Secretary in March 2000, was appointed Vice President in June 2000 and Senior Vice President in January 2009. Before joining us, Ms. Carloni was a founder and Vice President of Alere Medical Incorporated, a healthcare services start-up. Earlier in her career, Ms. Carloni worked in technology transfer for the University of California, was the general counsel of Nellcor Incorporated, a medical device company, and was an associate and a partner at the Cooley Godward law firm. She received her bachelor's degree in political science from Case Western Reserve University and her law degree from Boalt Hall School of Law at the University of California, Berkeley.
Robert E. Feller joined us in December 2008 as our Chief Financial Officer. From 2006 until joining us, Mr. Feller served as Vice President, Finance and Administration at AdBrite, Inc., which operates an Internet-based advertising marketplace. Prior to AdBrite, he served in financial leadership positions of increasing responsibility at salesforce.com, a leading provider of web-based customer relationship management services, from 2003 to 2006, ending his Salesforce service as Vice President, Finance. Mr. Feller began his career as an auditor with Arthur Andersen, LLP. He holds an MBA from the Ross School of Business at the University of Michigan and a BA from the University of Michigan.
Dr. William M. Jenkins was appointed Chief Scientific Officer in June 2009. Dr. Jenkins is a founder and served as Senior Vice President, Product Development from November 2000 through 2008 and Chief Technical Officer from January 2009 to June 2009. From 1990 to 1996, Dr. Jenkins was an Adjunct Associate Professor at the University of California, San Francisco. Dr. Jenkins is the principal developer of our current learning exercises. Dr. Jenkins holds a B.S. in Psychology, an M.A. in Psychobiology and a Ph.D. in Psychobiology from Florida State University, with additional post-doctoral training from UCSF.
Jessica Lindl joined us as Vice President of Marketing in March 2007 and was promoted to Senior Vice President in January 2009. Prior to joining us, Ms. Lindl served as Vice President of Marketing and Product Management for Riverdeep, a leading developer of educational software. Ms. Lindl held marketing management positions of increasing responsibility at Riverdeep and The Learning Company, which was acquired by Riverdeep, from 2001 through 2006. Ms. Lindl began her career in sales and sales management for AT&T. Ms. Lindl holds a bachelor’s degree in economics and international studies from Miami University in Oxford, Ohio and an MBA from the Haas School of Business at the University of California, Berkeley.
Ron Park joined Scientific Learning in June 2009 as Vice President, Product Development and became a Senior Vice President in February 2011 and Chief Technical Officer in October 2011. Mr. Park has over 20 years of product development experience in the software industry. Before joining us, Mr. Park served from 2008-2009 as founder and CTO of Arkapi Corporation, a provider of web and iPhone applications. Prior to Arkapi, Mr. Park served from 2006-2007 as VP Engineering and Products for MuleSource Inc., an open source service-oriented architecture and enterprise service bus middleware software vendor. Prior to MuleSource, from 2004 to 2007, Mr. Park was Group Director, Engineering at Siebel Systems, Inc. and Oracle Corporation after its acquisition of Siebel. Earlier in his career Mr. Park held various management and engineering positions at both large and small software companies. Mr. Park holds a BS in Computer Science and Engineering from the University of California, Los Angeles, and an MBA from The Wharton School at the University of Pennsylvania.
PART II
ITEM 5. MARKET FOR REGISTRANT'S COMMON EQUITY, RELATED STOCKHOLDER MATTERS AND ISSUER PURCHASE OF EQUITY SECURITIES
|
|
(a)
|
Market Information. Our common stock currently is, and since March 29, 2010 has been, traded on the Nasdaq Global Market under the symbol "SCIL”. Prior to March 29, 2010, our common stock traded on the Nasdaq Capital Market under the symbol “SCIL”.
|
The following table sets forth, for the periods indicated, the closing high and low sales prices per share of our common stock as reported on the NASDAQ Global Market and NASDAQ Capital Market, as applicable.
|
|
High
|
Low
|
||||||
|
Fiscal year ending December 31, 2011
|
||||||||
|
First quarter
|
$ | 3.54 | $ | 2.85 | ||||
|
Second quarter
|
$ | 3.27 | $ | 2.87 | ||||
|
Third quarter
|
$ | 3.25 | $ | 2.50 | ||||
|
Fourth quarter
|
$ | 3.46 | $ | 2.51 | ||||
|
Fiscal year ending December 31, 2010
|
||||||||
|
First quarter
|
$ | 5.73 | $ | 4.71 | ||||
|
Second quarter
|
$ | 5.47 | $ | 4.65 | ||||
|
Third quarter
|
$ | 5.49 | $ | 4.59 | ||||
|
Fourth quarter
|
$ | 4.52 | $ | 3.00 | ||||
Stockholders
As of March 16, 2012, the approximate number of stockholders of record of our common stock was 91.
Dividend Policy
We have never declared or paid cash dividends on our common stock, and we do not anticipate paying any cash dividends in the foreseeable future. Our current Loan and Security Agreement with Comerica Bank provides that we may not pay any dividends other than stock dividends during the term of the Agreement.
Securities Authorized for Issuance under Equity Compensation Plans
For information regarding securities authorized for issuance under equity compensation plans, see Item 12.
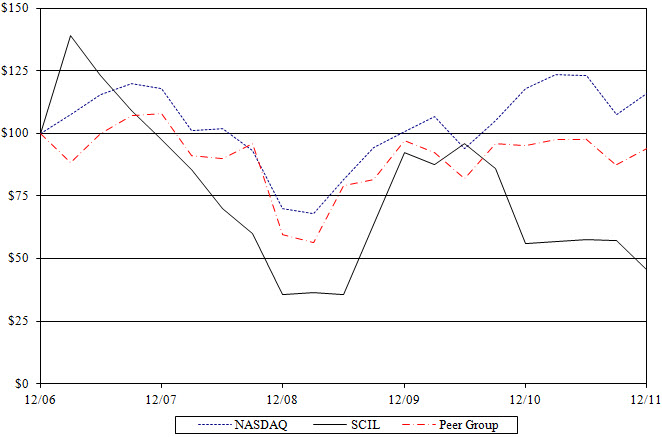
Performance Measurement Comparison
The following chart compares the cumulative total stockholder return of Scientific Learning Common Stock for the five years ended December 31, 2011 with the cumulative total return during the same period of (i) the NASDAQ Composite Market Index and (ii) a Scientific Learning constructed peer group index. The companies in the peer group index were selected on the basis of similarity in the nature of their business. At December 31, 2011, the peer group included Cambium, Scholastic Corporation, K12 Inc, Archipelago Learning and Princeton Review. Over the last five years we have changed companies in the peer group because of acquisitions, changes in business, new companies entering the market and other changes affecting peer group companies. This table shows these changes:
|
Members of Peer Group
|
Tenure in Peer Group
|
|
Cambium
|
Added to peer group in 2011 to replace Renaissance Learning, Inc.
|
|
Renaissance Learning Inc.
|
Removed from peer group in December 2011 after it was acquired.
|
|
Excelligence
|
Removed from peer group after September 30, 2006 after it stopped trading.
|
|
K12 Inc
|
Added to peer group in 2008 after going public in December 2007.
|
|
Archipelago Learning
|
Added to peer group in 2010 after going public in November 2009.
|
|
Plato Learning Inc.
|
Removed from peer group in May 2010 after it was acquired.
|
The comparison assumes $100 was invested on December 31, 2006 in Scientific Learning Common Stock and in each of the foregoing indices. It also assumes reinvestment of dividends. The performance shown in the graph below should not be considered an indication of future performance.
Recent Sales of Unregistered Securities; Use of Proceeds from Registered Securities
Not applicable
(b) Not applicable
(c) Not applicable
In thousands, except per share amounts
|
Year Ended December 31,
|
||||||||||||||||||||
|
2011
|
2010
|
2009
|
2008
|
2007
|
||||||||||||||||
|
Statement of Operations Data:
|
||||||||||||||||||||
|
Revenues:
|
||||||||||||||||||||
|
Products
|
$ | 21,758 | $ | 22,506 | $ | 35,863 | $ | 28,301 | $ | 31,023 | ||||||||||
|
Service and support
|
19,321 | 20,878 | 19,425 | 19,453 | 15,030 | |||||||||||||||
|
Total revenues
|
41,079 | 43,384 | 55,288 | 47,754 | 46,053 | |||||||||||||||
|
Cost of revenues:
|
||||||||||||||||||||
|
Cost of products
|
1,766 | 2,092 | 2,679 | 2,178 | 1,680 | |||||||||||||||
|
Cost of service and support
|
8,922 | 9,348 | 8,895 | 9,721 | 8,539 | |||||||||||||||
|
Total cost of revenues
|
10,688 | 11,440 | 11,574 | 11,899 | 10,219 | |||||||||||||||
|
Gross profit
|
30,391 | 31,944 | 43,714 | 35,855 | 35,834 | |||||||||||||||
|
Operating expenses:
|
||||||||||||||||||||
|
Sales and marketing
|
17,979 | 21,498 | 24,042 | 23,587 | 24,868 | |||||||||||||||
|
Research and development
|
10,324 | 7,933 | 6,418 | 7,016 | 4,500 | |||||||||||||||
|
General and administrative
|
8,413 | 8,129 | 8,135 | 7,883 | 7,660 | |||||||||||||||
|
Impairment charge
|
— | 3,890 | — | — | — | |||||||||||||||
|
Total operating expenses
|
36,716 | 41,450 | 38,595 | 38,486 | 37,028 | |||||||||||||||
|
Operating income (loss)
|
(6,325 | ) | (9,506 | ) | 5,119 | (2,631 | ) | (1,194 | ) | |||||||||||
|
Interest and other income (expense), net
|
13 | (41 | ) | 110 | 564 | 1,266 | ||||||||||||||
|
Income (loss) before income tax
|
(6,312 | ) | (9,547 | ) | 5,229 | (2,067 | ) | 72 | ||||||||||||
|
Provision for income taxes (income tax benefit)
|
164 | 143 | 429 | 1,248 | (1,082 | ) | ||||||||||||||
|
Net income (loss)
|
$ | (6,476 | ) | $ | (9,690 | ) | $ | 4,800 | $ | (3,315 | ) | $ | 1,154 | |||||||
|
Basic net income (loss) per share
|
$ | (0.34 | ) | $ | (0.52 | ) | $ | 0.27 | $ | (0.19 | ) | $ | 0.07 | |||||||
|
Diluted net income (loss) per share
|
$ | (0.34 | ) | $ | (0.52 | ) | $ | 0.26 | $ | (0.19 | ) | $ | 0.06 | |||||||
|
Shares used in computing basic net income (loss) per share
|
18,870 | 18,498 | 18,039 | 17,488 | 17,161 | |||||||||||||||
|
Shares used in computing diluted net income (loss) per share
|
18,870 | 18,498 | 18,690 | 17,488 | 18,297 | |||||||||||||||
|
Balance Sheet Data:
|
||||||||||||||||||||
|
Cash and cash equivalents
|
$ | 5,871 | $ | 5,415 | $ | 20,679 | $ | 7,550 | $ | 21,179 | ||||||||||
|
Short-term investments
|
— | 9,631 | — | — | — | |||||||||||||||
|
Working capital
|
(5,030 | ) | 1,176 | 5,178 | (3,551 | ) | 7,862 | |||||||||||||
|
Total assets
|
21,863 | 31,803 | 43,128 | 30,260 | 33,803 | |||||||||||||||
|
Stockholders’ equity (net capital deficiency) (1)
|
(681 | ) | 4,334 | 11,929 | 5,045 | 5,820 | ||||||||||||||
(1) We have paid no cash dividends since our inception
ITEM 7. MANAGEMENT’S DISCUSSION AND ANALYSIS OF FINANCIAL CONDITIONS AND RESULTS OF OPERATIONS
Overview
We develop, distribute and license technology that accelerates learning by applying proven research on how the brain learns. We are differentiated by our continuous focus on the “science of learning” – combining advances in the field of brain research with standards-based learning objectives to achieve dramatic student gains. Extensive outcomes research by independent researchers, our founding scientists, school districts and our company demonstrates the rapid and lasting gains achieved through participation in our products. Our products are marketed primarily to K-12 schools in the U.S., to whom we sell through a direct sales force. To facilitate the use of our products, we offer a variety of on-site and remote professional and technical services, as well as phone, email and web-based support. Since our inception, learners have used our products nearly three million times and over 7,000 schools have purchased at least $10,000 of our product licenses and services. As of December 31, 2011, we had 240 full-time equivalent employees, compared to 214 at December 31, 2010.
Business Highlights
We market our products primarily as learning acceleration solutions, to be used in a blended model with existing teaching and curriculum materials, at both the elementary and secondary school levels. According to the U.S. Department of Education (USDE), in 2011, 67% of fourth graders in the United States were not “proficient” in reading and 33% performed below the “basic” level. Between 2009 and 2011, there was no change in average 4th grade reading scores. While our installed base is growing, the over 7,000 schools that have purchased at least $10,000 of our product licenses and services represent a small fraction of the approximately 116,000 K-12 schools in the U.S.
States provide school districts with the majority of their funding, and those funds are also sometimes used to purchase our products. Additionally, federal education funds are a critical resource in helping school districts address the needs of the most challenged learners. We believe that a significant proportion of our sales are funded by federal sources, particularly Title One and IDEA (special education) grants.
During 2011, school districts focused more attention on balancing operating budgets than on investing in tools to improve student achievement. We experienced a decline in revenue and booked sales in 2011 compared to 2010, which we believe resulted from state budget pressures, uncertainty about future education policies, and an increasing trend toward using federal funds wherever possible to save teacher jobs and core programs rather than on supplemental programs focused on struggling learners. According to the Center on Budget and Policy Priorities, in the 2011-2012 school year, elementary and high schools in at least 37 states are receiving less state funding than in the prior school year, and in at least 30 states school funding now stands below 2008 levels.
Despite the recent attention school districts have paid to balancing their budgets, we believe our solutions will remain well-positioned for federal Title One, IDEA and competitive funding opportunities such as Race to the Top and School Improvement Grants, due to the continued emphasis on achievement mandates and education reform.
Company Highlights
Our total revenue decreased by 5% during 2011 as compared to 2010. Our total booked sales decreased by 14% during 2011 as compared to 2010. (Booked sales is a non-GAAP financial measure. For more explanation on booked sales, see discussion below). K-12 booked sales decreased by 18% during 2011 as compared to 2010. In 2011, we closed three transactions in excess of $500,000 totaling $3.1 million compared to five such transactions totaling $3.7 million in 2010. In 2012, we expect that our new platform will enable us to expand our per student licensing option to the broader U.S. K-12 market, and we anticipate that we will become less dependent on large transactions. We believe our new platform will enable us to significantly increase the number of smaller, more predictable transactions and recurring revenue. Non-school booked sales, including private practice, international, direct to consumer, virtual schools and OEM customers, increased by 20% during 2011 as compared to 2010.
Operating expenses decreased by 11% during 2011 as compared to 2010.
Results of Operations
Revenues
The following table sets forth information relating to our revenues (dollar amounts in thousands):
|
|
Year ended December 31,
|
2010-2011 | 2009-2010 | |||||||||||||||||
|
|
2011
|
2010
|
2009
|
% Change
|
% Change
|
|||||||||||||||
|
Products
|
$ | 21,758 | $ | 22,506 | $ | 35,863 | (3 | )% | (37 | )% | ||||||||||
|
Service and support
|
19,321 | 20,878 | 19,425 | (8 | ) % | 8 | % | |||||||||||||
|
Total revenues
|
$ | 41,079 | $ | 43,384 | $ | 55,288 | (5 | ) % | (22 | )% | ||||||||||
2011 versus 2010: Product revenues decreased by $0.7 million in 2011 compared to 2010, although booked sales decreased by $5.9 million. The impact of the proportionally larger booked sales decline on recognized revenue was somewhat diminished by product revenue that was deferred from 2010 to 2011 due to product functionality that was committed to customers in 2010 but was not delivered until 2011.We also expect the decrease in booked sales to unfavorably impact recognized product revenue in 2012 due to the recognition of subscription revenue ratably over the contract term. Our service and support revenue decreased by $1.6 million in 2011 compared to 2010. The decrease in 2011 was primarily due to lower U.S. K-12 booked sales and a decrease in service days delivered, as we continue to shift to web-based training and away from higher priced on-site services. As our business shifts to providing predominantly a hosted solution, we expect that it will also require fewer services, particularly fewer low margin on-site training and consulting days. We expect MySciLEARN to enable our users to become more self-reliant in obtaining product knowledge, and we also expect the shift from on-site to online training and consulting to continue.
For 2011, our renewal rate decreased to 87% from 88% in 2010. Renewal rate is determined by dividing the number of school sites that renewed annual support and maintenance contracts by the total number of sites whose contracts were expiring in the period.
2010 versus 2009: Product revenues decreased by $13.4 million in 2010 compared to 2009. The decrease in 2010 from 2009 was primarily due to lower U.S. K-12 booked product sales as school districts continued to struggle with current and anticipated budget shortfalls. Our service and support revenue increased by $1.5 million in 2010 compared to 2009 due to a higher renewal rate as we continued to focus on increasing product effectiveness and customer success. For 2010, our renewal rate increased to 88% from 80% in 2009.
We continue to focus on increasing the percentage of recurring, predictable revenue. In late 2010, we released the first version of our new SciLEARN platform, SciLEARN Enterprise, an on-premise solution that permits large customers to host our solutions on-premise and deploy from their own central server out to multiple school sites. In the second quarter of 2011, we released the second version of our SciLEARN platform, MySciLEARN On-Demand, which gives our customers the option to access our solutions online, via the SciLEARN platform hosted by us. At the end of 2011, the total number of active school sites on the new platform has increased 13% to 3,080 with 22% of those sites using the MySciLEARN On-Demand version of Fast ForWord. We expect that the MySciLEARN platform will increase the proportion of our revenue that is recurring. Over time, we expect that MySciLEARN, together with new per student pricing options we introduced in the second quarter of 2011 and changes in our business model, will increase our volume of smaller transactions, shorten sales cycles, and increase our ability to drive predictable, recurring revenue. In 2011 compared to 2010 our transaction count increased 10% from 1,643 transactions to 1,803 transactions. In 2011, the recurring portion of our revenue stream increased 6% to $13.0 million. The following table sets forth information relating to our recurring revenues (dollar amounts in thousands):
|
|
|
Year Ended December 31,
|
|
|||||||||||||||||
|
|
|
2011
|
|
|
2010
|
|
2009
|
|
2008
|
|
|
2007
|
|
|||||||
|
Products
|
|
|
||||||||||||||||||
|
Recurring1
|
|
$
|
2,324
|
|
|
$
|
1,476
|
|
|
$
|
629
|
|
$
|
169
|
|
|
$
|
—
|
|
|
|
Non-recurring
|
19,434
|
21,030
|
35,234
|
|
28,132
|
31,023
|
||||||||||||||
|
Total products
|
21,758
|
22,506
|
35,863
|
|
28,301
|
31,023
|
||||||||||||||
|
Service and support
|
||||||||||||||||||||
|
Recurring1
|
10,700
|
10,832
|
10,421
|
|
10,048
|
7,452
|
||||||||||||||
|
Non-recurring
|
8,621
|
10,046
|
9,004
|
|
9,405
|
7,578
|
||||||||||||||
|
Total service and support
|
19,321
|
20,878
|
19,425
|
|
19,453
|
15,030
|
||||||||||||||
|
Total revenues
|
|
$
|
41,079
|
$
|
43,384
|
$
|
55,288
|
|
$
|
47,754
|
$
|
46,053
|
||||||||
|
Recurring revenue as a % of total revenue
|
32
|
%
|
28
|
%
|
20
|
%
|
21
|
%
|
16
|
%
|
||||||||||
|
Non-recurring revenue as a % of total revenue
|
68
|
%
|
72
|
%
|
80
|
%
|
79
|
%
|
84
|
%
|
||||||||||
1 Recurring revenue is GAAP revenue recognized in the current period. It is predictable revenue that is likely to continue in future reporting periods. We derive recurring revenue from subscription fees paid by US and international customers to access our applications, on-line consumer products, and web-delivered reporting tools and from support & maintenance fees paid by our customers, who previously purchased perpetual software products.
Booked sales
Booked sales are a non-GAAP financial measure that management uses to evaluate current selling activity. We believe that booked sales is useful because it is the most direct measure of current demand for our products and services. Booked sales equals the total value (net of allowances) of subscriptions, software, services and support invoiced in the period. Revenue on a GAAP basis is recorded for booked sales when all four of the requirements for revenue recognition, as stated in our revenue recognition policy below, have been met; if any of the requirements to recognize revenue are not met, the sale is recorded as deferred revenue. We use booked sales information for resource allocation, planning, compensation and other management purposes. We believe that revenue is the most comparable GAAP measure to booked sales. However, booked sales should not be considered in isolation from revenue, and is not intended to represent a substitute measure of revenue or any other performance measure calculated under GAAP.
The following reconciliation table sets forth our booked sales, revenues and change in deferred revenue (dollar amounts in thousands):
|
|
Year ended December 31,
|
2010-2011 | 2009-2010 | |||||||||||||||||
|
|
2011
|
2010
|
2009
|
% Change
|
% Change
|
|||||||||||||||
|
Total deferred revenue beginning of period
|
$ | 21,871 | $ | 22,230 | $ | 19,952 | (2 | )% | (37 | )% | ||||||||||
|
Booked Sales
|
35,950 | 41,838 | 59,701 | (14 | ) % | (30 | ) % | |||||||||||||
|
Less: revenue recognized
|
41,079 | 43,384 | 55,288 | (5 | )% | (22 | )% | |||||||||||||
|
Other adjustments
|
580 | 1,187 | (2,135 | ) | (51 | )% | (156 | )% | ||||||||||||
|
Total deferred revenue end of period
|
$ | 17,322 | $ | 21,871 | $ | 22,230 | (21 | )% | (2 | )% | ||||||||||
2011 versus 2010: Booked sales is primarily comprised of sales to the K-12 sector which decreased by 18% to $31.3 million in 2011 compared to $37.9 million in 2010. As described above, during 2011 state budget pressures again caused many school districts to focus on retaining teaching positions and continuing their core operations rather than purchasing supplemental programs. Booked sales to the K-12 sector for 2011 and 2010 were 87% and 91%, respectively, of total booked sales. “Other adjustments” in 2011 consists primarily of the recognition of deferred revenue and the related receivable for 2010 booked sales with Free-On-Board (“FOB”) destination delivery terms that were not delivered until 2011.
2010 versus 2009: Booked sales in the K-12 sector decreased by 32% to $37.9 million in 2010 compared to $56.2 million in 2009. State budget pressures caused many school districts to delay purchases during 2010. Booked sales to the K-12 sector for 2010 and 2009 were 91% and 94%, respectively, of total booked sales. “Other adjustments” in 2010 consists primarily of the recognition of deferred revenue and the related receivable for 2009 booked sales with FOB destination delivery terms that were not delivered until 2010.
Historically, large booked sales, which we define as transactions totaling more than $500,000, have been an important indicator of mainstream education industry acceptance and an important factor in reaching our goal of increasing sales force productivity. In 2011, we closed three transactions in excess of $500,000 compared to five in 2010 and twenty in 2009. In 2011 and 2010, school districts struggled with current and anticipated budget shortfalls, making it especially difficult to close large deals in our pipeline. In 2009, we benefited from the increased federal funding made available to schools by ARRA. For the years ended December 31, 2011, 2010 and 2009, 9%, 9% and 37%, respectively, of our booked sales arose from transactions over $500,000. Large booked sales include volume and negotiated discounts but the percentage discount applicable to any given transaction will vary and the relative percentage of large booked sales and smaller booked sales in a given quarter may fluctuate. Because we allocate discounts disproportionately to product licenses compared to service and support fees for non-subscription orders, product booked sales and revenue are disproportionately affected. We cannot predict the size and number of large transactions in the future. MySciLearn, together with new per student pricing options we introduced in the second quarter of 2011 and changes in our business model, are designed to decrease our dependence on large transactions by increasing our volume of smaller transactions and shortening sales cycles. We continue to focus on increasing the percentage of recurring, predictable sales. In 2011, the recurring portion of our booked sales increased 7% to $12.4 million. The following table sets forth information relating to our recurring booked sales (dollar amounts in thousands):
|
Year Ended December 31,
|
||||||||
|
|
|
2011
|
|
|
2010
|
|
||
|
Recurring booked sales1
|
|
$
|
12,376
|
|
|
$
|
11,563
|
|
|
Non-recurring booked sales
|
23,574
|
30,275
|
||||||
|
Total booked sales
|
|
$
|
35,950
|
$
|
41,838
|
|||
|
Recurring booked sales as a % of total booked sales
|
34
|
%
|
28
|
%
|
||||
|
Non-recurring booked sales as a % of total booked sales
|
66
|
%
|
72
|
%
|
||||
1 Booked sales of recurring contracts is a non-GAAP measure of predictable sales that generate recurrent revenue, which is a GAAP measure defined above.
Booked sales to non-school customers increased by 20% to $4.7 million in 2011 as compared to 2010. Booked sales to non-school customers increased by 10% in 2010 as compared to 2009. The increases in 2011 and 2010 reflect higher sales to international VARs, OEM’s, consumers and virtual schools, partially offset by lower sales to private practice clinicians, who were more directly impacted by recent economic conditions.
Although the current economic and financial conditions, the expiration of federal stimulus funding, and federal, state and local budget pressures make for an uncertain funding environment for our customers, we remain optimistic about our growth prospects in the K-12 and non-school markets. However, achieving our growth objectives will depend on increasing customer acceptance of our products, which requires us to continue to focus on improving our products’ ease of use, their fit with school requirements, and our connection with classroom teachers and administrators. Our K-12 growth prospects are also influenced by factors outside our control, including general economic conditions and the overall level, certainty and allocation of state, local and federal funding. While federal funding for education remains significant, the current level of federal spending and the federal deficit are likely to put pressure on all areas in the federal budget. States continue to experience severe budget pressure from the adverse conditions in the job, housing and credit markets. These conditions may continue to impact state education spending.
In addition, the revenue recognized from our booked sales can be unpredictable. Our various license and service packages have substantially differing revenue recognition periods, and it is often difficult to predict which license package a customer will purchase, even when the amount and timing of a sale can be reasonably projected. In addition, the timing of a single large order or its implementation can significantly impact the level of booked sales and revenue at any given time.
Gross Profit and Cost of Revenues
The following table sets forth information relating to our gross profits (dollar amounts in thousands):
|
|
Year ended December 31,
|
2010-2011 | 2009-2010 | |||||||||||||||||
|
|
2011
|
2010
|
2009
|
% Change
|
% Change
|
|||||||||||||||
|
Gross profit on products
|
$ | 19,992 | $ | 20,414 | $ | 33,184 | (2 | )% | (39 | )% | ||||||||||
|
Gross profit on service and support
|
10,399 | 11,530 | 10,530 | (10 | ) % | 10 | % | |||||||||||||
|
Total gross profit
|
30,391 | 31,944 | 43,714 | (5 | )% | (27 | )% | |||||||||||||
|
Gross profit margin on products
|
92 | % | 91 | % | 93 | % | 1 | % | (2 | )% | ||||||||||
|
Gross profit margin on service and support
|
54 | % | 55 | % | 54 | % | (1 | )% | 1 | % | ||||||||||
|
Total gross profit margin
|
74 | % | 74 | % | 79 | % | 0 | % | (5 | )% | ||||||||||
2011 versus 2010: The overall gross profit margin was consistent in 2011 compared to 2010. Product revenues made up 53% of total revenues in 2011, compared to 52% in 2010. Product margins increased by 1% in 2011 over 2010, mainly due to decreased product costs and product mix change towards higher-margin products. Service and support margins decreased by 1% in 2011 compared to 2010, mainly due to the decrease in the number of service days delivered, as we continue to shift to web-based training and away from higher priced on-site services.
2010 versus 2009: The overall gross profit margin decreased by 5% in 2010 compared to 2009 due to declines in the proportion of higher margin product revenue. Product revenues made up 52% of total revenues in 2010, compared to 65% in 2009. Product margins decreased by 2% in 2010 over 2009, mainly due to lower revenues over which fixed costs could be allocated. Service and support margins increased by 1% in 2010 compared to 2009, reflecting higher delivery of services in 2010.
Operating Expenses
The following table sets forth information relating to our expenses (dollar amounts in thousands):
|
|
Year ended December 31,
|
2010-2011 | 2009-2010 | |||||||||||||||||
|
|
2011
|
2010
|
2009
|
% Change
|
% Change
|
|||||||||||||||
|
Sales and marketing
|
$ | 17,979 | $ | 21,498 | $ | 24,042 | (16 | ) % | (11 | )% | ||||||||||
|
Research and development
|
10,324 | 7,933 | 6,418 | 30 | % | 24 | % | |||||||||||||
|
General and administrative
|
8,413 | 8,129 | 8,135 | 4 | % | 0 | % | |||||||||||||
|
Impairment charge
|
— | 3,890 | — | (100 | ) % | 100 | % | |||||||||||||
|
Total operating expenses
|
$ | 36,716 | $ | 41,450 | $ | 38,595 | (11 | ) % | 7 | % | ||||||||||
Sales and Marketing: Sales and marketing expenses consist principally of salaries and incentive compensation paid to employees engaged in sales and marketing activities, travel costs, tradeshows, conferences, and marketing and promotional materials. The $3.5 million decrease in sales and marketing expenses in 2011 compared to 2010 and the $2.5 million decrease in sales and marketing expenses in 2010 compared to 2009 were mainly due to lower commission and bonus expenses as we did not meet our sales quotas in either 2010 or 2011. In addition, we reduced marketing expenses in 2011 compared to 2010 and in 2010 compared to 2009. At December 31, 2011, we had 50 quota-bearing sales personnel compared to 51 and 49 at December 31, 2010 and 2009, respectively.
Research and Development: Research and development expenses principally consist of compensation paid to employees and consultants engaged in research, product development and product management activities and product testing, together with software and equipment costs. Research and development expenses increased by $2.4 million in 2011 compared to 2010. Research and development expenses increased by $1.5 million in 2010 compared to 2009. During 2011 and 2010, we continued to make critical investments in product development which resulted in increased headcount and consulting expenses. We also incurred startup expenses for our new development office in Shanghai, China in 2010.
General and Administrative: General and administrative expenses principally consist of salaries and compensation paid to our executives, accounting staff and other support personnel, as well as travel expenses for these employees, and outside legal and accounting fees. The $0.3 million increase in general and administrative expenses in 2011 compared to 2010 was primarily due to increase in the use of consultants as well as the increase in depreciation expense due to an increase in property, plant and equipment. General and administrative expenses remained unchanged for 2010 as compared to 2009 as a result of lower bonus expense offset by increased legal and consulting expenses related to our exploration of strategic alternatives in the area of mergers and acquisitions.
Impairment Charge: Impairment charge is attributable to the impairment of the long lived asset group associated with the Reading Assistant product line acquired through the purchase of Soliloquy in 2008. We acquired Soliloquy for its Reading Assistant product line that uses speech recognition technology to improve reading fluency. We have seen success in both the U.S. K-12 and the international markets, as our partners successfully developed an effective English language learning curriculum around the product. Because of this success, we are making additional investments in Reading Assistant to replace the core technology and enable compatibility with our new web-based platform. Due to this investment, we assessed whether the intangible asset group acquired from Soliloquy, including some capitalized software development costs post acquisition, was impaired in accordance with the required accounting rules.
We used an income approach to determine if the sum of the undiscounted cash flows expected to result from the use and eventual disposition of the asset group associated with Reading Assistant exceeded the carrying values of those assets. As a result of this assessment, the carrying value of the asset group exceeded the undiscounted cash flows. We then applied a fair-value-based test. The fair value of the asset group was estimated using the expected present value of future cash flows which rely on estimates, judgments and assumptions. These estimates, judgments and assumptions include the discount rate, expected remaining useful life of the asset group and cash flows generated during the remaining useful life. This analysis resulted in a non-cash impairment charge of $3.9 million in 2010, which includes $0.5 million related to capitalized software development costs.
Income Tax Provision
2011: During 2011, we recorded an income tax provision of approximately $0.2 million, and our valuation allowance increased by approximately $2.6 million. We did not owe any federal income taxes due to our current and past taxable losses. The tax provision in 2011 and 2010 resulted from minimum state and statutory foreign taxes.
Our effective tax rate decreased to negative 2.7% for fiscal year 2011 compared to negative 1.5% for the same period a year ago.
As of December 31, 2011, we had U.S. federal and state net operating loss carryforwards of approximately $69.4 million and $50.9 million, respectively. The U.S. federal net operating loss carryforwards will expire at various dates beginning in 2019 through 2031 if not utilized. State net operating loss carryforwards will expire at various dates beginning in 2013 through 2031.
As of December 31, 2011, we had U.S. federal and state tax credit carryforwards of approximately $2.4 million and $3.2 million, respectively. The federal credit will expire at various dates beginning in 2018 through 2031, if not utilized. California state research and development credits can be carried forward indefinitely.
2010: During 2010, we recorded an income tax provision of approximately $0.1 million, and our valuation allowance increased by approximately $3.1 million. We did not owe any federal income taxes due to our current and past taxable losses. The tax provision in 2011 and 2010 resulted from minimum state and statutory foreign taxes.
Our effective tax rate decreased to (1.5)% for fiscal 2010 compared to 8.2% for fiscal 2009. The decrease was primarily due to U.S. losses not benefitted in 2010.
2009: During 2009, we recorded an income tax provision of approximately $0.4 million, and our valuation allowance decreased by approximately $2.4 million.
Net operating loss carryforwards and credit carryforwards reflected above are limited due to ownership changes as provided in the Internal Revenue Code and similar state provisions.
Liquidity and Capital Resources
Our cash and cash equivalents were $5.9 million at December 31, 2011, compared to cash and cash equivalents and short-term investments of $15.0 million at December 31, 2010.
We expect that during at least the next twelve months our current cash balances, including approximately $6.5 million in net proceeds from a private offering of our common stock completed on March 28, 2012 and cash available under our credit line will be our primary sources of liquidity and will be sufficient to provide the necessary funds for our operations and capital expenditures. Historically, we have used cash in our operations during the first half of the year and generated cash from operations in the second half. This pattern results largely from our seasonally low sales in the first and fourth calendar quarters, which reflects our industry pattern, and the time needed to collect on sales made towards the end of the second quarter. We expect that this pattern will continue, that we will use cash in operations during the first half of 2012 and that our current cash balances and credit line will be sufficient to fund our operating requirements during that period. Accomplishing this, however, will require us to achieve certain levels of booked sales, collections, and expenses. We cannot assure you that we will achieve these levels. If we are unable to achieve the needed booked sales and collections levels, we expect to reduce our expenses to ensure that we have sufficient liquidity to continue our operations through at least December 31, 2012. Reducing expenses significantly beyond our current plans could have a negative impact on our future growth potential.
On March 28, 2012, we closed our sale of 4,176,420 shares of Common Stock at a price of $1.73 per share in a private transaction to several investors, which resulted in approximately $6.5 million in net proceeds to us. As a part of the transaction, we issued warrants to the investors for an aggregate of 2,505,852 additional shares of Common Stock. The warrants have an exercise price of $1.82 per share and are exercisable until 60 months after the issuance.
In February 2012, we amended and restated our revolving line of credit agreement with Comerica Bank (Comerica). The maximum that can be borrowed under the agreement is $5.0 million and the line expires on December 31, 2013. Borrowing under the line of credit bears interest at a “daily adjusting LIBOR rate” and is subject to reporting covenants requiring us to provide financial statements to Comerica and financial covenants requiring us to maintain a specified minimum adjusted quick ratio and a specified level of net worth, of which the required levels vary over the course of the year. There were no borrowings outstanding under our Comerica line at December 31, 2011. On March 15, 2012, we borrowed $3.0 million under the line of credit. We are in compliance with all applicable covenants of the credit line. If we do not comply with the convenants, we risk being unable to borrow under the credit line.
Net cash used in operating activities for 2011 was $7.2 million versus cash used of $4.2 million during 2010. The decrease in cash was predominantly the result of lower booked sales and timing of collections.
Net cash provided by investing activities in 2011 was $7.4 million, of which $9.5 million was from the sales and maturities of investments (net of purchase of $5.3 million) and $2.1 million was used for capital spending primarily related to investments in the new SaaS platform and new systems for back-office operations. Net cash used in investing activities in 2010 was $11.7 million, of which $9.6 million was used for the purchase of investments (net of sales and maturities of $6.7 million) and $2.0 million was used for capital spending primarily related to investments in research and development and new systems for back-office operations. We do not anticipate having similarly high levels of capital spending in 2012.
Financing activities generated $0.2 million in 2011 resulting from proceeds from the exercise of stock options net of a use of cash to settle tax withholdings on restricted stock units. Financing activities for 2010 generated $0.6 million resulting from proceeds from the exercise of stock options.
Off-Balance Sheet Arrangements
We have no off-balance sheet arrangements.
Contractual Obligations and Commitments
We have a non-cancelable lease agreement for our corporate office facilities in Oakland, California. The minimum lease payment was approximately $78,000 per month through 2008. From 2009 through the end of the lease, the base lease payment increases at a compound annual rate of approximately 5%. The lease expires in December 2013. We also have a lease agreement for our Tucson, Arizona office through May 2013 at an average rent of approximately $11,000 per month and a lease for our Shanghai, China research and development office for 2,500 square feet at a rate of approximately $4,000 per month through May 2012. In addition, we lease certain equipment under capital lease arrangements that extend through 2014 for the amounts of $170,000 in 2012, $55,000 in 2013, and $7,000 in 2014.
We also make royalty payments to the institutions who participated in the original research that produced our initial products. Our minimum royalty payments are $150,000 per year.
The following table summarizes our obligations at December 31, 2011 and the effects such obligations are expected to have on our liquidity and cash flow in future periods (in thousands):
| 2012 | 2013 | 2014 | 2015 and thereafter | Total | ||||||||||||||||
|
Contractual Obligations:
|
|
|
|
|||||||||||||||||
|
Lease obligations
|
$ | 1,444 | $ | 1,297 | $ | 7 | $ | — | $ | 2,748 | ||||||||||
|
Minimum royalty obligations
|
150 | 150 | 150 | — | 450 | |||||||||||||||
|
Total
|
$ | 1,594 | $ | 1,447 | $ | 157 | $ | — | $ | 3,198 | ||||||||||
Lease obligations include both capital and operating leases. Our purchase order commitments at December 31, 2011 are not material.
Application of Critical Accounting Policies
Our financial statements are prepared in accordance with accounting principles generally accepted in the United States (“GAAP”). These accounting principles require us to make certain estimates, assumptions and judgments. We believe that the estimates, assumptions and judgments upon which we rely are reasonable based upon information available to us at the time. The estimates, assumptions and judgments that we make can affect the reported amounts of assets and liabilities as of the date of the financial statements, as well as the reported amounts of revenues and expenses during the periods presented. To the extent there are material differences between these estimates and actual results, our financial statements would be affected.
We believe that the estimates, assumptions and judgments pertaining to revenue recognition and allowance for doubtful accounts are the most critical to understand in order to evaluate our reported financial results. A detailed discussion of our use of estimates, assumptions and judgments as they relate to these polices is presented below. We have discussed the application of these critical accounting policies with the Audit Committee of the Board of Directors.
Revenue Recognition
We derive revenue from the sale of licenses to our software and from professional service and support fees. Software license revenue is recognized in accordance with accounting standards for software companies. Additionally, we derive revenue from subscription fees for access to and use of our on-demand application services. Under our subscription arrangements for our on-demand application services, the customer does not have the contractual right to take possession of the software at any time during the subscription period. Thus, revenue for our subscription services is recognized in accordance with accounting standards for service contracts.
There are four basic criteria which must be met to recognize revenue. These are: 1) persuasive evidence of an arrangement exists; 2) delivery of the product has occurred; 3) a fixed or determinable fee; and 4) the collection of the fee is reasonably assured. The application of the relevant accounting standards requires us to exercise significant judgment related to specific transactions and transaction types. In cases where extended payment terms are granted to school customers, we determine if the fixed or determinable fee criterion is met by reference to the customer’s specific funding sources, especially where the payment terms extend into the customer’s next fiscal year. If we determine that the fixed or determinable fee criterion is not met at the inception of the arrangement, we defer revenue recognition until the payments become due.
The value of software licenses, subscriptions, professional services and support invoiced during a particular period is recorded as deferred revenue until recognized. All revenue from transactions that include software licenses for new products that have not yet been delivered is deferred until the delivery of all products. Direct costs related to deferred software license revenue are deferred until the related license revenue is recognized.
Multiple contracts with the same customer are generally accounted for as separate arrangements, except in cases where contracts are so closely related that they are effectively part of a single arrangement.
Multiple-element software arrangements
Booked sales of software to our school customers typically include multiple elements (e.g., Fast ForWord perpetual software licenses, support, training, implementation management, and other professional services). We recognize software revenue using the residual method, whereby the difference between the total arrangement fee and the total “vendor specific objective evidence” (“VSOE”) of fair value of the undelivered elements is recognized as revenue relating to the delivered elements. VSOE of fair value for each element of an arrangement is based upon the normal pricing and discounting practices for those products and services when sold separately and, for support services, is also measured by the renewal price. We are required to exercise judgment in determining whether VSOE of fair value exists for each undelivered element based on whether the pricing for these elements is sufficiently consistent.
Multiple-element on-demand application service arrangements
Booked sales of subscriptions to our on-demand application services can also include multiple elements similar to software arrangements. We follow accounting guidance for revenue recognition of multiple-element arrangements to determine whether such arrangements contain more than one unit of accounting. Multiple-element arrangements require the delivery or performance of multiple products, services and/or rights to use assets. To qualify as a separate unit of accounting, the delivered item must have value to the customer on a standalone basis and revenue is allocated to each deliverable in the arrangement based on the relative fair value of the respective deliverable. Our on-demand subscription services, support, training and implementation management services have standalone value as these services are sold separately by us, and we have established VSOE of fair value for determining the fair value of each element except for our on-demand subscription services.
For our on-demand subscription services, we have determined the fair value to be allocated to these services based on our best estimate of selling price (BESP). In determining BESP, we have considered various factors including our historical pricing practices and internal costs, as well as historical student usage data related to previous sales of our products.
Product revenue
Product revenue is primarily derived from the licensing of software and access to and use of our on-demand application services. Product revenue is recognized as follows:
|
·
|
Perpetual licenses – software licensed on a perpetual basis. Revenue is recognized at the later of product delivery date or contract start date using the residual method. If VSOE of fair value does not exist for all the undelivered elements, all revenue is deferred and recognized ratably over the service period if the undelivered element is services or when all elements have been delivered.
|
|
·
|
Software term licenses – software licensed for a specific time period, generally a term of one to three years. Revenue is recognized ratably over the license term.
|
|
·
|
Individual participant licenses – software licensed for a single participant. Revenue is recognized over the average period of use, typically six weeks.
|
|
·
|
On-demand application services – revenue for subscription services is recognized ratably over the term of the subscription period.
|
Professional service and support revenue
Professional service and support revenue is derived from a combination of training, implementation, technical and professional services, online services and customer support. Training, implementation, technical and other professional services are typically sold on a per day basis. Professional services revenue is recognized as performed. If VSOE of fair value does not exist for all the elements in a software arrangement except software licenses, service revenue is recognized over the longest contractual period in an arrangement. Revenue from services sold alone or with support is recognized as performed.
If an arrangement includes services that are essential to the functionality of software, we recognize the fees for the software license and the services using the percentage of completion method in accordance with the accounting standards for software and service companies. We estimate the percentage of completion on contracts utilizing hours incurred to date as a percentage of the total estimated hours to complete the project. Recognized revenues and profit are subject to revisions as the contract progresses to completion. Revisions in profit estimates are charged to income in the period in which the facts that give rise to the revision become known.
|
Accounts Receivable
|
|
We conduct business primarily with public school districts and speech and language professionals in the United States. We record accounts receivable at the invoiced amount and we do not require collateral. We maintain an allowance for doubtful accounts for estimated losses due to the inability of customers to make payments. The allowance is determined based on any specific reserves deemed necessary and our historical experience of bad debt write-offs.
|
Goodwill
Goodwill and purchased intangible assets were recorded when we acquired the assets of Soliloquy in 2008. The cost of the acquisition was allocated to the assets and liabilities acquired, including purchased intangible assets, and the remaining amount was classified as goodwill. Goodwill arising from purchase transactions is not amortized to expense, but rather periodically assessed for impairment. The allocation of the acquisition cost to purchased intangible assets and goodwill, therefore, has a significant impact on operating results. The allocation process involves an extensive use of estimates and assumptions, including estimates of future cash flows to be generated by the acquired assets.
Goodwill is required to be tested annually for impairment or between annual impairment tests if an event occurs or circumstances change that would reduce the fair value of a reporting unit below its carrying amount. We perform our annual impairment test in the fourth quarter. The guidance requires a two-step impairment test be performed on goodwill. The two steps are as follows:
Step 1 – We compare the fair value of the reporting unit to its carrying value. We have one reporting unit, and therefore the fair value assessment is at an enterprise level. If the fair value of the reporting unit exceeds the carrying value of the net assets assigned to that unit, goodwill is considered not impaired and we are not required to perform further testing. If the carrying value of the net assets assigned to the reporting unit exceeds the fair value of the implied fair value of the reporting unit, we must perform the second step of the impairment test in order to determine the implied fair value and record an impairment loss equal to the difference.
Step 2 – We assign the fair value of a reporting unit to all of the assets and liabilities of that unit. The excess of the fair value over the amounts assigned to its assets and liabilities is the implied fair value of goodwill. The implied fair value is compared to the carrying amount of goodwill, if the carrying amount of the goodwill exceeds the implied fair value of that goodwill, an impairment loss shall be recognized in an amount equal to that excess.
When the carrying value of the reporting unit (in our case, the Company) is negative as of the impairment evaluation date, the accounting standards for goodwill also require us to further evaluate whether it is more likely than not that a goodwill impairment exists in determining whether the second step of the impairment test shall be performed. In making this evaluation, we considered certain qualitative factors that would affect the comparison of the reporting unit’s fair value with its carrying amount. Based on this evaluation, we determined that it is not more than likely that a goodwill impairment exists. Therefore, we did not perform step 2 and no impairment charge was recorded. We will continue to assess goodwill for impairment on an interim basis when indicators, events or circumstances change. Conditions that indicate that goodwill may be impaired include market capitalization declining below net book value or a sustained decline in stock price. A significant impairment could have a material adverse effect on our consolidated balance sheets and results of operations.
Income Taxes
We account for income taxes using the liability method, which requires the recognition of deferred tax assets or liabilities for the tax-effected temporary differences between the financial reporting and tax bases of our assets and liabilities, and for net operating loss and tax credit carryforwards. We intend to maintain a valuation allowance until sufficient positive evidence exists to support the realizability of the deferred tax assets.
In evaluating our ability to realize our deferred tax assets, we consider all available positive and negative evidence including our past operating results and our forecast of future taxable income. In determining future taxable income, we make assumptions to forecast federal and state operating income, the reversal of temporary differences and the implementation of any feasible and prudent tax planning strategies. These assumptions require significant judgment regarding the forecasts of future taxable income, and are consistent with the forecasts used to manage our business.
Stock-Based Compensation
We use the Black-Scholes option valuation model to estimate stock-based compensation expense at the grant date based on the fair value of the award and recognize the expense ratably over the requisite service period of the award. Determining the appropriate fair value model and assumptions used in calculating the fair value of stock-based awards requires judgment, including estimating stock price volatility, forfeiture rates and expected life.
The estimated expected stock price volatility increased from 58% in 2009 to 62% in 2010 and 2011. Our expected stock price volatility over the expected life of the options is based upon our historical experience over the historical period equal to the expected life of the options.
Our estimate of the forfeiture rate has also changed from 8.3% in 2009 to 7.7% in 2010 to 8.5% in 2011, based on our experience of actual forfeiture rates and our expectations of future pre-vesting termination behavior. Stock-based compensation expense will be adjusted in the future if actual forfeiture rates differ significantly from our current estimates.
The requirement to expense stock-based awards will continue to materially reduce our reported results of operations. As of December 31, 2011, we had an aggregate of $1.3 million of stock compensation remaining to be amortized to expense over the remaining requisite service period of the underlying awards. We currently expect this stock compensation balance to be amortized as follows: $0.5 million during 2012; $0.5 million during 2013; $0.2 million during 2014; and $42,000 during 2015. These amounts reflect only outstanding stock awards as of December 31, 2011. We expect to continue to issue share-based awards to our employees in future periods.
Capitalization of software development costs and website development costs
In 2011, 2010 and 2009 we capitalized certain software development costs incurred subsequent to the establishment of technological feasibility and will amortize the costs over the estimated lives of the related products. In 2011, 2010 and 2009, the Company capitalized $0.1 million, $0.1 million and $1.0 million of costs, respectively, relating to new products that had reached technological feasibility. The rules that govern how development costs are accounted for can have a major impact on our reported financial results as significant judgment is required in assessing whether and when products have reached technological feasibility. We are also required to use judgment to estimate the net realizable value of the asset by projecting future revenues and cash flows expected to be generated by the products, in order to determine whether the unamortized cost exceed the net realizable value. Moreover, any future changes to our software product offerings could result in write-offs of previously capitalized costs and have a significant impact on our financial results.
We also capitalize costs related to internal use software and website application, infrastructure development and content development. In each case, the software or website is for internal needs, and we do not plan to market the software externally. For the year ended December 31, 2011, we capitalized approximately $1.2 million of software and website development costs. For the years ended December 31, 2010 and 2009, we capitalized approximately $1.2 million and $0.4 million of software and website development costs, respectively.
The Company evaluates the useful lives of these assets on an annual basis and tests for impairment whenever events or changes in circumstances occur that could impact the recoverability of these assets. If indicators of impairment are present, estimates of future cash flows are used to test the recoverability of the asset. If the carrying amount of the asset exceeds its fair value, an impairment charge is recognized. In 2010, we determined that capitalized software development costs relating to the Reading Assistant asset group was impaired. See Long-lived assets below for further discussion. In late 2009, we determined that we needed to completely redesign our BrainSpark website and accordingly we recorded an impairment charge of $0.4 million. Significant judgment is required in evaluating which costs are eligible for capitalization and whether any impairment exists.
Long-lived assets
Long-lived assets, such as property and equipment and purchased intangible assets subject to amortization are reviewed for impairment annually and whenever events or changes in circumstances indicate that the carrying amount of an asset may not be recoverable. The recoverability of an asset is measured by a comparison of the carrying amount of an asset to its estimated undiscounted future cash flows. If the carrying amount of an asset exceeds its estimated future cash flows, an impairment charge is recognized for the amount by which the carrying amount of the asset exceeds the fair value of the asset.
In December 2010, we identified an impairment indicator related to the core technology intangible asset acquired as a result of the purchase of Soliloquy in 2008. In 2010, we decided to make additional investments in the Reading Assistant product line to replace the core technology and enable compatibility with our new web-based platform. As a result, we determined it was necessary to assess the recoverability of the asset group associated with generating Reading Assistant cash flows, which includes some capitalized software development costs post acquisition.
We used an income approach to determine if the sum of the undiscounted cash flows expected to result from the use and eventual disposition of the asset group exceeded the carrying values of those assets. As a result of this assessment, the carrying value of the asset group exceeded the undiscounted future cash flows. We then performed an analysis to determine the fair value of the asset group, which was determined using the expected present value of future cash flows which are based on estimates, assumptions and management’s judgments. These include the forecast of future cash flows related to the asset group, the discount rate used in discounting those cash flows, and the expected remaining useful life of the asset group. This analysis resulted in a non-cash impairment charge of $3.9 million in 2010, which includes $0.5 million related to capitalized software development costs. The impairment charge was allocated on a pro-rata basis using the relative carrying amounts of the asset group.
ITEM 7A. QUANTITATIVE AND QUALITATIVE DISCLOSURES ABOUT MARKET RISK
Market risk represents the risk of loss that may result from the change in value of a financial instrument due to fluctuations in its market price. Our exposure to market risk is related to our short-term investments in federal agency and corporate bonds at December 31, 2010. We had no investments subject to market risk at December 31, 2011.
Interest Rate Risk
The primary objectives of our investment activities are to preserve principal, provide liquidity and maximize income without significantly increasing risk. By policy, we do not enter into investments for trading or speculative purposes. All of our cash and cash equivalents are held with Comerica Bank in either our money market or operating account. Declines in interest rates, however, will reduce future interest income. During the year ended December 31, 2011, a 10% appreciation or depreciation in overall interest rates would not have had a material impact on our interest income or the fair value of our marketable securities.
Foreign currency exchange risk
Our sales contracts are primarily denominated in U.S. dollars and, therefore, the majority of our revenues are not subject to foreign currency risk. We are directly exposed to changes in foreign exchange rates to the extent such changes affect our expenses related to our foreign assets and liabilities. Our only exposure in regard to our foreign assets and liabilities is with our Chinese subsidiary whose functional currency is the Chinese Renminbi. In fiscal years 2011 and 2010 our foreign currency exchange risk was not material and we do not expect it to become material in the next twelve months.
ITEM 8. FINANCIAL STATEMENTS AND SUPPLEMENTARY DATA
Report of Independent Registered Public Accounting Firm
The Board of Directors and Stockholders of Scientific Learning Corporation
We have audited the accompanying consolidated balance sheets of Scientific Learning Corporation as of December 31, 2011 and 2010, and the related consolidated statements of operations, stockholders' equity (net capital deficiency), and cash flows for each of the three years in the period ended December 31, 2011. Our audits also included the financial statement schedule listed in the Index at Item 15(a)(2). These financial statements and schedule are the responsibility of the Company's management. Our responsibility is to express an opinion on these financial statements and schedule based on our audits.
We conducted our audits in accordance with the standards of the Public Company Accounting Oversight Board (United States). Those standards require that we plan and perform the audit to obtain reasonable assurance about whether the financial statements are free of material misstatement. We were not engaged to perform an audit of the Company's internal control over financial reporting. Our audits included consideration of internal control over financial reporting as a basis for designing audit procedures that are appropriate in the circumstances, but not for the purpose of expressing an opinion on the effectiveness of the Company's internal control over financial reporting. Accordingly, we express no such opinion. An audit also includes examining, on a test basis, evidence supporting the amounts and disclosures in the financial statements, assessing the accounting principles used and significant estimates made by management, and evaluating the overall financial statement presentation. We believe that our audits provide a reasonable basis for our opinion.
In our opinion, the financial statements referred to above present fairly, in all material respects, the consolidated financial position of Scientific Learning Corporation at December 31, 2011 and 2010, and the consolidated results of its operations and its cash flows for each of the three years in the period ended December 31, 2011, in conformity with U.S. generally accepted accounting principles. Also, in our opinion, the related financial statement schedule, when considered in relation to the basic financial statements taken as a whole, presents fairly in all material respects the information set forth therein.
|
/s/ Ernst & Young LLP
|
San Jose, California
March 30, 2012
SCIENTIFIC LEARNING CORPORATION
CONSOLIDATED BALANCE SHEETS
(In thousands, except share and per share data)
|
|
|
December 31, 2011
|
|
|
December 31, 2010
|
|
||
|
Assets
|
|
|
|
|||||
|
Current assets:
|
|
|
||||||
|
Cash and cash equivalents
|
|
$
|
5,871
|
$
|
5,415
|
|
||
|
Short-term investments
|
|
|
—
|
9,631
|
|
|||
|
Accounts receivable, net of allowance for doubtful accounts of $159 and $76, respectively
|
|
|
4,433
|
5,053
|
|
|||
|
Prepaid expenses and other current assets
|
|
1,709
|
2,206
|
|
||||
|
Total current assets
|
|
|
12,013
|
22,305
|
|
|||
|
|
|
|
||||||
|
Property and equipment, net
|
|
|
3,326
|
2,497
|
|
|||
|
Goodwill
|
|
|
4,568
|
4,568
|
|
|||
|
Other intangible assets, net
|
|
518
|
1,034
|
|
||||
|
Other assets
|
1,438
|
1,399
|
||||||
|
Total assets
|
|
$
|
21,863
|
$
|
31,803
|
|
||
|
|
|
|||||||
|
Liabilities and stockholders’ equity (net capital deficiency)
|
|
|
|
|||||
|
Current liabilities:
|
|
|
|
|||||
|
Accounts payable
|
|
$
|
881
|
$
|
543
|
|
||
|
Accrued liabilities
|
|
|
3,556
|
4,198
|
|
|||
|
Deferred revenue
|
|
|
12,606
|
16,388
|
|
|||
|
Total current liabilities
|
|
|
17,043
|
21,129
|
|
|||
|
Deferred revenue, long-term
|
4,716
|
5,483
|
||||||
|
Other liabilities
|
785
|
857
|
||||||
|
Total liabilities
|
22,544
|
27,469
|
||||||
|
|
|
|
||||||
|
Commitments and contingencies (See Note 15 to the consolidated financial statements)
|
|
|
|
|||||
|
|
|
|||||||
|
Stockholders’ equity (net capital deficiency):
|
|
|
||||||
|
Common stock $0.001 par value: 40,000,000 authorized, 19,005,153 and 18,702,044 shares issued and outstanding, respectively, and additional paid in capital
|
90,735
|
89,277
|
||||||
|
Accumulated other comprehensive income
|
3
|
—
|
||||||
|
Accumulated deficit
|
|
|
(91,419
|
)
|
(84,943
|
)
|
||
|
Total stockholders’ equity (net capital deficiency)
|
(681
|
)
|
4,334
|
|||||
|
Total liabilities and stockholders’ equity (net capital deficiency)
|
|
$
|
21,863
|
$
|
31,803
|
|
||
See accompanying notes to audited consolidated financial statements.
SCIENTIFIC LEARNING CORPORATION
CONSOLIDATED STATEMENTS OF OPERATIONS
(In thousands, except per share data)
| Year Ended December 31, | ||||||||||||
|
2011
|
2010
|
2009
|
||||||||||
|
Revenues:
|
|
|
|
|
||||||||
|
Products
|
|
$
|
21,758
|
$
|
22,506
|
$
|
35,863
|
|||||
|
Service and support
|
|
19,321
|
20,878
|
|
19,425
|
|||||||
|
Total revenues
|
|
41,079
|
43,384
|
55,288
|
||||||||
|
Cost of revenues:
|
||||||||||||
|
Cost of products
|
|
1,766
|
2,092
|
2,679
|
||||||||
|
Cost of service and support
|
|
8,922
|
9,348
|
8,895
|
||||||||
|
Total cost of revenues
|
|
10,688
|
11,440
|
11,574
|
||||||||
|
|
||||||||||||
|
Gross profit
|
|
30,391
|
31,944
|
43,714
|
||||||||
|
Operating expenses:
|
|
|||||||||||
|
Sales and marketing
|
|
17,979
|
21,498
|
24,042
|
||||||||
|
Research and development
|
|
10,324
|
7,933
|
6,418
|
||||||||
|
General and administrative
|
|
8,413
|
8,129
|
8,135
|
||||||||
|
Impairment charge
|
—
|
3,890
|
—
|
|||||||||
|
Total operating expenses
|
|
36,716
|
41,450
|
38,595
|
||||||||
|
|
||||||||||||
|
Operating income (loss)
|
(6,325
|
)
|
(9,506
|
)
|
5,119
|
|||||||
|
|
||||||||||||
|
Interest and other income (expense), net
|
13
|
(41
|
)
|
110
|
||||||||
|
Income (loss) before provision for income taxes
|
(6,312
|
)
|
(9,547
|
)
|
5,229
|
|||||||
|
Provision for income taxes
|
164
|
143
|
429
|
|||||||||
|
Net income (loss)
|
|
$
|
(6,476
|
)
|
$
|
(9,690
|
)
|
$
|
4,800
|
|||
|
|
||||||||||||
|
Net income (loss) per share:
|
|
|||||||||||
|
Basic net income (loss) per share
|
|
$
|
(0.34
|
)
|
$
|
(0.52
|
)
|
$
|
0.27
|
|||
|
Diluted net income (loss) per share
|
$
|
(0.34
|
)
|
$
|
(0.52
|
)
|
$
|
0.26
|
||||
|
|
||||||||||||
|
Weighted average shares used in computation of per share data:
|
||||||||||||
|
Basic weighted average shares outstanding
|
18,870
|
18,498
|
18,039
|
|||||||||
|
Diluted weighted average shares outstanding
|
18,870
|
18,498
|
18,690
|
|||||||||
See accompanying notes to audited consolidated financial statements.
SCIENTIFIC LEARNING CORPORATION
CONSOLIDATED STATEMENTS OF CASH FLOWS
(In thousands)
| Year Ended December 31, | ||||||||||||
|
2011
|
2010
|
2009
|
||||||||||
|
Operating Activities:
|
|
|
|
|
||||||||
|
Net income (loss)
|
|
$
|
(6,476
|
)
|
$
|
(9,690
|
)
|
$
|
4,800
|
|||
|
Adjustments to reconcile net loss to cash used in operating activities:
|
|
|
||||||||||
|
Depreciation and amortization
|
1,924
|
2,532
|
1,895
|
|||||||||
|
Impairment charge
|
|
—
|
3,890
|
—
|
||||||||
|
Stock-based compensation
|
1,232
|
1,496
|
1,389
|
|||||||||
|
Changes in operating assets and liabilities:
|
||||||||||||
|
Accounts receivable
|
620
|
1,337
|
1,327
|
|||||||||
|
Prepaid expenses and other current assets
|
409
|
(64
|
)
|
(801
|
)
|
|||||||
|
Other assets
|
62
|
32
|
(90
|
)
|
||||||||
|
Accounts payable
|
338
|
(268
|
)
|
138
|
||||||||
|
Accrued liabilities
|
(642
|
)
|
(3,164
|
)
|
3,398
|
|||||||
|
Deferred revenue
|
(4,549
|
)
|
(359
|
)
|
2,278
|
|||||||
|
Other liabilities
|
(72
|
)
|
62
|
170
|
||||||||
|
Net cash provided by (used in) operating activities
|
(7,154
|
)
|
(4,196
|
)
|
14,504
|
|||||||
|
Investing Activities:
|
|
|||||||||||
|
Purchases of property and equipment, net
|
|
(2,138
|
)
|
(2,036
|
)
|
(2,070
|
)
|
|||||
|
Purchases of investments
|
(5,313
|
)
|
(16,355
|
)
|
—
|
|||||||
|
Sales and maturities of investments
|
|
14,832
|
6,724
|
—
|
||||||||
|
Net cash provided by (used) in investing activities
|
|
7,381
|
(11,667
|
)
|
(2,070
|
)
|
||||||
|
Financing Activities:
|
|
|||||||||||
|
Borrowings under bank line of credit
|
|
—
|
—
|
2,500
|
||||||||
|
Repayment of borrowings
|
|
—
|
—
|
(2,500
|
)
|
|||||||
|
Proceeds from issuance of common stock
|
|
370
|
609
|
695
|
||||||||
|
Net settlement of common stock
|
(144
|
)
|
(10)
|
|||||||||
|
Net cash provided by financing activities
|
|
226
|
599
|
695
|
||||||||
|
|
||||||||||||
|
Effect of exchange rate changes on cash and cash equivalents
|
3
|
—
|
—
|
|||||||||
|
Increase (decrease) in cash and cash equivalents
|
456
|
(15,264
|
)
|
13,129
|
||||||||
|
|
||||||||||||
|
Cash and cash equivalents at beginning of period
|
5,415
|
20,679
|
7,550
|
|||||||||
|
Cash and cash equivalents at end of period
|
$$$$$
|
5,871
|
$
|
5,415
|
$
|
20,679
|
||||||
|
Supplemental disclosure of cash flow information
|
|
|||||||||||
|
Cash paid during the year for income taxes
|
|
$
|
25
|
$
|
242
|
$
|
301
|
|||||
|
Cash paid during the year for interest
|
$
|
13
|
$
|
—
|
$
|
56
|
||||||
See accompanying notes to audited consolidated financial statements.
SCIENTIFIC LEARNING CORPORATION
CONSOLIDATED STATEMENTS OF STOCKHOLDERS’ EQUITY (NET CAPITAL DEFICIENCY)
(In thousands, except share amounts)
|
Common Stock and Additional Paid-In Capital
|
||||||||||||||||||||
|
Shares
|
Amount
|
Accumulated Deficit
|
Other
Comprehensive
Income
|
Total
Stockholders’
Equity
|
||||||||||||||||
|
Balance at December 31, 2008
|
17,675,560 | $ | 85,098 | $ | (80,053 | ) | $ | — | $ | 5,045 | ||||||||||
|
Issuance of common stock under stock option plan
|
251,816 | 492 | — | — | 492 | |||||||||||||||
|
Issuance of common stock under employee stock purchase plan
|
114,142 | 203 | — | — | 203 | |||||||||||||||
|
Stock-based compensation
|
— | 1,389 | — | — | 1,389 | |||||||||||||||
|
Vesting of restricted stock units
|
253,290 | — | — | — | — | |||||||||||||||
|
Net income and comprehensive income
|
— | — | 4,800 | — | 4,800 | |||||||||||||||
|
Balance at December 31, 2009
|
18,294,808 | $ | 87,182 | $ | (75,253 | ) | $ | — | $ | 11,929 | ||||||||||
|
Issuance of common stock under stock option plan
|
100,398 | 249 | — | — | 249 | |||||||||||||||
|
Issuance of common stock under employee stock purchase plan
|
163,457 | 360 | — | — | 360 | |||||||||||||||
|
Stock-based compensation
|
— | 1,496 | — | — | 1,496 | |||||||||||||||
|
Vesting of restricted stock units
|
143,381 | — | — | — | — | |||||||||||||||
|
Tax withholding related to vesting of restricted stock units
|
— | (10 | — | — | (10 | ) | ||||||||||||||
|
Net loss and comprehensive loss
|
— | — | (9,690 | ) | — | (9,690 | ) | |||||||||||||
|
Balance at December 31, 2010
|
18,702,044 | $ | 89,277 | $ | (84,943 | ) | $ | — | $ | 4,334 | ||||||||||
|
Issuance of common stock under stock option plan
|
34,896 | 62 | — | — | 62 | |||||||||||||||
|
Issuance of common stock under employee stock purchase plan
|
117,961 | 306 | — | — | 306 | |||||||||||||||
|
Stock-based compensation
|
— | 1,232 | — | — | 1,232 | |||||||||||||||
|
Vesting of restricted stock units
|
150,252 | 2 | — | 2 | ||||||||||||||||
|
Tax withholding related to vesting of restricted stock units
|
— | (144 | ) | — | — | (144 | ) | |||||||||||||
|
Comprehensive loss:
|
||||||||||||||||||||
|
Currency translation adjustment
|
— | — | — | 3 | 3 | |||||||||||||||
| Net loss | — | — | (6,476 | ) | — | (6,476 | ) | |||||||||||||
| Comprehensive loss | — | — | — | — | (6,473 | ) | ||||||||||||||
|
Balance at December 31, 2011
|
19,005,153 | $ | 90,735 | $ | (91,419 | ) | $ | 3 | $ | (681 | ) | |||||||||
See accompanying notes to audited consolidated financial statements.
Notes to Consolidated Financial Statements
1. Summary of Significant Accounting Policies
Description of Business
Scientific Learning Corporation (the “Company”) develops, distributes and licenses technology that accelerates learning by improving the processing efficiency of the brain.
The Company’s patented products build learning capacity by rigorously and systematically applying neuroscience-based learning principles to improve the fundamental cognitive skills required to read and learn. To facilitate the use of the Company’s products, the Company offers a variety of on-site and remote professional and technical services, as well as phone, email and web-based support. The Company sells primarily to K-12 schools in the United States through a direct sales force.
All of the Company’s activities are in one operating segment.
The Company was incorporated in 1995 in the State of California and was reincorporated in 1997 in the State of Delaware.
Liquidity and Cash Flow
During 2011, the Company used $7.2 million cash in operations, while in 2010, it used $4.2 million and in 2009 it generated $14.5 million in cash from operations. The Company expects to be able to fund its operations primarily from its current cash, including approximately $6.5 million in net proceeds from the private offering of its common stock completed on March 28, 2012 as described below and cash available under its credit line from Comerica Bank ("Comerica") through at least December 31, 2012. This will require the Company to achieve certain levels of booked sales, collections, and expenses. If the Company does not have sufficient funds to meet its liquidity needs, it may need to reduce its operating expenses. Reducing the Company's expenses could adversely affect its operations. In addition, the Company may be required to sell assets, issue additional equity securities and incur additional debt, or it may need to obtain waivers or amendments from Comerica in the event it does not comply with its covenants. The Company may not be able to accomplish any of these alternatives.
On March 28, 2012, the Company closed its sale of 4,176,420 shares of common stock at a price of $1.73 per share in private transaction to several investors, which resulted in approximately $6.5 million in net proceeds to the Company. As a part of the transaction, the Company issued warrants to the investors for an aggregate of 2,505,852 additional shares of common stock. The warrants have an exercise price of $1.82 per share and are exercisable until 60 months after issuance.
Use of Estimates
The preparation of financial statements, in conformity with accounting principles generally accepted in the United States, requires management to make certain estimates and assumptions that affect the reported amounts of assets and liabilities as of the date of the financial statements as well as the reported amounts of revenues and expenses during the periods presented. To the extent that there are material differences between these estimates and actual results, the Company’s financial statements could be affected.
Principles of consolidation and basis of presentation
The consolidated financial statements include the accounts of the Company and its wholly owned subsidiaries in Shanghai, China and Puerto Rico. All significant intercompany balances and transactions have been eliminated in consolidation. In the consolidated statements of stockholders’ equity in 2010, the net settlement for restricted stock units was shown net of issuance of common stock under stock option plan and has been broken out to conform to the 2011 presentation.
Revenue Recognition
The Company derives revenue from the sale of licenses to its software and from professional service and support fees. Software license revenue is recognized in accordance with accounting standards for software companies. Additionally, the Company derives revenue from subscription fees for access to and use of its on-demand application services. Under the Company’s subscription arrangements for its on-demand application services, the customer does not have the contractual right to take possession of the software at any time during the subscription period. Thus, revenue for the Company’s subscription services is recognized in accordance with accounting standards for service contracts.
There are four basic criteria which must be met to recognize revenue. These are: 1) persuasive evidence of an arrangement exists; 2) delivery of the product has occurred; 3) a fixed or determinable fee; and 4) the collection of the fee is reasonably assured. The application of the relevant accounting standards requires the Company to exercise significant judgment related to specific transactions and transaction types. In cases where extended payment terms are granted to school customers, the Company determines if the fixed or determinable fee criterion is met by reference to the customer’s specific funding sources, especially where the payment terms extend into the customer’s next fiscal year. If the Company determines that the fixed or determinable fee criterion is not met at the inception of the arrangement, the Company defers revenue recognition until the payments become due.
The value of software licenses, subscriptions, professional services and support invoiced during a particular period is recorded as deferred revenue until recognized. All revenue from transactions that include software license for new products that have not yet been delivered is deferred until the delivery of all products. Direct costs related to deferred software license revenue are deferred until the related license revenue is recognized.
Multiple contracts with the same customer are generally accounted for as separate arrangements, except in cases where contracts are so closely related that they are effectively part of a single arrangement.
Multiple-element software arrangements
Booked sales of software to the Company’s school customers typically include multiple elements (e.g., Fast ForWord perpetual software licenses, support, training, implementation management, and other professional services). The Company recognizes software revenue using the residual method, whereby the difference between the total arrangement fee and the total “vendor specific objective evidence” (“VSOE”) of fair value of the undelivered elements is recognized as revenue relating to the delivered elements. VSOE of fair value for each element of an arrangement is based upon the normal pricing and discounting practices for those products and services when sold separately and, for support services, is also measured by the renewal price. The Company is required to exercise judgment in determining whether VSOE of fair value exists for each undelivered element based on whether the pricing for these elements is sufficiently consistent.
Multiple-element on-demand application service arrangements
Booked sales of subscriptions to the Company’s on-demand application services can also include multiple elements similar to software arrangements. The Company follows accounting guidance for revenue recognition of multiple-element arrangements to determine whether such arrangements contain more than one unit of accounting. Multiple-element arrangements require the delivery or performance of multiple products, services and/or rights to use assets. To qualify as a separate unit of accounting, the delivered item must have value to the customer on a standalone basis and revenue is allocated to each deliverable in the arrangement based on the relative fair value of the respective deliverable. The Company’s on-demand subscription services, support, training and implementation management services have standalone value as these services are sold separately by the Company, and the Company has established VSOE of fair value for determining the fair value of each element except for its on-demand subscription services.
For its on-demand subscription services, the Company has determined the fair value to be allocated to these services basis based on management’s best estimate of selling price (BESP). In determining BESP, the Company has considered various factors including the Company’s historical pricing practices and internal costs, as well as historical student usage data related to previous sales of the Company’s products.
Product revenue
Product revenue is primarily derived from the licensing of software and access to and use of the Company's on-demand application services. Product revenue is recognized as follows:
|
·
|
Perpetual licenses – software licensed on a perpetual basis. Revenue is recognized at the later of product delivery date or contract start date using the residual method. If VSOE of fair value does not exist for all the undelivered elements, all revenue is deferred and recognized ratably over the service period, if the undelivered element is services or when all elements have been delivered.
|
|
·
|
Software term licenses – software licensed for a specific time period, generally a term of one to three years. Revenue is recognized ratably over the license term.
|
|
·
|
Individual participant licenses – software licensed for a single participant. Revenue is recognized over the average period of use, typically six weeks.
|
|
·
|
On-demand application services – revenue for subscription services is recognized ratably over the term of the subscription period.
|
Professional service and support revenue
Professional service and support revenue is derived from a combination of training, implementation, technical and professional services, online services and customer support. Training, implementation, technical and other professional services are typically sold on a per day basis. Professional services revenue is recognized as performed. If VSOE of fair value does not exist for all the elements in a software arrangement except software licenses, service revenue is recognized over the longest contractual period in an arrangement. Revenue from services sold alone or with support is recognized as performed.
If an arrangement includes services that are essential to the functionality of software, the Company recognizes the fees for the software license and the services using the percentage of completion method in accordance with the accounting standards for software and service companies. The Company estimates the percentage of completion on contracts utilizing hours incurred to date as a percentage of the total estimated hours to complete the project. Recognized revenues and profit are subject to revisions as the contract progresses to completion. Revisions in profit estimates are charged to income in the period in which the facts that give rise to the revision become known.
Cash and Cash Equivalents
The Company considers all highly liquid investments purchased with an original maturity of three months or less from the date of purchase to be cash equivalents. Cash and cash equivalents, which consist of cash on deposit with banks and money market accounts, are stated at fair value.
Short-term Investments
The Company determines the appropriate classification of short-term investments at the time of purchase and reevaluates such determination at each balance sheet date. Short-term investments are classified as available for sale and are carried at fair value. Fair value is determined based on quoted market prices when observable or utilizing data points that are observable, such as quoted prices for similar instruments, interest rates and yield curves. Unrealized gains and losses on short-term investments are included in accumulated other comprehensive income. Declines in fair value judged to be other-than-temporary on securities available for sale are included as a component of interest and other income (expense), net. The cost of securities sold is based on the specific-identification method. Interest on securities classified as available for sale is also included as a component of interest and other income (expense), net. In order to determine whether a decline in value is other-than-temporary, the Company evaluates, among other factors: the duration and extent to which the fair value has been less than the carrying value, the Company’s financial condition and business outlook, including key operational and cash flow metrics, current market conditions and the Company’s intent and ability to retain the investment for a period of time sufficient to allow for any anticipated recovery in fair market value. The Company did not hold any short-term investments at December 31, 2011.
Accounts Receivable
The Company conducts business primarily with public school districts and speech and language professionals in the United States. The Company records accounts receivable at the invoiced amount and the Company does not require collateral. The Company maintains an allowance for doubtful accounts for estimated losses due to the inability of customers to make payments. The allowance is determined based on any specific reserves deemed necessary and the Company’s historical experience of bad debt write-offs.
Inventories
Product inventories, which are primarily finished goods, are stated at the lower of cost or market and are included in “Prepaid expenses and other current assets”. Cost is determined using a weighted average approach, which approximates the first-in first-out method. If inventory costs exceed expected market value due to obsolescence or lack of demand adjustments are recorded for the difference between the cost and the market value. Inventories were not material as of December 31, 2011.
Deferred Charges
The Company defers royalty charges as incurred and recognizes the expense over the term of the related license agreements or service periods. These deferred charges are included in “Prepaid expenses and other current assets” and in “Other assets” in the consolidated balance sheets.
Property and Equipment
Property and equipment are recorded at cost. Depreciation is computed using the straight-line method over the estimated useful lives of the assets, which range from three to five years.
Software and Website Development Costs
The Company capitalizes certain software development costs incurred subsequent to the establishment of technological feasibility and amortizes those costs over the estimated lives of the related products. The annual amortization is computed using the straight-line method over the remaining estimated economic life of the product. Technological feasibility is established upon completion of a working model. In 2011, 2010 and 2009, the Company capitalized $0.1 million, $0.1 million and $1.0 million of costs, respectively, relating to new products that had reached technological feasibility. For the years ended December 31, 2011, 2010 and 2009 amortization costs were $0.1 million, $0.3 million and $0.1 million respectively.
The Company also capitalizes costs related to internal use software and website application, infrastructure development and content development costs. Costs related to preliminary project activities and post implementation activities were expensed as incurred. Internal-use software is amortized on a straight line basis over its estimated useful life, generally three years. Management evaluates the useful lives of these assets on an annual basis and tests for impairment whenever events or changes in circumstances occur that could impact the recoverability of these assets. The capitalized costs are included in “Property and equipment” in the consolidated balance sheets. In each case the software or website is for internal needs, and the Company does not plan to market the software externally. For the years ended December 31, 2011, 2010, and 2009, the Company capitalized approximately $1.2 million, $1.2 million and $0.4 million of software and website development costs, respectively. For the years ended December 31, 2011, 2010 and 2009 amortization costs were $0.5 million, $0.3 million, and $0.1 million respectively.
The Company evaluates the useful lives of these assets on an annual basis and tests for impairment whenever events or changes in circumstances occur that could impact the recoverability of these assets. If indicators of impairment are present, estimates of future cash flows are used to test the recoverability of the asset. If the carrying amount of the asset exceeds its fair value, an impairment charge is recognized. In 2010, the Company determined that capitalized software development costs relating to the Reading Assistant asset group was impaired. See Note 6 – Intangible Assets for further discussion. In late 2009 it was determined that BrainSpark website needed to be completely redesigned and accordingly the Company recorded an impairment charge of $0.4 million and capitalized development costs of $21,000 for the new website. These costs will amortize over a period corresponding to the estimated life of the related products when the website is ready for use.
Goodwill
Goodwill and purchased intangible assets were recorded when the Company acquired the assets of Soliloquy in 2008. The cost of the acquisition was allocated to the assets and liabilities acquired, including purchased intangible assets, and the remaining amount was classified as goodwill. Goodwill arising from purchase transactions is not amortized to expense, but rather periodically assessed for impairment. The allocation of the acquisition cost to purchased intangible assets and goodwill, therefore, has a significant impact on operating results. The allocation process involves an extensive use of estimates and assumptions, including estimates of future cash flows to be generated by the acquired assets.
Goodwill is required to be tested annually for impairment or between annual impairment tests if an event occurs or circumstances change that would reduce the fair value of a reporting unit below its carrying amount. The Company performs its annual impairment test in the fourth quarter. The guidance requires a two-step impairment test be performed on goodwill. The two steps are as follows:
Step 1 – The Company compares the fair value of the reporting unit to its carrying value. The Company has one reporting unit, and therefore the fair value assessment is at an enterprise level. If the fair value of the reporting unit exceeds the carrying value of the net assets assigned to that unit, goodwill is considered not impaired and the Company is not required to perform further testing. If the carrying value of the net assets assigned to the reporting unit exceeds the fair value of the implied fair value of the reporting unit, the Company must perform the second step of the impairment test in order to determine the implied fair value and record an impairment loss equal to the difference.
Step 2 – The Company assigns the fair value of a reporting unit to all of the assets and liabilities of that unit. The excess of the fair value over the amounts assigned to its assets and liabilities is the implied fair value of goodwill. The implied fair value is compared to the carrying amount of goodwill, if the carrying amount of the goodwill exceeds the implied fair value of that goodwill, an impairment loss shall be recognized in an amount equal to that excess.
When the carrying value of the Company is negative as of the impairment evaluation date, the accounting standards for goodwill also require the Company to further evaluate whether it is more likely than not that a goodwill impairment exists in determining whether the second step of the impairment test shall be performed. In making this evaluation, the Company considered certain qualitative factors that would affect the comparison of the reporting unit’s fair value with its carrying amount. Based on this evaluation, the Company determined that it is not more than likely that a goodwill impairment exists. Therefore, the Company did not perform step 2 and no impairment charge was recorded. The Company will continue to assess goodwill for impairment on an interim basis when indicators events or circumstances change.
Long-Lived Assets
Long-lived assets, such as property and equipment and purchased intangible assets subject to amortization are reviewed for impairment whenever events or changes in circumstances indicate that the carrying amount of an asset may not be recoverable. The recoverability of an asset is measured by a comparison of the carrying amount of an asset to its estimated undiscounted future cash flows. If the carrying amount of an asset exceeds its estimated undiscounted future cash flows, an impairment charge is recognized for the amount by which the carrying amount of the asset exceeds the fair value of the asset. In 2011, the Company determined that no long-lived assets were impaired. In 2010, the Company determined that the carrying amount of the intangible assets and certain other long-lived assets were not recoverable and were impaired. See Note 6 – Intangible Assets for further discussion.
Fair Value of Financial Instruments
The carrying amounts of cash equivalents, short-term investments, accounts receivable, and accounts payable approximate fair value as they are short-term in nature or have relatively short maturities.
Concentration of Risk
Financial instruments that are potentially subject to concentrations of credit risk consist principally of cash equivalents, short-term investments and accounts receivable.
Cash and cash equivalents are primarily held in a major financial institution in the United States. Such deposits may be in excess of insured limits and are not insured in other jurisdictions. The Company believes that the financial institution that holds the Company’s cash and cash equivalents is financially sound and, accordingly, minimal credit risk exists with respect to these assets.
Accounts receivable are primarily from sales to customers located primarily in the United States. The Company performs ongoing credit evaluations of customers. The Company does not require collateral.
An allowance for doubtful accounts is determined with respect to those accounts that have been determined to be doubtful of collection. No customer accounted for more than 10% of accounts receivable at December 31, 2011 and 2010. No customer accounted for more than 10% of revenue in the years ended December 31, 2011, 2010 or 2009.
The Company has no off-balance sheet concentration of credit risk, such as foreign exchange contracts, option contracts or other hedging arrangements.
Concentration of royalty arrangements potentially exposes the Company to risk. If the Company were to lose rights under these arrangements, this could materially impact the Company’s revenues and its results of operations. The patents and applications that are licensed are owned by the Regents of the University of California, and Rutgers, the State University of New Jersey, and relate to the basic speech and sound modification and adaptive technology developed at those institutions. In 2011, approximately 29% of revenue was derived from selling products that use the licensed inventions.
Concentration of sales in the K-12 market potentially exposes the Company to risk. More than 87% of the Company's 2011 booked sales came from the K-12 market in the United States and Canada. That market is characterized by its dependence on federal funding and state and local tax revenues; a political environment, particularly when large transactions are involved; and a generally conservative approach to change. All of these attributes, particularly in the current economic and political environment, can result in a time-consuming and unpredictable sales cycle for large transactions. Because of the concentration of the Company's sales in this market, it is particularly exposed to its risks.
Stock-based compensation expense is recorded on a straight-line basis over the requisite service period and includes an estimate for forfeitures.
Advertising
Advertising costs are expensed as incurred. Advertising expenses were $0.4 million, $0.3 million and $0.2 million for the years ended December 31, 2011, 2010 and 2009, respectively.
Income Taxes
Deferred tax assets and liabilities are measured using enacted tax rates and laws that are expected to be in effect when the differences are expected to reverse. Valuation allowances are established when necessary to reduce deferred tax assets to the net amount expected to be realized.
Net Income (Loss) Per Share
Basic net income (loss) per share is computed using the weighted-average number of common shares outstanding during the period. Diluted net income (loss) per share reflects the potential dilution of securities by adding common stock equivalents (computed using the treasury stock method) to the weighted-average number of common shares outstanding during the period, if dilutive.
The following table sets forth the computation of net income (loss) per share (in thousands, except per share data):
| Year Ended December 31, | ||||||||||||
|
2011
|
2010
|
2009
|
||||||||||
|
Net income (loss)
|
|
$
|
(6,476
|
)
|
$
|
(9,690
|
)
|
$
|
4,800
|
|||
|
|
||||||||||||
|
Weighted average shares used in calculation of basic net income (loss) per share
|
|
18,870
|
18,498
|
18,039
|
||||||||
|
Effective of dilutive securities:
|
||||||||||||
|
Employee stock options and awards
|
—
|
—
|
651
|
|||||||||
|
Weighted-average diluted common shares
|
|
18,870
|
18,498
|
18,690
|
||||||||
|
Basic net income (loss) per share
|
|
$
|
(0.34
|
)
|
$
|
(0.52
|
)
|
$
|
0.27
|
|||
|
Diluted net income (loss) per share
|
$
|
(0.34
|
)
|
$
|
(0.52
|
)
|
$
|
0.26
|
||||
For the year ended December 31, 2011, 2010 and 2009, 1,195,994, 1,012,220, and 1,510,281 stock options, respectively, were excluded from the calculation of diluted net income per share because their effect is anti-dilutive.
Foreign Currency Translation
The functional currency of the Company’s China subsidiary is the local currency, Chinese RMB. Adjustments resulting from translating foreign functional currency financial statements into U.S. dollars are recorded as part of a separate component of stockholders’ equity (net capital deficiency). Foreign currency transaction gains and losses are included in interest and other income (expense), net. All assets and liabilities denominated in a foreign currency are translated into U.S. dollars at the exchange rate as of the balance sheet date. Revenues and expenses are translated at the average exchange rate during the period. Equity transactions are translated using historical exchange rates.
Recent Accounting Pronouncements
Goodwill Impairment – In September 2011, the Financial Accounting Standards Board (“FASB”) issued guidance to simplify how entities test goodwill for impairment. The guidance notes that an entity is not required to calculate the fair value of a reporting unit unless the entity determines that it is more likely than not that its fair value is less than its carrying amount. The guidance is effective for interim and annual financial periods beginning after December 15, 2011. The Company plans to adopt the guidance on January 1, 2012, and the adoption is not expected to have an impact on the Company’s consolidated statement of financial condition, operations and cash flows.
Amendments to Achieve Common Fair Value Measurement and Disclosure Requirement in U.S. GAAP and IFRSs – In May 2011, the FASB issued guidance to provide a consistent definition of fair value and ensure that the fair value measurement and disclosure requirements are similar between U.S. GAAP and International Financial Reporting Standards. The guidance changes certain fair value measurement principles and enhances the disclosure requirements particularly for level 3 fair value measurements. The guidance is effective for interim and annual financial periods beginning after December 15, 2011. The Company plans to adopt the guidance on January 1, 2012, and the adoption is not expected to have an impact on the Company’s consolidated statement of financial condition, operations and cash flows.
Presentation of Comprehensive Income – In May 2011, the FASB issued guidance to require an entity to present the total of comprehensive income, the components of net income, and the components of other comprehensive income either in a single continuous statement of comprehensive income or in two separate but consecutive statements. The guidance eliminates the option to present the components of other comprehensive income as part of the statement of equity. The guidance is effective for fiscal years, and interim periods within those years, beginning after December 15, 2011. In December 2011, the FASB issued an update which deferred the effective date for the reclassification of adjustments out of accumulated other comprehensive income until the Board is able to reconsider that portion of the original update. The Company plans to adopt the guidance on January 1, 2012, and the adoption is not expected to have an impact on the Company’s consolidated statement of financial condition, operations and cash flows.
2. Restructuring
On January 7, 2009, the Company announced a series of changes intended to better align costs and organization structure with the current economic environment and improve profitability. These changes included a reduction in work force of approximately 14% during the first quarter of 2009. Employees were notified in December 2008 and January 2009, and severance costs were approximately $287,000 in the year ended December 31, 2009.
On September 1, 2009, the Company announced a plan to consolidate its product development and product management functions in the Company’s Oakland, California headquarters. Under this plan, the Company closed its Waltham, Massachusetts office, and most Waltham employees left the Company by the end of 2009. The Company notified the employees affected by the workforce reduction on September 1, 2009. In January 2010, the Company signed an agreement to sublease the property through October 2010 and in September 2010 an addendum was signed to extend the sublease through September 2011. The Company’s lease on the Waltham office expired on September 30, 2011.
These restructuring costs were mainly recorded under research and development in the consolidated statement of operations. The Company paid all employee costs by December 31, 2010 and paid all facility costs by December 31, 2011. Accrued costs are shown in the following table (in thousands):
|
|
|
Employee Costs
|
|
|
Facility Costs
|
|
|
Total
|
|
|||
|
Accrued at December 31, 2009
|
$
|
19
|
$
|
226
|
$
|
245
|
||||||
|
Adjustments
|
—
|
(48
|
)
|
(48
|
)
|
|||||||
|
Cash Paid
|
(19
|
)
|
(93
|
)
|
(112
|
)
|
||||||
|
Accrued at December 31, 2010
|
|
$
|
—
|
|
|
$
|
85
|
|
|
$
|
85
|
|
|
Adjustments
|
|
|
—
|
|
|
|
(18
|
)
|
|
|
(18
|
)
|
|
Cash Paid
|
|
|
—
|
|
|
|
(67
|
)
|
|
|
(67
|
)
|
|
Accrued at December 31, 2011
|
|
$
|
—
|
|
|
$
|
—
|
|
|
$
|
—
|
|
3. Prepaid Expenses and Other Current Assets
Prepaid expenses and other current assets consist of the following (in thousands):
|
December 31,
|
||||||||
|
|
2011
|
|
|
2010
|
|
|||
|
Prepaid expenses
|
|
$
|
1,639
|
|
|
$
|
1,730
|
|
|
Product inventory
|
|
|
50
|
|
|
|
297
|
|
|
Other receivables
|
|
|
20
|
|
|
|
179
|
|
|
Total prepaid expenses and other current assets
|
$
|
1,709
|
$
|
2,206
|
||||
4. Property and Equipment
Property and equipment consists of the following (in thousands):
|
December 31,
|
||||||||
|
|
|
2011
|
|
|
2010
|
|
||
|
Computer equipment and software
|
|
$
|
7,134
|
|
|
$
|
4,306
|
|
|
Office furniture and equipment
|
|
256
|
|
|
|
1,370
|
|
|
|
Leasehold improvements and leased equipment
|
943
|
606
|
||||||
|
Total property and equipment
|
8,333
|
6,282
|
||||||
|
Less: Accumulated depreciation
|
5,007
|
3,785
|
||||||
|
Total property and equipment, net
|
$
|
3,326
|
$
|
2,497
|
||||
Depreciation expense for the years ended December 31, 2011, 2010 and 2009 was $1.3 million, $1.2 million and $0.9 million, respectively.
5. Fair Value Measurements of Financial Instruments
The Company generally invests its excess cash in money market funds and investment grade short-term fixed income securities. The portion in cash and cash equivalents represents highly liquid instruments with insignificant interest rate risk and original maturities of three months or less. Short-term investments are classified as available for sale and are carried at fair value, with the unrealized gains and losses, net of tax, reported as a separate component stockholders’ equity (net capital deficiency). There were no unrealized gains and losses as of December 31, 2011 and 2010. The Company did not hold any short-term investments as of December 31, 2011.
The Company has established a three-tier fair value hierarchy, categorizing the inputs used to measure fair value. The hierarchy can be described as follows: Level 1- observable inputs such as quoted prices in active markets; Level 2- inputs other than the quoted prices in active markets that are observable either directly or indirectly; and Level 3- unobservable inputs in which there is little or no market data, which require the reporting entity to develop its own assumptions.
Cash equivalents as of December 31, 2011 consist of money market funds and commercial paper that have original maturities of 90 days or less. These instruments are valued using quoted prices in active markets and as such are classified in Level 1 of the fair value hierarchy. The Company has no Level 2 or Level 3 financial assets as of December 31, 2011.
Cash equivalents as of December 31, 2010 consisted of money market funds and commercial paper that have original maturities of 90 days or less. These instruments were valued using quoted prices in active markets and as such were classified in Level 1 of the fair value hierarchy. The Company also invested in federal agency and corporate bonds with an original maturity date of greater than 90 days that were classified as short-term investments. These instruments were valued using non-binding market consensus prices that are corroborated by observable market data or quoted market prices for similar instruments and as such were classified within Level 2 of the fair value hierarchy. The Company had no Level 3 financial assets as of December 31, 2010.
The following is a summary of the fair value of the major categories of financial instruments held by the Company (in thousands):
|
December 31,
|
||||||||
|
|
|
2011
|
|
|
2010
|
|
||
|
Money market accounts
|
|
$
|
4,555
|
|
|
$
|
3,500
|
|
|
Commercial paper
|
|
|
—
|
|
|
|
500
|
|
|
Agency bonds
|
|
|
—
|
|
|
|
8,629
|
|
|
Other fixed income securities
|
|
|
—
|
|
|
|
502
|
|
|
Total
|
$
|
4,555
|
$
|
13,131
|
||||
The following is a summary of the Company’s financial assets as of December 31, 2010 that are accounted for at fair value on a recurring basis by level in accordance with the fair value hierarchy described above (in thousands):
|
|
|
December 31, 2010
|
|
|||||||||||||
|
|
|
Level 1
|
|
|
Level 2
|
|
|
Level 3
|
|
|
Total
|
|
||||
|
Money market accounts
|
|
$
|
3,500
|
|
|
$
|
—
|
|
|
$
|
—
|
|
|
$
|
3,500
|
|
|
Commercial paper
|
|
|
—
|
|
|
|
500
|
|
|
|
—
|
|
|
|
500
|
|
|
Agency bonds
|
|
|
—
|
|
|
|
8,629
|
|
|
|
—
|
|
|
|
8,629
|
|
|
Other fixed income securities
|
|
|
—
|
|
|
|
502
|
|
|
|
—
|
|
|
|
502
|
|
|
Total assets
|
|
$
|
3,500
|
|
|
$
|
9,631
|
|
|
$
|
—
|
|
|
$
|
13,131
|
|
6. Intangible Assets
Purchased intangible assets subject to amortization are reviewed for impairment whenever events or changes in circumstances indicate that the carrying amount of an asset may not be recoverable. Intangible assets are accounted for at fair value as level 3 assets in accordance with the fair value hierarchy.
In December 2010, the Company identified an impairment indicator related to the core technology intangible asset acquired as a result of the purchase of JTT Holdings Inc. d/b/a Soliloquy Learning (“JTT”), pursuant to which the Company agreed to acquire from JTT the Soliloquy Reading Assistant product line and substantially all of the other assets of the Soliloquy Learning business. In 2010, the Company determined it would make additional investments in Reading Assistant to replace the core technology and enable compatibility with the Company’s new web-based platform. As a result, the Company determined it was necessary to assess the recoverability of the asset group associated with generating Reading Assistant cash flows. The asset group consists of intangible assets and capitalized software.
The Company used an income approach to determine if the sum of the undiscounted cash flows expected to result from the use and eventual disposition of the asset group exceeded the carrying values of those assets. As a result of this assessment, the carrying value of the asset group exceeded the undiscounted cash flows. The Company then performed an analysis to determine the fair value of the asset group, which was determined using the expected present value of future cash flows which are based on estimates, assumptions and management’s judgments. These include the forecast of future cash flows related to the asset group, the discount rate used in discounting those cash flows, and the expected remaining useful life of the asset group. This analysis resulted in a non-cash impairment charge of $3.9 million in 2010, which includes $0.5 million related to capitalized software development costs. The impairment charge was allocated on a pro-rata basis using the relative carrying amounts of the asset group.
Intangible assets at December 31, 2011 are as follows (dollar amounts in thousands):
|
|
Gross carrying amount
|
Accumulated Amortization
|
Impairment (recorded in 2010)
|
Net carrying amount at December 31, 2011
|
Remaining amortization period
|
|||||||||||||||
|
Core technology
|
$ | 5,800 | $ | (2,276 | ) | $ | (3,062 | ) | $ | 462 | 1 | |||||||||
|
OEM contracts
|
560 | (393 | ) | (145 | ) | 22 | 1 | |||||||||||||
|
Customer list
|
220 | (214 | ) | (6 | ) | 1 | 1 | |||||||||||||
|
Non-compete agreement
|
610 | (358 | ) | (219 | ) | 33 | 1 | |||||||||||||
|
Total other intangible assets
|
$ | 7,190 | $ | (3,241 | ) | $ | (3,432 | ) | $ | 518 | ||||||||||
Intangible assets at December 31, 2010 are as follows (dollar amounts in thousands):
|
|
Gross carrying amount
|
Accumulated Amortization
|
Impairment (recorded in 2010)
|
Net carrying amount at December 31, 2010
|
Remaining amortization period (years)
|
|||||||||||||||
|
Core technology
|
$ | 5,800 | $ | (1,816 | ) | $ | (3,062 | ) | $ | 922 | 2 | |||||||||
|
OEM contracts
|
560 | (372 | ) | (145 | ) | 43 | 2 | |||||||||||||
|
Customer list
|
220 | (212 | ) | (6 | ) | 2 | 2 | |||||||||||||
|
Non-compete agreement
|
610 | (324 | ) | (219 | ) | 67 | 2 | |||||||||||||
|
Total other intangible assets
|
$ | 7,190 | $ | (2,724 | ) | $ | (3,432 | ) | $ | 1,034 | ||||||||||
Amortization expense for the years ended December 31, 2011, 2010, and 2009 was $0.5 million, $1 million and $1 million, respectively.
7. Other Assets
Other assets consist of the following (in thousands):
|
December 31,
|
||||||||
|
|
|
2011
|
|
|
2010
|
|
||
|
Long-term lease deposits
|
|
$
|
883
|
|
|
$
|
883
|
|
|
Capitalized software, net
|
|
|
187
|
|
|
|
232
|
|
|
Other long-term investment
|
200
|
—
|
||||||
|
Other
|
|
|
168
|
|
|
|
284
|
|
|
Total other assets
|
$
|
1,438
|
$
|
1,399
|
||||
Capitalized software amortization of $0.6 million and $0.3 million was charged to expense in 2011 and 2010, respectively. Additionally, a non-cash impairment charge related to capitalized software was recorded in 2010 for approximately $0.5 million. See Note 6 – Intangible Assets for further discussion.
8. Stock-Based Compensation
Stock-Based Compensation Plans
On December 31, 2011, the Company had three active share-based compensation plans, which are described below.
In May 1999, the Company’s stockholders approved the 1999 Equity Incentive Plan. The total number of shares authorized for issuance under the plan is 6,492,666. Restricted stock units awarded under this plan generally vest over four years of continuous service in annual or semi-annual installments. Option awards have generally been granted with an exercise price equal to the market price of the Company’s common stock at the date of grant, and generally vest based on four years of continuous service with a ten-year contractual term.
In May 1999 the Company’s stockholders approved the Employee Stock Purchase Plan (ESPP), which became effective upon the completion of the initial public offering of the Company’s common stock. The total number of shares originally authorized for issuance under the plan was 700,000. In June 2007 and June 2011, an additional 500,000 shares were authorized, respectively. The total number of shares authorized for issuance under this plan is 1,700,000. Eligible employees may purchase common stock at 85% of the lesser of the fair market value of the Company’s common stock on the first day of the applicable one-year offering period or the last day of the applicable six-month purchase period. At December 31, 2011, 525,567 shares were available for issuance under this plan.
In May 2002, the Board of Directors approved the 2002 CEO Stock Option Plan, which was subsequently approved by the shareholders in May 2003. The total number of shares authorized for issuance under this plan is 470,588.
Stock-Based Compensation Expense
Compensation expense is recognized for the fair values of stock-based awards, which typically have graded vesting, on a straight-line basis over the requisite service period.
Forfeitures are required to be estimated at the time of grant. The estimates are revised in subsequent periods if actual forfeitures differ from those estimates. The Company uses historical data to estimate pre-vesting option forfeitures and records stock-based compensation expense only for those awards that are expected to vest. The following table summarizes the stock-based compensation expense recorded in the years ended December 31, 2011, 2010 and 2009 (in thousands):
|
Year Ended December 31
|
||||||||||||
|
|
|
2011
|
|
|
2010
|
|
|
2009
|
|
|||
|
Cost of product
|
|
$
|
2
|
|
|
$
|
—
|
|
|
$
|
—
|
|
|
Cost of service and support revenues
|
40
|
97
|
151
|
|||||||||
|
Sales and marketing
|
270
|
450
|
490
|
|||||||||
|
Research and development
|
|
|
260
|
|
|
|
276
|
|
|
|
285
|
|
|
General and administrative
|
|
|
660
|
|
|
|
673
|
|
|
|
463
|
|
|
Total stock-based compensation expense
|
|
$
|
1,232
|
|
|
$
|
1,496
|
|
|
$
|
1,389
|
|
Valuation of Stock Option Awards
The fair value of each option award is estimated on the date of grant using a Black-Scholes Merton option pricing model with subjective assumptions, including expected stock price volatility, the expected life of each award and estimated pre-vesting forfeitures noted in the table below:
Expected volatility – Based on the historical prices of common stock over the expected life of each option.
Expected life – Based on the history of option exercise and cancellation activity of the options
Risk-free interest rate – Based on the U.S. Treasury yield curve in effect at the time of grants for periods corresponding with the expected life of the options.
Dividend yield – As the Company has not paid, nor does it currently plan to pay, dividends in the future, the assumed dividend yield is zero.
Estimated Forfeiture rate – Based on the history of option forfeitures
The fair value of stock options granted was estimated using the following weighted-average assumptions:
|
Year Ended December 31,
|
||||||||||||
|
|
|
2011
|
|
2010
|
|
2009
|
|
|||||
|
Expected life (in years)
|
|
5.5
|
|
5.5
|
|
5.5
|
||||||
|
Risk-free interest rate
|
2.0
|
%
|
|
2.3
|
%
|
1.9
|
%
|
|||||
|
Dividend yield
|
|
|
0
|
%
|
|
|
0
|
%
|
|
|
0
|
%
|
|
Expected volatility
|
|
|
62
|
%
|
|
|
62
|
%
|
|
|
58
|
%
|
|
Estimated forfeiture rate
|
8.5
|
%
|
|
|
7.7
|
%
|
|
|
8.3
|
%
|
||
Summary of Stock Options
The following table summarizes all stock option activity under the Company’s stock-based compensation plans for the year ended December 31, 2011:
|
|
|
Number of Options
|
|
|
Weighted-Average Exercise Price Per Share
|
|
|
Weighted-Average Remaining Contractual Term
|
|
|
Aggregate Intrinsic Value
|
|
||||
|
Outstanding at December 31, 2010
|
|
2,892,974
|
|
|
$
|
3.22
|
|
|
4.04
|
|
|
$
|
2,430,991
|
|
||
|
Granted
|
|
|
122,500
|
|
|
|
3.12
|
|
|
|
|
|
|
|
||
|
Exercised
|
(34,896
|
)
|
1.96
|
|||||||||||||
|
Forfeited
|
(76,941
|
)
|
3.86
|
|||||||||||||
|
Expired
|
|
|
(178,287
|
)
|
|
|
5.02
|
|
|
|
|
|
|
|
||
|
Outstanding at December 31, 2011
|
|
2,725,350
|
|
|
$
|
3.11
|
|
|
3.30
|
|
|
$
|
1,480,145
|
|
||
|
Vested and expected to vest at December 31, 2011
|
2,682,082
|
$
|
3.09
|
3.23
|
$
|
1,476,495
|
||||||||||
|
Exercisable at December 31, 2011
|
2,175,081
|
$
|
2.86
|
2.41
|
$
|
1,408,078
|
||||||||||
The aggregate intrinsic value of options outstanding at December 31, 2011 is calculated as the difference between the exercise price of the underlying options and the market price of the Company’s common stock for 1.4 million shares that had exercise prices that were lower than the $2.51 market price of the Company’s common stock at December 31, 2011 (“in the money options”). The total intrinsic value of options exercised during the years ended December 31, 2011, 2010 and 2009 was $39,000, $0.2 million and $0.2 million, respectively. The fair value of options vested during the years ended December 31, 2011, 2010 and 2009 was $1.2 million, $0.4 million and $0.4 million, respectively. The weighted average grant date fair value of options granted during the years ended December 31, 2011, 2010 and 2009 was $1.75, $2.62 and $1.09, respectively.
As of December 31, 2011, total unrecognized compensation cost related to stock options granted under the Company’s various plans was $0.7 million. The Company expects that cost to be recognized over a weighted-average period 1.85 years.
Summary of Restricted Stock Units and Restricted Stock Awards
The following table summarizes all restricted stock unit activity under the Company’s stock-based compensation plans for the year ending December 31, 2011:
|
|
|
Number of Shares
|
|
|
Weighted-Average Remaining Contractual Term (Years)
|
|
|
Aggregate Intrinsic Value
|
|
|||
|
Outstanding at December 31, 2010
|
|
342,752
|
|
|
1.35
|
|
|
$
|
1,025,973
|
|
||
|
Awarded
|
|
|
78,328
|
|
|
|
|
|
|
|
||
|
Released (Vested)
|
(198,884
|
)
|
||||||||||
|
Forfeited
|
|
|
(29,341
|
)
|
|
|
|
|
|
|
||
|
Outstanding at December 31, 2011
|
|
192,855
|
|
|
1.23
|
|
|
$
|
484,066
|
|
||
|
Vested and expected to vest at December 31, 2011
|
173,313
|
1.17
|
$
|
435,017
|
||||||||
Restricted stock units were granted for the first time in 2006 under the 1999 Equity Incentive Plan. The fair value of these awards is calculated based upon the fair market value of the Company’s stock at the date of grant, less an estimate of pre-vesting forfeitures. The weighted-average grant-date fair value of restricted stock units awarded during fiscal years 2011, 2010 and 2009 was $3.10, $4.73 and $1.96, respectively, and the fair value of stock units that vested during fiscal years 2011, 2010 and 2009 was $0.7 million, $0.9 million and $0.9 million, respectively. As of December 31, 2011, total unrecognized compensation cost related to restricted stock units was $0.6 million. The Company expects that cost to be recognized over a weighted-average period 2.15 years.
Employee Stock Purchase Plan (“ESPP”)
ESPP awards were valued using the Black-Scholes model using the following assumptions:
|
Year Ended December 31,
|
||||||||||||
|
|
|
2011
|
|
2010
|
|
2009
|
|
|||||
|
Expected life (in years)
|
|
0.5-1.0
|
|
0.5-1.0
|
|
0.5-1.0
|
||||||
|
Risk-free interest rate
|
0.2
|
%
|
|
0.4
|
%
|
1.1
|
%
|
|||||
|
Dividend yield
|
|
|
0
|
%
|
|
|
0
|
%
|
|
|
0
|
%
|
|
Expected volatility
|
|
|
40
|
%
|
|
|
58
|
%
|
|
|
85
|
%
|
Disclosures Pertaining to All Share-Based Compensation Plans
Cash received under all share-based payment arrangements for the years ended December 31, 2011, 2010 and 2009 was $0.4 million, $0.6 million and $0.7 million, respectively, related to the exercise of stock options and the purchase of ESPP shares. The weighted-average grant-date fair value of options, restricted stock units and restricted stock awards granted in the years ended December 31, 2011, 2010 and 2009 was $2.28, $3.42 and $1.18 per share, respectively. The Company issues new shares upon option exercise and does not repurchase or issue treasury shares.
9. Accrued Liabilities
Accrued liabilities consist of the following (in thousands):
|
December 31
|
||||||||
|
|
|
2011
|
|
|
2010
|
|
||
|
Accrued vacation
|
|
$
|
1,193
|
|
|
$
|
1,114
|
|
|
Accrued commissions and bonus
|
|
|
772
|
|
|
|
1,147
|
|
|
Other accrued liabilities
|
1,103
|
1,692
|
||||||
|
Accounts payable accruals
|
|
|
488
|
|
|
|
245
|
|
|
Total accrued liabilities
|
$
|
3,556
|
$
|
4,198
|
||||
10. Deferred Revenue
Deferred revenue consists of the following (in thousands):
|
December 31
|
||||||||
|
|
|
2011
|
|
|
2010
|
|
||
|
Current:
|
|
|
|
|
|
|
||
|
Products
|
|
$
|
2,631
|
|
|
$
|
3,662
|
|
|
Service and support
|
9,975
|
12,726
|
||||||
|
Total deferred revenue, current
|
|
|
12,606
|
|
|
|
16,388
|
|
|
|
|
|
|
|
|
|||
|
Long-term:
|
|
|
||||||
|
Products
|
$
|
172
|
$
|
111
|
||||
|
Service and support
|
4,544
|
5,372
|
||||||
|
Total deferred revenue, long-term
|
|
4,716
|
5,483
|
|||||
11. Warranties and Indemnification
The Company generally provides a warranty that the Company’s software products substantially operate as described in the manuals and guides that accompany the software for a period of 90 days. The warranty does not apply in the event of misuse, accident, and certain other circumstances. To date, the Company has not incurred any material costs associated with these warranties and has no accrual for such items at December 31, 2011.
From time to time, the Company enters into contracts that require the Company, upon the occurrence of certain contingencies, to indemnify parties against third party claims. These contingent obligations primarily relate to (i) claims against the Company’s customers for violation of third party intellectual property rights caused by the Company’s products; (ii) claims resulting from personal injury or property damage resulting from the Company’s activities or products; (iii) claims by the Company’s office lessor arising out of the use of the premises; and (iv) agreements with the Company’s officers and directors under which the Company may be required to indemnify such persons for liabilities arising out of their activities on behalf of the Company. No liabilities have been recorded for these obligations as of December 31, 2011.
12. Bank Line of Credit
On November 30, 2011, the Company amended its existing revolving line of credit agreement with Comerica Bank (“Comerica”). The maximum that can be borrowed under the agreement is $7.5 million. The line expires on December 31, 2013. Borrowing under the line of credit bears interest at a “daily adjusting LIBOR rate”, are subject to reporting covenants requiring the provision of financial statements to Comerica and, as amended, financial covenants requiring the Company to maintain a minimum adjusted quick ratio of 1.15 and net worth greater than or equal to negative $2.5 million. The agreement includes a letter of credit sublimit not to exceed $1.0 million. There were no borrowings outstanding on the line of credit at December 31, 2011, and the Company was in compliance with all its covenants.
Subsequent to December 31, 2011, the Company amended and restated its revolving line of credit agreement with Comerica Bank. The maximum that can be borrowed under the agreement is $5.0 million. The line expires on December 31, 2013. Borrowing under the line of credit bears interest at a “daily adjusting LIBOR rate”, are subject to reporting covenants requiring the provision of financial statements to Comerica, and, as amended, financial covenants requiring the Company to maintain a specified minimum adjusted quick ratio and a specified level of net worth. The required levels vary over the course of the year. On March 15, 2012, the Company borrowed $3.0 million under the line of credit.
13. Provision for Income Taxes
Substantially all income (loss) before income taxes is derived from the United States.
The components of the provision for income taxes are as follows (in thousands):
|
Year Ended December 31,
|
||||||||||||
|
|
|
2011
|
|
|
2010
|
|
|
2009
|
|
|||
|
Current:
|
|
|
|
|
|
|
||||||
|
Federal
|
$
|
—
|
$
|
(8
|
)
|
$
|
50
|
|||||
|
State
|
|
|
28
|
|
|
|
28
|
|
|
|
265
|
|
|
Foreign
|
|
|
19
|
|
|
|
5
|
|
|
|
—
|
|
|
Total current
|
|
$
|
47
|
|
|
$
|
25
|
|
|
$
|
315
|
|
|
Deferred:
|
||||||||||||
|
Federal
|
$
|
104
|
$
|
104
|
$
|
104
|
||||||
|
State
|
13
|
14
|
10
|
|||||||||
|
Foreign
|
|
—
|
|
—
|
|
—
|
||||||
|
Total deferred
|
|
117
|
|
118
|
|
114
|
||||||
|
Total provision for income taxes
|
$
|
164
|
$
|
143
|
$
|
429
|
||||||
Differences between income taxes calculated using the federal statutory income tax rate and the provision for income taxes were as follows (in thousands):
|
Year Ended December 31,
|
||||||||||||
|
|
|
2011
|
|
|
2010
|
|
|
2009
|
|
|||
|
Computed tax at statutory rate of 34%
|
|
$
|
(2,091
|
)
|
$
|
(3,246
|
)
|
$
|
1,777
|
|
||
|
State taxes, net of federal benefit
|
(151
|
)
|
23
|
299
|
||||||||
|
Federal alternative minimum tax
|
|
|
—
|
|
|
|
—
|
|
|
|
102
|
|
|
Losses (benefited) not benefited
|
|
|
(28
|
)
|
|
|
176
|
|
|
|
(1,787
|
)
|
|
Nondeductible stock-based compensation
|
|
157
|
|
|
124
|
|
|
105
|
|
|||
|
Other nondeductible expenses
|
74
|
106
|
259
|
|||||||||
|
Change in valuation allowance
|
2,203
|
2,960
|
(326
|
)
|
||||||||
|
Provision for income taxes
|
$
|
164
|
$
|
143
|
$
|
429
|
||||||
Deferred income taxes reflect the net tax effects of temporary differences between carrying amounts of assets and liabilities for financial reporting purposes and the amounts used for income tax purposes. Significant components of the Company’s deferred tax assets (liabilities) are as follows, (in thousands):
|
December 31,
|
||||||||
|
|
|
2011
|
|
|
2010
|
|
||
|
Deferred tax assets:
|
|
|
|
|
|
|
||
|
Net operating loss carryforwards
|
|
$
|
24,444
|
|
|
$
|
21,652
|
|
|
Capitalized software development costs
|
10
|
10
|
||||||
|
Deferred revenue
|
|
|
1,825
|
|
|
|
2,476
|
|
|
Research credit carryforwards
|
3,350
|
3,012
|
||||||
|
Other
|
3,110
|
3,031
|
||||||
|
Gross deferred tax assets
|
32,739
|
30,181
|
||||||
|
Less: Valuation allowance
|
|
32,739
|
30,181
|
|||||
|
Total deferred tax assets, net
|
—
|
—
|
||||||
|
Deferred tax liabilities:
|
||||||||
|
Goodwill
|
(471
|
)
|
(355
|
)
|
||||
|
Net deferred tax liability
|
$
|
(471
|
)
|
$
|
(355
|
)
|
||
As of December 31, 2011, the Company has U.S. federal and state net operating loss carryforwards of approximately $69.4 million and $50.9 million, respectively. The U.S. federal net operating loss carryforwards will expire at various dates beginning in 2019 through 2031 if not utilized. State net operating loss carryforwards will expire at various dates beginning in 2013 through 2031.
As of December 31, 2011, the Company has U.S. federal and state tax credit carryforwards of approximately $2.4 million and $3.2 million, respectively. The federal credit will expire at various dates beginning in 2018 through 2031, if not utilized. California state research and development credits can be carried forward indefinitely.
The Company uses the "with-and-without" approach to determine the recognition and measurement of excess tax benefits. In addition, the Company has elected to account for indirect effects of stock option based awards on other tax attributes, such as research and alternative minimum tax credits, through the income statement. Accordingly, the Company has elected to recognize excess tax benefits from stock option exercises in additional paid-in capital only if an incremental income tax benefit would be realized after considering all other tax attributes presently available to the Company.
Therefore, included in the net operating loss carryforwards are losses created by the exercise of stock options. Although these net operating loss carryforwards are reflected in total U.S. net operating tax loss carryforwards deferred tax assets associated with these deductions are only recognized to the extent that they reduce taxes payable. Further, these recognized deductions are treated as direct increases to stockholders' equity (net capital deficiency) and as a result do not impact the Company’s results of operations.
Net operating loss carryforwards and credit carryforwards reflected above are limited due to ownership changes as provided in the Internal Revenue Code and similar state provisions.
The Company does not provide for U.S. federal income and state income taxes on undistributed earnings of the China and Puerto Rico subsidiaries at December 31, 2011 because these earnings are intended to be indefinitely reinvested. At December 31, 2011, the cumulative amount of earnings upon which U.S. income tax has not been provided is approximately $0.1 million. Upon distribution of those earnings in the form of dividends or otherwise, the Company would be subject to nominal U.S. federal and state income taxes. It is not practicable to determine the income tax liability that might be incurred if these earnings were to be repatriated to the U.S.
At December 31, 2011, the Company had a liability for unrecognized tax benefits of $2.7 million. For those benefits to be recognized, a tax position must be more-likely-than-not to be sustained upon examination by taxing authorities. The Company believes there may be changes in its unrecognized tax positions over the next twelve months, but will not be a material adjustment.
Interest and penalty costs related to unrecognized tax benefits are classified as a component of income tax expense and the corresponding liability in the balance sheet. The Company recognized an immaterial amount of interest expense related to unrecognized tax benefits for the years ended December 31, 2011, 2010 and 2009.
The Company files U.S. federal, state, and foreign income tax returns. Material jurisdictions are Federal and California tax returns, which remain open to examination by the appropriate governmental agencies for tax years 2007 to 2011. The federal and state taxing authorities may choose to audit tax returns for tax years beyond the statute of limitation period due to significant tax attribute carryforwards from prior years, making adjustments only to carryforward attributes. The Company is not currently under audit in any major tax jurisdiction.
A reconciliation of the beginning and ending amount of the consolidated liability for unrecognized tax benefits during the years ended December 31, 2011, 2010 and 2009 is as follows (in thousands):
|
Year Ended December 31
|
||||||||||||
|
|
|
2011
|
|
|
2010
|
|
|
2009
|
|
|||
|
Balance at January 1
|
|
$
|
2,547
|
$
|
2,397
|
$
|
1,883
|
|
||||
|
Additions for tax positions of prior years
|
—
|
—
|
434
|
|||||||||
|
Additions for tax positions related to the current year
|
|
|
149
|
|
|
|
154
|
|
|
|
130
|
|
|
Reductions for tax positions of prior years
|
|
|
(18
|
)
|
|
|
(4
|
)
|
|
|
(50
|
)
|
|
Settlements during the current year
|
|
—
|
|
|
—
|
|
|
—
|
|
|||
|
Balance at December 31
|
$
|
2,678
|
$
|
2,547
|
$
|
2,397
|
||||||
14. Stockholders’ Equity (Net Capital Deficiency)
Common Stock
At December 31, 2011, the Company had reserved shares of common stock for future issuance as follows:
|
Stock options outstanding
|
2,725,350 | |||
|
Stock awards outstanding
|
192,855 | |||
|
Stock options available for future grants
|
1,287,026 | |||
|
Employee stock purchase plan
|
525,567 | |||
| 4,730,798 |
15. Commitments and Contingencies
Leases
The Company has a non-cancelable lease agreement for its corporate office facilities in Oakland, California. The minimum lease payment was approximately $78,000 per month through 2008. From 2009 through the end of the lease, the base lease payment increases at a compound annual rate of approximately 5%. The lease expires in December 2013. The Company also has lease agreements for the Tucson, Arizona office through May 2013 at an average rent of approximately $11,000 per month. In June 2010, the Company signed a lease for an office in Shanghai, China for 2,500 square feet at a rate of approximately $4,000 per month through May 2012 to be used for research and development. The Company recognizes rent expense, including increases in rent, under these leases on a straight-line basis over the term of the lease. In addition, the Company leases certain equipment under capital lease arrangements that extend through 2014 for the amounts of $170,000 in 2012, $55,000 in 2013, and $7,000 in 2014.
License Agreement
In September 1996, the Company entered into a license agreement with a university for the use of the intellectual property underlying its most significant current products. In exchange for the license, which expires in 2014, the Company issued stock and paid a license-issue fee. The agreement also provided for milestone payments, all of which have been made, and for royalties based on booked sales of products using the licensed technology. Royalty expenses were $0.4 million, $0.5 million and $0.8 million for the years ended December 31, 2011, 2010 and 2009, respectively, and are included in cost of product revenues.
If the Company loses or is unable to maintain the license agreement during the term of the underlying patents, it would adversely affect the business. The university may terminate the license agreement if the Company fails to perform or violate its terms without curing the violation within 60 days of receiving written notice of the violation.
At December 31, 2011, the Company's future minimum lease payments and future payments under its royalty agreements are as follows (in thousands):
| 2012 | 2013 | 2014 | 2015 and thereafter | Total | ||||||||||||||||
|
Contractual Obligations:
|
|
|
|
|||||||||||||||||
|
Lease obligations
|
$ | 1,444 | $ | 1,297 | $ | 7 | $ | — | $ | 2,748 | ||||||||||
|
Minimum royalty obligations
|
150 | 150 | 150 | — | 450 | |||||||||||||||
|
Total
|
$ | 1,594 | $ | 1,447 | $ | 157 | $ | — | $ | 3,198 | ||||||||||
Rent expense under all operating leases was $1.2 million, $1.1 million and $1.3 million for the years ended December 31, 2011, 2010 and 2009, respectively.
16. Employee Retirement and Benefit Plan
The Company has a defined contribution retirement plan under Section 401(k) of the Internal Revenue Code, which covers substantially all employees. The Company did not match contributions by plan participants for the years ended December 31, 2009, 2010 and 2011.
17. Related Party Transactions
On September 30, 2003, the Company entered into an agreement with Posit Science Corporation (“Posit Science”), formerly Neuroscience Solutions Corporation, to provide Posit Science with exclusive rights in the healthcare field to certain intellectual property, patents and software owned or licensed, along with transfer of certain healthcare research projects. A co-founder, substantial shareholder, and former member of the Board of Directors is a co-founder, officer, director and substantial shareholder of Posit Science. Under the agreement, the Company receives net royalties between 2% to 4% on products sold by Posit Science that uses the Company’s patents or software. The Company has a 3.5% equity interest in Posit Science. The royalty income recorded from Posit Science was $0.2 million, $0.1 million and $0.2 million for years ended December 31, 2011, 2010 and 2009, respectively.
In July 2007 Michael A. Moses joined the Board of Directors as Vice Chair and entered into a consulting agreement with the Company. The consulting agreement provides for a consulting fee of $40,000 per year and two stock option grants, both with a five year term and at a per share exercise price of $7.15, the closing price of the Company’s Common Stock on July 25, 2007. The first option grant for 80,000 shares vests over four years, with a one year cliff with ratable monthly vesting thereafter. The second option for 100,000 shares vests only in the event the per share price of the Company’s common stock reaches and maintains for 20 consecutive business days a specified target closing price as follows: 25,000 shares vesting at each target stock price of $15, $20, $25, and $30. In November 2010 Shari Simon joined the Board of Directors and in 2011 entered into a consulting agreement with the Company. Shari Simon provides consulting work related to sales models and implementation. In fiscal year 2011 she received total compensation of approximately $71,000.
Also in place is a consulting agreement with Dr. Paula Tallal, who is one of the Company's founders and also a current Board member. She provides ongoing consulting in the areas of public speaking and customer relationships; in fiscal years 2011, 2010 and 2009 she received total compensation of approximately $77,000, $80,000 and $69,000, respectively. Dr. Michael Merzenich, another of the Company's founders who retired as a Board member in October 2008, has provided consulting services from time to time, including public speaking, meetings with third parties and other projects, and in fiscal 2011, 2010 and 2009 received total compensation of approximately zero, zero and $45,000, respectively.
18. Interim Financial Information (unaudited)
Quarterly financial data (in thousands, except per share amounts):
|
Three Months Ended
|
||||||||||||||||||||
|
March 31
|
June 30
|
September 30
|
December 31(1)
|
Total
|
||||||||||||||||
|
Fiscal Year 2011:
|
||||||||||||||||||||
|
Total revenues
|
$ | 10,435 | $ | 12,397 | $ | 10,536 | $ | 7,711 | $ | 41,079 | ||||||||||
|
Gross profit
|
7,827 | 10,029 | 7,759 | 4,776 | 30,391 | |||||||||||||||
|
Net income (loss)
|
$ | (2,363 | ) | $ | 884 | $ | (1,243 | ) | $ | (3,754 | ) | $ | (6,476 | ) | ||||||
|
Net income (loss) per share:
|
||||||||||||||||||||
|
Basic
|
$ | (0.13 | ) | $ | 0.05 | $ | (0.07 | ) | $ | (0.20 | ) | $ | (0.34 | ) | ||||||
|
Diluted
|
$ | (0.13 | ) | $ | 0.05 | $ | (0.07 | ) | $ | (0.20 | ) | $ | (0.34 | ) | ||||||
|
Fiscal Year 2010:
|
||||||||||||||||||||
|
Total revenues
|
$ | 11,065 | $ | 12,307 | $ | 10,234 | $ | 9,778 | $ | 43,384 | ||||||||||
|
Gross profit
|
8,112 | 9,453 | 7,430 | 6,949 | 31,944 | |||||||||||||||
|
Net loss
|
$ | (1,899 | ) | $ | (781 | ) | $ | (825 | ) | $ | (6,185 | ) | $ | (9,690 | ) | |||||
|
Basic and diluted net loss per share
|
$ | (0.10 | ) | $ | (0.04 | ) | $ | (0.04 | ) | $ | (0.34 | ) | $ | (0.52 | ) | |||||
|
|
(1) Net loss for the three months ended December 31, 2010 includes a $3.9 million non-cash impairment charge.
|
ITEM 9. CHANGES IN AND DISAGREEMENTS WITH ACCOUNTANTS ON ACCOUNTING AND FINANCIAL DISCLOSURE
None.
ITEM 9A. CONTROLS AND PROCEDURES
Evaluation of Disclosure Controls and Procedures
Disclosure controls and procedures are designed to ensure that information required to be disclosed in our reports filed under the Exchange Act, such as this Annual Report on Form 10-K, is recorded, processed, summarized and reported within the required time periods. These procedures are also designed to ensure that such information is accumulated and communicated to our management, including our Chief Executive Officer and Chief Financial Officer, as appropriate to allow timely decisions regarding required disclosure.
As required under Rule 13a-15(b) of the Exchange Act, our management, including the Chief Executive Officer and Chief Financial Officer, conducted an evaluation of the effectiveness of the Company’s disclosure controls and procedures as of the end of the period covered by this Annual Report on Form 10-K, and concluded that our disclosure controls and procedures were effective as of December 31, 2011.
It should be noted that a control system, no matter how well designed and operated, can provide only reasonable, not absolute, assurance that the objectives of the control system are met. As a result, there can be no assurance that a control system will succeed in preventing all possible instances of error and fraud. Our disclosure controls and procedures are designed to provide reasonable assurance of achieving their objectives, and the conclusions of our Chief Executive Officer and the Chief Financial Officer are made at the “reasonable assurance” level.
Management's Report on Internal Control over Financial Reporting
Our management is responsible for establishing and maintaining adequate internal control over financial reporting, as such term is defined in Rules 13a-15(f) and 15d-15(f) of the Exchange Act. Our internal control system was designed to provide reasonable assurance regarding the reliability of financial reporting and the preparation of financial statements for external purposes, in accordance with generally accepted accounting principles. Because of inherent limitations, a system of internal control over financial reporting may not prevent or detect misstatements. Also, projections of any evaluation of effectiveness to future periods are subject to the risk that controls may become inadequate due to change in conditions, or that the degree of compliance with the policies or procedures may deteriorate.
Our management, including our Chief Executive Officer and Chief Financial Officer, conducted an evaluation of the effectiveness of our internal control over financial reporting using the criteria set forth by the Committee of Sponsoring Organizations of the Treadway Commission (COSO) in Internal Control—Integrated Framework. Based on its evaluation, our management concluded that our internal control over financial reporting was effective as of the end of the period covered by this report.
Changes in Internal Controls over Financial Reporting
There were no changes in our internal control over financial reporting that occurred during the year ended December 31, 2011 that have materially affected, or are reasonably likely to materially affect, our internal control over financial reporting.
ITEM 9B. OTHER INFORMATION
None.
PART III
ITEM 10. DIRECTORS, EXECUTIVE OFFICERS AND CORPORATE GOVERNANCE
The information required by this item with respect to our executive officers is contained in Part I “Executive Officers” and such information is also incorporated by reference in this section.
Information required by this item respecting our directors, audit committee and code of ethics is set forth under the caption “Proposal 1: Election of Directors” in our Proxy Statement relating to our 2012 Annual Meeting of Stockholders (the “Proxy Statement”) and is incorporated by reference into this Form 10-K Report. The Proxy Statement will be filed with the Securities and Exchange Commission in accordance with Rule 14a-6(c) promulgated under the Securities Exchange Act of 1934, as amended (the “Exchange Act”). With the exception of the foregoing information and other information specifically incorporated by reference into this Form 10-K Report, the Proxy Statement is not being filed as a part hereof.
Information with respect to compliance with Section 16(a) of the Exchange Act is set forth under the caption “Section 16(a) Beneficial Ownership Reporting Compliance” in the Proxy Statement and is incorporated by reference into this Form 10-K Report.
ITEM 11. EXECUTIVE COMPENSATION
Information required by this item concerning compensation of executive officers and directors is set forth under the caption “Executive Compensation” in the Proxy Statement and is incorporated by reference into this Form 10-K Report.
ITEM 12. SECURITY OWNERSHIP OF CERTAIN BENEFICIAL OWNERS AND MANAGEMENT AND RELATED STOCKHOLDER MATTERS
Information required by this item concerning security ownership of certain beneficial owners and management is set forth under the caption “Security Ownership of Certain Beneficial Owners and Management” in the Proxy Statement and is incorporated by reference into this Form 10-K Report.
Information required by this item concerning shares authorized for issuance under equity compensation plans approved by stockholders and not approved by stockholders is set forth under the caption “Equity Compensation Plan Information” in the Proxy Statement and is incorporated by reference into this Form 10-K Report.
ITEM 13. CERTAIN RELATIONSHIPS AND RELATED TRANSACTIONS, AND DIRECTOR INDEPENDENCE
Information required by this item concerning director independence is set forth under the caption “Proposal 1: Election of Directors” in the Proxy Statement. Information concerning certain relationships and related transactions is set forth under the captions “Employment Agreement” and “Certain Transactions” in the Proxy Statement. Both are incorporated by reference into this Form 10-K Report.
ITEM 14. PRINCIPAL ACCOUNTANT FEES AND SERVICES
Information required by this item concerning the independent auditor’s fees and services is set forth under the caption “Ratification of Selection of Independent Registered Public Accounting Firm” in the Proxy Statement and is incorporated by reference into this Form 10-K Report.
PART IV
ITEM 15. EXHIBITS AND FINANCIAL STATEMENT SCHEDULES
|
|
(a)
|
Documents filed as part of this report:
|
|
|
(1)
|
Financial Statements
|
Report of Independent Registered Public Accounting Firm
Consolidated Balance Sheet – December 31, 2011 and 2010
Consolidated Statements of Operations – Years Ended December 31, 2011, 2010 and 2009
Consolidated Statements of Stockholders’ Equity (Net Capital Deficiency) – Years Ended December 31, 2011, 2010 and 2009
Consolidated Statements of Cash Flows – Years Ended December 31, 2011, 2010 and 2009
Notes to Consolidated Financial Statements
|
|
(2)
|
Financial Statement Schedules
|
As required under Item 8, Financial Statements and Supplementary Data, the financial statement schedule of the Company is provided in this separate section. The financial statement schedule included in this section is as follows:
Schedule II – Valuation and Qualifying Accounts (in thousands):
|
|
|
Beginning Balance
|
|
|
Change (credit) to Operating Expenses
|
|
|
Additions (deductions) to Allowance
|
|
|
Ending Balance
|
|
||||
|
2011
|
|
$
|
76
|
|
|
$
|
(175
|
)
|
|
$
|
258
|
|
|
$
|
159
|
|
|
2010
|
|
$
|
97
|
|
|
$
|
(18
|
)
|
|
$
|
(3
|
)
|
|
$
|
76
|
|
|
2009
|
$
|
296
|
$
|
(75
|
)
|
$
|
(124
|
)
|
$
|
97
|
||||||
Other schedules are either not applicable or the required information is shown in the consolidated financial statements or notes thereto.
|
|
(b)
|
Exhibits
|
A list of exhibits filed herewith is contained in the exhibit index that immediately precedes such exhibits and is incorporated herein by reference.
Pursuant to the requirements of Section 13 or 15(d) of the Securities Exchange Act of 1934, the registrant has duly caused this report to be signed on its behalf by the undersigned, thereunto duly authorized.
SCIENTIFIC LEARNING CORPORATION
|
By /s/ D. Andrew Myers
|
March 28, 2012
|
|
|
D. Andrew Myers
|
||
|
President, Chief Executive Officer
|
Pursuant to the requirements of the Securities Exchange Act of 1934, this report has been signed below by the following persons on behalf of the registrant and in the capacities and on the dates indicated.
|
Signature
|
Title
|
Date
|
||
|
/s/ D. Andrew Myers
|
President, Chief Executive Officer, Director
|
March 28,2012
|
||
|
D. Andrew Myers
|
(Principal Executive Officer)
|
|||
|
/s/ Robert E. Feller
|
Chief Financial Officer, Treasurer
|
March 28,2012
|
||
|
Robert E. Feller
|
(Principal Financial and Accounting Officer)
|
|||
|
/s/ Edward Vermont Blanchard, Jr.
|
Director
|
March 28,2012
|
||
|
Edward Vermont Blanchard, Jr.
|
||||
|
/s/ Robert C. Bowen
|
Chairman of the Board , Director
|
March 28,2012
|
||
|
Robert C. Bowen
|
||||
|
/s/ Gayle A. Crowell
|
Director
|
March 28,2012
|
||
|
Gayle A. Crowell
|
||||
|
/s/ Dr. Michael A. Moses
|
Director
|
March 28,2012
|
||
|
Dr. Michael A. Moses
|
||||
|
/s/ Shari Simon
|
Director
|
March 28,2012
|
||
|
Shari Simon
|
||||
|
/s/ Dino A. Rossi
|
Director
|
March 28,2012
|
||
|
Dino A. Rossi
|
||||
|
/s/ Dr. Paula A. Tallal
|
Director
|
March 28,2012
|
||
|
Dr. Paula A. Tallal
|
||||
|
/s/ Jeffrey D. Thomas
|
Director
|
March 28,2012
|
||
|
Jeffrey D. Thomas
|
EXHIBIT INDEX
|
Incorporated by Reference
|
||||||||||||
|
Exhibit Number
|
Description
|
Form
|
File Number
|
Date of First Filing
|
Exhibit Number
|
Filed Herewith
|
||||||
|
3.1
|
Amended and Restated Certificate of Incorporation
|
10-Q
|
000-24547
|
5/7/2007
|
3.1
|
|||||||
|
3.2
|
Amended and Restated Bylaws
|
S-1/A
|
333-143093
|
7/16/2007
|
3.2
|
|||||||
|
3.3
|
Certificate of Amendment to the Amended and Restated Certificate of Incorporation
|
S-1/A
|
333-143093
|
7/16/2007
|
3.3
|
|||||||
|
4.1
|
Reference is made to Exhibits 3.1 through 3.2
|
|||||||||||
|
4.2
|
Specimen Stock Certificate
|
S-1/A
|
333-56545
|
7/17/1998
|
4.3
|
|||||||
|
4.3
|
Form of Warrant
|
8-K
|
000-24547
|
3/22/2012
|
4.2
|
|||||||
|
10.1*
|
Form of Indemnity Agreement with each of our directors and executive officers
|
S-1
|
333-56545
|
6/10/1998
|
10.1
|
|||||||
|
10.2*
|
1999 Equity Incentive Plan, as amended
|
10-K
|
000-24547
|
3/4/2011
|
10.2
|
|||||||
|
10.3*
|
Forms of Restricted Stock Unit Grant Notice and Restricted Stock Unit Agreement under the Incentive Plan
|
10-K
|
000-24547
|
3/14/2006
|
10.3
|
|||||||
|
10.4*
|
Forms of Stock Option Grant Notice, Stock Option Agreement and Stock Bonus Agreement under the Incentive Plan
|
10-Q
|
000-24547
|
8/14/2003
|
10.3
|
|||||||
|
10.5*
|
1999 Non-Employee Directors’ Stock Option Plan, as amended
|
10-K
|
000-24547
|
4/15/2005
|
10.4
|
|||||||
|
10.6*
|
Employee Stock Purchase Plan, as amended
|
DEF 14A
|
000-24547
|
4/13/2011
|
—
|
|||||||
|
10.7*
|
Form of Employee Stock Purchase Plan Offering under the Employee Stock Purchase Plan
|
10-K
|
000-24547
|
3/3/2010
|
10.7
|
|||||||
|
10.8*
|
Milestone Equity Incentive Plan
|
10-Q
|
000-24547
|
5/14/2004
|
10.29
|
|||||||
|
10.9*
|
2002 CEO Option Plan
|
8-K
|
000-24547
|
6/7/2002
|
99.2
|
|||||||
|
10.10*
|
Separation Agreement between the Company and David C. Myers
|
8-K
|
000-24547
|
8/24/2011
|
99.1
|
|||||||
|
10.11*
|
Retirement Agreement by and between Scientific Learning Corporation and Robert C. Bowen, effective as of January 1, 2010
|
10-K
|
000-24547
|
3/3/2010
|
10.14
|
|||||||
|
10.12*
|
Independent Contractor Agreement by and between Scientific Learning Corporation and Robert C. Bowen, effective as of January 1, 2010
|
10-K
|
000-24547
|
3/3/2010
|
10.15
|
|||||||
|
10.13*
|
Offer of Employment Letter Agreement with D. Andrew Myers
|
8-K
|
000-24547
|
12/7/2007
|
10.1
|
|||||||
|
10.14*
|
Letter Agreement with D. Andrew Myers amending the terms of his employment, dated December 15, 2008
|
8-K
|
000-24547
|
1/2/2009
|
10.1
|
|||||||
|
Exhibit Number
|
Description
|
Form
|
File Number
|
Date of First Filing
|
Exhibit Number
|
Filed Herewith
|
||||||
|
10.15*
|
Independent Contractor Agreement dated April l7, 2003 between the Registrant and Paula A. Tallal and Project Assignment thereunder dated December 17, 2004
|
8-K
|
000-24547
|
12/20/2004
|
99.1
|
|||||||
|
10.16*
|
Independent Contractor Project Assignment between the Registrant and Paula A. Tallal effective January 1, 2011
|
10-K
|
000-24547
|
3/4/2011
|
10.20
|
|||||||
|
Independent Contractor Project Assignment between the Registrant and Paula A. Tallal effective January 1, 2012
|
X
|
|||||||||||
|
10.18*
|
Independent Contractor Agreement dated July 25, 2007 between the Registrant and Michael A. Moses
|
8-K
|
000-24547
|
7/26/2007
|
10.2
|
|||||||
|
10.19*
|
Independent Contractor Project Assignment between the Registrant and School Executive Consulting (for Michael Moses services) effective January 1, 2011
|
10-K
|
000-24547
|
3/3/2010
|
10.23
|
|||||||
|
Independent Contractor Project Assignment between the Registrant and School Executive Consulting (for Michael Moses services) effective January 1, 2012
|
X
|
|||||||||||
|
Independent Contractor Agreement dated February 1, 2011 between the Registrant and Shari Simon and Project Assignment thereunder dated February 24, 2011
|
—
|
—
|
—
|
—
|
X
|
|||||||
|
Independent Contractor Project Assignment between the Registrant and Shari Simon effective January 1, 2012
|
X
|
|||||||||||
|
10.23*
|
2011 Management Incentive Plan
|
8-K
|
000-24547
|
2/24/2011
|
10.1
|
|||||||
|
10.24*
|
2012 Bonus Plan
|
8-K
|
000-24547
|
2/28/2012
|
10.1
|
|||||||
|
10.25*
|
Change of Control Benefit Plan.
|
8-K
|
000-24547
|
5/21/2010
|
10.1
|
|||||||
|
10.26
|
Amended and Restated Loan and Security Agreement dated as of February 9, 2012 by and between the Registrant and Comerica Bank
|
8-K
|
000-24547
|
2/16/2012
|
10.1
|
|||||||
|
10.27
|
Loan and Security Agreement dated as of January 15, 2004 by and between the Registrant and Comerica Bank
|
8-K
|
000-24547
|
2/5/2004
|
99.1
|
|||||||
|
10.28
|
First Amendment to Loan and Security Agreement, dated as of September 29, 2004, by and between Comerica Bank and the Registrant, amending the Loan and Security Agreement
|
10-K
|
000-24547
|
4/15/2005
|
10.30
|
|
Exhibit Number
|
Description
|
Form
|
File Number
|
Date of First Filing
|
Exhibit Number
|
Filed Herewith
|
||||||
|
10.29
|
Second Amendment to Loan and Security Agreement, dated as of December 2, 2005, by and between Comerica Bank and the Registrant, amending the Loan and Security Agreement
|
10-K
|
000-24547
|
3/14/2006
|
10.19
|
|||||||
|
10.30
|
Third Amendment to Loan and Security Agreement, dated as of September 5, 2006, by and between Comerica Bank and the Registrant, amending the Loan and Security Agreement
|
10-K
|
000-24547
|
3/8/2007
|
10.20
|
|||||||
|
10.31
|
Fourth Amendment to Loan and Security Agreement, dated as of June 5, 2007, by and between Comerica Bank and the Registrant, amending the Loan and Security Agreement
|
S-1/A
|
333-143093
|
7/16/2007
|
10.22
|
|||||||
|
10.32
|
Fifth Amendment to Loan and Security Agreement, dated as of June 30, 2008, by and between Comerica Bank and the Registrant, amending the Loan and Security Agreement
|
10-Q
|
000-24547
|
8/6/2008
|
10.2
|
|||||||
|
10.33
|
Sixth Amendment to Loan and Security Agreement, dated as of January 30, 2009, by and between Comerica Bank and the Registrant, amending the Loan and Security Agreement
|
8-K
|
000-24547
|
4/30/2009
|
10.1
|
|||||||
|
10.34
|
Bilateral Extension Letter relating to Loan and Security Agreement, dated as of December 31, 2009, by and between Comerica Bank and the Registrant.
|
10-K
|
000-24547
|
3/3/2010
|
10.33
|
|||||||
|
10.35†
|
Seventh Amendment to Loan and Security Agreement, dated as of February June 30, 2008, by and between Comerica Bank and the Registrant, including Prime Referenced Rate Addendum to Loan and Security Agreement, amending the Loan and Security Agreement
|
10-K
|
000-24547
|
3/3/2010
|
10.34
|
|||||||
|
10.36
|
Exclusive License Agreement, dated September 27, 1996, with the Regents of the University of California
|
S-1
|
333-56545
|
6/10/1998
|
10.13
|
|||||||
|
10.37
|
Amendment No. 3 to Exclusive License Agreement, dated September 27, 1996, with the Regents of the University of California, amending the agreement
|
10-Q
|
000-24547
|
11/14/2003
|
10.36
|
|
Exhibit Number
|
Description
|
Form
|
File Number
|
Date of First Filing
|
Exhibit Number
|
Filed Herewith
|
||||||
|
10.38
|
Amendment No. 4 to Exclusive License Agreement, dated September 27, 1996, with the Regents of the University of California, amending the agreement
|
10-K
|
000-24547
|
3/8/2007
|
10.23
|
|||||||
|
10.39
|
Amendment No. 5 to License Agreement of September 27, 1996 between the Regents of the University of California and Registrant, effective as of July 1, 2010
|
10-Q
|
000-24547
|
8/13/2010
|
10.2
|
|||||||
|
10.40
|
Lease, dated as of October 1, 2003, with Rotunda Partners II
|
10-Q
|
000-24547
|
11/14/2003
|
10.37
|
|||||||
|
10.41
|
First Amendment to Lease dated February 2008, between TriPointe Tucson, LLC and the Company
|
10-Q
|
000-24547
|
5/9/2008
|
10.3
|
|||||||
|
10.42
|
Technology Transfer Agreement dated as of September 30, 2003 by and between the Registrant and Neuroscience Solutions Corporation (now renamed Posit Science Corporation) or “NSC”
|
8-K
|
000-24547
|
10/1/2003
|
99.1
|
|||||||
|
10.43
|
SLC License Agreement dated as of September 30, 2003 by and between the Registrant and NSC
|
8-K
|
000-24547
|
10/1/2003
|
99.2
|
|||||||
|
10.44
|
NSC License Agreement dated as of September 30, 2003 by and between NSC and the Registrant
|
8-K
|
000-24547
|
10/1/2003
|
99.3
|
|||||||
|
10.45
|
Amendment No. 1 to SLC License Agreement between Posit Science Corporation and Registrant, effective as of July 1, 2010
|
10-Q
|
000-24547
|
8/13/2010
|
10.3
|
|||||||
|
10.46
|
Consent of UC Regents to Amendment No. 1 to SLC License Agreement, dated June 25, 2010
|
10-Q
|
000-24547
|
8/13/2010
|
10.4
|
|||||||
|
10.47
|
Amendment No. 2 to SLC License Agreement between Posit Science Corporation and Registrant, effective as of July 1, 2010
|
10-Q
|
000-24547
|
8/13/2010
|
10.5
|
|||||||
|
Consent of Independent Registered Public Accounting Firm
|
—
|
—
|
—
|
—
|
X
|
|||||||
|
Certification of Chief Executive Officer (Section 302)
|
—
|
—
|
—
|
—
|
X
|
|||||||
|
Certification of Chief Financial Officer (Section 302)
|
—
|
—
|
—
|
—
|
X
|
|||||||
|
Certification of Chief Executive Officer (Section 906)
|
—
|
—
|
—
|
—
|
X
|
|
Exhibit Number
|
Description
|
Form
|
File Number
|
Date of First Filing
|
Exhibit Number
|
Filed Herewith
|
||||||
|
Certification of Chief Financial Officer (Section 906)
|
—
|
—
|
—
|
—
|
X
|
|
†
|
Certain portions of this exhibit have been omitted based upon confidential treatment granted by the Securities and Exchange Commission for portions of the referenced exhibit.
|
|
*
|
Management contract or compensatory plan or arrangement.
|