Attached files
| file | filename |
|---|---|
| 8-K - FORM 8-K - HEALTHCARE TRUST OF AMERICA, INC. | d325813d8k.htm |
Exhibit 99.1
Supplemental Financial Information: Year Ended 2011
Wisconsin MOB Portfolio 2
Mequon, WI
King Street Medical Office Building
Jacksonville, FL
Greenville Hospital Portfolio:
Patewood MOB C
Greenville, S.C
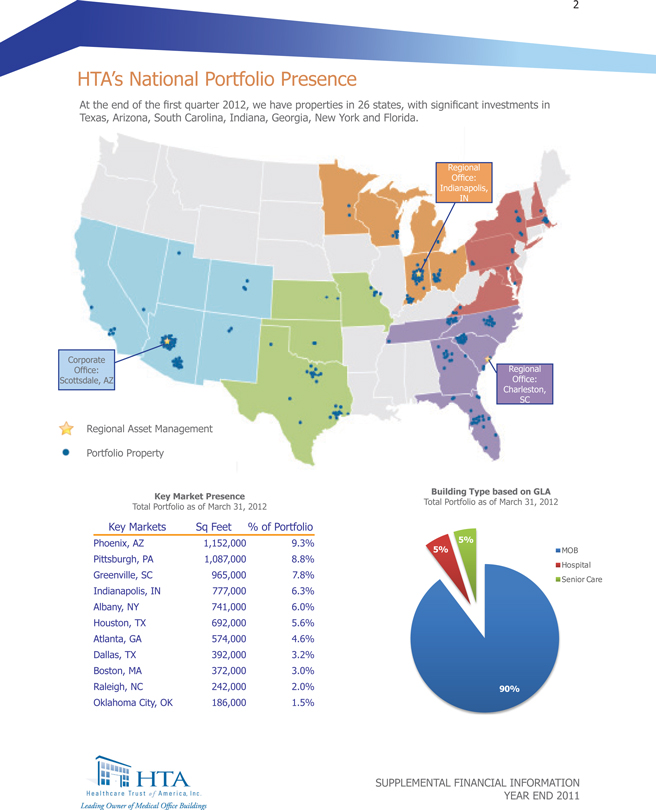
HTA’s National portfolio presence
At the end of the first quarter 2012, we have properties in 26 states, with significant investments in Texas, Arizona, South Carolina, Indiana, Georgia, New York and Florida.
Key Market Presence
Total Portfolio as of March 31, 2012
Key Markets Sq Feet % of Portfolio
Phoenix, AZ 1,152,000 9.3%
Pittsburgh, PA 1,087,000 8.8%
Greenville, SC 965,000 7.8%
Indianapolis,777,000IN 6.3%
Albany, NY 741,000 6.0%
Houston, TX 692,000 5.6%
Atlanta, GA 574,000 4.6%
Dallas, TX 392,000 3.2%
Boston, MA 372,000 3.0%
Raleigh, NC 242,000 2.0%
Oklahoma City,186,000OK 1.5%
Building Type based on GLA
Total Portfolio as of March 31, 2012
SUPPLEMENTAL FINANCIAL INFORMATION
YEAR END 2011
2
HTA’s Business & Growth Strategies
We focus on acquiring high quality medical office buildings with stabilized occupancy in key strategic on-campus locations associated with dominant healthcare systems. Our portfolio has a strong presence in markets that are deemed “business friendly” for their low cost of doing business, favorable regulatory climate and plentiful, educated workforce.
Enterprise Strength.
We are focused on building a trusted enterprise, with the primary goal of delivering maximum value to our shareholders. Under the direction of our experienced executive management team, we believe that our commitment to quality in all facets of our business plan will continue to be the key driver to our success.
Partnering with Healthcare Systems & Physicians.
Our management team has extensive long-term relationships with healthcare systems, developers, lenders and brokers that have dominant market share and high credit quality. These credit quality relationships drive incremental demand for our MOB space, support increased tenant retention rates and provide us with further investment opportunities.
Conservative Balance Sheet & Financial Flexibility.
We actively manage our balance sheet to maintain conservative leverage with carefully staged debt maturities. This positions us to take advantage of strategic investment opportunities. With our low leverage and unused credit facility, we have the capital capacity with increased leverage to acquire over $1billion of medical office buildings, based on the current covenant requirements at the end of December 31, 2011.
Healthcare Sector Fundamentals.
We believe demographic trends, including an aging population, the decentralization and specialization of healthcare services, and high state healthcare spending forecasts will continue to fuel sustainable growth in the healthcare sector. Even during the most recent recession, the healthcare industry has continued to expand in our key markets.
Growth Opportunities.
Growth opportunities are generated by our prudent and disciplined acquisition capability, focused asset management, high-quality and stable existing tenant base, and our experienced executive officers and senior management team. We have a proven track record of acquiring properties offmarket at accretive cap rates.
2011 Highlights
• Closed the year ended 2011 with low leverage and overall debt to asset ratio of 28%
• At the end of December 31, 2011, approximately 57% of our annualized base rent is leased to credit-rated tenants, with 38% having an investment grade credit rating
• Increased our unsecured revolving credit facility to $575 million from $275 million
• Established our asset management footprint and increased access to our tenants by opening regional offices in Indianapolis, IN and Charleston, SC
• In July 2011, we received investment grade credit ratings from two nationally recognized credit rating agencies
• Increased YTD FFO by 60% compared to the prior year
• Grew YTD NOI by 35% year over year
• Maintained a strong overall portfolio occupancy of 91%
• Transitioned 34% of our portfolio to a regionally-focused HTA property management platform
• Purchased six MOBs with a total purchase price of $68.3 million and 306,000 square feet of GLA
2012 Highlights
• To date in 2012, HTA has completed $214.2 million in new medical office acquisitions which includes 1,162,000 square feet of GLA and extends its geographic presence into Michigan.
• On March 29, 2012, we closed an upsized $875 million unsecured credit facility consisting of a $575 million revolving tranche and a $300 million term loan tranche. The maturity of the new credit facility was extended to March 2016 with an option to extend by an additional year.
• On January 12, 2012, we purchased a MOB located in Novi, MI for $51.3 million.
• On January 31, 2012, we purchased a MOB located in Atlanta, GA for $8.9 million.
• On March 1, 2012, we purchased a MOB located in Pittsburgh, PA for $54 million.
• On March 30, 2012, we purchased a 13-building MOB portfolio in Boston, MA for $100 million.
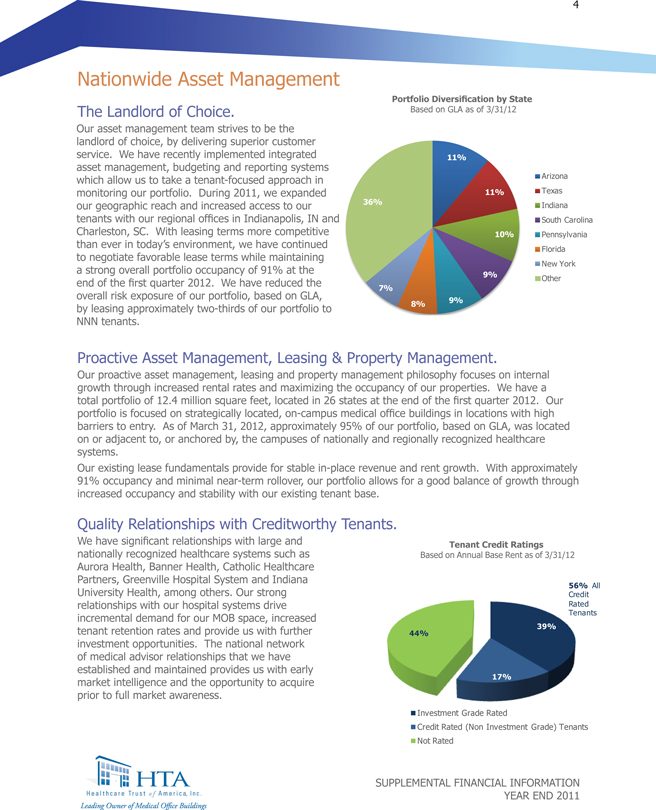
Nationwide Asset Management
The Landlord of Choice.
Our asset management team strives to be the landlord of choice, by delivering superior customer service. We have recently asset management, budgeting and reporting systems which allow us to take a tenant-focused approach in monitoring our portfolio. During 2011, we expanded our geographic reach and increased access to our tenants with our regional offices in Indianapolis, IN and Charleston, SC. With leasing terms more competitive than ever in today’s environment, we have continued to negotiate favorable lease terms while maintaining a strong overall portfolio occupancy of 91% at the end of the first quarter 2012. We have reduced the overall risk exposure of our portfolio, based on GLA, by leasing approximately two-thirds of our portfolio to NNN tenants.
Portfolio Diversification by State
Based on GLA as of 3/31/12
Proactive Asset Management, Leasing & Property Management.
Our proactive asset management, leasing and property management philosophy focuses on internal growth through increased rental rates and maximizing the occupancy of our properties. We have a total portfolio of 12.4 million square feet, located in 26 states at the end of the first quarter 2012. Our portfolio is focused on strategically located, on-campus medical office buildings in locations with high barriers to entry. As of March 31, 2012, approximately 95% of our portfolio, based on GLA, was located on or adjacent to, or anchored by, the campuses of nationally and regionally recognized healthcare systems.
Our existing lease fundamentals provide for stable in-place revenue and rent growth. With approximately 91% occupancy and minimal near-term rollover, our portfolio allows for a good balance of growth increased occupancy and stability with our existing tenant base.
Quality Relationships with Creditworthy Tenants.
We have significant relationships with large and nationally recognized healthcare systems such as Aurora Health, Banner Health, Catholic Healthcare Partners, Greenville Hospital System and Indiana University Health, among others. Our strong relationships with our hospital systems drive incremental demand for our MOB space, increased tenant retention rates and provide us with further investment opportunities. The national network of medical advisor relationships that we have established and maintained provides us with early market intelligence and the opportunity to acquire prior to full market awareness.
Tenant Credit Ratings Based on Annual Base Rent as of 3/31/12
SUPPLEMENTAL FINANCIAL INFORMATION
YEAR END 2011
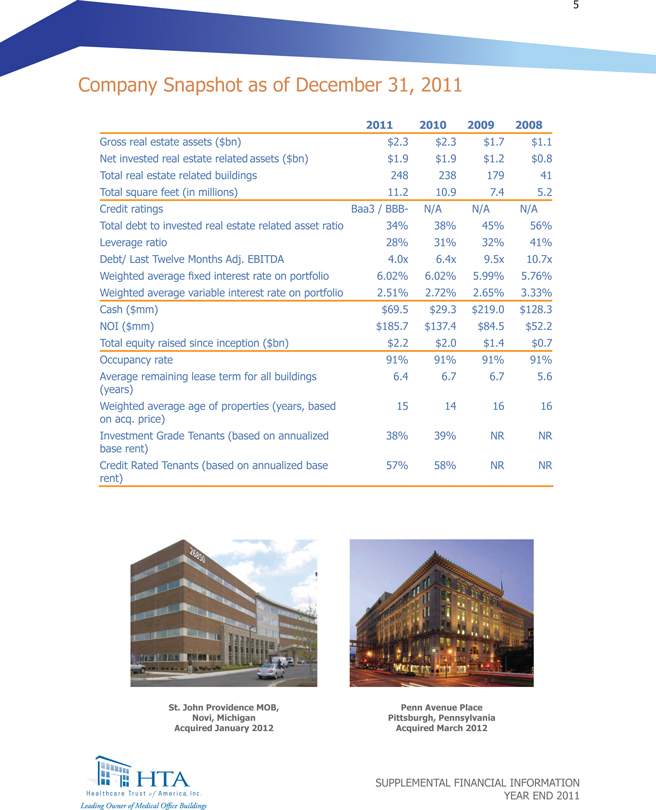
Company Snapshot as of December 31, 2011
2011 2010 2009 2008
Gross real estate assets ($bn)$2.3 $2.3 $1.7 $1.1
Net invested realassetsestate($bn)related$1.9 $1.9 $1.2 $0.8
Total real estate related buildings 248 238 179 41
Total square feet (in millions)11.2 10.9 7.4 5.2
Credit ratings Baa3 / BBB-N/A N/A N/A
Total debt to invested real estate related asset ratio 34% 38% 45% 56%
Leverage ratio 28% 31% 32% 41%
Debt/ Last Twelve Months Adj EBITDA4.0x 6.4x 9.5x10.7x
Weighted average fixed interest6.02%6.rate02%5.on99%5.portfolio76%
Weighted average variable interest rate on portfolio 2.51%2.72%2.65%3.33%
Cash ($mm) $69.5$29.3$219.0$128.3
NOI ($mm) $185.7$137.4$84.5$52.2
Total equity raised since inception$2.2 $2.0 $1.($bn)4 $0.7
Occupancy rate 91% 91% 91% 91%
Average remaining lease term for all buildings 6.4 6.7 6.7 5.6
(years)
Weighted average age of properties15 14 (years,16 16based
on acq. price)
Investment Grade Tenants (based38% 39%on annualizedNR NR
base rent)
Credit Rated Tenants (based57%on annualized58% NR NRbase
rent)
St. John Providence MOB,
Novi, Michigan
Acquired January 2012
Penn Avenue Place Pittsburgh, Pennsylvania Acquired March 2012
SUPPLEMENTAL FINANCIAL INFORMATION
YEAR END 2011
Healthcare Sector & Economic Overview
Healthcare is one of the fastest growing segments of the US economy, driven by a continually expanding population and growth in the utilization of medical care as the baby boomer generation approaches retirement age. Advancements in medical technology and specialization have allowed physicians to perform lower cost procedures that have traditionally been performed in hospitals with limited space. As demand for medical services increases, physicians are moving into medical office facilities that are better suited to the needs of the profession and a shifting consumer preference for outpatient services. Medical office buildings provide stable, long-term growth within this market, and do not experience as much volatility as other healthcare asset classes during turbulent times. The aging population, combined with baby boomers’ shifting preference toward delivery of care outside of hospitals, should produce a sustainable growth period within the medical office sector.
Favorable MOB
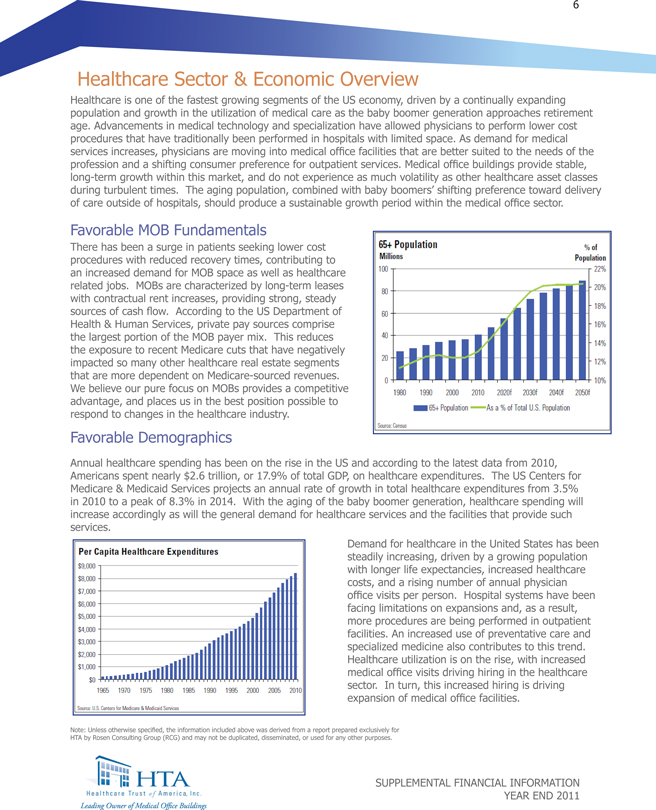
There has been a surge in patients seeking lower cost procedures with reduced recovery times, contributing to an increased demand for MOB space as well as healthcare related jobs. MOBs are characterized by long-term leases with contractual rent increases, providing strong, steady sources of cash flow. According to the US Department of Health & Human Services, private pay sources comprise the largest portion of the MOB payer mix. This reduces the exposure to recent Medicare cuts that have negatively impacted so many other healthcare real estate segments that are more dependent on Medicare-sourced revenues. We believe our pure focus on MOBs provides a competitive advantage, and places us in the best position possible to respond to changes in the healthcare industry.
Favorable Demographics
Annual healthcare spending has been on the rise in the US and according to the latest data from 2010,
Americans spent nearly $2.6 trillion, or 17.9% of total GDP, on healthcare expenditures. The US Centers for Medicare & Medicaid Services projects an annual rate of growth in total healthcare expenditures from 3.5% in 2010 to a peak of 8.3% in 2014. With the aging of the baby boomer generation, healthcare spending will increase accordingly as will the general demand for healthcare services and the facilities that provide such services.
Demand for healthcare in the United States has been steadily increasing, driven by a growing population with longer life expectancies, increased healthcare costs, and a rising number of annual physician office visits per person. Hospital systems have been facing limitations on expansions and, as a result, more procedures are being performed in outpatient facilities. An increased use of preventative care and specialized medicine also contributes to this trend.
Healthcare utilization is on the rise, with increased medical office visits driving hiring in the healthcare sector. In turn, this increased hiring is driving expansion of medical office facilities.
Note: Unless otherwise specified, the information HTA by Rosen Consulting Group (RCG) and may not be
SUPPLEMENTAL FINANCIAL INFORMATION
YEAR END 2011
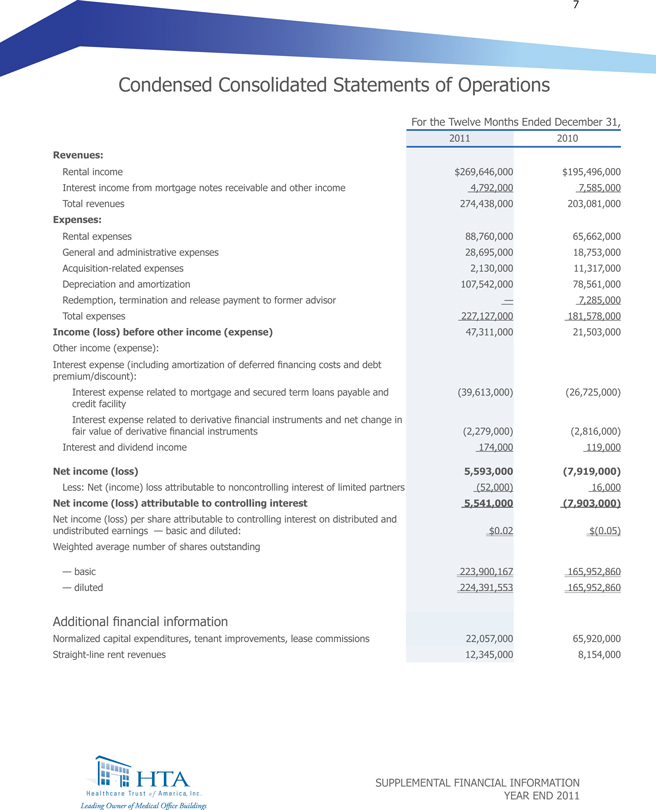
Condensed Consolidated Statements of Operations
For the Twelve Months Ended December 31,
2011 2010
Revenues:
Rental income $269,646,000$195,496,000
Interest income from mortgage notes receivable and other income 4,792,000 7,585,000
Total revenues 274,438,000 203,081,000
Expenses:
Rental expenses 88,760,000 65,662,000
General and administrative expenses 28,695,000 18,753,000
Acquisition-related expenses 2,130,000 11,317,000
Depreciation and amortization 107,542,000 78,561,000
Redemption, termination and release payment to former advisor — 7,285,000
Total expenses 227,127,000 181,578,000
Income (loss) before other income (expense) 47,311,000 21,503,000
Other income (expense):
Interest expense (including amortization of deferred financing costs and debt
premium/discount):
Interest expense related to mortgage and secured term loans payable and (39,613,000) (26,725,000)
credit facility
Interest expense related to derivative financial instruments and net change in
fair value of derivative financial instruments(2,279,000) (2,816,000)
Interest and dividend income 174,000 119,000
Net income (loss) 5,593,000 (7,919,000)
Less: Net (income) loss attributable to noncontrolling interest of limited partners (52,000) 16,000
Net income (loss) attributable to controlling interest 5,541,000 (7,903,000)
Net income (loss) per share attributable to controlling interest on distributed and
undistributed earnings — basic and diluted: $0.02 $(0.05)
Weighted average number of shares outstanding
— basic 223,900,167 165,952,860
— diluted 224,391,553 165,952,860
Additional financial information
Normalized capital expenditures, tenant improvements lease commissions,22,057,000 65,920,000
Straight-line rent revenues 12,345,000 8,154,000
SUPPLEMENTAL FINANCIAL INFORMATION
YEAR END 2011
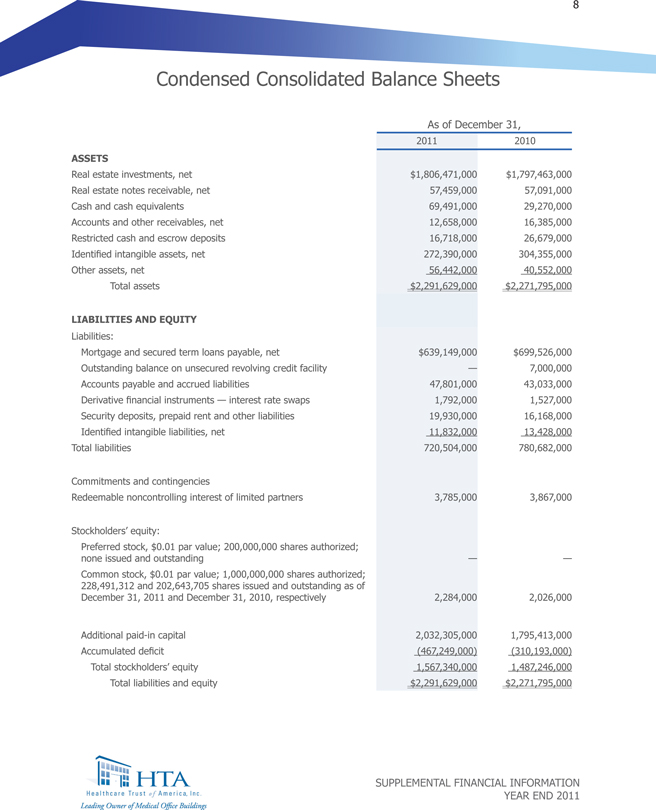
Condensed Consolidated Balance Sheets
As of December 31,
2011 2010
ASSETS
Real estate investments, net $1,806,471,000, 1,797,463,000
Real estate notes receivable, net 57,459,000 57,091,000
Cash and cash equivalents 69,491,00029,270,000
Accounts and other receivables, net 12,658,000, 16,385,000
Restricted cash and escrow deposits 16,718,000, 26,679,000
Identified intangible assets, net 272,390,000 304,355,000
Other assets, net 56,442,00040,552,000
Total assets $2,291,629,000$2,271,795,000
LIABILITIES AND EQUITY
Liabilities:
Mortgage and secured term loans payable, net $639,149,000, $699,526,000
Outstanding balance on unsecured revolving credit facility — 7,000,000
Accounts payable and accrued liabilities 47,801,000 43,033,000
Derivative financial instruments — interest rate swaps 1,792,000 1,527,000
Security deposits, prepaid rent and other liabilities 19,930,000, 16,168,000
Identified intangible liabilities, net11,832,000 13,428,000
Total liabilities 720,504,000, 780,682,000
Commitments and contingencies
Redeemable noncontrolling interest of limited partners 3,785,000, 3,867,000
Stockholders’ equity:
Preferred stock,par value;$0.01200,000,000shares authorized;
none issued and outstanding — —
Common stock,par value;$0.01 1,000,000,000shares authorized;
228,491,312 and 202,643,705 shares issued and outstanding as of
December 31, 2011 and December 31, 2010, respectively 2,284,000, 2026,000
Additional paid-in capital 2,032,305,000 1,795,413,000
Accumulated deficit (467,249,000), (310,193,000)
Total stockholders’ equity 1,567,340,000, 1,487,246,000
Total liabilities and equity $2,291,629,000$2,271,795,000
SUPPLEMENTAL FINANCIAL INFORMATION
YEAR END 2011
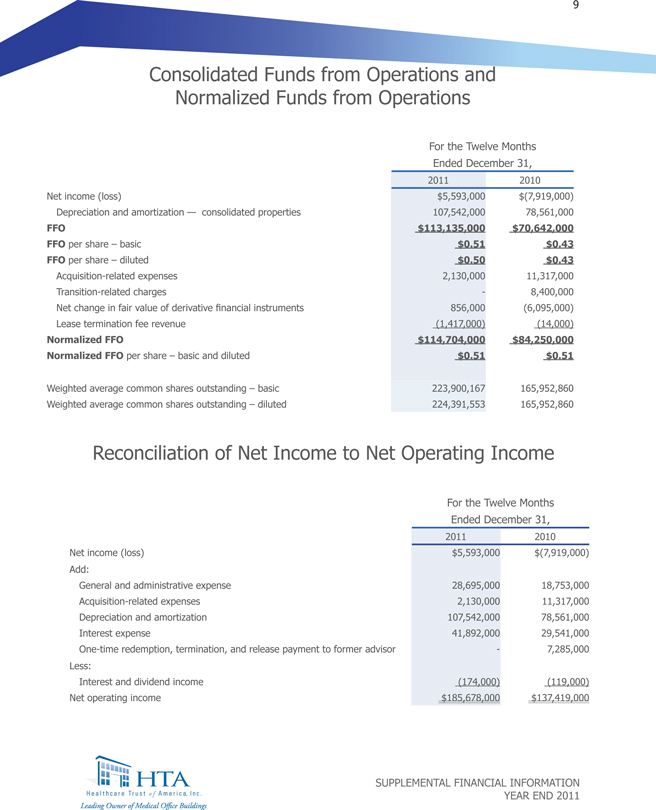
Consolidated Funds from Operations and
Normalized Funds from Operations
For the Twelve Months
Ended December 31,
2011 2010
Net income (loss) $5,593,000 $(7,919,000)
Depreciation and amortization — consolidated properties 107,542,000 78,561,000
FFO $113,135,000 $70,642,000
FFOper share – basic $0.51 $0.43
FFOper share – diluted $0.50 $0.43
Acquisition-related expenses 2,130,000 11,317,000
Transition-related charges - 8,400,000
Net change in fair value of derivative financial856,000 instruments(6,095,000)
Lease termination fee revenue (1,417,000)(14,000)
Normalized FFO $114,704,000 $84,250,000
Normalizedper shareFFO– basic and diluted $0.51 $0.51
Weighted average common shares outstanding – basic 223,900,167165,952,860
Weighted average common shares outstanding – diluted 224,391,553 165,952,860
Reconciliation of Net Income to Net Operating Income
For the Twelve Months
Ended December 31,
2011 2010
Net income (loss) $5,593,000 $(7,919,000)
Add:
General and administrative expense 28,695,00018,753,000
Acquisition-related expenses 2,130,000 11,317,000
Depreciation and amortization 107,542,000 78,561,000
Interest expense 41,892,000 29,541,000
One-time redemption, termination, and release payment to former advisor - 7,285,000
Less:
Interest and dividend income (174,000) (119,000)
Net operating income $185,678,000$137,419,000
SUPPLEMENTAL FINANCIAL INFORMATION
YEAR END 2011
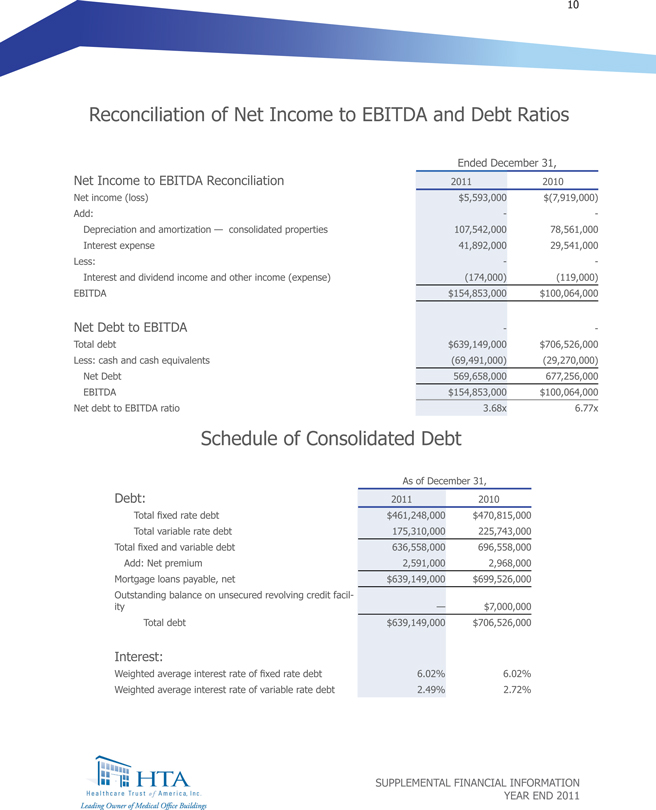
Reconciliation of Net Income to EBITDA and Debt Ratios Ended December 31,
Net Income to EBITDA Reconciliation2011 2010
Net income (loss) $5,593,000 $(7,919,000)
Add: - -
Depreciation and amortization — consolidated properties 107,542,000 78,561,000
Interest expense 41,892,000 29,541,000
Less: - -
Interest and dividend income and other income(174,000)(expense)(119,000)
EBITDA $154,853,000 $100,064,000
Net Debt to EBITDA - -
Total debt $639,149,000$706,526,000
Less: cash and cash equivalents (69,491,000)(29,270,000)
Net Debt 569,658,000677,256,000
EBITDA $154,853,000 $100,064,000
Net debt to EBITDA ratio 3.68x 6.77x
Schedule of Consolidated Debt As of December 31,
Debt: 2011 2010
Total fixed rate debt $461,248,000$470,815,000
Total variable rate debt 175,310,000 225,743,000
Total fixed and variable debt 636,558,000, 696,558,000
Add: Net premium 2,591,000, 2,968,000
Mortgage loans payable, net $639,149,000, 699,526,000
Outstanding balance on unsecured revolving credit facil-
ity — $7,000,000
Total debt $639,149,000, 706,526,000
Interest:
Weighted average interest rate of6.02%fixed rate6.02%debt
Weighted average interest rate of variable rate debt 2.49% 2.72%
SUPPLEMENTAL FINANCIAL INFORMATION
YEAR END 2011
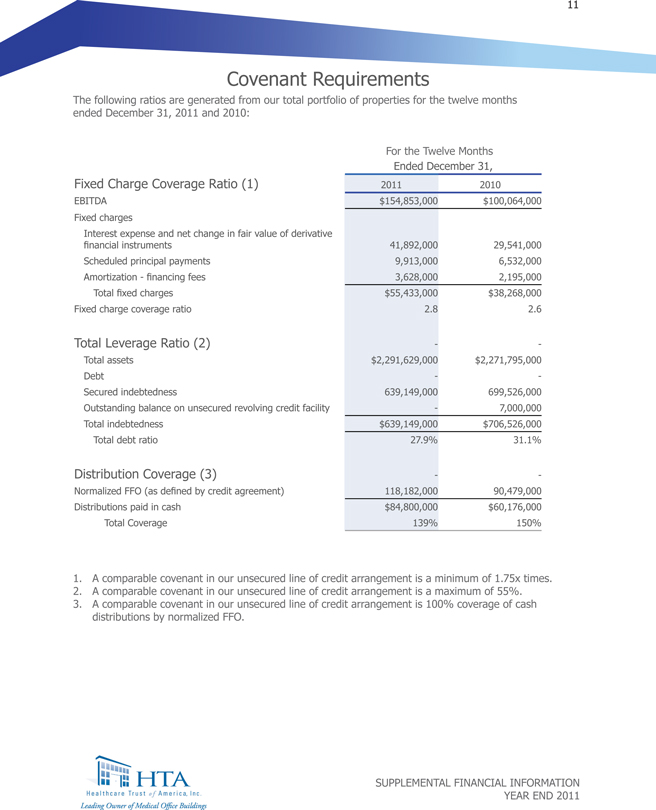
Covenant Requirements
The following ratios are generated from our total portfolio of properties for the twelve months ended December 31, 2011 and 2010:
For the Twelve Months
Ended December 31,
Fixed Charge Coverage Ratio 2011 (1) 2010
EBITDA $154,853,000 $100,064,000
Fixed charges
Interest expense and net change in fair value of derivative
financial instruments 41,892,000 29,541,000
Scheduled principal payments 9,913,000 6,532,000
Amortization - financing fees 3,628,000 2,195,000
Total fixed charges $55,433,000 $38,268,000
Fixed charge coverage ratio 2.8 2.6
Total Leverage Ratio (2) - -
Total assets $2,291,629,000 $2,271,795,000
Debt - -
Secured indebtedness 639,149,000 699,526,000
Outstanding balance on unsecured revolving credit facility - 7,000,000
Total indebtedness $639,149,000 $706,526,000
Total debt ratio 27.9% 31.1%
Distribution Coverage (3) - -
Normalized FFO (as defined by credit 118,182,000 agreement) 90,479,000
Distributions paid in cash $84,800,000 $60,176,000
Total Coverage 139% 150%
1. A comparable covenant in our unsecured line of credit arrangement is a minimum of 1.75x times.
2. A comparable covenant in our unsecured line of credit arrangement is a maximum of 55%.
3. A comparable covenant in our unsecured line of credit arrangement is 100% coverage of cash distributions by normalized FFO.
SUPPLEMENTAL FINANCIAL INFORMATION
YEAR END 2011
Glossary/Definitions
• Acquisition-related expenses: Prior to 2009, acquisition-related expenses were capitalized and have historically been added back to FFO over time through depreciation; however, beginning in 2009, acquisition- related expenses related to related to business combinations are expenses have been and will continue to be funded from the proceeds of our offerings and our debt and not from operations. We believe by excluding expensed acquisition-related expenses, normalized FFO provides useful supplemental information that is comparable for our real estate investments.
• Annualized Base Rent: Based on contractual base rent from leases in effect as of the end of each year and does not reflect tenant concessions. Excludes notes receivable.
• Capital Expenditures, Tenant Improvements, Leasing Commissions: Represents amounts paid in cash for (1) recurring and non-recurring capital expenditures required to maintain and re-tenant our properties, (2) second generation improvements, and (3) leasing commissions paid to third party leasing agents to secure new tenants.
• Distribution Rate: Based on original share price of $10 per share. Distributions are aggregated and paid monthly. It is our intent to continue to pay distributions. However, the amount of distributions we pay to our stockholders is determined by our board of directors, at its discretion, and is dependent on a number of factors, including funds available for the payment of distributions, our financial condition, capital expenditure requirements and annual distribution requirements needed to maintain our status as a REIT under the Internal Revenue Code, as well as any liquidity alternative we may pursue in the future. Our board of directors may reduce its distribution rate and we cannot guarantee the amount of distributions paid in the future, if any.
• EBITDA: Earnings before interest, taxes, depreciation, and amortization. The real estate industry uses EBITDA, a non-GAAP financial measure, as a measure of both operating performance and liquidity.
• Financial Leverage: Total debt divided by gross real estate assets (based on acquisition price and includes two real estate notes receivable).
• Fixed Charges: Interest expense and net gain on derivative financial instruments, scheduled principal payments, and amortization—financing fees. We use fixed charges to measure our interest payments on outstanding debt for purposes of presenting fixed charge coverage.
• Funds from Operations: We define FFO, a non-GAAP measure, as net income or loss computed in accordance with GAAP, excluding gains or losses from sales of property, and impairment write downs of depreciable assets, plus depreciation and amortization, and after adjustments for unconsolidated partnerships and joint ventures. Adjustments for unconsolidated partnerships and joint ventures are calculated to reflect FFO.
• FFO should not be considered as an alternative to net income (loss) or to cash flows from operating activities and is not intended to be used as a liquidity measure indicative of cash flow available to fund our cash needs, including our ability to make distributions. FFO should be reviewed in connection with other GAAP measurements. For more information on FFO, see our
Annual Report on Form 10-K for the year ended December 31, 2011 as filled with Securities and Exchange Commission.
• Gross Leasable Area (GLA): Gross leasable area (in square feet).
SUPPLEMENTAL FINANCIAL INFORMATION
YEAR END 2011
Gross Lease:
Full Service Gross (FSG): Under this type of lease, the tenant pays a pre-determind base rent and operating expenses are typically paid by the Landlord in year 1. In subsequent years, the tenant is responsible for their proportionate share of operating expense increases over the base year.
Modified Gross (MG): Similar to a FSG lease, however, the tenant pays a pre-determind base rent and some of the operating expenses are typically paid by the tenant instead of the Landlord
(i.e. electrical or janitorial).
Gross real estate assets: Based on acquisition price and includes two real estate notes receivable.
Mortgage Notes Receivable and Other: We have acquired two other real estate assets including five notes receivable for an aggregate purchase price of $52,135,000. These assets also include ground leases. Please refer to our Form 10-K for the year ended December 31, 2011 as filed with the Securities and Exchange Commission for more information.
Net Operating Income (NOI): NOI is a non-GAAP financial measure that is defined as net income (loss), computed in accordance with GAAP, generated from our total portfolio of properties before interest expense, general and administrative expenses, depreciation, amortization, acquisition-related expenses, and interest and dividend income. We believe that NOI provides an accurate measure of the operating performance of our operating assets because NOI excludes certain items that are not associated with management of the properties. Additionally, we believe that NOI is a widely accepted measure of comparative operating performance in the real estate community. However, our use of the term NOI may not be comparable to that of other real estate companies as they may have different methodologies for computing this amount.
Normalized Funds from Operations: Normalized FFO is calculated by deducting from FFO transition charges, acquisition-related expenses, net change in fair value of derivative financial instruments, and proceeds received from lease terminations, to further evaluate how our portfolio might perform after our acquisition stage is complete and the sustainability of our distributions in the future.
Normalized FFO should not be considered as an alternative to net income (loss) or to cash flows from operating activities and is not intended to be used as a liquidity measure indicative of cash flow available to fund our cash needs, including our ability to make distributions. Normalized FFO should be reviewed in connection with other GAAP measurements.
Occupancy: Occupancy represents the percentage of total gross leasable area that is leased and occupied, including month-to-month leases and leases signed but not yet commenced, as of the date reported.
Off-Campus: A building or portfolio that is not located on or in close proximity to key hospital based-campuses and is not aligned with recognized healthcare systems.
On-Campus / Health System Aligned: A building or portfolio that is either (1) located on or in close proximity to key hospital-based campuses or (2) aligned with recognized healthcare systems. Approximately 95% of our medical office portfolio includes buildings are considered to be on-campus or health system aligned.
Total equity raised since inception: Excludes share issuance from Distribution Reinvestment Plan( DRIP).
(DRIP).
Total Revenue (TTM): Total revenue for the trailing twelve months.
SUPPLEMENTAL FINANCIAL INFORMATION
YEAR END 2011
Transition-related charges: FFO includes certain charges related to the cost of our transition to self-management. These items include, but are not limited to, additional legal expenses, system conversion costs (including updates to certain estimate development procedures) and non-recuring employment costs. Because MFFO excludes such costs, management believes MFFO provides useful supplemental information by focusing on the changes in our fundamental operations that will be comparable rather than on such transition our transition charges. We do not believe such costs will recur now that our transition to a self-management inrastructure is complete.
Triple Net (NNN): Under this lease, the tenant pays a monthly lump sum bse rent as well as the property taxes, the property insurance, and the maintenance.
SUPPLEMENTAL FINANCIAL INFORMATION
YEAR END 2011
About Healthcare Trust of America
Contact Information
Corporate Headquarters Indianapolis Regional Office Charleston Regional Office
16435 North Scottsdale Road 201 N.Pennsylvania Parkway 463King Street
Suite 320 Suite 201 Suite B
Scottsdale, AZ 85254 Indianapolis, IN 46280 Charleston, SC 29403
(480)998-3478 (317) 550-2800 (843) 623-3751
www.htareit.com
Investor Services
Transfer Agent: Investor Relations
DST Systems, Inc. 16435 North Scottsdale Road
430 West 7th Street Suite 320
Kansas City, MO 64105 Scottsdale, AZ 85254
(888) 801-0107 (480)998-3478
Email: info@htareit.com
Senior Management
Scott D. Peters
Chairman, Chief Executive Officer
& President
Kellie S. Pruitt Mark D. Engstrom Amanda L. Houghton
Chief Financial Officer, Secretary Executive Vice President—Executive Vice President—
and Treasurer Acquisitions Asset Management
Dawna H. Powell Brendan R. Magee Brian Woidneck
Vice President Midwest Regional Asset Manager Vice President Manager East Regional Asset Manager Southwest Regional Asset Manager
Board of Directors
Scott D. Peters W. Brad Blair, II Maurice J. DeWald
Chairman, Chief Executive Officer, Director and Chairman of Director and Chairman of
& President Investment Committee Audit Committee
Warren D. Fix Larry L. Mathis Gary T. Wescombe
Director and Chairman of Director and Chairman of Risk Director and Chairman of
Nominating and Corporate Management Committee Compensation Committee
Governance Committee
Forward-Looking Statements
This supplemental information contains certain forward-looking statements with respect to HTA. Forward-looking statements are statements that are not descriptions of historical facts and include statements regarding management’s intentions, beliefs, expectations, plans or predictions of the future, within the meaning of Section 27A of the Securities Act of 1933, as amended, and Section 21E of the Securities Exchange Act of 1934, as amended. Because such statements include risks, uncertainties and contingencies, actual results may differ materially from those expressed or implied by such forward-looking statements. These risks, uncertainties and contingencies include, but are not limited to, the following: uncertainties relating to changes in general economic and real estate conditions; uncertainties relating to the implementation of recent healthcare legislation; uncertainties regarding changes in the healthcare industry;the uncertainties relating to the implementation of HTA’s real estate investment stategy; and other risk factors as outlined in HTA’s periodic reports, as filed with the Securities and Exchange Commission.
SUPPLEMENTAL FINANCIAL INFORMATION
YEAR END 2011

Banner Sun City Portfolio: Del E. Web Medical Plaza Building B Sun City West, AZ
Shakerag Medical Center Peachtree, GA
Deaconess Evansville Clinic Portfolio, Gateway Health Center Newburgh, IN
Contact Us:
Healthcare Trust of America, Inc.
16435 North Scottsdale Road, Suite 320 Scottsdale, AZ 85254
Telephone: (480) 998-3478
Fax: (480)991-0755
Email: info@htareit.com
Website: www.htareit.com