Attached files
| file | filename |
|---|---|
| EX-99.1 - American Realty Capital Trust, Inc. | v307925_ex99-1.htm |
| 8-K - American Realty Capital Trust, Inc. | v307925_8k.htm |
March 2012 NASDAQ: “ARCT” American Realty Capital Trust, Inc . NASDAQ: ARCT This slide show is for informational purposes only and is not an offer to buy or the solicitation of an offer to sell any shares.
March 2012 2 The data and other information described in these slides speaks as of the date of the slides or an earlier date indicated . Future performance may not be consistent with past performance, and is subject to change and inherent risks and uncertainties . This presentation contains certain statements that are the Company’s and Management’s hopes, intentions, beliefs, expectations, or projections of the future and might be considered to be forward - looking statements under Federal Securities laws . Prospective investors are cautioned that any such forward - looking statements are not guarantees of future performance, and involve risks and uncertainties . The Company’s actual future results may differ significantly from the matters discussed in these forward - looking statements, and we may not release revisions to these forward - looking statements to reflect changes after we’ve made the statements . Factors and risks that could cause actual results to differ materially from expectations are disclosed from time to time in greater detail in the Company’s filings with the SEC including, but not limited to, the Company’s report on Form 10 - K, as well as Company press releases . Introductory Notes This slide show is for informational purposes only and is not an offer to buy or the solicitation of an offer to sell any shares.
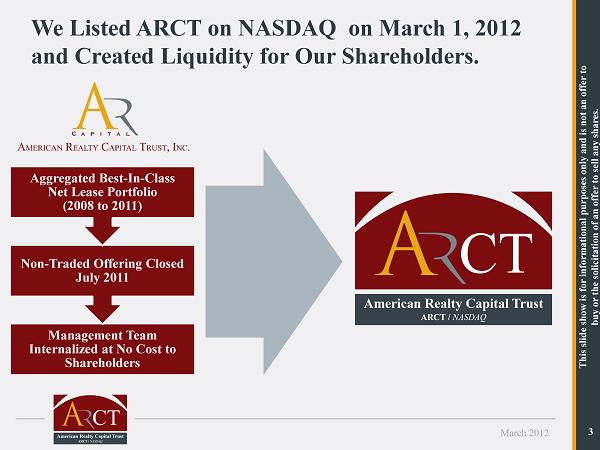
March 2012 3 Management Team Internalized at No Cost to Shareholders Non - Traded Offering Closed July 2011 Aggregated Best - In - Class Net Lease Portfolio (2008 to 2011) We Listed ARCT on NASDAQ on March 1, 2012 and Created Liquidity for Our Shareholders. This slide show is for informational purposes only and is not an offer to buy or the solicitation of an offer to sell any shares.
March 2012 4 Overview of Recent Events High Quality Portfolio Conservative Capital Structure Proven, Focused Business Plan This slide show is for informational purposes only and is not an offer to buy or the solicitation of an offer to sell any shares.
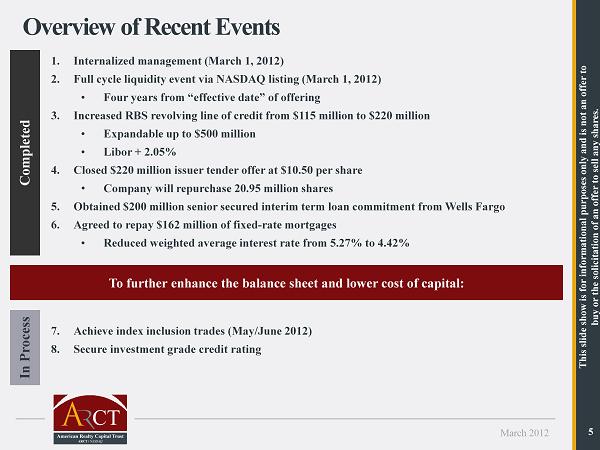
March 2012 5 Overview of Recent Events 1. Internalized management (March 1, 2012) 2. Full cycle liquidity event via NASDAQ listing (March 1, 2012) • Four years from “effective date” of offering 3. Increased RBS revolving line of credit from $115 million to $220 million • Expandable up to $500 million • Libor + 2.05% 4. Closed $220 million issuer tender offer at $10.50 per share • Company will repurchase 20.95 million shares 5. Obtained $200 million senior secured interim term loan commitment from Wells Fargo 6. Agreed to repay $162 million of fixed - rate mortgages • Reduced weighted average interest rate from 5.27% to 4.42% To further enhance the balance sheet and lower cost of capital: Completed In Process 7. Achieve index inclusion trades (May/June 2012) 8. Secure investment grade credit rating This slide show is for informational purposes only and is not an offer to buy or the solicitation of an offer to sell any shares.
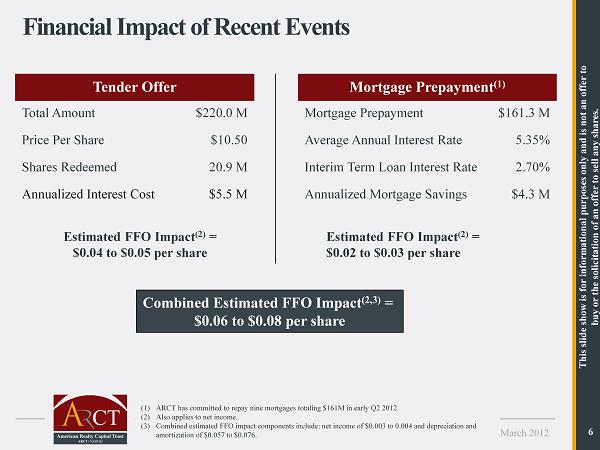
March 2012 6 Financial Impact of Recent Events Tender Offer Mortgage Prepayment (1) Total Amount $220.0 M Mortgage Prepayment $161.3 M Price Per Share $10.50 Average Annual Interest Rate 5.35% Shares Redeemed 20.9 M Interim Term Loan Interest Rate 2.70% Annualized Interest Cost $5.5 M Annualized Mortgage Savings $4.3 M Estimated FFO Impact (2) = $0.04 to $0.05 per share Estimated FFO Impact (2) = $0.02 to $0.03 per share Combined Estimated FFO Impact (2,3) = $0.06 to $0.08 per share (1) ARCT has committed to repay nine mortgages totaling $161M in early Q2 2012. (2) Also applies to net income. (3) Combined estimated FFO impact components include: net income of $0.003 to 0.004 and depreciation and amortization of $0.057 to $0.076. This slide show is for informational purposes only and is not an offer to buy or the solicitation of an offer to sell any shares.
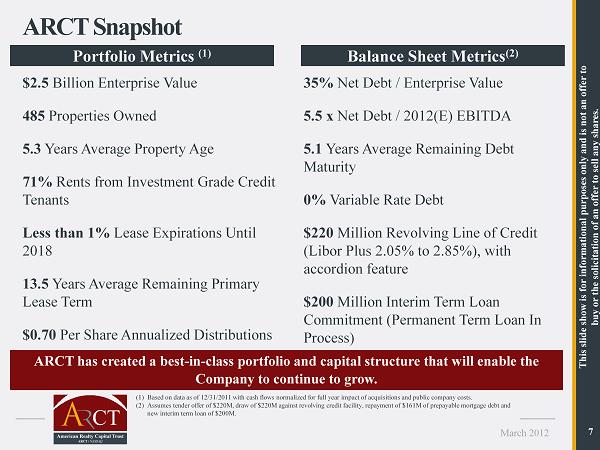
March 2012 7 ARCT Snapshot ARCT has created a best - in - class portfolio and capital structure that will enable the Company to continue to grow. Portfolio Metrics (1) Balance Sheet Metrics (2) (1) Based on data as of 12/31/2011 with cash flows normalized for full year impact of acquisitions and public company costs. (2) Assumes tender offer of $220M, draw of $220M against revolving credit facility, repayment of $ 161M of prepayable mortgage debt and new interim term loan of $200M. $ 2.5 Billion Enterprise Value 485 Properties Owned 5.3 Years Average Property Age 71% Rents from Investment Grade Credit Tenants Less than 1% Lease Expirations Until 2018 13.5 Years Average Remaining Primary Lease Term $0.70 Per Share Annualized Distributions 35% Net Debt / Enterprise Value 5.5 x Net Debt / 2012(E) EBITDA 5.1 Years Average Remaining Debt Maturity 0% Variable Rate Debt $220 Million Revolving Line of Credit (Libor Plus 2.05% to 2.85%), with accordion feature $200 Million Interim Term Loan Commitment (Permanent Term Loan In Process) This slide show is for informational purposes only and is not an offer to buy or the solicitation of an offer to sell any shares.
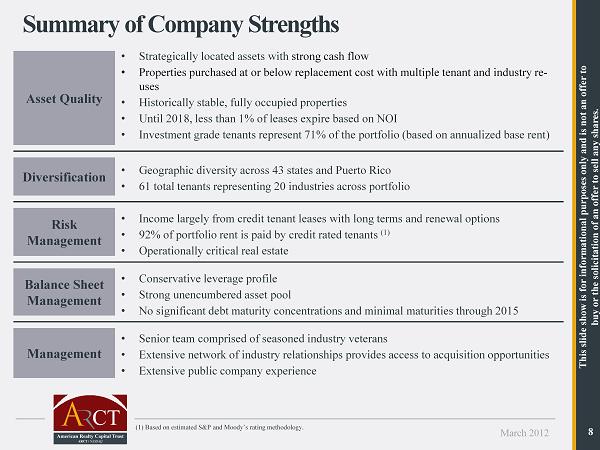
March 2012 8 Summary of Company Strengths (1) Based on estimated S&P and Moody’s rating methodology. • Strategically located assets with strong cash flow • Properties purchased at or below replacement cost with multiple tenant and industry re - uses • Historically stable , fully occupied properties • Until 2018, less than 1% of leases expire based on NOI • Investment grade tenants represent 71% of the portfolio (based on annualized base rent) Asset Quality • Geographic diversity across 43 states and Puerto Rico • 61 total tenants representing 20 industries across portfolio Diversification • Income largely from credit tenant leases with long terms and renewal options • 92% of portfolio rent is paid by credit rated tenants (1) • Operationally critical real estate Risk Management • Conservative leverage profile • Strong unencumbered asset pool • No significant debt maturity concentrations and minimal maturities through 2015 Balance Sheet Management • Senior team comprised of seasoned industry veterans • Extensive network of industry relationships provides access to acquisition opportunities • Extensive public company experience Management This slide show is for informational purposes only and is not an offer to buy or the solicitation of an offer to sell any shares.
March 2012 9 Overview of Recent Events High Quality Portfolio Conservative Capital Structure Proven, Focused Business Plan This slide show is for informational purposes only and is not an offer to buy or the solicitation of an offer to sell any shares.
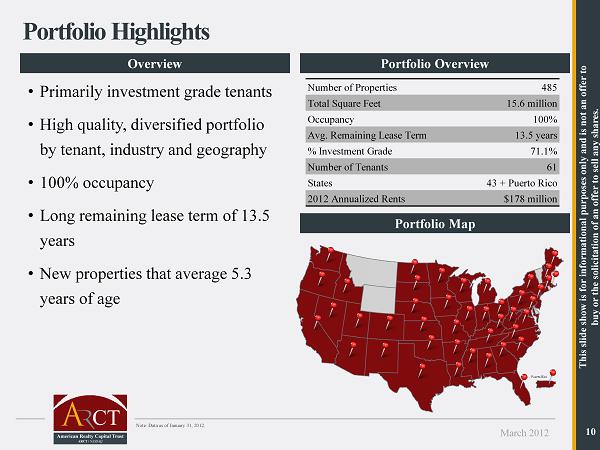
March 2012 10 Portfolio Highlights Overview Portfolio Map Portfolio Overview • Primarily investment grade tenants • High quality, diversified portfolio by tenant, industry and geography • 100% occupancy • Long remaining lease term of 13.5 years • New properties that average 5.3 years of age Number of Properties 485 Total Square Feet 15.6 million Occupancy 100% Avg. Remaining Lease Term 13.5 years % Investment Grade 71.1% Number of Tenants 61 States 43 + Puerto Rico 2012 Annualized Rents $178 million Note: Data as of January 31, 2012. This slide show is for informational purposes only and is not an offer to buy or the solicitation of an offer to sell any shares.
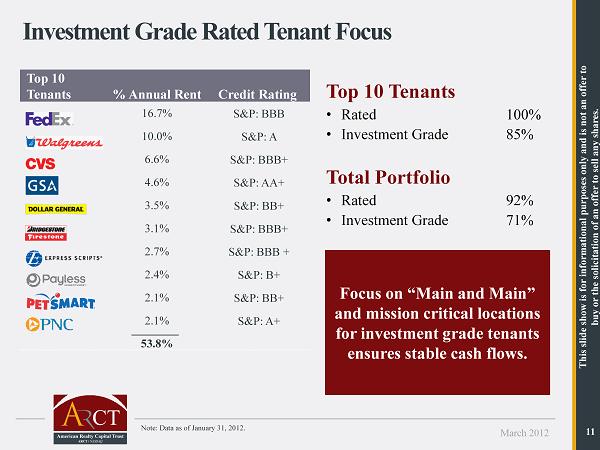
March 2012 11 Investment Grade Rated Tenant Focus Top 10 Tenants % Annual Rent Credit Rating 16.7% S&P: BBB 10.0% S&P: A 6.6% S&P: BBB+ 4.6% S&P: AA+ 3.5% S&P: BB+ 3.1% S&P: BBB+ 2.7% S&P: BBB + 2.4% S&P: B+ 2.1% S&P: BB+ 2.1% S&P: A+ 53.8% Top 10 Tenants • Rated 100% • Investment Grade 85% Total Portfolio • Rated 92% • Investment Grade 71% Focus on “Main and Main ” and mission critical locations for investment grade tenants ensures stable cash flows. Note: Data as of January 31, 2012. This slide show is for informational purposes only and is not an offer to buy or the solicitation of an offer to sell any shares.
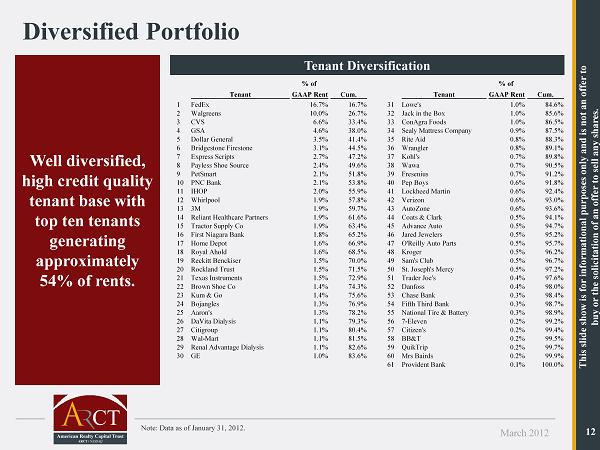
March 2012 12 Diversified Portfolio Tenant Diversification Well diversified, high credit quality tenant base with top ten tenants generating approximately 54% of rents. Note: Data as of January 31, 2012. Tenant % of GAAP Rent Cum. Tenant % of GAAP Rent Cum. 1 FedEx 16.7% 16.7% 31 Lowe's 1.0% 84.6% 2 Walgreens 10.0% 26.7% 32 Jack in the Box 1.0% 85.6% 3 CVS 6.6% 33.4% 33 ConAgra Foods 1.0% 86.5% 4 GSA 4.6% 38.0% 34 Sealy Mattress Company 0.9% 87.5% 5 Dollar General 3.5% 41.4% 35 Rite Aid 0.8% 88.3% 6 Bridgestone Firestone 3.1% 44.5% 36 Wrangler 0.8% 89.1% 7 Express Scripts 2.7% 47.2% 37 Kohl's 0.7% 89.8% 8 Payless Shoe Source 2.4% 49.6% 38 Wawa 0.7% 90.5% 9 PetSmart 2.1% 51.8% 39 Fresenius 0.7% 91.2% 10 PNC Bank 2.1% 53.8% 40 Pep Boys 0.6% 91.8% 11 IHOP 2.0% 55.9% 41 Lockheed Martin 0.6% 92.4% 12 Whirlpool 1.9% 57.8% 42 Verizon 0.6% 93.0% 13 3M 1.9% 59.7% 43 AutoZone 0.6% 93.6% 14 Reliant Healthcare Partners 1.9% 61.6% 44 Coats & Clark 0.5% 94.1% 15 Tractor Supply Co 1.9% 63.4% 45 Advance Auto 0.5% 94.7% 16 First Niagara Bank 1.8% 65.2% 46 Jared Jewelers 0.5% 95.2% 17 Home Depot 1.6% 66.9% 47 O'Reilly Auto Parts 0.5% 95.7% 18 Royal Ahold 1.6% 68.5% 48 Kroger 0.5% 96.2% 19 Reckitt Benckiser 1.5% 70.0% 49 Sam's Club 0.5% 96.7% 20 Rockland Trust 1.5% 71.5% 50 St. Joseph's Mercy 0.5% 97.2% 21 Texas Instruments 1.5% 72.9% 51 Trader Joe's 0.4% 97.6% 22 Brown Shoe Co 1.4% 74.3% 52 Danfoss 0.4% 98.0% 23 Kum & Go 1.4% 75.6% 53 Chase Bank 0.3% 98.4% 24 Bojangles 1.3% 76.9% 54 Fifth Third Bank 0.3% 98.7% 25 Aaron's 1.3% 78.2% 55 National Tire & Battery 0.3% 98.9% 26 DaVita Dialysis 1.1% 79.3% 56 7-Eleven 0.2% 99.2% 27 Citigroup 1.1% 80.4% 57 Citizen's 0.2% 99.4% 28 Wal-Mart 1.1% 81.5% 58 BB&T 0.2% 99.5% 29 Renal Advantage Dialysis 1.1% 82.6% 59 QuikTrip 0.2% 99.7% 30 GE 1.0% 83.6% 60 Mrs Bairds 0.2% 99.9% 61 Provident Bank 0.1% 100.0% This slide show is for informational purposes only and is not an offer to buy or the solicitation of an offer to sell any shares.
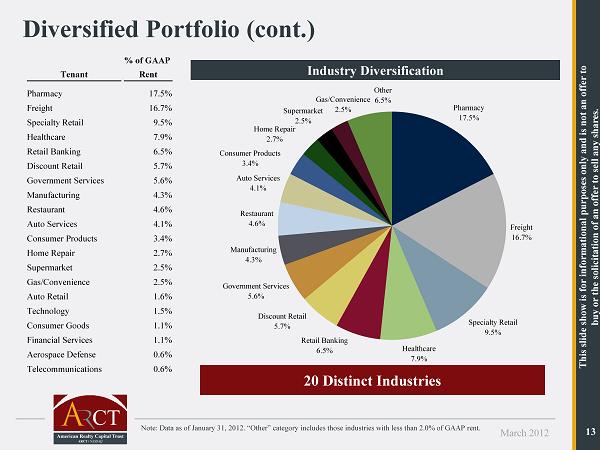
March 2012 13 Diversified Portfolio (cont.) Note: Data as of January 31, 2012. “Other” category includes those industries with less than 2.0% of GAAP rent. Tenant % of GAAP Rent Pharmacy 17.5% Freight 16.7% Specialty Retail 9.5% Healthcare 7.9% Retail Banking 6.5% Discount Retail 5.7% Government Services 5.6% Manufacturing 4.3% Restaurant 4.6% Auto Services 4.1% Consumer Products 3.4% Home Repair 2.7% Supermarket 2.5% Gas/Convenience 2.5% Auto Retail 1.6% Technology 1.5% Consumer Goods 1.1% Financial Services 1.1% Aerospace Defense 0.6% Telecommunications 0.6% Industry Diversification 20 Distinct Industries Pharmacy 17.5% Freight 16.7% Specialty Retail 9.5% Healthcare 7.9% Retail Banking 6.5% Discount Retail 5.7% Government Services 5.6% Manufacturing 4.3% Restaurant 4.6% Auto Services 4.1% Consumer Products 3.4% Home Repair 2.7% Supermarket 2.5% Other 6.5% Gas/Convenience 2.5% This slide show is for informational purposes only and is not an offer to buy or the solicitation of an offer to sell any shares.
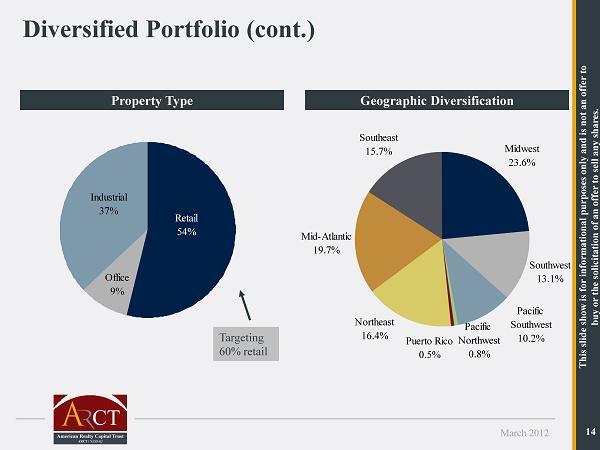
March 2012 14 Retail 54% Industrial 37% Office 9% Property Type Geographic Diversification Targeting 60% retail Diversified Portfolio (cont.) Midwest 23.6% Southwest 13.1% Pacific Southwest 10.2% Pacific Northwest 0.8% Puerto Rico 0.5% Northeast 16.4% Mid-Atlantic 19.7% Southeast 15.7% This slide show is for informational purposes only and is not an offer to buy or the solicitation of an offer to sell any shares.
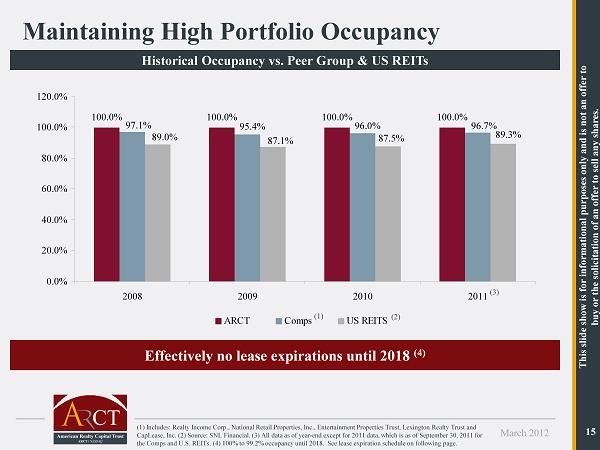
March 2012 15 Historical Occupancy vs. Peer Group & US REITs Maintaining High Portfolio Occupancy (1) Includes: Realty Income Corp., National Retail Properties, Inc., Entertainment Properties Trust, Lexington Realty Trust a nd CapLease, Inc. (2) Source: SNL Financial. (3) All data as of year - end except for 2011 data, which is as of September 30, 2011 fo r the Comps and U.S. REITs. (4) 100% to 99.2% occupancy until 2018. See lease expiration schedule on following page. Effectively no lease expirations until 2018 (4) 100.0% 100.0% 100.0% 100.0% 96.7%96.0% 95.4% 97.1% 89.0% 87.1% 89.3% 87.5% 0.0% 20.0% 40.0% 60.0% 80.0% 100.0% 120.0% 2008 2009 2010 2011 ARCT Comps US REITS (1) (2) (3) This slide show is for informational purposes only and is not an offer to buy or the solicitation of an offer to sell any shares.
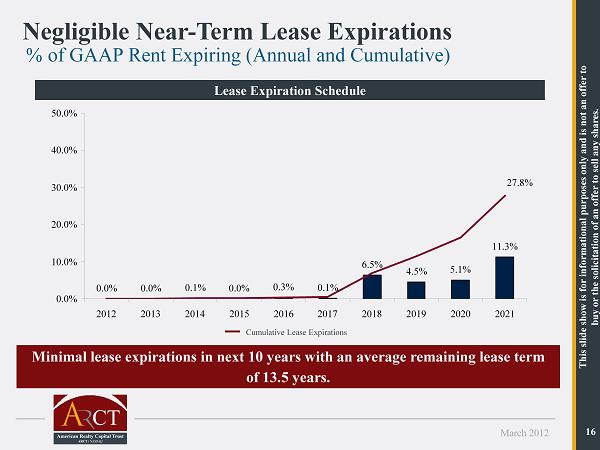
March 2012 16 Minimal lease expirations in next 10 years with an average remaining lease term of 13.5 years. % of GAAP Rent Expiring (Annual and Cumulative) Negligible Near - Term Lease Expirations Lease Expiration Schedule 0.0% 0.0% 0.1% 0.0% 0.3% 0.1% 6.5% 4.5% 5.1% 11.3% 27.8% 0.0% 10.0% 20.0% 30.0% 40.0% 50.0% 2012 2013 2014 2015 2016 2017 2018 2019 2020 2021 Cumulative Lease Expirations This slide show is for informational purposes only and is not an offer to buy or the solicitation of an offer to sell any shares.
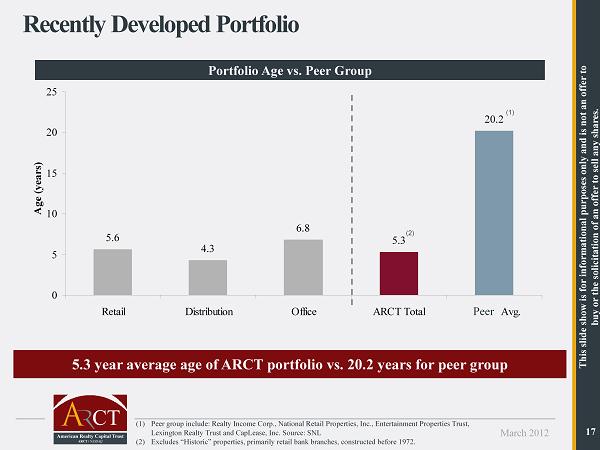
March 2012 17 5.6 4.3 6.8 5.3 20.2 0 5 10 15 20 25 Retail Distribution Office ARCT Total Comps Avg. Age (years) Recently Developed Portfolio (1) Peer group include : Realty Income Corp., National Retail Properties, Inc., Entertainment Properties Trust, Lexington Realty Trust and CapLease, Inc. Source: SNL (2) Excludes “Historic” properties, primarily retail bank branches, constructed before 1972. 5.3 year average age of ARCT portfolio vs. 20.2 years for peer group (1) (2) Portfolio Age vs. Peer Group Peer This slide show is for informational purposes only and is not an offer to buy or the solicitation of an offer to sell any shares.
March 2012 18 Overview of Recent Events High Quality Portfolio Conservative Capital Structure Proven, Focused Business Plan This slide show is for informational purposes only and is not an offer to buy or the solicitation of an offer to sell any shares.
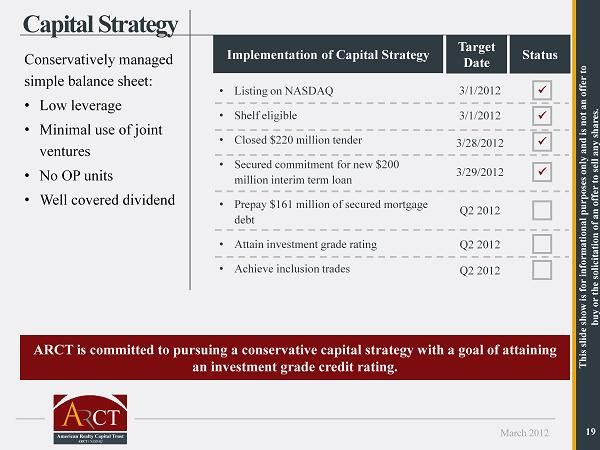
March 2012 19 Capital Strategy Conservatively managed simple balance sheet: • Low leverage • Minimal use of joint ventures • No OP units • Well covered dividend Implementation of Capital Strategy Status • Listing on NASDAQ • Shelf eligible • Closed $220 million tender • Secured commitment for new $200 million interim term loan • Prepay $ 161 million of secured mortgage debt • Attain investment grade rating • Achieve inclusion trades x x ARCT is committed to pursuing a conservative capital strategy with a goal of attaining an investment grade credit rating. Target Date 3/1/2012 3/1/2012 3/28/2012 3/29/2012 Q2 2012 Q2 2012 Q2 2012 x x This slide show is for informational purposes only and is not an offer to buy or the solicitation of an offer to sell any shares.
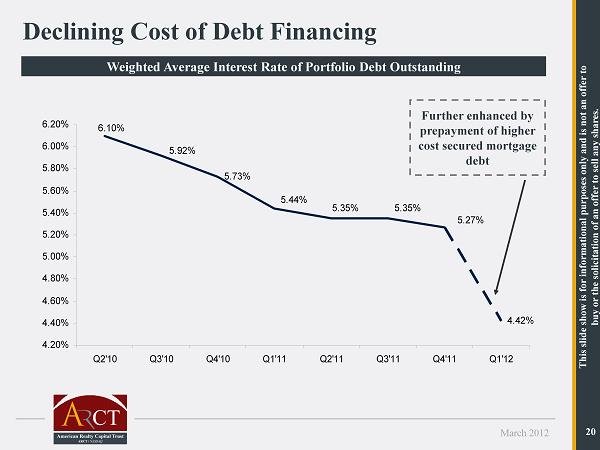
March 2012 20 5.73% 4.42% 5.27% 5.35%5.35% 5.44% 5.92% 6.10% 4.20% 4.40% 4.60% 4.80% 5.00% 5.20% 5.40% 5.60% 5.80% 6.00% 6.20% Q2'10 Q3'10 Q4'10 Q1'11 Q2'11 Q3'11 Q4'11 Q1'12 Weighted Average Interest Rate of Portfolio Debt Outstanding Declining Cost of Debt Financing Further enhanced by prepayment of higher cost secured mortgage debt This slide show is for informational purposes only and is not an offer to buy or the solicitation of an offer to sell any shares.
March 2012 21 Overview of Recent Events High Quality Portfolio Conservative Capital Structure Proven, Focused Business Plan This slide show is for informational purposes only and is not an offer to buy or the solicitation of an offer to sell any shares.
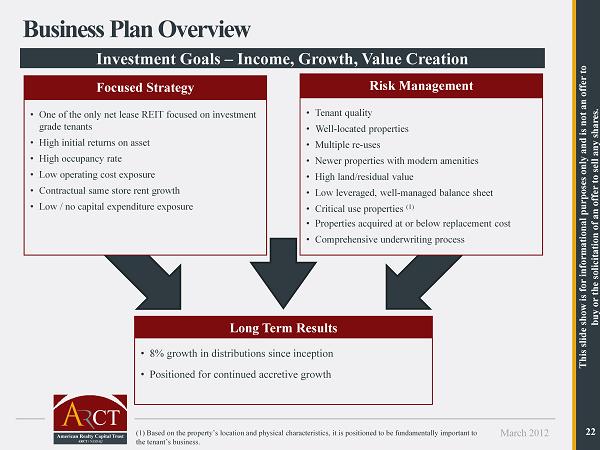
March 2012 22 Business Plan Overview Focused Strategy • One of the only net lease REIT focused on investment grade tenants • High initial returns on asset • High occupancy rate • Low operating cost exposure • Contractual same store rent growth • Low / no capital expenditure exposure Risk Management • Tenant quality • Well - located properties • Multiple re - uses • Newer properties with modern amenities • High land/residual value • Low leveraged, well - managed balance sheet • Critical use properties (1) • Properties acquired at or below replacement cost • Comprehensive underwriting process Long Term Results • 8% growth in distributions since inception • Positioned for continued accretive growth (1) Based on the property’s location and physical characteristics, it is positioned to be fundamentally important to the tenant’s business. Investment Goals – Income, Growth, Value Creation This slide show is for informational purposes only and is not an offer to buy or the solicitation of an offer to sell any shares.
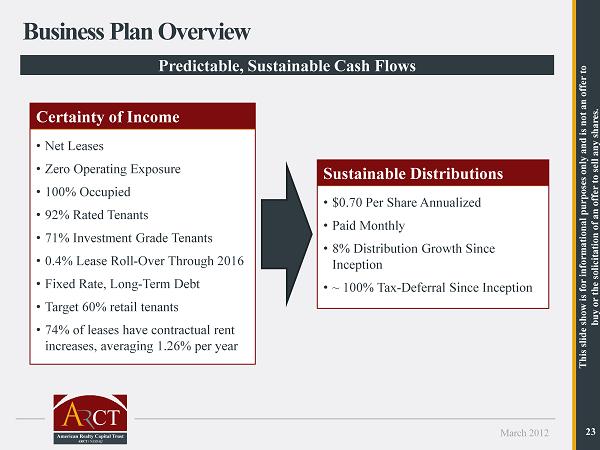
March 2012 23 Business Plan Overview Certainty of Income • Net Leases • Zero Operating Exposure • 100% Occupied • 92% Rated Tenants • 71% Investment Grade Tenants • 0.4% Lease Roll - Over Through 2016 • Fixed Rate, Long - Term Debt • Target 60% retail tenants • 74% of leases have contractual rent increases, averaging 1.26% per year Sustainable Distributions • $0.70 Per Share Annualized • Paid Monthly • 8% Distribution Growth Since Inception • ~ 100% Tax - Deferral Since Inception Predictable, Sustainable Cash Flows This slide show is for informational purposes only and is not an offer to buy or the solicitation of an offer to sell any shares.
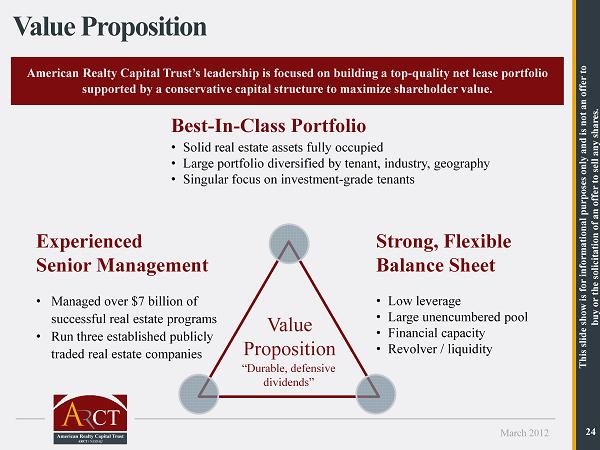
March 2012 24 • Managed over $7 billion of successful real estate programs • Run three established publicly traded real estate companies • Low leverage • Large unencumbered pool • Financial capacity • Revolver / liquidity Best - In - Class Portfolio • Solid real estate assets fully occupied • Large portfolio diversified by tenant, industry, geography • Singular focus on investment - grade tenants Value Proposition Value Proposition “Durable, defensive dividends” Strong, Flexible Balance Sheet Experienced Senior Management American Realty Capital Trust’s leadership is focused on building a top - quality net lease portfolio supported by a conservative capital structure to maximize shareholder value. This slide show is for informational purposes only and is not an offer to buy or the solicitation of an offer to sell any shares.
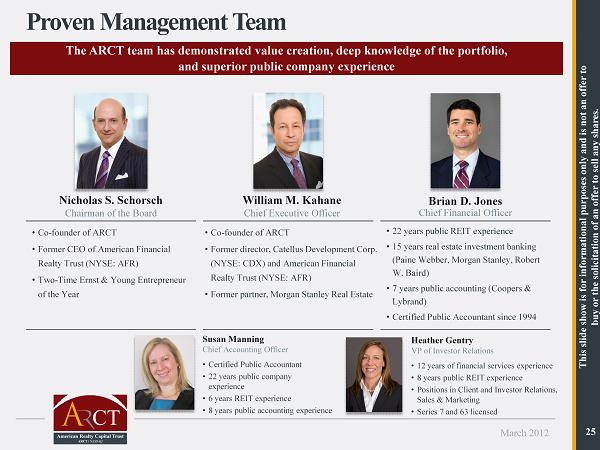
March 2012 25 Proven Management Team Nicholas S. Schorsch Chairman of the Board • Co - founder of ARCT • Former CEO of American Financial Realty Trust (NYSE: AFR) • Two - Time Ernst & Young Entrepreneur of the Year Brian D. Jones Chief Financial Officer • 22 years public REIT experience • 15 years real estate investment banking (Paine Webber, Morgan Stanley, Robert W. Baird) • 7 years public accounting (Coopers & Lybrand) • Certified Public Accountant since 1994 William M. Kahane Chief Executive Officer • Co - founder of ARCT • Former director, Catellus Development Corp. (NYSE: CDX) and American Financial Realty Trust (NYSE: AFR) • Former partner, Morgan Stanley Real Estate The ARCT team has demonstrated value creation, deep knowledge of the portfolio, and superior public company experience Susan Manning Chief Accounting Officer • Certified Public Accountant • 22 years public company experience • 6 years REIT experience • 8 years public accounting experience Heather Gentry VP of Investor Relations • 12 years of financial services experience • 8 years public REIT experience • Positions in Client and Investor Relations, Sales & Marketing • Series 7 and 63 licensed This slide show is for informational purposes only and is not an offer to buy or the solicitation of an offer to sell any shares.
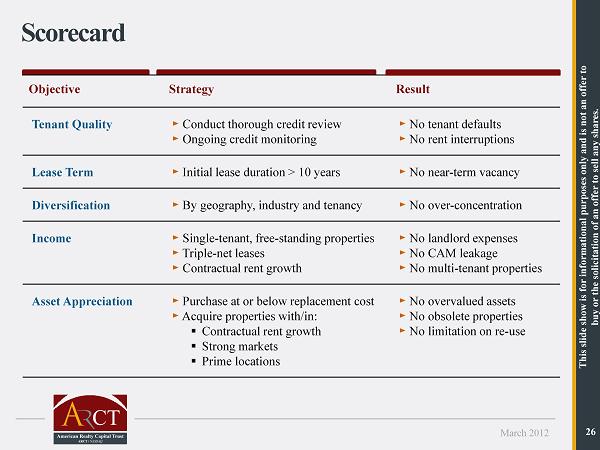
March 2012 26 Scorecard Objective Strategy Result Tenant Quality ► Conduct thorough credit review ► Ongoing credit monitoring ► No tenant defaults ► No rent interruptions Lease Term ► Initial lease duration > 10 years ► No near - term vacancy Diversification ► By geography, industry and tenancy ► No over - concentration Income ► Single - tenant, free - standing properties ► Triple - net leases ► Contractual rent growth ► No landlord expenses ► No CAM leakage ► No multi - tenant properties Asset Appreciation ► Purchase at or below replacement cost ► Acquire properties with/in: ▪ Contractual rent growth ▪ Strong markets ▪ Prime locations ► No overvalued assets ► No obsolete properties ► No limitation on re - use This slide show is for informational purposes only and is not an offer to buy or the solicitation of an offer to sell any shares.
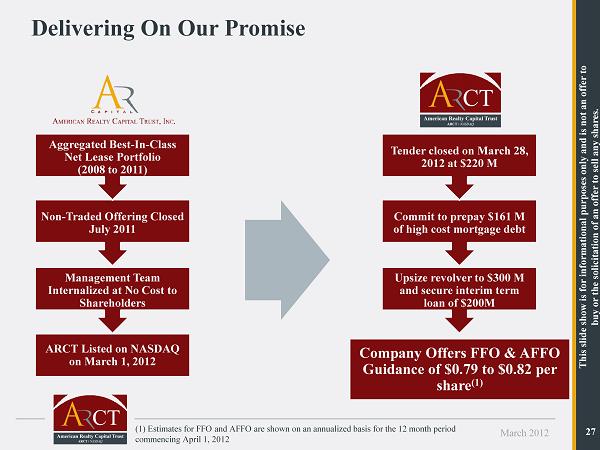
March 2012 27 ARCT Listed on NASDAQ on March 1, 2012 Non - Traded Offering Closed July 2011 Aggregated Best - In - Class Net Lease Portfolio (2008 to 2011) Delivering On Our Promise Management Team Internalized at No Cost to Shareholders Company Offers FFO & AFFO Guidance of $0.79 to $0.82 per share (1) Commit to prepay $161 M of high cost mortgage debt Tender closed on March 28, 2012 at $220 M Upsize revolver to $300 M and secure interim term loan of $200M This slide show is for informational purposes only and is not an offer to buy or the solicitation of an offer to sell any shares. (1) Estimates for FFO and AFFO are shown on an annualized basis for the 12 month period commencing April 1, 2012
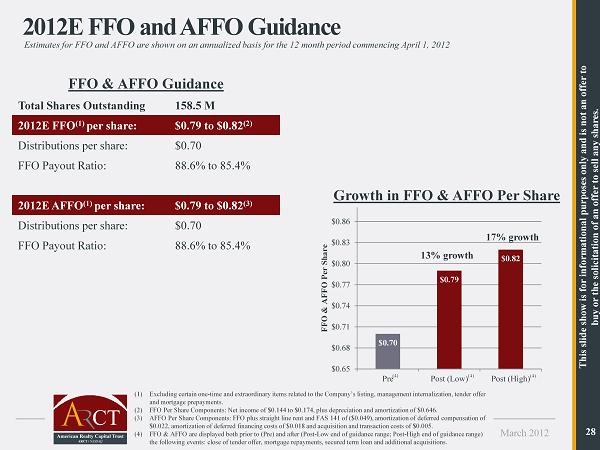
March 2012 28 (4) $0.70 $0.79 $0.82 $0.65 $0.68 $0.71 $0.74 $0.77 $0.80 $0.83 $0.86 Pre Post (Low) Post (High) FFO & AFFO Per Share 2012E FFO and AFFO Guidance (1) Excluding certain one - time and extraordinary items related to the Company’s listing, management internalization, tender offer and mortgage prepayments . (2) FFO Per Share Components: Net income of $ 0.144 to $0.174, plus depreciation and amortization of $0.646. (3) AFFO Per Share Components: FFO plus straight line rent and FAS 141 of ($0.049 ), amortization of deferred compensation of $0.022, amortization of deferred financing costs of $0.018 and acquisition and transaction costs of $0.005. (4) FFO & AFFO are displayed both prior to (Pre) and after (Post - Low end of guidance range; Post - High end of guidance range) the following events: close of tender offer, mortgage repayments, secured term loan and additional acquisitions. 17% growth 13% growth This slide show is for informational purposes only and is not an offer to buy or the solicitation of an offer to sell any shares. FFO & AFFO Guidance Total Shares Outstanding 158.5 M 2012E FFO (1) per share: $0.79 to $0.82 (2) Distributions per share: $0.70 FFO Payout Ratio: 88.6% to 85.4% 2012E AFFO (1) per share: $0.79 to $0.82 (3) Distributions per share: $0.70 FFO Payout Ratio: 88.6% to 85.4% Growth in FFO & AFFO Per Share (4) (4) Estimates for FFO and AFFO are shown on an annualized basis for the 12 month period commencing April 1, 2012
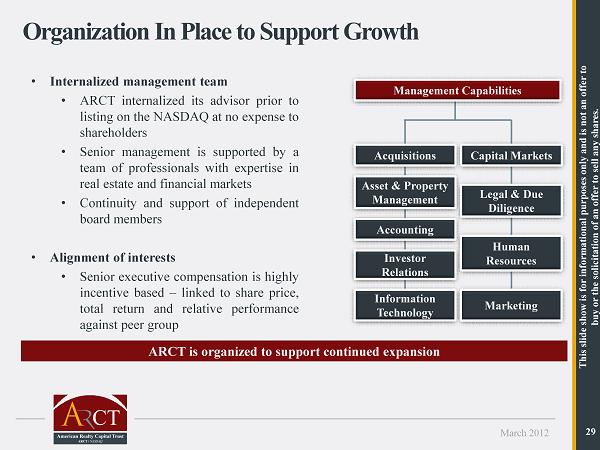
March 2012 29 Organization In Place to Support Growth • Internalized management team • ARCT internalized its advisor prior to listing on the NASDAQ at no expense to shareholders • Senior management is supported by a team of professionals with expertise in real estate and financial markets • Continuity and support of independent board members • Alignment of interests • Senior executive compensation is highly incentive based – linked to share price, total return and relative performance against peer group Acquisitions Capital Markets Accounting Investor Relations Information Technology Legal & Due Diligence Human Resources Marketing Asset & Property Management Management Capabilities ARCT is organized to support continued expansion This slide show is for informational purposes only and is not an offer to buy or the solicitation of an offer to sell any shares.