Attached files
| file | filename |
|---|---|
| EXCEL - IDEA: XBRL DOCUMENT - Planet Green Holdings Corp. | Financial_Report.xls |
| EX-21 - EXHIBIT 21 - Planet Green Holdings Corp. | exhibit21.htm |
| EX-32.2 - EXHIBIT 32.2 - Planet Green Holdings Corp. | exhibit32-2.htm |
| EX-31.2 - EXHIBIT 31.2 - Planet Green Holdings Corp. | exhibit31-2.htm |
| EX-31.1 - EXHIBIT 31.1 - Planet Green Holdings Corp. | exhibit31-1.htm |
| EX-23.1 - EXHIBIT 23.1 - Planet Green Holdings Corp. | exhibit23-1.htm |
| EX-32.1 - EXHIBIT 32.1 - Planet Green Holdings Corp. | exhibit32-1.htm |
UNITED STATES
SECURITIES AND EXCHANGE COMMISSION
Washington,
D.C. 20549
FORM 10-K
[X] ANNUAL REPORT PURSUANT TO SECTION 13 OR 15(d) OF THE SECURITIES EXCHANGE ACT OF 1934
For the fiscal year ended: December 31, 2011
[_] TRANSITION REPORT PURSUANT TO SECTION 13 or 15(d) OF THE SECURITIES EXCHANGE ACT OF 1934
For the transition period from __________ to ____________
Commission File Number: 000-50883
AMERICAN LORAIN CORPORATION
(Exact name of registrant as specified in its charter)
| Nevada | 87-0430320 |
| (State or other jurisdiction of incorporation or organization) |
(I.R.S. Employer Identification Number) |
Beihuan Zhong Road
Junan County
Shandong,
People’s Republic of China, 276600
(Address of principal executive
office and zip code)
(86) 539-7318818
(Registrant’s telephone
number, including area code)
Securities registered pursuant to Section 12(b) of the Act:
| Title of each class | Name of each exchange on which registered |
| Common Stock, par value $0.001 per share | NYSE AMEX |
Securities registered pursuant to Section 12(g) of the Act: None
Indicate by check mark if the registrant is a well-known seasoned issuer, as defined in Rule 405 of the Securities Act.
Yes [_] No [X]
Indicate by check mark if the registrant is not required to file reports pursuant to Section 13 or Section 15(d) of the Act.
Yes [_] No [X]
Indicate by check mark whether the registrant (1) has filed all reports required to be filed by Section 13 or 15(d) of the Securities Exchange Act of 1934 during the preceding 12 months (or for such shorter period that the registrant was required to file such reports), and (2) has been subject to such filing requirements for the past 90 days.
Yes [X] No [_]
Indicate by check mark whether the registrant has submitted electronically and posted on its corporate Website, if any, every Interactive Data File required to be submitted and posted pursuant to Rule 405 of Regulation S-T (§232.405 of this chapter) during the preceding 12 months (or for such shorter period that the registrant was required to submit and post such file).
Yes [_] No [_]
Indicate by check mark if disclosure of delinquent filers pursuant to Item 405 of Regulation S-K is not contained herein, and will not be contained, to the best of registrant’ s knowledge, in definitive proxy or information statements incorporated by reference in Part III of this Form 10-K or any amendment to this Form 10-K.
Indicate by check mark whether the registrant is a large accelerated filer, an accelerated filer, a non-accelerated filer, or a smaller reporting company. See the definitions of “large accelerated filer,” “accelerated filer” and “smaller reporting company” in Rule 12b-2 of the Exchange Act. (Check one):
| Large accelerated filer [_] | Accelerated filer [_] | Non-accelerated filer [_] | Smaller reporting company [X] |
Indicate by check mark whether the registrant is a shell company (as defined in Rule 12b-2 of the Act).
Yes [_] No [X]
The number of shares and aggregate market value of common stock held by non-affiliates as of the last business day of the registrant’s most recently completed second fiscal quarter were 18,351,383 and $28,261,130, respectively.
There were 34,507,874 shares of common stock outstanding as of March 29, 2012.
- 2 -
PART I
Item 1. BUSINESS
Conventions
In this annual report on Form 10-K:
- “We,” “us” and “our” refer to the combined business of ALN, ILH and their direct and indirect Chinese operating subsidiaries.
- “ALN” refers to American Lorain Corporation, a Nevada corporation (formerly known as Millennium Quest, Inc.).
- “ILH” refers to International Lorain Holding, Inc., a Cayman Islands company that is wholly - owned by ALN.
- “Junan Hongrun” refers to Junan Hongrun Foodstuff Co., Ltd.
- “Luotian Lorain” refers to Luotian Green Foodstuff Co., Ltd.
- “Beijing Lorain” refers to Beijing Green Foodstuff Co., Ltd.
- “Shandong Lorain” refers to Shandong Green Foodstuff Co., Ltd.
- “Dongguan Lorain” refers to Dongguan Green Foodstuff Co., Ltd.
- “Shandong Greenpia” refers to Shandong Greenpia Foodstuff Co., Ltd.
- “RMB” refers to Renminbi, the legal currency of China.
- “U.S. dollar,” “$” and “US$” refer to the legal currency of the United States.
- “China” and “PRC” refer to the People’s Republic of China.
Overview of Our Business
We are an integrated food manufacturing company headquartered in Shandong Province, China. We develop, manufacture and sell the following types of food products:
- chestnut products,
- convenience foods (including ready-to-cook, or RTC, foods, ready-to-eat, or RTE, foods and meals ready-to-eat, or MRE); and
- frozen food products.
We conduct our production activities in China. Our products are sold in 26 provinces and administrative regions in China and 42 foreign countries. We derive most of our revenues from sales in China, Japan and South Korea. In 2012, our primary strategy was to continue building our brand recognition in China through consistent marketing efforts towards supermarkets, wholesalers, and significant customers, enhancing the cooperation with other manufacturers and factories and enhancing the turnover for our exsting chestnut, convenience and frozen food products. In addition, we are working to expand our marketing efforts in Asia, Europe, the Middle East and North America. We currently have limited sales and marketing activity in the United States, although our long-term plan is to significantly expand our activities there.
Organizational Structure
ALN is a Nevada corporation that was incorporated on February 4, 1986 and was formerly known as Millennium Quest, Inc. Prior to May 3, 2007, when ALN completed a recapitalization, or reverse merger, with ILH, ALN did not engage in active business operations other than to search for a potential acquisition target. Effective November 16, 2009, ALN reincorporated in Nevada from Delaware.
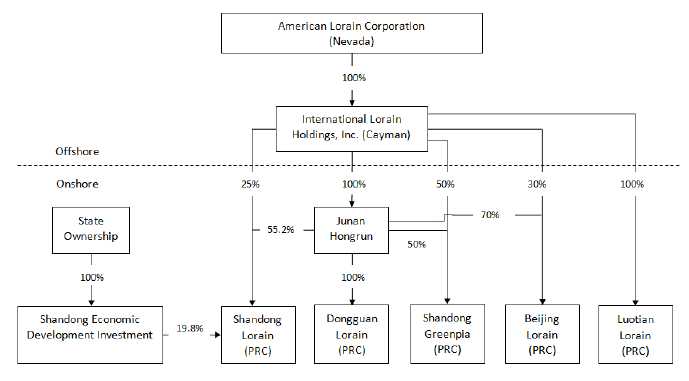
ALN owns 100% of ILH. ILH wholly owns two Chinese operating subsidiaries, Luotian Lorain and Junan Hongrun, directly. Junan Hongrun, in turn, wholly owns Dongguan Lorain. In addition, together with Junan Hongrun, ILH wholly owns Beijing Lorain, Shandong Greenpia, and owns approximately 80% of Shandong Lorain (Shandong Economic Development Investment Co. Ltd. owns approximately 20%). We sometimes refer to our six Chinese operating subsidiaries throughout this annual report on Form 10-K as the Lorain Group Companies. Below is an organizational chart of ALN, ILH and the Lorain Group Companies:
- 3 -
Products
Our products are categorized into the following three segments:
- chestnut products,
- convenience food products, and
- frozen food products.
We produced 254 products in 2011, including 16 new products in our chestnut and convenience foods segment. We also discontinued 3 products in 2011 in the convenience segment due to slow sales.
Our chestnut products and convenience foods were our main profit centers in 2011. Our convenience foods segment has been the fastest growing portion of our business and was one of the main catalysts of our growth during 2011. Frozen food products accounted for a smaller portion of our revenues in 2011 as compared with 2010 because we have been more focused on generating revenues from higher margin chestnut and convenience food products.
Chestnut Products
We believe that we are the largest chestnut processor and manufacturer in China. We have developed brand equity for our chestnut products in China, Japan and South Korea over the past 10 to 15 years. We produced 57 high value-added processed chestnut products in 2011. In 2011 and 2010, this segment contributed 51.7% and 54.9% of our total revenues, respectively.
Our best selling products in 2011 included our aerated open-bottom chestnuts, which are chestnuts packaged with nitrogen; sweetheart chestnuts, which are sweet preserved chestnuts; chestnuts in syrup, which are very popular in Japan and South Korea; and golden chestnut kernels. The majority of our chestnut products are natural and do not contain chemical additives.
The chestnut, in contrast to many other tree nuts, contains small quantities of oil and is very high in complex carbohydrates. This makes them useful for a wider food range than other common nuts. Chestnuts are commonly steamed, boiled, sugar stir-fried, roasted or added into dishes or desserts as an ingredient.
- 4 -
China is the largest grower of chestnuts in the world, followed by South Korea and Japan. In recent years, the chestnut production in South Korea and Japan has declined. This has been attributed to the increasing labor costs and operational costs incurred in growing chestnuts. Because of the declining domestic production, South Korean and Japanese customers have grown to rely more on imported chestnut products. Our strategy is to take advantage of these trends.
We differentiate our chestnut products based on flavor, size and method of packaging. For instance, some of our chestnut products that are sold in Japan are packaged in plastic bags or tin cans, each considered a different product. Similarly, some of our chestnut products are processed with hot water or cold water, each considered a different product.
Chestnut season in China lasts from September to January. We purchase and produce raw chestnuts during these months and store them in our refrigerated storage facilities throughout the year. Once we obtain a purchase order during the rest of the year, we remove the chestnuts from storage, process them and ship them within one day of production.
Convenience Foods
Our convenience food products are characterized as follows:
- Ready-to-cook, or RTC, food products,
- Ready-to-eat, or RTE, food products and
- Meals ready-to-eat, or MRE, food products.
These products are intended to meet the current demands of our customers for safe, wholesome and tasty foods that are easily prepared.
RTCs can be served after a few easy cooking procedures. Typically, when preparing a RTC, customers need only to heat the food in a microwave or boil it for several minutes before eating. Our best selling RTCs in 2011 were beef and lamb products.
RTEs can be served without any cooking. Our best selling RTEs in 2011 were various bean products and pickle products.
MREs are meal kits with self-heating devices or microwavable kits, such as microwavable rice boxes. Our self heating MREs are primarily for military use since no cooking device or other ingredients are needed other than water. We also introduced microwavable MREs for civilian uses such as camping, traveling and other situations since only simple preparation and a cooking device such as a microwave oven is required.
We produce various MREs based on Chinese cuisine, the best sellers of which were our pork with garlic sauce over rice and kungpao chicken with rice in 2011. Other MREs are based on other styles of food, such as Italian cuisine. Many of our convenience products are natural and do not contain chemical additives.
We produced 138 convenience food products in 2011, including 14 new products such as filled buns and fried sweet potato. In 2011 and 2010, this segment contributed 34.2% and 30.8%, respectively, of our total revenues.
Our convenience foods segment has been the fastest growing portion of our business and was one of the main catalysts of our growth during 2011. We expect our convenience foods segment to continue to be an important area of growth for our business in the future.
Frozen Food Products
We produce a variety of frozen foods, including frozen vegetables, frozen fruits, frozen fish, and frozen meats. We produced 63 frozen food products in 2011. Our best selling frozen foods in 2011 were frozen asparagus and frozen corn.
Our frozen food business allows us to mitigate the significant production seasonality of chestnut products and to increase the utilization rate of our production capacity. Historically, our frozen food division has been a significant portion of our business. We continue to see steady increase in sales of our frozen food segment, but with the fast increase in sales of our convenience food products, the percentage weight frozen foods accounted for in our total revenue decreased from 14.3% in 2010 to 14.1% in 2011. Gross margins in this segment are lower than the margins for chestnut products and convenience foods.
Our Manufacturing Facilities
General
- 5 -
We currently manufacture our products in six facilities in China, three of which are located in Junan County, Shandong Province, one in Luotian County, Hubei Province, one in Miyun County, Beijing City and one leased facility in Dongguan, Guandong Province. The following table indicates the year that operations commenced at each of the facilities and the size of the facilities
| Year Operations | Facility Size | |
| Facility | Commenced | (square meters) |
| Junan Hongrun | 2002 | 38,865 |
| Shandong Lorain | 1995 | 15,392 |
| Beijing Lorain | 2003 | 21,000 |
| Luotian Lorain | 2003 | 9,558 |
| Dongguan | 2008 | 9,250 |
| Shandong Greenpia | 2010 | 9,179 |
Production Lines
We currently manufacture our products using 26 production lines. Each production line is used to produce between 10 and 50 products. We currently run three types of product lines:
- deep-freezing lines, which are used to freeze raw materials for year-round production and to produce frozen food;
- canning lines, which are used to produce canned products, including chestnut products; and
- convenience food lines, which are used for producing RTCs, RTEs and MREs, all of which have nitrogen preservation capacity.
The production process for our chestnut products initially involves sorting and cleaning the raw chestnuts purchased during the chestnut season. We then store the raw chestnuts in our refrigerated storage facilities throughout the year. Once we obtain a purchase order, we remove the chestnuts from storage and process them by steaming, decladding and deep-freezing the chestnuts, depending on the particular product. We then package and ship the processed chestnuts within one day of production.
The production process of our convenience products generally involves various steps, including soaking, boiling, coating, drying, deep freezing, packing, sealing and sterilizing.
The following table shows the number and types of production lines, the types of products produced and the production capacity at each facility:
| Facilities | Production Lines | Product Portfolio | 2011 Capacity |
| Junan Hongrun | 1 Deep-freezing line 3 Convenience food lines 4 Canning lines |
Chestnut products, frozen foods, beans, bean paste |
Multi-purpose production lines with 44,000 tons of production capacity and 11,400 tons of cold and frozen storage |
| Shandong Lorain | 1 Deep-freezing line 1 Convenience food line |
Chestnut products, convenience foods, frozen foods |
Multi-purpose production lines with 20,000 tons of production capacity and 3,500 tons of cold and frozen storage |
| Beijing Lorain | 6 Convenience food lines 1 Deep-freezing line |
Chestnut products, frozen foods |
Multi-purpose production lines with 34,000 tons of production capacity and 4,650 tons of cold and frozen storage |
| Luotian Lorain | 3 Convenience food lines 2 Deep-freezing lines |
Chestnut products, convenience foods, frozen foods |
Multi-purpose production lines with 24,000 tons of production capacity and 6,500 tons of cold and frozen storage |
| Dongguan factory | 2 Convenience food lines |
Convenience food |
Multi-purpose production lines with 3,000 tons of production capacity and 2,250 tons of cold and frozen storage |
| Shandong Greenpia | 2 Convenience food lines | Chestnut products, convenience foods | Multi-purpose production lines with 9,000 tons of production capacity and 1,500 tons of cold and frozen storage |
- 6 -
We allocate our production lines based upon the location of our facilities to take advantage of efficiencies in the transportation of required raw materials. For example, Junan Hongrun and Shandong Lorain, which manufacture primarily chestnut and frozen products, are located in Shandong Province, which is China’s largest supplier of fresh products by volume. Shandong Province is also a major chestnut producing region.
Our production lines and facilities have all been designed to meet the standards and requirements of our largest customers in Japan and Europe, with Japan being our largest export market. We employ advanced methods of quality control and have obtained various certifications for many of our products, packages and processes, including ISO 9000 or ISO 9001 certification for certain of our chestnut and frozen vegetable products, BRC certification for certain of our frozen fruit and vegetable products and HACCP certification for certain of our frozen vegetable, fruit and chestnut products and our bottom-open chestnuts. We believe that our quality controls and standards of products distinguish our products both in domestic and international markets. The import approvals that we have obtained from the Japanese government for our chestnuts and other convenience foods have been helpful in advocating with the Chinese government for domestic approvals to increase our product offerings.
With limited exception, we operate our production lines year round. In the past, when our production was focused almost exclusively on chestnuts, we experienced seasonal underutilization of our product lines. However, our current facilities have multiple-function designs allowing us to use our production lines for our convenience and frozen products when we are not producing chestnuts at full capacity. Consequently, as we have increased our processed and convenience food offerings over the last several years, we have generally been able to run our production lines at increasing efficiency.
Previously, most of our processed and convenience foods were produced at our Beijing Lorain plant. With the introduction of bean products in 2009, we expanded our facility in Junan Hongrun with the addition of three convenience food production lines designed specifically for bean products with current annual capacity of 13,500 metric tons.
We believe our facilities are adequate for our current levels of production. We anticipate, however, that we may require additional facilities and/or product lines as our business grows. We are exploring the possibility of alliances with one or more OEM partners for the production, in the short-term, of some of our convenience food products and frozen products should our facilities be inadequate to meet increasing demand. We are also exploring the possibility of leasing additional production lines to expand our production capacity. In 2008, we leased two convenience foods production lines in Dongguan, Guangdong Province, which increased production capacity by approximately 3,000 metric tons per year to meet our short-term needs. We did not lease any production facility during 2011. Given the relatively low cost to lease, we may decide to lease additional facilities in 2012, should circumstances require. In the long-term, we plan to increase our own production capacity by acquiring or building new facilities, subject to the availability of adequate sources of funding.
Storage Capacity
Storage of our raw materials and inventory is a critical element of our business. Our raw materials and partially finished products need to be preserved in frozen storages (-18ºC to -20ºC) or constant temperature storages (-5ºC to 5ºC). Storage is particularly critical for our chestnut products because chestnuts are a seasonal fruit.
The following table illustrates on a facility by facility basis the type and capacity of our storage resources:
| Facility | Storage Type | Number of | Capacity |
| Storage Units | (metric tons) | ||
| Junan Hongrun | Frozen Storage | 19 | 20,100 |
| Constant Temperature | 8 | 4,800 | |
| Shandong Lorain | Frozen Storage | 5 | 2,000 |
| Constant Temperature | 3 | 1,500 | |
| Luotian Lorain | Frozen Storage | 8 | 4,500 |
| Constant Temperature | 4 | 2,000 | |
| Beijing Lorain | Frozen Storage | 6 | 2,850 |
| Constant Temperature | 3 | 1,800 | |
| Dongguan | Frozen Storage | 2 | 800 |
| Constant Temperature | 2 | 1,450 | |
| Shandong Greenpia | Constant Temperature | 4 | 1,500 |
| TOTAL | 64 | 43,300 |
- 7 -
As we have expanded our production capacity, we have also expanded our storage capacity. All of the listed storage facilities are owned by us. In 2009, we expanded our storage capacity in Junan Hongrun by an additional 3,600 metric tons. In 2010, we also expanded storage facility in Dongguan by 1,000 metric tons and, through our acquisition of Shandong Greenpia, we have added four additional storage units with an aggregate capacity of 1,500 metric tons. We also added 13,500 metric tons of cold storage at the Junan Hongrun facility during 2011. We may also lease additional storage facilities from time to time should circumstance require.
Agricultural Operations
We grow or set up agricultural co-ops with local farmers to supply ourselves with a small portion of chestnut, fruit and vegetable products. For the year ended December 31, 2010 and 2011, the supplies coming from agricultural operations have been immaterial. We believe, however, that development of agricultural facilities is a good strategy for the long-term. We anticipate that self grown agricultural products and agricultural products grown in cooperation with local farmers will enable us to assure adequacy of supply, promote quality and reduce cost, particularly for our high margin offerings. For example, by growing Korean cultivar chestnuts domestically, we expect to significantly reduce our supply costs for this premium product, while ensuring superior quality.
Lands in which we grow our agricultural products for such products are shown in the following table.
| Area | Location | |
| Harvest | (acres) | (PRC) |
| Chestnut (South Korean, Japanese, Australian cultivar) | 329 | Shandong |
| Chestnut (Japanese cultivar) | 165 | Beijing |
| Sticky Corn | 342 | Beijing |
| Sweet Corn | 118 | Beijing |
| Green Pea | 217 | Beijing |
| Sweet Pea | 167 | Beijing |
| Organic Chestnut | 165 | Beijing |
| Mixed Vegetables | 417 | Shandong |
| Mixed Vegetables | 83 | Beijing |
| Japanese Pumpkin | 197 | Inner Mongolia |
| Black Beans | 500 | Shandong |
| Strawberry | 392 | Shandong |
| Broccoli | 165 | Beijing |
| Green Asparagus | 591 | Beijing |
| White Asparagus | 263 | Shandong |
| Sweet Potato | 500 | Shandong |
| Peach | 329 | Beijing |
| Apricot | 411 | Beijing |
| Pear | 329 | Beijing |
| Blackberry | 165 | Beijing |
We began growing chestnuts in Shandong Province in 2003. Unlike most vegetables and fruits, chestnut trees have a 3-5 year growing phase before they can be harvested. Our current chestnut planting base has been self-supplying limited quantities of chestnuts to our production since 2007.
We began growing strawberries in 2008 in Shandong and peaches, apricots, pears and blackberries in 2009 in Beijing. We use these fruits in some of our frozen fruit products. We plan to continue to expand our agricultural operations over the next few years. Among other things, we plan to increase our self-production in China of Korean cultivar chestnuts. We expect to obtain funding for this expansion through a combination of commercial and government loans, including loans under Chinese government programs to promote agricultural industrialization. There is no assurance, however, that adequate funding for these purposes will be available to us.
Raw Materials
In 2011 and 2010, approximately 88% and 93% of our procured raw materials, respectively, consisted of agricultural products, including primarily chestnuts and vegetables, approximately 7% and 4%, respectively, consisted of packaging materials and approximately 5% and 3% consisted of condiments such as sugar, salt and flour.
- 8 -
Our Supply Sources
Our business depends on obtaining a reliable supply of various agricultural products, including chestnuts, vegetables, red meat, fish, eggs, rice and flour. Because of the diversity of available sources of these raw materials, we believe that our raw materials are currently in adequate supply and will continue to be so in the future.
We obtain our agricultural raw materials from three sources: domestic procurement (excluding self-supply), overseas markets, and self-supply. Domestic and overseas procurement accounted 98.4% and 1.4%, respectively, of our total raw material costs in 2011, with self-supply accounted for less than 1%. We obtained substantially all of our agricultural raw materials from domestic sources during 2011.
In 2011 and 2010, respectively, we procured approximately 64,851 and 55,200 metric tons of chestnuts and approximately 54,827 and 44,500 metric tons of vegetables and other raw materials from a number of third party suppliers, domestic and overseas, and produced approximately 258 and 60 metric tons of chestnuts from our own agricultural operations.
We select suppliers based on price and product quality. We typically rely on numerous domestic and international suppliers, including some with whom we have a long-term relationship. Our top 10 suppliers accounted for 17.9% and 17.4%, respectively, of the total procurement in 2011 and 2010 in value terms. We purchase from suppliers and farmers pursuant to supply contracts and underlying purchase orders. We have not entered into any long-term contracts with any of our suppliers.
Our suppliers generally include wholesale agricultural product companies, agricultural associations and distributors. Some raw materials must be imported at higher costs, however. Occasionally, we also work directly with farmers. For instance, we operate an initiative which involves a series of cooperation and lease agreements between Shandong Lorain, Beijing Lorain and local farmers. This initiative involves approximately 1,000 acres of land which is used primarily to produce Japanese and Korean style chestnuts, sticky corn and pumpkins for our operations.
Procurement Cost and Quality Control
To control procurement costs, we have located our facilities near domestic sources of agricultural raw materials. For example, Junan Hongrun and Shandong Lorain are located in Shandong Province, which is China’s largest supplier of fresh products by volume. Shandong Province is also a major chestnut producing region. Local procurement reduces our costs, especially transportation costs. It also gives us first-hand harvest and market information, which provides us with an advantage in price negotiations with suppliers.
Some raw materials must be imported at higher cost. As discussed, we have begun to develop our agricultural capabilities in order to control costs, particularly with respect to imported raw materials such as Korean-style chestnuts.
Pricing for agricultural products reflects several external factors, such as weather conditions and commodity market fluctuations, which are beyond our control. We obtain contemporaneous information on local harvests and collect daily reported price information on harvests in other markets from which we procure our products. We also attempt to predict harvest yields in advance based on our information gathering. We use this harvest information to negotiate best pricing with our suppliers.
We impose strict standards on our suppliers. During the harvest season, our internal procurement function may visit our sources of supply to assure that the products we are purchasing comply with our standards.
Our Customers
We sell our products in 26 provinces and administrative regions in China and 42 foreign countries globally. In 2011 and 2010, approximately 73.7 and 73.3%, respectively, of our sales were made domestically and approximately 26.3% and 26.7%, respectively, were to international customers, primarily Japan and South Korea.
Our top ten customers contributed 15.5% and 20.5% of our total revenues in 2011 and 2010. Approximately 5.3% in 2010 and 11.2% in 2011 of our total sales were attributable to revenues from Shandong Lvan Import & Export Co., Ltd., a food trading company in China.
Domestic
In China, we sell our products through our own sales team and through third-party distributors. We have 36 sales offices in 21 provinces in China. In 2011 and 2010, we sold approximately 88% and 89%, respectively, of our products directly to our Chinese customers and approximately 12% and 11% through third-party distributors.
- 9 -
We sell our products in all first-tier cities in China, including Beijing, Shanghai, Tianjin and Guangzhou, through our own sales efforts in order to capture the profit margin that would otherwise go to intermediate wholesalers and to enhance our brand recognition. Our sales team sells our products directly to supermarket chains, mass merchandisers, large wholesalers and others in these markets. In second-tier and third-tier cities, we currently sell our products to third-party distributors, such as food companies or trading companies with established distribution channels in such regions, rather than through our own sales team, in order to enable us to penetrate such markets more quickly without spending significant capital. We also sell to small customers through independent sales representatives.
Generally, our direct sales customers are required to pay us on 30 to 60 day credit terms. Third-party distributors, however, generally do not pay on credit, allowing us to obtain quicker payment terms and thereby decrease our accounts receivables.
The terms of a typical sales contract between us and our distributors provide that we are responsible for transportation costs and the distributors are responsible for storage costs. Furthermore, the distributors have the right to return products that fail to satisfy specified quality standards, at our cost. The majority of such contracts require the distributors to pay us in cash in full upon delivery, and the remaining contracts provide for short-term credit, usually two to three weeks. In addition, we typically offer distributors performance-based incentives, such as a cash bonus equal to 1% of total revenues generated by such distributor which exceed previously established sales targets.
We plan to gradually increase the portion of sales to third party distributors in order to access new markets in China in a cost effective manner and to improve our cash position. Such plans are subject to our ability to restructure the sales force and manage the increased number of distributors without compromising our profit margins.
International
Our export sales destinations include:
- Asia pacific, primarily Japan, South Korea and Malaysia, but also Singapore, Philippines, Indonesia and Australia;
- Europe, primarily Belgium and the United Kingdom, but also France, Germany, the Netherlands, Spain, Poland, and Denmark
- the Middle East, primarily Saudi Arabia, Kuwait and Israel;
- North America, including the United States and Canada
We generate most of our sales in Asia. In 2011 and 2010, respectively, approximately 93.8% and 92.7% of our international sales were in Asia and approximately 5.7% and 5.3% were in Europe.
We sell our products to international markets primarily through export and trading agents and companies in China, as well as our own sales team located in China. Our sales team sells directly to wholesalers, food processors and mass merchandisers. Many of our customers are well known in their local food market. We have established long-term relationships with many international customers, especially in Japan and South Korea. We currently have no sales offices outside of China and do not use alternative methods to sell our products outside of China. We attend trade shows in Europe and other international markets in order to promote our products.
In March 2011, the northern region of Japan experienced a severe earthquake followed by a tsunami. These geological events caused significant damage in that region and have adversely affected Japan's infrastructure and economy. However, the crisis did not harm our export sales to Japan because most of our products are distributed to Tokyo, Osaka, Nagoya, Kobe and Kyoto, which did not suffer direct damages in the earthquake or the tsunami. Japan accounted for 13.0% and 10.7% of our total revenue for the years ended December 31, 2011 and 2010, respectively.
Our Sales and Marketing Efforts
We seek to expand our customer base by:
- direct sales communications with our large customers;
- sales through distributors to new customer bases;
- referrals from existing customers; and
- participation in domestic and international food exhibitions and trade conferences.
We have not spent a significant amount of capital on advertising in the past, and our advertising budget continues to be limited. In 2011 our marketing and branding efforts included supermarket advertising, and internet advertising. We intend to increase our advertising and branding efforts given the consumer nature for many of our products. For the near future, our marketing efforts will continue to focus primarily on the domestic Chinese market for our chestnut and convenience food products.
Competition and Market Position
- 10 -
The overall food market is diverse, both globally and in China. We do not have a significant market share in any of our business segments.
Chestnut Products
We compete in the chestnut market primarily on the basis of the uniqueness of our products, quality, price and brand recognition. We also utilize our proprietary, patented and patent-pending technology in the production of our chestnut products to our competitive advantage.
The world market for chestnut products is highly fragmented. Our principal competitors in the chestnut product market are currently Hebei Liyuan, a Chinese company, and Foodwell Corporation, a South Korean company.
Convenience Food Products
Convenience food products market competition is based mostly upon quality and product variety. We attempt to use our modern food processing technology, such as nitrogen preservation, to produce a wide variety of high quality convenience foods.
The convenience food market in China is highly fragmented and we do not face competitive pressure from any particular competitor or small group of competitors.
Frozen Food Products
In the frozen food product market, competition is based primarily upon quality, ability to provide a reliable product supply and customer relationships.
Our strongest competitors in the frozen food products market are currently Weifang Langdong Food Co. Ltd., Yuyao Hongji Food Co. Ltd. and Yantai Pengshun Food Co. Ltd., all of which are located in China.
Competitive Advantages
We believe that we enjoy a number of competitive advantages, both domestically and internationally.
We have developed brand equity for our chestnut products in China, Japan and South Korea over the past 10 to 15 years. Our customers are willing to pay a premium for some of our chestnut products because of our brand equity. In addition, we believe that we have a strong distribution channel for our products in the markets in which we currently operate.
We believe that we are able to provide our customers with greater selection and a more reliable supply than many of our competitors, which is especially important for our supermarket chain and large wholesaler customers. We produced 57 chestnut products in 2011. We believe that we are the sole provider of certain bottom-open chestnut and sweetheart chestnut products in China.
Labor is a large portion of total operating costs for food companies. We believe that we have a lower labor cost structure and a more abundant labor supply than many of our international competitors.
We are focused on managing our costs in other ways as well. We seek to locate our production facilities in close proximity to our main domestic sources of raw materials supply to reduce transportation costs and give us first-hand knowledge of market factors affecting our cost of raw material supply. Our agricultural self-supply program, while modest at present, is expected to grow and to become a significant element of our cost containment efforts.
We use modern food processing technology and innovation in our formulations and manufacturing processes to create high quality products. Nitrogen preservation in particular, used in the production of convenience foods, is an innovative technology which has not been widely applied in China.
In 2008, we submitted an application for patent protection in the PRC for two of our technologies which support the production of our chestnut and convenience food products, with one successful patent grant and one denial. During 2009 and 2010, we submitted four additional patent applications, with one successful patent grant and and three remaining under review. (See “Intellectual Property” below.) We believe that our technology gives us an advantage over our Chinese competitors, allowing us to produce chestnut and convenience food products that are superior in quality and to offer more products varieties.
We believe that our reputation for quality also contributes to our competitiveness. We maintain high food safety standards, in order to satisfy both domestic and international requirements. We regularly test our products for quality and compliance with standards.
- 11 -
Intellectual Property
Trademarks
We use the trademarks
 and
and
 on all of our products sold in China.
Patents
We have developed the following four proprietary technologies to support our chestnut and convenience food production:
-
The sweetheart chestnut is a premium product that is more expensive, and yields greater profit margins than our other chestnut products. Our proprietary technology relates to the process for evenly distributing throughout the chestnuts the syrup used to preserve the chestnuts. This technology enhances the texture of the chestnuts, preserves the natural form of the chestnuts and promotes the stability and uniformity of the chestnuts’ sweetness. In 2008, our patent application for this technology was approved by the State Intellectual Property Office of the PRC and is protected by PRC patent law for 20 years. We expect this technology to contribute to the growth of our sales of sweetheart chestnuts, which had been increasing at an annual rate of 25% to 30% over the past several years.
-
Oden is a popular traditional Japanese dish, typically consisting of boiled eggs, daikon radish, konnyaku and processed fish cakes stewed in a light, soy-flavored dashi broth. Our technology relates to the process used to control the sterilization of the packaging for oden eggs. Our technology enables us to deliver convenience food products with unique freshness and authentic taste. This technology has been an important factor in expanding the market for our convenience foods products, particularly in Japan. Our patent application for this product was approved by the State Intellectual Property Office in February 2009.
-
The pickle vegetable exhibition counter is ideal for shopping malls and supermarkets. It consists of the refrigerator cabinet which keeps the temperature low, and the exhibition cabinet, which sits above the refrigerator cabinet and with glass covers. The exhibition counter is intended for convenience observation and better preservation for the pickle vegetables. Our patent for this device was granted in April 2009.
-
High-temperature chestnut roasting machine is an innovative chestnut roasting device, which overcomes shortcomings of traditional roasters such as low efficiency and uneven heating. It is a sealed cylinder device and also quipped with thermometer and manometer to gauge the temperature and pressure inside the roaster. This new roasting device is also energy efficient and environmentally friendly. Our patent application for this device was approved by the State Intellectual Property Office in July 2011, and protected by PRC patent law for 10 years.
We also have three patent applications pending with the State Intellectual Property Office of the PRC, including the preparation of aerated snack beans, frozen bottom open chestnuts, as well as the device and the preparation procedure for chestnut roasting within a high pressure cylinder device. The approval for patents typically takes 3 to 4 years.
We take reasonable steps to protect our proprietary information and trade secrets, such as limiting disclosure of proprietary plans, methods and the like on a need-to-know basis and requiring employees with access to our proprietary technology to enter into confidentiality arrangements. We believe that our proprietary technology and trade secrets are adequately protected.
Our Employees
As of December 31, 2011, we had a total of 2,122 full-time employees and 484 part-time employees. 720 of our full-time employees are directly employed by our subsidiary companies and the remaining employees are employed by Linyi Zhifu Labor Service Company, an outside company that leases employees to us to meet our staffing needs. As required by Chinese law, all employees are party to a written employment contract. We compensate the employees leased from Linyi Zhifu directly and pay Linyi Zhifu a service fee. Linyi Zhifu is responsible for the pension and social insurance benefits of the leased employees, as described below.
The following table sets forth the allocation of employees, both direct and leased, by job function.
- 12 -
| Department | Number of |
| Employees | |
| Production | 2,223 |
| Quality Control | 75 |
| Domestic Sales | 110 |
| Human Resources | 8 |
| Research and Development | 40 |
| International Sales | 38 |
| Finance | 40 |
| Procurement | 25 |
| Administration | 40 |
| Strategic planning | 7 |
| Total | 2,606 |
We believe that the relationship between management and our employees is good. We have not experienced any significant problems or disruption to our operations due to labor disputes, nor have we experienced any difficulties in recruitment and retention of experienced staff.
Our Shandong Lorain subsidiary has an employee relations department for the purpose of advancing employee welfare, encouraging employee participation in decision making and enhancing relations among employees and between employees and our management team.
We compensate our production line employees by unit produced (piece work) and compensate other employees with a base salary and bonus based on performance. We also provide training for our staff from time to time to enhance their technical and product knowledge, including knowledge of industry quality standards.
Our employees in China participate in a state pension scheme organized by Chinese municipal and provincial governments. We were required to contribute to the scheme on behalf of our direct employees at a rate of 24% of the average monthly salary for the years ended December 31, 2011 and 2010. In addition, we are required by Chinese law to cover our employees with various types of social insurance. We made contributions to the social insurance scheme on behalf of our direct employees at a rate of 4% of the average monthly salary for each employee for the years ended December 31, 2011, 2010, and 2009. As indicated above, Linyi Zhifu is responsible for contributions on behalf of the leased employees.
Our Research and Development Activities
Our research and development efforts are focused on three objectives:
-
Superior product safety and quality;
-
Reduction of operating costs; and
-
Sustaining growth through the development of new products.
We have research and development staff at each of our facilities. In total, 40 employees are dedicated to research and development.
We rely heavily on customer feedback to assist us in the modification and development of our products. We also utilize customer feedback to assist us in the development of new products. Over the past several years, on average, we added 10 to 20 new varieties to our product portfolio each year. In 2011, we added 16 new products, most in our convenience and frozen foods segment. In 2011, we discontinued 3 products in the convenience food segment primarily due to slow sales.
The amount we spent on research and development activities during the years ended December 31, 2011 and 2010 was not a material portion of our total expenses for those years.
Government Regulation
As a manufacturer and distributor of food products, we are subject to regulations of China’s Agricultural Ministry. This regulatory scheme governs the manufacture (including composition and ingredients), labeling, packaging and safety of food. It also regulates manufacturing practices, including quality assurance programs, for foods through its current goods manufacturing practices regulations, and specifies the standards of identity for certain foods, including the products sold by us, and prescribes the format and content of many of the products sold by us, the format and content of certain nutritional information required to appear on food products labels and approves and regulates claims of health benefits of food products.
- 13 -
We have obtained approvals from Chinese authorities for the production of certain categories of products, including chestnuts, frozen vegetables and fruits, fish, and canned products. Production of new products that do not fall into approved categories of products would require separate approval from the appropriate Chinese authorities. We have consistently obtained such approvals for our newly developed products in the past and do not anticipate any difficulties in obtaining new approvals in the future if needed.
In addition, we are required to obtain governmental approval, and to register with the State Administration for Industry and Commerce, in order to open a new facility in China. We have consistently obtained such approvals, and made such registrations, for our new facilities in the past and do not anticipate any difficulties in filing new registrations and obtaining new approvals in the future if needed.
Under the relevant Provisions of the PRC on Sanitation of Food for Export (for Trial Implementation), unless an exporter’s products are exempted from inspection, products must be inspected in accordance with the Law of the PRC on Import and Export Commodity Inspection. We have not been exempted from inspection. In the past, we were authorized by the relevant authorities to conduct self-inspection of certain of our export products. However, currently, the relevant authorities have imposed tighter food safety control in China, and as a result, all of our exported food products must be inspected by qualifying government agencies. We believe that all of our exported products are currently in compliance with such requirements and we do not anticipate any difficulties in complying with such rules in the future.
In addition, we are required to obtain a license from the local branch of the Entry-Exit Inspection and Quarantine Bureau of China for our exported products. We have consistently obtained such licenses in the past and we do not anticipate any difficulties in obtaining such licenses in the future.
Item 1A. RISK FACTORS
RISK FACTORS
From time to time, information provided by us, including but not limited to statements in this report, or other statements made by or on our behalf, may contain “forward-looking” information within the meaning of the Private Securities Litigation Reform Act of 1995. Such statements involve a number of risks, uncertainties, and contingencies, many of which are beyond our control, which may cause actual results, performance, or achievements to differ materially from those anticipated. Set forth below are important factors that could cause our results, performance, or achievements to differ materially from those in any forward-looking statements made by us or on our behalf.
Business Risks
We may not be able to obtain an adequate supply of high quality raw materials.
Our business depends on obtaining a reliable supply of various agricultural products, including chestnuts, vegetables, fruits, red meat, fish, eggs, rice, flour and packaging products. During 2011, the cost of our raw materials increased from $102,751,348 to $127,798,200 for an increase of approximately 23.3% . We may have to increase the number of our suppliers of raw materials and expand our own agricultural operations in the future to meet growing production demands. Despite our efforts to control our supply of raw materials and maintain good relationships with our suppliers, we could lose one or more of our suppliers at any time. The loss of several suppliers may be difficult to replace and could increase our reliance on higher cost or lower quality suppliers, which could negatively affect our profitability. In addition, if we have to increase the number of our suppliers of raw materials in the future to meet growing production demands, we may not be able to locate new suppliers who could provide us with sufficient materials to meet our needs. Any interruptions to, or decline in, the amount or quality of our raw materials supply could materially disrupt our production and adversely affect our business and financial condition and financial prospects.
The prices that we have paid for our raw materials recently have experienced significant fluctuation. If these price fluctuations continue, our profit margins may be materially adversely affected.
The average price that we paid for chestnuts in 2011 and 2010 was approximately $1,071 per metric ton and $1,119 per metric ton, respectively, excluding value added taxes. We do not currently hedge against changes in our raw material prices. Consequently, if the costs of our raw materials increase further, and we are unable to offset these increases by raising the prices of our products, our profit margins and financial condition could be adversely affected.
- 14 -
Price inflation in China could affect our results of operation if we are unable to pass along raw material price increases to our customers.
Inflation in China has been consistently increasing in recent years. Because we purchase raw materials from suppliers in China, price inflation directly causes an increase in the cost of our raw materials. Price inflation could affect our results of operation if we are unable to pass along raw material price increases to customers. In addition, if inflationary trends continue in China, China could lose its competitive advantage as a low-cost manufacturing venue, which could in turn lessen some of the competitive advantages of our being based in China. Accordingly, inflation in China may weaken our competitiveness domestically or in international markets.
Our sales and reputation may be affected by product liability claims, litigation or, product recalls in relation to our products.
The sale of products for human consumption involves an inherent risk of injury to consumers. We face risks associated with product liability claims, litigation, or product recalls, if our products cause injury or become adulterated or misbranded. Our products are subject to product tampering and contamination, such as mold, bacteria, insects, shell fragments and off-flavor contamination, during any of the procurement, production, transportation and storage processes. If any of our products were to be tampered with, or become tainted in any of these respects, and we were unable to detect this, our products could be subject to product liability claims or product recalls. Our ability to sell products could be reduced if certain pesticides, herbicides or other chemicals used by growers have left harmful residues on portions of our raw materials or if our raw materials have been contaminated by other agents.
We have never had a product recall in the past but we have experienced product liability claims that were made by our customers. The amounts of such claims were immaterial. However, claims of product defect or product liability for material amounts, individually or in the aggregate, may be made in the future.
We have not procured a product liability or general liability insurance policy for our business, as the insurance industry in China is still in an early stage of development. To the extent that we suffer a loss of a type which would normally be covered by product liability or general liability insurance in the United States, we would incur significant expenses in defending any action against us and in paying any claims that result from a settlement or judgment against us. Product liability claims and product recalls could have a material adverse effect on the demand for our products and on our business goodwill and reputation. Adverse publicity could result in a loss of consumer confidence in our products.
We may be unable to manage future rapid growth.
We have grown rapidly over the last few years. Our sales increased from $27,735,833 in 2004 to $213,222,106 in 2011. The number of product types we sold increased from approximately 100 in 2004 to approximately 254 in 2011. We intend to continue to expand the volume and variety of products we offer, as well as the geographical scope of our sales and production facilities. Our business growth could place a significant strain on our managerial, operational and financial resources. Our ability to manage future growth will depend on our ability to continue to implement and improve operational, financial and management information systems on a timely basis and to expand, train, motivate and manage our workforce. Our personnel, systems, procedures and controls may not be adequate to support our future growth. Failure to effectively manage our expansion may lead to increased costs, a decline in sales and reduced profitability.
Our expansion strategy may not prove successful and could adversely affect our existing business.
Our growth strategy includes the expansion of our manufacturing operations, including new production lines and agricultural operations. We plan to expand our sales in China and internationally. We will need to engage in various forms of promotional and marketing activities in order to further develop the branding of our products and to increase our market share in new and existing markets. The implementation of this strategy may involve large transactions and present financial, managerial and operational challenges. We could also experience financial or other setbacks if any of our growth strategies incur problems of which we are not presently aware. If we fail to generate sufficient sales in new markets or increase our sales in existing markets, we may not be able to recover the production, distribution, promotional and marketing expenses, as well as administrative costs we have incurred in developing such markets.
Our results of operations could be affected by natural events in the locations in which our customers operate.
Several of our customers have operations in locations that are subject to natural disasters, such as severe weather and geological events, which could disrupt the operations of those customers and suppliers as well as our operations. If our customers suffer from these events, their operations may be negatively impacted. As a result, some or all of those customers may reduce their orders for our products, which could adversely affect our revenue and results of operations.
- 15 -
The acquisition of other businesses could pose risks to our profitability.
We may try to grow through acquisitions in the future. Any proposed acquisition could result in accounting charges, potentially dilutive issuances of equity securities, and increased debt and contingent liabilities, any of which could have a material adverse effect on our existing business and the market price of our common stock. Acquisitions, in general, entail many risks, including risks relating to the failed integration of the acquired operations, diversion of management’s attention, and the potential loss of key employees of the acquired organizations. We may be unable to successfully integrate businesses or the personnel of any business that might be acquired in the future, and our failure to do so could have a material adverse effect on our business and on the market price of our common stock.
We are subject to risks of doing business internationally. If the international market does not grow as we expect, our business and financial condition may be adversely affected.
We conduct a substantial amount of business internationally. Our export sales destinations include countries in Asia, Europe, the Middle East and North America. Our international operations are subject to a number of inherent risks, including:
- chestnut products may not be widely recognized internationally, especially in Western countries;
- local economic and political conditions, including disruptions in trading markets;
- restrictive foreign governmental actions, including restrictions on transfers of funds and trade;
- protection measures, including export duties and quotas and customs tariffs;
- currency exchange rate fluctuations;
- earthquakes, tsunamis, floods or other major disasters may limit the imported food products; and
- unexpected incidents related to food safety.
Any of the foregoing risks could have a material and adverse effect on our operating results.
A significant amount of our revenues is dependent on a limited number of customers and the loss of any one of our major customers could materially and adversely affect our growth and our revenues.
A significant portion of our revenues has historically been derived from a limited number of customers, particularly in our chestnut products segment. Sales to our ten largest customers accounted for approximately 21% and 16% of our total revenues in 2010 and 2011, respectively. The loss of any one of these customers, or a material decrease in purchases by any one of these customers, could adversely impact our revenues.
We rely primarily on distributors to sell our products. Any delays in delivery or poor handling by our distributors or third-party transport operators may affect our sales and damage our reputation.
In 2011, we sold our products through over 100 distribution service providers. The services provided could be suspended and could cause interruption to the supply of our products to domestic or overseas customers. Delivery disruptions may occur for various reasons beyond our control, including poor handling by service providers or third party transport operators, transportation bottlenecks, natural disasters and labor strikes, and could lead to delayed, damaged or lost deliveries. If our products are not delivered in a timely manner, our reputation could be harmed. If our products are damaged in the process of being delivered, we may be liable to pay for such damages incurred.
Failure of the market to accept our new products, or failure to obtain regulatory approval for our new products, may cause us to lose our competitive position in the food industry.
We introduced 15 new products in 2010 and 16 new products in 2011. We plan to introduce approximately 10 to 20 new products in 2012. The success of the new products we introduce depends on our ability to anticipate the tastes and dietary habits of consumers and to offer products that appeal to their preferences. We intend to introduce new products as well as alternative flavors, sizes and packaging for our existing products. We may not be able to gain market acceptance for our new products. Consumer preferences change, and any new products that we introduce may fail to meet the particular tastes or requirements of consumers, or may be unable to replace their existing preferences. Our failure to anticipate, identify or react to these particular tastes or changes could result in reduced demand for our products, which could in turn cause us to be unable to recover our development, production and marketing costs.
We are dependent on certain key personnel and loss of these key personnel could have a material adverse effect on our research and development, operations and revenue.
- 16 -
The Lorain Group Companies were founded in 1995 by Si Chen, our Chairman and Chief Executive Officer. Mr. Chen, together with other senior management, has been a key driver of our strategy and has been fundamental to our achievements to date. The successful management of our business is, to a considerable extent, dependent on the services of Mr. Chen and other senior management. We compete for qualified personnel with other food processing companies, food retailers and research institutions. Consequently, we may either lose key employees to our competitors or we may need to significantly increase the compensation of such employees in order to retain them. The loss of the services of any key management employee or failure to recruit a suitable or comparable replacement could have a significant impact upon our ability to manage our business effectively, and our business and future growth may be adversely affected.
We face increasing competition from domestic and foreign companies.
The food industry in China is fragmented. Our ability to compete against other national and international enterprises is, to a significant extent, dependent on our ability to distinguish our products from those of our competitors by providing large volumes of high quality products that appeal to consumers’ tastes and preferences at reasonable prices. Some of our competitors have been in business longer than we have and are more established. Our competitors may provide products comparable or superior to those we provide or adapt more quickly than we do to evolving industry trends or changing market requirements. Increased competition may result in price reductions, higher raw materials prices, reduced margins and loss of market share, any of which could materially adversely affect our profit margins.
An increase in the cost of energy could affect our profitability.
Recently, we have experienced significant increases in energy costs, and energy costs could continue to rise, which would result in higher distribution, freight and other operating costs. Our future operating expenses and margins will be dependent on our ability to manage the impact of cost increases.
Our products are subject to counterfeiting or imitation, which could impact our reputation.
To date, we have experienced limited counterfeiting and imitation of our products. However, counterfeiting or imitation of our products may occur in the future and we may not be able to detect it and deal with it effectively. Any occurrence of counterfeiting or imitation could impact negatively upon our reputation, particularly if the counterfeit or imitation products cause sickness, or injury to consumers. In addition, counterfeit or imitation products could result in our need to incur costs with respect to the detection or prosecution of such activities.
We rely on an outside contractor to provide a majority of our labor.
We have hired Linyi Zhifu Labor Service Company to provide employees to our production facilities. Should Linyi Zhifu Labor Service Company be unable to continue to provide the number of employees we need, our production could be disrupted. In addition, Linyi Zhifu Labor Service Company could raise their service fees or terminate their relationship with us in the future, which may result in increased production costs.
Regulatory Risks
We are subject to extensive regulations by the Chinese government.
The food industry is subject to extensive regulations by Chinese government agencies. Among other things, these regulations govern the manufacturing, importation, processing, packaging, storage, exportation, distribution and labeling of our products. New or amended statutes and regulations, increased production at our existing facilities, and our expansion into new operations and jurisdictions may require us to obtain new licenses and permits and could require us to change our methods of operations at costs that could be substantial.
Our failure to comply with PRC environmental laws may require us to incur significant costs.
We carry on our business in an industry that is subject to PRC environmental protection laws and regulations. These laws and regulations require enterprises engaged in manufacturing and construction that may cause environmental waste to adopt effective measures to control such waste. In addition, such enterprises are required to pay fines, or to cease operations entirely under extreme circumstances, should they discharge waste substances. The Chinese government may also change the existing laws or regulations or impose additional or stricter laws or regulations, compliance with which may cause us to incur significant capital expenditures, which we may be unable to pass on to our customers through higher prices for our products.
Our failure to comply with PRC hygiene laws may require us to incur significant costs.
- 17 -
Manufacturers in the Chinese food industry are subject to compliance with PRC food hygiene laws and regulations. These food hygiene laws require all enterprises engaged in the production of chestnuts and various vegetables and fruits to obtain a hygiene license for each of their production facilities. Such laws also require manufacturers to comply with regulations with respect to food, food additives, packaging, and food production sites, facilities and equipment. Failure to comply with PRC food hygiene laws may result in fines, suspension of operations, loss of hygiene licenses and, in more extreme cases, criminal proceedings against an enterprise and its management. The Chinese government may also change the existing laws or regulations or impose additional or stricter laws or regulations, compliance with which may cause us to incur significant capital expenditures, which we may be unable to pass on to our customers through higher prices for our products.
Financial Risks
Our operations are cash intensive, and our business could be adversely affected if we fail to maintain sufficient levels of working capital.
We spend a significant amount of cash on our operations, principally to procure raw materials for our products. Many of our suppliers, including chestnut, vegetable and fruit farmers, and suppliers of packaging materials, do not allow us to pay on credit. However, some of the suppliers with whom we have a long-standing business relationship allow us to pay on credit. We fund the majority of our working capital requirements out of cash flow generated from operations. If we fail to generate sufficient sales, or if our suppliers stop offering us credit terms, we may not have sufficient liquidity to fund our operating costs and our business could be adversely affected.
We also fund approximately 43.8% of our working capital requirements from the proceeds of short-term loans from Chinese banks. We expect to continue to do so in the future. Such loans are generally secured by our fixed assets, receivables and/or guarantees by third parties. Our average loan balance from short-term bank loans in 2011 was approximately $20.9 million. The term of almost all such loans is one year or less. Historically, we have rolled over such loans on an annual basis. However, we may not have sufficient funds available to pay all of our borrowings upon maturity. Failure to roll over our short-term borrowings at maturity or to service our debt could result in the imposition of penalties, including increases in rates of interest, legal actions against us by our creditors, or even insolvency.
Management anticipates that our existing capital resources and cash flows from operations and current and expected short-term bank loans will be adequate to satisfy our liquidity requirements through 2012. However, if available liquidity is not sufficient to meet our operating and loan obligations as they come due, our plans include considering pursuing alternative financing arrangements or further reducing expenditures as necessary to meet our cash requirements. However, there is no assurance that, if required, we will be able to raise additional capital or reduce discretionary spending to provide the required liquidity. Currently, the capital markets for small capitalization companies are difficult and banking institutions have become stringent in their lending requirements. Accordingly, we cannot be sure of the availability or terms of any third party financing.
We are subject to credit risk in respect of account receivables.
In 2008 and 2009, some of our customers, including some of our large supermarket customers, delayed their payments for up to 60 to 90 days beyond their term. Our cash flow suffered while waiting for such payments. Consequently, at times we had to delay payments to our suppliers and to postpone business expansion as a result of these delayed payments. Starting in 2008 and through 2011, we gradually shortened credit terms for many of our international and domestic customers from between 30 and 180 days to between 30 and 60 days. Our large customers may fail to meet these shortened credit terms, in which case we may not have sufficient cash flow to fund our operating costs and our business could be adversely affected.
The discontinuation of any preferential tax treatment or other incentives currently available to us in the PRC could materially and adversely affect our business, financial condition and results of operations.
Our subsidiaries are entitled to certain special or preferential tax treatments regarding foreign enterprise income tax in accordance with the “Income Tax Law of the PRC for Enterprises with Foreign Investment and Foreign Enterprises” and related rules.
Accordingly, we have been entitled to tax concessions whereby the profit for the first two financial years beginning with the first profit-making year (after setting off tax losses carried forward from prior years) is exempt from income tax in the PRC and the profit for each of the subsequent three financial years is taxed at 50% of the prevailing tax rates set by the relevant tax authorities. However, on March 16, 2007, the PRC’s National People’s Congress passed a new corporate income tax law, which became effective on January 1, 2008. This new corporate income tax unifies the corporate income tax rate, cost deduction and tax incentive policies for both domestic and foreign-invested enterprises. According to the new corporate income tax law, the applicable corporate income tax rate of our operating subsidiaries has been increased to a rate of 25% over a five-year grandfather period. This tax rate increase applies across the board, for all enterprises whether domestic or foreign. The PRC government has established a set of transition rules to allow enterprises that already started tax holidays before January 1, 2008, to continue utilizing the tax holidays until fully utilized. The discontinuation of any such special or preferential tax treatment or other incentives could have an adverse affect on our business, financial condition and results of operations.
- 18 -
In addition, under current PRC tax law, regulations and rulings, dividends from our operations in China paid to us are not currently subject to PRC income tax. If these distributions become subject to tax in the future, our net income would be adversely affected.
We may enter into additional financing agreements which may have a dilutive effect to our earnings per share and the rights of certain stockholders.
Additional financings could result in significant dilution to our earnings per share or the issuance of securities with rights superior to our current outstanding securities. For instance, we may grant registration rights to investors purchasing our equity or debt securities in the future.
We may be unable to raise additional capital.
If we are unable to raise additional financing when needed, we may be unable to implement our long-term business plan, develop or enhance our products and services, take advantage of future opportunities or respond to competitive pressures on a timely basis, if at all. In addition, a lack of additional financing could force us to substantially curtail or cease operations.
We may be exposed to potential risks relating to our internal control over financial reporting and our ability to have such controls attested to by our independent auditors.
The SEC, under Section 404 of the Sarbanes-Oxley Act of 2002, adopted rules requiring public companies to provide in their annual reports on Form 10-K a report by management with respect to the company’s disclosure controls and procedures and internal control over financial reporting. We are currently required to comply with this requirement. In addition, such rules require the independent registered public accounting firm auditing a company’s financial statements to attest to the operating effectiveness of such company’s internal controls. However, because we are a smaller reporting company, we are not required to receive an attestation report from a registered public accounting firm. We can provide no assurance that we will comply with all of the requirements imposed thereby. Further, we cannot assure that we will receive a positive attestation from our independent auditors. Investors and others may lose confidence in the reliability of our financial statements in the event we identify significant deficiencies or material weaknesses in our internal controls that we cannot remediate in a timely manner or if we are unable to receive a positive attestation from our independent auditors with respect to our internal controls.
Risks Related To Doing Business In China
Changes in China’s political or economic situation could harm us and our operating results.
Economic reforms adopted by the Chinese government have had a positive effect on the economic development of the country. However, the Chinese government could change these economic reforms at any time. Such changes could negatively impact our operations and profitability.
The structure of the Chinese economy may inhibit our ability to expand our business.
The Chinese economy differs from the economies of most countries belonging to the Organization for Economic Cooperation and Development, or OECD, in several ways. For example, state-owned enterprises constitute a large portion of the Chinese economy. In addition, weak corporate governance practices and the lack of flexible currency exchange policies continue to persist. As a result of these differences, we may not develop in the same way or at the same rate as might be expected if the Chinese economy were similar to those of the OECD member countries.
Our business is largely subject to the uncertain legal environment in China.
The Chinese legal system is a civil law system based on written statutes. Unlike common law systems, it is a system in which precedents set in earlier legal cases are not generally used. Laws, regulations and legal requirements relating to foreign investments in China are still evolving, and their interpretation and enforcement involve uncertainties. These uncertainties could limit the legal protections available to foreign investors, such as the right of foreign enterprises to hold required business licenses and permits.
It may be difficult for our stockholders to affect service of process against our subsidiaries or our officers and directors.
- 19 -
Our operating subsidiaries were organized under the laws of China and substantially all of their assets are located outside the U.S. In addition, our executive officers and directors are residents of China and substantially all of their assets are located outside the U.S. As a result, it could be difficult for our stockholders to affect service of process in the U.S., or to enforce a judgment obtained in the U.S., against our officers and directors.
Restrictions on currency exchange may limit our ability to receive and use our revenues effectively.
The majority of our revenues are settled in Renminbi and U.S. dollars, and any future restrictions on currency exchanges may limit our ability to use revenue generated in Renminbi to fund any future business activities outside China or to make dividends or other payments in U.S. dollars. Although the Chinese government introduced regulations in 1996 to allow greater convertibility of the Renminbi for current account transactions, significant restrictions still remain. For instance, foreign enterprises may only buy, sell or remit foreign currencies after providing valid commercial documents at banks in China authorized to conduct foreign exchange business. In addition, conversion of Renminbi for capital account items, including direct investment and loans, is subject to governmental approval in China, and companies are required to open and maintain separate foreign exchange accounts for capital account items. The Chinese regulatory authorities may impose more stringent restrictions on the convertibility of the Renminbi in the future.
Failure to comply with PRC regulations relating to the establishment of offshore special purpose companies by PRC residents may have negative effects on our company.
In October 2005, the PRC State Administration of Foreign Exchange, or SAFE, issued the Notice on Relevant Issues in the Foreign Exchange Control over Financing and Return Investment Through Special Purpose Companies by Residents Inside China, generally referred to as Circular 75, which required PRC residents to register with the local SAFE branch before establishing or acquiring control over an offshore special purpose company, or SPV, for the purpose of engaging in an equity financing outside of China on the strength of domestic PRC assets originally held by those residents. Internal implementing guidelines issued by SAFE, which became public in June 2007 (known as Notice 106), further expanded the reach of Circular 75.
ILH acquired certain interests in the Lorain Group Companies controlled by Si Chen, our Chairman and Chief Executive Officer. Pursuant to Notice No. 75 and Notice 106, if a PRC resident has completed a round-trip investment through its established SPV but has not yet completed the required procedures of SAFE registration for offshore investment of the SPV, he must retroactively register the SPV with SAFE.
In order to avoid such SAFE registration requirements, a Japanese individual, Hisashi Akazawa, was designated as a nominee holder of ILH when ILH was established. Mr. Akazawa granted an option to our Chairman and Chief Executive Officer, Mr. Chen, allowing Mr. Chen to buy 90% of Mr. Akazawa’s interest in the Company at a fixed price at a future time in accordance with the terms of an option agreement between the two parties. On December 22, 2008, Mr. Chen exercised this option. In addition, on that date, Mr. Chen acquired all of the remaining shares of our company held by Mr. Akazawa. As a result, Mr. Chen is the beneficiary of ILH and may be required to register with and obtain approvals from SAFE or its agency in connection with respect to the direct offshore investment activities related to the acquisition of the Lorain Group Companies.
If the failure to identify and characterize Mr. Chen as a beneficial owner of ILH is determined by the PRC authorities to be a serious violation of the requirements of the PRC Company Law and the PRC Regulation of Registration of Companies, the Lorain Group Companies may be ordered by the company registration authority in the PRC to make corrections on its filed registration, to be fined an amount no less than RMB 5,000 and no more than RMB 50,000 or, in the worse scenario, to have its company registration certificate revoked or its business licenses canceled.
Moreover, because of uncertainty over how Circular 75 will be interpreted and implemented, and how or whether SAFE will apply it to us, we cannot predict how it will affect our business operations or future strategies, such as our present and prospective PRC subsidiaries’ ability to conduct foreign exchange activities including the remittance of dividends and foreign currency-denominated borrowings. In addition, our PRC resident beneficial holders may be subject to compliance with Circular 75. Such holders may not be able to complete the necessary registration procedures required by Circular 75.
Our financial condition is affected by the foreign exchange rate between the U.S. dollar and the Renminbi.
Our financial condition is affected by the foreign exchange rates, primarily the rate between the U.S. dollar and the Renminbi. In the event that the Renminbi appreciates against the U.S. dollar, our costs will increase.
Risks Related To the Market For Our Stock
- 20 -
Certain of our stockholders have the ability to delay or prevent adoption of important business decisions based on their ownership of a significant percentage of our outstanding voting securities.
Mr. Chen is the record owner of approximately 47% of our outstanding voting securities. As a result, he possesses significant influence over our business. For instance, Mr. Chen may elect our board of directors, authorize significant corporate transactions or prevent a future change in control of our company.
Certain provisions of our Certificate of Incorporation may make it more difficult for a third party to effect a change- in-control.
Our Certificate of Incorporation authorizes our board of directors to issue up to 5,000,000 shares of preferred stock without stockholder approval. The preferred stock may be issued in one or more series, the terms of which may be determined at the time of issuance by the board of directors without further action by the stockholders. These terms may contain voting rights, including the right to vote as a series on particular matters, preferences as to dividends and liquidation, conversion rights and redemption rights provisions. The issuance of any preferred stock could diminish the rights of holders of our common stock, and therefore could reduce the value of such common stock. In addition, specific rights granted to future holders of preferred stock could be used to restrict our ability to merge with, or sell assets to, a third party. The ability of our board of directors to issue preferred stock could make it more difficult to acquire our company and could negatively affect the market price of our common stock.
The exercise of outstanding warrants issuable for shares of our common stock may cause dilution to existing shareholders.
There are currently warrants outstanding to purchase up to an aggregate of 2,336,179 shares of our common stock. The term of 1,753,909 of these warrants expire in April 2015, the term of 501,115 of these warrants expire in October 2012, and the term of 81,155 of these warrants expire in January 2014. The exercise prices of these warrants range from $2.81 to $4.25 per share, subject to adjustment. If holders of these warrants exercise the warrants in exchange for shares of our common stock, such issuances may have a dilutive effect on the stock ownership of existing shareholders and may harm the market price of our stock. Furthermore, if we were to attempt to obtain additional financing during the term of these warrants, the terms on which we obtain such financing may be adversely affected by the existence of these warrants.
We do not expect to pay dividends in the future, and any return on your investment may be limited to the value of the shares you acquire.
Other than a special cash dividend which we paid to holders of our common stock as of April 16, 2007, we have never declared or paid cash dividends. We do not anticipate paying any cash dividends on our common stock in the foreseeable future and any return on your investment may be limited to the value of the shares of our common stock that you acquire. We currently intend to retain and use any future earnings for the development and expansion of our business.
Item 1B. UNRESOLVED STAFF COMMENTS
[None.]
Item 2. PROPERTIES
Our primary facilities, which are owned except where otherwise indicated, are as follows:
| Facility | Location | Approximate Size | Owned or Leased |
| (Square Meters) | |||
| Junan Hongrun | Junan County, Shandong Province, PRC | 197,637 | Owned |
| Shandong Lorain | Junan County, Shandong Province, PRC | 31,459 | Owned |
| Beijing Lorain | Miyun County, Beijing Province, PRC | 22,677 | Owned |
| Luotian Lorain | Luotian County, Hubei Province, PRC | 54,251 | Owned |
| Dongguan Lorain | Dongguan County, Guandong Province, PRC | 5,472 | Leased |
| Shandong Greenpia | Junan County, Shandong Province, PRC | 33,332 | Owned |
- 21 -
We also own or lease space for additional facilities, including refrigerated storage facilities, and smaller offices, including sales offices, located in China.
In the aggregate, we currently have land use rights to, or lease, 76 properties with approximately 344,828 square meters in the aggregate, consisting of manufacturing facilities, office buildings and land reserved for future expansion. We believe our current facilities provide adequate capacity for our current and projected needs.
All land in China is owned by the State. Individuals and companies are permitted to acquire rights to use land or land use rights for specific purposes. In the case of land used for industrial purposes, the land use rights are granted for a period of up to 50 years. This period may be renewed at the expiration of the initial and any subsequent terms. Granted land use rights are transferable and may be used as security for borrowings and other obligations.
Item 3. LEGAL PROCEEDINGS
From time to time, we may become involved in various lawsuits and legal proceedings which arise in the ordinary course of business. However, litigation is subject to inherent uncertainties, and an adverse result in these or other matters may arise from time to time that may harm our business. We are currently not aware of any such legal proceedings or claims that we believe will have a material adverse affect on our business, financial condition or operating results.
Item 4. MINE SAFETY DISCLOSURES
Not applicable.
PART II
Item 5. MARKET FOR REGISTRANT'S COMMON EQUITY, RELATED STOCKHOLDER MATTERS AND ISSUER PURCHASES OF EQUITY SECURITIES.
Market for our Common Stock
Our common stock is quoted on the NYSE AMEX under the symbol “ALN”. As of March 29, 2012 the closing price for our common stock was $1.34 per share.
The following table sets forth, for the periods indicated, the high and low sales prices of our common stock. These prices reflect inter-dealer prices, without retail mark-up, mark-down or commission, and may not represent actual transactions.
| Common Stock | ||||||
| Market Prices | ||||||
| High | Low | |||||
| Fiscal Year Ended December 31, 2011 | ||||||
| First Quarter | $ | 2.89 | $ | 2.26 | ||
| Second Quarter | $ | 2.38 | $ | 1.28 | ||
| Third Quarter | $ | 2.19 | $ | 1.44 | ||
| Fourth Quarter | $ | 1.60 | $ | 1.25 | ||
| Fiscal Year Ended December 31, 2010 | ||||||
| First Quarter | $ | 4.02 | $ | 2.79 | ||
| Second Quarter | 3.60 | 2.50 | ||||
| Third Quarter | 3.39 | 2.55 | ||||
| Fourth Quarter | 3.13 | 2.58 | ||||
Approximate Number of Holders of Our Common Stock
On December 31, 2011, there were 295 stockholders of record of our common stock.
Dividend Policy
We have not declared or paid cash dividends other than the payment of a dividend in April 2007 in connection with our reverse merger. Any future decisions regarding dividends will be made by our board of directors. We currently intend to retain and use any future earnings for the development and expansion of our business and do not anticipate paying any cash dividends in the foreseeable future.
- 22 -
Issuances of Unregistered Securities
On January 5, 2010, we issued warrants to three service providers. These warrants are exercisable into an aggregate of 81,155 shares of our common stock and the warrants expire in January 2014. Based upon certain representations made by the grantees of these warrants, as set forth in the warrants, the warrants were issued pursuant to an exemption from registration under Section 4(2) of the Securities Act.
EQUITY COMPENSATION PLAN INFORMATION
Information for our equity compensation plans in effect as of the end of fiscal year 2011 is as follows :
| (a) | (b) | (c) | |||||||
| Number of | Weighted-average | Number of | |||||||
| securities to | exercise price of | securities | |||||||
| be issued | outstanding | remaining | |||||||
| upon | options, warrants | available for | |||||||
| exercise of | and rights | future | |||||||
| outstanding | issuance | ||||||||
| options, | under equity | ||||||||
| warrants | compensation | ||||||||
| and rights | plans | ||||||||
| (excluding | |||||||||
| securities | |||||||||
| reflected in | |||||||||
| column (a)) | |||||||||
| Plan category | |||||||||
| Equity compensation plans approved by security holders | 1,334,573 | 1.58 | 1,165,427 | ||||||
| Equity compensation plans not approved by security holders | 0 | N/A | 0 | ||||||
| Total | 1,334,573 | 1.58 | 1,165,427 |
Item 6. SELECTED FINANCIAL DATA
Not applicable.
Item 7. MANAGEMENT’S DISCUSSION AND ANALYSIS OF FINANCIAL CONDITION AND RESULTS OF OPERATIONS
Overview
We are an integrated food manufacturing company headquartered in Shandong Province, China. We develop, manufacture and sell the following types of food products:
- chestnut products,
- convenience foods (including ready-to-cook, or RTC, foods, ready-to-eat, or RTE, foods and meals ready-to-eat, or MRE); and
- frozen food products.
We conduct our production activities in China. Our products are
sold in 26 provinces and administrative regions in China and 42 foreign
countries. We believe that we are the largest chestnut processor and
manufacturer in China. We have developed brand equity for our chestnut products
in China, Japan and South Korea over the past 10 to 15 years. We produced 57
high value-added processed chestnut products in 2011. We derive most of our
revenues from sales in China, Japan and South Korea. In 2012, our primary
strategy was to continue building our brand recognition in China through
consistent marketing efforts towards supermarkets, wholesalers, and significant
customers;, enhancing the cooperation with other manufacturers
and factories; and enhancing the
turnover for our exsting chestnut, convenience and frozen food products. In
addition, we are working to expand our marketing efforts in Asia, Europe and the
Middle East. We currently have limited sales and marketing activity in the
United States, although our long-term plan is to significantly expand our
activities there.
Production Factors that Affect our Financial and Operational Condition
Our business depends on obtaining a reliable supply of various agricultural products, including chestnuts, vegetables, fruits, red meat, fish, eggs, rice, flour and packaging products. During 2011, the cost of our raw materials increased from $102,751,348 to $127,798,200, for an increase of approximately 23.3% . We may have to increase the number of our suppliers of raw materials and expand our own agricultural operations in the future to meet growing production demands. Despite our efforts to control our supply of raw materials and maintain good relationships with our suppliers, we could lose one or more of our suppliers at any time. The loss of several suppliers may be difficult to replace and could increase our reliance on higher cost or lower quality suppliers, which could negatively affect our profitability. In addition, if we have to increase the number of our suppliers of raw materials in the future to meet growing production demands, we may not be able to locate new suppliers who could provide us with sufficient materials to meet our needs. Any interruptions to, or decline in, the amount or quality of our raw materials supply could materially disrupt our production and adversely affect our business and financial condition and financial prospects.
- 23 -
The average price that we paid for chestnuts in 2011 and 2010 was approximately $1,071 per metric ton and $1,119 per metric ton, respectively, excluding value added taxes. In past few years , increasing inflation pressures weighed on the Chinese economy, as well as on agricultural products. We do not have effective means and do not currently hedge against changes in our raw material prices. Consequently, if the costs of our raw materials increase further and we are unable to offset these increases by raising the prices of our products, our profit margins and financial condition could be adversely affected.
Uncertainties that Affect our Financial Condition
We spend a significant amount of cash on our operations, principally to procure raw materials for our products. Many of our suppliers, including chestnut, vegetable and fruit farmers, and suppliers of packaging materials, require us to pay for their supplies in cash on the same day that such supplies are delivered to us. However, some of the suppliers with whom we have a long-standing business relationship allow us to pay on credit. We fund the majority of our working capital requirements out of cash flow generated from operations. If we fail to generate sufficient sales, or if our suppliers stop offering us credit terms, we may not have sufficient liquidity to fund our operating costs and our business could be adversely affected.
We also funded approximately 43.8% and 43.9% of our working capital requirements in 2011 and 2010, respectively, from the proceeds of short-term loans from Chinese banks. We expect to continue to do so in the future. Such loans are generally secured by our fixed assets, receivables and/or guarantees by third parties. Our average loan balance from short-term bank loans in 2011 and 2010 were approximately $20.9 million and $36.3 million, respectively. The term of almost all such loans is one year or less. Historically, we have rolled over such loans on an annual basis. However, commencing 2010, the Chinese government has implemented more stringent credit policies to curb inflation and soaring property prices, which could negatively impact our ability to obtain or roll over these short term loans, and hence not having sufficient funds available to pay all of our borrowings upon maturity. Failure to roll over our short-term borrowings at maturity or to service our debt could result in the imposition of penalties, including increases in rates of interest, legal actions against us by our creditors, or even insolvency. In addition, we completed two private placement financings in September 2010 and October 2009 with net proceeds of $9.0 million and $10.9 million, respectively, the proceeds of which were primarily used as working capital. We also secured a $15 million loan from Deutsche Investitions- und Entwicklungsgesellshaft (“DEG”) in May 2010, which we have fully drawn down as of December 2011. We can provide no assurances that we will be able to enter into any future financing or refinancing agreements on terms favorable to us, especially considering the current instability of the capital markets.
We anticipate that our existing capital resources, cash flows from operations, current and expected short-term bank loans, as well as remaining proceeds from the September 2010 private placement and the loan from DEG will be adequate to satisfy our liquidity requirements through 2012. However, if available liquidity is not sufficient to meet our operating and loan obligations as they come due, our plans include considering pursuing alternative financing arrangements or further reducing expenditures as necessary to meet our cash requirements. However, there is no assurance that, if required, we will be able to raise additional capital or reduce discretionary spending to provide the required liquidity. Currently, the capital markets for small capitalization companies are difficult and banking institutions have become stringent in their lending requirements. Accordingly, we cannot be sure of the availability or terms of any third party financing.
The crisis of the financial and credit markets worldwide in the second half of 2008 has led to a severe economic recession worldwide. Furthermore, the European countries experienced severe debt crisis during 2010 and 2011 which further weighed on the global economic conditions as well as the financial market. The outlook for 2012 is still uncertain, but continuation or worsening of unfavorable economic conditions, including the ongoing global economy and capital markets disruptions, could have an adverse impact on our business, operating results or financial condition in a number of ways. For example, we may experience declines in revenues, profitability and cash flows as a result of reduced orders, delays in receiving orders, delays or defaults in payment or other factors caused by the economic problems of our customers and prospective customers. We may experience supply chain delays, disruptions or other problems associated with financial constraints faced by our suppliers and subcontractors. In addition, changes and volatility in the equity, credit and foreign exchange markets and in the competitive landscape make it increasingly difficult for us to predict our revenues and earnings into the future.
In 2008 and 2009, some of our customers, including some of our large supermarket customers, delayed their payments for up to 60 to 90 days beyond their term. Our cash flow suffered while waiting for such payments. Consequently, at times we had to delay payments to our suppliers and to postpone business expansion as a result of these delayed payments. Starting in 2008 and through 2011, we gradually shortened credit terms for many of our international and domestic customers from between 30 and 180 days to between 30 and 60 days. Our large customers may fail to meet these shortened credit terms, in which case we may not have sufficient cash flow to fund our operating costs and our business could be adversely affected.
- 24 -
Results of Operations
The following tables set forth key components of our results of operations for the periods indicated, and the differences between the two periods expressed in dollars and percentages :
| Increase / | Increase / | |||||||||||
| 2011 | 2010 | Decrease | Decrease | |||||||||
| (in thousands of U.S. dollars) | ($) | (%) | ||||||||||
| Revenue | 213,222 | 184,177 | 29,045 | 15.8% | ||||||||
| Cost of Revenue | -168,209 | -142,293 | -25,916 | 18.2% | ||||||||
| Gross profit | 45,013 | 41,884 | 3,129 | 7.5% | ||||||||
| Operating Expenses: | ||||||||||||
| Selling and Marketing | -10,514 | -8,559 | -1,955 | 22.8% | ||||||||
| General and administrative | -6,584 | -5,807 | -777 | 13.4% | ||||||||
| Operating Income | ||||||||||||
| Income from continuing operations | 27,916 | 27,518 | 398 | 1.4% | ||||||||
| Non-operating Income | ||||||||||||
| (Expenses): | ||||||||||||
| Government grant | 746 | 1,271 | -525 | -41.3% | ||||||||
| Interest income | 87 | 10 | 77 | 765.6% | ||||||||
| Other income | 2,450 | 1,047 | 1,403 | 134.0% | ||||||||
| Other expense | -733 | -416 | -317 | 76.2% | ||||||||
| Interest Expense | -2,562 | -4,352 | 1,790 | -41.1% | ||||||||
| Income before taxes | 27,903 | 25,079 | 2,824 | 11.3% | ||||||||
| Income Taxes | -6,819 | -5,830 | -989 | 17.0% | ||||||||
| Income before Minority | 21,084 | 19,248 | 1,836 | 9.5% | ||||||||
| Interest | ||||||||||||
| Minority Interest | -1,196 | -1,409 | 213 | -15.1% | ||||||||
| Net Income | 19,887 | 17,839 | 2,048 | 11.5% |
Year Ended December 31, 2011 Compared to Year Ended December 31, 2010
Revenue
Net Revenues. Net revenues increased by $29.0 million, or approximately 15.8%, to $213.2 million in 2011 from $184.2 million in 2010. This increase was attributable to the increased revenues generated from sales of each of our product segments, as reflected in the following table:
- 25 -
| (in thousands | 2011 | 2010 | Increase / | Increase / | ||||||||
| of U.S. | Revenues | Revenues | Decrease | Decrease | ||||||||
| dollars) | ||||||||||||
| ($) | ($) | ($) | (%) | |||||||||
| Convenience Products | 72,888 | 56,752 | 16,136 | 28.4% |
The increase in revenue was primarily driven by growth in our domestic market. Revenues from sales in the Chinese domestic market increased by approximately $22.0 million, or approximately 16.3%, in 2011. As a percentage of total revenues, revenues from sales in the domestic PRC market increased to approximately 73.7% from approximately 73.3% in 2010.
In addition, in 2011, revenues from sales to Japan, France, United Kingdom, and Spain as well as other countries increased, in the aggregate, approximately $12.9 million, or 47.8%, compared to 2010, partially offset by a decrease of an aggregate of $5.9 million, or 26.9%, of sales to United States, Netherlands, South Korea as well as other countries compared to 2010. See Note 16 to the financial statements contained elsewhere in this report for more information on the breakdown of our sales per geographic region.
Cost of Revenues. Our cost of revenues increased $25.9 million, or approximately 18.2%, to $168.2 million in 2011 from $142.3 million in 2010. This increase was attributable to the following factors, by percentage:
| Category | Allocation of | ||
| Increase in | |||
| Cost | |||
| of Revenues | |||
| (%) | |||
| Raw Materials | 23.3% | ||
| Other Allocated Overhead | 61.9% | ||
| (depreciation, utilities, freight, equipment consumables) Wages | 57.4% |
Raw material costs increased to $127,798,200, or approximately 23.3%, in 2011 from $102,751,348 in 2010, primarily reflecting our increase operation and sales. Overhead expenses increased primarily due to increased depreciation expenses and utility expenses. Wages increased due to increased employee base as well as an increase in salary level.
The following table reflects the changes in our cost of revenues in 2011 as compared to 2010 among our different segments:
| (thousands of U.S. dollars) | 2011 Cost of | 2010 Cost of | Increase/ | ||||||
| Revenues | Revenues | (Decrease) | |||||||
| ($) | ($) | (%) | |||||||
| Chestnut Products | 86,986 | 77,136 | 12.8% | ||||||
| Convenience Products | 57,500 | 44,117 | 30.3% | ||||||
| Frozen Products | 23,722 | 21,040 | 12.7% | ||||||
| Total | 168,209 | 142, 293 | 18.2% |
Gross Profit. Our gross profit increased $3.1 million, or 7.5%, to $45.0 million in 2011 from $41.9 million in 2010 as a result of higher net revenues, partially offset by higher cost of revenues, for the reasons indicated above.
Operating Expenses
Selling and Marketing Expenses. Our selling and marketing expenses increased approximately $2.0 million, or 22.8%, to $10.5 million in 2011 from $8.6 million in fiscal year 2010. The following table reflects the main factors that contributed to this increase as well as the dollar amount that each factor contributed to this increase:
- 26 -
| (in U.S. dollars) | Increase in | ||
| costs in 2011 | |||
| over 2010 | |||
| Wages (sales personnel) | 438,240 | ||
| Transportation | 426,213 | ||
| Supermarket Fee | 182,910 | ||
| Customer Entertainment | 89,315 | ||
| Port Fee | 760,478 |
The increases listed in the table above were partially offset by an aggregate of $505,819 decreases of other factors, including advertizing, certification and sea transportation.
General and Administrative Expenses. Our general and administrative expenses increased approximately $776,777, or 13.4%, to $6.6 million in 2011 from $5.8 million in 2010. The following table reflects the main factors that contributed to this increase as well as the dollar amount that each factor contributed to this increase:
| (in U.S. dollars) | Increase in | ||
| costs in 2011 | |||
| over 2010 | |||
| Wage and Benefit | 270,232 | ||
| Depreciation and Amortization | 194,185 | ||
| Land Use Fee | 256,450 | ||
| Customer Entertainment | 144,733 |
Government Subsidy Income
Government subsidy income decreased from approximately $1.3 million in 2010 to $745,708 in 2011, representing grants received mostly from the Junan County government and Hubei government to assist us in our research and business development.
Income Before Taxation and Minority Interest
Income before taxation and minority interest increased $2.8 million, or 11.3%, to $27.9 million in 2011 from $25.1 million in 2010 as a result of higher revenues, partially offset by higher costs of revenues and operating expenses, for the reasons indicated above.
Income Taxes
Income taxes increased approximately $1.0 million, or 17.0%, to $6.8 million in 2011, as compared to $5.8 million in 2010. This increase was attributable to the higher income earned in 2011 as compared to 2010. Effective January 1, 2008, the PRC government implemented a new 25% tax rate across the board for all enterprises, without any tax holiday. However, the PRC government has established a set of transition rules to allow enterprises that already started tax holidays before January 1, 2008 to continue utilizing such tax holidays until they are fully utilized. The income tax rates applicable to our Chinese operating subsidiaries in 2010, 2011, and 2012 are depicted in the following table:
| 2010 | 2011 | 2012 | |||||||
| Income Tax | |||||||||
| Junan Hongrun | 25% | 25% | 25% | ||||||
| Luotian Lorain | 15% | 25% | 25% | ||||||
| Beijing Lorain | 15% | 15% | 25% | ||||||
| Shangdong Lorain | 25% | 25% | 25% | ||||||
| Dongguan Lorain | 25% | 25% | 25% | ||||||
| Shandong Greenpia | 25% | 25% | 25% |
Minority Interest.
Shandong Economic Development Investment holds 19.8% of the equity of our subsidiary Shandong Lorain, which is reflected in the minority interest of $1.2 million in 2011 and $1.4 million in 2010.
Net Income.
Net income increased $2.0 million, or 11.5%, to $19.9 million in 2011 from $17.8 million in fiscal year 2010, as a result of the factors described above.
Liquidity and Capital Resources
- 27 -
General
Our primary capital needs have been to fund the working capital requirements necessitated by our sales growth, adding new products and expanding our facilities. In the past, our primary sources of financing have been cash generated from operations and short-term loans from banks in China. In October 2009 and September 2010, we obtained approximately $11 million and 9 million, respectively, from two private placement transactions. We also secured a $15 million loan from Deutsche Investitions- und Entwicklungsgesellshaft (“DEG”) in May 2010 which we have fully drawn down as of December 2011. Proceeds from the private placement transactions and cash drawn down from the DEG loan, together with cash generated from operations and short-term bank loans, have been primarily used to fund our working capital needs, as well as addition to our construction in progress and purchase of fixed assets. At December 31, 2011 and 2010, cash and cash equivalents (including restricted cash) were $30.4 million $15.0 million, respectively.
We expect to continue to finance our operations and working capital needs in 2012 from cash generated from operations and short-term bank loans. In addition, we currently plan to finance or refinance approximately $12 million in the form of short-term bank loans in 2012. We expect that anticipated cash flows from operations and short-term bank loans will be sufficient to fund our operations through at least the next twelve months.
If available liquidity is not sufficient to meet our operating and loan obligations as they come due, our plans include pursuing alternative financing arrangements or reducing expenditures as necessary to meet our cash requirements. However, there is no assurance that we will be able to raise additional capital or reduce discretionary spending to provide liquidity, if needed. Currently, the capital markets for small capitalization companies are difficult. Accordingly, we cannot be sure of the availability or terms of any alternative financing arrangements.
The following table provides detailed information about our net cash flow for all financial statements periods presented in this report.
| Cash Flows Data: | ||||||
| (in thousands of U.S. dollars) | For year ended December 31, | |||||
| 2011 | 2010 | |||||
| Net cash flows provided by (used in) operating activities | (2,141 | ) | 24,429 | |||
| Net cash flows provided by (used in) investing activities | (16,217 | ) | (35,649 | ) | ||
| Net cash flows provided by (used in) financing activities | 17,009 | 7,837 | ||||
Operating Activities
Net cash used in operating activities for 2011 was $2.1 million and net cash provided by operating activities for 2010 was $24.4 million. The decrease of approximately $26.6 million in net cash flows provided in operating activities resulted primarily from a higher increase in accounts and other receivables of $18.5 million, a higher increase in inventory of $1.7 million, and a lower decrease in prepayments of $9.4 million, partially offset by higher net income of $1.8 million.
Investing Activities
During 2011, our uses of cash for investment activities are primarily purchase of plant and equipment. Net cash used in investing activities for 2011 and 2010 were $16.2 million and $35.6 million, respectively, with the decrease of approximately $19.4 million resulted primarily from a $11.2 million less payment for construction in progress, $3 million less payment for the purchase of plant and equipment and $9.4 million proceeds from short term investments, partially offset by $9.7 million higher increase in restricted cash.
Financing Activities
Net cash provided by financing activities for 2011 and 2010 were $17.0 million and $7.8 million, respectively. The increase of approximately $9.2 million in net cash provided by financing activities resulted primarily from an increase of $20.8 million in net short-term bank borrowings and a $5.8 million additional increase in long-term bank borrowings, partially offset by $9.0 million less proceeds from the issuance of common stock and $4.2 million repayment of bank notes.
Loan Facilities
As of December 31, 2011 and 2010, we carried $36.0 million and $25.2 million short term bank loans from Chinese domestic banks. Please refer to Note 9 of the consolidated financial statements for details.
Critical Accounting Policies
- 28 -
The preparation of financial statements in conformity with United States generally accepted accounting principles requires our management to make assumptions, estimates and judgments that affect the amounts reported in the financial statements, including the notes thereto, and related disclosures of commitments and contingencies, if any. We consider our critical accounting policies to be those that require the more significant judgments and estimates in the preparation of financial statements, including the following:
Method of Accounting -- We maintain our general ledger and journals with the accrual method accounting for financial reporting purposes. The financial statements and notes are representations of management. Accounting policies adopted by us conform to generally accepted accounting principles in the United States of America and have been consistently applied in the presentation of financial statements, which are compiled on the accrual basis of accounting.
Use of estimates -- The preparation of the financial statements in conformity with generally accepted accounting principles in the United States of America requires management to make estimates and assumptions that affect the reported amounts of assets and liabilities and disclosure of contingent assets and liabilities at the date of the financial statements and the reported amounts of revenues and expenses during the reporting periods. Management makes these estimates using the best information available at the time the estimates are made; however, actual results could differ materially from those estimates.
The use of estimates is critical to carrying value of asset accounts such as accounts receivable, inventory, fixed assets, and intangible assets. We use estimates to account for the related bad debt allowance, inventory impairment charges, depreciation and amortization of our assets. In the food processing industry these accounts have a significant impact on the valuation of our balance sheet and the results of our operations.
Principles of consolidation -- The consolidated financial statements are presented in US Dollars and include the accounts of the Company and its commonly controlled entity. All significant inter-company balances and transactions are eliminated in combination.
As of December 31, 2011, the particulars of the commonly controlled entities are as follows:
| Place of | Attributable equity | Registered | |||||||
| Name of Company | incorporation | interest % | capital | ||||||
| Shandong Lorain Co., Ltd | PRC | 80.2 | $ | 12,733,926 | |||||
| Luotian Lorain Co., Ltd | PRC | 100 | 3,987,343 | ||||||
| Junan Hongrun Foodstuff Co., Ltd | PRC | 100 | 47,101,050 | ||||||
| Beijing Lorain Co., Ltd | PRC | 100 | 1,574,233 | ||||||
| Shandong Greenpia Foodstuff Co.,Ltd | PRC | 100 | 2,418,022 | ||||||
| Dongguan Lorain Co,,Ltd | PRC | 100 | 157,423 | ||||||
| International Lorain Holding Inc. | Cayman Islands | 100 | 48,988,162 |
Accounting for the Impairment of Long-Lived Assets -- The long-lived assets held and used by us are reviewed for impairment whenever events or changes in circumstances indicate that the carrying amount of assets may not be recoverable. It is reasonably possible that these assets could become impaired as a result of technology or other industry changes. Determination of recoverability of assets to be held and used is by comparing the carrying amount of an asset to future net undiscounted cash flows to be generated by the assets.
If such assets are considered to be impaired, the impairment to be recognized is measured by the amount by which the carrying amount of the assets exceeds the fair value of the assets. Assets to be disposed of are reported at the lower of the carrying amount or fair value less costs to sell.
During the reporting years, there was no impairment loss.
Revenue recognition -- Our revenue recognition policies are in compliance with Staff Accounting Bulletin (SAB) 104. Sales revenue is recognized at the date of shipment to customers when a formal arrangement exists, the price is fixed or determinable, the delivery is completed, we have no other significant obligations and collectability is reasonably assured. Payments received before all of the relevant criteria for revenue recognition are satisfied are recorded as unearned revenue.
Our revenue consists of invoiced value of goods, net of a value-added tax (VAT). No product return or sales discount allowance is made as products delivered and accepted by customers are normally not returnable and sales discount is normally not granted after products are delivered.
- 29 -
We believe that when custody and title of goods has been passed to our customers, or third party transporters revenue is recognized. Our industry does not call for revenue recognition under multiple deliverable arrangements.
Financial Instruments
Our financial instruments are cash and cash equivalents, accounts receivable, other receivable, advances to suppliers, advances to employees, bank loans and notes, accounts payable, other payable, accrued liabilities, and long-term liabilities. The recorded values of cash and cash equivalents, accounts receivable, other receivable, advances to suppliers, advances to employees, bank loans and notes, accounts payable, other payable, and accrued liabilities approximate their fair values based on their short-term nature. The recorded values of long-term liabilities approximate their fair values, as interest approximates market rates.
We have the accounting policy regarding financial instruments for our financial statements in 2010 and 2011. We consider it critical because our business is becoming more global in nature and the use of fair value for financial instruments has been widely adopted by accounting bodies around the globe. With financial statements that are widely accepted and comparable in many jurisdictions we will have greater access to capital locally.
Recent accounting pronouncements
In December 2010, FASB issued ASU No. 2010-29, Business Combinations (Topic 805): Disclosure of Supplementary Pro Forma Information for Business Combinations. The amendments in this update specify that if a public entity presents comparative financial statements, the entity should disclose revenue and earnings of the combined entity as though the business combination(s) that occurred during the current year had occurred as of the beginning of the comparable prior annual reporting period only. The amendments also expand the supplemental pro forma disclosures to include a description of the nature and amount of material, nonrecurring pro forma adjustments directly attributable to the business combination included in the reported pro forma revenue and earnings. The amendments in this update are effective prospectively for business combinations for which the acquisition date is on or after the beginning of the first annual reporting period beginning on or after December 15, 2010. The Company adopted the disclosure requirements for the business combinations in 2011.
In May 2011, FASB issued ASU No. 2011-04, Fair Value Measurement (Topic 820): Amendments to Achieve Common Fair Value Measurement and Disclosure Requirements in U.S. GAAP and IFRSs, which is not expected to have a material impact on the Company’s consolidated financial statements upon adoption.
In June 2011, FASB issued ASU 2011-05, Comprehensive Income (ASC Topic 220): Presentation of Comprehensive Income. Under the amendments in this update, an entity has the option to present the total of comprehensive income, the components of net income and the components of other comprehensive income either in a single continuous statement of comprehensive income or in two separate but consecutive statements. Under both options, an entity is required to present each component of net income along with total net income, each component of other comprehensive income along with a total for other comprehensive income and a total amount for comprehensive income. In a single continuous statement, the entity is required to present the components of net income and total net income, the components of other comprehensive income and a total for other comprehensive income, along with the total of comprehensive income in that statement. In the two-statement approach, an entity is required to present components of net income and total net income in the statement of net income. The statement of other comprehensive income should immediately follow the statement of net income and include the components of other comprehensive income and a total for other comprehensive income, along with a total for comprehensive income. In addition, the entity is required to present on the face of the financial statements reclassification adjustments for items that are reclassified from other comprehensive income to net income in the statement(s) where the components of net income and the components of other comprehensive income are presented. The amendments in this update should be applied retrospectively and are effective for fiscal years, and interim periods within those years, beginning after December 15, 2011. The Company is currently assessing the effect that the adoption of this pronouncement will have on its financial statements.
In September 2011, FASB issued ASU No. 2011-08, Intangibles-Goodwill and Other (ASC Topic 350): Testing Goodwill for Impairment, to simplify how entities test goodwill for impairment. ASU No. 2011-08 allows entities to first assess qualitative factors to determine whether it is more likely than not that the fair value of a reporting unit is less than its carrying amount. If greater than 50 percent likelihood exists that the fair value is less than the carrying amount then a two-step goodwill impairment test as described in Topic 350 must be performed. The guidance provided by this update becomes effective for annual and interim goodwill impairment tests performed for fiscal years beginning after December 15, 2011. Early adoption is permitted, including for annual and interim goodwill impairment tests performed as of a date before September 15, 2011. The Company does not intend to adopt this ASU No. 2011-08 before September 15, 2011, and does not expect it to have a material impact on the Company’s consolidated financial position and results of operations.
- 30 -
Off-Balance Sheet Arrangements
We do not have any off-balance arrangements.
Item 7A. QUANTITATIVE AND QUALITATIVE DISCLOSURE ABOUT MARKET RISK
Not applicable.
Item 8. FINANCIAL STATEMENTS AND SUPPLEMENTARY FINANCIAL DATA
The full text of our audited consolidated financial statements as of December 31, 2011 begins on page F-2 of this Annual Report on Form 10-K.
Item 9. CHANGES IN AND DISAGREEMENTS WITH ACCOUNTANTS ON ACCOUNTING AND FINANCIAL DISCLOSURE.
None.
Item 9A CONTROLS AND PROCEDURES.
Disclosure Controls and Procedures
We maintain disclosure controls and procedures (as defined in Rule 13a-15(e) under the Exchange Act) that are designed to ensure that information that would be required to be disclosed in Exchange Act reports is recorded, processed, summarized and reported within the time period specified in the SEC’s rules and forms, and that such information is accumulated and communicated to our management, including to our Chief Executive Officer and Chief Financial Officer, as appropriate, to allow timely decisions regarding required disclosure.
As required by Rule 13a-15 under the Exchange Act, our management, including our Chief Executive Officer and Chief Financial Officer, evaluated the effectiveness of the design and operation of our disclosure controls and procedures as of December 31, 2011. Based on that evaluation, our Chief Executive Officer and Chief Financial Officer concluded that as of December 31, 2011, and as of the date that the evaluation of the effectiveness of our disclosure controls and procedures was completed, our disclosure controls and procedures were not effective due to the material weakness in our internal control over financial reporting described below.
Internal Controls Over Financial Reporting
Management’s Annual Report on Internal Control over Financial Reporting.
Our management is responsible for establishing and maintaining adequate internal control over financial reporting, as such term is defined in Rule 13a-15(f) of the Exchange Act. Under the supervision and with the participation of our management, including our Chief Executive Officer and Chief Financial Officer, we conducted an evaluation of the effectiveness of our internal control over financial reporting based upon the framework in Internal Control—Integrated Framework issued by the Committee of Sponsoring Organizations of the Treadway Commission (COSO). Based on that evaluation, our management concluded that, as of December 31, 2011, our internal controls over financial reporting are effective.
Changes in Internal Controls over Financial Reporting.
During the fiscal year ended December 31, 2011, there were no changes in our internal control over financial reporting identified in connection with the evaluation performed during the fiscal year covered by this report that has materially affected, or is reasonably likely to materially affect, our internal control over financial reporting.
Inherent Limitations Over Internal Controls
Our internal control over financial reporting is designed to provide reasonable assurance regarding the reliability of financial reporting and the preparation of financial statements for external purposes in accordance with GAAP. Our internal control over financial reporting includes those policies and procedures that:
- 31 -
(i) pertain to the maintenance of records that, in reasonable detail, accurately and fairly reflect the transactions and dispositions of our assets;
(ii) provide reasonable assurance that transactions are recorded as necessary to permit preparation of financial statements in accordance with GAAP, and that our receipts and expenditures are being made only in accordance with authorizations of our management and directors; and
(iii) provide reasonable assurance regarding prevention or timely detection of unauthorized acquisition, use, or disposition of our assets that could have a material effect on the financial statements;
Management, including our Chief Executive Officer and Chief Financial Officer, does not expect that our internal controls will prevent or detect all errors and all fraud. A control system, no matter how well designed and operated, can provide only reasonable, not absolute, assurance that the objectives of the control system are met. Further, the design of a control system must reflect the fact that there are resource constraints, and the benefits of controls must be considered relative to their costs. Because of the inherent limitations in all control systems, no evaluation of internal controls can provide absolute assurance that all control issues and instances of fraud, if any, have been detected. Also, any evaluation of the effectiveness of controls in future periods are subject to the risk that those internal controls may become inadequate because of changes in business conditions, or that the degree of compliance with the policies or procedures may deteriorate.
Attestation Report
This annual report does not include an attestation report of our independent registered public accounting firm regarding internal control over financial reporting. Management’s report was not subject to attestation by our registered public accounting firm pursuant to temporary rules of the Securities and Exchange Commission that permit us to provide only management’s report in this annual report.
Item 9B OTHER INFORMATION.
The final voting results of each of the matters submitted to a vote of security holders during the Company’s annual meeting of shareholders held on November 17, 2011 were as follows:
1. Election of Directors:
| For | Withheld | |
| Si Chen | 23,734,426 | 131,088 |
| Yundong Lu | 23,729,631 | 135,833 |
| Maoquan Wei | 23,733,426 | 132,088 |
| Dekai Yin | 23,736,731 | 128,783 |
| Yongjun Li | 23,732,731 | 132,783 |
| Tad M. Ballantyne | 23,734,951 | 130,563 |
2. Ratification of Samuel H. Wong & Co., LLP as registered pubic accountants:
| For | Against | Abstain | Broker Non-Votes |
| 25,284,332 | 3,238,605 | 8,716 | - |
- 32 -
PART III
ITEM 10. DIRECTORS, EXECUTIVE OFFICERS AND CORPORATE GOVERNANCE
Directors
The following table sets forth the name, age and position of each of our current directors as well as the date that each officer began their service as a director.
| Name | Age | Position | Director Since |
| Si Chen | 49 | Chairman, Chief Executive Officer, President and Director | 2007 |
| Yundong Lu | 37 | Chief Operating Officer and Director | 2008 |
| Maoquan Wei | 65 | Director | 2008 |
| Dekai Yin | 59 | Director | 2009 |
| Yongjun Li | 50 | Director | 2009 |
| Tad M. Ballantyne | 57 | Director | 2009 |
MR. SI CHEN. Mr. Chen became our chief executive officer and director in May 2007 upon the completion of our recapitalization, and was also appointed our president in September 2009. Mr. Chen founded Shandong Lorain, our first subsidiary, in 1994, and served as the chairman of our subsidiaries since that time. Mr. Chen earned an associate degree from Linyi Normal University. Mr. Chen has been our Company’s founder and Chairman and Chief Executive Officer since inception. He is the individual most familiar with our business and industry, including the regulatory structure and other industry-specific matters, as well as being most capable of effectively identifying strategic priorities and leading the discussion and execution of strategy.
MR. YUNDONG LU. Mr. Lu was appointed as our Chief Operating Officer and was elected as a member of our board of directors effective August 1, 2008. Mr. Lu joined the Company in 1994 and has held various positions since then. From April 2003 to May 2005, Mr. Lu was the General Manager of Beijing Lorain and the Deputy General Manager of our subsidiaries. From May 2005 to February 2007, Mr. Lu was the General Manager of Lorain International Trading and the Deputy General Manager of our subsidiaries. From February to August 2008, Mr. Lu was the General Manager of our subsidiaries. Mr. Lu was recognized as an Outstanding Entrepreneur in Shandong Province in 2007. Mr. Lu earned an MBA from Shandong University and a Bachelor of Arts degree from Shandong University. Mr. Lu, has been our Company’s Chief Operating Officer since 2008 and he has worked with our Company since 1994. Because of his tenure with the Company, he is familiar with our business and industry, including the regulatory structure and other industry-specific matters.
MR. MAOQUAN WEI. Mr. Wei, who has served as a member of our board of directors since 2008, is a retired government official who held various positions in the government of Junan County, Shandong Province, China from 1990 to 2003, during which time Mr. Wei was responsible for overseeing the agricultural development of Junan County in the Shandong Province of China. Most recently, from 1998 to 2003, Mr. Wei was the Chairman of the Political Conservative Conference of Junan County. Mr. Wei also served as the Deputy Secretary of County Committee and Deputy Chairman of Junan County. Mr. Wei has helped lead Junan County to win numerous honors, including Top 100 National Fruit Products County and National Chestnut Base County. Although retired, Mr. Wei’s expertise and experience with the agricultural economy and resources in the countryside is invaluable to our business.
MR. DEKAI YIN. Mr. Yin was appointed one of our directors in September 2009. He has been working as the President of Zibo branch of the Agricultural Bank of China since 2004. Before that position, Mr. Yin served as the Vice President and the President at Linyi branch of the Agricultural Bank of China from 1995-2004. Mr. Yin has a degree in economic management and is regarded as a senior economist due to his distinguished expertise in the banking and accounting industries and economic development. Our company greatly benefits from Mr. Yin’s invaluable expertise in banking and accounting systems and operations.
MR. YONGJUN LI. Mr. Li was appointed one of our directors in September 2009. He has been working as the County Governor Assistant of Miyun County, the General Manager of Beijing Economic Development Zone Headquarters, and the Director of Beijing Economic Development Zone Managing Committee since 1997. Mr. Li is an economist with advanced expertise in economic and industrial development. Mr. Li also has advanced experience and expertise in supply chain and strategic marketing as an adviser and consultant to companies in the economic development zone. The company significantly benefits from Mr. Li’s outstanding economics and industry knowledge of the operations in China.
- 33 -
MR. TAD M. BALLANTYNE. Mr.Ballantyne was appointed one of our directors in September 2009. He is also an officer and director of several private and public companies, including BR Industries, Inc, Hoopeston Foods, Inc, Thomsen Group, LLC, and Pacific Rim Foods Ltd. He also serves as an independent director and financial expert on the audit committee of Life Partners Holdings Inc. and Creat Resources Holdings Ltd., as an independent director of Mach One Corporation and CMH Development, LLC, and is an adviser of international affairs and/or director of a number of China-based private enterprises, including TCIB Investment Co. Ltd, Jilin Jimei Foods Ltd and Creat Group. During 2003, Texas Steel Partners Inc, a Texas based steel foundry, filed for reorganization and was liquidated pursuant to a bankruptcy Chapter 7 conversion. Mr. Ballantyne was an officer and director and a 50% shareholder of Texas Steel Partners Inc. During the last 20 years, Mr. Ballantyne has been active in acquiring and operating troubled companies or assets being divested by public and private companies and has focused over the last 5 years on food processing plants in both the United States and Asia. He holds a Bachelor of Science degree in business management from the University of Wisconsin-Parkside. Our Company greatly benefits from Mr. Ballantyne’s experience as an officer and director of other public and private companies, including companies in the food industry in the United States and Asia.
There are no arrangements or understandings between any of our directors and any other person pursuant to which any director was selected to serve as a director of our company. Directors are elected until their successors are duly elected and qualified. There are no family relationships among our directors or officers.
Executive Officers
Our executive officers are appointed by our Board and serve at their discretion. The following table sets forth the name, age and position of each of our current executive officers as well as the date that each officer began their service as an executive officer.
| Name | Age | Position | Executive Officer Since |
| Si Chen | 49 | Chairman, Chief Executive Officer, President and Director | 2007 |
| David She | 28 | Chief Financial Officer | 2010 |
| Yundong Lu | 37 | Chief Operating Officer and Director | 2008 |
See the section entitled “Directors” above for information on Messrs. Chen and Lu.
MR. DAVID SHE. Mr. David She became our chief financial officer on December 10, 2010. Prior to his appointment, Mr. She held various positions, and most lately as Chief Financial Officer, at China Natural Gas, Inc. from 2008 to 2010, where he oversaw financial operations and managed the company's financial growth. His duties included the oversight of quarterly and annual filings with the U.S. Securities and Exchange Commission, evaluating and executing financing alternatives, and managing the investor relations program. Mr. She also served as a securities analyst for West China Securities in Beijing in 2006. He received bachelor's degrees in mathematics and business administration from Beijing Institute of Technology as well as a master's degree in finance from the State University of New York in Buffalo.
There are no arrangements or understandings between any of our executive officers and any other person pursuant to which any executive officer was selected to serve as an executive officer of our company.
Audit Committee
The Audit Committee assists our board in monitoring:
- our accounting, auditing, and financial reporting processes;
- the integrity of our financial statements;
- internal controls and procedures designed to promote our compliance with accounting standards and applicable laws and regulations; and
- the appointment and evaluation of the qualifications and independence of our independent auditors.
Dekai Yin, Yongjun Li, Tad M. Ballantye, and Maoquan Wei, all of whom are independent directors under SEC rules and the rules of NYSE Amex, are currently serving as members of the Audit Committee. Mr. Yin is the chairman of the Audit Committee and is our audit committee financial expert.
- 34 -
The Audit Committee has adopted a written charter, a copy of which is available on our website on the Corporate Governance page under the Investor link at http://www.americanlorain.com, and a printed copy of which is available to any shareholder requesting a copy by writing to: American Lorain Corporation, c/o Board of Director Office, Beihuan Zhong Road, Junan County, Shandong, People’s Republic of China, 276600
Shareholder Nominations for Director
Shareholders may propose candidates for board membership by writing to American Lorain Corporation, c/o Board of Director Office, Beihuan Zhong Road, Junan County, Shandong, People’s Republic of China, 276600. Any such proposal shall contain the name, holdings of our securities and contact information of the person making the nomination, the candidate's name, address and other contact information, any direct or indirect holdings of our securities by the nominee, any information required to be disclosed about directors under applicable securities laws and/or stock exchange requirements, information regarding related party transactions with our company and/or the stockholder submitting the nomination; any actual or potential conflicts of interest, the nominee's biographical data, current public and private company affiliations, employment history and qualifications and status as "independent" under applicable securities laws and stock exchange requirements. Nominees proposed by stockholders will receive the same consideration as other nominees.
Section 16(a) Beneficial Ownership Reporting Compliance
Section 16(a) of the Exchange Act requires our executive officers, directors and persons who beneficially own more than 10% of our common stock to file initial reports of ownership and reports of changes in ownership with the Securities and Exchange Commission, which we also refer to throughout this report as the SEC. Based solely on our review of the copies of such forms furnished to us and written representations from our executive officers, directors and such beneficial owners, we believe that all filing requirements of Section 16(a) of the Exchange Act were timely complied with during the fiscal year ended December 31, 2011, except that David She has not yet filed a Form 3 in connection with his becoming a Section 16 filer.
Code of Ethics
Our Board adopted a Code of Ethics that applies to all of our directors, executive officers, including our principal executive officer, principal financial officer and principal accounting officer, and employees. The Code of Ethics addresses, among other things, honesty and ethical conduct, conflicts of interest, compliance with laws, regulations and policies, including disclosure requirements under the federal securities laws, confidentiality, trading on inside information, and reporting of violations of the code. The Code of Ethics is available on the Corporate Governance page of our website under the Investor link at www.americanlorain.com, and a copy of the Code of Ethics is available to any shareholder requesting a copy by writing to: American Lorain Corporation, c/o Board of Director Office, Beihuan Zhong Road, Junan County, Shandong, China 276600. We intend to disclose on our website, in accordance with all applicable laws and regulations, amendments to, or waivers from, our Code of Ethics.
ITEM 11. EXECUTIVE COMPENSATION
Summary Compensation Table
The following table sets forth information concerning all compensation earned by our named executive officers in 2009, 2010 and 2011 for services provided to us and our subsidiaries. None of our current executive officers earned compensation that exceeded $100,000 in 2009, 2010 or 2011.
| Name and | All Other | |||||
| Principal | Salary | Stock Awards | Option Awards | Compensation | Total | |
| Position | Year | ($) | ($) (1) | ($) (2) | ($) (3) | ($) |
| Si Chen Chief Executive Officer |
2009 2010 2011 |
66,000 66,000 |
- - |
- - |
- - |
66,000 66,000 |
| David She Chief Financial Officer | 2011 | 72,727 | 72,727 |
- 35 -
| (1) |
This column represents the fair value of the stock award on the grant date determined in accordance with the provisions of ASC 718. See Note 18 to the financial statements included in our original Form 10-K for the year ended December 31, 2011 for the assumptions made in the valuation of these awards. |
| (2) |
This column represents the fair value of the stock option on the grant date determined in accordance with the provisions of ASC 718. See Note 18 to the financial statements included in our original Form 10-K for the year ended December 31, 2011 for the assumptions made in the valuation of this award. |
Pursuant to Mr. Chen’s employment agreement, we paid Mr. Chen a base salary of $66,000 in cash in 2009, 2010 and 2011. Mr. Chen’s employment agreement does not provide any change in control or severance benefits and we do not have any separate change-in-control agreements with Mr. Chen or any of our other executive officers.
Pursuant to Mr. She’s employment agreement, dated October 22, 2010, we are obligated to pay Mr. She a base salary of $72,727 for the first year of employment and $90,909 for the second year of employment. Mr. She’s employment agreement does not provide any change -in -control or severance benefits.
Outstanding Equity Awards at Fiscal Year End
| Option Awards | Stock Awards | |||||
| Name (a) |
Number of Securities Underlying Unexercised Options (#) Exercisable (b) |
Number of Securities Underlying Unexercised Options (#) Unexercisable (c) (1) |
Option Exercise Price ($) (e) |
Option Expiration Date (f) |
Number of Shares or Units of Stock That Have Not Vested
(#) (g) |
Market Value of Shares or Units of Stock That Have Not Vested
($) (h) |
| YundongLu | 22,387 | 11,193 | $1.58 | 7/27/14 | ||
| (1) |
Options vest 33% per year over 3 years from date of grant. |
Pursuant to our 2009 Incentive Stock Plan, if an employee is
terminated for any reason other than disability or death, then the employee
shall have the right to exercise the portions of any option which was
exercisable as of the date of such termination, in whole or in part, not less
than 30 days nor more than three months after such termination. However, in the
event of "termination for good cause," the options shall
automatically terminate as of the termination of employment.
With respect to nonstatutory options granted to employees, directors or consultants, the Board may specify such period for exercise as the Board deems reasonable and appropriate, not less than 30 days following termination of employment or services (except that in the case of "termination for cause" or removal of a director, the option shall automatically terminate as of the termination of employment or services). The option may be exercised only with respect to installments that the optionee could have exercised at the date of termination of employment or services.
If an optionee dies while employed by, engaged as a consultant to, or serving as a director of the company, the portion of such optionee's option which was exercisable at the date of death may be exercised, in whole or in part, by the estate of the decedent or by a person succeeding to the right to exercise such option at any time within (i) a period, as determined by the Board, of not less than six months nor more than one year after the optionee's death or (ii) during the remaining term of the option, whichever is the lesser. The option may be so exercised only with respect to installments exercisable at the time of optionee's death and not previously exercised by the optionee.
Director Compensation
- 36 -
On August 1, 2008, Mr. Hao Chen, Mr. David Yaudoon Chiang and Mr. Maoquan Wei were appointed as independent members of our Board and as members of our Board committees. On September 17, 2009, Mr. Chiang and Mr. Hao Chen resigned from the Board. Mr. Hao Chen was paid RMB 100,000 (approximately US $14,641) per year for his Board and Board committee service. Mr. Chiang was paid US $25,000 per year plus US $5,000 for each board meeting attended by Mr. Chiang, as compensation for his Board and Board committee service. Mr. Wei is paid RMB 100,000 (approximately US $14,641) per year. In addition, in 2009 we granted stock options and stock awards to Messrs. Hao Chen, Chiang and Wei under our 2009 Incentive Stock Option Plan, as set forth in the table below.
On September 17, 2009, Messrs. Dekai Yin, Yongjun Li and Tad Ballantyne were appointed as independent members of our Board and as members of our Board committees. Messrs. Yin, Li and Ballantyne are paid RMB 100,000 (approximately US $15,493) per year.
We may reimburse our non-employee directors for reasonable travel expenses related to attendance at board or board committee meetings. In 2011, we did not make any such reimbursements.
Our policy is not to pay compensation to directors who are also employees of the Company or its subsidiaries. As a result, Mr. Si Chen and Mr. Yundong Lu did not receive any compensation in 2011 for their service as directors.
The following table reflects the compensation earned by our directors in 2011:
| Name | Fees Earned or Paid in Cash ($) | Stock Awards ($) |
Option Awards ($) |
All Other Compensation ($) |
Total ($) |
| Maoquan Wei | 15,493 | - | - | - | 15,493 |
| Dekai Yin | 15,493 | - | - | - | 15,493 |
| Yongjun Li | 15,493 | - | - | - | 15,493 |
| Tad Ballantyne | 15,493 | - | - | - | 15,493 |
ITEM 12. SECURITY OWNERSHIP OF CERTAIN BENEFICIAL OWNERS AND
MANAGEMENT AND RELATED STOCKHOLDER MATTERS.
Securities Authorized for Issuance Under Equity Compensation Plans
Please see Part II, Item 5 above for a tabular representation of our equity compensation plan.
Security Ownership of Certain Beneficial Owners and Management
The following table sets forth information regarding beneficial ownership of our common stock as of March 30, 2012 (i) by each person who is known by us to beneficially own more than 5% of our common stock; (ii) by each of our named executive officers and directors and (iii) by all of our officers and directors as a group. Beneficial ownership is determined in accordance with the rules of the SEC that deem shares to be beneficially owned by any person who has voting or investment power with respect to such shares. Except as otherwise indicated, the persons listed below have advised us that they have direct sole voting and investment power with respect to the shares listed as owned by them.
Unless otherwise specified, the address of each of the persons set forth below is c/o American Lorain Corporation, Beihuan Zhong Road, Junan County, Shandong, China 276600.
In the table below, percentage ownership is based on 34, 507,874 shares of our common stock outstanding as of March 30, 2012.
| Name and title of beneficial owner | Amount and nature of beneficial | Percent of class |
| ownership | ||
| Mr. Si Chen, Chairman, CEO and President | 16,050,785 | 46.5% |
| Jayhawk Capital Management (1) | 3,297,866 | 9.6% |
| Tongley Investments Ltd. (2) | 3,000,000 | 8.7% |
| Guerilla Capital Management (3) | 2,824,828 | 8.2% |
| Mr. Yundong Lu, COO and Director | 34,307 | * |
| Mr. Dekai Yin, Director | - | * |
| Mr. Yongjun Li, Director | - | * |
| Mr. Tad M. Ballantyne, Director | - | * |
| Mr. Maoquan Wei, Director | 8,234 | * |
| All officers and directors as a group (7 persons) | 16,093,326 | 46.6% |
- 37 -
* Less than 1%
(1) Based on information supplied by Jayhawk Capital Management, LLC, Jayhawk Private Equity Fund, L.P., Jayhawk Private Equity Co-Invest Fund, L.P., Jayhawk Private Equity GP, L.P., and Kent C. McCarthy in a Schedule 13G/A filed with the SEC on February 14, 2012. Jayhawk Private Equity GP, L.P., Jayhawk Capital Management, L.L.C. and Kent C. McCarthy have shared power to vote or to dispose of 3,297,866 shares. Jayhawk Private Equity Fund, L.P. has shared power to vote or dispose of 3,092,595 shares. Jayhawk Private Equity Co-Invest Fund, L.P. has shared power to vote or dispose of 205,271 shares.
(2) Based on information supplied by Tongley Investment Ltd. in a Schedule 13G filed with the SEC on February 14, 2011. The address of Tongley Investment Ltd. is P.O. Box 957, Offshore Incorporations Centre, Road Town, Tortola, British Virgin Islands.
(3) Based on information supplied by Guerilla Capital Management, LLC, Peter Siris, Leigh S. Curry and Hua-Mei 21st Century Partners, LP in a Schedule 13G/A filed with the SEC on February 14, 2012. The address of each of these entities is 237 Park Avenue, 9th Floor, New York, New York 10017. Guerilla Capital Management, LLC, Peter Siris and Leigh S. Curry have shared power to vote or to dispose of 2,824,828 shares. Hua-Mei 21st Century Partners, LP has shared power to vote or to dispose of 1,828,350 shares.
ITEM 13. CERTAIN RELATIONSHIPS AND RELATED TRANSACTIONS, AND
DIRECTOR INDEPENDENCE.
Related Party Transactions
Since January 1, 2008, there have been no transactions between members of management, five percent stockholders, affiliates, promoters or finders.
Director Independence
Our board has determined that Messrs. Yin, Li, Ballantyne and Wei satisfy the criteria for independence under NYSE Amex and SEC rules for independence of directors and of committee members.
ITEM 14. PRINCIPAL ACCOUNTING FEES AND
SERVICES.
Audit Fees. We paid aggregate fees of approximately $138,500 and $125,000 for each of the fiscal years ended December 31, 2011 and December 31, 2010, respectively, to Samuel H. Wong & Co., LLP for professional services rendered by such firm for the audit and review of the financial statements included in our annual report on Form 10-K and for the review of the financial statements included in our quarterly reports on Form 10-Q.
Audit-Related Fees. We paid aggregate fees to Samuel H. Wong & Co., LLP of approximately $2,831 and $5,456 for the fiscal year ended December 31, 2011 and 2010 for travel expenses, respectively.
Tax Fees. We paid aggregate fees of approximately $5,000 for each of the fiscal years ended December 31, 2011 and December 31, 2010 to Samuel H. Wong & Co., LLP for professional services rendered for tax compliance, tax advice and tax planning.
Board of Directors Pre-Approval Policies and Procedures
- 38 -
The Audit Committee has the sole authority to review in advance
and grant any pre–approvals of (i) all auditing services to be provided by the
independent auditor, (ii) all significant non–audit services to be provided by
the independent auditors as permitted by Section 10A of the Exchange
Act, and (iii) all fees and the terms of engagement with
respect to such services, except that the Audit Committee may delegate the
authority to pre–approve non–audit services to one or more of its committee
members who will present its decisions to the full Audit Committee at the first
meeting following such decision. Following the Company’s establishment of an
Audit Committee on August 1, 2008, all audit and non–audit services performed by
Samuel H. Wong & Co., LLP during fiscal 2010 and 2011 were pre–approved
pursuant to the procedures outlined above. Prior to the establishment of the
Audit Committee, all services of the independent auditors were approved by the
full board of directors.
PART IV
Item 15. EXHIBITS, FINANCIAL STATEMENT SCHEDULES
1. The financial statements contained in the “Audited Financial Statements” beginning on page F-2 of this Annual Report on Form 10-K.
3. Exhibits
- 39 -
| Exhibit No. | Description |
| 3.1 | Restated Certificate of Incorporation of the registrant as filed with the Secretary of State of Delaware. Incorporated by reference to Exhibit 3.1 to the registrant’s current report on Form 8-K filed on May 9, 2007. |
| 3.2 | Bylaws of the registrant, adopted on March 31, 2000. Incorporated by reference to Exhibit 3.2 to the registrant’s registration statement on Form 10SB12G filed on October 19, 2001. |
| 4.1 | Certificate of Designation of Series A Voting Convertible Preferred Stock of the registrant as filed with the Secretary of State of Delaware on April 9, 2007. Incorporated by reference to Exhibit 4.1 to the registrant’s current report on Form 8- K filed on May 9, 2007 in commission file number 0- 31619. |
| 4.2 | Certificate of Designation of Series B Voting Convertible Preferred Stock of registrant as filed with the Secretary of State of Delaware on April 30, 2007. Incorporated by reference to Exhibit 4.2 to the registrant’s current report on Form 8-K filed on May 9, 2007. |
| 4.3 | Form of Series A Warrant. Incorporated by reference to Exhibit 4.1 to the registrant’s current report on Form 8-K filed on October 29, 2009. |
| 4.4 | Form of Series B Warrant. Incorporated by reference to Exhibit 4.2 to the registrant’s current report on Form 8-K filed on October 29, 2009. |
| 4.5 | Registration Rights Agreement, dated as of October 28, 2009. Incorporated by reference to Exhibit 4.3 to the registrant’s current report on Form 8-K filed on October 29, 2009. |
| 4.6 | Registration Rights Agreement, dated as of September 9, 2010, by and among American Lorain Corporation and the purchasers named therein. Incorporated by reference to Exhibit 99.3 to the registrant’s current report on Form 8-K filed on September 13, 2010. |
| 4.7 | Stockholder Agreement, dated as of September 9, 2010, by and among American Lorain Corporation, the purchasers named therein and Si Chen. Incorporated by reference to Exhibit 99.4 to the registrant’s current report on Form 8-K filed on September 13, 2010. |
| 10.1 | Securities Purchase Agreement dated as of October 28, 2009, by and between American Loan Corporation and the purchasers named therein. Incorporated by reference to Exhibit 10.1 to the registrant’s current report on Form 8-K filed on October 29, 2009. |
| 10.2 | Securities Purchase Agreement dated as of September 9, 2010, by and among American Loan Corporation, Si Chen and the purchasers named therein. Incorporated by reference to Exhibit 99.1 to the registrant’s current report on Form 8-K filed on September 13, 2010. |
| 10.3 | Make Good Escrow Agreement, dated as of September 9, 2010, by and among American Lorain Corporation, the purchasers named therein, Si Chen and the collateral agent named therein. Incorporated by reference to Exhibit 99.2 to the registrant’s current report on Form 8-K filed on September 13, 2010. |
| 10.4 | Loan Agreement, dated May 31, 2010, between Junan Hongrun Foodstuff Co. Ltd. and DEG-Deutsche Investitions Und Entwicklungsgesellschaft MBH. Incorporated by reference to Exhibit 10.12 to the registrant’s quarterly report on Form 10-Q filed on August 11, 2010. |
| 10.5 | Employment Agreement by and between American Lorain Corporation and David She, dated October 22, 2010* |
| 14 | Business Ethics Policy and Code of Conduct, adopted on April 30, 2007. Incorporated by reference to Exhibit 14 to the registrant’s current report on Form 8-K filed on May 9, 2007. |
| 21 | List of subsidiaries of the registrant. * |
| 23.1 | Consent of Samuel H. Wong & Co., LLP * |
| 31.1 | Certification of Chief Executive Officer, pursuant to Section 302 of the Sarbanes-Oxley Act of 2002 * |
| 31.2 | Certification of Chief Financial Officer, pursuant to Section 302 of the Sarbanes-Oxley Act of 2002 * |
| 32.1 | Certification of Chief Executive Officer, pursuant to 18 U.S.C. Section 1350, as adopted pursuant to Section 906 of the Sarbanes-Oxley Act of 2002 * |
| 32.2 | Certification of Chief Financial Officer, pursuant to 18 U.S.C. Section 1350, as adopted pursuant to Section 906 of the Sarbanes-Oxley Act of 2002 * |
* Filed herewith
- 40 -
SIGNATURES
Pursuant to the requirements of Section 13 or 15(d) of the Securities Exchange Act of 1934, the registrant has duly caused this report to be signed on its behalf by the undersigned, thereunto duly authorized.
| AMERICAN LORAIN CORPORATION | |
| By:/s/ Si Chen | |
| March 30, 2012 | Si Chen |
| (Date Signed) | President, Director and Chief Executive |
| Officer |
Pursuant to the requirements of the Securities Exchange Act of 1934, this annual report has been signed by the following persons in the capacities and on the dates indicated.
| Signature | Title | Date |
| President , Director and Chief | March 30, 2012 | |
| Executive Officer | ||
| /s/ Si Chen | (Principal Executive Officer) | |
| Si Chen | ||
| Chief Financial Officer | ||
| (Principal Financial Officer and | ||
| Principal | ||
| /s/ David She | Accounting Officer) | March 30, 2012 |
| David She | ||
| /s/ Yundong Lu | Chief Operating Officer and Director | March 30, 2012 |
| Yundong Lu | ||
| /s/ Dekai Yin | Director | March 30, 2012 |
| Dekai Yin | ||
| /s/ Yongjun Li | Director | March 30, 2012 |
| Yongjun Li | ||
| /s/ Maoquan Wei | Director | March 30, 2012 |
| Maoquan Wei | ||
| /s/ Tad M. Ballantyne | Director | March 30, 2012 |
| Tad M. Ballantyne |
- 41 -
AMERICAN LORAIN CORPORATION
AUDITED FINANCIAL STATEMENTS
DECEMBER 31, 2011 AND 2010
(Stated in US Dollars)
AMERICAN LORAIN CORPORATION
| CONTENTS | PAGES |
| REPORT OF INDEPENDENT REGISTERED PUBLIC ACCOUNTING FIRM | 1 |
| CONSOLIDATED BALANCE SHEETS | 2 – 3 |
| CONSOLIDATED STATEMENTS OF INCOME | 4 |
| CONSOLIDATED STATEMENTS OF CASH FLOWS | 5 – 6 |
| CONSOLIDATED STATEMENTS OF STOCKHOLDER’S EQUITY | 7 |
| NOTES TO CONSOLIDATED FINANCIAL STATEMENTS | 8 – 29 |
REPORT OF REGISTERED INDEPENDENT PUBLIC ACCOUNTING FIRM
| To: | The Board of Directors and Stockholders of |
| American Lorain Corporation |
We have audited the accompanying consolidated balance sheets of American Lorain Corporation as of December 31, 2011 and 2010 and the related consolidated statements of income, stockholders’ equity and cash flows for the years then ended. These consolidated financial statements are the responsibility of the Company’s management. Our responsibility is to express an opinion on these consolidated financial statements based on our audits.
We conducted our audits in accordance with the standards of the Public Company Accounting Oversight Board (United States). Those standards require that we plan and perform the audit to obtain reasonable assurance about whether the consolidated financial statements are free of material misstatement. An audit includes examining, on a test basis, evidence supporting the amounts and disclosures in the financial statements. An audit also includes assessing the accounting principles used and significant estimates made by management, as well as evaluating the overall financial statement presentation. We believe that our audits provide a reasonable basis for our opinion.
In our opinion, the consolidated financial statements referred to above present fairly, in all material respects, the financial position of American Lorain Corporation as of December 31, 2011 and 2010 and the results of its operations and its cash flows for the years then ended in conformity with accounting principles generally accepted in the United States of America.
| San Mateo, California | Samuel H. Wong & Co., LLP |
| March 22, 2012 | Certified Public Accountants |
AMERICAN LORAIN CORPORATION
CONSOLIDATED BALANCE
SHEETS
AT DECEMBER 31, 2011 AND 2010
(Stated in US
Dollars)
|
|
Note | At December 31, | At December 31, | ||||||
|
|
2011 | 2010 | |||||||
|
ASSETS |
|||||||||
|
Current assets |
|||||||||
|
Cash and cash equivalents |
2(d) | $ | 17,353,494 | $ | 12,730,626 | ||||
|
Restricted cash |
3 | 13,017,371 | 2,308,898 | ||||||
|
Short-term investment |
- | 9,447,585 | |||||||
|
Trade accounts receivable |
4 | 41,469,880 | 33,226,612 | ||||||
|
Other receivables |
5 | 6,147,550 | 1,492,850 | ||||||
|
Inventory |
6 | 34,348,997 | 29,807,198 | ||||||
|
Advance to suppliers |
15,772,736 | 7,744,976 | |||||||
|
Prepaid expenses and taxes |
132,710 | 434,061 | |||||||
|
Deferred tax asset |
164,394 | 103,713 | |||||||
|
Security deposits and other Assets |
16,373 | 693,858 | |||||||
|
Total current assets |
$ | 128,423,505 | $ | 97,990,377 | |||||
|
|
|||||||||
|
Non-current assets |
|||||||||
|
Investment |
472,270 | ||||||||
|
Property, plant and equipment, net |
7 | 84,377,306 | 72,095,007 | ||||||
|
Land use rights, net |
8 | 5,425,252 | 4,877,438 | ||||||
|
Deposit |
- | 20,297 | |||||||
|
TOTAL ASSETS |
$ | 218,698,333 | $ | 174,983,119 | |||||
|
|
|||||||||
|
LIABILITIES AND STOCKHOLDERS’ EQUITY |
|||||||||
|
Current liabilities |
|||||||||
|
Short-term bank loans |
9 | $ | 36,018,450 | $ | 25,164,469 | ||||
|
Long-term debt – current portion |
13 | 57,066 | 218,935 | ||||||
|
Notes payable |
10 | - | 4,249,977 | ||||||
|
Accounts payable |
3,900,317 | 6,284,532 | |||||||
|
Taxes payable |
11 | 4,237,142 | 3,266,502 | ||||||
|
Accrued liabilities and other payables |
12 | 1,938,759 | 1,335,947 | ||||||
|
Customers deposits |
- | 89,370 | |||||||
|
Total current liabilities |
$ | 46,151,734 | $ | 40,609,732 | |||||
|
|
|||||||||
|
Long-term liabilities |
|||||||||
|
Long-term bank loans |
13 | 15,597,831 | 5,030,930 | ||||||
|
|
|||||||||
|
TOTAL LIABILITIES |
$ | 61,749,565 | $ | 45,640,662 |
See Accompanying Notes to the Financial Statements and Accountant’s Report
2
AMERICAN LORAIN CORPORATION
CONSOLIDATED BALANCE
SHEETS
AT DECEMBER 31, 2011 AND 2010
(Stated in US
Dollars)
|
|
At December 31, | At December 31, | |||||||
|
|
Note | 2011 | 2010 | ||||||
|
|
|||||||||
|
STOCKHOLDERS’ EQUITY |
|||||||||
|
Preferred Stock, $.001 par
value, 5,000,000 |
- | - | |||||||
|
|
|||||||||
|
Common stock, $0.001 par value,
200,000,000 shares |
14 | 34,508 | 34,420 | ||||||
|
Additional paid-in capital |
14 | 53,015,636 | 52,371,481 | ||||||
|
Statutory reserves |
2(r) | 13,976,899 | 11,340,739 | ||||||
|
Retained earnings |
65,939,713 | 48,688,375 | |||||||
|
Accumulated other comprehensive income |
15,353,885 | 9,475,745 | |||||||
|
Non-controlling interests |
15 | 8,628,127 | 7,431,697 | ||||||
|
|
|||||||||
|
TOTAL STOCKHOLDER’S EQUITY |
$ | 156,948,768 | $ | 129,342,457 | |||||
|
|
|||||||||
|
TOTAL LIABILITIES AND STOCKHOLDER’S EQUITY |
$ | 218,698,333 | $ | 174,983,119 |
See Accompanying Notes to the Financial Statements and Accountant’s Report
3
AMERICAN LORAIN CORPORATION
CONSOLIDATED
STATEMENTS OF INCOME AND COMPREHENSIVE INCOME
FOR YEARS ENDED
DECEMBER 31, 2011 AND 2010
(Stated in US Dollars)
|
|
December 31, | December 31, | |||||||
|
|
Note | 2011 | 2010 | ||||||
|
|
|||||||||
|
Net revenues |
2(t),16 | $ | 213,222,106 | $ | 184,176,567 | ||||
|
Cost of revenues |
(168,208,856 | ) | (142, 292,716 | ) | |||||
|
Gross profit |
$ | 45,013,250 | $ | 41,883,851 | |||||
|
|
|||||||||
|
Operating expenses |
|||||||||
|
Selling and marketing expenses |
(10,513,567 | ) | (8,559,003 | ) | |||||
|
General and administrative expenses |
(6,583,851 | ) | (5,807,074 | ) | |||||
|
|
(17,097,418 | ) | (14,366,077 | ) | |||||
|
|
|||||||||
|
Operating income |
$ | 27,915,832 | $ | 27,517,774 | |||||
|
|
|||||||||
|
Government subsidy income |
745,708 | 1,270,957 | |||||||
|
Interest income |
86,562 | 10,375 | |||||||
|
Other income |
21 | 2,449,950 | 1,047,234 | ||||||
|
Other expenses |
(733,179 | ) | (415,877 | ) | |||||
|
Interest expense |
(2,561,700 | ) | (4,351,714 | ) | |||||
|
|
|||||||||
|
Earnings before tax |
$ | 27,903,173 | $ | 25,078,749 | |||||
|
|
|||||||||
|
Income tax |
2(q),17 | (6,819,245 | ) | (5,830,472 | ) | ||||
|
|
|||||||||
|
Net income |
$ | 21,083,928 | $ | 19,248,277 | |||||
|
|
|||||||||
|
Other comprehensive income: |
|||||||||
|
Foreign currency translation gain |
5,972,198 | 3,994,293 | |||||||
|
Comprehensive Income |
27,056,126 | 23,242,570 | |||||||
|
Net income attributable to: |
|||||||||
|
|
|||||||||
|
-Common stockholders |
$ | 19,887,498 | $ | 17,839,463 | |||||
|
-Non-controlling interest |
1,196,430 | 1,408,814 | |||||||
|
|
$ | 21,083,928 | $ | 19,248,277 | |||||
|
|
|||||||||
|
Earnings per share |
2(u), 18 | ||||||||
|
- Basic |
$ | 0.58 | $ | 0.57 | |||||
|
- Diluted |
$ | 0.57 | $ | 0.55 | |||||
|
|
|||||||||
|
Weighted average shares outstanding |
|||||||||
|
- Basic |
34,445,972 | 31,507,044 | |||||||
|
- Diluted |
34,726,494 | 32,204,555 |
See Accompanying Notes to the Financial Statements and Accountant’s Report
4
AMERICAN LORAIN CORPORATION
CONSOLIDATED
STATEMENTS OF CASH FLOW
FOR YEARS ENDED DECEMBER 31, 2011 AND 2010
(Stated in US Dollars)
|
|
December 31, | December 31, | ||||
|
|
2011 | 2010 | ||||
|
Cash flows from operating activities |
||||||
|
Net income |
$ | 21,083,928 | $ | 19,248,277 | ||
|
Stock and share based compensation |
644,243 | 890,210 | ||||
|
Depreciation of fixed assets |
2,196,052 | 1,360,134 | ||||
|
Amortization of intangible assets |
155,754 | 144,611 | ||||
|
Write down of short-term investments |
(94,058 | ) | 587,117 | |||
|
Gain on acquisition of subsidiary |
- | (383,482 | ) | |||
|
(Increase)/decrease in accounts & other receivables |
(21,015,097 | ) | (2,541,158 | ) | ||
|
(Increase)/decrease in inventories |
(4,541,799 | ) | (2,812,751 | ) | ||
|
Decrease/(increase) in prepayment |
301,351 | 9,665,103 | ||||
|
Decrease/(increase) in deferred tax asset |
(60,681 | ) | 96,155 | |||
|
Increase/(decrease) in accounts and other payables |
(810,763 | ) | (1,816,937 | ) | ||
|
Net cash (used in)/provided by operating activities |
(2,141,070 | ) | 24,437,279 | |||
|
|
||||||
|
Cash flows from investing activities |
||||||
|
Shandong Greenpia acquisition net of cash acquired |
- | (1,695,315 | ) | |||
|
Purchase of plant and equipment |
(14,478,351 | ) | (17,566,907 | ) | ||
|
Payment of construction in progress |
- | (11,188,400 | ) | |||
|
(Increase)/decrease in restricted cash |
(10,708,473 | ) | (1,009,009 | ) | ||
|
Payments for the purchase of land use rights |
(703,569 | ) | (190,109 | ) | ||
|
Payments for security deposits |
697,783 | (698,067 | ) | |||
|
Purchase of long-term investment |
(472,270 | ) | (3,301,571 | ) | ||
|
Proceeds from sale of short-term investments |
9,447,585 | - | ||||
|
Net cash used in investing activities |
(16,217,295 | ) | (35,649,378 | ) | ||
|
Cash flows from financing activities |
||||||
|
Issuance of common stock |
- | 8,955,673 | ||||
|
Repayment of notes |
(4,249,977 | ) | - | |||
|
Proceeds from issuance of notes |
- | 4,249,977 | ||||
|
Proceeds from bank borrowings |
45,058,403 | 80,338,300 | ||||
|
Repayment of bank borrowings |
(34,366,292 | ) | (90,443,107 | ) | ||
|
Proceeds from long-term bank borrowings |
10,566,901 | 4,736,057 | ||||
|
Net cash provided by/(used in) financing activities |
$ | 17,009,035 | $ | 7,836,900 | ||
|
|
||||||
|
Net Increase/(decrease) of Cash and Cash Equivalents |
(1,349,330 | ) | (3,375,199 | ) | ||
|
Effect of foreign currency translation on cash and cash equivalents |
5,972,198 | 3,994,293 | ||||
|
|
||||||
|
Cash and cash equivalents–beginning of year |
12,730,626 | 12,111,532 | ||||
|
Cash and cash equivalents–end of year |
$ | 17,353,494 | $ | 12,730,626 |
See Accompanying Notes to the Financial Statements and Accountant’s Report
5
AMERICAN LORAIN CORPORATION
CONSOLIDATED
STATEMENTS OF CASH FLOW
FOR YEARS ENDED DECEMBER 31, 2011 AND 2010
(Stated in US Dollars)
|
Supplementary cash flow information: |
||||||
|
Interest received |
$ | 86,562 | $ | 10,375 | ||
|
Interest paid |
$ | 2,261,004 | $ | 4,457,597 | ||
|
Income taxes paid |
$ | 6,871,539 | $ | 5,157,436 |
See Accompanying Notes to the Financial Statements and Accountant’s Report
6
AMERICAN LORAIN
CORPORATION
CONSOLIDATED
STATEMENTS OF STOCKHOLDERS’ EQUITY
FOR YEARS ENDED DECEMBER
31, 2011 AND 2010
(STATED IN US DOLLARS)
|
|
Accumulated | |||||||||||||||||||||||
|
|
Number | Additional | Other | Non- | ||||||||||||||||||||
|
|
Of | Common | Paid-in | Statutory | Retained | Comprehensive | Controlling | |||||||||||||||||
|
|
Shares | Stock | Capital | Reserves | Earnings | Income | Interests | Total | ||||||||||||||||
|
|
||||||||||||||||||||||||
|
Balance, January 1, 2010 |
30,240,202 | $ | 30,240 | $ | 35,268,603 | $ | 8,895,477 | $ | 38,455,349 | $ | 6,068,569 | $ | 6,022,883 | $ | 94,741,121 | |||||||||
|
Issuance of share based compensation |
7,000 | 7 | 890,203 | - | - | - | - | 890,210 | ||||||||||||||||
|
Issuance of common stock for cash |
3,440,800 | 3,441 | 9,630,800 | - | - | - | - | 9,634,241 | ||||||||||||||||
|
Issuance cost of common stock |
- | - | (678,567 | ) | - | - | - | - | (678,567 | ) | ||||||||||||||
|
Appropriations to additional paid in capital |
- | - | 5,161,175 | - | (5,161,175 | ) | - | - | - | |||||||||||||||
|
Acquisition of Shandong Greenpia |
731,707 | 732 | 2,099,267 | - | - | - | - | 2,099,999 | ||||||||||||||||
|
Net income |
- | - | - | - | 19,248,277 | - | - | 19,248,277 | ||||||||||||||||
|
Appropriations to statutory reserves |
- | - | - | 2,445,262 | (2,445,262 | ) | - | - | - | |||||||||||||||
|
Allocation to non-controlling interests |
- | - | - | - | (1,408,814 | ) | - | 1,408,814 | - | |||||||||||||||
|
Unrealized gain (loss) on investment |
- | - | - | - | - | (587,117 | ) | - | (587,117 | ) | ||||||||||||||
|
Foreign currency translation adjustment |
- | - | - | - | - | 3,994,293 | - | 3,994,293 | ||||||||||||||||
|
Balance, December 31, 2010 |
34,419,709 | $ | 34,420 | $ | 52,371,481 | $ | 11,340,739 | $ | 48,688,375 | $ | 9,475,745 | $ | 7,431,697 | $ | 129,342,457 | |||||||||
|
|
||||||||||||||||||||||||
|
Balance, January 1, 2011 |
34,419,709 | $ | 34,420 | $ | 52,371,481 | $ | 11,340,739 | $ | 48,688,375 | $ | 9,475,745 | $ | 7,431,697 | $ | 129,342,457 | |||||||||
|
Issuance of share based compensation |
88,165 | 88 | 644,155 | - | - | - | - | 644,243 | ||||||||||||||||
|
Net income |
- | - | - | - | 21,083,928 | - | - | 21,083,928 | ||||||||||||||||
|
Appropriations to statutory reserves |
- | - | - | 2,636,160 | (2,636,160 | ) | - | - | - | |||||||||||||||
|
Allocation to non-controlling interests |
- | - | - | - | (1,196,430 | ) | - | 1,196,430 | - | |||||||||||||||
|
Unrealized gain (loss) on investment |
- | - | - | - | - | (94,058 | ) | - | (94,058 | ) | ||||||||||||||
|
Foreign currency translation adjustment |
- | - | - | - | - | 5,972,198 | - | 5,972,198 | ||||||||||||||||
|
|
||||||||||||||||||||||||
|
Balance, December 31, 2011 |
34,507,874 | 34,508 | 53,015,636 | 13,976,899 | 65,939,713 | 15,353,885 | 8,628,127 | 156,948,768 |
See Accompanying Notes to the Financial Statements and Accountant’s Report
7
AMERICAN LORAIN CORPORATION
NOTES TO CONSOLIDATED
FINANCIAL STATEMENTS
DECEMBER 31, 2011 AND 2010
(Stated in
US Dollars)
| 1. |
ORGANIZATION, BASIS OF PRESENTATION, AND PRINCIPAL ACTIVITIES | |
| (a) |
Organization history of American Lorain Corporation (formerly known as Millennium Quest, Inc.) | |
|
American Lorain Corporation (the “Company” or “ALN”) was originally a Delaware corporation incorporated on February 4, 1986. From inception through May 3, 2007, the Company did not engage in any active business operations other than in search and evaluation of potential business opportunity to become an acquiree of a reverse-merger deal. On May 3, 2007, the Company entered into a share exchange agreement as described under “Reverse-Merger” below. On November 12, 2009, the Company filed a statement of merger in the state of Nevada to transfer the Company’s jurisdiction from Delaware to Nevada. | ||
| (b) |
Organization History of International Lorain Holding Inc. and its subsidiaries | |
|
ALN owns 100% of the equity of International Lorain Holding Inc. (“ILH”). ILH is a Cayman Islands company incorporated on August 4, 2006 and was wholly-owned by Mr. Hisashi Akazawa until May 3, 2007. ILH presently has two direct wholly-owned subsidiaries, Junan Hongrun and Luotian Lorain, and three indirectly wholly-owned subsidiaries through Junan Hongrun, which are Beijing Lorain, Dongguan Lorain, and Shandong Greenpia Foodstuff Co., Ltd. (“Shandong Greenpia”). | ||
|
In addition, the Company directly and indirectly has 80.2% ownership of Shandong Lorain. The rest of the 19.8%, which is owned by the State under the name of Shandong Economic Development Investment Co. Ltd., is not included as a part of the Group. | ||
|
On April 9, 2009, the Company, through its Junan Hongrun subsidiary, invested cash to establish Dongguan Lorain. Dongguan Lorain is indirectly 100% beneficially owned by the Company. | ||
|
On June 28, 2010, the Company signed an equity transfer agreement with Shandong Greenpia. Shandong Greenpia was originally directly owned by Taebong Inc. and Shandong Luan Trade Company. The Company paid $2,100,000 to Korean Taebong Inc. for 50% equity of Shandong Greenpia on September 20, 2010. On September 23, 2010, the Company issued 731,707 shares of restricted stock at an agreed price of $2.87 per share to the owner of Shandong Luan Trade Company, Mr. Ji Zhenwei, for the remaining 50% equity of Shandong Greenpia. Since September 23, 2010, Shandong Greenpia was directly owned by both Junan Hongrun and ILH. As a result, Shandong Greenpia is 100% owned by the Company. Accordingly, the Company booked a gain of $383,482 which is included in the statement of income as other income. | ||
| (c) |
Reverse-Merger | |
|
On May 3, 2007, the Company entered into a share exchange agreement with ILH whereby the Company consummated its acquisition of ILH by issuance of 697,663 Series B voting convertible preferred shares to the shareholders of ILH in exchange of 5,099,503 ILH shares. Concurrently on May 3, 2007, the Company also entered into a securities purchase agreement with certain investors and Mr. Hisashi Akazawa and Mr. Si Chen (each a “beneficial owner”) whereby the Company issued 319,913 (after reverse-split at 32.84 from 10,508,643) common shares to its shareholders as consideration of the Company’s reverse-merger with Lorain. | ||
|
The share exchange transaction is sometimes referred to hereafter as the “reverse-merger transaction.” The share exchange transaction has been accounted for as a recapitalization of ALN where the Company (the legal acquirer) is considered the accounting acquiree and ILH (the acquiree) is considered the accounting acquirer. As a result of this transaction, the Company is deemed to be a continuation of the business of ILH. | ||
|
Accordingly, the accompanying consolidated financial statements are those of the accounting acquirer, ILH. The historical stockholders’ equity of the accounting acquirer prior to the share exchange has been retroactively restated as if the share exchange transaction occurred as of the beginning of the first period presented. See also Note 14 Capitalization. | ||
8
AMERICAN LORAIN CORPORATION
NOTES TO CONSOLIDATED
FINANCIAL STATEMENTS
DECEMBER 31, 2011 AND 2010
(Stated in
US Dollars)
| (d) |
Business Activities | |
|
The Company develops, manufactures, and sells convenience foods (including ready-to-cook (or RTC) foods; ready-to-eat (or RTE) foods and meals ready-to-eat (or MRE); chestnut products; and frozen foods, in hundreds of varieties. The Company operates through indirect Chinese subsidiaries. The products are sold in 26 provinces and administrative regions in China and 42 foreign countries. Food products are categorized into three types: (1) chestnut products, (2) convenience food, and (3) frozen food. |
| 2. |
SUMMARY OF SIGNIFICANT ACCOUNTING POLICIES | |
| (a) |
Method of Accounting | |
|
The Company maintains its general ledger and journals with the accrual method accounting for financial reporting purposes. The financial statements and notes are representations of management. Accounting policies adopted by the Company conform to generally accepted accounting principles in the United States of America and have been consistently applied in the presentation of financial statements, which are compiled on the accrual basis of accounting. | ||
|
The Company regrouped certain accounts in its presentation of changes in assets and liabilities in the statement of cash flows for the year ended December 31, 2011 in order to be consistent with the presentation provided for the year ended December 31, 2010. There was no impact in earnings for the regrouping. | ||
| (b) |
Principles of consolidation | |
|
The consolidated financial statements which include the Company and its subsidiaries are compiled in accordance with generally accepted accounting principles in the United States of America. All significant inter-company accounts and transactions have been eliminated. The consolidated financial statements include 100% of assets, liabilities, and net income or loss of those wholly-owned subsidiaries; ownership interests of minority investors are recorded as minority interests. | ||
As of December 31, 2011, the detailed identities of the consolidating subsidiaries are as follows:
| Place of | Attributable equity | Registered | ||||||||
| Name of Company | incorporation | interest % | capital | |||||||
| Shandong Lorain Co., Ltd | PRC | 80.2 | $ | 12,733,926 | ||||||
| Luotian Lorain Co., Ltd | PRC | 100 | 3,987,343 | |||||||
| Junan Hongrun Foodstuff Co., Ltd | PRC | 100 | 47,101,050 | |||||||
| Beijing Lorain Co., Ltd | PRC | 100 | 1,574,233 | |||||||
| Shandong Greenpia Foodstuff Co.,Ltd | PRC | 100 | 2,418,022 | |||||||
| Dongguan Lorain Co,,Ltd | PRC | 100 | 157,423 | |||||||
| International Lorain Holding Inc. | Cayman Islands | 100 | 48,988,162 |
| (c) |
Use of estimates | |
|
The preparation of the financial statements in conformity with generally accepted accounting principles in the United States of America requires management to make estimates and assumptions that affect the reported amounts of assets and liabilities and disclosure of contingent assets and liabilities at the date of the financial statements and the reported amounts of revenues and expenses during the reporting periods. Management makes these estimates using the best information available at the time the estimates are made; however actual results could differ materially from those estimates. |
9
AMERICAN LORAIN CORPORATION
NOTES TO CONSOLIDATED
FINANCIAL STATEMENTS
DECEMBER 31, 2011 AND 2010
(Stated in
US Dollars)
| (d) |
Cash and cash equivalents | |
|
The Company considers all highly liquid investments purchased with original maturities of three months or less to be cash equivalents. | ||
| (e) |
Investment securities | |
|
The Company classifies securities it holds for investment purposes into trading or available-for-sale. Trading securities are bought and held principally for the purpose of selling them in the near term. All securities not included in trading securities are classified as available-for-sale. | ||
|
Trading and available-for-sale securities are recorded at fair value. Unrealized holding gains and losses on trading securities are included in the net income. Unrealized holding gains and losses, net of the related tax effect, on available for sale securities are excluded from net income and are reported as a separate component of other comprehensive income until realized. Realized gains and losses from the sale of available-for-sale securities are determined on a specific-identification basis. | ||
|
A decline in the market value of any available-for-sale security below cost that is deemed to be other-than- temporary results in a reduction in carrying amount to fair value. The impairment is charged as an expense to the statement of income and comprehensive income and a new cost basis for the security is established. To determine whether impairment is other-than-temporary, the Company considers whether it has the ability and intent to hold the investment until a market price recovery and considers whether evidence indicating the cost of the investment is recoverable outweighs evidence to the contrary. Evidence considered in this assessment includes the reasons for the impairment, the severity and duration of the impairment, changes in value subsequent to year end, and forecasted performance of the investee. | ||
|
Premiums and discounts are amortized or accreted over the life of the related available-for-sale security as an adjustment to yield using the effective-interest method. Dividend and interest income are recognized when earned. | ||
| (f) |
Trade receivables | |
|
Trade receivables are recognized and carried at the original invoice amount less allowance for any uncollectible amounts. An estimate for doubtful accounts is made when collection of the full amount is no longer probable. Bad debts are written off as incurred. | ||
| (g) |
Inventories | |
|
Inventories consisting of finished goods and raw materials are stated at the lower of cost or market value. Finished goods are comprised of direct materials, direct labor and an appropriate proportion of overhead. | ||
| (h) |
Customer deposits and advances to suppliers | |
|
Customer deposits were received from customers in connection with orders of products to be delivered in future periods. | ||
|
Advance to suppliers is a good faith deposit paid to the supplier for the purpose of committing the supplier to provide product promptly upon delivery of the Company’s purchase order for raw materials, supplies, equipment, building materials etc. Pursuant to the Company’s arrangements with its suppliers, this deposit is generally 20% of the total amount contracted for. This type of transaction is classified as a prepayment category under the account name “Advance to Suppliers” until such time as the Company’s purchase order is delivered, at which point this account is reduced by reclassification of the applicable amount to the appropriate asset account such as inventory or fixed assets or construction in progress. |
10
AMERICAN LORAIN CORPORATION
NOTES TO CONSOLIDATED
FINANCIAL STATEMENTS
DECEMBER 31, 2011 AND 2010
(Stated in
US Dollars)
| (i) |
Property, plant and equipment | |
|
Plant and equipment are carried at cost less accumulated depreciation. Depreciation is provided over their estimated useful lives, using the straight-line method. Estimated useful lives of the plant and equipment are as follows: |
| Buildings | 40 years | |
| Landscaping, plant and tree | 30 years | |
| Machinery and equipment | 10 years | |
| Motor vehicles | 10 years | |
| Office equipment | 5 years |
|
The cost and related accumulated depreciation of assets sold or otherwise retired are eliminated from the accounts and any gain or loss is included in the statement of income. The cost of maintenance and repairs is charged to income as incurred, whereas significant renewals and betterments are capitalized. | ||
| (j) |
Construction in progress | |
|
Construction in progress represents direct and indirect construction or acquisition costs. The construction in progress is transferred to plant and equipment when substantially all the activities necessary to prepare the assets for their intended use are completed. No depreciation is provided until the asset is completed and ready for intended use. | ||
| (k) |
Land Use Rights | |
|
Land use rights are carried at cost and amortized on a straight-line basis over a specified period. Amortization is provided using the straight-line method over 40-50 years. | ||
| (l) |
Accounting for the Impairment of Long-Lived Assets | |
|
The long-lived assets held by the Company are reviewed in accordance with Financial Accounting Standards Board (“FASB”) Accounting Standards Codification (“ASC”) Subtopic 360-10-35, “Accounting for the Impairment or Disposal of Long-Lived Assets,” for impairment whenever events or changes in circumstances indicate that the carrying amount of assets may not be recoverable. It is reasonably possible that these assets could become impaired as a result of technology or other industry changes. Impairment is present if carrying amount of an asset is less than its undiscounted cash flows to be generated. | ||
|
If an asset is considered impaired, a loss is recognized based on the amount by which the carrying amount exceeds the fair market value of the asset. Assets to be disposed of are reported at the lower of the carrying amount or fair value less costs to sell. The Company believes no impairment has occurred to its assets during 2011 and 2010. | ||
| (m) |
Advertising | |
|
All advertising costs are expensed as incurred. | ||
| (n) |
Shipping and handling | |
|
All shipping and handling are expensed as incurred. | ||
| (o) |
Research and development | |
|
All research and development costs are expensed as incurred. |
11
AMERICAN LORAIN CORPORATION
NOTES TO CONSOLIDATED
FINANCIAL STATEMENTS
DECEMBER 31, 2011 AND 2010
(Stated in
US Dollars)
| (p) |
Retirement benefits | |
|
Retirement benefits in the form of contributions under defined contribution retirement plans to the relevant authorities are charged to the consolidated statement of income as incurred. | ||
| (q) |
Income taxes | |
|
The Company accounts for income tax using an asset and liability approach and allows for recognition of deferred tax benefits in future years. Under the asset and liability approach, deferred taxes are provided for the net tax effects of temporary differences between the carrying amounts of assets and liabilities for financial reporting purposes and the amounts used for income tax purposes. A valuation allowance is provided for deferred tax assets if it is more likely than not these items will either expire before the Company is able to realize their benefits, or that future realization is uncertain. | ||
|
The Company has implemented ASC Topic 740, “Accounting for Income Taxes.” Income tax liabilities computed according to the United States and People’s Republic of China (PRC) tax laws are provided for the tax effects of transactions reported in the financial statements and consists of taxes currently due plus deferred taxes related primarily to differences between the basis of fixed assets and intangible assets for financial and tax reporting. The deferred tax assets and liabilities represent the future tax return consequences of those differences, which will be either taxable or deductible when the assets and liabilities are recovered or settled. Deferred taxes also are recognized for operating losses that are available to offset future income taxes. A valuation allowance is created to evaluate deferred tax assets if it is more likely than not that these items will either expire before the Company is able to realize that tax benefit, or that future realization is uncertain. | ||
|
Effective January 1, 2008, PRC government implemented a new 25% tax rate across the board for all enterprises regardless of whether domestic or foreign enterprise without any tax holiday which is defined as "two-year exemption followed by three-year half exemption" hitherto enjoyed by tax payers. As a result of the new tax law of a standard 15% tax rate, tax holidays terminated as of December 31, 2007. However, PRC government has established a set of transition rules to allow enterprises already started tax holidays before January 1, 2008, to continue enjoying the tax holidays until being fully utilized. | ||
|
The Company is subject to United States Tax according to Internal Revenue Code Sections 951 and 957. Corporate income tax is imposed on progressive rates in the range of: - |
| Taxable Income | ||||
| Rate | Over | But Not Over | Of Amount Over | |
| 15% | 0 | 50,000 | 0 | |
| 25% | 50,000 | 75,000 | 50,000 | |
| 34% | 75,000 | 100,000 | 75,000 | |
| 39% | 100,000 | 335,000 | 100,000 | |
| 34% | 335,000 | 10,000,000 | 335,000 | |
| 35% | 10,000,000 | 15,000,000 | 10,000,000 | |
| 38% | 15,000,000 | 18,333,333 | 15,000,000 | |
| 35% | 18,333,333 | - | - | |
| (r) |
Statutory reserves | |
|
Statutory reserves are referring to the amount appropriated from the net income in accordance with laws or regulations, which can be used to recover losses and increase capital, as approved, and are to be used to expand production or operations. The Company transferred $2,636,160 from retained earnings to statutory reserves during 2011. PRC laws prescribe that an enterprise operating at a profit, must appropriate, on an annual basis, an amount equal to 10% of its profit. Such an appropriation is necessary until the reserve reaches a maximum that is equal to 50% of the enterprise’s PRC registered capital. |
12
AMERICAN LORAIN CORPORATION
NOTES TO CONSOLIDATED
FINANCIAL STATEMENTS
DECEMBER 31, 2011 AND 2010
(Stated in
US Dollars)
| (s) |
Foreign currency translation | |
|
The accompanying financial statements are presented in United States dollars. The functional currency of the Company is the Renminbi (RMB). The financial statements are translated into United States dollars from RMB at year-end exchange rates as to assets and liabilities and average exchange rates as to revenues and expenses. Capital accounts are translated at their historical exchange rates when the capital transactions occurred. |
| 12/31/2011 | 12/31/2010 | ||
| Year end RMB : US$ exchange rate | 6.3523 | 6.6118 | |
| Average yearly RMB : US$ exchange rate | 6.4544 | 6.7788 |
|
The RMB is not freely convertible into foreign currency and all foreign exchange transactions must take place through authorized institutions. No representation is made that the RMB amounts could have been, or could be, converted into US Dollars at the rates used in translation. | ||
| (t) |
Revenue recognition | |
|
The Company’s revenue recognition policies are in compliance with Staff accounting bulletin (SAB) 104. Sales revenue is recognized at the date of shipment to customers when a formal arrangement exists, the price is fixed or determinable, the delivery is completed, no other significant obligations of the Company exist and collectibility is reasonably assured. Payments received before all of the relevant criteria for revenue recognition are satisfied are recorded as unearned revenue. | ||
|
The Company’s revenue consists of invoiced value of goods, net of a value-added tax (VAT). The Company allows its customers to return products if they are defective. However, this rarely happens and amounts returned have been de minimis. | ||
|
The Company gradually switched its sales model from direct sales to third party distributor model and issues 1% sales incentive to distributors. The Company modified it accounting policy for the recognition of revenue accordingly. Given the circumstances of how the Company conducts its incentive program, the Company books the payments settled in cash as a contra account to Gross Revenue, and includes the amount in its reported “net revenue”. The Company has considered the guidance in FASB ASC 605-50 (EITF 01-9) and will account for its sales incentive program accordingly. | ||
| (u) |
Earnings per share | |
|
Basic earnings per share is computed by dividing net income by the weighted average number of shares of common stock outstanding during the period. Diluted earnings per share is computed by dividing net income by the sum of the weighted average number of ordinary shares outstanding and potential dilutive securities during the year. During the year ended December 31, 2011, no warrants were issued nor options were granted. For the year ended December 31, 2010, 81,155 warrants were issued to certain service providers. For the year ended December 31, 2009, 1,334,573 stock options were granted to employees pursuant to the Company’s equity incentive plan; 2,255,024 warrants were issued to investors in connection with a PIPE financing. These warrants and options could be potentially dilutive if the market price of the Company’s common stock exceeds the exercise price for these securities. | ||
|
The Company computes earnings per share (“EPS”) in accordance with Statement of Financial Accounting Standards No. 128, “Earnings per share” (“SFAS No. 128”), and SEC Staff Accounting Bulletin No. 98 (“SAB 98”). SFAS No. 128 requires companies with complex capital structures to present basic and diluted EPS. Basic EPS is measured as the income or loss available to common shareholders divided by the weighted average common shares outstanding for the period. Diluted EPS is similar to basic EPS but presents the dilutive effect on a per share basis of potential common shares (e.g., convertible securities, options, and warrants) as if they had been converted at the beginning of the periods presented, or issuance date, if later. |
13
AMERICAN LORAIN CORPORATION
NOTES TO CONSOLIDATED
FINANCIAL STATEMENTS
DECEMBER 31, 2011 AND 2010
(Stated in
US Dollars)
|
Potential common shares that have an anti-dilutive effect (i.e., those that increase income per share or decrease loss per share) are excluded from the calculation of diluted EPS. | |||
| (v) |
Financial Instruments | ||
|
The Company’s financial instruments, including cash and equivalents, accounts and other receivables, accounts and other payables, accrued liabilities and short-term debt, the carrying amounts approximate their fair values due to their short maturities. ASC Topic 820, “Fair Value Measurements and Disclosures,” requires disclosure of the fair value of financial instruments held by the Company. ASC Topic 825, “Financial Instruments,” defines fair value, and establishes a three-level valuation hierarchy for disclosures of fair value measurement that enhances disclosure requirements for fair value measures. The carrying amounts reported in the consolidated balance sheets for receivables and current liabilities each qualify as financial instruments and are a reasonable estimate of their fair values because of the short period of time between the origination of such instruments and their expected realization and their current market rate of interest. The three levels of valuation hierarchy are defined as follows: | |||
| • |
Level 1 inputs to the valuation methodology are quoted prices for identical assets or liabilities in active markets. | ||
| • |
Level 2 inputs to the valuation methodology include quoted prices for similar assets and liabilities in active markets, and inputs that are observable for the asset or liability, either directly or indirectly, for substantially the full term of the financial instrument. | ||
| • |
Level 3 inputs to the valuation methodology are unobservable and significant to the fair value measurement. | ||
|
The Company analyzes all financial instruments with features of both liabilities and equity under ASC 480, “Distinguishing Liabilities from Equity,” and ASC 815. | ||
|
As of December 31, 2011 and 2010, the Company did not identify any assets and liabilities that were required to be presented on the balance sheet at fair value. | ||
| (w) |
Commitments and contingencies | |
|
Liabilities for loss contingencies arising from claims, assessments, litigation, fines and penalties and other sources are recorded when it is probable that a liability has been incurred and the amount of the assessment can be reasonably estimated. | ||
| (x) |
Comprehensive income | |
|
Comprehensive income is defined to include all changes in equity except those resulting from investments by owners and distributions to owners. Among other disclosures, all items that are required to be recognized under current accounting standards as components of comprehensive income are required to be reported in a financial statement that is presented with the same prominence as other financial statements. The Company’s current component of other comprehensive income includes the foreign currency translation adjustment and unrealized gain or loss. | ||
|
The Company uses FASB ASC Topic 220, “Reporting Comprehensive Income”. Comprehensive income is comprised of net income and all changes to the statements of stockholders’ equity, except the changes in paid- in capital and distributions to stockholders due to investments by stockholders. Comprehensive income for the years ended December 31, 2011 and 2010 included net income and foreign currency translation adjustments. | ||
| (y) |
Recent accounting pronouncements | |
|
In December 2010, FASB issued ASU No. 2010-29, Business Combinations (Topic 805): Disclosure of Supplementary Pro Forma Information for Business Combinations. The amendments in this update specify that if a public entity presents comparative financial statements, the entity should disclose revenue and earnings of the combined entity as though the business combination(s) that occurred during the current year had occurred as of the beginning of the comparable prior annual reporting period only. The amendments also expand the supplemental pro forma disclosures to include a description of the nature and amount of material, nonrecurring pro forma adjustments directly attributable to the business combination included in the reported pro forma revenue and earnings. The amendments in this update are effective prospectively for business combinations for which the acquisition date is on or after the beginning of the first annual reporting period beginning on or after December 15, 2010. The Company adopted the disclosure requirements for the business combinations in 2011. |
14
AMERICAN LORAIN CORPORATION
NOTES TO CONSOLIDATED
FINANCIAL STATEMENTS
DECEMBER 31, 2011 AND 2010
(Stated in
US Dollars)
In May 2011, FASB issued ASU No. 2011-04, Fair Value Measurement (Topic 820): Amendments to Achieve Common Fair Value Measurement and Disclosure Requirements in U.S. GAAP and IFRSs, which is not expected to have a material impact on the Company’s consolidated financial statements upon adoption.
In June 2011, FASB issued ASU 2011-05, Comprehensive Income (ASC Topic 220): Presentation of Comprehensive Income. Under the amendments in this update, an entity has the option to present the total of comprehensive income, the components of net income and the components of other comprehensive income either in a single continuous statement of comprehensive income or in two separate but consecutive statements. Under both options, an entity is required to present each component of net income along with total net income, each component of other comprehensive income along with a total for other comprehensive income and a total amount for comprehensive income. In a single continuous statement, the entity is required to present the components of net income and total net income, the components of other comprehensive income and a total for other comprehensive income, along with the total of comprehensive income in that statement. In the two-statement approach, an entity is required to present components of net income and total net income in the statement of net income. The statement of other comprehensive income should immediately follow the statement of net income and include the components of other comprehensive income and a total for other comprehensive income, along with a total for comprehensive income. In addition, the entity is required to present on the face of the financial statements reclassification adjustments for items that are reclassified from other comprehensive income to net income in the statement(s) where the components of net income and the components of other comprehensive income are presented. The amendments in this update should be applied retrospectively and are effective for fiscal years, and interim periods within those years, beginning after December 15, 2011. The Company is currently assessing the effect that the adoption of this pronouncement will have on its financial statements.
In September 2011, FASB issued ASU No. 2011-08, Intangibles-Goodwill and Other (ASC Topic 350): Testing Goodwill for Impairment, to simplify how entities test goodwill for impairment. ASU No. 2011-08 allows entities to first assess qualitative factors to determine whether it is more likely than not that the fair value of a reporting unit is less than its carrying amount. If greater than 50 percent likelihood exists that the fair value is less than the carrying amount then a two-step goodwill impairment test as described in Topic 350 must be performed. The guidance provided by this update becomes effective for annual and interim goodwill impairment tests performed for fiscal years beginning after December 15, 2011. Early adoption is permitted, including for annual and interim goodwill impairment tests performed as of a date before September 15, 2011. The Company does not intend to adopt this ASU No. 2011-08 before September 15, 2011, and does not expect it to have a material impact on the Company’s consolidated financial position and results of operations.
| 3. |
RESTRICTED CASH |
|
Restricted Cash represents interest bearing deposits placed with banks to secure banking facilities in the form of loans and notes payable. The restriction of funds is based on time. The funds that collateralize loans are held for 60 days in savings account that pay interest at the prescribed national daily savings account rate. For funds that underline notes payable, the cash is deposited in six month time deposits that pay interest at the national time deposit rate. |
15
AMERICAN LORAIN CORPORATION
NOTES TO CONSOLIDATED
FINANCIAL STATEMENTS
DECEMBER 31, 2011 AND 2010
(Stated in
US Dollars)
| 4. |
TRADE ACCOUNTS RECEIVABLE |
| 12/31/2011 | 12/31/2010 | ||||||
| Trade accounts receivable | $ | 41,849,573 | $ | 33,562,514 | |||
| Less: Allowance for doubtful accounts | (379,693 | ) | (335,902 | ) | |||
| $ | 41,469,880 | $ | 33,226,612 | ||||
| Allowance for bad debt: | 12/31/2011 | 12/31/2010 | |||||
| Beginning balance | $ | (335,902 | ) | $ | (267,590 | ) | |
| Additions to allowance | (43,791 | ) | (68,312 | ) | |||
| Bad debt written-off | - | - | |||||
| Ending balance | $ | (379,693 | ) | $ | (335,902 | ) |
|
The Company offers credit terms of between 30 to 60 days to most of their domestic customers, including supermarkets and wholesalers, around 90 days to most of their international customers, and between 0 to 15 days for most of the third-party distributors the Company works with. | |
| 5. |
OTHER RECEIVABLES |
|
Other receivables consisted of the following as of December 31, 2011 and 2010: |
| 12/31/2011 | 12/31/2010 | ||||||
|
Advances to employees for job/travel disbursements |
577,237 | 764,725 | |||||
|
Amount due by a non-related enterprise |
157,424 | 215,685 | |||||
|
Other non-related receivables |
319,639 | 388,973 | |||||
|
Other related receivables |
213,128 | 123,467 | |||||
|
Short-term investment sale receivable (See footnote 21) |
4,880,122 | - | |||||
| $ | 6,147,550 | $ | 1,492,850 |
Advances to employees for job/travel disbursements consisted of advances to employees for transportation, meals, client entertainment, commissions, and procurement of certain raw materials. The advances issued to employees may be carried for extended periods of time because employees may spend several months out in the field working to procure new sales contracts or fulfill existing contracts.
Specifically, the company uses every available employee to arrange purchases with desirable chestnut or other raw material growers. However, because many of these growers are in rural farming areas of China where traditional banking and credit arrangements are difficult to implement, the Company must utilize cash purchases and also must contract for its future needs by placing a good faith deposit in cash with the growers. However none of these advances to employees for delivery to the growers on behalf of the Company are “personal loans” to the employees. Advances to employees for purchase of materials in other receivables are adjusted to advances to suppliers as of December 31, 2011.
Related party receivable consisted of the following as of December 31, 2011 and 2010:
| 12/31/2011 | 12/31/2010 | ||||||
| Chen, Si | $ | 133,070 | $ | 123,467 | |||
| Lu, Yundong | 896 | - | |||||
| Liu, Lihua | 78,712 | - | |||||
| Junan Hot & Roll Fast Food | 450 | - | |||||
| $ | 213,128 | $ | 123,467 |
16
AMERICAN LORAIN CORPORATION
NOTES TO CONSOLIDATED
FINANCIAL STATEMENTS
DECEMBER 31, 2011 AND 2010
(Stated in
US Dollars)
|
Related party receivable represented advances issued by management for job or travel disbursement in the normal course of business. The receivable had no impact on earnings. As with other employees, officers sign notes when cash is issued to them as job or travel disbursement. | |
|
In order to satisfy certain criteria for obtaining the long-term loan with DEG, as noted in footnote 13, Junan Hongrun lent money to Mr. Chen, Si and Ms. Liu, Lihua to purchase life insurance. | |
|
Related party receivable amounts are disclosed as other related receivables in other receivables. | |
| 6. |
INVENTORIES |
|
Inventories consisted of the following as of December 31, 2011 and 2010: |
| 12/31/2011 | 12/31/2010 | ||||||
| Raw materials | $ | 10,470,187 | $ | 18,128,883 | |||
| Finished goods | 23,878,810 | 11,678,315 | |||||
| $ | 34,348,997 | $ | 29,807,198 |
| 7. |
PROPERTY, PLANT AND EQUIPMENT |
|
Property, plant, and equipment consisted of the following as of December 31, 2011 and 2010: |
| 12/31/2011 | 12/31/2010 | ||||||
| At Cost: | |||||||
| Buildings | $ | 75,509,164 | $ | 48,612,643 | |||
| Landscaping, plant and tree | 7,879,579 | 2,852,998 | |||||
| Machinery and equipment | 10,976,564 | 9,544,910 | |||||
| Office equipment | 618,558 | 501,977 | |||||
| Motor vehicles | 467,415 | 420,020 | |||||
| $ | 95,451,279 | $ | 61,932,548 | ||||
| Less: Accumulated depreciation | |||||||
| Buildings | (4,141,133 | ) | (2,729,161 | ) | |||
| Landscaping, plant and tree | (1,303,707 | ) | (23,775 | ) | |||
| Machinery and equipment | (4,988,873 | ) | (3,998,121 | ) | |||
| Office equipment | (391,272 | ) | (312,872 | ) | |||
| Motor vehicles | (248,987 | ) | (225,832 | ) | |||
| (11,073,972 | ) | (7,289,761 | ) | ||||
| Construction in Progress | - | 17,452,220 | |||||
| $ | 84,377,306 | $ | 72,095,007 |
Construction in progress is mainly comprised of capital expenditures for construction of the Company’s new corporate campus, including offices, factories, and staff dormitories located at Junan Hongrun. Capital commitments for the construction are immaterial for the two years above.
Landscaping, plants, and trees accounts for the orchards that the Company has developed for agricultural operations. These orchards as well as the young trees which were purchased as nursery stock are capitalized into fixed assets. The depreciation is then calculated on a 30-year straight-line method when production in commercial quantities begins. The orchards have begun production in small quantities and the Company has accounted for depreciation commencing July 1, 2010.
17
AMERICAN LORAIN CORPORATION
NOTES TO CONSOLIDATED
FINANCIAL STATEMENTS
DECEMBER 31, 2011 AND 2010
(Stated in
US Dollars)
| 8. |
LAND USE RIGHTS, NET |
|
Land use rights consisted of the following as of December 31, 2011 and 2010: |
| 12/31/2011 | 12/31/2010 | ||||||
| Land use rights, at cost | 6,242,530 | $ | 5,509,925 | ||||
| Less: Accumulated amortization | (817,278 | ) | (632,487 | ) | |||
| $ | 5,425,252 | $ | 4,877,438 |
All lands are owned by the government in China. Land use rights represent the Company’s purchase of usage rights for a parcel of land for a specified duration of time, typically 50 years. The land use rights are then amortized over the period of usage. Amortization expense for the years ended December 31, 2011 and 2010 were $155,755 and $144,611, respectively.
| 9. |
SHORT-TERM BANK LOANS |
|
Short-term bank loans consisted of the following as of December 31, 2011 and 2010: |
| Remark | 12/31/2011 | 12/31/2010 | ||||||||
| Loans from Junan County Construction Bank, | ||||||||||
| • Interest rate at 5.610% per annum due 1/6/2011 | 128,558 | |||||||||
| • Interest rate at 5.841% per annum due 1/14/2011 | 483,983 | |||||||||
| • Interest rate at 5.610% per annum due 1/28/2011 | 3,223 | |||||||||
| • Interest rate at 5.841% per annum due 3/4/2011 | 393,236 | |||||||||
| • Interest rate at 5.841% per annum due 9/9/2011 | 1,209,958 | |||||||||
| • Interest rate at 6.710% per annum due 1/25/2012 | 1,479,779 | - | ||||||||
| • Interest rate at 6.100% per annum due 2/19/2012 | 944,540 | - | ||||||||
| • Interest rate at 7.015% per annum due 6/7/2012 | 3,337,374 | - | ||||||||
| • Interest rate at 6.666% per annum due 11/5/2012 | 1,086,221 | - | ||||||||
| • Interest rate at 6.666% per annum due 11/23/2012 | 787,116 | - | ||||||||
| Loan from Junan County Agriculture Bank, | ||||||||||
| • Interest rate at 6.903% per annum due 3/30/2011 | 95,284 | |||||||||
| • Interest rate at 7.434% per annum due 8/23/2011 | 1,512,447 | |||||||||
| • Interest rate at 7.320% per annum due 1/10/2012 | A | 3,148,466 | - | |||||||
| Loan from Junan County Industrial and Commercial Banks, | ||||||||||
| • Interest rate at 5.100% per annum due 1/18/2011 | - | 756,224 | ||||||||
| • Interest rate at 5.100% per annum due 1/20/2011 | - | 756,224 |
18
AMERICAN LORAIN CORPORATION
NOTES TO CONSOLIDATED
FINANCIAL STATEMENTS
DECEMBER 31, 2011 AND 2010
(Stated in
US Dollars)
| • Interest rate at 5.100% per annum due 1/26/2011 | - | 1,134,336 | ||||||||
| • Interest rate at 5.100% per annum due 2/8/2011 | - | 635,228 | ||||||||
| • Interest rate at 5.100% per annum due 2/22/2011 | - | 1,240,207 | ||||||||
| • Interest rate at 4.860% per annum due 3/15/2011 | - | 1,134,336 | ||||||||
| • Interest rate at 6.405% per annum due 4/9/2012 | B | 1,023,251 | - | |||||||
| • Interest rate at 6.405% per annum due 4/24/2012 | B | 550,982 | - | |||||||
| • Interest rate at 6.410% per annum due 4/24/2012 | B | 62,9693 | - | |||||||
| • Interest rate at 6.410% per annum due 5/10/2012 | B | 1,338,098 | - | |||||||
| • Interest rate at 6.410% per annum due 6/12/2012 | B | 1,574,233 | - | |||||||
| Loan from Linyi Commercial Bank, | ||||||||||
| • Interest rate at 11.510% per annum due 1/21/2011 | - | 680,601 | ||||||||
| • Interest rate at 11.676% per annum due 12/15/2011 | - | 680,601 | ||||||||
| • Interest rate at 12.201% per annum due 1/10/2012 | 708,405 | - | ||||||||
| • Interest rate at 11.152% per annum due 12/11/2012 | 3,148,466 | - | ||||||||
| • Interest rate at 12.201% per annum due 12/13/2012 | 787,116 | - | ||||||||
| • Interest rate at 12.136% per annum due 12/29/2012 | 708,405 | - | ||||||||
| Loan from China Minsheng Bank Corporation, Linyi Branch | ||||||||||
| • Interest rate at 8.203% per annum due 4/14/2012 | 2,361,349 | - | ||||||||
| Loan from China Agricultural Bank, Luotian Branch | ||||||||||
| • Interest rate at 6.372% per annum due 9/12/2011 | 1,134,336 | |||||||||
| • Interest rate at 6.372% per annum due 9/12/2012 | 944,540 | - | ||||||||
| Bank of Beijing, | ||||||||||
| • Interest rate at 6.672% per annum due 10/28/2011 | - | 302,489 | ||||||||
| • Interest rate at 6.672% per annum due 11/16/2012 | 629,693 | - | ||||||||
| East West Bank (Formerly United Commercial Bank), China | ||||||||||
| Branch, | ||||||||||
| • Interest rate at 5.494% per annum due 1/14/2011 | - | 897,052 | ||||||||
| HSBC Miyun Branch, | ||||||||||
| • Interest rate at 5.840% per annum due 6/09/2011 | - | 302,489 | ||||||||
| • Interest rate at 6.372% per annum due 6/29/2011 | - | 983,091 | ||||||||
| • Interest rate at 6.804% per annum due 4/8/2011 | - | 302,489 | ||||||||
| Shenzhen Development Bank, |
19
AMERICAN LORAIN CORPORATION
NOTES TO CONSOLIDATED
FINANCIAL STATEMENTS
DECEMBER 31, 2011 AND 2010
(Stated in
US Dollars)
| • Interest rate at 5.310% per annum due 9/14/2011 | - | 756,224 | ||||||||
| • Interest rate at 6.710% per annum due 2/13/2012 | 236,135 | - | ||||||||
| • Interest rate at 6.710% per annum due 3/15/2012 | 787,116 | - | ||||||||
| • Interest rate at 6.435% per annum due 6/8/2012 | 2,361,349 | - | ||||||||
| China Development Bank, | ||||||||||
| • Interest rate at 5.841% per annum due 6/27/2011 | - | 3,024,895 | ||||||||
| Luotian Agricultural Development Bank, | ||||||||||
| • Interest rate at 0.670% per annum due 12/11/2010 | - | 113,433 | ||||||||
| Luotian Sanliqiao Credit Union, | ||||||||||
| • Interest rate at 6.300% per annum due 11/5/2011 | - | 756,224 | ||||||||
| Beijing Rural Commercial Bank, Shilibao Branch, | ||||||||||
| • Interest rate at 7.434% per annum due 8/10/2011 | - | 2,571,161 | ||||||||
| • Interest rate at 7.434% per annum due 9/6/2012 | 2,046,503 | - | ||||||||
| China Agricultural Bank, Shandong Branch | ||||||||||
| • Interest rate at 7.228% per annum due 12/27/2011 | - | 1,512,447 | ||||||||
| • Interest rate at 7.544% per annum due 12/23/2012 | 1,574,233 | - | ||||||||
| • Interest rate at 7.544% per annum due 12/29/2012 | 676,920 | - | ||||||||
| Shandong Junan Rural Credit Union | ||||||||||
| • Interest rate at 9.1155% per annum due 2/07/2011 | - | 1,209,958 | ||||||||
| Beijing International Trust Co., Ltd., (“BITIC”) | ||||||||||
| • Interest rate at 6.600% per annum due 12/14/2011 | - | 453,734 | ||||||||
| China Everbright Bank, Qingdao Branch | ||||||||||
| • Interest rate at 7.930% per annum due 5/13/2012 | 3,148,467 | - | ||||||||
| $ | 36,018,450 | $ | 25,164,469 |
The short-term loans, which are denominated in the functional currency Renminbi (RMB), were primarily obtained for general working capital.
Remark:
|
A: A parcel of 12,726 square meters land use right and an 8,162 square meters building was used as collateral for this loan. | |
|
B: Accounts Receivable in the amount of $1,650,000 was used as collateral for this loan |
20
AMERICAN LORAIN CORPORATION
NOTES TO CONSOLIDATED
FINANCIAL STATEMENTS
DECEMBER 31, 2011 AND 2010
(Stated in
US Dollars)
| 10. |
NOTES PAYABLE |
|
Notes payable consisted of the following as of December 31, 2011 and 2010: |
| 12/31/2011 | 12/31/2010 | ||||||
| Junan County Construction Bank, | |||||||
| • due at 1/26/2011 | $ | - | $ | 378,112 | |||
| • due at 1/30/2011 | - | 846,971 | |||||
| Qingdao Evergrowing Bank, | |||||||
| • due at 6/13/2011 | - | 3,024,895 | |||||
| $ | - | $ | 4,249,977 |
|
Certain notes payable, as indicated above, do not have a stated rate of interest. These notes are payable on demand to the Company’s creditors. | |
| 11. |
TAXES PAYABLES |
|
Taxes payable consisted of the following as of December 31, 2011 and 2010: |
| 12/31/2011 | 12/31/2010 | ||||||
| Value added tax payable | $ | 255,327 | $ | 377,562 | |||
| Corporate income tax payable | 2,822,321 | 2,808,466 | |||||
| Employee payroll tax withholding | 6,105 | 5,096 | |||||
| Property tax payable | 46,192 | 38,819 | |||||
| Stamp tax payable | 9,369 | 4,679 | |||||
| Business tax payable | 152,869 | 76 | |||||
| Land use tax payable | 23,988 | 24,943 | |||||
| Import tariffs | 4,956 | 6,861 | |||||
| Capital gain tax payable | 916,015 | - | |||||
| $ | 4,237,142 | $ | 3,266,502 |
| 12. |
ACCRUED EXPENSES AND OTHER PAYABLE |
|
Accrued expenses and other payables consisted of the following as of December 31, 2010 and December 31, 2009: |
| 12/31/2011 | 12/31/2010 | ||||||
| Accrued salaries and wages | $ | 774,206 | $ | - | |||
| Accrued utility expenses | 74,927 | 24,825 | |||||
| Accrued interest expenses | 303,701 | 38,353 | |||||
| Accrued transportation expenses | 172,094 | 472,836 | |||||
| Other accruals | 95,371 | 110,683 | |||||
| Business and other taxes | 422,100 | 479,850 | |||||
| Disbursement payable | 38,804 | 177,543 | |||||
| Accrued staff welfare | 57,554 | 31,857 | |||||
| $ | 1,938,759 | $ | 1,335,947 |
21
AMERICAN LORAIN CORPORATION
NOTES TO CONSOLIDATED
FINANCIAL STATEMENTS
DECEMBER 31, 2011 AND 2010
(Stated in
US Dollars)
| 13. |
LONG-TERM DEBT |
|
Current portions of long-term debt consisted of the following as of December 31, 2011 and 2010: |
| 12/31/2011 | 12/31/2010 | ||||||
| Loans from Luotian Agricultural Development Bank | |||||||
| • Interest rate at 2.100% per annum due 12/11/2011 | 57,066 | 26,468 | |||||
| Loans from East West Bank (Formerly United Commercial Bank), China Branch | |||||||
| • Interest rate at 5.494% per annum due 1/14/2011 | - | 192,467 | |||||
| $ | 57,066 | $ | 218,935 |
Non-current portions of long-term debt consisted of the following as of December 31, 2010 and 2009:
| 12/31/2011 | 12/31/2010 | ||||||
| Loans from Deutsche Investitions-und | |||||||
| Entwicklungsgesellschaft mbH (“DEG”) | |||||||
| • Interest rate at 5.510% per annum due 9/16/2016 | 15,597,831 | 5,030,930 | |||||
| $ | 15,597,831 | $ | 5,030,930 |
The Company’s loan with DEG will be repaid in semi-annual installments beginning September 15, 2012. The loan was collateralized with the following terms:
| (a.) | Create and register a first ranking mortgage in the amount of about USD 12,000,000 on its land and building in favor of DEG. | |
| (b.) | Undertake to provide a share pledge of Mr. Si Chen shares in the sponsor in the amount of about USD 12,000,000 and being the majority shareholder in the sponsor in form and substance satisfactory to DEG | |
| (c.) | The total amount of the first ranking mortgage as indicated in the Loan Agreement (Article 12(1)(a)) and the value of the pledged shares of Mr. Si Chen (Loan Agreement (Article 12(1)(a))) should be at least USD 24,000,000. | |
| (d.) | Undertake to provide a guarantee from the Shareholder in form and substance satisfactory to DEG. |
|
As of December 31, 2011, the value of the pledged shares has not fulfilled the required amount; therefore, the borrower and sponsor are in breach of the loan agreement and security contracts. Despite these breaches, DEG has not accelerated the loan. | |
| 14. |
CAPITALIZATION |
|
Dating back to May 3, 2007, the Company underwent a reverse-merger and a concurrent financing transaction that resulted in 24,923,178 shares of outstanding common stock that remained unchanged until through December 31, 2007. In connection with the financing, the Company also issued 1,037,858 and 489,330 warrants to the PIPE investors and placement agent, respectively. During 2008, several holders of warrants issued in connection with the financing transaction exercised their rights to purchase shares at the prescribed exercise price. The holders of the warrants exercised the right to purchase a total of 360,207 shares; however, because the holders did not pay in cash for the warrants, 110,752 of those shares were cancelled as consideration in lieu of the warrant holders paying in cash. Ultimately, 249,455 of new shares were issued to those who exercised their warrant. The Company also made an adjustment to its outstanding share count for rounding errors as result of the split and reverse splits made at the time of the reverse merger. The number of shares in the adjustment was an addition of seven shares. The Company believes the adjustment of seven shares is immaterial to both prior and current earnings per share calculation. As detailed in the table below, the total number of outstanding shares at December 31, 2011 was 34,507,874. |
22
AMERICAN LORAIN CORPORATION
NOTES TO CONSOLIDATED
FINANCIAL STATEMENTS
DECEMBER 31, 2011 AND 2010
(Stated in
US Dollars)
During the year 2009, the Company issued 56,393 shares of stock to its employees and vendors and 5,011,169 shares to investors. The Company issued 1,334,573 stock options to employees on July 28, 2009; 1,753,909 shares of Series A warrants and 501,115 shares of Series B warrants were issued to investors on October 28, 2009.
During the year 2010, the Company issued 2,000 shares to a service provider on February 10, 2010 and 81,155 warrants to various service providers on January 5, 2010. The Company issued to investors 3,440,800 shares at an agreed price of $2.80 per share for a PIPE financing on September 10, 2010. This financing brought $8,955,730 net proceeds to the Company. The Company issued 5,000 shares to its employee on September 23, 2010. 731,707 shares of restricted stock were issued to the owner of Shandong Greenpia, Mr. Ji Zhenwei on September 24, 2010 as part of acquisition cost.
For the year 2010, the Company transferred 5,161,176 from retained earnings to additional paid up capital and 2,445,262 from retained earnings to statutory reserve. These transfers are to be used for future company development, recovery of losses and increase of capital, as approved, to expand production or operations.
The total number of shares issued and outstanding is 34,507,874 as of December 31, 2011. For the period ended December 31, 2011, the Company transferred 2,636,160 from retained earnings to statutory reserve. These transfers are to be used for future company development, recovery of losses and increase of capital, as approved, to expand production or operations.
American Lorain Corporation
Capitalization Reconciliation
Table
| Par value authorized | Issuance date | Shares outstanding | ||
| Common stock at 1/1/2009 | 200,000,000 | 25,172,640 | ||
| New shares issued to employees and vendors during 2009 | Various dates | 56,393 | ||
| New shares issued to PIPE investors | 10/28/2009 | 5,011,169 | ||
| New shares issued to service provider during 2010 | 2/10/2010 | 2,000 | ||
| New shares issued to PIPE investors | 9/10/2010 | 3,440,800 | ||
| New shares issued to employee | 9/23/2010 | 5,000 | ||
| New shares issued as acquisition consideration | 9/24/2010 | 731,707 | ||
| New shares issued to service provider during 2011 | 5/5/2011 | 25,000 | ||
| New shares issued to employees per stock incentive plan | 7/20/2011 | 27,092 | ||
| New shares issued to employees per stock incentive plan | 11/21/2011 | 36,073 | ||
| Common stock at 12/31/2011 | 34,507,874 |
| Warrants and options | Number of warrants or options |
Issuance date | Expiration date | |
| Warrants issued to investors in 2007 PIPE | 1,037,858 | 5/3/2007 | 5/2/2010 | |
| Warrants issued to placement agent in 2007 PIPE | 489,330 | 5/3/2007 | 5/2/2010 | |
| Employee stock options | 1,334,573 | 7/28/2009 | 7/27/2014 |
23
AMERICAN LORAIN CORPORATION
NOTES TO CONSOLIDATED
FINANCIAL STATEMENTS
DECEMBER 31, 2011 AND 2010
(Stated in
US Dollars)
| Warrants issued to investors in 2009 PIPE - Series A | 1,753,909 | 10/28/2009 | 4/28/2015 | |
| Warrants issued to investors in 2009 PIPE - Series B | 501,115 | 10/28/2009 | 10/28/2012 | |
| Issued to service provider A during 2010 | 50,722 | 1/5/2010 | 1/2/2014 | |
| Issued to service provider B during 2010 | 20,289 | 1/5/2010 | 1/2/2014 | |
| Issued to service provider C during 2010 | 10,144 | 1/5/2010 | 1/2/2014 | |
| Total warrants and options | 5,197,940 |
| 15. |
NON-CONTROLLING INTERESTS |
|
The non-controlling interest represents the 19.8% equity of Shandong Lorain held by the Shandong Economic Development Investment Corporation, which is a state-owned interest. | |
| 16. |
SALES BY PRODUCT TYPE |
|
Sales by categories of product consisted of the following as of December 31, 2011 and 2010: |
| Category | 12/31/2011 | 12/31/2010 | |||||
| Chestnut | $ | 110,263,973 | $ | 101,165,457 | |||
| Convenience food | 72,887,580 | 56,751,766 | |||||
| Frozen food | 30,070,553 | 26,259,344 | |||||
| Total | $ | 213,222,106 | $ | 184,176,567 |
Revenue by geography consisted of the following as of December 31, 2011 and 2010:
| Country | 12/31/2011 | 12/31/2010 | |||||
| Australia | $ | 363,508 | $ | 327,087 | |||
| Belgium | 2,467,360 | 2,979,263 | |||||
| Canada | 110,552 | 57,088 | |||||
| Chile | - | 18,126 | |||||
| China | 157,064,976 | 135,028,823 | |||||
| Denmark | 43,656 | 16,221 | |||||
| France | 2,721,435 | 910,881 | |||||
| Germany | 1,179,298 | 920,178 | |||||
| Hong Kong | 563,285 | 470,434 | |||||
| Indonesia | 20,999 | 172,118 | |||||
| Israel | 461,427 | 426,437 | |||||
| Japan | 27,767,186 | 19,649,089 | |||||
| Kuwait | - | 165,499 | |||||
| Malaysia | 2,106,973 | 2,177,511 | |||||
| Netherlands | 586,327 | 1,558,792 | |||||
| Philippines | 382,480 | 314,125 | |||||
| Poland | 175,410 | 185,264 | |||||
| Saudi Arabia | 33,732 | 144,216 | |||||
| Singapore | 1,139,671 | 862,862 | |||||
| South Korea | 9,119,942 | 9,816,362 | |||||
| Spain | 1,134,021 | 540,546 | |||||
| Taiwan | 1,353,567 | 1,910,243 | |||||
| Thailand | 387,164 | - | |||||
| United Kingdom | 3,797,548 | 2,609,928 | |||||
| United States | 241,589 | 2,915,474 | |||||
| Total | $ | 213,222,106 | $ | 184,176,567 |
24
AMERICAN LORAIN CORPORATION
NOTES TO CONSOLIDATED
FINANCIAL STATEMENTS
DECEMBER 31, 2011 AND 2010
(Stated in
US Dollars)
| 17. |
INCOME TAXES |
|
All of the Company’s operations are in the PRC, and in accordance with the relevant tax laws and regulations of PRC, the corporate income tax rate is 25%. | |
|
The following tables provide the reconciliation of the differences between the statutory and effective tax expenses for the years ended December 31, 2011 and 2010: |
| 12/31/2011 | 12/31/2010 | ||||||
| Income attributed to PRC | $ | 28,870,041 | $ | 26,384,934 | |||
| Loss attributed to US* | (966,868 | ) | (1,306,185 | ) | |||
| Income before tax | 27,903,173 | 25,078,749 | |||||
| PRC Statutory Tax at 25% Rate | 6,824,201 | 5,906,670 | |||||
| Effect of tax exemption granted | - | (76,199 | ) | ||||
| Income tax | $ | 6,824,201 | $ | 5,830,472 |
Per Share Effect of Tax Exemption
| 12/31/2011 | 12/31/2010 | ||||||
| $ | $ | ||||||
| Effect of tax exemption granted | - | 76,199 | |||||
| Weighted-Average Shares Outstanding Basic | 34,445,972 | 31,507,044 | |||||
| Per share effect | $ | - | $ | 0.002 |
The difference between the U.S. federal statutory income tax rate and the Company’s effective tax rate was as follows for the years ended December 31, 2011 and 2010:
| 2011 | 2010 | ||||||
| U.S. federal statutory income tax rate | 35% | 35% | |||||
| Lower rates in PRC, net | -10% | -10% | |||||
| Tax holiday for foreign investments | -0.57% | -1.75% | |||||
| The Company’s effective tax rate | 24.43% | 23.25% |
Effective January 1, 2008, the PRC government implemented a new 25% tax rate across the board for all enterprises regardless of whether domestic or foreign enterprise without any tax holiday which is defined as “two-year exemption followed by three-year half exemption” hitherto enjoyed by tax payers. As a result of the new tax law of a standard 25% tax rate, tax holidays were terminated as of December 31, 2007. However, PRC government has established a set of transition rules to allow enterprises already started tax holidays before January 1, 2008, to continue enjoying the tax holidays until being fully utilized.
The Company has accrued a deferred tax asset as a result of its net operating loss in 2009 because the Company planned to setup operations in the United States. The company anticipates that the operations within the United States will generate income in the future so that it will be able to take full advantage of the accrued asset. Accordingly the Company has not provided a valuation allowances for the accrued tax asset.
The Company’s has detailed the tax rates for its subsidiaries for 2011 and 2010 in the following table.
25
AMERICAN LORAIN CORPORATION
NOTES TO CONSOLIDATED
FINANCIAL STATEMENTS
DECEMBER 31, 2011 AND 2010
(Stated in
US Dollars)
| Income Tax Rate | 2011 | 2010 | |||||
| International Lorain | 0% | 0% | |||||
| Junan Hongran | 25% | 25% | |||||
| Luotian Lorain | 15% | 15% | |||||
| Beijing Lorain | 15% | 15% | |||||
| Shandong Lorain | 25% | 25% | |||||
| Shandong Greenpia | 25% | 25% | |||||
| Dongguan Lorain | 25% | 25% |
| 18. |
EARNINGS PER SHARE |
|
Components of basic and diluted earnings per share were as follows: |
| 12 months | 12 months | ||||||
| ended | ended | ||||||
| December 31, | December 31, | ||||||
| 2011 | 2010 | ||||||
| Basic Earnings Per Share Numerator | |||||||
| Net Income | $ | 19,902,367 | $ | 17,839,463 | |||
| Income Available to Common Stockholders | $ | 19,887,498 | $ | 17,839,463 | |||
| Diluted Earnings Per Share Numerator | |||||||
| Income Available to Common Stockholders | $ | 19,887,498 | $ | 17,833,959 | |||
| Income Available to Common Stockholders on Converted Basis | $ | 19,887,498 | $ | 17,833,959 | |||
| Original Shares: | |||||||
| Additions from Actual Events | |||||||
| -Issuance of Common Stock | 34,445,972 | 31,507,044 | |||||
| Basic Weighted Average Shares Outstanding | 34,445,972 | 31,507,044 | |||||
| Dilutive Shares: | |||||||
| Additions from Potential Events | |||||||
| Exercise of Investor Warrants & Placement Agent Warrants | - | 22,638 | |||||
| Exercise of Employee & Director Stock Options | 280,522 | 674,873 | |||||
| Diluted Weighted Average Shares Outstanding: | 34,726,494 | 32,204,555 | |||||
| Earnings Per Share | |||||||
| - Basic | $ | 0.58 | $ | 0.57 | |||
| - Diluted | $ | 0.57 | $ | 0.55 | |||
| Weighted Average Shares Outstanding | |||||||
| - Basic | 34,445,972 | 31,507,044 | |||||
| - Diluted | 34,726,494 | 32,204,555 |
| 19. |
SHARE BASED COMPENSATION |
|
On July 27, 2009, the Company’s Board of Directors adopted the American Lorain Corporation 2009 Incentive Stock Plan (the “Plan”). The Plan provides that the maximum number of shares of the Company’s common stock that may be issued under the Plan is 2,500,000 shares. The Company’s employees, directors, and service providers are eligible to participate in the Plan. |
26
AMERICAN LORAIN CORPORATION
NOTES TO CONSOLIDATED
FINANCIAL STATEMENTS
DECEMBER 31, 2011 AND 2010
(Stated in
US Dollars)
For the year ended December 31, 2009, the Company recorded a total of $166,346 of shared based compensation expense. The Company issued warrants that upon exercise would result in the issuance of 1,334,573 common shares. These stock options vest over three years, where 33.33% vest annually. The expense related to the stock options was $107,375. The Company also recorded expense of $58,971 for the issuance of 56,393 common shares to participants, respectively. The common shares vested immediately. Given the materiality and nature of share based compensation, the entire expense has been recorded as general and administrative expenses.
During the period ended December 31, 2010, the Company recorded a total of $890,209 stock option and its related general and administrative expenses.
During the period ended December 31, 2011, the Company recorded a total of $ 644,243 stock option and its related general and administrative expenses.
The range of the exercise prices of the stock options granted since inception of the plan are shown in the following table:
| Price Range | Number of Shares | |
| $0 - $4.99 | 1,334,573 shares | |
| $5.00 - $9.99 | 0 shares | |
| $10.00 - $14.99 | 0 shares |
No tax benefit has yet to be accrued or realized. For the year ended December 31, 2011 the Company has yet to repatriate its earnings, accordingly it has not recognized any deferred tax assets or liability in regards to benefits derived from the issuance of stock options.
The Company used the Black-Scholes Model to value the warrants granted. The following shows the weighted average fair value of the grants and the assumptions that were employed in the model:
| Weighted-average fair value of grants: | $ | 1.1909 | ||
| Risk-free interest rate: | 0.96% | |||
| Expected volatility: | 4.58% | |||
| Expected life in months: | 36.00 |
| 20. |
LEASE COMMITMENTS |
|
The Company entered into an operating lease agreement leasing a factory building located in Dongguan, China. The lease was signed by Shandong Lorain on behalf of Dongguan Lorain and expires on August 9, 2018. | |
|
The minimum future lease payments for this property at December 31, 2011 are shown in the following table: |
| From | To | Lease payment | |||||
| 1/1/2012 | 12/31/2012 | $ | 84,259 | ||||
| 1/1/2013 | 12/31/2013 | 87,536 | |||||
| 1/1/2014 | 12/31/2014 | 92,685 | |||||
| 1/1/2015 | 12/31/2015 | 92,685 | |||||
| 1/1/2016 | 12/31/2016 | 92,685 | |||||
| 1/1/2017 | 12/31/2017 | 92,685 | |||||
| 1/1/2018 | 8/9/2018 | 56,641 | |||||
| $ | 599,176 |
The outstanding lease commitment as of December 31, 2011 was $599,176.
The minimum future lease payments for this property at December 31, 2010 are shown in the following table:
27
AMERICAN LORAIN CORPORATION
NOTES TO CONSOLIDATED
FINANCIAL STATEMENTS
DECEMBER 31, 2011 AND 2010
(Stated in
US Dollars)
| From | To | Lease payment | |||||
| 1/1/2011 | 12/31/2011 | $ | 84,259 | ||||
| 1/1/2012 | 12/31/2012 | 84,259 | |||||
| 1/1/2013 | 12/31/2013 | 87,536 | |||||
| 1/1/2014 | 12/31/2014 | 92,685 | |||||
| 1/1/2015 | 12/31/2015 | 92,685 | |||||
| 1/1/2016 | 12/31/2016 | 92,685 | |||||
| 1/1/2017 | 12/31/2017 | 92,685 | |||||
| 1/1/2018 | 8/9/2018 | 56,641 | |||||
| $ | 683,435 |
|
The outstanding lease commitment as of December 31, 2010 was $683,435. | ||
| 21. |
OTHER INCOME | |
|
Other Income of $2,449,950 included a gain of $1,953,303 from sale of land as short-term investment. The transaction is described below: | ||
|
On March 13, 2011, the Company entered into an agreement with Jiangsu Heng An Industrial Investment Group Co., Ltd. to sell the Company’s short-term investment in the amount of $ 7,764,577 (RMB 49,604,000) of a parcel of land located in Junan Town, Shandong Province, to construct residential buildings. The land was sold to Jiangsu Heng An at a total sale price of RMB 69,604,000 and a guaranteed gross profit of RMB 20,000,000 without consideration of profit/loss of the residential building project. The gain on the sale of the short-term investment excluding taxes payable is recorded as other income on the statements of income and comprehensive income. Title of the land transferred from the Company to Jiangsu Heng An with receipt of an initial deposit of RMB 15,000,000. As of December 31, 2011, a total of RMB 38,000,000 has been paid and RMB 31,000,000 (USD 4,880,122) is classified as Other Receivable as noted in footnote 5. According to the contract, the Company will be entitled to receive RMB 9,000,000 within 5 days after the title transfer and construction approval is complete, and RMB 27,000,000 within 5 days after the residential building main frame is completed | ||
| 22. |
RISKS | |
| A. |
Credit risk | |
|
Since the Company’s inception, the age of account receivables have been less than one year indicating that the Company is subject to minimal risk borne from credit extended to customers. | ||
| B. |
Interest risk | |
|
The company subject to the interest rate risk when their short term loans become due and require refinancing. | ||
| C. |
Economic and political risks | |
|
The Company’s operations are conducted in the PRC. Accordingly, the Company’s business, financial condition, and results of operations may be influenced by changes in the political, economic, and legal environments in the PRC. | ||
|
The Company’s operations in the PRC are subject to special considerations and significant risks not typically associated with companies in North America and Western Europe. These include risks associated with, among others, the political, economic and legal environment and foreign currency exchange. The Company’s results may be adversely affected by changes in the political and social conditions in the PRC, and by changes in governmental policies with respect to laws and regulations, anti-inflationary measures, currency conversion, remittances abroad, and rates and methods of taxation, among other things. | ||
28
AMERICAN LORAIN CORPORATION
NOTES TO CONSOLIDATED
FINANCIAL STATEMENTS
DECEMBER 31, 2011 AND 2010
(Stated in
US Dollars)
| D. |
Environmental risks | |
|
The Company has procured environmental licenses required by the PRC government. The Company has both a water treatment facility for water used in its production process and secure transportation to remove waste off site. In the event of an accident, the Company has purchased insurance to cover potential damage to employees, equipment, and local environment. | ||
| E. |
Inflation Risk | |
|
Management monitors changes in prices levels. Historically inflation has not materially impacted the company’s financial statements; however, significant increases in the price of raw materials and labor that cannot be passed on the Company’s customers could adversely impact the Company’s results of operations. |
29