Attached files
| file | filename |
|---|---|
| 8-K - FORM 8-K - HUNTINGTON INGALLS INDUSTRIES, INC. | d325429d8k.htm |
| EX-99.1 - EXHIBIT 99.1 - HUNTINGTON INGALLS INDUSTRIES, INC. | d325429dex991.htm |
 Q4
2011 Earnings Presentation March 28, 2012
Mike Petters
President and Chief Executive Officer
Barb Niland
Corporate Vice President, Business Management
& Chief Financial Officer
Exhibit 99.2 |
 Statements in
this presentation, other than statements of historical fact, constitute
"forward-looking
statements"
within
the
meaning
of
the
Private
Securities
Litigation
Reform
Act
of
1995.
Forward-looking
statements
involve
risks
and
uncertainties
that
could cause our actual results to differ materially from those expressed in these
statements.
Factors
that
may
cause
such
differences
include:
changes
in
government
and customer priorities and requirements (including government budgetary
constraints,
shifts
in
defense
spending,
and
changes
in
customer
short-range
and
long-range plans); our ability to obtain new contracts, estimate our costs and
perform effectively; risks related to our spin-off from Northrop Grumman (including
our increased costs and leverage); our ability to realize the expected benefits from
consolidation of our Gulf Coast facilities; natural disasters; adverse economic
conditions
in
the
United
States
and
globally;
and
other
risk
factors
discussed
in
our
filings with the U.S. Securities and Exchange Commission. There may be other risks
and uncertainties that we are unable to predict at this time or that we currently do
not expect to have a material adverse effect on our business, and we undertake no
obligations
to
update
any
forward-looking
statements.
This
presentation
also
contains
non-GAAP financial measures and includes a GAAP reconciliation of these financial
measures. Non-GAAP financial measures should not be construed as being more
important than comparable GAAP measures.
Safe Harbor
2 |
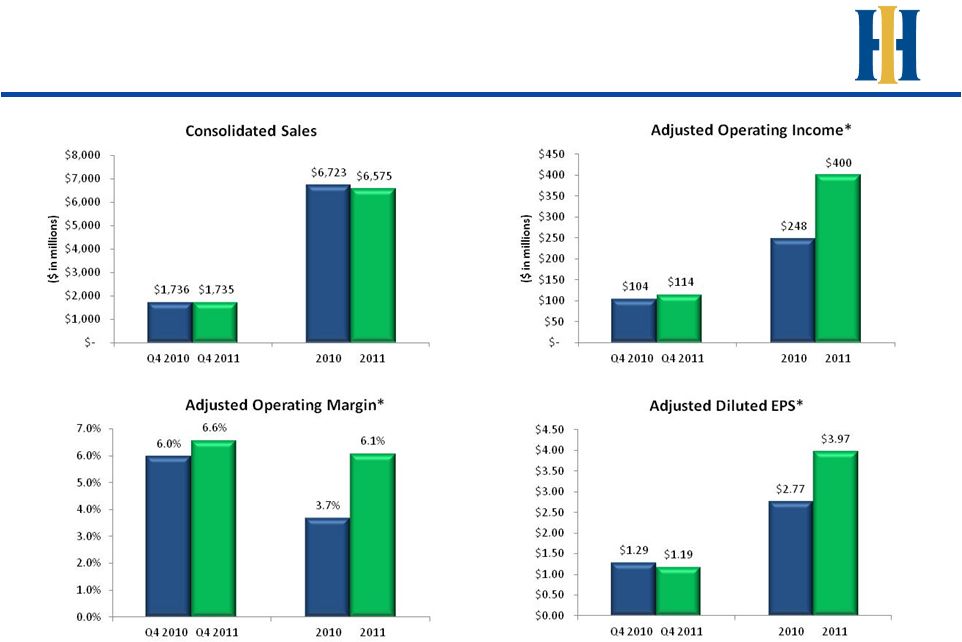
 Highlights from the Quarter and FY 2011
3
Adjusted diluted EPS* of $1.19 for the fourth quarter and $3.97 for the year
Total
adjusted
operating
margin*
for
the
fourth
quarter
improved
to
6.6%
from
6.0%
in Q4 2010; full year adjusted operating margin* increased to 6.1% from 3.7%
in 2010
Q4 Newport News operating margin was 9.5%, down 0.9% from Q4 2010; for 2011,
operating margin was 9.1%, down 0.3% from 2010
Q4 Ingalls adjusted operating margin* was 2.2%, up from 1.4% in Q4 2010; for
2011,
adjusted
operating
margin*
was
2.4%,
up
significantly
over
last
year
Operating cash flow was $474 million for the quarter and $528 million for the
year Delivered LPD-22 San Diego, marking a major milestone towards completing the
turnaround at Ingalls
Announced $0.8 billion of new contract awards during Q4 2011 including advance
construction for Kennedy, engineering and support services on the
LPD San Antonio
-class
ships
and
continued
work
on
the
DDG-1000
class
of
destroyers
* Adjusted for non-cash goodwill impairment charge. See Appendix for
reconciliation to the net loss per share and operating margin determined
under GAAP |
 Fourth Quarter and FY 2011 Consolidated
Results
4
* Adjusted for non-cash goodwill impairment charge. See Appendix for
reconciliation to the operating income, operating margin and net earnings
per share determined under GAAP |
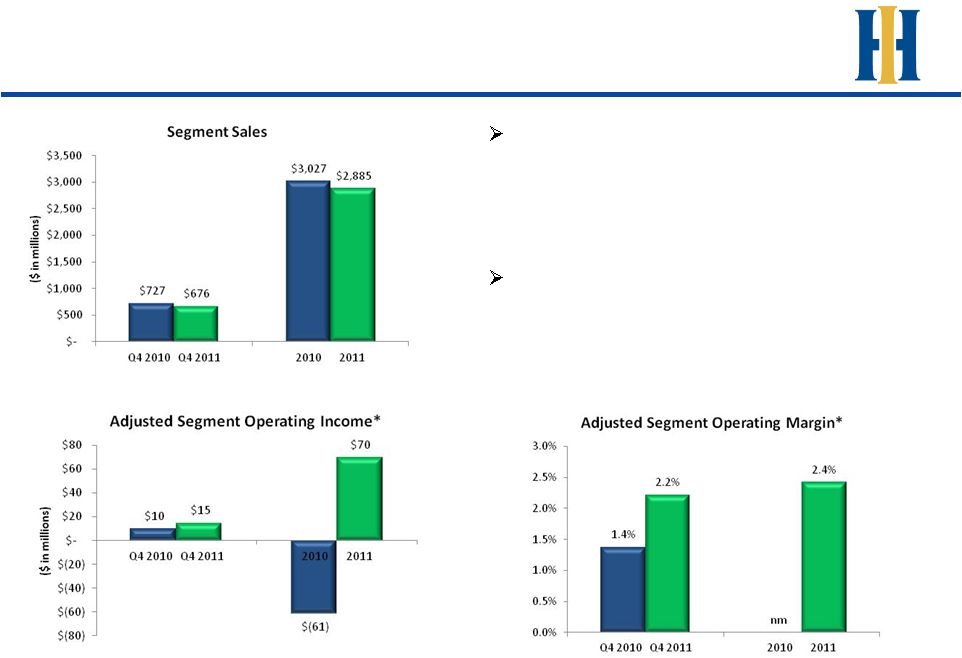 Ingalls Shipbuilding
5
Ingalls Q4 sales were down YoY due to
lower volumes on DDG-51 program and
LPD program, partially offset by higher
volume on NSC and LHA programs, and
LPD-27
Q4 adjusted segment operating income*
was up YoY driven by improved
performance on the LPD program and
new contracts
* Adjusted for non-cash goodwill impairment charge. See Appendix for
reconciliation to the operating income and operating margin determined under
GAAP |
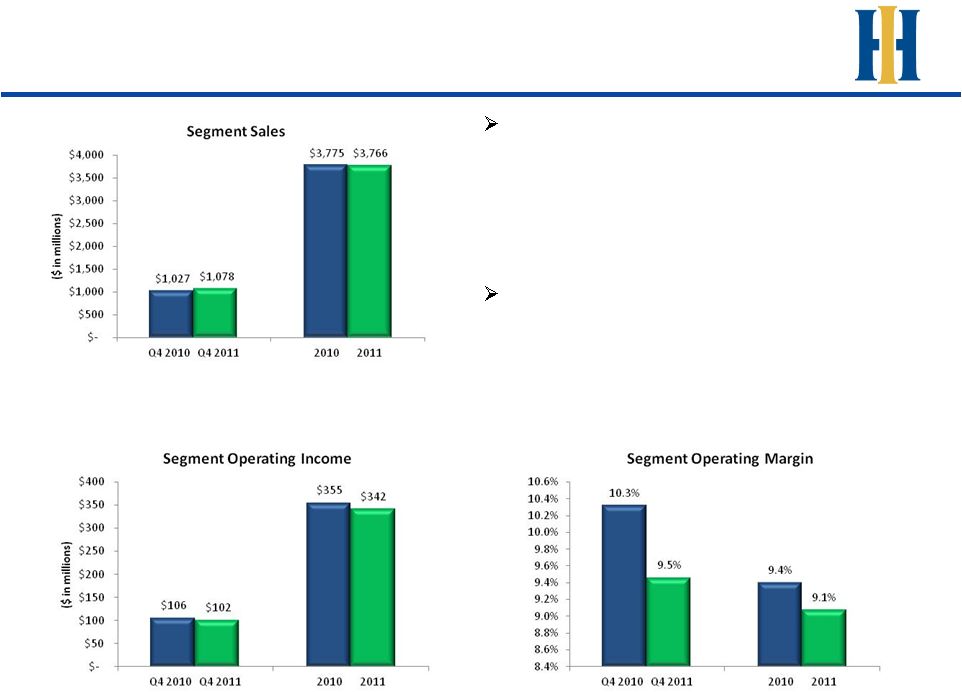 Newport News Shipbuilding
6
Newport News sales were up in Q4 as
compared to Q4 2010 due to higher
volumes
on
Ford,
Kennedy,
Lincoln
RCOH
planning effort & the VCS program,
partially
offset
by
Roosevelt
RCOH,
the
Enterprise
EDSRA
and
the
PSA
for
Bush
Segment operating income and margin
decreased due to contract mix and 2010
risk retirement on the carrier programs,
partially offset by risk retirement on the
VCS
program in 2011 |
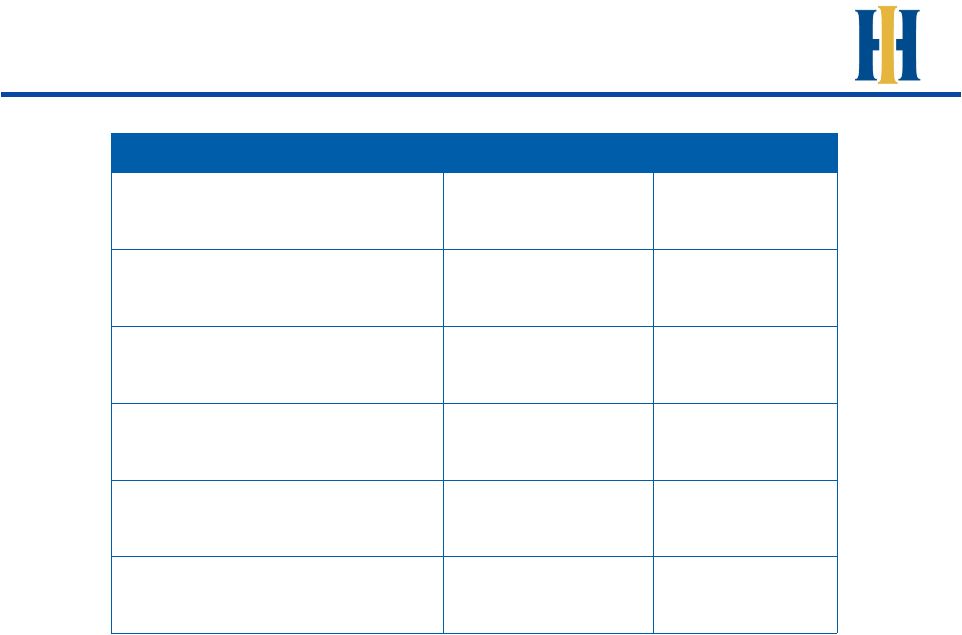 2012
Pension Assumptions 7
($ in millions)
2011
2012
Discount Rate
5.84%
5.23%
Asset Returns
8.50%
8.00%
Cash Contributions
(1)(2)
$36
$254
Net FAS/CAS Adjustment
(1)(2)
($13)
($77)
CAS
(1)(2)
$144
$143
FAS
(1)
($157)
($220)
(1)
Includes pension and other post retirement benefits.
(2)
Projection; subject to change during 2012. |
 Appendix |
 Reconciliations
9
We
make
reference
to
“free
cash
flow,”
“segment
operating
income,”
“adjusted
segment
operating
income,”
“adjusted
segment
operating
margin,”
“adjusted
operating
income,”
“adjusted
operating
margin,”
“adjusted
net
earnings,”
and “adjusted diluted earnings per share.”
Free cash flow represents cash provided by (used in)
operating activities less capital expenditures. Segment operating income is defined as
operating income before net pension and post-retirement benefits adjustment and
deferred state income taxes. Adjusted measures for the fiscal year 2011 exclude the $290
million non-cash goodwill impairment charge in the Ingalls segment; adjusted
measures for the fourth quarter of 2011 exclude a $10 million reversal of a portion of the charge taken
in
the
third
quarter
of
2011
(together,
we
refer
to
these
as
the
“goodwill
impairment
charge”).
Adjusted
segment operating income is defined as segment operating income as adjusted for the impact of
the goodwill impairment charge, and adjusted segment operating margin is defined as
adjusted segment operating income as a percentage of segment sales and service revenues.
Adjusted operating income is defined as operating income adjusted for the impact of the
goodwill impairment charge, and adjusted operating margin is defined as adjusted
operating income as a percentage of total sales and service revenues. Adjusted net earnings is defined
as
net
income
adjusted
for
the
impact
of
the
goodwill
impairment
charge.
Adjusted
diluted
earnings
per
share
is
defined
as
diluted
earnings
per
share
adjusted
for
the
impact
of
the
goodwill
impairment
charge.
Segment operating income is one of the key metrics we use to evaluate operating performance
because it excludes items that do not affect segment performance. We believe adjusted
segment operating income, adjusted segment operating margin, adjusted operating income,
adjusted operating margin, adjusted net earnings and adjusted diluted earnings per share
are useful because they exclude the goodwill impairment charge, a non-recurring item
that we do not consider indicative of our core operating performance. Therefore, we
believe it is appropriate to disclose these measures to help investors analyze our operating performance.
However, these measures are not measures of financial performance under GAAP and may not be
defined or calculated by other companies in the same manner.
|
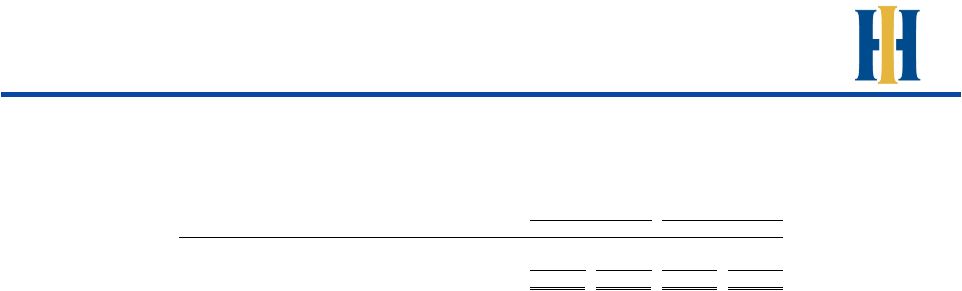 Reconciliation of Non-GAAP Measure –
Free Cash Flow
10
Three Months Ended
Year Ended
December 31
December 31
$ in millions
2011
2010
2011
2010
Net cash provided by (used in) operating activities
474
$
208
$
528
$
359
$
Less: Capital expenditures
(78)
(95)
$
(197)
(191)
$
Free cash flow from operations
396
$
113
$
331
$
168
$ |
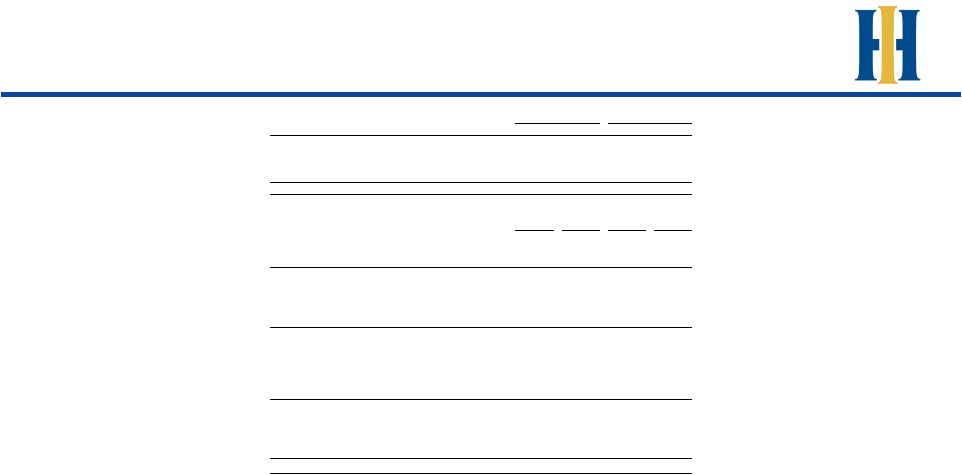
 Reconciliation of Non-GAAP Measure –
Segment Operating Income
11
Three Months Ended
Year Ended
December 31
December 31
$ in millions
2011
2010
2011
2010
Sales and Service Revenues
Ingalls
676
$
727
$
2,885
$
3,027
$
Newport News
1,078
1,027
3,766
$
3,775
$
Intersegment eliminations
(19)
(18)
(76)
(79)
Total sales and service revenues
1,735
$
1,736
$
6,575
$
6,723
$
Operating Income (Loss)
Ingalls
25
$
10
$
(220)
$
(61)
$
As a percentage of sales
3.7%
1.4%
-7.6%
-2.0%
Newport News
102
106
342
355
As a percentage of sales
9.5%
10.3%
9.1%
9.4%
Total Segment Operating Income (Loss)
127
116
122
294
As a percentage of sales
7.3%
6.7%
1.9%
4.4%
Non-segment factors affecting operating income
Net pension and post-retirement benefits adjustment
(4)
(15)
(13)
(49)
Deferred state income taxes
1
3
1
3
Total operating income (loss)
124
$
104
$
110
$
248
$
Interest expense
(29)
(10)
(104)
(40)
Federal income taxes
(26)
(29)
(100)
(71)
Other, Net
-
(2)
-
(2)
Total net earnings (loss)
69
$
63
$
(94)
$
135
$ |
 Reconciliation of Non-GAAP Measure –
Adjusted Figures
12
(1)
Adjusted diluted average common shares outstanding is a non-GAAP
measure defined as weighted average common shares outstanding plus the dilutive effect of stock options and stock awards. This measure has been provided for consistency and comparability of
the 2011 results with earnings per share from prior periods.
(2)
Adjusted
diluted
EPS
is
a
non-GAAPmeasure
defined
as
earnings
per
share
before
the
per
share
2011
goodwill
impairmentcharge
impact.
Adjusted
diluted
EPS
has
been
provided
forconsistencyand
comparability
of
theresults
with
results
of
operations
from
prior
periods.
(3)
Per share amounts are based on basic weighted average shares
outstanding, as use of dilutive securities (ie. stock options and stock awards) would result in a lesser per share loss for 2011.
Three Months Ended
Year Ended
December 31
December 31
$ in millions
2011
2010
2011
2010
Sales and Service Revenues
Ingalls
676
$
727
$
2,885
$
3,027
$
Newport News
1,078
1,027
$
3,766
3,775
$
Intersegment eliminations
(19)
(18)
(76)
(79)
Total sales and service revenues
1,735
$
1,736
$
6,575
$
6,723
$
Adjusted Operating Income (Loss)
Ingalls
25
$
10
$
(220)
$
(61)
$
Adjustment for goodwill impairment
(10)
-
290
-
Adjusted Ingalls
15
10
70
(61)
As a % of sales
2.2%
1.4%
2.4%
-2.0%
Newport News
102
106
342
355
Total Adjusted Segment Operating Income (Loss)
117
116
412
294
As a % of sales
6.7%
6.7%
6.3%
4.4%
Non-segment factors affecting adjusted operating income
Net pension and post-retirement benefits adjustment
(4)
(15)
(13)
(49)
Deferred state income taxes
1
3
1
3
Total adjusted operating income (loss)
114
$
104
$
400
$
248
$
As a % of sales
6.6%
6.0%
6.1%
3.7%
Non-operating factors affecting adjusted net income
Interest expense
(29)
(10)
(104)
(40)
Federal income taxes
(26)
(29)
(100)
(71)
Other, Net
-
(2)
-
(2)
Total adjusted net earnings (loss)
59
$
63
$
196
$
135
$
Per Share Amounts
Weighted average common shares outstanding
48.9
48.8
48.8
48.8
Dilutive effect of stock options and stock awards
0.8
-
0.6
-
Adjusted diluted average common shares outstanding
(1)
49.7
48.8
49.4
48.8
Earnings Per Share (EPS) Calculations
Adjusted net earnings from above
59
$
63
$
196
$
135
$
Adjusted diluted average common shares outstanding
(1)
49.7
48.8
49.4
48.8
Adjusted diluted earnings per share
(2)
1.19
$
1.29
$
3.97
$
2.77
$
Reported net income (loss)
69
$
(94)
$
Weighted average common shares outstanding
(3)
48.9
48.8
Basic earnings (loss) per share
1.41
$
(1.93)
$
Diluted average common shares outstanding
49.7
48.8
Diluted earnings (loss) per share
1.39
$
(1.93)
$ |