Attached files
| file | filename |
|---|---|
| 8-K - 8-K - FLEETCOR TECHNOLOGIES INC | d323878d8k.htm |
 An
Introduction to FleetCor Technologies A Leading Global Provider of Fleet Cards
and Specialty Payments to Businesses March 2012
Exhibit 99.1 |
 Safe
Harbor Provision This
presentation
contains
statements
that
express
our
opinions,
expectations,
beliefs,
plans,
objectives,
assumptions
or
projections regarding future events or future results, in contrast with statements
that reflect historical facts. In some cases, we have identified such
forward-looking statements with typical conditional words such as "anticipate," "intend," "believe,"
"estimate," "plan," "seek," "project" or
"expect," "may," "will," "would," "could" or "should," the negative of these terms or
other comparable terminology.
These forward-looking statements are not a guarantee of performance, and you
should not place undue reliance on such statements. We have based these
forward-looking statements largely on our current expectations and projections about
future events. Forward-looking statements are subject to many uncertainties and
other variable circumstances, such as delays or failures associated with
implementation; fuel price and spread volatility; changes in credit risk of customers and
associated losses; the actions of regulators relating to payment
cards; failure to maintain or renew key business
relationships; failure to maintain competitive offerings; failure to maintain or
renew sources of financing; failure to complete, or delays in completing,
anticipated new partnership arrangements or acquisitions and the failure to
successfully integrate or otherwise achieve anticipated benefits
from such partnerships or acquired businesses; failure to
successfully expand business internationally; the impact of foreign exchange rates
on operations, revenue and income; the effects of general economic
conditions on fueling patterns and the commercial activity of fleets, as well as the other
risks and uncertainties identified under the caption "Risk Factors" in our
Annual Report on Form 10-K for the year ended December
31, 2011. These factors could cause our actual results and experience to differ
materially from any forward- looking statement. Given these risks and
uncertainties, you are cautioned not to place undue reliance on these forward-
looking statements. The forward-looking statements included in this
presentation are made only as of the date hereof. We do not undertake, and
specifically decline, any obligation to update any such statements or to publicly announce the
results of any revisions to any of such statements to reflect future events or
developments. You may get FleetCor’s Securities
and
Exchange
Commission
(“SEC”)
Filings
for
free
by
visiting
the
SEC
Web
site
at
www.sec.gov
or
FleetCor’s
investor
relations
website
at
investor.fleetcor.com.
Trademarks
which
appear
in
this
presentation
belong
to
their
respective owners.
2 |
 3
Company Overview
Key Investment Highlights
Growth Strategy
Financial Overview
Agenda |
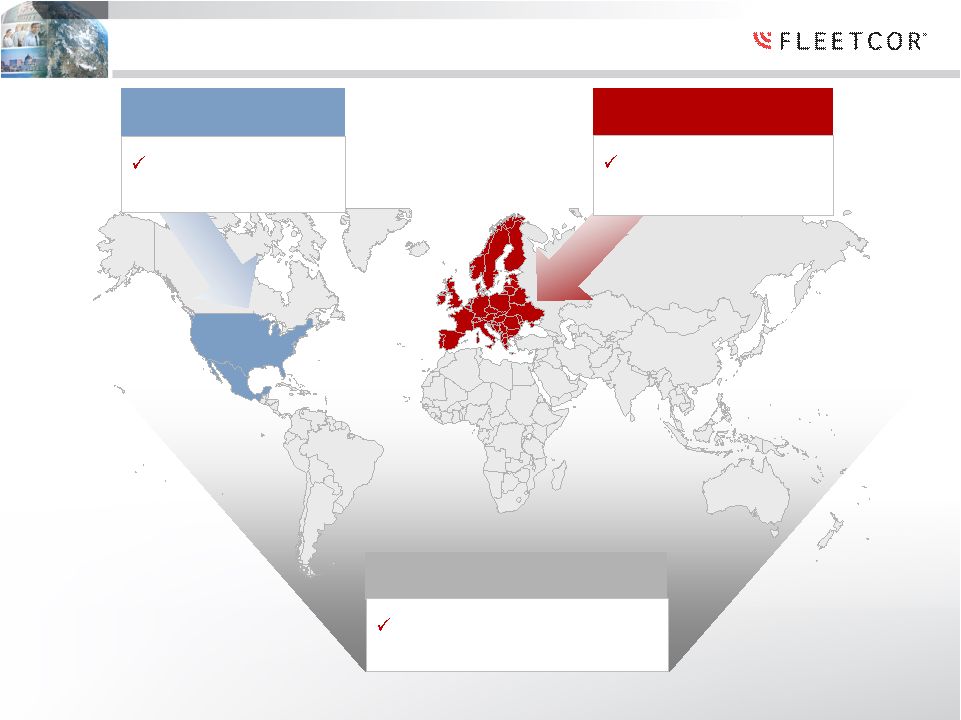
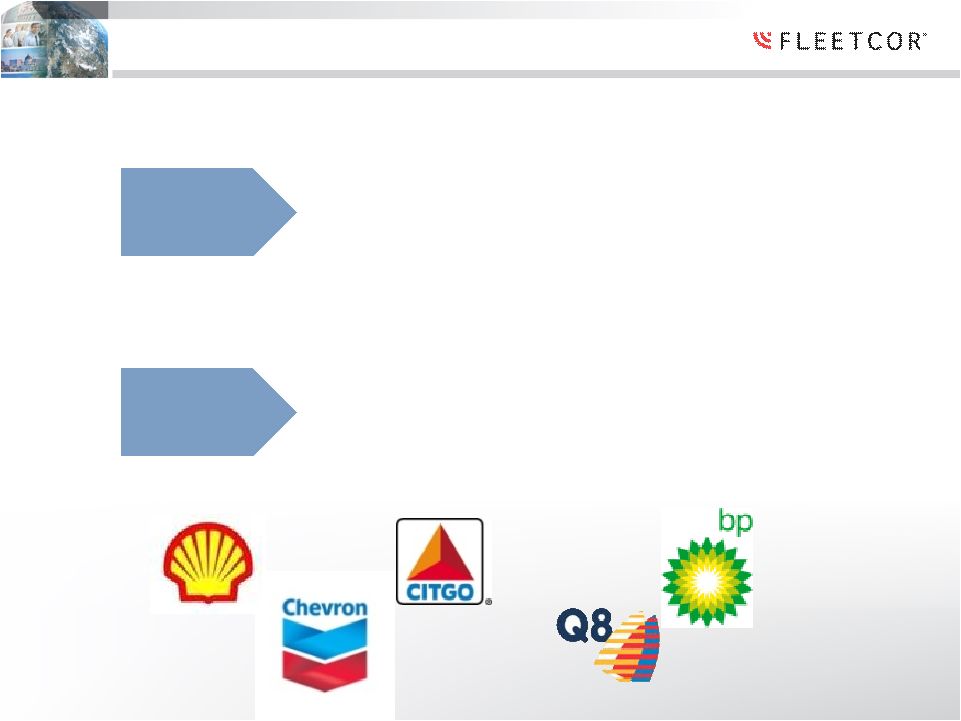
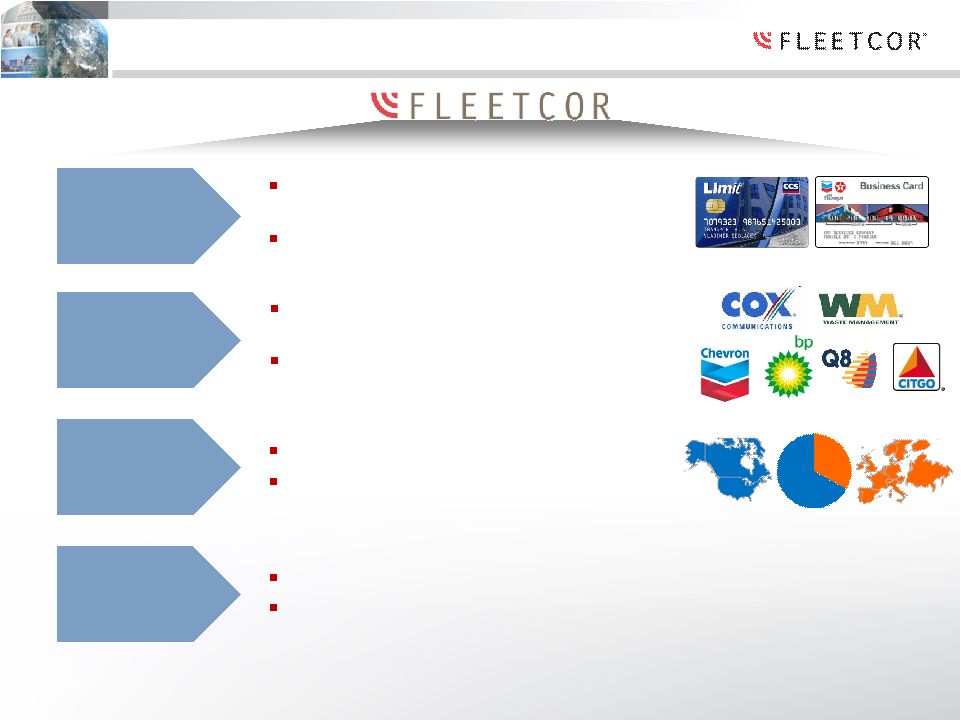 FleetCor –
A Leading Global Fleet Card Company
Core
Products
Target
Customers
Special-purpose business charge cards
(e.g., fuel)
Value proposition: control and savings
Businesses and government entities
with vehicles
Major oils and fuel marketers with fuel
card programs (e.g. Partners)
4
Global
Scope
21 countries and 17 offices worldwide
One-third of revenue outside U.S.
1
67%
33%
Strong
Performance
28%
revenue
growth
2
(2003
–
2011)
41% adjusted net income growth
3
(2003 –
2011)
1
Based on consolidated revenue for year ended December 31, 2011
2
Revenue reported on a managed basis
³
Adjusted
net
income
is
defined
as
GAAP
net
income
+
amortization
(net
of
taxes)
+
stock
option
expense
(net
of
taxes) |
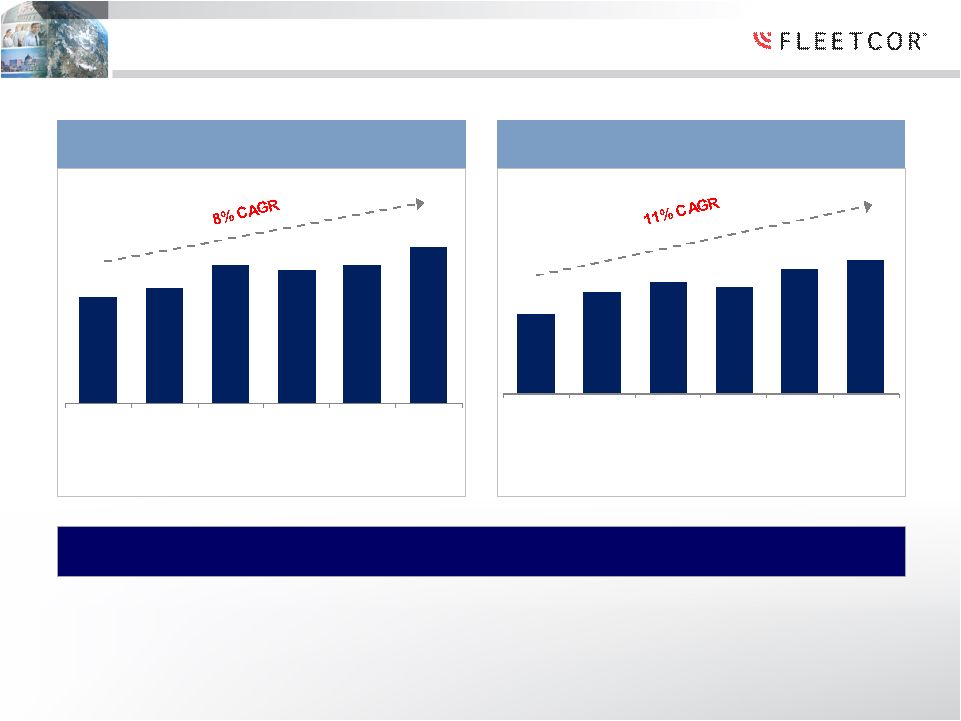
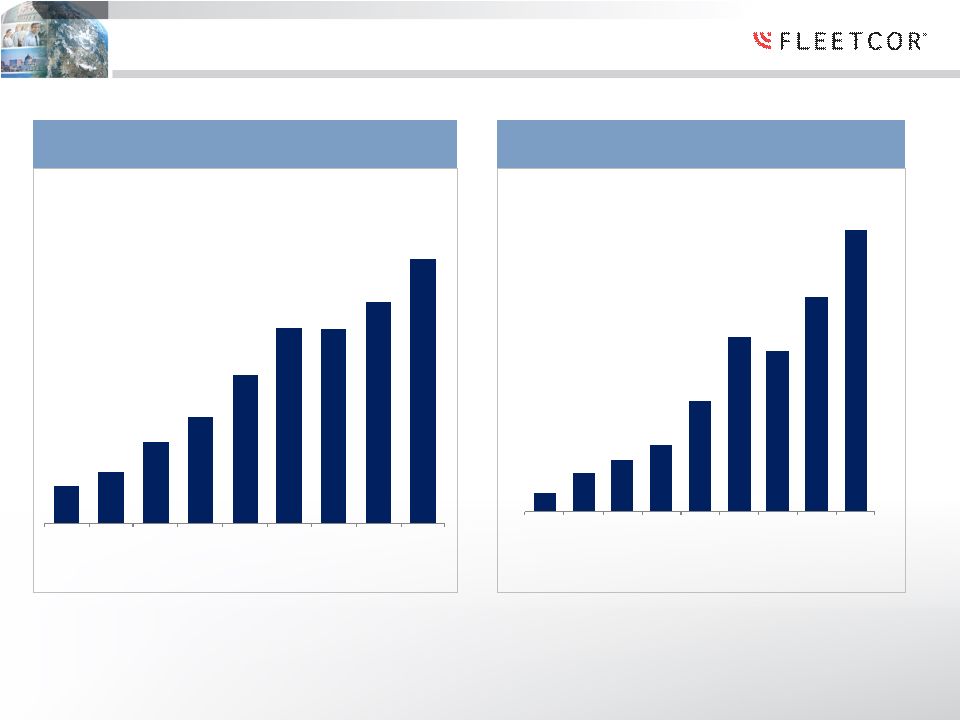 Track
Record of Growth… Proven Track Record of Solid Financial
Performance 1
Revenue reported on a managed basis
2
Adjusted
net
income
is
defined
as
GAAP
net
income
+
amortization
(net
of
taxes)
+
stock
option
expense
(net
of
taxes)
3
2010
is
reflected
on
a
pro
forma
basis
(to
reflect
the
impact
of
public
company
expenses,
loss
on
extinguishment
of
debt,
non-cash
compensation expenses associated with our stock plan and an increase in the
effective tax rate, effective during 2011) Revenue
1
($M)
Adjusted
Net
Income
2
($M)
$73
$100
$160
$210
$292
$384
$381
$434
$520
2003
2004
2005
2006
2007
2008
2009
2010
2011
$12
$25
$33
$43
$71
$113
$104
$139
$182
2003
2004
2005
2006
2007
2008
2009
2010
2011
2003-2011
3
CAGR
=
41%
2003-2011 CAGR = 28%
5 |
 6
Company Overview
Key Investment Highlights
Growth Strategy
Financial Overview
Agenda |
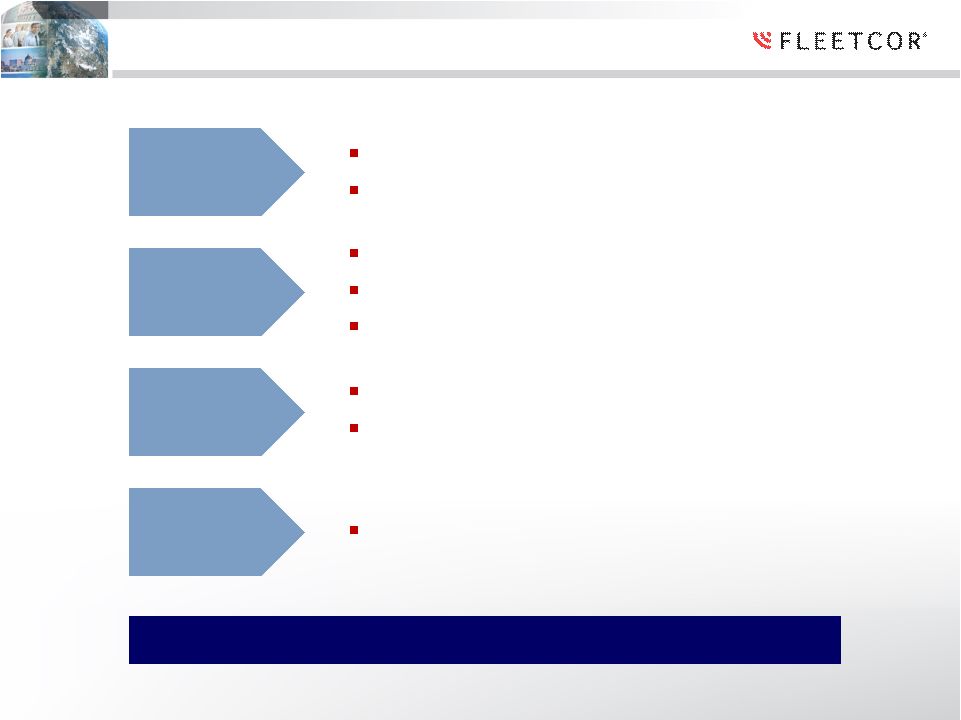
 Downside Protection…
Significant Barriers to Entry
Ten networks around the world with
more than 35,000 merchants contracted
individually
Proprietary
Networks
Differentiated
Technology
Broad
Distribution
Strong
Relationships
Specialized, next generation,
global processing system (GFN)
Distribution capabilities across multiple
channels, direct and via partners
Numerous, long-term relationships with
merchants, customers and partners
A difficult business to enter regardless of scale
7 |
 Attractive Model…
An Attractive, Predictable Business Model
Transaction-based
Recurring, routine purchases
Recurring
Revenue
Diversified
Revenue
Highly
Profitable
33% of revenues outside the U.S. in 2011
55% from customers, 45% from merchants
Low customer concentration (~600k accounts)
~50% EBITDA margins
Resulting in a business you can plan
8
High
Operating
Leverage
Low variable costs
Low capex requirements |
 Large
Global Market… Lots of Room to Grow
U.S.
Europe
Rest of World
1
Gallons of commercial fuel purchased annually
2
Year ended December 31, 2011
3
2008 data from Packaged Facts, Commercial Payment Cards, December 2009
4
Based on 67.3bn litres of commercial fuel card volume (3.7854 litres = 1 gallon) and
59% penetration. Fuel card volume is 2009 data from Datamonitor, Commercial Fuel Cards Database 2010:
Europe, and covers the following 25 markets: Austria, Belgium, Czech Republic,
Denmark, Estonia, Finland, France, Germany, Greece, Hungary, Ireland, Italy, Lithuania, Luxembourg, Netherlands,
Norway, Poland, Portugal, Romania, Slovakia, Slovenia, Spain, Sweden, Switzerland,
United Kingdom 5
Based on 2009 global oil consumption, where the U.S. and developed European markets
consumed 38% and the remaining markets consumed 62% FleetCor
Penetration
Commercial
Fuel Volume¹
FleetCor
Fuel Volume
1,2
We want a piece of every commercial fuel transaction on the planet
9
Total
56B
3
3.4B
6%
30B
4
1.6B
5%
140B
5
0.1B
0.1%
226B
6.1B
3% |
 10
Company Overview
Key Investment Highlights
Growth Strategy
Financial Overview
Agenda |
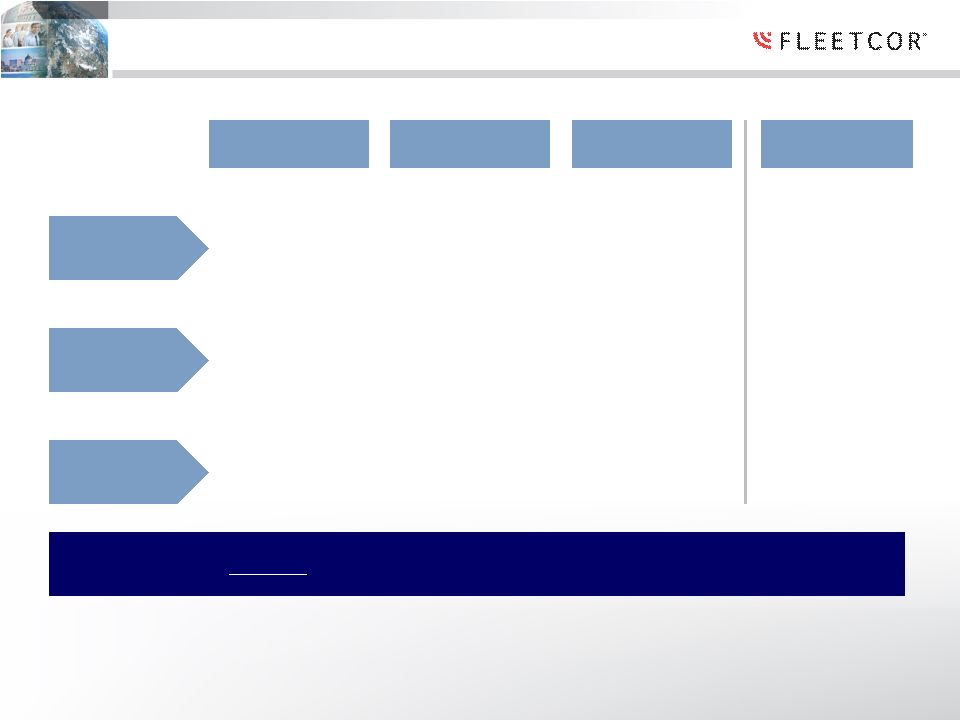
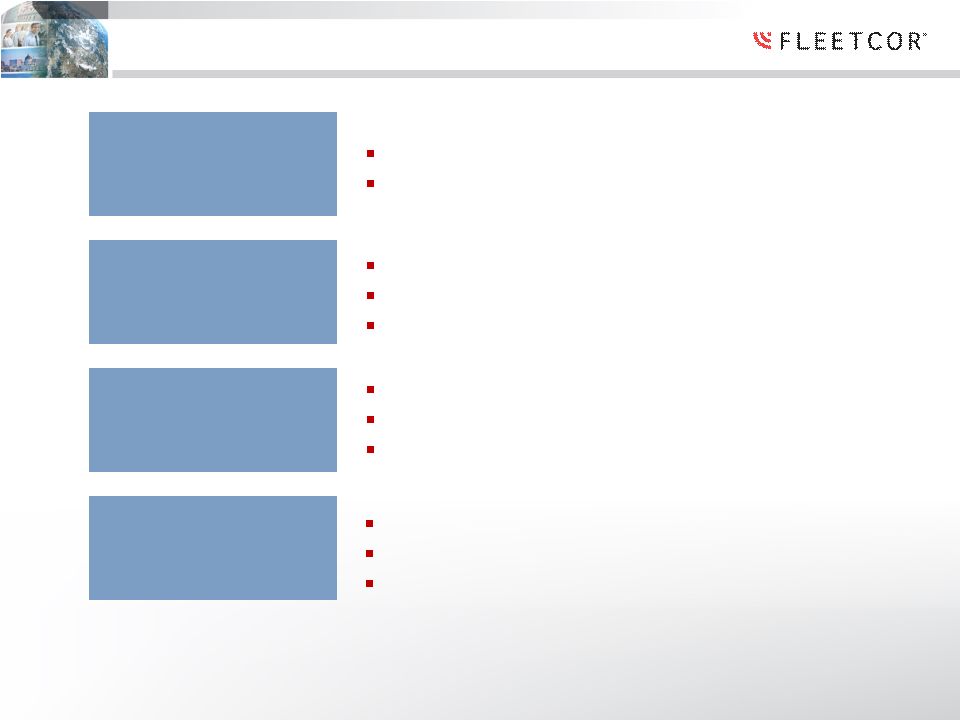
 Big
Market…. Opportunity Varies By Geography
11
Partner Outsourcing
Manage major oil
in-house card programs
Share Shift
Win accounts from
competitors
Increase Adoption
Convert businesses to fuel cards
from other payment methods |
 We
“build” the business we own by investing in sales and
marketing and product innovation
•
Spent over $34m on sales and marketing in 2011
•
Market our products through multiple sales
channels
•
“New”
(non field) channels accounted >50% of
US sales
Invest in Sales
and Marketing
Product
Innovation
Penetrate
Target Markets
Further
•
Grow revenue through new product features and
functionalities
•
Add new product offerings (Extended network
cards, Telematics, Price protection, Fleetwide,
Fleetsource, etc.)
•
Add more customers through investment in
sales and marketing new products
•
Enter into more strategic relationships
Fiscal Year 2011 transactions grew 12% and revenue per transaction
grew 8%
12 |
 We
“buy” and improve performance of acquired companies
•Completed over 45
acquisitions •In 2011,
we completed two strategic acquisitions -Mexico Prepaid Card business -Allstar-leading UK Fuel Card provider
•Focus on emerging
markets -BRIC
countries Grow Through
Strategic
Acquisition
We Improve
the
Businesses
We Buy
•Economies of scale
•Leverage state-of-the-art processing systems •Run them the “FleetCor way”
13 |
 We
“Partner” With Major Oil and Petroleum Marketers
•GFN
–
Industry
platform
•Revenue management
•Full program
outsourcing Services we
offer
14
•Euro Shell…the world’s largest commercial oil
portfolios
in
35
countries
•Pantry…awarded new long term contract
Recent partner
wins |
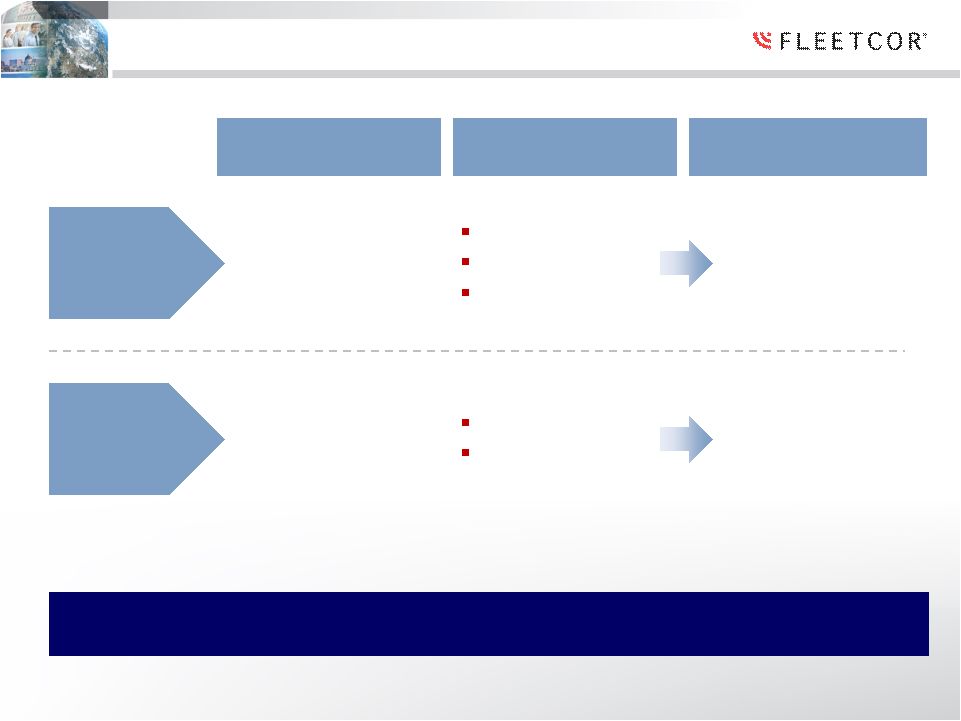
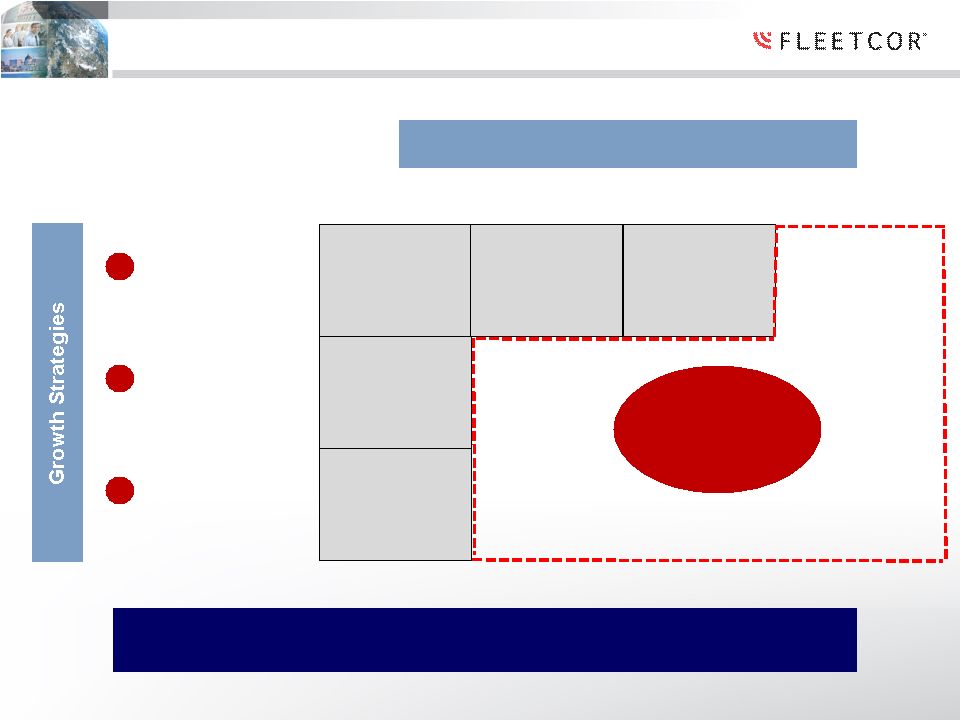 Growth Strategy…
An Attractive Growth Opportunity –
Emphasize ROW
US
Europe
Latin
America
BIG GROWTH
OPPORTUNITY
Geographies
Plan to focus more of our energy on emerging markets …
and
repeat the three-pronged approach that’s working in U.S. & Europe
15
Acquisitions
Buy & Improve
Partners
Sign to
Outsourcing
Innovation
New Products &
Sales Channels
1
2
3
Rest of World |
 16
Company Overview
Key Investment Highlights
Growth Strategy
Financial Overview
Agenda |
 Financial Highlights
28%
Revenue
growth
(2003
–
2011)
1
41%
Adjusted
net
income
growth
(2003
–
2011)
High
Growth
Strong Operating
Leverage
49%
2
Adjusted EBITDA margin (2011)
Highly leverageable cost structure
High cash flow fuels growth initiatives
>$500m
of
liquidity,
undrawn
revolver
3
Low
leverage
…
~1.30x
Adj.
EBITDA
4
Low
Capex
…
approximately
2.5%
of
revenue
5
Strong Balance Sheet
Predictable recurring revenue sources
Low fuel price sensitivity
Minimal credit risk
Stable and Predictable
1
Revenue reported on a managed basis
2
Calculated
as
Adjusted
EBITDA (excluding
stock
comp
expense)
divided
by
managed
revenue
3
As of December 31, 2011
4
Debt
outstanding
(excluding
the
securitization
facility)
divided
by
LTM
EBITDA
for
the
year
ended
December
31,
2011
5
For the year ended December 31, 2011
17 |
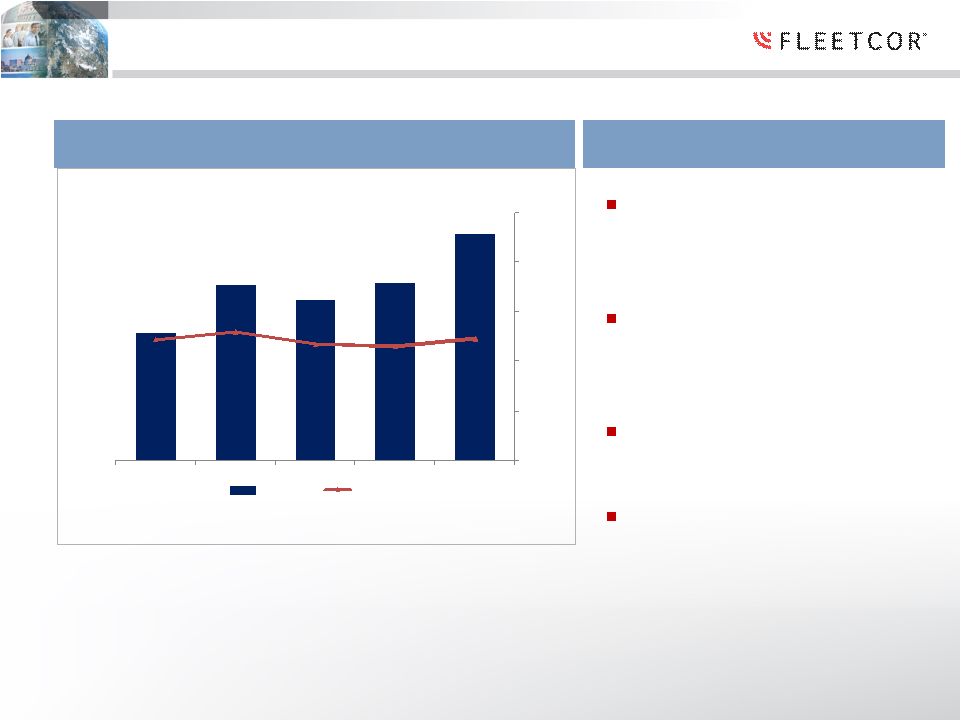
 Driven By Both Volume and Rate Enhancement
Transaction
Volume
1
(M)
Revenue
per
Transaction
2
Strong
underlying
growth
trends
in
our
key
metrics
drive
revenue
growth
1
2006 transactions estimated based on 2007’s average gallons per
transaction 2
2006 –
2010 revenue reported on a managed basis
* 2010 transaction volume and revenue per transaction have been
adjusted to exclude the impact of a non-renewed partner contract in
Europe, inherited from an acquisition, which we chose not to renew.
146
158
189
184
190
215
2006
2007
2008
2009
2010*
2011
$1.45
$1.84
$2.02
$1.92
$2.27
$2.42
2006
2007
2008
2009
2010*
2011
18 |
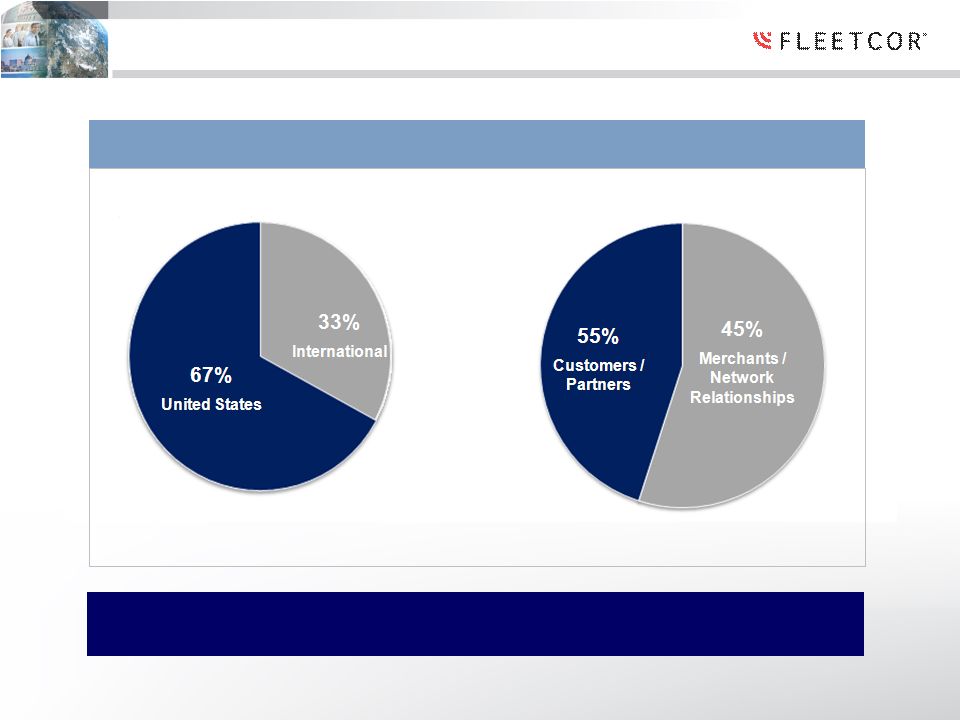 Well-Diversified Revenue Mix
19
Diverse
business
mix
reduces
top
line
volatility
from
geographic
and
macroeconomic factors
2011 Revenue Breakout (%) |
 ~20% of revenue tied
directly to fuel prices
No direct impact from
changes in fuel prices
Customers /
Partners
Limited Fuel Price Exposure
2011 Revenue
Revenue Type
Merchant /
Network
Relationships
Limited sensitivity to fuel price movements
20
Fuel Price Sensitivity
45%
55%
% of spend
Fixed fee
Spread-based
Program fees
Other fees |
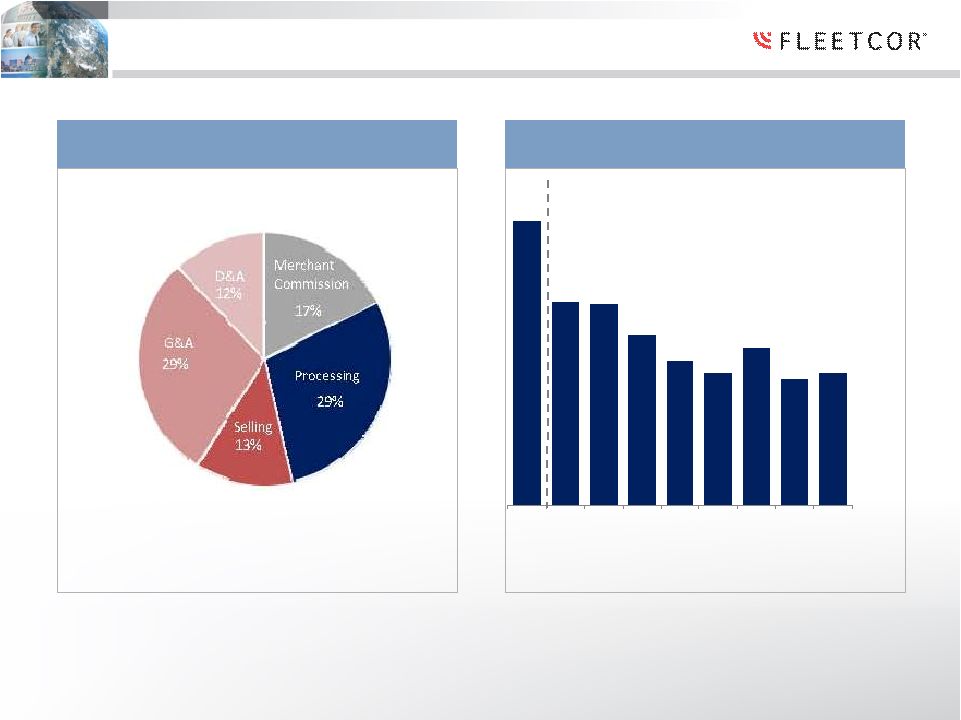 Strong Operating Leverage with Low Credit Risk
21
Bad Debt as a % of Billed Revenue
0.45%
0.32%
0.32%
0.27%
0.23%
0.21%
0.25%
0.20%
0.21%
'06-
'09
Q1 10
Q2 10
Q3 10
Q4 10
Q1 11
Q2 11
Q3 11
Q4 11
2011
Expense
Breakdown
1
1
For the year ended December 31, 2011 FleetCor’s variable expenses were 37% of
total operating expenses. Variable expenses are expenses that are directly impacted by transaction volume. The
remaining 63% of total operating expenses are considered fixed expenses
|
 Strong EBITDA Margins and Operating Leverage
EBITDA
1
and
Adjusted
EBITDA
Margin
($M)
1
Adjusted EBITDA divided by managed revenue; Adjusted EBITDA is calculated as EBITDA
adjusted for the incremental interest expense attributable to the securitization facility
* 2010 is reflected on a pro forma basis (to
exclude the impact of a charge related to stock comp expense and to reflect the impact of public company expenses, loss on extinguishment
of
debt,
non-cash
compensation
expenses
associated
with
our
stock
plan
and
an
increase
in
the
effective
tax
rate,
effective
during
2011)
$143.8
$198.0
$180.6
$201.1
$256.2
49.0%
52.0%
47.0%
46.3%
49.3%
0.0%
20.0%
40.0%
60.0%
80.0%
100.0%
$-
$30.0
$60.0
$90.0
$120.0
$150.0
$180.0
$210.0
$240.0
$270.0
2007
2008
2009
2010*
2011
Adj. EBITDA
Margin %
22
Increasing revenue per
transaction
Highly scalable operating
model
Low variable costs
Low incremental capex
Superior Operating Leverage |
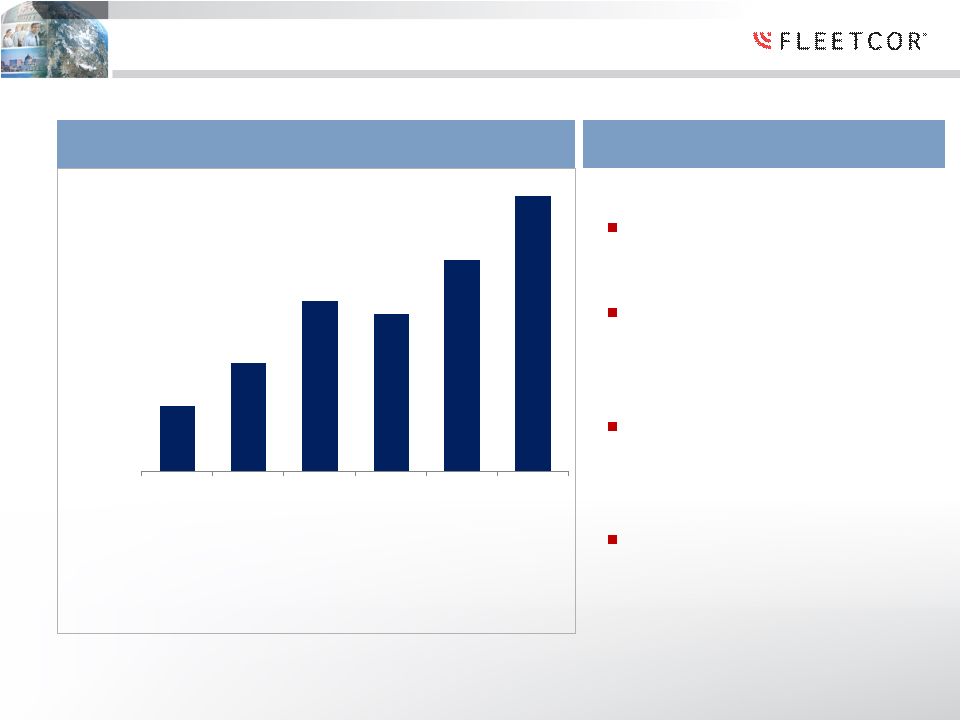 Solid Stable Cash Flow Generation
Adjusted
Net
Income
1
($M)
$43
$71
$113
$104
$139
$182
$(10)
$10
$30
$50
$70
$90
$110
$130
$150
$170
$190
2006
2007
2008
2009
2010*
2011
23
Adjusted
Net Income
($M)
Grow core business
Pursue selective
acquisitions
Continue new product
innovation
Enter new markets
Fueling Growth Initiatives
$5.3
$7.1
$7.1
$9.7
$13.5
Total Capex
($M)
2.5%
2.7%
2.1%
2.7%
2.6%
% revenue
+
1
Adjusted
net
income
is
defined
as
GAAP
net
income
+
amortization
(net
of
taxes)
+
stock
option
expense
(net
of
taxes),
and
is
comparable
to
free
cash
flow
defined
as
cash
flow
from
operations
–
capital
expenditures
•
2010
is
reflected
on
a
pro
forma
basis
(to
exclude
the
impact
of
a
one-time
charge
related
to
stock
comp
expense
and
to
reflect
the
impact
of
public
company
expenses,
loss
on
extinguishment
of
debt
non-cash
compensation
expenses
associated
with
our
stock
plan
and
an
increase
in
the
effective
tax
rate,
effective
during
2011)
+
Revenue is defined as reported revenue
$11.2
2.6% |
 Appendix |
 Reconciliation of Reported Revenue to Managed Revenue
Year Ended December 31,
($M)
2011
2010
2009
2008
2007
2006
Reported
Revenue
$519.6
$433.8
$354.1
$341.1
$264.1
$186.2
Adjustments:
Processing
Expense
_
_
21.9
27.4
11.3
10.4
Interest Expense,
Net
_
_
5.3
15.8
16.2
13.1
Managed
Revenue
$519.6
$433.8
$381.3
$384.3
$291.6
$209.7 |
 Reconciliation of Net Income to EBITDA and Adjusted EBITDA
Year Ended December 31,
($M)
2011
2010
2009
2008
2007
2006
2005
Net income
$147.3
$107.9
$89.1
$97.3
$61.6
$38.0
$30.7
Provision for Income Taxes
63.5
43.4
40.6
37.4
26.0
22.0
18.7
Interest Expense, Net
13.4
20.5
17.4
20.3
19.7
11.9
7.6
Other Income
(0.6)
(1.3)
Depreciation and Amortization
36.2
33.7
28.4
27.2
20.3
12.6
7.4
Loss on extinguishment
2.7
EBITDA
$262.5
$204.2
$175.3
$182.2
$127.6
$84.4
$64.4
Securitzation Adjustment
5.3
15.8
16.2
13.1
7.0
Incremental Interest Expense
6.3
6.5
Adjusted EBITDA
$256.2
$197.7
$180.6
$198.0
$143.8
$97.5
$71.4
*
Beginning
in
2010,
the
Company’s
income
statement
no
longer
reflects
activity
related
to
its
retained
residual
interest
in
eligible
accounts
receivable
sold
to
Funding,
but
instead
reflect the activity related to its securitized accounts receivable and the
corresponding securitized debt, including interest income, fees generated from late payments, provision for
losses on accounts receivable and interest expense. Prior to 2010, interest expense
and the provision for losses on accounts receivable associated with the securitized accounts
receivable were included as a deduction from revenues, net in the consolidated
statements of income. Thus, prior to 2010, a securitization adjustment is necessary to present
comparable measures of Adjusted EBITDA. |
 Reconciliation of Adjusted EBITDA to Pro Forma Adjusted
EBITDA
($M)
Year Ended 2010
Changes
Pro forma 2010
Net income
$107.9
$ (1.7)
$106.2
Provision for Income Taxes
43.4
2.4
45.8
Interest Expense, Net
20.5
-
20.5
Other Income
(1.3)
-
(1.3)
Depreciation and Amortization
33.7
-
33.7
Loss on extinguishment
2.7
2.7
EBITDA
$204.2
$3.40
$207.6
Incremental Interest Expense
6.5
6.5
Adjusted EBITDA
$197.7
$3.4
$201.1 |
 Reconciliation of Net Income to Adjusted Net Income
Year Ended December 31,
($M)
2011
2010
2009
2008
2007
2006
2005
Net Income
$147.3
$107.9
$89.1
$97.3
$61.6
$38.0
$30.7
Stock-based
Compensation Expense
21.7
26.8
2.7
2.8
1.2
0.1
–
Amortization of
Intangible Assets
19.6
17.2
13.9
12.0
9.8
5.0
2.1
Amortization of
Premium on Receivables
3.3
3.3
3.3
5.5
1.7
1.4
0.6
Amortization of
Deferred Financing Costs
1.9
2.0
1.8
1.1
0.9
1.0
1.2
Loss on Extinguishment of Debt
2.7
0.0
0.0
0.0
0.0
0.0
0.0
Total Pre-tax Adjustments
$49.1
$49.2
$21.7
$21.4
$13.6
$7.5
$4.0
Income tax Impact of Pre-tax
Adjustments
(14.8)
(14.1)
(6.8)
(5.9)
(4.0)
(2.8)
(1.5)
Adjusted Net Income
$181.7
$143.0
$103.9
$112.7
$71.1
$42.8
$33.1 |
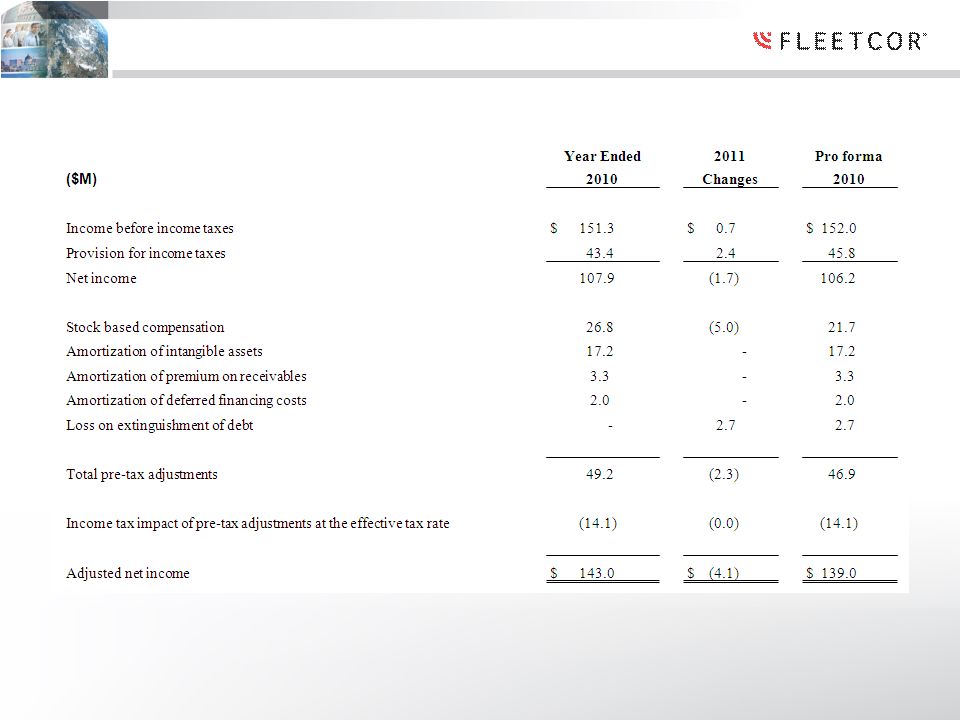 Reconciliation of Adjusted Net Income to Pro Forma Adjusted
Net Income |
 Reconciliation of Revenue to Revenue Excluding the Impact of a
Non-Renewed Contract
Year Ended December 31,
($M)
2011
2010
2009
North America
Revenues, net
$ 348.8
287.8
$ 227.4
Excluding non-renewed contract revenues
-
-
-
Revenues, net, excluding the impact of a non-renewed contract
$ 348.8
$ 287.8
$ 227.4
International
Revenues, net
$ 170.8
$ 146.0
$ 126.7
Excluding non-renewed contract revenues
-
(0.8)
(1.3)
Revenues, net, excluding the impact of a non-renewed contract
$ 170.8
$ 145.2
$ 125.4
Consolidated
Revenues, net
$ 519.6
$ 433.8
$ 354.1
Excluding non-renewed contract revenues
-
(0.8)
(1.3)
Revenues, net, excluding the impact of a non-renewed contract
$ 519.6
$ 433.0
$ 352.8
* Calculation of revenue per transaction for our International segment and on a
consolidated basis for the years ended December 31, 2010 and 2009 excludes the impact of a
non-renewed partner contract in Europe, inherited from an acquisition, which we
chose not to renew. This non-renewed contract contributed approximately 3.6 million
transactions and $0.9 million in revenues, net to our International segment in the
year ended December 31, 2010 and approximately 6.9 million transactions and $1.3 million in
revenues, net to our International segment in the year ended December 31, 2009.
This contract had a high number of transactions and very little revenue and if we had included
it in the calculation would have reduced International segment revenue per
transaction by $0.25 negative and $0.38 in the years ended December 31, 2010 and 2009,
respectively.
The
table
above
reconciles
revenues,
net
per
GAAP
to
Revenues,
net,
excluding
the
impact
of
this
non-renewed
partner. |