Attached files
| file | filename |
|---|---|
| 8-K - FORM 8-K - EXELON GENERATION CO LLC | d325275d8k.htm |
 Bank
of America Merrill Lynch 2012 Megawatt Round Up Conference
Houston, Texas
Joe Nigro, Senior Vice President, Portfolio Strategy
Ed Quinn, Senior Vice President, Wholesale Trading & Origination
March 28, 2012
Exhibit 99.1 |
 2
Cautionary Statements Regarding
Forward-Looking Information
This presentation includes forward-looking statements within the meaning of the Private Securities
Litigation Reform Act of 1995 that are subject to risks and uncertainties. The factors that
could cause actual results to differ materially from these forward-looking statements
include those discussed herein as well as those discussed in (1) Exelon
Corporation’s (Exelon) 2011Annual Report on Form 10-K in (a) ITEM 1A. Risk Factors,
(b) ITEM 7. Management’s Discussion and Analysis of Financial Condition and Results of Operations,
and (c) ITEM 8. Financial Statements and Supplementary Data: Note 18; (2) Constellation Energy Group,
Inc.’s 2011 Annual Report on Form 10-K in (a) ITEM 1A. Risk Factors, (b) ITEM 7.
Management’s Discussion and Analysis of Financial Condition and Results of Operations, and
(c) ITEM 8. Financial Statements and Supplementary Data: Note 12; and (3) other factors
discussed in filings with the Securities and Exchange Commission by Exelon, Commonwealth Edison
Company, PECO Energy Company, Baltimore Gas and Electric Company, and Exelon Generation
Company, LLC (Companies). Readers are cautioned not to place undue reliance on these
forward-looking statements, which apply only as of the date of this presentation. None of
the Companies undertakes any obligation to publicly release any revision to its forward-looking
statements to reflect events or circumstances after the date of this presentation. |
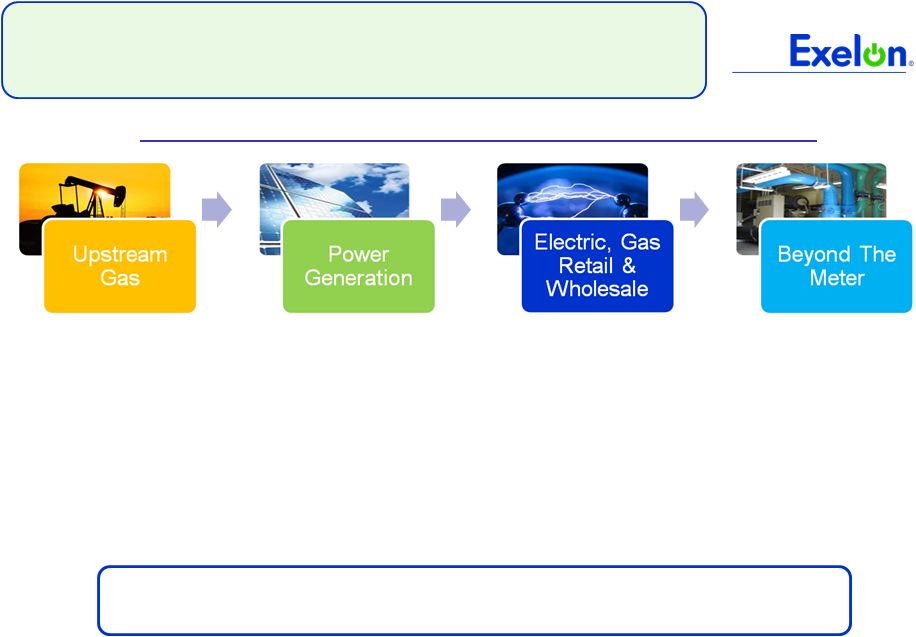 Commercial Background
3
3
Development and
exploration of natural gas
properties
10 assets in six states
294 Bcf of proved
reserves
¹
Largest merchant power
generation portfolio in the
U.S.
Over 34 GW of owned
generation
capacity
²
Clean portfolio, well
positioned for evolving
regulatory requirements
A leading competitive
supplier of power in the
U.S.
164 TWh of load and
382
bcf
of
gas
delivered
³
Over 1 million residential
and 100,000 business and
public sector customers
The merger creates the largest –
and growing –
competitive integrated
energy company in the U.S.
One of the largest and
most experienced Load
Response providers
1,730 MW of Demand
Response
under
contract
Over 4,000 energy savings
projects implemented
across the U.S.
Scale, Scope and Flexibility Across the Energy Value Chain
(1)
Estimated proved reserves as of 12/31/2011.
(2)
Total owned generation capacity as of 12/31/2011, net of physical market mitigation
(Brandon Shores, C.P. Crane and H.A. Wagner ~2,648 MW).
(3)
Actuals
for
2011.
Electric
load
and
gas
includes
fixed
price
and
indexed
products.
(4)
DR estimate is as of February 2012.
4 |
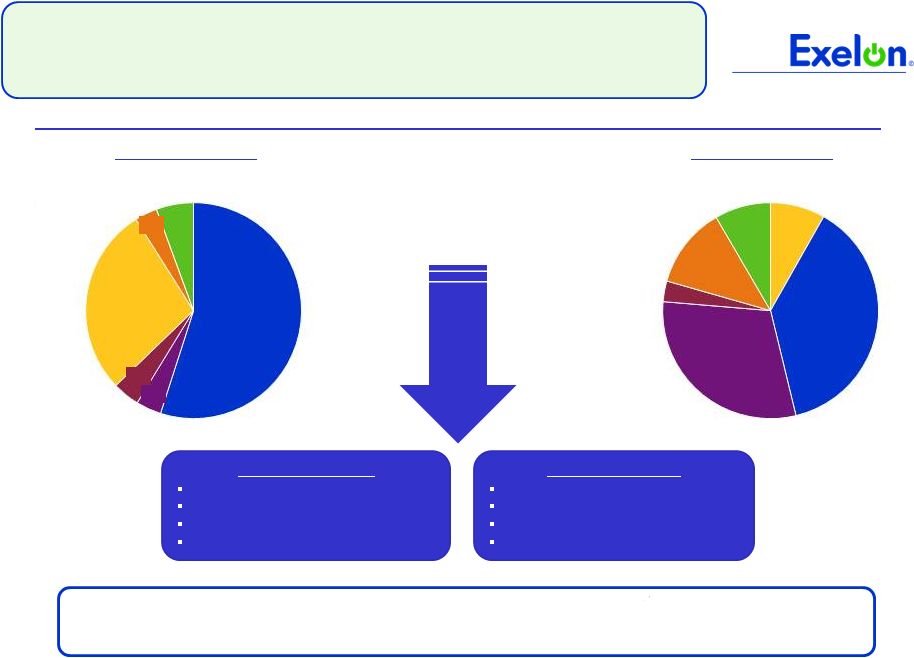 Commercial Background:
Generation 4
Power Generation Capacity –Technologically and Regionally Diverse Fleet
Other
9%
ERCOT
12%
NYISO
3%
PJM West
30%
PJM East
38%
NEPOOL
Owned Generation
(Technology Type)
6%
Wind/Solar/Other
3%
Gas
Oil
4%
Coal
(2)
4%
Nuclear
55%
Hydro
One of the largest and cleanest fleets in the U.S., with unparalleled upside
from tightening power markets
Owned
Generation
Capacity
(1)
:
~ 34,650 MW
Owned Generation
(ISO)
Multiple Channels
Retail -
Residential, C&I
Wholesale / POLR
Over The Counter
Mid Marketing & Origination
Multiple Products
Load -
fixed shape, full requirement
Standard products, basis
Options -
Power, Gas & Heat Rate
Emission credits, RECs
(1)
Total owned generation capacity as of 12/31/2011, net of physical market mitigation (Brandon Shores, C.P. Crane and H.A. Wagner ~2,648 MW).
(2)
Coal capacity shown above does not include Eddystone 2 (309 MW) to be retired on 6/1/2012. 28%
8% |
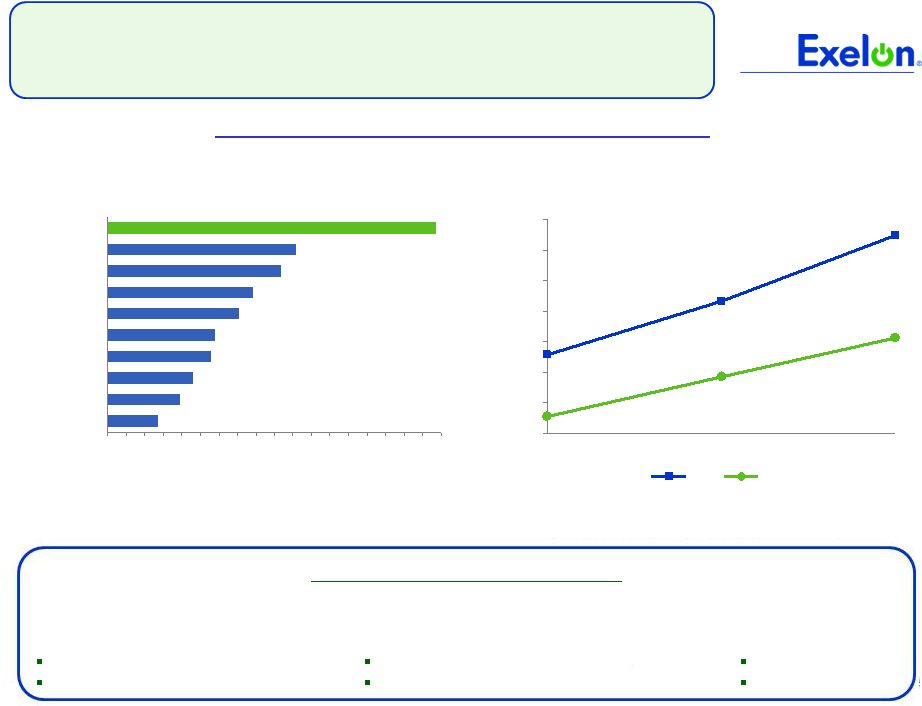 Leading Retail Electric Business in the U.S.
Commercial Background: Retail
5
The “Constellation Difference”
National Coverage (Energy Value & Services for all US Facilities)
Supply & Demand Side Services
Power & Gas Commodity
Demand Response
Energy Efficiency
Real-time Energy Management
On Site Solar
Renewables
(1) Exelon and Constellation combined retail businesses
Source: KEMA, “The Retailer Yearbook”, December 2011
Trends in Switched Retail Power Market
(Est.
Switched
Rates,
%
Eligible
U.S.
MWhs)
(2)
(2) Eligible retail power market defined as “universe that can be sold to
competitively, excluding Muni/Co-Op”; Switched market
defined as “capacity that has switched to a retail service
provider”; Source: KEMA. 90
80
70
60
50
40
30
20
10
0
Constellation
1
Leadership Position in Electric Sales
(Est. Annual Sales, Top 10 Non-residential North American Retailers)
2011 Annualized Volume (TWh)
0%
10%
20%
30%
40%
50%
60%
70%
Projected 2012
2008
2003
Residential
C&I |
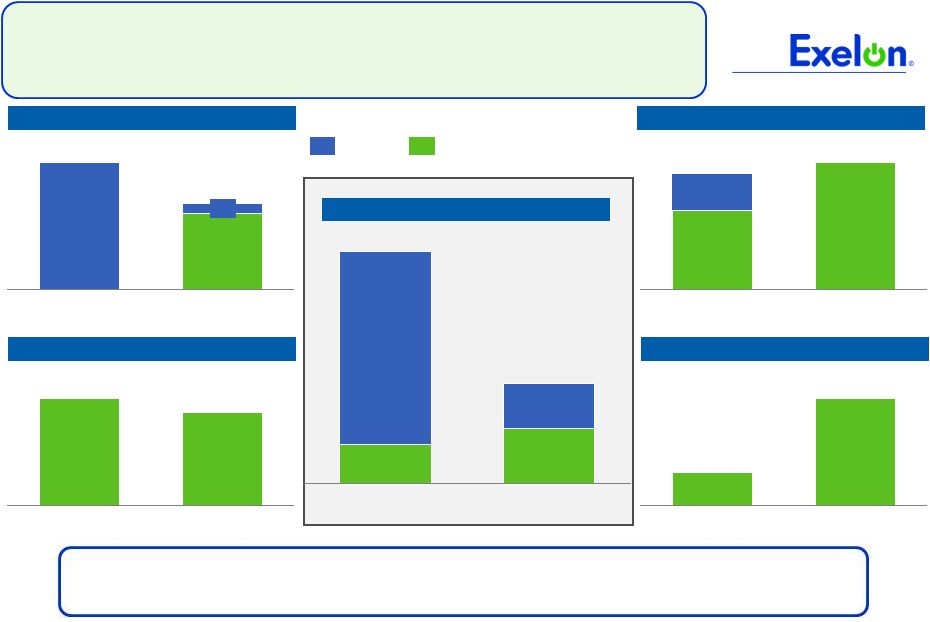 Portfolio Matches Generation with Load in
Key Competitive Markets
6
MISO (TWh)
PJM
(1)
(TWh)
South
(2)
(TWh)
ISO-NE & NY ISO
(3)
(TWh)
West
(4)
(TWh)
Note: Data for Exelon and Constellation represents actual generation (owned and
contracted) and actual electric sales for 2011. Generation is adjusted for assets that have
long term PPAs sold by Exelon or Constellation, including but not limited to wind
and South assets. Exelon load doesn’t include the ComEd swap (~26 TWh). Index load,
which
is
a
pass
through
load
product
with
no
price
or
volumetric
risk
to
the
seller,
is
not
included
in
the
load
estimate.
(1)Constellation generation includes output from assets to be mitigated (Brandon
Shores, C.P. Crane and H.A. Wagner with total generation ~8.4 TWh).
(2)Represents load and generation in ERCOT, SERC and SPP.
(3)Constellation load includes ~0.7 TWh of load served in Ontario.
(4)Constellation generation includes ~0.4 TWh of generation in Alberta.
Load
74.8
41.3
33.5
Generation
175.1
29.4
145.7
Former Constellation
Exelon
Load
5.8
5.2
0.6
Generation
8.6
8.6
Load
26.6
Generation
24.2
16.6
7.6
Load
1.9
Generation
0.6
Load
29.1
29.1
Generation
33.5
33.5
The combination establishes an industry-leading platform with regional
diversification of the generation fleet and customer-facing load business
|
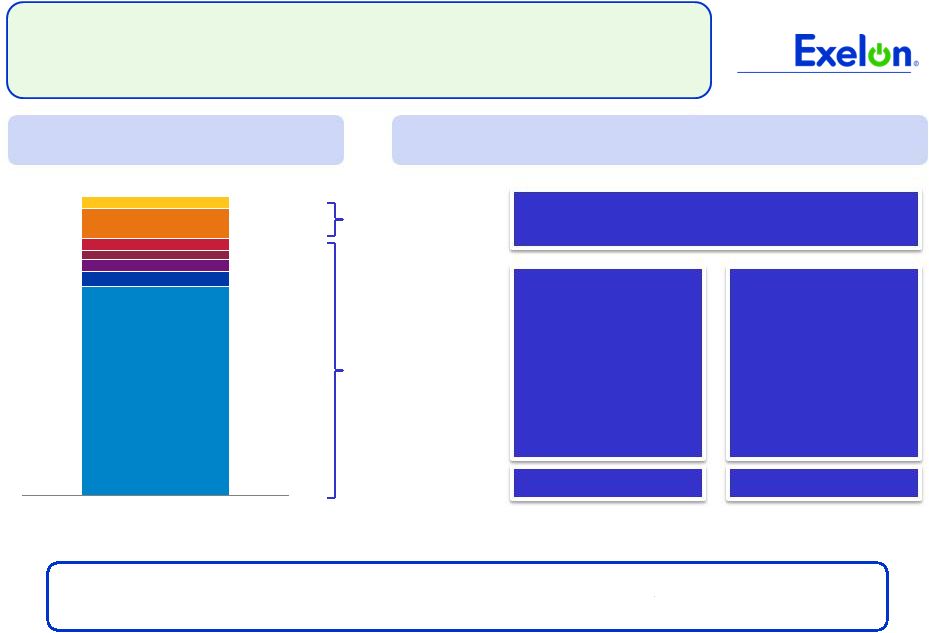 Pricing and Portfolio Management
Approach
7
Transmission
Ancillaries
Renewable
Load Shape
Basis
Block Energy
Capacity
Hedged primarily
with generation –
baseload,
intermediate &
peaking
Hedged via market
based products –
blocks, fixed load
shapes, options,
RECs
Fixed or determinable
Transmission
& Capacity
Block Energy,
Basis,
Load Shape,
Renewables &
Ancillaries
Pricing Build Up (Illustrative)*
1. Full requirements pricing build up is for illustrative purpose and not
reflective of any one particular product or zone. Margins are not shown in the build up.
Constellation's model will be an integrated approach to load management,
selling the products that closely tie to the asset portfolio
Full Requirements Components
1
Pricing and Portfolio Management Approach
Integrated Portfolio
Pure Play Retail |
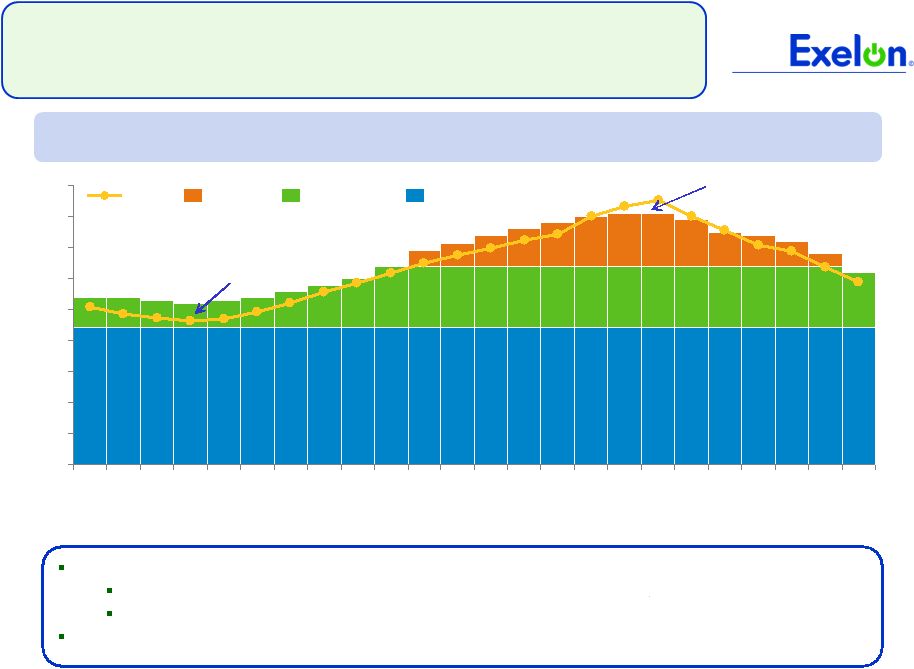 Load
and Generation Match 8
0
1,000
2,000
3,000
4,000
5,000
6,000
7,000
8,000
9,000
24
22
20
18
16
14
12
10
8
6
4
2
MW
Hour Ending
Baseload
Intermediate
Peaking
Load
Our generation portfolio is low cost, flexible and diverse
Large portion of a load following contract is ATC or Peak blocks, which we own
Adequate intermediate and peaking capacity within the portfolio for managing peaking
load Any residual shortfall can be supplemented by market products (physical
and or financial) Surplus: sell into the
market
Deficit : Buy from the
market
Matching Load with Generation
(illustrative*)
* Generation and load matching diagram is for
illustrative purpose and is not reflective of actual load or generation positions |
 9
9
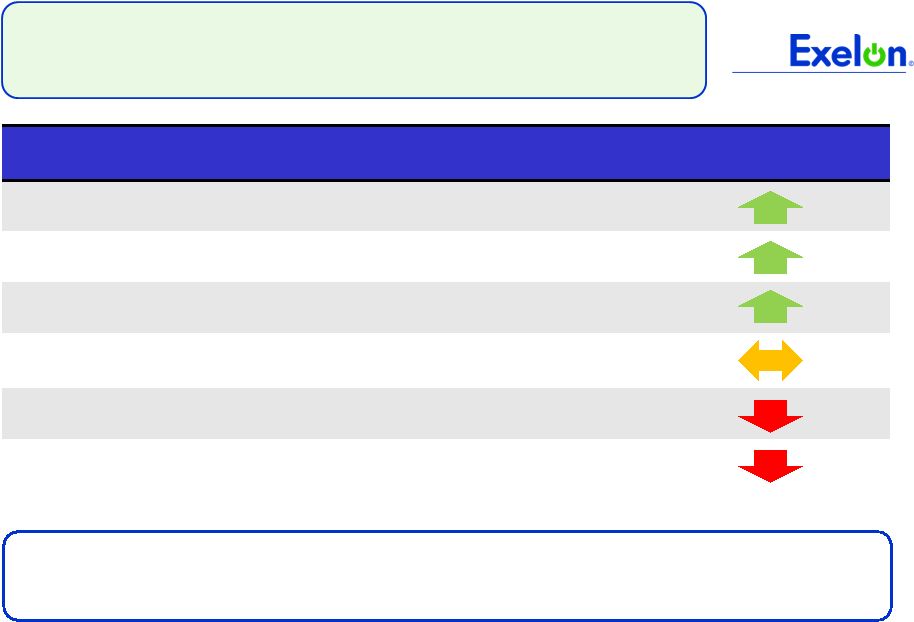
Factors Influencing PJM RPM Capacity Auction
(Comparison of PY 15/16 and PY 14/15 Price Drivers)
Exelon
Price Impact
Incremental Coal Retirements
New Jersey High Electric Demand Day (HEDD) rules
Higher Net ACRs for Coal Units
Import Transmission Limits and Objectives
(muted impact on portfolio revenues due to regional diversification)
New Generation, with exemptions
Peak Load
2015/16 PJM Capacity Auction: Expected
Changes Since Planning Year 2014/15
We continue to believe that supply bidding behavior will have the greatest impact on
clearing price
RPM = Reliability Pricing Model; Net ACR: Net Avoided Cost Rate
|
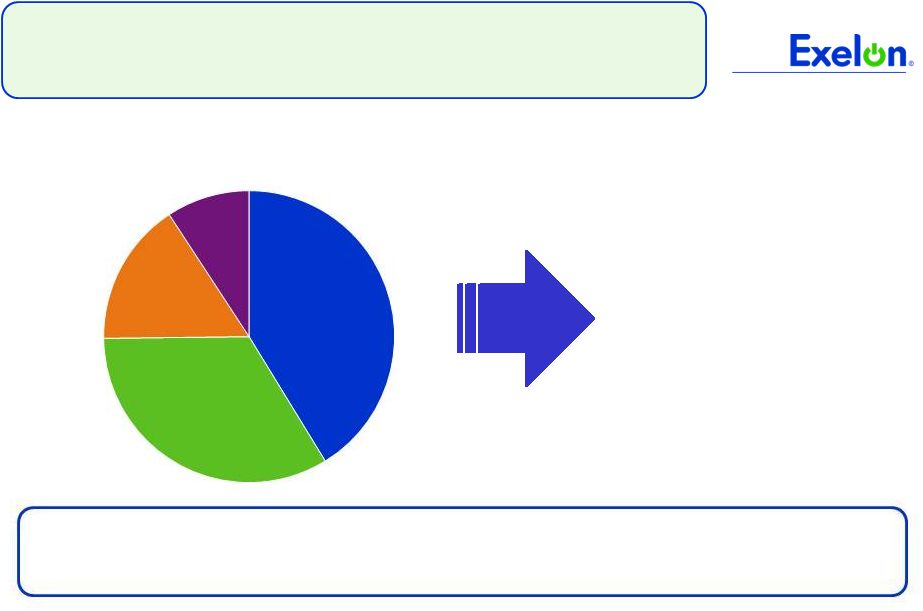 10
10
Generation Capacity Position in PJM
SWMAAC
9%
EMAAC
16%
MAAC
34%
RTO
41%
Exelon has a sizeable and well balanced capacity portfolio offering stable cash flows
in the near term and upside in the medium to long term.
PY 14/15 Eligible Capacity
(1)
:
~ 27,500 MW
(1)
Capacity
values
are
in
installed
capacity
terms
(summer
ratings)
located
in
the
areas
and
adjusted
for
mid-year
PPA
roll-offs
and
net
of
market
mitigation
assumed to be 2,648 MW.
$10 / MW –
Day increase
in prices translates to
approximately $100
million increase in
revenues
RTO = Regional Transmission Organization (i.e. Rest of Pool), MAAC =
Mid-Atlantic Area Council, EMAAC = Eastern Mid-Atlantic Area Council ; SWMAAC = South
West Mid-Atlantic Area Council |