Attached files
| file | filename |
|---|---|
| 8-K - 8-K - Laredo Petroleum, Inc. | a12-7924_18k.htm |
Exhibit 99.1
|
|
Howard Weil 2012 Energy Conference March 26, 2012 NYSE: LPI www.laredopetro.com |
|
|
Forward-Looking / Cautionary Statements This presentation (which includes oral statements made in connection with this presentation) contains forward-looking statements within the meaning of Section 27A of the Securities Act of 1933 and Section 21E of the Securities Exchange Act of 1934. All statements, other than statements of historical fact included in this presentation that address activities, events or developments that Laredo Petroleum Holdings, Inc. (the “Company”, “Laredo” or “LPI”) assumes, plans, expects, believes or anticipates will or may occur in the future are forward-looking statements. The words “believe,” “expect,” “may,” “estimates,” “will,” “anticipate,” “plan,” “intend,” “foresee,” “should,” “would,” “could,” or other similar expressions are intended to identify forward-looking statements, which are generally not historical in nature. However, the absence of these words does not mean that the statements are not forward-looking. Without limiting the generality of the foregoing, forward-looking statements contained in this presentation specifically include the expectations of plans, strategies, objectives and anticipated financial and operating results of the Company, including as to the Company’s drilling program, production, hedging activities, capital expenditure levels and other guidance included in this presentation. These statements are based on certain assumptions made by the Company based on management’s expectations and perception of historical trends, current conditions, anticipated future developments and other factors believed to be appropriate. Such statements are subject to a number of assumptions, risks and uncertainties, many of which are beyond the control of the Company, which may cause actual results to differ materially from those implied or expressed by the forward-looking statements. These include the factors discussed or referenced in the “Risk Factors” section of the Company’s Annual Report on Form 10-K dated March 20, 2012, risks relating to financial performance and results, current economic conditions and resulting capital restraints, prices and demand for oil and natural gas, availability of drilling equipment and personnel, availability of sufficient capital to execute the Company’s business plan, impact of compliance with legislation and regulations, successful results from our identified drilling locations, the Company’s ability to replace reserves and efficiently develop and exploit its current reserves and other important factors that could cause actual results to differ materially from those projected. Any forward-looking statement speaks only as of the date on which such statement is made and the Company undertakes no obligation to correct or update any forward-looking statement, whether as a result of new information, future events or otherwise, except as required by applicable law. The Securities and Exchange Commission (“SEC”) generally permits oil and gas companies, in filings made with the SEC, to disclose proved reserves, which are reserve estimates that geological and engineering data demonstrate with reasonable certainty to be recoverable in future years from known reservoirs under existing economic and operating conditions and certain probable and possible reserves that meet the SEC’s definitions for such terms. In this presentation, the Company may use the term “unproved reserves” which the SEC guidelines restrict from being included in filings with the SEC without strict compliance with SEC definitions. The Company does not choose to include unproved reserve estimates in its filings with the SEC. “Unproved reserves” refers to the Company’s internal estimates of hydrocarbon quantities that may be potentially discovered through exploratory drilling or recovered with additional drilling or recovery techniques. Unproved reserves may not constitute reserves within the meaning of the Society of Petroleum Engineer’s Petroleum Resource Management System or SEC rules and does not include any proved reserves. Actual quantities that may be ultimately recovered from the Company’s interests will differ substantially. Factors affecting ultimate recovery include the scope of the Company’s ongoing drilling program, which will be directly affected by the availability of capital, drilling and production costs, availability of drilling services and equipment, drilling results, lease expirations, transportation constraints, regulatory approvals and other factors; and actual drilling results, including geological and mechanical factors affecting recovery rates. Estimates of unproved reserves may change significantly as development of the Company’s core assets provide additional data. In addition, our production forecasts and expectations for future periods are dependent upon many assumptions, including estimates of production decline rates from existing wells and the undertaking and outcome of future drilling activity, which may be affected by significant commodity price declines or drilling cost increases. This presentation includes financial measures that are not in accordance with generally accepted accounting principals (“GAAP”) including adjusted EBITDA. While management believes that such measures are useful for investors, they should not be used as a replacement for financial measures that are in accordance with GAAP. For a reconciliation of adjusted EBITDA to the nearest comparable measure in accordance with GAAP, please see the Appendix. 2 |
|
|
3 LPI: Experienced Explorers, Operators & Company-Builders Experienced management team, with a track record of successful exploration, asset growth, and risk management. Built and sold Lariat (2001) and Latigo (2006), both for >3x invested equity. Laredo began in 2006 Completed IPO in December 2011 Science-driven exploration & development, with a history of early entry. Significant position in the Permian Basin targeting multiple liquids-rich zones Ongoing horizontal drilling operations in the Granite Wash, targeting liquids-rich natural gas Recent Developments Released CAPEX and production guidance for 2012 (1/18/12) S&P upgraded corporate debt rating to B+ and HY debt rating to B-, stable outlook (1/23/12) Earnings release for fourth quarter and full year 2011 (3/20/12) NYSE: LPI Market Cap: ~$3.3 Billion Shares Outstanding: 128.2 MM Share Price (3/20/12): $25.43 /share Total Enterprise Value: ~$4.0 B |
|
|
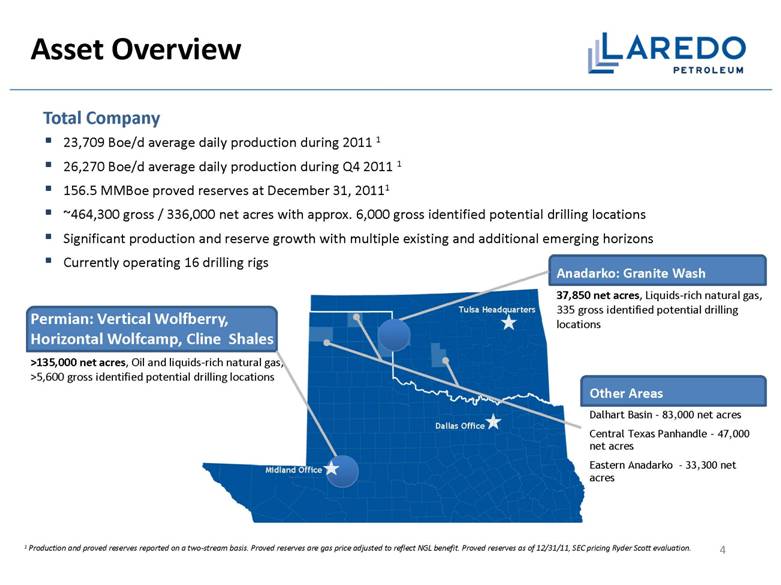
Permian: Vertical Wolfberry, Horizontal Wolfcamp, Cline Shales >135,000 net acres, Oil and liquids-rich natural gas, >5,600 gross identified potential drilling locations 4 Midland Office Dallas Office Tulsa Headquarters 23,709 Boe/d average daily production during 2011 1 26,270 Boe/d average daily production during Q4 2011 1 156.5 MMBoe proved reserves at December 31, 20111 ~464,300 gross / 336,000 net acres with approx. 6,000 gross identified potential drilling locations Significant production and reserve growth with multiple existing and additional emerging horizons Currently operating 16 drilling rigs Asset Overview Total Company Anadarko: Granite Wash 37,850 net acres, Liquids-rich natural gas, 335 gross identified potential drilling locations Other Areas Dalhart Basin – 83,000 net acres Central Texas Panhandle – 47,000 net acres Eastern Anadarko - 33,300 net acres 1 Production and proved reserves reported on a two-stream basis. Proved reserves are gas price adjusted to reflect NGL benefit. Proved reserves as of 12/31/11, SEC pricing Ryder Scott evaluation. |
|
|
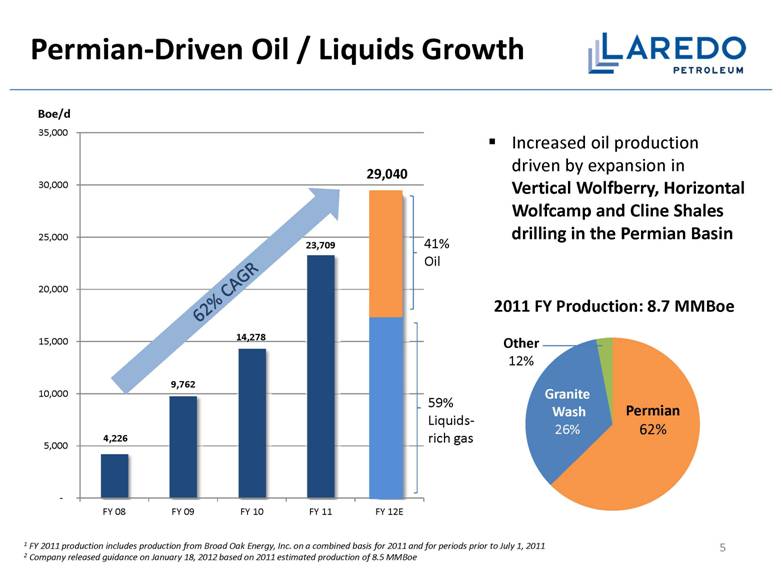
Permian-Driven Oil / Liquids Growth 59% Liquids-rich gas 41% Oil Increased oil production driven by expansion in Vertical Wolfberry, Horizontal Wolfcamp and Cline Shales drilling in the Permian Basin Boe/d 1 FY 2011 production includes production from Broad Oak Energy, Inc. on a combined basis for 2011 and for periods prior to July 1, 2011 2 Company released guidance on January 18, 2012 based on 2011 estimated production of 8.5 MMBoe 5 Permian 62% Granite Wash 26% Other 12% 2011 FY Production: 8.7 MMBoe 62% CAGR |
|
|
Significant PDP Growth Potential Granite Wash 45 MMBoe 29% Permian 101 MMBoe 65% Other 10 MMBoe 6% 1 Proved reserves reported on a two-stream basis. Gas price is adjusted to reflect NGL benefit. Proved reserves and value as of 12/31/11, Ryder Scott evaluation, SEC pricing. 2011 Year-End Reserves: 156.5 MMBoe1 6 Laredo’s current drilling program is concentrated on exploring and exploiting high-potential acreage in the Permian / Midland Basin with multi-year PUD-to-PDP conversion phase underway (MMBbl) Year over Year Oil + Condensate PD Growth Increase in PD Oil Reserves RESERVES (NET MMBOE) PDP PDNP PUD Total Proved % DEV Oil / Condensate (MMBbl) 20.9 0.9 34.5 56.3 39% Natural Gas (MMcf) 232.5 16.1 352.5 601.1 41% Total (MMBOE) 59.6 3.6 93.3 156.5 40% 76% |
|
|
7 Years of Growth Embedded in Extensive Drilling Inventory Permian Horizontal 2,243 locations Permian Vertical 3,426 locations Granite Wash 335 locations Total Gross Identified Potential Drilling Locations1 = 6,004 (94% Permian) Laredo’s inventory of high-quality drilling locations is identified and de-risked through Drilling Results: Laredo has over 600 vertical & horizontal wells on its Permian acreage Vertical well single zone testing Core Samples: More than 2,200 ft of whole cores, 400+ sidewall cores taken 3D Seismic Library: Over 470 sq. miles of data in-house, another 250+ sq. miles being acquired Advanced logging / stimulation technologies employed Verification of upside potential supported by Industry activity 1 Company estimates. See page 35and 36 for details. |
|
|
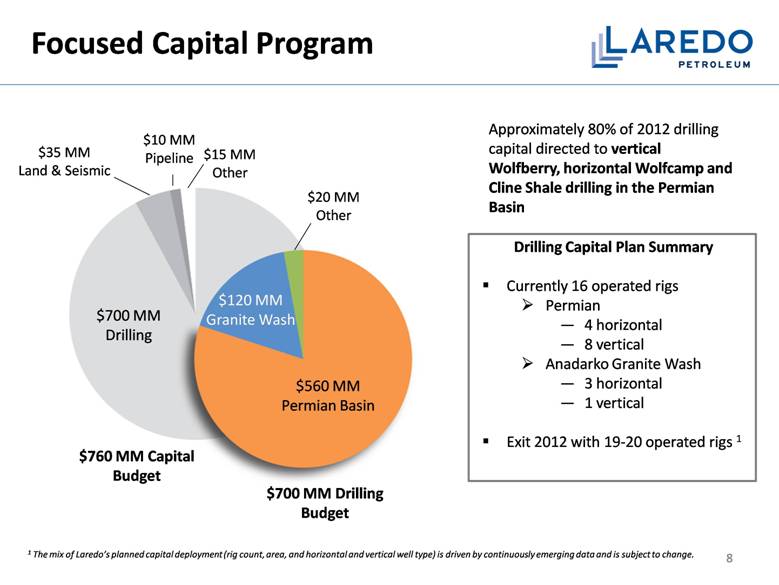
Focused Capital Program $760 MM Capital Budget $700 MM Drilling Budget $560 MM Permian Basin $120 MM Granite Wash $20 MM Other $700 MM Drilling $35 MM Land & Seismic $10 MM Pipeline $15 MM Other Approximately 80% of 2012 drilling capital directed to vertical Wolfberry, horizontal Wolfcamp and Cline Shale drilling in the Permian Basin Drilling Capital Plan Summary Currently 16 operated rigs Permian 4 horizontal 8 vertical Anadarko Granite Wash 3 horizontal 1 vertical Exit 2012 with 19-20 operated rigs 1 1 The mix of Laredo’s planned capital deployment (rig count, area, and horizontal and vertical well type) is driven by continuously emerging data and is subject to change. 8 |
|
|
Conservative Financial Profile 9 Liquidity and Capitalization ($ millions) 1 FY 2011 Adjusted EBITDA, see page 38 for a reconciliation 2 Based on December 31, 2011 reserves prepared by Ryder Scott 3 Total Market Capitalization includes Total Long Term Debt + public equity value based on 3/20/12 closing price Liquidity position of $655 million Funding flexibility for 2012 and beyond Rapidly growing cash flow from operations Availability under revolver should continue to grow Proven ability to access multiple capital market sources Flexible capital program 2012 Cap Ex program focused on liquids rich plays Drilling program provides high economic returns No near term debt maturities Revolver borrowing base increased to $712.5 million (10/28/11) S&P upgraded corporate debt rating to B+ and HY debt rating to B- with stable outlook 12/31/11 Cash and marketable securities 28.0 Current Borrowing Base Oil and Gas Component 712.5 Borrowings (85.0) Liquidity 655.5 Long Term Debt Senior Revolving Credit Facility due 2016 85.0 9.5% Senior Notes due 2019 552.0 Total Long Term Debt 637.0 Stockholder’s Equity 760.0 Total Book Capitalization 1,425.0 Credit Statistics Total Debt / Adj. EBITDA 1 1.6x Total Debt / Proved Reserves ($/Boe) 2 $4.07 Total Debt / Total Book Capitalization 45% Total Debt / Total Market Capitalization3 17% |
|
|
2012 2013 2014 2015 Total Total volume hedged by ceiling (Bbl) 1,716,500 1,368,000 726,000 252,000 4,062,500 Weighted average price ($/Bbl) $108.19 $110.56 $129.09 $135.00 $114.39 Total volume hedged by floor (Bbl) 2,332,500 2,448,000 726,000 252,000 5,758,500 Weighted average price ($/Bbl) $79.64 $77.19 $75.45 $75.00 $77.87 % PDP hedged by floor 1 103% 132% 50% 21% 85% 2012 2013 2014 2015 Total volume hedged by ceiling (MMBtu) 9,390,000 7,300,000 6,960,000 - 23,650,000 Weighted average price ($/Mcf) 2 $6.40 $7.75 $8.07 - $7.31 Total volume hedged by floor (MMBtu) 13,350,000 13,900,000 6,960,000 - 34,210,000 Weighted average price ($/Mcf) 2 $5.30 $4.55 $4.59 - $4.85 % PDP hedged by floor 1 52% 58% 34% - 49% Hedging: Protect and Stabilize Cash Flows 10 1 Based on 3/1/12 internal PDP forecast 2 $/Mcf is converted based on a Company average Btu content of 1.1483. Oil Hedges Natural Gas Hedges As of March 10, 2012 |
|
|
Permian Basin: Large, Quality Position ...multi-stacked plays in a prime geologic neighborhood 11 Current target intervals include Vertical Wolfberry, Horizontal Wolfcamp Shale (Upper, Middle, Lower), Horizontal Cline Shale Interest in over 300 sections with ~135,000 net acres concentrated in Glasscock and Reagan Counties ~96% average working interest Pioneer Range Range Laredo COP El Paso El Paso EOG Exco Approach PHK Apache Apache PHK 1 Acreage illustrated in map above represents publicly released leasehold positions Pioneer Laredo Apache Exco Petrohawk / BHP EOG Approach COP El Paso Range |

|
|
MULTIPLE IDENTIFIED POTENTIAL HORIZONAL TARGETS STACKED VERTICAL PAYS VERTICAL WOLFBERRY TARGETS 3,900’-5,700’ 5,000’-7,500’ 6,000’-8,000’ 7,000’-8,300’ 9,000’-9,500’ 9,500’-10,000’ 12 Permian Basin: Targets of Opportunity 1 Formation depths are approximate. |
|
|
Permian Basin Overview Multiple targets in varying phases of exploration / development 1 13 1 Well and core counts as of 3/20/12 |
|
|
14 What Laredo Knows about its Horizontal Wolfcamp and Cline Shale Laredo’s Data Framework – Areal, Extensive and Comprehensive THE DATABASE CONSISTS OF: >2,200’ of Whole Core (all formations) 400+ Side Wall Core Samples (all formations) 8,000+ Open Hole Logs ~50 Proprietary Petrophysical Logs Vertical Well Zone Test Whole or Sidewall Cores Upper Wolfcamp 1 89 Middle Wolfcamp 1 38 Lower Wolfcamp 4 41 Cline 13 143 Total 19 311 LAREDO’S DATA LIBRARY IS: Proprietary to Laredo Started in 2008 Consists of Single Zone Tests and cores spanning the geographical extent of Laredo’s 80x20 mile acreage fairway Data integrated reservoir characterization conducted by in-house expertise in conjunction with commercial labs |
|
|
Vertical Wolfberry: Foundation for Growth LPI has over 600 gross vertical wells in the Wolfberry; 8 vertical rigs currently running Current average well density of approximately 1 vertical well per 225 acres Large inventory of repeatable, highly economic development locations. Provides a technical and economic foundation for defining additional upside of horizontal shale drilling programs. Provides core information of individual targeted formations, single-zone testing, sub-surface control, assist to delineate and identify “sweet spots”, helps prioritize land efforts Provides economic production base from which to launch horizontal drilling program Continued optimization from vertical to horizontal drilling 15 LPI acreage GLASSCOCK HOWARD STERLING IRION REAGAN TOM GREEN MARTIN MITCHELL LPI vertical well |

|
|
Deep Vertical Wolfberry Development: Performance & Well Economics 16 Key ROR Assumptions 40 Acre Spacing 75% NRI 138 MBOE Gross EUR / Well, 50-60% oil 143 Boe/d 30 day IP, 65% oil $2.2 MM Drill and Complete Cap Ex 0 10 20 30 40 50 60 70 125 130 135 140 145 150 ROR, % Well EUR (MBOE) Deep Vertical Wolfberry Economic Analysis at Oil Price Sensitivity Constant $4.00 Gas Price $110 / bbl $90 / bbl $70 / bbl |
|
|
17 Deep Vertical Wolfberry: Well Performance 0 10000 20000 30000 40000 50000 60000 70000 80000 0 20 40 60 80 100 120 140 160 0 12 24 36 48 60 Cumulative Production (BOE) Average 30 day rate (BOEPD) Months on Production Deep Vertical Wolfberry Type Curve and Cumulative Production 138 MBOE EUR - (2 stream production) Initial Decline Rate Di = 83% Terminal Decline Rate Dt = 6% Hyperbolic Exponent b = 1.6 |
|
|
Horizontal Wolfcamp Shale: Emerging Opportunity 18 LPI has drilled and completed 6 gross horizontal wells in the Upper Wolfcamp Shale. Upside potential in Middle and Lower Wolfcamp identified based on petro-physical data and extensive vertical well control. Significant industry activity on trend by Pioneer, EOG, Approach, El Paso, and others is indicative of industry interest in the play. Recent Laredo well drilled with a 5,970’ lateral, 30 Day IP of 949 BOEPD (2 stream) 1,300 Wolfcamp Shale Horizontal Identified Potential Locations IRION STERLING MARTIN HOWARD MITCHELL GLASSCOCK MIDLAND UPTON REAGAN TOM GREEN LPI acreage LPI Horizontal Upper Wolfcamp well EARLY STAGE EXPLORATION LATE STAGE EXPLORATION EARLY STAGE DEVELOPMENT Industry Horizontal Wolfcamp Activity |
|
|
19 315 BOEPD 3.0 Mm lbs sand 3540 ft lateral 10 stage-SW 516 BOEPD 6.4 Mm lbs sand 5670 ft lateral 20 stage-Gel 187 BOEPD 2.0 Mm lbs sand 3280 ft lateral 6 stage-Gel 949 BOEPD 5.2 Mm lbs sand 5970 ft lateral 22 stage-SW 0 100 200 300 400 500 600 700 800 900 1000 30 Day Average BOEPD Horizontal Wolfcamp Well Performance Average 30 Day Rate (Two Stream Production Rates) Natural Gas Oil |
|
|
Horizontal Wolfcamp Shale Exploration: Performance & Well Economics 1 Based on early production from 6 wells 20 Key ROR Assumptions1 160 Acre Spacing 75% NRI 500 MBOE Gross EUR / Well, 60% oil 531 BOE/D Gross First 30 Day Avg, 75% oil $8.1 MM Drill and Complete Cap Ex, for 6000’ lateral and 20 stage frac 0 10 20 30 40 50 60 70 425 450 475 500 525 550 575 ROR, % Well EUR (MBOE) Horizontal Wolfcamp Economic Analysis at Oil Price Sensitivity Constant $4.00 Gas Price $110 / bbl $90 / bbl $70 / bbl |
|
|
21 Horizontal Wolfcamp Shale: Well Performance 1 Based on early production from 6 wells 1 0 50000 100000 150000 200000 250000 300000 0 100 200 300 400 500 600 0 12 24 36 48 60 Cumulative Production (BOE) Average 30 day rate (BOEPD) Months on Production Wolfcamp Horizontal Type Curve and Cumulative Production 500 MBOE EUR - (2 stream production) Initial Decline Rate Di = 82% Terminal Decline Rate Dt = 5% Hyperbolic Exponent b = 1.6 1 |
|
|
Repeatable horizontal resource play in the Cline Shale Laredo has been drilling and gathering data on Cline Shale since 2008 26 horizontal wells drilled and completed in the Cline Shale, a baseline of historical well performance 1 Cline Shale has been identified across Laredo’s entire Permian acreage position Laredo has gathered extensive petrophysical data on the Cline Shale that is currently proprietary Laredo’s Horizontal Cline Shale Play 943 Horizontal Cline Shale Identified Potential Locations Late stage exploration Early stage development Cline whole core Laredo Cline hz well (26) LPI acreage Early stage exploration 22 GLASSCOCK HOWARD STERLING IRION REAGAN TOM GREEN MARTIN MITCHELL 1 Well and core counts as of 3/20/12 |
|
|
23 Horizontal Cline Well Performance Average 30 Day Rate (Two Stream Production Rates) Avg 264 BOEPD Avg 1.7MM lbs sand Avg lateral 3900 ft Avg 10 stages Avg 390 ft/stage Avg 427 BOEPD Avg 2.7 MM lbs sand Avg lateral 3900 ft Avg 10 stages Avg 390 ft/stage Avg 527 BOEPD Avg 4.6 MM lbs sand Avg lateral 3900 ft Avg 15 stages Avg 260 ft/stage 580 BOEPD 4.3 MM lbs sand 5600 ft lateral 15 stage 373 ft/stage 0 100 200 300 400 500 600 700 800 900 30 Day Average BOEPD Natural Gas Oil Average |
|
|
Early Stage Development Area ROR Assumptions 160 Acre Spacing 75% NRI 420 MBOE Gross EUR / Well, 60% oil 578 BOE/D Gross First 30 Day Avg, 75% oil $7.7 MM Drill and Complete Cap Ex, for 4000’ lateral and 15 stage frac 24 Horizontal Cline Shale Exploration: Performance & Well Economics |
|
|
25 Horizontal Cline Shale: Well Performance 1 Early stage development area drilling |
|
|
26 Horizontal Cline Shale : Optimization Focus y = 0.013x + 5.2522 R² = 0.397 0 2 4 6 8 10 12 14 16 18 0 100 200 300 400 500 600 700 800 900 # OF FRAC STAGES GREATER THAN 100K LBS SAND 30 Day IP BOEPD PERMIAN BASIN HORZ CLINE # FRAC STAGES GREATER THAN 100K LBS SAND VS 30 DAY IP BOEPD |
|
|
Multiple Granite Wash Porosity Trends 27 Stacked, Liquids-Rich Granite Wash Porosity Trends Extend Across Laredo Acreage Land position consists of 54,974 gross / 37,850 net acres Drilled and completed 12 horizontal Granite Wash wells in the play 1 ~100 Potential Horizontal Granite Wash locations identified Horizontal well locations technically defined by geology and reservoir characteristics Majority of the Laredo Granite Wash program will have 2 horizontal wells or less per zone per section Detailed geological mapping and engineering have resulted in economic, high rate completions 1 Well counts as of 3/20/12 |
|
|
28 Oklahoma Granite Wash Horizontal : Performance & Well Economics Key ROR Assumptions 2 or less laterals / zone / section 80% NRI 5.2 BCFE Gross EUR / Well 10.5 MMCFE/D Gross IP $9 MM Drill and Complete Cap Ex, for 4500 lateral and 9 stage frac 0 10 20 30 40 50 60 70 80 90 100 4.40 4.70 5.00 5.30 5.60 5.90 Rate of Return, % Well EUR (BCFE) Anadarko Basin OK GraniteWash Economic Analysis at Gas Price Sensitivity Constant $90.00 Oil Price $6.00 / MCF $4.00 / MCF $2.00 / MCF |
|
|
29 Texas Granite Wash Horizontal : Performance & Well Economics Key ROR Assumptions 2 or less laterals / zone / section 75% NRI 5.2 BCFE Gross EUR / Well 10.5 MMCFE/D Gross IP $8 MM Drill and Complete Cap Ex, for 4500 lateral and 9 stage frac 0 10 20 30 40 50 60 70 80 90 100 4.40 4.70 5.00 5.30 5.60 5.90 Rate of Return, % Well EUR (BCFE) Anadarko Basin TX GraniteWash Economic Analysis at Gas Price Sensitivity Constant $90.00 Oil Price $6.00 / MCF $4.00 / MCF $2.00 / MCF |
|
|
30 Granite Wash Horizontal : Well Performance 0 500000 1000000 1500000 2000000 2500000 3000000 3500000 4000000 0 2000 4000 6000 8000 10000 12000 0 12 24 36 48 60 Cumulative Production (MCFE) Average 30 day rate (MCFEPD) Months on Production Granite Wash Horizontal Type Curve and Cumulative Production 5.2 BCFE - (2 stream production) Initial Decline Rate Di = 83% Terminal Decline Rate Dt = 10% Hyperbolic Exponent b = 1.2 |
|
|
Dalhart Basin – Exploration Program 83,000 net acres Characterized by conventional shallow oil plays and several potential liquids-rich shale plays Targeted intervals are oil plays at depths of less than 7,000 feet Exploration upside potential Acquired 155 square miles of 3D seismic data Have drilled 3 wells in this program 1 Central Texas Panhandle – Operating Area 47,000 net acres Laredo operated JV with ExxonMobil in Hansford County Relatively shallow (<9,500 feet) natural gas targets Positive operating cash flow Eastern Anadarko Basin – Operating Area 33,300 net acres Multiple targets with depths between 8,000 and 22,000 feet which are predominantly dry natural gas Positive operating cash flow 31 OKLAHOMA Laredo continues adding to inventory through early-entry exploration, i.e., Dalhart Basin Midland Office Dallas Office Tulsa Headquarters TEXAS Other Exploration & Operating Areas 1 Well counts as of 3/20/12 |
|
|
Appendix |
|
|
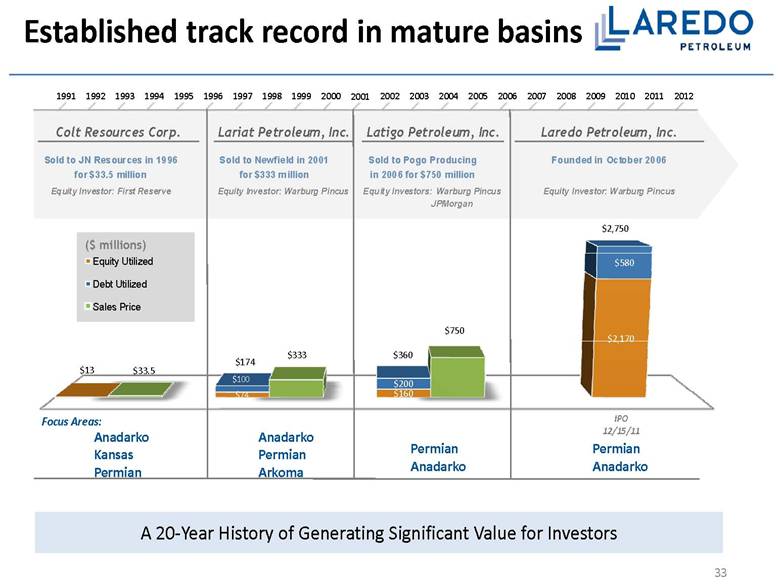
Established track record in mature basins A 20-Year History of Generating Significant Value for Investors 33 ($ millions) Anadarko Kansas Permian Anadarko Permian Arkoma Permian Anadarko Permian Anadarko Focus Areas: Colt Resources Corp. Lariat Petroleum, Inc. Latigo Petroleum, Inc. Laredo Petroleum, Inc. Sold to JN Resources in 1996 for $33.5 million Sold to Newfield in 2001 for $333 million Sold to Pogo Producing in 2006 for $750 million Founded in October 2006 Equity Investor: First Reserve Equity Investor: Warburg Pincus Equity Investors : Warburg Pincus JPMorgan Equity Investor: Warburg Pincus |
|
|
Name Title Years in E&P Industry Years with “L” Companies Randy A. Foutch Chairman of the Board & Chief Executive Officer 35 14 Jerry R. Schuyler Director, President & Chief Operating Officer 33 4 W. Mark Womble SVP & Chief Financial Officer 32 8 Patrick J. Curth SVP - Exploration & Land 35 13 John E. Minton SVP - Reservoir Engineering 36 10 Rodney S. Myers SVP - Permian 33 5 Kenneth E. Dornblaser SVP & General Counsel 31 1 Experienced Leadership 34 Name Professional Association Peter R. Kagan Warburg Pincus, Managing Director James R. Levy Warburg Pincus, Principal B.Z. (Bill) Parker1 Phillips Petroleum Company, Former Executive Vice President Pamela S. Pierce1 Ztown Investments, Inc., Partner Ambassador Francis Rooney1 Rooney Holdings, Inc. & Manhattan Construction Group, Chief Executive Officer Edmund P. Segner, III1 EOG Resources, Former President, Chief of Staff & Director Donald D. Wolf1 Quantum Resources Management, LLC, Chairman 1Independent board members Non-Management Board Members Management |
|
|
Permian Basin: Identified Potential Drilling Locations 35 Large Inventory of Unbooked Potential Locations 1 PUD locations as identified in third party reserve report prepared by Ryder Scott for 12/31/11 2 IPD Locations are recognized based on a combination of available geological, production and engineering data 3 Booked % represents PUD Locations as a proportion of Total Identified Potential Drilling Locations 4 Vertical wells assume 40 acre spacing 5 Horizontal wells assume 160 acre spacing |
|
|
Anadarko Basin: Identified Potential Drilling Locations 36 Additional Inventory of Unbooked Horizontal Locations 1 PUD locations as identified in third party reserve report prepared by Ryder Scott for 12/31/11 2 IPD Locations are recognized based on a combination of available geological, production and engineering data 3 Booked % represents PUD Locations as a proportion of Total Identified Potential Drilling Locations 4 Locations assume 40 acre spacing for the Granite Wash Vertical Program 5 The majority of the technically identified horizontal locations have 2 or less wells/zone/section |
|
|
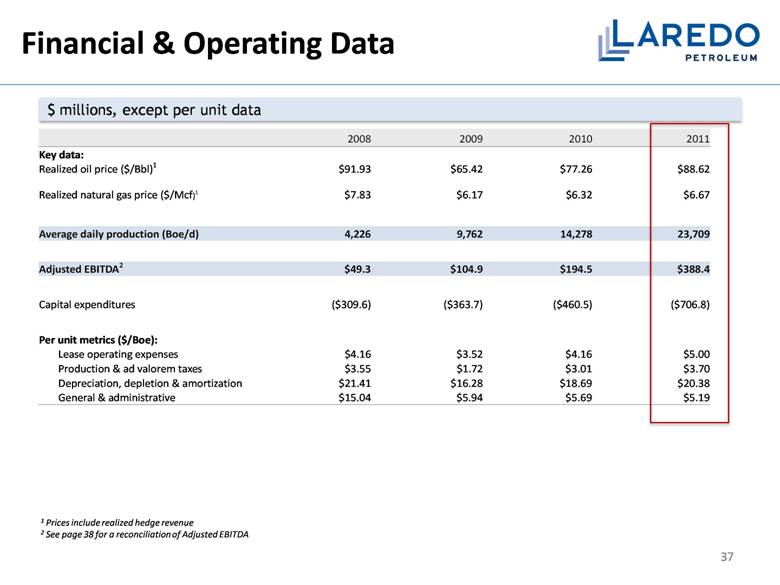
$ millions, except per unit data 1 Prices include realized hedge revenue 2 See page 38 for a reconciliation of Adjusted EBITDA Financial & Operating Data 37 2008 2009 2010 2011 Key data: Realized oil price ($/Bbl)1 $91.93 $65.42 $77.26 $88.62 Realized natural gas price ($/Mcf)1 $7.83 $6.17 $6.32 $6.67 Average daily production (Boe/d) 4,226 9,762 14,278 23,709 Adjusted EBITDA2 $49.3 $104.9 $194.5 $388.4 Capital expenditures ($309.6) ($363.7) ($460.5) ($706.8) Per unit metrics ($/Boe): Lease operating expenses $4.16 $3.52 $4.16 $5.00 Production & ad valorem taxes $3.55 $1.72 $3.01 $3.70 Depreciation, depletion & amortization $21.41 $16.28 $18.69 $20.38 General & administrative $15.04 $5.94 $5.69 $5.19 |
|
|
($ thousands, unaudited) Adjusted EBITDA Reconciliation 38 For the years ended December 31, 2008 2009 2010 2011 Net income (loss) ($192,047) ($184,495) $86,248 $105,554 Plus: Interest expense 4,410 7,464 18,482 50,580 Depreciation, depletion & amortization 33,102 58,005 97,411 176,366 Impairment of long-lived assets 282,587 246,669 – 243 Write-off of deferred loan costs – – – 6,195 Loss on disposal of assets 2 85 30 40 Unrealized losses (gains) on derivative financial instruments (27,174) 46,003 11,648 (20,890) Realized losses (gains) on interest rate derivatives 278 3,764 5,238 4,873 Non-cash equity-based compensation 1,864 1,419 1,257 6,111 Income tax expense (benefit) (53,717) (74,006) (25,812) 59,374 Adjusted EBITDA $49,305 $104,908 $194,502 $388,446 |

|
|
2012 Production and Expense Guidance 39 Production (MMBoe) 10.6 Lease Operating Expenses ($/Boe) $4.75 - $5.25 General and Administrative Expenses ($/Boe) $4.75 - $5.25 Production Taxes (% of oil and natural gas revenues) 7.50% Depreciation, Depletion and Amortization ($/Boe) $18.50 - $19.50 Price Realizations (pre-hedge, two-stream basis, % of NYMEX): Crude oil 95% Natural gas, including natural gas liquids 175% |
|
|
NYSE: LPI www.laredopetro.com |