Attached files
| file | filename |
|---|---|
| EX-10.30 - NON-EMP. DIRECTOR COMP. POLICY - ChyronHego Corp | ex1030.htm |
| EX-31.1 - CEO CERT - ChyronHego Corp | ex311.htm |
| EX-23.1 - BDO CONSENT - ChyronHego Corp | ex231.htm |
| EX-21.1 - SUBSIDIARIES - ChyronHego Corp | ex211.htm |
| EX-32 - CEO/CFO CERT - ChyronHego Corp | ex32.htm |
| EX-31.2 - CFO CERT - ChyronHego Corp | ex312.htm |
| EXCEL - IDEA: XBRL DOCUMENT - ChyronHego Corp | Financial_Report.xls |
| EX-10.32 - RSU CANCELLATION AGREEMENT - ChyronHego Corp | ex1032.htm |
|
UNITED STATES
|
|||||||
|
SECURITIES AND EXCHANGE COMMISSION
|
|||||||
|
WASHINGTON, D.C. 20549
|
|||||||
|
FORM 10-K
|
|||||||
|
[ X ] Annual Report Pursuant to Section 13 or 15(d) of the Securities Exchange Act of 1934
|
|||||||
|
For the fiscal year ended December 31, 2011
|
|||||||
|
OR
|
|||||||
|
[ ] Transition Report Pursuant to Section 13 or 15(d) of the Securities Exchange Act of 1934
|
|||||||
|
For the transition period from _____ to _______
|
|||||||
|
Commission File Number: 001-09014
|
|||||||
|
CHYRON CORPORATION
|
|||||||
|
(Exact name of registrant as specified in its charter)
|
|||||||
|
New York
|
11-2117385
|
||||||
|
(State or other jurisdiction of incorporation or organization)
|
(I.R.S. Employer Identification No.)
|
||||||
|
5 Hub Drive, Melville, New York
|
11747
|
||||||
|
(Address of principal executive offices)
|
(Zip Code)
|
||||||
|
Registrant’s telephone number, including area code: (631) 845-2000
|
|||||||
|
Securities registered pursuant to Section 12(b) of the Act:
|
|||||||
|
Common Stock, par value $0.01 per share
|
NASDAQ Global Market
|
||||||
|
(Title of Class)
|
(Name of exchange on which registered)
|
||||||
|
Securities registered pursuant to Section 12(g) of the Act: None
|
|||||||
|
Indicate by check mark if the registrant is a well-known seasoned issuer, as defined in Rule 405 of the Securities Act. Yes[ ] No[x]
|
|||||||
|
Indicate by check mark if the registrant is not required to file reports pursuant to Section 13 or Section 15(d) of the Act. Yes[ ] No[x]
|
|||||||
|
Indicate by check mark whether the registrant (1) has filed all reports required to be filed by Section 13 or 15(d) of the Securities Exchange Act of 1934 during the preceding 12 months (or for such shorter period that the registrant was required to file such reports), and (2) has been subject to such filing requirements for the past 90 days. Yes[x] No[ ]
|
|||||||
|
Indicate by check mark whether the registrant has submitted electronically and posted on its corporate Web site, if any, every Interactive Data File required to be submitted and posted pursuant to Rule 405 of Regulation S-T during the preceding 12 months (or for such shorter period that the registrant was required to submit and post such files). Yes[ x ] No[ ]
|
|||||||
|
Indicate by check mark if disclosure of delinquent filers pursuant to Item 405 of Regulation S-K is not contained herein, and will not be contained, to the best of registrant’s knowledge, in definitive proxy or information statements incorporated by reference in Part III of this Form 10-K or any amendment to this Form 10-K. [ ]
|
|||||||
|
Indicate by check mark whether the registrant is a large accelerated filer, an accelerated filer, a non-accelerated filer, or a smaller reporting company. See the definitions of “large accelerated filer,” “accelerated filer” and “smaller reporting company” in Rule 12b-2 of the Exchange Act. (Check one):
|
|||||||
|
Large accelerated filer [ ]
|
Accelerated filer[ ]
|
Non-accelerated filer [ ]
|
Smaller reporting company [x]
|
||||
|
(do not check if a smaller reporting company)
|
|||||||
|
Indicate by check mark whether the registrant is a shell company (as defined in Rule 12b-2 of the Act). Yes [ ] No [x]
|
|||||||
|
The aggregate market value of the Company’s voting and non-voting common equity held by non-affiliates of the Company (without admitting that any person whose shares are not included in such calculations is an affiliate) on June 30, 2011 was $22,820,100.
The number of shares outstanding of the issuer’s common stock, par value $.01 per share, on March 15, 2012 was 16,838,661.
|
|||||||
|
DOCUMENTS INCORPORATED BY REFERENCE
|
|||||||
|
Portions of the proxy statement for the Annual Meeting of Shareholders to be held May 23, 2012 are incorporated by reference into Part III.
|
|||||||
1
PART I
The following Business Section contains forward-looking statements, which involve risks and uncertainties. Our actual results could differ materially from those anticipated in these forward-looking statements as a result of certain factors (see Part I, Item 1A: Risk Factors). Unless the context otherwise requires, references to “Chyron,” “the Company,” “we,” “our,” and “us,” in this Annual Report on Form 10-K refer to Chyron Corporation and our subsidiaries.
Overview
Chyron Corporation, “The Company the Whole World Watches®,” is a pioneer of Graphics as a Service for on-air and digital video applications including newsrooms, studios, sports broadcasting facilities, and corporate video environments. Chyron is an Emmy® Award-winning company and we believe our products have defined the world of digital and broadcast graphics. Chyron’s graphics solutions include the Axis World Graphics (Axis) online content creation software and order management system, on-air graphics systems, clip servers, channel branding, and graphics asset management solutions, all of which may be incorporated into our BlueNet™ end-to-end graphics workflow. For over four decades the Chyron name has been known for brilliant graphics for live broadcast and production.
Our mission is to provide solutions that help our customers tell a compelling visual story and create the best visual brand, in the most simple and efficient way. One of our primary goals is to continue to leverage our experience and expertise in our traditional hardware product offerings for television stations and networks into becoming a leading provider of web-based software solutions, or a cloud services provider, to the multimedia industry.
At Chyron, we develop, manufacture, market and support high-performance hardware and software products that are designed to provide broadcast-quality graphics and audio for live and pre-recorded productions and to enhance workflow and video asset management for broadcast operations. Extending beyond the traditional proprietary hardware paradigm, our Axis World Graphics Software-as-a-Service (SaaS) applications provide web-based, self-service graphics creation and order management for distribution to broadcast systems without the need for specialized systems or software.
In addition to providing high-performance hardware and software and cloud-based services, we offer a suite of professional services that encompasses creative services and project management, as well as an experienced customer service team to support our products and to train users.
2
|
·
|
create online or offline, high definition (HD) or standard definition (SD), mono- or stereoscopic graphics containing text, logos, images, three dimensional (3D) elements, movies, clips and flipbooks by applying special effects, animation, 3D transformations, lighting, digital video effects (DVE), multi-layer compositing and audio;
|
|
·
|
perform real-time playout of graphics without the necessity of time- and resource-consuming file conversion and/or platform changes;
|
|
·
|
perform instant update of text and data using a variety of Chyron and third-party tools; manage clips, stills and other assets in a central storage location making the assets network- and web-accessible; use our CAMIO Graphics Asset Management solution to enable journalists and producers to quickly create and update graphics for immediate playout;
|
|
·
|
create graphics on the web, using the Chyron-hosted Axis SaaS applications;
|
|
·
|
order graphics on the web, using the Chyron-hosted Axis order management system;
|
|
·
|
automate channel branding to enable facilities to pre-program promos, snipes, coming-ups, etc., that display automatically updated information and graphics without the necessity of recreating each graphic with the new information;
|
|
·
|
play clips from a dedicated clip server that can operate under automation; and
|
|
·
|
produce live-data tickers and crawls on dedicated systems.
|
Our broadcast products are intended to meet the myriad demands of the industry. The transition from an analog to a digital broadcast standard mandated by the United States Federal Communications Commission (FCC) has created a range of additional means to deliver video and audio content to the consumer, as well as innovations in storage and management of video and audio assets.
Our Markets
We introduced our first character generator (CG) in 1970 to such success that character and graphics generation systems, whether Chyron or not, have been generically referred to throughout the industry as “chyrons.” While a significant number of U.S. broadcasters use Chyron products to display news titles, sports scores, weather information, election results, and news and finance tickers, we believe that our graphics products have grown to become integral to television operations worldwide. We offer a comprehensive experience by providing integrated, scalable, real-time graphics solutions. Building on our presence in the live, on air, television graphics market, our customers now include many major broadcast, cable, satellite and post-production facilities in North America, Europe and Australia. We also serve customers in Asia, South America, and the Middle East and Africa.
3
The Company is focused on leveraging and building on its leading brand image and large installed base in the broadcast graphics market to further penetrate the post-production, corporate, educational and professional video market sectors.
Because our Axis graphics creation process is designed to be intuitive and easy to use, it is not limited to artists and designers who have advanced knowledge of graphics production. As a subscription service at a low initial monthly price point, it is suited to a wide range of applications, including online video and websites, to provide the quality “look and feel” of graphics that traditionally have been available only to television production. Axis graphics tools can be used to build graphics for both static text-based web pages and for “rich,” multimedia web environments. An ordering module enables users to place orders for specialized graphics, which are then automatically delivered to final destinations, which can include playout systems. This workflow provides significant efficiencies, bypassing the formerly necessary intermediate graphics management stages between creation and playout.
Numerous television stations currently employ Axis World Graphics in producing their daily news broadcasts. The first large TV stations group owner and enterprise-level broadcast and television customer for Axis World Graphics was the Gannett Broadcasting Group, where Axis is currently deployed across 23 television stations. The successful Axis launch at Gannett has been followed by implementations at Post-Newsweek, FOX, Scripps and Sinclair broadcast stations, as well as our first European implementation at Sky Sports News. The first pure play online customer was Yahoo!®, which uses Axis to create stock price charts for its Yahoo!® Finance Tech Ticker Service.
Our Products and Services
We offer a broad range of powerful graphics products that are designed to provide broadcast-quality, real-time, HD/SD, 2D/3D, graphics creation and playout for television stations, networks, video production and post-production markets. Our line of high-performance systems is relied upon by many of the world’s leading broadcast stations to display 2D/3D animated news flashes, election results, sports scores, stock market quotations, and programming notes.
Our broadcast systems are Windows®-based and incorporate a high content of off-the-shelf components. Industry-standard interface protocol enables our equipment to be easily integrated into the most advanced television facilities, as well as Media Object Server (MOS)-based newsroom installations. We believe that our software has become an indispensable plug-in application for products offered by leading broadcast manufacturers such as Adobe®, Apple®, AP®, Avid®, Leitch®, and Grass Valley®, greatly extending the capabilities of those products. Our systems can import elements including images, movie files, animation files and audio files from non-Windows systems such as Apple® Mac®.
4
Axis World Graphics, the cornerstone of our SaaS initiative, is available to our core broadcast and video constituency. Axis World Graphics provides an intuitive web interface for creating unique looks for television stations. Its power lies in the ability to generate maps, news graphics, financial quotes, charts and graphs on demand, which can then be imported into Chyron’s or third-party applications and systems for display. The Axis order management component has further streamlined and automated the workflow from creation to air.
We are dedicated to providing the highest quality and most comprehensive array of advanced solutions, ranging from low-cost character generators to fully-integrated workflows that provide precision creation, playout and management of text, stills, clips, effects, audio, graphics storage, newsroom integration, and multi-format distribution and to web-hosted graphics creation, accessible from anywhere. A summary description of selected Chyron products and services is listed below.
Broadcast Hardware Products
Chyron’s broadcast systems provide the high-performance graphics playout and reliability that are critical for live production, whether in brick-and-mortar facilities or mobile studios. All are built from state-of-the-art components and feature real-time playout and easy integration with facility systems and workflows.
Graphics Systems – HyperX3.1, LEX3.1, MicroX3.1: Our graphics systems family is comprised of real-time, 2D/3D graphics platforms and systems that integrate a Windows® front end with real-time video processing to provide exceptional performance for television graphics applications. Our HyperX3.1 and LEX3.1 systems can also play out 3D stereoscopic graphics. The HyperX3.1 is our flagship graphics system, in use by major local, regional, national and international facilities. Numerous major broadcasters have standardized Chyron systems as the graphics solution for their major sporting and news events, including coverage of: the 2011 Super Bowl at Cowboys Stadium; 2011 Wimbledon; The Royal Wedding; the 2010 World Cup; the 2010 Commonwealth Games; the 2010 Winter Olympic Games in Vancouver; U.S. and international elections; and professional golf tournaments.
The HyperX has taken an important role in 3D stereoscopic graphics, and has been the system of choice for many premier 3D broadcasts: the first televised stereoscopic 3D NFL game; the first stereoscopic 3D broadcast of an NHL game in Canada; the first live stereoscopic 3D concert by German hip hop group Die Fantastischen Vier; and NBA All-Star Saturday Night, in the first commercially marketed deal to deliver an NBA sporting event in live 3D nationwide.
Chyron systems are increasingly in use for high-resolution graphics display on big screens and scoreboards at stadiums, including: Yankee Stadium (New York Yankees); Fenway Park (Boston Red Sox); Target Field (Minnesota Twins); American Airlines Center (Dallas Mavericks, Dallas Stars); and Cowboys Stadium (Dallas Cowboys).
5
Our systems are multi-standard platforms, providing both HD and SD within each channel, without the need of a separate upgrade. Changing from SD to HD television standards is accomplished within the software. Content may be created and played back in any of our supported standards. The systems’ architecture has enabled us to provide a range of scalable, cost-effective product solutions, from low-cost single-channel CGs to fully integrated, HD/SD-switchable, multi-channel systems with clip playout and DVE.
Channel Branding Solutions - Channel Box2, Channel Box EX: Channel Box features 2D/3D design and playout for branding applications, including tickers, crawls, snipes, “bag and tag,” promos and end-credits. The system’s real-time video, graphics effects, clips, and audio can be integrated with automation, or the system can be used as a standalone branding device. Station promos only need to be built once, and Channel Box automatically adjusts the animation lengths for new voice-over tags, text and graphics during the live broadcast and credit squeezes at the end of shows. It adds revenue-generating commercial content, advertising show sponsors or “coming-up next” promos.
The power of the Channel Box as an automated system is underscored by its ability to update text and graphics on the fly, driven by data drawn from a wide range of sources. Additionally, Channel Box includes a full eco system of components and applications including a server/client content distribution workflow, a Multi-Viewer remote monitor & control application, and asset viewing. Channel Box also provides applications for displaying information from AP® news feeds, weather feeds and RSS feeds. Data from web pages can also be obtained through established, third-party data providers. For late-breaking situations, templates can be manually updated on the fly. We have extended the reach of Channel Box by implementing the industry-standard Broadcast Exchange Format (BXF) technology, enabling more complete integration between Channel Box and automated scheduling (traffic) systems. Channel Box also integrates with industry-standard automation systems.
New for Channel Box2 users is our Desktop Multi-Viewer, a software-based application giving any operator, including a master control operator, the ability to monitor and control multiple remote desktop systems simultaneously from a single desktop within a single application. The Desktop Multi-Viewer displays each system in a view-only grid view without affecting any on-air devices. If needed, the operator can easily manage and control a particular playout system by maximizing the view of that system. The Multi-Viewer is based on virtual network computing (VNC) technology, with the Multi-Viewer application acting as the client, and is compatible with most VNC servers in use today.
As the broadcast industry continues to evolve, more and more broadcasters are incorporating social media within their programming and broadcasts. In response to this changing landscape, our dedicated team of in-house engineers developed our newest software-based solution, the Chyron Social Media Editor, which we believe is ideal for the news, sports, and entertainment markets. This solution allows an operator to monitor and pull incoming Tweets from any feed and quickly display the Tweets on-air. The Chyron Social Media Editor can be used in tandem with Channel Box² or any Chyron system running Lyric PRO software, using the built-in play-out controller that allows operators to simplify and streamline their approach to on-air productions and events.
6
XClyps Family - XClyps, XClyps SAN, MicroClyps: We believe that our XClyps systems set a new level for graphics server technology and performance, by providing superior quality and precise control over video clip playout. Serving the most demanding multi-standard environments, XClyps can be configured with one or two completely independent, switchable HD/SD channels, each with synchronized video and key outputs. Advanced wavelet compression is designed to provide high-capacity storage and flawless playout of channel branding, promos, snipes and DSK. XClyps can be easily integrated as a single system, or multiple XClyps systems can be networked. Built on Microsoft®.NET® Technology, assets can be quickly transferred across the network. Due to a powerful application environment that provides maximum flexibility, XClyps can be controlled remotely via VDCP, Grass Valley®, PBusII protocol, Intelligent Interface® protocol over serial or TCP/IP, and GPI.
For collaborative, high-demand environments, multiple XClyps can be interoperated around a shared central storage SAN providing full HD streaming of multiple channels from any number of XClyps systems. We have integrated the XClyps family with our CAMIO newsroom integration and graphics/video asset management system, enabling clips to be browsed and added to the newsroom rundown in the same manner as Lyric graphics.
Axis World Graphics and Software as a Service (SaaS) - Graphics on Demand
Axis Graphics Creation: Axis World Graphics, we believe, is the only cloud-based graphics creation system, designed specifically for broadcasters. Axis World Graphics simplifies, streamlines, and facilitates the graphics creation process, enabling artists, reporters, production assistants, and news producers to create broadcast-quality graphics using their own graphics packages. Several new features have recently been introduced to the system, including fully integrated electronic order management, asset management, and integrations with Apple® Final Cut Pro® and Adobe® Premiere® Pro video editing, all of which are designed for ease of use and maximum workflow efficiency.
Axis is designed to bring innovation to graphics creation and workflow. The Axis suite of web-based services and applications are designed to provide proven workflows, including quick creation of customizable, high-resolution maps, financial quotes, 3D charts, plus a virtually unlimited set of tools to create topical news graphics. Because these applications run on our hosted computer servers “in the cloud,” our customers are not required to invest in or maintain expensive hardware or license multiple releases of software. Axis World Graphics has enabled us to extend beyond our established client base to serve not only existing Chyron broadcast and network customers, but to act as a point of entry for the sale of our systems and software to facilities currently using non-Chyron products.
7
Axis order: We have developed our Axis order management system, called order, to the specifications of a select group of our high-profile clients. Using order, a journalist or producer can order a new graphic from the art department from the Chyron LUCI interface from within a newsroom computer system, from LUCI within iRB, or from the order interface itself, via a web-based interface. The journalist or producer can specify deadline, description and metadata, and can attach files. Once the graphic is fulfilled and uploaded by the art department, it is automatically placed in the story without further intervention by the journalist or producer. Axis order is designed to streamline the workflow by eliminating the need for the phone orders, paper memos and follow-up calls that have traditionally comprised the graphics request process, potentially saving time and money. Graphic creation status can be viewed at any time, and the process is completely configurable with regard to scheduling, assignment, approval, metadata use and more. We believe that Axis order is particularly suited to the growing trend in centralized graphics creation, as the same art department can service multiple facilities, offering a unified look and conserving resources.
Software Products
Our broadcast graphics systems run Lyric® and Lyric® PRO, our award-winning graphics creation-to-playout software; proprietary, system-specific software; and/or a variety of third-party applications and plug-ins. Extending Lyric beyond our own systems, we also offer Lyric plug-ins to® Avid® and other non-linear editing systems.
With the goal of providing end-to-end solutions for our customers, we have unified graphics operations with our workflow and asset management applications, including CAMIO, iRB, iSQ, and Axis order. Adobe XMP®-awareness is already integrated into CAMIO and Lyric Pro. Detailed descriptions of these products follow.
Lyric®: Lyric is our advanced graphics creation and playback application that is provided on our graphics systems. Using Lyric, graphic artists can create advanced 2D/3D graphics on a Chyron system or offline on a PC for later playout/export to broadcast. Content can be created in one location and transported by local area network (“LAN”) or wide area network (“WAN”) to another device or facility using standard network protocols. Lyric imports numerous standard 2D and 3D file types and takes full advantage of industry-standard tools, including Autodesk’s® FBX® file interchange format and Adobe’s® Extensible Metadata Platform (XMP®), while maintaining full legacy support. Lyric features intuitive and agile operation and interoperability with many third-party graphics applications and technologies. Lyric was designed from inception to easily incorporate future advances in software and hardware.
8
We believe that our Lyric® PRO application has revolutionized graphics production and workflow. The innovative, object-oriented technology behind Lyric PRO is designed to provide unprecedented ease and flexibility in graphics creation and real-time, live playout. Major features include: conditional intelligent transitions that enhance live broadcast by enabling playback of transition elements and messages in any order, at any time without relying on any scripting or programming; live data update executed within a transition; continually rendered static and animated graphics, allowing transitions to be executed at will; control of multiple scenes for support of complex, multi-layered animations (unique to Lyric PRO); persistent elements completely integrated with graphic animations; and advanced 3D texturing.
Lyric and Lyric PRO have gained wide acceptance in the industry and we expect to continue to develop new features. Lyric and Lyric PRO offer additional functionality to our powerful 3D text renderer. The ability to create and display text in non-Western languages has successfully opened the opportunity to market our products in Asian countries including India and China, as well as the Middle East. Enhanced 3D text manipulation and effects have been implemented and enhancements with our built-in 3D primitives have expanded the capabilities for artists to create complex, 3D animations using the tools available in Lyric.
Lyric PRO has met the increasingly sophisticated demands of live broadcast, with the introduction of scriptless Conditional Transitions and Inherit State. Where conditional behavior of graphics had depended on scripting by highly specialized programmers, designers can now easily set up complex behaviors directly within Lyric PRO, drastically cutting graphics creation time and providing the flexible playout required for live production.
Lyric PRO has become a leader in 3D stereoscopic graphics creation and playout. In 2010, The NBA, in conjunction with TNT and Cinedigm Digital Cinema Corp., represented the first commercially marketed deal to deliver an NBA sporting event in live 3D nationwide. Lyric PRO 8, running on our HyperX3 platform, delivered the live 3D stereoscopic graphics for this hugely successful production, which was broadcast by satellite to more than 80 digitally-equipped theaters across the U.S.
Lyric PRO has expanded touch screen hardware support for Lyric’s Touch GraphX, which gives a presenter the ability to trigger Lyric PRO graphics via a touch screen. Lyric PRO’s Touch GraphX enables fast, simple creation of touch-enabled graphics, and was used to enhance 2010 election coverage with live interaction between the on-air talent and graphic displays. Touch GraphX is an extension of our programming-free, scriptless environment, bringing touch-enabled graphics creation out of the realm of the programmer and back to the designer.
Lyric PRO offers quick, manual update, as well as an indispensable set of update tools. Optional, third-party live data import applications can be added for linking data from websites, RSS feeds, Social Media sites, and news services. Lyric-based systems integrate with our CAMIO newsroom integration and graphics/video asset management, as well as our iRB rundown builder, enabling journalists and producers to remotely create graphics, based on Lyric templates for playout on Lyric-based systems. Lyric PRO is the cornerstone of our BlueNet™ end-to-end workflow and order management system.
9
Newsroom Integration and Graphics/Video Asset Management
CAMIO: Television newsroom operations depend on accurate, fast exchange of information and graphics among disparate computer systems and devices. Media Object Server, or MOS, protocol enables Newsroom Computer Systems, or NRCS, Media Object Servers and devices such as graphics systems to exchange information using an industry-standard protocol. With CAMIO integrated into a newsroom, journalists and producers can access a library of templates from their newsroom workstations, to quickly create and edit text, graphics and movies using our Lyric Universal Control Interface, or LUCI. CAMIO’s powerful asset management tools, search engine and visual browser make it easy to locate and select graphic templates, enter text for titling and select images and move files to complete the graphic. Completed objects are associated with a story, and then the stories are ordered by the NRCS and sent to a Chyron system playlist for playout to air. Changes in the newsroom rundowns are automatically and instantly reflected on the Chyron output devices, offering a streamlined and accurate newsroom production environment. Because journalists and producers are directly involved in the final output, there is less opportunity for error, and they can quickly make last-minute changes without involving a graphic artist or graphics system/CG operator. In addition, because the graphics are based on existing, reusable templates created by graphic artists, CAMIO can speed the production of pages by eliminating the need for a graphic artist to create each page for a news broadcast. This allows artists to be available for other tasks and can increase output of the art department.
MediaMaker, a new technology that seamlessly integrates Chyron graphics with file-based workflows, uses CAMIO content management and Lyric file-based rendering to create graphics for use in editing systems such as Apple® Final Cut Pro®, Adobe® Premiere® Pro, and Adobe® After Effects®. This extends the entire BlueNet workflow including Axis World Graphics content creation and order management system, into the editing suite. MediaMaker gives video editors and graphic designers access to the same graphics and animations that are being used live on the air.
The integration of Adobe® XMP® metadata into CAMIO enables the packaging of configurable metadata with files. It can be used within CAMIO to auto-populate template fields in the graphic and enables conditional use of graphics in a template. For example, the name of a person, embedded into the graphic as metadata, can automatically populate a text template based on the metadata traveling with an image, or a sports player’s headshot can be automatically restricted to placement in a graphic with his team logo. Errors are minimized and naming conventions can be automatically enforced, resulting in significant time savings. XMP metadata can also be mapped into CAMIO’s default metadata fields to expedite searches.
10
End-to-End Workflow
BlueNet™: Understanding the needs of broadcasters - as well as the economic pressures and technical challenges they face - we have leveraged our expertise in graphics creation, management, and workflows to introduce BlueNet. This comprehensive workflow solution leverages the Chyron acclaimed suite of graphics tools to streamline ordering and graphics asset management, collaborative graphics creation, and real-time playout, in turn addressing broadcasters’ requirements for powerful, seamless and efficient end-to-end graphics workflows. Integration with Axis World Graphics, our cloud-based services offering, extends the power of BlueNet workflows in speeding even the most advanced graphics to air.
From the moment a graphic requirement is identified, the BlueNet workflow provides tools that ease the flow from the graphics request through the creation, management, and fully automated playout of the completed asset. What once was a complicated workflow demanding continual operator intervention can be transformed into an efficient, fast workflow in which graphics move quickly and fluidly from conception to completion to air. BlueNet gives broadcasters an array of tools that can be configured to meet the specific needs of their graphics workflows, as well as their budgets, while providing seamless integration into leading newsroom systems such as AP ENPS, Avid® iNEWS®, and Dalet.
Already implemented by leading broadcast groups and sports networks such as Sinclair Broadcast Group and the NHL Network, BlueNet minimizes the cycle time from creation to air, ensuring very fast news and sports workflows. Order management tools allow producer driven content to move smoothly into a rundown, and easily accessible templates enable instant and efficient collaboration in preparing graphics. For stations supporting multiple networks and broadcasts, BlueNet facilitates the fast, simple application of custom graphics packages across shared assets or a common rundown. As a result, a station group can maintain a single rundown for a news broadcast and, with a few clicks of a button, adapt the rundown with a whole new channel- and network-specific look in seconds. BlueNet is our custom-winning workflow providing the stability and reliability that customers have come to expect of a Chyron-based solution.
Creative Services
Chyron Creative Services, comprised of world-class designers from around the globe, enables us to offer a complete, end-to-end Chyron graphics creation-to-playout workflow. Creative Services provides graphic design services for customers of our traditional hardware systems, for the networked CAMIO environment and for our Axis hosted services. We offer an array of options, from single-facility graphics creation to enterprise-wide graphics packages for sports, news and other high-profile broadcasts.
Our graphic designers have extensive experience in high-profile broadcasting environments with Chyron systems and software and packages are built using Chyron’s advanced creation tools. Our graphic designers work closely with the broadcaster to integrate graphics into their workflow and provide training and support in modification and playout of graphics.
11
In addition, our highly skilled Creative Services team provides graphics implementation expertise to enable our customers to get more out of their systems and resources, especially in the face of dwindling budgets. Creative Services has been generating a growing revenue stream by producing comprehensive graphics packages for sports, news and other high-profile broadcasts from the FIFA™ World Cup to the Olympic Games, from local news to international events.
Creative Services also serves our in-house needs, maintaining and enhancing our brand through the production of product demonstration graphics, digital and printed marketing materials and graphics for our web site.
Chyron Development Strategy
Our goal is to provide a centralized, fully-integrated and collaborative creation environment for our clients. We continually seek to leverage the latest advances in technology and workflow design to provide complete, streamlined solutions in an integrated environment that encourages creativity and allows the software to take care of the more repetitive, time-consuming tasks. We have developed modular suites of systems and software that we believe fulfill the requirements of a wide variety of potential customers, from small college stations to major market facilities, national and global networks, and various multimedia outlets.
We continue to extend new and evolving products, with a focus on tight integration among our existing systems, hosted services, and external systems and software. Our FBX importer is designed to enable the use of 3D animations created in 3D applications to be imported and played out from our Lyric-based systems. We designed a new text renderer to enable easy creation of text in non-Western, complex-script languages. We have introduced new CAMIO and Axis World Graphics components such as our order offering to help automate the graphics request and fulfillment process, and provide additional means for accessing, distributing and fulfilling graphics from within the CAMIO and Axis environments.
In addition, our Axis World Graphics service offers the creation of platform-independent, web-based graphics that can be imported for use on Chyron and third-party systems. We continue to further integrate Axis into our products to provide automatic, transparent graphics fulfillment, management and interoperability.
In light of the shifting landscape of broadcast and demand for Social Television solutions, our newest focus includes developing applications to help broadcasters tie the second screen experience to the first screen experience to captivate the viewers attention, enrich the viewing experience, and drive advertising revenue. Our first offering, already in use by a major U.S. broadcaster, is our Social Media Moderator Application which allows an operator to monitor and pull incoming Tweets from any feed and quickly display the Tweets on-air.
12
Sales and Marketing
We market our products and systems to traditional broadcast, production and post-production facilities and to multimedia outlets such as web, mobile and print companies throughout the world, including the markets identified above under “Business - Our Markets.” We also market our products and services in these markets to sports networks and arenas, government agencies, educational institutions, health institutions, religious institutions and telecommunications and corporate customers. In order to maintain and increase awareness of our products, we display at the major domestic and international trade shows of the broadcast and post-production segments. In the United States, we exhibit at the National Association of Broadcasters Convention and other smaller trade shows. We also exhibit at the International Broadcasters Convention in Europe and other smaller trade shows internationally.
We also promote our products through email campaigns, e-newsletters, advertisements placed in relevant journals, our website, knowledge base and forum, and social media marketing venues such as Facebook®, Twitter®, Yahoo!® and YouTube®. In addition, our engineering and corporate staff publish articles, present papers, and are quoted in trade journals and papers presented at technical conventions, which we believe reinforces and promotes our industry credentials.
Our aim is to continue to expand the range and sophistication of our marketing tools. We offer marketing and instructional podcasts on our website, and we continually refresh our library of tutorials, white papers, workflow diagrams and system diagrams. Periodically, we send an electronic marketing package highlighting a product or product line to clients and potential clients. We also perform online video demonstrations which have become a valuable and cost-saving marketing tool for us. Additionally, we aim to expand the Chyron brand throughout the globe and to increase our international footprint and position.
A critical component of our sales strategy is the development of effective product and workflow demonstrations. We believe that the ability to conduct successful demonstrations is key in proving the reliability and innovation of our products, and results in the retention of existing customers and the acquisition of new business.
Sales of our broadcast products worldwide are made through our direct sales personnel as well as through third-party dealers, independent representatives and systems integrators. Direct sales, marketing and product specialists serving our global markets act as links between the customer and our development team.
13
Our Commitment to Customer Success
We believe that our success is measured not only in sales figures, but with the ongoing success of our customers. Our attention to customer success commences in the planning stages of a project, through the sale, training, and commissioning process. We are dedicated to ensuring that Chyron solutions are tailored to customer requirements and that the process of implementation is smooth, follow-up is maintained and issues are addressed in a timely manner. This approach has become increasingly critical to the success of our clients, with the rapid transition from single-box installations to integrated solutions, especially those involving Axis World Graphics and CAMIO, which involve complex interactions among multiple Chyron components and third-party products. This heightened level of project management continues to bear fruit from our longer-term projects, in that our clients return to us for guidance in implementing additional Chyron solutions, thus generating a continuing revenue stream. In addition, as an extra level of support, we offer post-sale maintenance agreements to ensure that our customers continue to effectively use their Chyron products.
Product Management
Our Product Management team oversees and manages the entire Chyron product line from conception through end of life, including: software, hosted application and platform releases; the integration of products with each other and with external systems and software; and the development and implementation of workflow and feature sets. Product Managers evaluate current and future customer goals, business and technical trends in the industry, potential third-party partnerships and opportunities for which we are uniquely suited in order to establish product development roadmaps.
Product Managers interface with all departments of the Company: they work closely with the engineering department by framing development goals and by providing Software Quality Assurance (SQA) with real-life test materials and scenarios; provide production with the deliverables that they require to ship; support sales and marketing by producing collateral including podcasts, product information sheets, system diagrams, tutorials and white papers; and train our support team so that they can effectively respond to customers.
Engineering
We employ software and platform engineers, a software quality assurance team and technical publications staff. The software engineers design, implement, test, and maintain the software; and the platform engineers develop, source and test the high-performance hardware configurations to be used in our systems. The Engineering department operates in a creative, collaborative environment, framed by an agile development methodology. Engineering, Product Management, SQA and Technical Publications work in concert to produce, qualify and document solutions for our clients.
14
Service and Support
We offer technical service and support to our customers via 24-hours-per-day, seven-days-per-week, 52-weeks-per-year access to highly trained service and support professionals. We employ online video conferencing to help customers resolve problems and update software on their systems, speeding resolution and cutting costs. We have instituted an on-line case submission system, which enables our customers to submit a case to the support team and provides them with a “help desk at their fingertips” via the web. We provide a searchable knowledge base which is continually updated with current information. Service is provided both domestically and internationally by Chyron or through our appointed dealers and representatives.
We provide our customers with hardware, software and performance maintenance contracts and spare parts, and believe that support contracts and an easily available spare parts supply facilitate customer satisfaction.
Warranty
We generally provide one-year warranties on all of our products. There may be, in certain instances, exceptions to these terms. A provision is made in our financial statements to estimate the warranty cost in products sold based on historical actual results.
Training
Proper training is essential for the success of our customers, and in certain instances, e.g., CAMIO and Axis, training is a mandatory, itemized component. We offer a comprehensive course catalog, with scalable and fixed-duration training courses tailored to varying levels of proficiency and generally consisting of a mix of classroom discussions and hands-on training. Training courses are held at our Melville, NY headquarters or on site at the customer’s facility, as required. We make training available to a wider user base by offering online video conferencing courses in which users can participate in interactive instruction.
Manufacturing
Our final assembly, system integration and test operations are located at our headquarters in Melville, NY. We use third-party vendors to manufacture and supply many of the hardware components and sub-assemblies. We rely on a limited number of suppliers for major hardware components. We continually review product specifications in order to diversify the sourcing of critical components. With our current architecture, we use many “off-the-shelf” components. This not only permits us greater flexibility in sourcing of components, but provides higher gross margins on our products through the attainment of lower costs through competitive sourcing and greater commonality of components among our products.
15
Research and Development
Our research and product development has primarily been focused on the revitalization and further extension of our core products, including the continuing integration and development of Axis services. During 2011 and 2010, we spent approximately $6.7 million and $6.6 million, respectively, for research and development for new and existing products, all of which is company funded.
Customers
There are no customers that individually represent in excess of 10% of our consolidated revenues for 2011 or 2010.
Competition
The markets for our graphics products are highly competitive and are characterized by rapid technological change and evolving industry standards. Product obsolescence, frequent development of new products, new technologies and significant price erosion are all features of the industry in which we operate.
The explosion of alternative media outlets, characterized by the accelerated use of online resources for information, entertainment and business and the ubiquitous presence of personal mobile devices, has opened new markets for us and our competitors. We have aggressively pursued these opportunities by providing our clients with the ability to create and distribute media assets from any web access point, with an integrated environment that we believe is not available from our competitors.
We are currently aware of several major and a number of smaller competitors. We believe the competitive factors in our market include product pricing, features, ease of implementation and use, integration with workflow and third-party systems, and the quality of customer support. We believe our primary competitors are Vizrt Ltd., Harris Corporation’s Inscriber subsidiary, Miranda, Pixel Power, Orad Hi-Tec Systems Ltd., Avid Technology, Inc. and Ross Video Ltd. Some of these companies have significantly greater financial, technical, manufacturing and marketing resources than we have. On a region-by-region basis, certain product categories or market segments in which we operate, or may operate, are dominated by established vendors.
Intellectual Property
Our success depends upon our ability to protect our proprietary intellectual property, technology and know-how and operate without infringing on the rights of others. We rely on a combination of methods to protect our proprietary intellectual property, technology and know-how, such as trade secret laws, trademark law, patent law, contractual provisions, confidentiality agreements and certain technology and security measures.
16
Our registered trademarks for our current product line are Chyron, The Company The Whole World Watches, HyperX, Lyric, CAMIO, CODI, Intelligent Interface, WAPSTR, ChyTV, ChyAlert, iNFiNiT!, MAX!>, and MAXINE!. We review our trademark registrations regularly and renew the terms if we deem appropriate based on current usage of the respective trademark. We also have rights in trademarks and service marks that are not federally registered. We do not have registered copyrights on any of our intellectual property.
We have been awarded patents in the United States and Great Britain for incorporating graphics and interactive triggers in a video stream which expire in 2024 and 2021, respectively.
Government Regulation
The telecommunications and television industries are subject to extensive regulation in the United States and other countries. For example, the FCC has issued regulations relating to shielding requirements for electromagnetic interface in electronic equipment. Our products are in compliance with these regulations.
In addition, we ensure that our products are in compliance with Restriction of Hazardous Substances (RoHS) regulations, which were implemented in the European Union. Maintaining compliance involves providing such specifications to the manufacturers of our proprietary components, as well as acquiring certifications from our third-party vendors.
Substantially all of our manufacturing is outsourced and we purchase completed components and assemblies from our suppliers. Consequently, our processes do not involve hazardous substances and we have not incurred and do not anticipate incurring any expenses associated with environmental laws.
Employees
As of December 31, 2011, we employed 126 persons worldwide. None of these employees are represented by a labor union.
About the Company
Chyron Corporation was incorporated under the laws of the State of New York on April 8, 1966, under the name The Computer Exchange, Inc., which was changed to the present name on November 28, 1975. Our principal executive offices are located at 5 Hub Drive, Melville, New York 11747 and our telephone number is (631) 845-2000.
We are required to file annual, quarterly and current reports, proxy statements and other information with the Securities and Exchange Commission (“SEC”). You may read and copy any documents filed by us at the Public Reference Section of the SEC, 100 F Street, N.E., Room 1580, Washington, D.C. 20549. You may obtain information on the operation of the Public Reference Room by calling the SEC at 1-800-SEC-0330. Our filings with the SEC are also available to the public through the SEC’s website at http://www.sec.gov .
17
We maintain Internet sites at www.chyron.com, www.chytv.com and www.axisgraphics.tv. We make available, free of charge, through the “Investors” section of our www.chyron.com website, our SEC filings as soon as reasonably practicable after these reports have been electronically filed with or furnished to the SEC. Our websites and the information contained on them or connected to them shall not be deemed to be incorporated by reference into this report.
ITEM 1A. RISK FACTORS
A wide range of factors could affect our business and financial results. We consider the factors described below to be the most significant. There may be other currently unknown or unpredictable economic, business, competitive or other factors that could have material adverse effects on our business, financial condition and results of operations. Past financial performance may not be a reliable indicator of future performance and historical trends should not be used to anticipate results or trends in future periods. The following discussion of risk factors contains “forward-looking statements,” as we discuss under the heading “Special Note Regarding Forward-Looking Statements,” and should be read in conjunction with “Item 7. Management’s Discussion and Analysis of Financial Condition and Results of Operations” and the consolidated financial statements and related notes in this Annual Report on Form 10-K.
Current and future economic conditions may adversely affect our business and customers.
The United States and other countries where we operate continue to struggle to emerge from economic recessions. This could adversely affect overall spending on technology and services and reduce demand or delay payments for our products and services. The continuing unfavorable economic environment may also cause our customers to have difficulty obtaining capital at adequate or historical levels to finance their ongoing business and operations and our customers may face insolvency, all of which could impair their ability to make timely payments and continue operations. Further, we may experience supply chain delays, disruptions or other problems associated with financial constraints faced by our suppliers and subcontractors. We are unable to predict the duration and severity of the weakened economic conditions and such conditions could adversely impact our business, operating results and financial condition.
Our revenues may fluctuate from period to period and therefore may fail to meet expectations, which could have a material adverse effect on our business, financial condition and results of operations.
Our revenues have fluctuated in the past and may do so in the future. In addition, our revenues may not follow any past trends. Our financial results depend on many factors and may fail to meet our expectations for a number of reasons. A variety of factors could cause our revenues to fluctuate, including decreased capital spending by our customers, the financial health of our customers, changes in customer demand for our products, changes in our product mix, the need for continual, rapid new product introductions, successful execution of our strategy to develop and market web-based content creation solutions, quality and market acceptance of new products and services, competitive pricing pressures, the cyclical nature of the broadcast industry and other markets in which our products and services are sold, and economic conditions
18
affecting our customers and us. Any failure to meet expectations could have a material adverse effect on our business, financial condition and results of operations.
If we fail to successfully continue to expand our Axis graphics solution or to develop, introduce and sell new products and services, then we may be unable to compete effectively in the future.
We operate in a highly competitive, quickly changing environment marked by rapid obsolescence of existing products. Our future success depends on our ability to develop, introduce and successfully market our Axis graphics creation and order management services, other new products employing the latest technologies, including graphics systems and software that continues to replace our legacy products and older graphics systems, as well as hosted applications that meet the rapidly evolving requirements of our customers. Our success increasingly depends on the ability to cement our position in new segments of the broadcast market with our graphics offerings, including workflow solutions and asset management, channel branding, and Axis graphics online content creation and order management services. In recent years, sales of our graphics systems/CG products, channel branding systems and clip servers have resulted in part due to the increasing implementation of HD and emerging implementation of 3D stereoscopic production by the broadcast facilities. We expect, however, that demand for these products may decline when implementation of HD is completed by a larger percentage of broadcasters. If any of the following occur, then our business, financial condition and results of operations may be materially harmed:
|
|
·
|
our broadcast customers do not continue to order our products at the same rate or in the same quantities following their transition to HD, or their budgets for such products are reduced or eliminated,
|
· 3D stereoscopic production does not grow as predicted, resulting in unrealized sales,
|
|
·
|
we fail to increase sales of our Axis graphics solutions in sufficient amounts to offset any declines in sales of our traditional broadcast products,
|
|
|
·
|
we fail to complete and introduce new product designs and services in a timely manner,
|
|
|
·
|
we are unable to have these new products manufactured or developed according to design specifications,
|
· our customers do not perceive value in our new offerings and demand deep discounts,
|
|
·
|
we do not open the appropriate marketing/sales channels for our hosted and non-broadcast products,
|
· our sales channels do not create adequate demand for our products, or
· market demand for our new products and services does not develop as anticipated.
If we are unable to keep up with rapid change in our industry, then our business may suffer.
The markets for our products are characterized by rapidly changing technology, evolving industry standards and frequent new product introductions, enhancements and changes in workflow by our customers, our customer’s other vendors and our competitors. Due to technological advancements and changes in industry standards, our products may become obsolete or the prices at which we can sell them may decline. Future technological advances in the television, video and multimedia industries may result in the availability of new products or
19
services that could compete with our products or require us to reduce the price of our existing products or services. The availability of competing or less expensive products could cause our existing or potential customers to fulfill their needs more effectively and cost-efficiently with products other than ours.
For example, customers are, in many environments, using personal computers to create and edit graphics. This is a task that traditionally would have been completed on our standalone machines. To accommodate this new workflow, we provide offline versions of our software that can be used to create graphics to be played out on our proprietary systems. We may not be successful in offering Axis or in enhancing our other products or in developing, manufacturing or marketing new products that satisfy customer needs or achieve market acceptance. In addition, services, products or technologies developed by others may render our products or technologies uncompetitive, unmarketable or obsolete. Announcements of currently planned or other new product offerings by either our competitors or us may cause customers to defer or fail to purchase our existing products or services.
In addition, it is possible that errors or failures may be found in our products. Such errors or failures could cause delays in product introductions and shipments or require design modifications that could adversely affect our sales and our competitive position and could increase warranty claims. This could result in an increase in the inventory of our products. If we do not develop, on a timely basis, new products and enhancements to existing products, or correct errors should they arise, or if such new products or enhancements do not achieve market acceptance, then our business, financial condition and results of operations may suffer. Furthermore, the trend toward the use of software-based and web-based solutions, including our own hosted services, may cause price erosion in our legacy products, create opportunities for new competitors, allow existing competitors enhanced opportunities and limit the sale of our proprietary systems.
We expend substantial resources in developing and selling our products and services, and we may be unable to generate significant revenue as a result of these efforts.
To establish market acceptance of our products and services, we must dedicate significant resources to research and development, production, and sales and marketing. We experience a delay between the time when we expend these resources and the time when we begin to generate revenue, if any, from these expenditures. We record as expenses the costs related to the development of new products as these expenses are incurred. As a result, our profitability from quarter to quarter and from year to year may be materially and adversely affected by the number and timing of sales of our existing products and our new product introductions in any period, and the level of acceptance gained by these products.
20
Our results of operations could be adversely affected by impairments of goodwill or other long-lived assets and intangible assets or a write down of our deferred tax assets.
We have recorded $2.7 million of goodwill and intangible assets on our balance sheet as of December 31, 2011. Goodwill is not amortized, but instead must be tested at least annually for impairment by applying a fair-value-based test. Goodwill is deemed impaired to the extent that its carrying amount exceeds the fair value of the reporting unit. Although our latest tests indicate that no goodwill impairment is currently required, future deterioration in market conditions could lead to goodwill impairments that could have a negative effect on our results of operations.
In addition, we have $18.5 million of deferred tax assets on our balance sheet at December 31, 2011, primarily related to our net operating loss carryforwards. The realizability of this asset is based on estimates and assumptions using available information and judgment. If actual results differ materially from the estimates and assumptions that we used, that could have a material effect on our financial condition and results of operations.
At December 31, 2011, the Company has not identified any impairments related to goodwill or other long-lived assets, nor do we believe that any additional valuation allowances are required for our deferred tax assets.
We have incurred net losses in each of our two most recently completed fiscal years and we may continue to incur net losses in future periods.
We have incurred, on the basis of U.S generally accepted accounting principles, net losses in each of the past two fiscal years: $4.2 million in 2011 and $2.4 million in 2010. These losses, among other things, adversely affect our shareholders’ equity and working capital. These losses, and the principal factors or components underlying them, are discussed in “Management’s Discussion and Analysis of Financial Condition and Results of Operations” in Item 7 of this Annual Report on Form 10-K. We cannot be certain when, or if, our operations will be profitable or, if we become profitable whether it can be sustained.
We will be unable to compete effectively if we fail to anticipate product opportunities based upon emerging technologies and standards and fail to develop products and services that incorporate these technologies and standards.
We may spend significant time and money on research and development to design and develop products and services around an emerging technology or industry standard. If an emerging technology or industry standard that we have identified fails to achieve broad market acceptance in our target markets, then we may be unable to generate significant revenue from our research and development efforts. Moreover, even if we are able to develop products using adopted standards, then our products may not be accepted in our target markets. As a result, our business, financial condition and results of operations would be materially harmed.
21
If systems manufacturers move away from the use of industry standards that we support with our products and adopt alternative standards, then we may be unable to design and develop new products that conform to these new standards. The expertise required is unique to each industry standard, and we would be required to either hire individuals with the requisite expertise or acquire this expertise through a licensing arrangement or by other means. The demand for individuals with the necessary expertise to develop a product relating to a particular industry standard is generally high, and we may not be able to hire such individuals. The cost to acquire this expertise through licensing or other means may be high and such arrangements may not be possible in a timely manner or on commercially reasonable terms, if at all.
Since our systems are Microsoft® Windows®-based, we are vulnerable to issues that arise, both anticipated and unanticipated, whenever a current version of Windows is updated or a new version of Windows is released. When a Windows update is released, Lyric, other Chyron applications and/or the graphics systems of our customers may fail to function correctly or at all. Consequently, we incur expenditures conducting an investigation and subsequently, devising a solution. This can be a time- and capital-consuming process. When a new version of Windows is released, we are forced, against our schedule, to rigorously test all of our software and systems using the new version, investigate malfunctions and re-engineer our software where necessary. This financial and labor expenditure is required in order for us to have the ability to officially represent our software and systems as supporting a specific version of Windows. Our revenues and our market share will decline if we do not continue to develop and exploit the compatibility of our products with Windows. Microsoft’s newest version, Windows 7, has not yet been validated with our proprietary systems, although it can be used with selected offline software and hosted applications. We are currently under an agreement with Microsoft to continue the use of an OEM version of Windows XP® until we have validated and tested Windows 7 with our software.
Because we rely on the implementation of our software and services in Windows® and other operating systems, we are exposed to the vagaries of individual systems or installations in which hardware and/or software may interfere with the operation of our software and systems, or be interfered with by our software and/or systems, and our systems may face exposure to computer viruses. For example, because our Axis World Graphics applications are accessed via an Internet web browser, we are required to test Axis within multiple web browsers including Internet Explorer® and Safari® running on both current and legacy Windows® and Apple® operating systems. We may spend a significant amount of time and resources ensuring that Axis functions properly on a wide range of systems and within the various operating systems and browsers, and in making necessary revisions to Axis to enable compatibility with new versions of these systems. Commissioning our systems, software and services in these situations can consume time and resources beyond original estimates and consequently reduce our profit margins. If we are unable to continue offering our products on the latest versions of these browsers and operating systems, then we will not be able to generate sales of these products, and our business, financial condition and results of operations will be harmed.
22
We may not successfully develop strategic relationships that may be important to our business.
We believe the formation of strategic relationships will be important to our broadcast and online SaaS offerings. The inability to find strategic partners or the failure of any existing relationships to achieve meaningful positive results for us could harm our business. We will rely in part on strategic relationships to help us:
|
|
·
|
maximize visibility and adoption of our products and services through distribution arrangements,
|
· enhance our brand,
· expand the range of commercial activities based on our technology, and
· increase the performance, functionality and utility of our products and services.
Many of these goals have historically been beyond our traditional strengths. Going forward, we anticipate that we may become more reliant on strategic partners to provide multimedia content and build the necessary infrastructure for media delivery. In addition, the efforts of our strategic partners may be unsuccessful. Furthermore, these strategic relationships may be terminated before we realize any benefit.
We operate in a highly competitive environment and industry and we may lack resources needed to capture increased market share.
We may not be able to compete successfully against our current or future competitors. The markets for digital and broadcast graphics products and services are highly competitive. These markets are characterized by constant technological change and evolving industry standards. Most of our competitors have significantly greater financial, technical, manufacturing and marketing resources than we have. In addition, certain vendors dominate certain product categories and market segments, on a region-by-region basis, in which we currently operate or may wish to operate in the future. As a result, our ability to compete and operate in these areas may be limited.
We believe that our ability to compete depends on factors both within and outside of our control, including the success and timing of new product and service offerings introduced by us and by our competitors, product performance and price, market presence and customer support. We may not be able to compete successfully with respect to these factors. Maintaining any advantage that we may have, now or in the future, over our competitors will require our continuing investments in research and development, acquisition and retention of highly skilled personnel, competitive analyses, sales and marketing and customer service and support. In addition, as we enter new markets, we may encounter distribution channels, technical requirements and competitive factors that differ from those in the markets in which we currently operate. We may not be able to compete successfully in these new markets. Increased competition in any of our current markets could also result in price reductions, reduced margins or loss of market share, any of which could harm our business, financial condition and results of operations.
23
We may encounter periods of industry-wide, surface-mount components shortage, resulting in pricing pressure and a risk that we could be unable to fulfill our customers’ requirements.
The semiconductor industry (from which surface-mount components are derived) has historically been characterized by wide fluctuations in the demand for, supply of, and price of its products, which feed the electronics, telecommunications and computer markets. These fluctuations have resulted in circumstances when supply and demand for the industry’s products have been widely out of balance. Our operating results may be materially harmed by industry-wide surface mount component shortage, which could result in severe pricing pressure. In a market with undersupply, we would have to compete with the larger customers of our vendors for limited manufacturing capacity. For example, as a result of the extensive flooding in Thailand, we experienced a temporary shortage in one of our components. In such an environment, we may be unable to have our products manufactured in a timely manner or in quantities necessary to meet our requirements. Since we outsource the manufacture and supply of a significant proportion of our products, we are particularly vulnerable to such supply shortages. As a result, we may be unable to fulfill orders and may lose customers. Any future, industry-wide shortage of surface-mount components or manufacturing capacity would materially harm our business, financial condition and results of operations.
We depend on a limited number of suppliers of surface-mount components.
We depend on a limited number of contract manufacturers to produce surface-mount components for our products. Our principal suppliers may experience unanticipated events that could inhibit their ability to provide us with adequate manufacturing capacity on a timely basis, or at all. For example, we currently depend on one supplier for a surface-mount component that is used in substantially all of our hardware products. This component was manufactured by our supplier at a facility in Thailand which experienced extensive flooding in recent months. As a result, our supplier was forced to seek alternate sources of supply and shifted production to other facilities. Because we had enough inventory on hand, the delay in receipt of this component did not have any impact on the results of operations for 2011. As of December 2011, the supplier is back to its normal production schedule. Introducing new surface-mount components or transferring existing design and specifications to a new third-party manufacturer would require significant development time to adapt our designs to their manufacturing processes and could cause product shipment delays. In addition, the costs associated with manufacturing our components may increase if we are required to use a new third-party manufacturer. If we fail to satisfy our manufacturing requirements, then our business, financial condition and results of operations would be materially harmed.
We depend on the availability of specific off-the-shelf components.
If the supply of specific off-the-shelf components for our products is terminated due to either market demand or by choice of the manufacturer, then production, and therefore, revenue, could be negatively impacted. In addition, our resources would need to be diverted to locate a replacement component, which must then be rigorously tested and qualified. If we fail to have the ability to seamlessly switch from a non-available component to a replacement, then our business, financial condition and results of operations would be materially harmed.
24
Our business will suffer if our network systems fail or become unavailable.
A reduction in the performance, reliability and availability of our network infrastructure would harm our ability to distribute our products and services to our users, as well as our reputation and ability to attract and retain users and content providers. Our systems and operations could be damaged or interrupted by fire, flood, power loss, telecommunications failure, Internet breakdown, earthquake and similar events. Our systems could also be subject to viruses, break-ins, sabotage, acts of terrorism, acts of vandalism, hacking, cyber-terrorism and similar misconduct which could result in unintentional disclosure of proprietary, sensitive or confidential information. Such unauthorized access could expose us, our customers or the individuals to a risk of loss or misuse of information, resulting in litigation or potential liability for us. Although we offer redundant configurations for some of our systems and co-locations of our servers to protect our Axis World Graphics hosted services, we do not offer fully redundant configurations across the entire product line, nor do we have a formal disaster recovery plan. We might not carry adequate business interruption insurance to compensate us for losses that may occur from a system outage. Any system error or failure that causes interruption in availability of products or services or an increase in response time could result in a loss of potential or existing customers or content providers, which could have a material adverse effect on our business, financial condition and results of operations. If we suffer sustained or repeated interruptions, then our products and services could be less attractive to our users and our business would be materially harmed.
We depend upon third-party dealers to market and sell our products and services and they may discontinue sale of our products and services, fail to give our products and services priority or be unable to successfully market, sell and support our products and services.
During 2011, 32% of our sales were made to third-party dealers and independent representatives. Although we have contracts with our dealers and representatives, any of them may terminate their relationship with us on short notice. The loss of one or more of our principal dealers, or our inability to attract new dealers, could materially harm our business. We may lose dealers in the future and we may be unable to recruit additional or replacement dealers. As a result, our future performance will depend in part on our ability to retain our existing dealers and representatives and attract new dealers and representatives who will be able to sell and support our products and services effectively.
Problems associated with international business operations could subject us to risks from financial, operational and political situations, and affect our ability to manufacture and sell our products and services.
Sales to customers located outside the United States accounted for 28% of our total sales in 2011 and 25% of our total sales in 2010. We anticipate that sales to customers located outside the United States will continue to represent a significant portion of our total sales in future periods. Accordingly, our operations and revenues are subject to a number of risks associated with foreign commerce, including the following:
25
|
|
·
|
managing foreign dealers and foreign customers, which may be state corporations or government agencies,
|
· staffing and managing foreign branch offices,
· political and economic instability,
· foreign currency exchange fluctuations,
|
|
·
|
changes in tax laws, tariffs, environmental directives, freight rates and governmental royalties,
|
· timing and availability of export licenses,
· changes in laws and policies governing operations of foreign-based companies,
· inadequate protection of intellectual property rights in some countries,
|
·
|
longer collection cycles for accounts receivable payment cycles and difficulties in enforcing contracts,
|
· obtaining governmental approvals for certain products, and
|
|
·
|
technical standards which may differ and/or be more stringent that those of the United States, and would cause us to incur expenses associated with obtaining required certifications.
|
In 2011, we denominated sales of our products in foreign countries exclusively in U.S. dollars and British Pounds Sterling. As a result, any increase in the value of the U.S. dollar relative to the local currency of a foreign country would increase the price of our products in that country so that our products become more expensive to customers in the local currency of that foreign country. As a result, sales of our products in that foreign country may decline. To the extent any such risks materialize, our business, financial condition and results of operations would be materially harmed.
If we are not able to retain our current senior management team or continue to attract and retain qualified scientific, technical and business personnel, our business will suffer.
We depend on the members of our management team for our business success. The loss of any one member of our senior management team, including, in particular, Michael Wellesley-Wesley, our President and Chief Executive Officer and Jerry Kieliszak, our Senior Vice President and Chief Financial Officer, could result in a significant loss in the knowledge and experience that we, as an organization possess and could cause significant delays, or outright failure, in the development and commercialization of our products, and could hinder the operation of our business. We have an employment agreement with Mr. Wellesley-Wesley which extends through December 2012. The agreement may be terminated either by us or by Mr. Wellesley-Wesley with or without consent. Mr. Kieliszak is employed with us on an at-will basis pursuant to an offer letter executed at the time he commenced employment with us. Mr. Kieliszak is party to a severance agreement with us. Messrs. Wellesley-Wesley and Kieliszak are parties to change-in-control agreements with us. The terms of these agreements will be detailed in the Compensation Discussion and Analysis section of our 2012 Proxy Statement on Schedule 14A. The loss of the services of these individuals may delay or prevent us from achieving our objectives.
26
In addition, we believe our future success will depend upon our ability to attract and retain engineers and other highly skilled personnel and sales people. Most of our employees are at-will and only a few are subject to employment contracts. Hiring qualified sales and technical personnel will be difficult due to the limited number of qualified professionals. Competition for these types of employees is high. We have in the past experienced difficulty in recruiting and retaining qualified sales and technical personnel necessary for the development of our business. Failure to attract and retain personnel, particularly sales and technical personnel, would materially harm our business.
We may not be able to protect our proprietary technology and may be sued for infringing on the rights of others.
Protection of intellectual property rights is crucial to our business, since that is how we prevent others from copying innovations that are central to our existing and future products. Our success also depends, in part, upon our ability to operate without infringing upon the rights of others. We rely on a combination of methods to protect our proprietary intellectual property, technology and body of knowledge, such as:
· trade secret laws,
· copyright law,
· trademark law,
· patent law,
· contractual provisions,
· confidentiality agreements, and
· certain technology and security measures.
Because it is critical to our success that we are able to prevent competitors from copying our innovations, we intend to continue to seek patent and trade secret protection for our products where available and when we deem appropriate. The process of seeking patent protection can be long and expensive and we cannot be certain that any currently pending or future applications will actually result in issued patents, or that, even if patents are issued, they will be of sufficient scope or strength to provide meaningful protection or any commercial advantage to us. We also intend to continue to seek trademark status for our product/service brand names and technologies, in order to prevent our competitors from co-opting these brand names for their own use.
Existing copyright, trademark, patent and trade secret laws afford only limited protection. Moreover, effective protection of copyrights, trade secrets, trademarks and other proprietary rights may be unavailable or limited in certain foreign countries and territories. Domestic and foreign laws, in combination with the steps we have taken to protect our proprietary rights, may not be adequate to prevent misappropriation of our technology or other proprietary rights. The steps we have taken regarding our proprietary technology may not be sufficient to deter misappropriation; for example, we have rights in trademarks, service marks and copyrights that are not registered. We also rely on trade secret protection for our technology, in part through confidentiality agreements with our employees, consultants and third parties; however, employees may breach these agreements, and we may not have adequate remedies for any
27
breach. Also, the copyright, trademark, patent and trade secret laws we rely upon to protect our intellectual property do not preclude competitors from independently developing products with functionality or features similar or superior to our products and technologies, or designing around the patents we own or the technology we create.
In the systems and software industries, companies receive notices from time to time alleging infringement of patents, copyrights or other intellectual property rights of others. In the past we have been, and may from time to time continue to be, notified of claims that we may be infringing patents, copyrights or other intellectual property rights of third parties. Companies may pursue claims against us with respect to the alleged infringement of patents, copyrights or other intellectual property rights of third parties. In addition, litigation may be necessary to protect our intellectual property rights and trade secrets, to determine the validity of and scope of the proprietary rights of others or to defend against third-party claims of infringement. Any litigation could result in substantial costs and diversion of resources from the day-to-day operation of our business.
If a new law or regulation is adopted pertaining to the telecommunications and television industries, it could harm our customers’ business, which could have a material adverse effect on our business, financial condition and results of operations.
The enactment by U.S. federal or state or international governments of new laws or regulations, changes in the interpretation of existing regulations or a reversal of the trend toward deregulation in these industries could cause our customers to suffer, and thereby adversely affect our business, financial condition and results of operations. Television operators are subject to extensive government regulation by the FCC and other U.S. federal and state regulatory agencies. These regulations could limit capital expenditures by television operators and if that occurs, our business, financial condition and results of operations may suffer.
The telecommunications and television industries are subject to extensive regulation in the United States and other countries. Our business is dependent upon the continued growth of these industries in the United States and internationally. Recent legislation has lowered the legal barriers to entry for companies into the United States’ multi-channel television market, but telecommunications companies may not successfully enter this or related markets. Moreover, the growth of our business internationally is dependent in part on similar deregulation of the telecommunications industry abroad and such deregulation may not occur.
We are uncertain of our ability to obtain financing for our future needs, and liquidity issues have and may continue to increase our cost of capital.
At December 31, 2011, we had cash and cash equivalents of $4.2 million and working capital of $7.4 million. We have a credit facility from a U.S. bank which expires December 29, 2012. The credit facility provides for a $1.5 million revolving line of credit with an advance rate of up to 80% of eligible accounts receivable. We believe that cash on hand, net cash expected to be generated in the business, and the amount available under our line of credit, will be sufficient to meet our needs for at least the next twelve months if we are able to achieve our planned results of operations and retain the availability of credit under our lending agreement. However, we may
28
need to raise additional funds in order to fund our business, expand our sales and marketing activities, develop or enhance new products and services, respond to competitive pressures and satisfy our existing and any new obligations that may arise. We could be in default under our credit facility with our bank if: (i) we fail to make payment of principal and interest when due; (ii) we fail to provide to our bank required financial statements, reports and certificates; fail to timely file all required tax returns and pay timely; maintain required insurance policies at levels acceptable to the bank; maintain our primary operating bank accounts with the bank; fail to meet our financial covenants or comply with the required negative covenants; (iii) we incur a material adverse change in our business, operations or condition or if there is a material impairment in the perfection of the bank’s lien on the collateral supporting the credit facility; (iv) we become insolvent; (v) are issued a judgment for payment of $200,000 or more net of insurance recovery if any; and (vi) other events of default as described in our Loan and Security Agreement, as amended, with our bank. In the event of default, the bank’s remedies include any or all of the following: (i) declare all outstanding obligations, including unpaid principal and interest on our equipment term loan, due and payable; (ii) stop advances or credit under the credit facility; (iii) require that we deposit cash equal to any outstanding letters of credit; (iv) terminate any foreign exchange forward contracts; (v) dispose of collateral adequate to repay the bank any amounts owed to it; and (vi) take additional measures, as outlined in the Loan and Security Agreement, as amended, to protect its interests. Additional financing may not be available on terms favorable to us, or at all. Capital is critical to our business, and our ability to raise capital in the event that losses use our available cash would have a material adverse effect on our business, financial condition and results of operations.
Raising additional capital may cause dilution to our existing shareholders, restrict our operations or require us to relinquish rights to our technologies.
We may seek additional capital through a combination of private and public equity offerings, debt financings, collaborations, strategic alliances and licensing arrangements. To the extent that we raise additional capital through the sale of equity or convertible debt securities, your ownership interest will be diluted, and the terms may include liquidation or other preferences that adversely affect your rights as a shareholder. Debt financing, if available, may involve agreements that include covenants limiting or restricting our ability to take specific actions, such as incurring debt, making capital expenditures or declaring dividends. If we raise additional funds through collaborations, strategic alliances and licensing arrangements with third parties, we may have to relinquish valuable rights to our technologies, or grant licenses on terms that are not favorable to us. If we are unable to raise additional funds through equity or debt financing when needed, we may be required to delay, limit, reduce or terminate our product development or commercialization efforts or grant rights to develop and market our products that we would otherwise prefer to develop and market ourselves.
29
Significant changes in discount rates, the actual return on pension assets and other factors could adversely affect our business, financial condition and results of operations.
Our business, financial condition and results of operations may be negatively impacted by the amount of expense recorded related to our qualified pension plan. Accounting principles generally accepted in the Unites States (“GAAP”) require that income or expense related to the pension plan be calculated at the annual measurement date using actuarial calculations, which reflect certain assumptions. The most significant of these assumptions relate to interest rates, the capital markets and other economic conditions. Changes in key economic indicators can change these assumptions. These assumptions, as well as the actual value of pension assets at the measurement date, will impact the calculation of pension expense for the year. Although GAAP expense and pension contributions are not directly related, the key economic indicators that affect GAAP expense also affect the amount of cash that we will contribute to our pension plan. Because the values of these pension assets have fluctuated and will continue to fluctuate in response to changing market conditions, the amount of gains or losses that will be recognized in subsequent periods, the impact on the funded status of the pension plan and the future minimum required contributions, if any, could adversely affect our business, financial condition and results of operations.
Our principal shareholders have significant voting power and may vote for actions that may not be in the best interests of our shareholders.
Our officers, directors and 5% or more shareholders, together control approximately 40.42% of our issued and outstanding common stock as of March 1, 2012. As a result, these shareholders, if they act together, will be able to significantly influence the management and affairs of our company and all matters requiring shareholder approval, including the election of directors and approval of significant corporate transactions. This concentration of ownership may have an effect on any potential change in control or other business combination and might affect the market price of our common stock. This concentration of ownership may not be in the best interest of our other shareholders.
An increase in the number of shares of our common stock outstanding could reduce the price of our common stock.
At December 31, 2011, there were 3.8 million potentially dilutive shares that would be issuable if all outstanding common stock options were exercised and all restricted stock units were vested, plus an additional 2.3 million shares available for grant under our stock incentive plan. Issuance or sale of a substantial number of shares of additional common stock, or the perception that such issuance or sales could occur, could adversely affect the market price for our common stock as it would result in additional shares of our common stock being available on the public market. These issuances or sales also might make it difficult for us to sell equity securities in the future at a time and at a price that we deem appropriate.
30
We have various mechanisms in place to discourage takeover attempts, which may reduce or eliminate your ability to sell your shares for a premium in a change of control transaction.
Various provisions of our Amended and Restated Certificate of Incorporation and Amended and Restated By-Laws and New York corporate law may discourage, delay or prevent a change in control or takeover attempt of our company by a third party that is opposed to by our management and board of directors. Shareholders who might desire to participate in such a transaction may not have the opportunity to do so. These anti-takeover provisions could substantially impede the ability of shareholders to benefit from a change of control or change in our management and board of directors. These provisions include:
|
|
·
|
authorizing the issuance of “blank check” preferred stock that could be issued by our board of directors to increase the number of outstanding shares, issue shares of stock with voting, liquidation and other rights in preference to the rights of common shareholders and thwart a takeover attempt,
|
|
|
·
|
limiting who may call special meetings of our shareholders, and
|
|
|
·
|
establishing advance notice requirements for nominations of candidates for election to our board of directors, or for proposing matters that can be acted upon by our shareholders at shareholder meetings.
|
The price of our common stock may be volatile.
The trading price of our common stock has been and may continue to be subject to fluctuations in response to quarter-to-quarter variations in our liquidity and operating results, changes in earnings estimates by analysts, general conditions in the digital media industry, announcements of technological innovations or new products or services introduced by us or our competitors, and other events or factors. The stock market in general, and the shares of technology companies in particular, have experienced extreme price fluctuations in recent years. During the period commencing January 1, 2010 through March 1, 2012, the price of our common stock has ranged between $1.17 and $3.40. This volatility has had a substantial impact on the market prices of securities issued by many companies for reasons unrelated to the operating performance of the companies affected. These broad market fluctuations may adversely affect the market price of our common stock.
ITEM 1B. UNRESOLVED STAFF COMMENTS
None.
ITEM 2. PROPERTIES
Our executive offices and principal office are located in Melville, New York, pursuant to a lease that expires on July 31, 2019. This facility consists of approximately 47,000 square feet and is used for manufacturing, research and development, marketing and the executive offices. We believe that this facility is suitable for our existing operations and do not foresee the need for any significant expansion of our current facility.
31
ITEM 3. LEGAL PROCEEDINGS
On December 1, 2009, one of our customers, International Broadcast Consultants, Inc., or IBC, filed a lawsuit against us in the Superior Court of the State of California for the County of Los Angeles, which was subsequently removed to the United States District Court for the Central District of California on January 4, 2010. In August 2011, after various motions and proceedings before the court, Chyron settled this lawsuit for de minimis consideration. The settlement of this lawsuit did not have a material impact on our business, financial condition, results of operations or liquidity.
A letter of notification, dated March 10, 2011, was received from counsel for Turner Broadcasting System, Inc., Turner Network Television, Inc., Cable News Network, Inc., and The Cartoon Network, Inc. (“Turner”) alleging that we are obligated to indemnify Turner as a result of a recently filed patent infringement action against Turner by Multimedia Patent Trust (“MPT”) in the United States District Court for the Southern District of California. Chyron supplies various products to Turner. We have notified Turner that its request is without merit. We believe Turner’s request for indemnification lacks merit because our products do not infringe any of MPT’s patents and we are not obligated to indemnify Turner for those portions of our products that are allegedly involved. Should any of such parts of our products be found to be infringing, then indemnification should lawfully be sought from our outside supplier of such parts and not Chyron. We have denied Turner’s request. Based on our current knowledge, we believe that the amount of reasonably possible loss or range of loss is not reasonably estimable. Moreover, legal matters are inherently unpredictable and subject to significant uncertainties, some of which are beyond our control. As such, there can be no assurance that the final outcome will not have a material adverse effect upon our financial condition and results of operations.
We are not a party to any other legal proceedings that we believe will have a material impact on our business, financial condition, results of operations or liquidity.
ITEM 4. MINE SAFETY DISCLOSURES
Not applicable.
32
PART II
|
|
ITEM 5. MARKET FOR REGISTRANT’S COMMON EQUITY, RELATED
|
|
|
SHAREHOLDER MATTERS AND ISSUER PURCHASES OF EQUITY
|
|
|
SECURITIES
|
Market Information
Our common stock trades on The NASDAQ Global Market under the symbol “CHYR”. Prior to this listing our common stock traded on the American Stock Exchange under the symbol “CGS.”
The high and low sales prices of the Company’s common stock, as reported by NASDAQ, for each full quarterly period for the two most recent fiscal years, were as follows:
Price Range of Common Stock
|
High
|
Low
|
|
|
Year ended December 31, 2011
|
||
|
Fourth quarter
|
$2.02
|
$1.17
|
|
Third quarter
|
2.80
|
1.86
|
|
Second quarter
|
2.65
|
1.91
|
|
First quarter
|
3.40
|
1.94
|
|
Year ended December 31, 2010
|
||
|
Fourth quarter
|
$2.35
|
$1.45
|
|
Third quarter
|
1.95
|
1.26
|
|
Second quarter
|
2.20
|
1.70
|
|
First quarter
|
2.25
|
1.83
|
Shareholders
As of March 1, 2012, there were approximately 7,700 shareholders of record of our common stock.
Dividends
We have not declared or paid any cash dividends since 1989. We currently plan to retain any future earnings, for use in the operation and expansion of our business and do not anticipate paying cash dividends in the foreseeable future. In addition, under the credit agreement with our lender, we are not permitted to pay any dividends without the bank’s consent.
33
Unregistered Sales of Equity Securities
None.
Issuer Purchases of Equity Securities
None.
Stock Performance Graph
The following graph compares the cumulative 5-year total return provided shareholders on Chyron Corporation’s common stock relative to the cumulative total returns of the Russell MicroCap index, and a customized peer group of two companies that includes: Avid Technology, Inc. and Vizrt Ltd. An investment of $100 (with reinvestment of all dividends) is assumed to have been made in our common stock, in the peer group, and the index on 12/31/2006 and its relative performance is tracked through 12/31/2011. The graph lines merely connect year-end value and do not reflect fluctuations between those dates. We did not declare or pay any dividends during the comparison period.
34
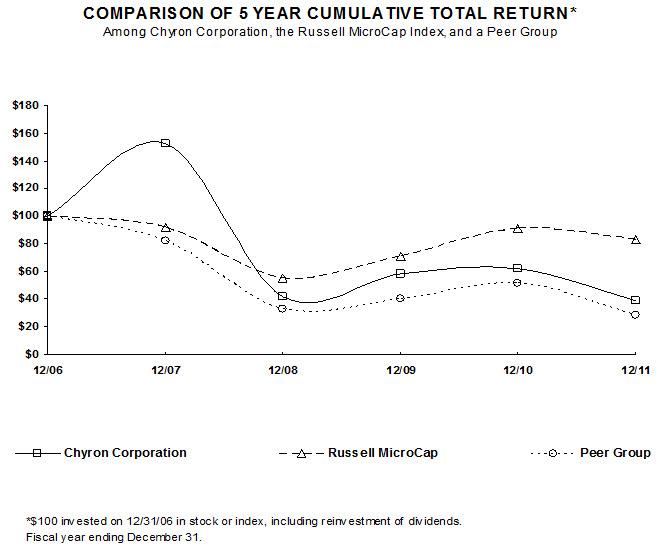
|
12/06
|
12/07
|
12/08
|
12/09
|
12/10
|
12/11
|
|
|
Chyron Corporation
|
100.00
|
152.66
|
42.02
|
58.26
|
61.62
|
38.94
|
|
Russell MicroCap
|
100.00
|
92.00
|
55.40
|
70.63
|
91.03
|
82.59
|
|
Peer Group
|
100.00
|
82.27
|
32.67
|
40.35
|
51.89
|
28.60
|
The stock price performance included in this graph is not necessarily indicative of future stock price performance
The performance graph shall not be deemed to be incorporated by reference by means of any general statement incorporating by reference this Form 10-K into any filing under the Securities Act of 1933, as amended, or the Securities Exchange Act of 1934, as amended, except to the extent that we specifically incorporate such information by reference, and shall not otherwise be deemed filed under such acts.
35
ITEM 6. SELECTED FINANCIAL DATA
The information called for by this Item is omitted in reliance upon Item 301(c) of Regulation S-K.
ITEM 7. MANAGEMENT’S DISCUSSION AND ANALYSIS OF FINANCIAL
CONDITION AND RESULTS OF OPERATIONS
General
In this section, we discuss our consolidated financial statements for the periods indicated, which have been prepared in accordance with accounting principles generally accepted in the United States. The preparation of these financial statements requires management to make estimates and assumptions that affect the reported amounts of assets and liabilities and the disclosure of contingent assets and liabilities at the date of the financial statements and the reported amounts of revenues and expenses during the reporting period. On an on-going basis, management evaluates its estimates and judgments, including those related to product returns, bad debts, inventories, revenue recognition, investments, intangible assets, income taxes, financing, operations, warranty obligations, restructuring costs, healthcare costs and retirement benefits, forecasts of future results, contingency plans, cash requirements and contingencies and litigation. Management bases its estimates and judgments on historical experience and on various other factors. These include, but are not limited to, pricing pressures, customer requirements, supply issues, manufacturing performance, product development and general market conditions that are believed to be reasonable under the circumstances, the results of which form the basis for making judgments about the carrying values of assets and liabilities that are not readily apparent from other sources. Actual results may differ from these estimates under different assumptions or conditions. Results for the periods reported herein are not necessarily indicative of results that may be expected in future periods.
Overview
We have been holding our position during recent recessionary periods by improving our technology and investing in sales and marketing personnel both domestically and abroad. We believe that our media company customers are beginning to realize increases in their revenues, mainly due to political advertising and the recovery in several core advertising segments, most notably automotive, that favorably impacts their capital expenditure budgets. These strategies and occurrences in the marketplace are beginning to have a positive impact on our results of operations.
36
The overall economic recovery is still tenuous, however, and our professional media customers continue to be challenged. They are in the process of transforming their businesses to address new opportunities and threats. To help our customers transition their business models we must develop workflow solutions for them that bring cost advantage over traditional processes. Simply put, our mission is to offer visionary, responsive and cost-effective solutions to the community of professionals involved in the creation, management and distribution of media content. These solutions help our media clients do more with less. By leveraging our Cloud-based technologies to deliver low-cost, scalable, collaborative applications and services, we help our customers transform their high fixed-cost business model to a lower, variable and more flexible cost model. We are not deemphasizing our products business, rather, we are finding that adoption of our services offerings results in new product and systems sales and vice versa.
Results of Operations
Year Ended December 31, 2011 Compared to Year Ended December 31, 2010
Net Sales. Total revenues for the year ended December 31, 2011 were $31.6 million, an increase of $3.9 million, or 14%, from the $27.7 million reported for the year ended December 31, 2010. Total revenues derived from U.S. customers were $22.8 million in 2011 as compared to $20.7 million in 2010. Total revenues derived from international customers were $8.8 million in 2011 and $7.0 million in 2010.
Revenues, by type, are as follows (in thousands):
|
% of
|
% of
|
|||
|
2011
|
Total
|
2010
|
Total
|
|
|
Product
|
$23,877
|
76%
|
$21,452
|
77%
|
|
Services
|
7,710
|
24%
|
6,275
|
23%
|
|
$31,587
|
$27,727
|
In the U.S., many TV networks and station groups realized increases in political advertising revenues and automotive advertising revenues that enabled them to procure products, resulting in increased demand domestically for our product and services offerings in 2011. In addition, we have experienced increased demand in certain markets as broadcasters upgrade and standardize their systems across locations and also in anticipation of the summer Olympics in 2012.
Our services revenues have increased in both total dollars and as a percentage of total revenues due to an increase in training provided to our customers, the sale of software and hardware maintenance contracts for our broadcast graphics products and new revenues generated from the sale of our Axis World Graphics applications.
37
Gross Profit. Gross profit margins for the year ended December 31, 2011 and 2010 were 70% and 69%, respectively. Overall, we have been able to obtain reasonable pricing for our materials and have favorably managed our overhead costs to achieve a consistent cost structure. Also, in 2011 we increased inventory reserves by $0.1 million as compared to $0.25 million in 2010. Larger reserves were required in 2010 as we transitioned away from certain legacy products.
Selling, General and Administrative Expenses. Selling, general and administrative (“SG&A”) expenses were $17.3 million in 2011 as compared to $15.0 million in 2010, an increase of 15%. The increase in spending is primarily due to additional compensation and related direct costs of increasing our senior sales, marketing and support staff. As planned, in 2011 the Company made strategic hires in key sales positions and expanded our sales and marketing efforts overseas.
We expect that SG&A expenses will continue to increase in 2012 as we continue our focus on increasing sales and marketing efforts in order to drive revenue growth, especially in our international business, and as we realize the impact of the costs associated with the hiring of these key positions that will be filled for an entire year.
Research and Development Expenses. Research and development (“R&D”) costs increased $0.1 million, or 2%, in 2011 to $6.7 million as compared to $6.6 million in 2010. R&D has substantially leveled off between 2010 and 2011, with minor increases primarily a result of additional engineering staff in support of our ongoing development process. We anticipate there will be marginal increases in 2012 costs as new products evolve.
Interest expense. Interest expense declined slightly in 2011 as compared to 2010, as we continue to make monthly principal payments on our term loan and the outstanding balance is reduced. Final payment on this borrowing is scheduled for May 2012.
Other income (loss), net. The components of other income (loss), net are as follows (in thousands):
|
2011
|
2010
|
|
|
Foreign exchange transaction gain (loss)
|
$ 16
|
$ (2)
|
|
Other
|
-
|
(37)
|
|
$ 16
|
$(39)
|
We continue to be exposed to foreign currency and exchange risk in the normal course of business due to our revenues that can be negotiated in British Pounds Sterling. However, we believe that it is not material to our near-term financial position or results of operations.
38
Income tax (expense) benefit, net. During 2011, we recorded an income tax expense of $2.3 million as compared to an income tax benefit of $0.1 million in 2010. The primary reason for the increase in income tax expense relates to the increase in our valuation allowance for deferred tax assets. In the third quarter of 2011, it was determined, based on management’s current estimate of book income and the uncertainty of the timing of future taxable income, that it was more likely than not that we would not realize a portion of our net operating loss carryforwards and, therefore, we recorded a charge of $2.7 million, which is why we had a net income tax expense, rather than benefit, for 2011.
Year Ended December 31, 2010 Compared to Year Ended December 31, 2009
The Company has elected not to report its results of operations for the fiscal year ended December 31, 2009, or to include a discussion of its results of operations for such period compared to 2010, in reliance upon Instruction 1 to Item 303(a) of Regulation S-K. Investors are urged to read the Company’s Annual Report on Form 10-K for the fiscal year ended December 31, 2010 for this information.
Liquidity and Capital Resources
Sources and Uses of Funds
Historically, the Company has financed its business primarily with cash generated from operations. At December 31, 2011, we had cash and cash equivalents on hand of $4.2 million and working capital of $7.4 million. In 2011, the Company used approximately $0.2 million in net cash for operations. This was primarily caused by the increase in accounts receivable that was driven by higher sales in the last two months of 2011. This was offset, to a lesser degree, by the increase in accounts payable that was higher than normal, due to the late receipt of certain inventory components, delayed due to production shifts as a result of flooding in Thailand.
The Company has a credit facility with a U.S. bank which expires December 29, 2012. The credit facility provides for a $1.5 million revolving line of credit (“revolver”), with an advance rate of up to 80% of eligible accounts receivable. At December 31, 2011, available borrowings were approximately $1.5 million based on this formula. In 2009, the Company borrowed $0.98 million to finance capital equipment under the then existing credit facility, of which $0.1 million remained outstanding at December 31, 2011 and is scheduled to be repaid in full by May 2012. The Company is required to maintain financial covenants based on an adjusted quick ratio of 1.2, measured at month-end, and minimum tangible net worth of $18.5 million, increased by 60% of the sum of the gross proceeds received by the Company from any sale of its equity or incurrence of subordinated debt and any positive quarterly net income earned, measured at quarter-end (as defined in the credit facility). As is usual and customary in such lending agreements, the agreements also contain certain non-financial requirements, such as required periodic reporting to the bank and various representations and warranties. The lending agreement also restricts our ability to pay dividends without the bank’s consent. The Company has been in compliance with all debt covenants since inception of the credit facility.
39
The Company invested approximately $0.9 million in 2011 for new equipment. Approximately $0.8 million of 2011 purchases relate to equipment for storage and backup related to our services business and other equipment used for demonstrations and tradeshows in line with our marketing focus.
During 2012, we plan to expend approximately $0.8 million for another co-location for our servers that will be funded from operations or additional borrowings.
Off-Balance Sheet Arrangements
We do not have any off-balance sheet arrangements.
Contractual Obligations
The Company’s contractual obligations as of December 31, 2011, were as follows (in thousands):
|
Payments Due by Period
|
|||||
|
Less Than
|
One to
|
Three to
|
More Than
|
||
|
Contractual Obligations
|
Total
|
One Year
|
Three Years
|
Five Years
|
Five Years
|
|
Operating lease obligations
|
$ 5,279
|
$ 653
|
$1,365
|
$1,364
|
$1,897
|
|
Pension obligations (1)
|
3,447
|
783
|
2,664
|
||
|
Purchase commitments for inventory
|
1,737
|
1,737
|
|||
|
Term Loan (2)
|
135
|
135
|
|||
|
Capital lease obligations
|
81
|
38
|
33
|
10
|
|
|
Total
|
$10,679
|
$3,346
|
$4,062
|
$1,374
|
$1,897
|
|
(1)
|
Lower than expected investment performance could accelerate or increase the amount of payment of
|
|
|
required contributions in future years.
|
|
(2)
|
If an event of default were to occur, that is not cured, the bank could demand repayment.
|
Liquidity
We have been holding our position during recent recessionary periods by improving our technology and investing in sales and marketing personnel both domestically and abroad. We believe that our media company customers are beginning to realize increases in their revenues, mainly due to political advertising and the recovery in several core advertising segments, most notably automotive, that favorably impacts their capital expenditure budgets. These strategies and occurrences in the marketplace are beginning to have a positive impact on our results of operations.
The overall economic recovery is still tenuous, however. Our future growth and success will depend to a significant degree on our ability to generate sales of cost-effective workflow solutions in our existing and new markets. We operate in a rapidly changing environment and must remain responsive to changes as they occur. In the event that revenues are significantly below forecasted revenues, we believe we have the ability to reduce or delay discretionary expenditures, including capital purchases, and reduce headcount, so that we will have sufficient
40
cash resources. However, there can be no assurance that we will be able to adjust our costs in sufficient time to respond to revenue and cash shortfalls, should that occur.
Our long-term success will depend on our ability to achieve and sustain profitable operating results and our ability to raise additional capital on acceptable terms should such additional capital be required. In the event that we are unable to achieve expected goals of profitability or raise sufficient additional capital, if needed, we may have to scale back or eliminate certain parts of our operations.
We believe that cash on hand, net cash to be generated in the business, and availability of funding under our credit facility, will be sufficient to meet our cash needs for at least the next 12 months if we are able to achieve our planned results of operations and retain the availability of credit under our lending agreement.
If these sources of funds are not sufficient, we may need to reduce, delay or terminate our existing or planned products and services. We may also need to raise additional funds through one or more capital financings. To the extent that we raise additional capital through the sale of equity or convertible debt securities, the ownership interest of our existing shareholders will be diluted, and the terms may include liquidation or other preferences that adversely affect the rights of our shareholders. Debt financing, if available, may involve agreements that include covenants limiting or restricting our ability to take specific actions, such as incurring debt, making capital expenditures or declaring dividends. If we raise additional funds through collaborations, strategic alliances and licensing arrangements with third parties, we may have to relinquish valuable rights to our technologies or products, or grant licenses on terms that are not favorable to us.
There can be no assurance that additional funds will be available when we need them on terms that are acceptable to us, or at all. If adequate funds are not available to us on a timely basis, we may be required to delay, limit, reduce or terminate development activities for one or more of our products or services; or delay, limit, reduce or terminate our sales and marketing capabilities or other activities that may be necessary to commercialize one or more of our products or services.
Impact of Inflation and Changing Prices
Although we cannot accurately determine the precise effect of inflation, we believe that it has not significantly impacted our revenues or increased the costs of salaries, benefits and general and administrative expenses. We attempt to pass on increased costs and expenses by developing more useful and cost-effective products for our customers that can be sold at more favorable profit margins.
41
Recent Accounting Pronouncements
For a discussion of recent accounting pronouncements, see Note 1 of our consolidated financial statements included in this Annual Report under the caption “Item 8 - Financial Statements and Supplementary Data.”
Common Stock in our 401(k) Plan
We have a 401(k) plan for U.S. employees into which we make discretionary matching contributions. The discretionary matching contribution is currently two thirds of the first 6% of qualifying compensation up to the IRS limits for tax-deferred employee contributions. We have the option of making the matching contribution in cash or through the issuance of Company stock. During 2011 and 2010, we issued 130 thousand and 114 thousand shares, respectively, of common stock in connection with the Company match for our 401(k) plan in lieu of an aggregate cash match of $265 thousand and $217 thousand, respectively. A participant in the 401(k) plan has 15 investment choices.
Critical Accounting Policies and Estimates
Management believes the following critical accounting policies, among others, comprise the more significant judgments and estimates used in the preparation of our consolidated financial statements. These critical accounting policies and estimates have been discussed with our Audit Committee and the Audit Committee has reviewed the disclosures relating to such matters.
Revenue Recognition
The Company recognizes revenue when persuasive evidence of an arrangement exists, title has transferred, product payment is not contingent upon installation or other service obligations, the price is fixed or determinable, and collectability is reasonably assured. This condition is normally met when the product has been delivered or upon performance of services. In instances where final acceptance of the product or service is specified by the customer, revenue is deferred until all acceptance criteria have been met.
The Company also enters into arrangements that contain multiple elements such as equipment, installation and service. For multiple-element arrangements, revenue is recognized based on an allocation of the total amount of the arrangement to each deliverable based on the fair value based on vendor-specific objective evidence (“VSOE”) if available, third-party evidence (“TPE”) if VSOE is not available, or best estimate of selling price (“BESP”) if neither VSOE or TPE is available. BESP must be determined in a manner that is consistent with that used to determine the price to sell the specific elements on a standalone basis. Our best estimate of selling price is established considering multiple factors including, but not limited to, pricing practices in different geographies and through different sales channels, gross margin objectives, competitor pricing pressures and other factors contemplated in negotiating the arrangement with the customer.
42
Revenue from training, installation and services is recognized upon the performance of services. The Company also provides one year maintenance contracts with certain equipment sales and defers a portion of the revenue from the equipment sale based on the relative fair value as determined above. Upon expiration of the initial maintenance contract, optional renewal maintenance contracts are offered. Deferred maintenance revenue is recognized ratably, on a straight line basis over the contract period, generally one to three years.
In connection with our on-line web-based solutions, we recognize revenue on a monthly basis for use of our subscription based products. We recognize set-up or other up-front fees, if any, ratably over the expected customer relationship period, generally one to three years.
Approximately 32% of 2011 consolidated revenues were made to third-party dealers, independent representatives and system integrators (collectively, dealers). The Company recognizes revenue from sales to dealers when the product is shipped and all other revenue recognition criteria are met.
Allowances for Doubtful Accounts, Inventory and Warranties
We maintain allowances for doubtful accounts for estimated losses resulting from the inability of our customers to make required payments. If the financial condition of our customers were to deteriorate, resulting in an impairment of their ability to make payments, additional allowances and/or the deferral of revenue may be required.
We write-down our inventory for estimated obsolescence or unmarketable inventory equal to the difference between the cost of inventory and the estimated market value based upon assumptions about future demand and market conditions. Technology changes and market conditions may render some of our products obsolete and additional inventory write-downs may be required. If actual, future demand or market conditions are less favorable than those projected by management, additional inventory write-downs may be required.
We provide for the estimated cost of product warranties at the time revenue is recognized. While we engage in extensive product quality programs and processes, including actively monitoring and evaluating the quality of our component suppliers, our warranty obligation is affected by product failure rates, material usage and service delivery costs incurred in correcting a product failure. Should actual product failure rates, material usage or service delivery costs differ from our estimates, revisions to the estimated warranty liability may be required.
Self Insurance
We are self-insured for healthcare costs up to certain stop-loss limits. Such costs are accrued based on known claims and an estimate of incurred, but not reported (“IBNR”) claims. IBNR claims are estimated using historical lag information and other data provided by claims administrators. This estimation process is subjective, and to the extent that future actual results differ from original estimates, adjustments to recorded accruals may be necessary.
43
Income Taxes
We account for income taxes under an asset and liability approach, which recognizes deferred tax assets and liabilities based on the difference between the financial reporting and tax basis of assets and liabilities using enacted tax rates in effect in the years in which the differences are expected to reverse. Valuation allowances are provided, if, based upon the weight of available evidence, it is more likely than not that some or all of the net deferred tax assets will not be realized.
At December 31, 2011, approximately $7.5 million of net operating losses are due to expire in 2012. The remaining amount of net operating losses of $41.7 million are not scheduled to expire until 2018 and beyond. Based on management’s current estimate of book income and the uncertainty of the timing of future taxable income, it was determined that it is more likely than not that we will not be able to realize a portion of our net operating loss carryforwards and therefore, we recorded a charge of $2.7 million in the third quarter of 2011. While we believe that our estimates and assumptions are reasonable, if we do not generate enough taxable income to fully utilize the net operating loss carry forwards, additional valuation allowances or tax provisions may be required.
The Company recognizes tax benefits associated with the exercise of stock options directly to stockholders’ equity only when realized. A tax benefit occurs when the actual tax benefit realized by the Company upon an employee’s disposition of a share-based award exceeds the deferred tax asset, if any, associated with the award that the Company had recorded. When assessing whether a tax benefit relating to share-based compensation has been realized, the Company follows the tax law ordering method, under which current year share-based compensation deductions are assumed to be utilized before net operating loss carryforwards and other tax attributes.
The Company recognizes the financial statement impact of tax provisions, taken or expected to be taken, utilizing a more-likely-than-not recognition threshold. We also recognize any interest and penalties related to tax uncertainties as income tax expense. At December 31, 2011, there are no unrecognized tax benefits, or related accrued interest and penalties, recorded in the financial statements.
Goodwill
We assess the possible impairment of goodwill at least annually, on October 1, at the reporting unit level. We have determined that the reporting unit is the single operating segment disclosed in our current financial statements. Impairment is the condition that exists when the carrying amount of goodwill exceeds its implied fair value. The first step in the impairment process is to determine the fair value of the reporting unit and then compare it to the carrying value, including goodwill. We determined that the market capitalization approach is the most appropriate method of measuring fair value of the reporting unit, assuming a controlling interest.
44
Under this approach, fair value is calculated based on the market price of common stock, multiplied by the number of outstanding shares. A control premium, which is representative of premiums paid in the marketplace to acquire a controlling interest in a company, is then added to the market capitalization to determine the fair value of the reporting unit. If the fair value exceeds the carrying value, no further action is required and no impairment loss is recognized. Additional impairment assessments may be performed on an interim basis if we encounter events or changes in circumstances that would indicate that, more likely than not, the carrying value of goodwill has been impaired. For example, at December 2011 our average value of equity (after addition of an estimated 35% control premium) was approximately 30% greater than our book value. Had our average monthly closing stock price been more than 17% lower than it was in the month, the average premium-control adjusted value of equity would have fallen below the average book value, and we would have performed additional impairment testing to determine whether the carrying value of goodwill was impaired, and if so, by what amount. These percentages will change as the market price for our common stock and our book value change. We monitor changes in our closing market price and its effect on average control-premium adjusted value of equity, and its relationship to average book value, on an interim basis during the year.
Retirement-Related Benefits
Pension expense for the defined benefit pension plan and the determination of future pension obligations are determined based upon a number of actuarial assumptions. The assumptions are based on historical rates of inflation and investment performance, target asset allocations and projected rates of compensation increase. Year-end discount rates were developed from a major bank pension index that match expected benefit payments under the defined benefit pension plan. We determine our expected rate of return on plan assets from the plan assets’ historical long-term investment performance, current asset allocation and estimates of future long-term returns by asset class. These assumptions are reviewed annually by the Company with input from our actuaries and investment advisors. In the event that actual results differ from the actuarial assumptions, or the fair value of the underlying assets change, the funded status of the defined benefit plan may change and any such change could result in a charge or credit to equity and an increase or decrease in future pension expense and cash contributions.
Share-Based Compensation
The Company’s share-based compensation programs consist of grants of share-based awards to employees and non-employee directors, including stock options, restricted stock, restricted stock units and other equity awards. The estimated fair value of these awards, including the effect of forfeitures, is charged to income over the requisite service period, which is generally the vesting period.
45
The fair value of stock options is estimated at the grant date using the Black-Scholes option valuation model which requires us to make assumptions about the expected life of options, stock price volatility, risk-free interest rates and dividend yields. The fair value of restricted stock units is based on the closing market value of the Company’s common stock on the date of grant. Although we believe our judgments, estimates and/or assumptions related to share-based compensation are reasonable, making material changes to such judgments, estimates and/or assumptions could affect our financial results.
Fair Value Measurements
Financial assets and liabilities are classified as Level 1, 2 or 3 within the fair value hierarchy. Fair values determined by Level 1 inputs utilize quoted prices (unadjusted) in active markets for identical assets or liabilities that we have the ability to access. Fair values determined by Level 2 inputs utilize data points that are observable such as quoted prices, interest rates and yield curves. Fair values determined by Level 3 inputs utilize unobservable data points for the asset or liability.
Special Note Regarding Forward-Looking Statements
The SEC encourages companies to disclose forward-looking information so that investors can better understand a company’s future prospects and make informed investment decisions. This Annual Report on Form 10-K contains such “forward-looking statements” within the meaning of the Private Securities Litigation Reform Act of 1995. These statements may be made directly in this Annual Report, and they may also be made a part of this Annual Report by reference to other documents filed with the SEC, which is known as “incorporation by reference.” Such statements in connection with any discussion of future financial performance, liquidity and capital resources, business prospects, technological developments, changes in the industry, new products, research and development activities and similar matters are identified by use of words such as “may,” “anticipate,” “estimate,” “expect,” “project,” “intend,” “plan,” “believe,” and other words and terms of similar meaning. Such statements are based on management’s expectations and are subject to certain factors, risks and uncertainties that may cause actual results, outcome of events, timing and performance to differ materially from those expressed or implied by such forward-looking statements.
These risks include, but are not limited to: current and future economic conditions that may adversely affect our business and customers; our revenues and profitability may fluctuate from period to period and therefore may fail to meet expectations, which could have a material adverse effect on our business, financial condition and results of operations; our ability to maintain adequate levels of working capital; our ability to successfully maintain the level of operating costs; our ability to obtain financing for our future needs should there be a need; our ability to incentivize and retain our current senior management team and continue to attract and retain qualified scientific, technical and business personnel; our ability to expand our Axis online graphics creation solution or to develop other new products and services; our ability to generate sales and profits from our Axis online graphics services, workflow and asset management solutions; rapid technological changes and new technologies that could render certain of our products and services to be obsolete; our ability to develop strategic relationships; competitors
46
with significantly greater financial resources; new product and service introductions by competitors; periods of industry-wide, surface-mount components shortages; dependence on a limited number of suppliers of surface-mount components; dependence on third-party dealers to market and sell our products and services; risks associated with international business operations; new laws or regulations pertaining to the telecommunications and television industries; expansion into new markets; and, other factors discussed under the heading “Risk Factors” contained in Item 1A appearing elsewhere in this Annual Report on Form 10-K for the year ended December 31, 2011.
In light of these assumptions, risks and uncertainties, the results and events discussed in the forward-looking statements contained in this Annual Report or in any document incorporated by reference might not occur. Investors are cautioned not to place undue reliance on the forward-looking statements, which speak only as of the date of this report or the date of the document incorporated by reference in this Annual Report. We are not under any obligation, and we expressly disclaim any obligation, to update or alter any forward-looking statements, whether as a result of new information, future events or otherwise. All subsequent forward-looking statements attributable to us or to any person acting on our behalf are expressly qualified in their entirety by the cautionary statements contained or referred to in this section.
ITEM 7A. QUANTITATIVE AND QUALITATIVE DISCLOSURES ABOUT MARKET RISK
The information called for by this Item is omitted this year in reliance upon Item 305(e) of Regulation S-K.
47
ITEM 8. FINANCIAL STATEMENTS AND SUPPLEMENTARY DATA
Index to Consolidated Financial Statements
|
Financial Statements:
|
Page
|
|
Report of BDO USA, LLP, Independent Registered Public
|
|
|
Accounting Firm
|
49
|
|
Consolidated Balance Sheets at December 31, 2011 and 2010
|
50
|
|
Consolidated Statements of Operations for the Years Ended
|
|
|
December 31, 2011 and 2010
|
51
|
|
Consolidated Statements of Cash Flows for the Years Ended
|
|
|
December 31, 2011 and 2010
|
52
|
|
Consolidated Statements of Shareholders’ Equity and Comprehensive Loss
for the Years Ended December 31, 2011 and 2010
|
53
|
|
Notes to the Consolidated Financial Statements
|
54
|
48
Report of Independent Registered Public Accounting Firm
Board of Directors and Shareholders
Chyron Corporation
Melville, New York
We have audited the accompanying consolidated balance sheets of Chyron Corporation as of December 31, 2011 and 2010 and the related consolidated statements of operations, shareholders’ equity and comprehensive loss and cash flows for the years then ended. These consolidated financial statements are the responsibility of the Company’s management. Our responsibility is to express an opinion on these consolidated financial statements based on our audits.
We conducted our audits in accordance with the standards of the Public Company Accounting Oversight Board (United States). Those standards require that we plan and perform the audit to obtain reasonable assurance about whether the financial statements are free of material misstatement. The Company is not required to have, nor were we engaged to perform, an audit of its internal control over financial reporting. Our audits included consideration of internal control over financial reporting as a basis for designing audit procedures that are appropriate in the circumstances, but not for the purpose of expressing an opinion on the effectiveness of the Company’s internal control over financial reporting. Accordingly, we express no such opinion. An audit also includes examining, on a test basis, evidence supporting the amounts and disclosures in the financial statements, assessing the accounting principles used and significant estimates made by management, as well as evaluating the overall financial statement presentation. We believe that our audits provide a reasonable basis for our opinion.
In our opinion, the consolidated financial statements referred to above present fairly, in all material respects, the financial position of Chyron Corporation at December 31, 2011 and 2010, and the results of its operations and its cash flows for the years then ended, in conformity with accounting principles generally accepted in the United States of America.
/s/ BDO USA, LLP
Melville, New York
March 21, 2012
49
CHYRON CORPORATION
CONSOLIDATED BALANCE SHEETS
(In thousands, except share amounts)
|
December 31,
|
||
|
Assets
|
2011
|
2010
|
|
Current assets:
|
||
|
Cash and cash equivalents
|
$ 4,216
|
$ 5,565
|
|
Accounts receivable, net
|
5,727
|
4,141
|
|
Inventories, net
|
2,132
|
2,218
|
|
Deferred taxes
|
2,508
|
2,869
|
|
Prepaid expenses and other current assets
|
792
|
775
|
|
Total current assets
|
15,375
|
15,568
|
|
Property and equipment, net
|
1,620
|
1,575
|
|
Intangible assets, net
|
658
|
763
|
|
Goodwill
|
2,066
|
2,066
|
|
Deferred taxes
|
15,994
|
17,343
|
|
Other assets
|
93
|
106
|
|
TOTAL ASSETS
|
$35,806
|
$37,421
|
|
Liabilities and Shareholders’ Equity
|
||
|
Current liabilities:
|
||
|
Accounts payable and accrued expenses
|
$ 3,847
|
$ 3,296
|
|
Deferred revenue
|
3,203
|
2,846
|
|
Current portion of pension liability
|
783
|
704
|
|
Current portion of term loan
|
135
|
326
|
|
Capital lease obligations
|
38
|
34
|
|
Total current liabilities
|
8,006
|
7,206
|
|
Pension liability
|
2,664
|
1,519
|
|
Deferred revenue
|
765
|
642
|
|
Term loan
|
-
|
136
|
|
Other liabilities
|
329
|
308
|
|
Total liabilities
|
11,764
|
9,811
|
|
Commitments and contingencies
|
||
|
Shareholders’ equity:
|
||
|
Preferred stock, par value without designation
|
||
|
Authorized - 1,000,000 shares, Issued - none
|
||
|
Common stock, par value $.01
|
||
|
Authorized - 150,000,000 shares
|
||
|
Issued and outstanding – 16,639,704 and 16,053,945
|
||
|
at December 31, 2011 and 2010, respectively
|
166
|
161
|
|
Additional paid-in capital
|
83,407
|
81,793
|
|
Accumulated deficit
|
(58,103)
|
(53,857)
|
|
Accumulated other comprehensive loss
|
(1,428)
|
(487)
|
|
Total shareholders’ equity
|
24,042
|
27,610
|
|
TOTAL LIABILITIES AND SHAREHOLDERS’ EQUITY
|
$35,806
|
$37,421
|
See Notes to Consolidated Financial Statements
50
CHYRON CORPORATION
CONSOLIDATED STATEMENTS OF OPERATIONS
(In thousands, except per share amounts)
|
Year Ended December 31,
|
||
|
2011
|
2010
|
|
|
Product revenues
|
$23,877
|
$21,452
|
|
Service revenues
|
7,710
|
6,275
|
|
Total revenues
|
31,587
|
27,727
|
|
Cost of sales
|
9,473
|
8,507
|
|
Gross profit
|
22,114
|
19,220
|
|
Operating expenses:
|
||
|
Selling, general and administrative
|
17,287
|
15,008
|
|
Research and development
|
6,775
|
6,648
|
|
Total operating expenses
|
24,062
|
21,656
|
|
Operating loss
|
(1,948)
|
(2,436)
|
|
Interest expense
|
(37)
|
(59)
|
|
Other income (loss), net
|
16
|
(39)
|
|
Loss before income taxes
|
(1,969)
|
(2,534)
|
|
Income tax (expense) benefit, net
|
(2,277)
|
138
|
|
Net loss
|
$(4,246)
|
$(2,396)
|
|
Net loss per share:
|
||
|
Basic
|
$ (0.26)
|
$ (0.15)
|
|
Diluted
|
$ (0.26)
|
$ (0.15)
|
|
Weighted average shares used in computing net loss
|
||
|
per share:
|
||
|
Basic
|
16,458
|
15,969
|
|
Diluted
|
16,458
|
15,969
|
See Notes to Consolidated Financial Statements
51
CHYRON CORPORATION
CONSOLIDATED STATEMENTS OF CASH FLOWS
(In thousands)
|
Year Ended December 31,
|
||
|
2011
|
2010
|
|
|
CASH FLOWS FROM OPERATING ACTIVITIES:
|
||
|
Net loss
|
$(4,246)
|
$(2,396)
|
|
Adjustments to reconcile net loss to net cash (used in)
|
||
|
provided by operating activities:
|
||
|
Depreciation and amortization
|
975
|
1,043
|
|
Deferred tax asset allowance
|
2,724
|
136
|
|
Deferred income tax benefit
|
(495)
|
(278)
|
|
Share-based compensation expense
|
1,005
|
1,770
|
|
Shares issued for 401(k) match
|
265
|
217
|
|
Inventory provisions
|
109
|
255
|
|
Other
|
(16)
|
49
|
|
Changes in operating assets and liabilities:
|
||
|
Accounts receivable
|
(1,586)
|
(664)
|
|
Inventories
|
(79)
|
42
|
|
Prepaid expenses and other assets
|
(12)
|
200
|
|
Accounts payable and accrued expenses
|
865
|
(42)
|
|
Deferred revenue
|
480
|
412
|
|
Other liabilities
|
(177)
|
327
|
|
Net cash (used in) provided by operating activities
|
(188)
|
1,071
|
|
CASH FLOWS FROM INVESTING ACTIVITIES:
|
||
|
Acquisition of property and equipment
|
(915)
|
(387)
|
|
Net cash used in investing activities
|
(915)
|
(387)
|
|
CASH FLOWS FROM FINANCING ACTIVITIES:
|
||
|
Proceeds from exercise of stock options
|
112
|
1
|
|
Payments on term loan
|
(325)
|
(325)
|
|
Payments on capital lease obligations
|
(33)
|
(33)
|
|
Net cash used in financing activities
|
(246)
|
(357)
|
|
Change in cash and cash equivalents
|
(1,349)
|
327
|
|
Cash and cash equivalents at beginning of year
|
5,565
|
5,238
|
|
Cash and cash equivalents at end of year
|
$4,216
|
$5,565
|
|
SUPPLEMENTAL CASH FLOW INFORMATION:
|
||
|
Interest paid
|
$ 36
|
$ 59
|
|
Taxes paid (refunded)
|
50
|
(24)
|
|
Assets acquired under capital lease
|
-
|
54
|
|
Deferred pension loss (gain), net of tax
|
940
|
(226)
|
See Notes to Consolidated Financial Statements
52
CHYRON CORPORATION
CONSOLIDATED STATEMENTS OF SHAREHOLDERS’ EQUITY
AND COMPREHENSIVE LOSS
(In thousands)
|
Accumulated
|
||||||
|
Additional
|
Other
|
|||||
|
Common Stock
|
Paid-In
|
Accumulated
|
Comprehensive
|
|||
|
Shares
|
Amount
|
Capital
|
(Deficit)
|
Income (loss)
|
Total
|
|
|
Balance at January 1, 2010
|
15,864
|
$ 159
|
$80,087
|
$(51,461)
|
$ (701)
|
$28,084
|
|
Net loss
|
(2,396)
|
(2,396)
|
||||
|
Deferred pension gain, net of tax
|
226
|
226
|
||||
|
Cumulative translation adjustment
|
(12)
|
(12)
|
||||
|
Total comprehensive loss
|
(2,182)
|
|||||
|
Share-based compensation
|
1,491
|
1,491
|
||||
|
Shares issued upon exercise of stock
|
||||||
|
options
|
1
|
-
|
||||
|
Shares issued for vesting of restricted
|
75
|
1
|
(1)
|
-
|
||
|
stock units
|
||||||
|
Shares issued for 401(k) match
|
114
|
1
|
216
|
|
|
217
|
|
Balance at December 31, 2010
|
16,054
|
161
|
81,793
|
(53,857)
|
(487)
|
27,610
|
|
Net loss
|
(4,246)
|
(4,246)
|
||||
|
Deferred pension loss, net of tax
|
(940)
|
(940)
|
||||
|
Cumulative translation adjustment
|
(1)
|
(1)
|
||||
|
Total comprehensive loss
|
(5,187)
|
|||||
|
Share-based compensation
|
1,005
|
1,005
|
||||
|
Shares issued upon exercise of stock
|
||||||
|
options
|
105
|
1
|
90
|
91
|
||
|
Shares issued for vesting of restricted
|
||||||
|
stock units and restricted stock
|
350
|
3
|
255
|
258
|
||
|
Shares issued for 401(k) match
|
130
|
1
|
264
|
|
|
265
|
|
Balance at December 31, 2011
|
16,639
|
$ 166
|
$83,407
|
$(58,103)
|
$ (1,428)
|
$24,042
|
See Notes to Consolidated Financial Statements
53
CHYRON CORPORATION
NOTES TO CONSOLIDATED FINANCIAL STATEMENTS
1. SUMMARY OF SIGNIFICANT ACCOUNTING POLICIES
Nature of Business
Chyron provides sophisticated graphics offerings that include Chyron’s Axis World Graphics online content creation software, HD/SD switchable on-air graphics systems, clip servers, channel branding and telestration systems, and graphic asset management solutions. As a pioneer of Graphics as a Service for digital video media, Chyron addresses the world of digital and broadcast graphics with web, mobile, HD, 3D and newsroom integration solutions.
Basis of Presentation
The consolidated financial statements include the accounts of the Company and its wholly-owned subsidiaries. All significant intercompany amounts have been eliminated.
The preparation of financial statements in conformity with generally accepted accounting principles requires management to make estimates and assumptions that affect the reported amounts of assets and liabilities and disclosure of contingent assets and liabilities at the date of the financial statements and the reported amounts of revenues, costs and expenses during the periods presented. Estimates made by management include inventory valuations, stock compensation, allowances for doubtful accounts, income taxes, pension assumptions and reserves for warranty and incurred but not reported health insurance claims. Actual results could differ from those estimates. The Company has not segregated its cost of sales between costs of products and costs of services as it is not practicable to segregate such costs.
Cash and Cash Equivalents
Cash includes cash on deposit, overnight repurchase agreements, and amounts invested in highly liquid money market funds. Cash equivalents consist of short term investments with original maturities of three months or less. Cash and cash equivalents include $3.7 million and $4.5 million of investments in overnight repurchase agreements at December 31, 2011 and 2010, respectively. Repurchase agreements are collateralized by U.S. Treasury and federal agency securities with a fair value of 102% of the securities sold. This credit risk is divided among five financial institutions that management believes to be of high quality. The carrying amount of cash and cash equivalents approximates their fair value.
Accounts Receivable
Accounts receivable are recorded at the invoiced amount and do not bear interest. Accounts receivable are stated net of an allowance for doubtful accounts. Our allowance for doubtful accounts considers historical experience, the age of amounts due, current economic conditions and other factors that may affect our customers’ ability to pay.
54
Inventories
Inventories are stated at the lower of cost or market, cost being determined primarily on the basis of FIFO and average cost. The need for inventory obsolescence provisions is evaluated by us and, when appropriate, reserves for technological obsolescence, non-profitability of product lines and excess quantities are established.
Property, Equipment and Depreciation
Property and equipment are stated at cost less accumulated depreciation and amortization. Depreciation and amortization are provided on the straight line method over the following estimated useful lives:
|
Machinery and equipment
|
3-10 years
|
|
Furniture and fixtures
|
5-10 years
|
|
Leasehold improvements
|
Shorter of the life of improvement or
remaining life of the lease
|
When assets are retired or disposed of, the assets and related accumulated depreciation are removed from the accounts and the resulting gain or loss is reflected in operations.
Capitalized Software Costs
For development costs related to our on line web-based solutions, the Company capitalizes costs incurred during the application development stage. Costs related to preliminary project activities and post implementation activities were expensed as incurred. The Company has not capitalized any software development costs for the years ended December 31, 2011 and 2010.
Self Insurance
The Company is self-insured for healthcare costs up to certain stop-loss limits. Such costs are accrued based on known claims and an estimate of incurred, but not reported (“IBNR”) claims. IBNR claims are estimated using historical lag information and other data provided by claims administrators. This estimation process is subjective, and to the extent that future actual results differ from original estimates, adjustments to recorded accruals may be necessary.
Research, Development and Engineering
Technological feasibility for our products is reached shortly before the products are released to manufacturing. Consequently, costs incurred after technological feasibility is established have not been material, and accordingly, we expense all research and development costs when incurred. We re-evaluate the materiality of these costs on an on-going basis. Research and development costs include wages and other personnel costs, material costs and an allocation of certain indirect costs related to facilities.
55
Long-Lived Assets and Intangible Assets
Long-lived assets and certain identifiable intangible assets to be held and used are reviewed for impairment when events or changes in circumstances indicate that the carrying amount of such assets may not be recoverable. Determination of recoverability is based on an estimate of undiscounted future cash flows resulting from the use of the asset and its eventual disposition. In the event that such cash flows are not expected to be sufficient to recover the carrying amount of the assets, the assets are written down to their estimated fair values.
Goodwill
Goodwill is not amortized, but is tested at least annually, on October 1, for impairment at the reporting unit level. The reporting unit is the single operating segment presented in these financial statements. Impairment is the condition that exists when the carrying amount of goodwill exceeds its implied fair value. The first step in the impairment process is to determine the fair value of the reporting unit and then compare it to the carrying value, including goodwill. If the fair value exceeds the carrying value, no further action is required and no impairment loss is recognized. Additional impairment assessments may be performed on an interim basis if the Company encounters events or changes in circumstances that would indicate that, more likely than not, the carrying value of goodwill has been impaired. There was no impairment of goodwill in 2011.
Revenue Recognition
The Company recognizes revenue when persuasive evidence of an arrangement exists, title has transferred, product payment is not contingent upon installation or other service obligations, the price is fixed or determinable, and collectability is reasonably assured. This condition is normally met when the product has been delivered or upon performance of services. In instances where final acceptance of the product or service is specified by the customer, revenue is deferred until all acceptance criteria have been met.
The Company also enters into arrangements that contain multiple elements such as equipment, installation and service. For multiple-element arrangements, revenue is recognized based on an allocation of the total amount of the arrangement to each deliverable based on the fair value based on vendor-specific objective evidence (“VSOE”) if available, third-party evidence (“TPE”) if VSOE is not available, or best estimate of selling price (“BESP”) if neither VSOE or TPE is available. BESP must be determined in a manner that is consistent with that used to determine the price to sell the specific elements on a standalone basis. Our best estimate of selling price is established considering multiple factors including, but not limited to, pricing practices in different geographies and through different sales channels, gross margin objectives, competitor pricing pressures and other factors contemplated in negotiating the arrangement with the customer.
56
Revenue from training, installation and services is recognized upon the performance of services. The Company also provides one year maintenance contracts with certain equipment sales and defers a portion of the revenue from the equipment sale based on the relative fair value as determined above. Upon expiration of the initial maintenance contract, optional renewal maintenance contracts are offered. Deferred maintenance revenue is recognized ratably, on a straight line basis over the contract period, generally one to three years.
In connection with our on-line web-based solutions, we recognize revenue on a monthly basis for use of our subscription based products. We recognize set-up or other up-front fees, if any, ratably over the expected customer relationship period, generally one to three years. Revenues from these web-based solutions are included in service revenues in our statements of operations.
Approximately 32% and 26% of 2011 and 2010 consolidated revenues, respectively, were made through third-party dealers and system integrators (collectively, dealers). The Company recognizes revenue from sales to dealers when the product is shipped and all other revenue recognition criteria are met.
Shipping and Handling Fees and Costs
All amounts billed to a customer in a sales transaction related to shipping and handling represent revenues earned and are reported as revenue, and the costs incurred by the Company for shipping and handling are reported as a component of cost of sales.
Advertising Costs
Advertising costs are expensed as incurred. Advertising expense was $96 thousand in 2011 and $17 thousand in 2010.
Income Taxes
We account for income taxes under an asset and liability approach, which recognizes deferred tax assets and liabilities based on the difference between the financial reporting and tax basis of assets and liabilities using enacted tax rates in effect in the years in which the differences are expected to reverse. Valuation allowances are provided if, based upon the weight of available evidence, it is more likely than not that some or all of the net deferred tax assets will not be realized.
The Company recognizes tax benefits associated with the exercise of stock options directly to stockholders’ equity only when realized. A tax benefit occurs when the actual tax benefit realized by the Company upon an employee’s disposition of a share-based award exceeds the deferred tax asset, if any, associated with the award that the Company had recorded. When assessing whether a tax benefit relating to share-based compensation has been realized, the Company follows the tax law ordering method, under which current year share-based compensation deductions are assumed to be utilized before net operating loss carryforwards and other tax attributes.
57
The Company recognizes the financial statement impact of tax positions, taken or expected to be taken, utilizing a more-likely-than not recognition threshold. We also recognize any interest and penalties related to tax uncertainties as income tax expense. At December 31, 2011 there are no unrecognized tax benefits, or related accrued interest and penalties, recorded in the financial statements.
Sales Taxes
We account for sales taxes imposed on our goods and services on a net basis in our Consolidated Statements of Operations. Since we primarily act as an agent for the governmental authorities, the amount charged to the customer is collected and remitted directly to the appropriate jurisdictional entity.
Foreign Currencies
Assets and liabilities of our foreign subsidiaries, which are of immaterial amounts, are translated into U.S. dollars at the period end rate of exchange, while revenues and expenses are translated at the average exchange rate during the period. Adjustments from translating foreign subsidiaries’ financial statements are reported as a component of other comprehensive income or loss. Transaction gains or losses are included in other income and expense, net. The net impact of foreign exchange transactions for the years ended December 31, 2011 and 2010 were a gain of $16 thousand and a loss of $2 thousand, respectively.
Earnings (Loss) Per Share
Basic earnings (loss) per share is computed based on the weighted average number of common shares outstanding. Diluted earnings per share is based on the sum of the weighted average number of common shares outstanding and common stock equivalents. Potentially dilutive shares are excluded from the computation of diluted earnings per share when their effect is anti-dilutive. Shares used to calculate earnings (loss) per share are as follows (in thousands):
|
Year Ended December 31,
|
||
|
2011
|
2010
|
|
|
Basic weighted average shares outstanding
|
16,458
|
15,969
|
|
Effect of dilutive stock options
|
-
|
-
|
|
Diluted weighted average shares outstanding
|
16,458
|
15,969
|
|
Weighted average shares which are not included
|
||
|
in the calculation of diluted earnings per share
|
||
|
because their impact is antidilutive
|
||
|
Stock options
|
1,361
|
3,336
|
|
Restricted stock units
|
510
|
1,194
|
|
1,871
|
4,530
|
|
58
Share-Based Compensation
The Company’s share-based compensation programs consist of grants of share-based awards to employees and non-employee directors, including stock options, restricted stock, restricted stock units and other equity awards. The estimated fair value of these awards, including the effect of forfeitures, is charged to income over the requisite service period, which is generally the vesting period.
The fair value of stock options is estimated at the grant date using the Black-Scholes option valuation model. The fair value of restricted stock units is based on the market value of the Company’s common stock on the date of grant.
Fair Value Measurements
Financial assets and liabilities are classified as Level 1, 2 or 3 within the fair value hierarchy. Fair values determined by Level 1 inputs utilize quoted prices (unadjusted) in active markets for identical assets or liabilities that we have the ability to access. Fair values determined by Level 2 inputs utilize data points that are observable such as quoted prices, interest rates and yield curves. Fair values determined by Level 3 inputs utilize unobservable data points for the asset or liability.
Retirement-Related Benefits
The Company recognizes in its balance sheet as an asset or liability the overfunded or underfunded status of its defined benefit plan. This asset or liability is measured as the difference between the fair value of plan assets and the benefit obligation of the plan. For the pension plan, the benefit obligation is the projected benefit obligation, which is calculated based on actuarial computations of current and future benefits for employees. Actuarial gains or losses and prior service costs or credits that arise during the period, but are not included as components of net periodic benefit (expense), are recognized as a component of Accumulated Other Comprehensive Income (Loss). Pension expense is charged to operating expenses.
Recent Accounting Pronouncements
In May 2011, the FASB issued amended guidance on fair value measurement and related disclosures. The new guidance clarified the concepts applicable for fair value measurement of non-financial assets and requires the disclosure of quantitative information about the unobservable inputs used in a fair value measurement. This guidance is effective for reporting periods beginning after December 15, 2011, and will be applied prospectively. We do not anticipate that the adoption of this amended guidance will have a material impact on our consolidated financial statements.
59
In June 2011, the FASB issued amended guidance on the presentation of comprehensive income. The amended guidance eliminates one of the presentation options provided by current U.S. GAAP, that is to present the components of other comprehensive income as part of the statement of changes in stockholders’ equity. In addition, it gives an entity the option to present the total of comprehensive income, the components of net income, and the components of other comprehensive income either in a single continuous statement of comprehensive income or in two separate but consecutive statements. This guidance is effective for reporting periods beginning after December 15, 2011 and will be applied retrospectively. The adoption of this guidance will not have a material impact on our consolidated financial statements.
In September 2011, the FASB issued an accounting standard update that amends the accounting guidance on goodwill impairment testing. The amendments are intended to reduce complexity and costs by allowing an entity the option to make a qualitative evaluation about the likelihood of goodwill impairment to determine whether it should calculate the fair value of a reporting unit. The amendments also improve previous guidance by expanding upon the examples of events and circumstances that an entity should consider between annual impairment tests in determining whether it is more likely than not that the fair value of a reporting unit is less than its carrying amount. The amendments in this accounting standard update are effective for interim and annual goodwill impairment tests performed for fiscal years beginning after December 15, 2011. We do not anticipate that the adoption of this accounting standard update will have a material impact on our consolidated financial statements.
2. ACCOUNTS RECEIVABLE
Accounts receivable are stated net of an allowance for doubtful accounts of $0.40 million and $0.42 million at December 31, 2011 and 2010, respectively. Accounts receivable are principally due from customers in, and dealers serving, the broadcast video industry. At December 31, 2011 and 2010, receivables included approximately $1.4 million and $1.0 million, respectively, due from foreign customers.
Bad debt expense amounted to zero in 2011 and 2010. We record an allowance for doubtful accounts based on specifically identified amounts that management believes to be uncollectible and an additional allowance based on historical experience and management’s assessment of the general financial conditions affecting our customer base. We also evaluate the credit worthiness of our customers and determine whether collateral (in the form of letters of credit or credit insurance) should be taken or whether reduced credit limits are necessary. Credit losses have consistently been within management’s expectations. The carrying amounts of accounts receivable approximate their fair values.
60
3. INVENTORIES
Inventory is comprised of the following (in thousands):
|
December 31,
|
||
|
2011
|
2010
|
|
|
Finished goods
|
$ 653
|
$ 312
|
|
Work-in-progress
|
170
|
259
|
|
Raw material
|
1,309
|
1,647
|
|
$2,132
|
$2,218
|
|
Inventories are stated net of reserves of approximately $5.0 million at December 31, 2011 and 2010.
4. GOODWILL AND INTANGIBLE ASSETS
The carrying amount of goodwill is not amortized but subject to annual impairment testing at the reporting unit level. We evaluate goodwill for impairment on October 1, or more frequently if impairment indicators are present. Impairment is the condition that exists when the carrying amount of goodwill exceed its implied fair value. The first step in the impairment process is to determine the fair value of the reporting unit and then compare it to the carrying value, including goodwill. We determined that the market capitalization approach is the most appropriate method of measuring fair value of the reporting unit, assuming a controlling interest. Under this approach, fair value is calculated based on the market price of common stock, multiplied by the number of outstanding shares. A control premium, which is representative of premiums paid in the marketplace to acquire a controlling interest in a company, is then added to the market capitalization to determine the fair value of the reporting unit. If the fair value exceeds the carrying value, no further action is required and no impairment loss is recognized. We monitor changes in our closing market price and its effect on fair value and the relationship to the carrying value. Additional impairment assessments may be performed on an interim basis if we encounter events or changes in circumstances that would indicate that, more likely than not, the carrying value of goodwill has been impaired. At December 31, 2011, the Company did not identify any potential impairment related to its goodwill.
The components and estimated useful lives of intangible assets as of December 31, 2011 and 2010 are stated below. Amortization is provided on a straight line method, or in the case of customer relationships, on an accelerated method, over the following estimated useful lives (in thousands):
61
|
2011
|
||||
|
Gross
|
Accumulated
|
Net
|
Estimated
|
|
|
Amount
|
Amortization
|
Amount
|
Useful Life
|
|
|
Tradenames
|
$ 304
|
$ 81
|
$ 223
|
15 years
|
|
Proprietary technology
|
620
|
248
|
372
|
10 years
|
|
Non-compete agreement
|
25
|
25
|
-
|
3 years
|
|
Customer relationships
|
170
|
123
|
47
|
10 years
|
|
Domain name and related website
|
23
|
7
|
16
|
15 years
|
|
$1,142
|
$ 484
|
$ 658
|
||
|
2010
|
|||||
|
Gross
|
Accumulated
|
Net
|
Estimated
|
||
|
Amount
|
Amortization
|
Amount
|
Useful Life
|
||
|
Tradenames
|
$ 304
|
$ 60
|
$ 244
|
15 years
|
|
|
Proprietary technology
|
620
|
186
|
434
|
10 years
|
|
|
Non-compete agreement
|
25
|
25
|
-
|
3 years
|
|
|
Customer relationships
|
170
|
101
|
69
|
10 years
|
|
|
Domain name and related website
|
23
|
7
|
16
|
15 years
|
|
|
$1,142
|
$ 379
|
$ 763
|
|||
Amortization expense related to intangible assets for the years ended December 31, 2011 and 2010 was $105 thousand and $122 thousand, respectively. Annual amortization expense, in thousands, for intangible assets over the next five years ending December 31 is summarized as follows:
|
2012
|
$ 99
|
|
2013
|
95
|
|
2014
|
92
|
|
2015
|
89
|
|
2016
|
88
|
|
Thereafter
|
195
|
5. PROPERTY AND EQUIPMENT
Property and equipment consist of the following (in thousands):
|
December 31,
|
||
|
2011
|
2010
|
|
|
Machinery and equipment
|
$4,755
|
$4,322
|
|
Furniture and fixtures
|
1,047
|
694
|
|
Leasehold improvements
|
162
|
162
|
|
5,964
|
5,178
|
|
|
Less: Accumulated depreciation
|
||
|
and amortization
|
4,344
|
3,603
|
|
$1,620
|
$1,575
|
|
62
Depreciation expense, which includes amortization of assets under capital lease, was $0.9 million in 2011 and 2010.
The value of equipment recorded under capital leases was approximately $0.15 million at December 31, 2011 and 2010.
6. ACCOUNTS PAYABLE AND ACCRUED EXPENSES
Accounts payable and accrued expenses consist of the following (in thousands):
|
December 31,
|
||
|
2011
|
2010
|
|
|
Accounts payable
|
$2,266
|
$1,401
|
|
Accrued salaries, and other employee benefits
|
1,013
|
1,304
|
|
Accrued warranty (Note 13)
|
50
|
50
|
|
Accrued medical costs
|
257
|
256
|
|
Other
|
261
|
285
|
|
$3,847
|
$3,296
|
|
7. CREDIT FACILITY
The Company has a credit facility with a U.S. bank which expires on December 29, 2012. The credit facility provides for a $1.5 million revolving line of credit (“revolver”) with an advance rate of up to 80% of eligible accounts receivable. At December 31, 2011 available borrowings were approximately $1.5 million based on this formula. The revolver under the credit facility bears interest at Prime +1.75%.
The credit facility is collateralized by the Company’s assets, except for (i) its intellectual property rights which are subject to a negative pledge arrangement with the bank, and (ii) any equipment whose purchase is financed by any other lender or lessor, solely to the extent the security agreement with such lender or lessor prohibits junior liens on such equipment, and only until the lien held by such lender or lessor is terminated or released with respect to such equipment. The Company is required to maintain financial covenants based on an adjusted quick ratio of at least 1.2 to 1.0, measured at each month end, and minimum tangible net worth of $18.5 million, increased by 60% of the sum of the gross proceeds received by the Company from any sale of its equity or incurrence of subordinated debt and any positive quarterly net income earned, measured at quarter end (both as defined as per the credit facility). As is usual and customary in such lending agreements, the agreements also contain certain nonfinancial requirements, such as required periodic reporting to the bank and various representations and warranties. The lending agreement also restricts our ability to pay dividends without the bank’s consent. The Company has been in compliance with all debt covenants since inception of the credit facility.
In 2009, the Company borrowed to finance capital equipment under the then existing credit facility which resulted in a term loan of $977 thousand payable over 36 months in equal monthly installments of principal plus accrued interest. Interest expense related to the term loan
63
was $17 thousand and $38 thousand for the years ended December 31, 2011 and 2010, respectively. The term loan is scheduled to be paid in full in May 2012.
8. LONG-TERM INCENTIVE PLAN
Pursuant to the 2008 Long-term Incentive Plan (the “Plan”), we may grant stock options (non-qualified or incentive), stock appreciation rights, restricted stock and other share-based awards to employees, directors and other persons who serve the Company. The Plan is overseen by the Compensation Committee of the Board of Directors, which approves the timing and circumstances under which share-based awards may be granted. At December 31, 2011 there were 2.3 million shares available to be granted under the Plan. We issue new shares to satisfy the exercise or release of share-based awards. Under the provisions of Accounting Standards Codification Topic for Stock Compensation all share-based payments are required to be recognized in the statement of operations based on their fair values at the date of grant.
The fair value of each option award is estimated using a Black-Scholes option valuation model. Expected volatility is based on the historical volatility of the price of the Company’s stock. The risk-free interest rate is based on U.S. Treasury issues with a term equal to the expected life of the option. The Company uses historical data to estimate expected dividend yield, expected life and forfeiture rates. Options generally have a life of 10 years and vest over a period of 3 years. The fair values of the options granted during the years ended December 31, 2011 and 2010, were estimated based on the following weighted average assumptions:
|
2011
|
2010
|
|
|
Expected volatility
|
70.26%
|
73.82%
|
|
Risk-free interest rate
|
1.36%
|
1.70%
|
|
Expected dividend yield
|
0.00%
|
0.00%
|
|
Expected life (in years)
|
6.00
|
5.81
|
|
Estimated fair value per option granted
|
$1.04
|
$1.18
|
The following table presents a summary of the Company’s stock options for the year ended December 31, 2011:
|
Weighted
|
||||
|
Weighted
|
average
|
|||
|
Number
|
average
|
remaining
|
Aggregate
|
|
|
of
|
exercise
|
contractual
|
intrinsic
|
|
|
options
|
price
|
life (years)
|
value
|
|
|
Outstanding at January 1, 2011
|
3,411,573
|
$2.39
|
||
|
Granted
|
279,085
|
1.66
|
||
|
Exercised
|
(159,755)
|
1.39
|
||
|
Forfeited and cancelled
|
(306,024)
|
2.79
|
||
|
Outstanding at December 31, 2011
|
3,224,879
|
2.34
|
5.86
|
$191,444
|
|
Exercisable at December 31, 2011
|
2,458,999
|
2.59
|
5.06
|
$163,138
|
64
The aggregate intrinsic value of options exercised during the year ended December 31, 2011 and 2010 was approximately $144,000 and $1,000, respectively. The actual tax benefit realized for the tax deductions from the options exercised totaled $22,000.
The Company also grants restricted stock units, or RSUs, which have either time or performance-based vesting features. RSUs are equity awards that are granted to individuals entitling the holder to a share of Company common stock. The fair value of an RSU is equal to the market value of a share of common stock on the date of grant. Time-based RSUs vest over a one to three year period, while performance-based RSUs vest based upon the achievement of specific performance targets. Unless forfeited, all RSUs are required to be settled in shares. In 2011 and 2010, we recorded an expense of $534 thousand and $436 thousand, respectively, relating to outstanding RSUs.
The following table presents a summary of the Company’s RSUs for the year ended December 31, 2011:
|
Weighted average
|
|||
|
grant date
|
|||
|
Shares
|
fair value
|
||
|
Nonvested at January 1, 2011
|
1,869,991
|
$1.90
|
|
|
Granted
|
847,262
|
2.04
|
|
|
Vested
|
(238,167)
|
1.94
|
|
|
Forfeited and cancelled
|
(1,950,643)
|
1.93
|
|
|
Nonvested at December 31, 2011
|
528,443
|
2.00
|
In addition, the Company also has a Management Incentive Compensation Plan that entitles recipients to a combination of cash and equity awards based on achievement of certain performance and service conditions. During 2010, we recorded approximately $279 thousand associated with the equity portion of these awards. During 2011, there was no expense recognized because no amounts were earned.
The impact on our results of operations of recording share-based compensation expense for the years ended December 31, 2011 and 2010 is as follows:
|
2011
|
2010
|
|
|
Cost of sales
|
$ 101,387
|
$ 166,480
|
|
Research and development
|
359,528
|
565,629
|
|
Selling, general and administrative
|
543,913
|
1,037,584
|
|
$1,004,828
|
$1,769,693
|
As of December 31, 2011, there was approximately $1.2 million of total unrecognized share-based compensation cost related to stock options or RSUs granted under our plans to employees or for services performed by non-employees that will be recognized over the next three years.
65
9. OTHER COMPREHENSIVE INCOME
Components and activity related to accumulated other comprehensive income (loss) is as follows (in thousands):
|
Foreign
|
Pension
|
Accumulated
|
|||
|
Currency
|
Benefit
|
Other
|
|||
|
Translation
|
Costs,
|
Comprehensive
|
|||
|
Adjustments
|
Net of Tax
|
Income (Loss)
|
|||
|
January 1, 2010
|
$ (13)
|
$ (688)
|
$ (701)
|
||
|
Change for period
|
(12)
|
226
|
214
|
||
|
December 31, 2010
|
(25)
|
(462)
|
(487)
|
||
|
Change for period
|
(1)
|
(940)
|
(941)
|
||
|
December 31, 2011
|
$ (26)
|
$(1,402)
|
$(1,428)
|
10. INCOME TAXES
The components of deferred income taxes are as follows (in thousands):
|
December 31,
|
||
|
2011
|
2010
|
|
|
Deferred tax assets:
|
||
|
Net operating loss carryforwards
|
$16,728
|
$17,027
|
|
Inventory
|
1,736
|
2,181
|
|
Other liabilities
|
2,229
|
1,539
|
|
Fixed assets
|
452
|
255
|
|
Other temporary differences
|
625
|
99
|
|
21,770
|
21,101
|
|
|
Deferred tax valuation allowance
|
3,268
|
889
|
|
$18,502
|
$20,212
|
|
In accordance with accounting standards, the Company has not recorded a deferred tax asset related to the net operating losses resulting from the exercise of disqualifying stock options in the accompanying financial statements. The cumulative amount of unrecognized tax benefits at December 31, 2011 was approximately $0.9 million, and if the Company is able to utilize this benefit in the future it would result in a credit to additional paid in capital.
Our income tax benefit (provision) for the years ended December 31, 2011 and 2010, consisted of the following (in thousands):
66
|
2011
|
2010
|
|
|
Current:
|
||
|
State and foreign
|
$ (48)
|
$ (28)
|
|
Federal
|
-
|
22
|
|
(48)
|
(6)
|
|
|
Deferred:
|
||
|
State
|
22
|
14
|
|
Federal
|
473
|
266
|
|
495
|
280
|
|
|
Valuation allowance
|
(2,724)
|
(136)
|
|
Income tax (expense) benefit, net
|
$(2,277)
|
$ 138
|
The effective income tax rate differed from the Federal statutory rate as follows (in thousands):
|
2011
|
2010
|
||||
|
Amount
|
%
|
Amount
|
%
|
||
|
Federal income tax at statutory rate
|
$ 669
|
34.0
|
$ 862
|
34.0
|
|
|
Permanent differences
|
(197)
|
(10.0)
|
(605)
|
(23.9)
|
|
|
International taxes and rate differentials
|
|||||
|
and other
|
(25)
|
(1.2)
|
17
|
0.7
|
|
|
Effect of increase in valuation allowance
|
|||||
|
for deferred tax assets
|
(2,724)
|
(138.4)
|
(136)
|
(5.4)
|
|
|
$(2,277)
|
(115.6)
|
$ 138
|
5.4
|
||
At December 31, 2011, we had U.S. Federal net operating loss carryforwards (“NOLs”) of approximately $49 million expiring between the years 2012 through 2030. Approximately $7.5 million of the NOLs are set to expire in 2012 if not utilized. The remaining amount of NOLs of $41.7 million are not scheduled to expire until 2018 and beyond. Based on management’s current estimate of book income and the uncertainty of the timing of future taxable income, it was determined that it is more likely than not that the Company will not be able to generate enough taxable income in the respective carry forward periods to realize all of its NOLs. Consequently, in the third quarter of 2011, we recorded a $2.7 million valuation allowance related to the portion of the NOLs that may not be realized. While we believe our estimates and assumptions are reasonable, if we do not generate enough taxable income to fully realize the balance of net operating loss carryforwards, additional valuation allowances or tax provisions may be required.
We file U.S. federal income tax returns as well as income tax returns in various states and one foreign jurisdiction. We may be subject to examination by the Internal Revenue Service (“IRS”) for calendar years 2008 through 2011 under the normal statute of limitations. Additionally, any net operating losses that were generated in prior years and utilized in these years may also be subject to examination by the IRS. Generally, for state tax purposes, the Company’s 2007 through 2011 tax years remain open for examination by the tax authorities under a four year statute of limitations, however, certain states may keep their statute open for six to ten years.
67
11. FAIR VALUE MEASUREMENTS
Financial assets and liabilities at fair value at December 31, 2011 and 2010 are classified in one of the three categories, which are described below.
|
·
|
Level 1: Quoted prices (unadjusted) in active markets that are accessible at the measurement date for assets or liabilities. The fair value hierarchy gives the highest priority to Level 1 inputs.
|
|
·
|
Level 2: Observable prices that are based on inputs not quoted on active markets, but corroborated by market data.
|
|
·
|
Level 3: Unobservable inputs are used when little or no market data is available. The fair value hierarchy gives the lowest priority to Level 3 inputs.
|
In determining fair value, the Company utilizes valuation techniques that maximize the use of observable inputs and minimize the use of unobservable inputs to the extent possible as well as considers a counterparty credit risk in its assessment of fair value.
The carrying amount of cash, accounts receivables and accounts payables and other short-term financial instruments approximate their fair value due to their short-term nature. The Company believes that borrowings outstanding under its term loan approximate fair value because such borrowings bear interest at current variable market rates.
Additionally, on a nonrecurring basis, the Company uses fair value measures when analyzing asset impairment. Long-lived assets and certain identifiable intangible assets are reviewed for impairment whenever events or changes in circumstances indicate that the carrying amount of an asset may not be recoverable. If it is determined such indicators are present and the review indicates that the assets will not be fully recoverable, based on undiscounted estimated cash flows over the remaining amortization periods, their carrying values are reduced to estimated fair value. Measurements based on undiscounted cash flows are considered to be level 3 inputs. During the fourth quarter of each year, the Company evaluates goodwill and indefinite-lived intangibles for impairment at the reporting unit level using the market capitalization approach. Thus, the fair value of the reporting unit is represented by the fair value of the Company, assuming a controlling interest. As such, a premium for control is added to the non-controlling equity value, as calculated by the market price of the Company common stock which is publicly traded. This measurement would be classified based on level 2 input.
12. BENEFIT PLANS
Chyron has a domestic defined benefit pension plan (the “U.S. Pension Plan”) covering substantially all U.S. employees meeting minimum eligibility requirements. Benefits paid to retirees are based upon age at retirement, years of credited service and average compensation. The U.S. Pension Plan was closed to new employees that joined the Company on or after October 1, 2006. Pension expense is actuarially determined using the projected unit credit method. Our policy is to fund the minimum contributions required under the Employee Retirement Income Security Act (ERISA), and, subject to cash flow levels, the Company may choose to make a discretionary contribution to the Pension Plan to reduce the unfunded liability.
68
While no contribution was required in 2010 based on these requirements, we did make a discretionary contribution of $100,000. During 2011, we made an additional contribution of $0.36 million in order to exceed an 80% funding level as measured at January 1, 2011. We also made required contributions in 2011 of $0.33 million. Based on current assumptions, we expect to make approximately $0.78 million in contributions during 2012. We use a December 31 measurement date to determine pension benefit obligations.
Benefit plan information for the U.S. Pension Plan is as follows (in thousands):
|
2011
|
2010
|
|
|
Reconciliation of projected benefit obligation:
|
||
|
Obligation at January 1
|
$ 5,866
|
$ 6,496
|
|
Service cost
|
402
|
337
|
|
Interest cost
|
331
|
336
|
|
Actuarial loss (gain)
|
1,214
|
(400)
|
|
Benefit payments
|
(278)
|
(903)
|
|
Obligation at December 31
|
$ 7,535
|
$ 5,866
|
|
Reconciliation of fair value of plan assets:
|
||
|
Fair value of plan assets at January 1
|
$ 3,643
|
$ 4,169
|
|
Actual return on plan assets
|
35
|
277
|
|
Employer contributions
|
688
|
100
|
|
Benefit payments
|
(278)
|
(903)
|
|
Fair value of plan assets at December 31
|
$ 4,088
|
$ 3,643
|
|
Funded Status:
|
||
|
Funded (unfunded) status at December 31
|
$ (3,447)
|
$ (2,223)
|
|
Projected benefit obligation
|
$ 7,535
|
$ 5,866
|
|
Accumulated benefit obligation
|
6,928
|
5,422
|
|
Fair value of plan assets
|
4,088
|
3,643
|
|
Amounts recognized in consolidated
|
||
|
balance sheets:
|
||
|
Prior service credit
|
$ 19
|
$ 43
|
|
Net loss
|
(2,194)
|
(760)
|
|
Accumulated other comprehensive income (loss)
|
(2,175)
|
(717)
|
|
Net periodic benefit cost in excess of
|
||
|
accumulated contributions
|
(1,272)
|
(1,506)
|
|
Net amount recognized in consolidated
|
||
|
balance sheet
|
$ (3,447)
|
$ (2,223)
|
69
|
|
2011
|
2010
|
|
Components of net periodic pension cost:
|
||
|
Service cost
|
$ 401
|
$ 337
|
|
Interest cost
|
331
|
336
|
|
Expected return on plan assets
|
(294)
|
(299)
|
|
Amortization of net loss
|
39
|
-
|
|
Amortization of prior service credit
|
(25)
|
(25)
|
|
Net periodic benefit cost
|
452
|
349
|
|
Other changes in plan assets and benefit obligations
|
||
|
recognized in other comprehensive income:
|
||
|
Net loss (gain)
|
1,473
|
(378)
|
|
Amortization of net loss
|
(39)
|
-
|
|
Amortization of prior service cost
|
25
|
25
|
|
Total loss (gain) recognized in other comprehensive
|
||
|
(income) loss
|
1,459
|
(353)
|
|
Total recognized in net periodic benefit cost and other
|
||
|
comprehensive (income) loss
|
$1,911
|
$ (4)
|
In 2012, the Company expects that a net loss of $159,495 and a prior service cost of $11,214 will be amortized from accumulated other comprehensive income into net periodic pension cost.
|
Weighted-average assumptions used to determine net
|
||
|
periodic benefit cost for the years ended December 31:
|
||
|
Discount rate
|
5.61%
|
6.00%
|
|
Expected long-term return on plan assets
|
7.50%
|
7.50%
|
|
Rate of compensation increase
|
2.00%
|
3.50%
|
|
Weighted-average assumptions used to determine pension
|
||
|
benefit obligation as of December 31:
|
||
|
Discount rate
|
4.61%
|
5.61%
|
|
Rate of compensation increase
|
2.00%
|
2.00%
|
The assumed expected long-term rate of return on plan assets is an estimate based on our plan investment guidelines which specify our strategic asset allocation, historical performance for the various asset classes in our strategic allocation, and our expectations for long-term rates of return for these various asset classes. We recognize that market performance varies and that our assumed expected long-term rate of return may not be meaningful during some periods. We re-evaluate our assumed expected long-term rate of return on plan assets annually through discussion with our plan investment manager. We select that return which we believe best reflects a reasonable expected return on funds invested and to be invested to provide for the benefits included in the projected benefit obligation. The overall investment objective for the pension plan investment portfolio is to achieve the highest level of return with the least amount of risk. Our actual pension plan asset allocations at December 31, 2011 and 2010 are as follows:
70
|
Target
|
Actual
|
|||
|
Allocation Range
|
Allocation
|
|||
|
Asset Category
|
2011
|
2011
|
2010
|
|
|
Equity securities
|
60% (+/- 1 to 5%)
|
58%
|
58%
|
|
|
Debt securities
|
35% (+/- 1 to 5%)
|
33%
|
32%
|
|
|
Cash and cash equivalents
|
5% (+/- 1 to 5%)
|
9%
|
10%
|
|
The following table presents estimated future benefit payments over the next ten years (in thousands):
|
2012
|
$ 165
|
|
2013
|
334
|
|
2014
|
200
|
|
2015
|
168
|
|
2016
|
276
|
|
2017 to 2021
|
2,751
|
The amortization of gains and losses is determined by using a 10% corridor of the greater of the market-related value of assets and the projected benefit obligation. Total unamortized gains and losses in excess of the corridor are amortized into income over the average remaining future service. Prior service costs/(benefits) are amortized over the average remaining future service at the time the prior service was established. Average remaining future service as of January 1, 2011 was about 9 years.
The following table sets forth by level, within the fair value hierarchy, the Plan’s assets measured at fair value on a recurring basis as of December 31, 2011:
|
Level 1
|
Level 2
|
Level 3
|
Total
|
||||
|
Government and other
|
|||||||
|
fixed income securities
|
$ 334,991
|
$1,012,724
|
$ -
|
$1,347,715
|
|||
|
Equities
|
2,386,220
|
-
|
-
|
2,386,220
|
|||
|
$2,721,211
|
$1,012,724
|
$ -
|
$3,733,935
|
We have adopted a 401(k) Plan exclusively for the benefit of participants and their beneficiaries. All U.S. employees of Chyron are eligible to participate in the 401(k) Plan. An employee may elect to contribute a percentage of his or her current compensation to the 401(k) Plan, subject to a maximum of 20% of compensation or the Internal Revenue Service annual contribution limit, whichever is less. We may make discretionary matching contributions of the compensation contributed by a participant. The discretionary matching contribution is 2/3rds of the first 6% of qualifying compensation. The Company has the option of making the matching contributions in cash or through shares of Company common stock. Employees will vest in the matching contributions in equal increments annually over three years. During 2010 and 2011, the Company match was substantially made in the form of newly issued Chyron common stock. As a result, we issued 130 thousand and 114 thousand shares of common stock, in lieu of an aggregate cash match of $265 thousand and $217 thousand during 2011 and 2010, respectively.
71
We also have several U.K. employees that are provided with pension benefits through the Chyron International Corporation Group Personal Pension Plan (the “CIC Pension Plan”). Under the CIC Pension Plan, each member has an individual account within the defined contribution plan and the Company contributes monthly an amount equal to 3% of his/her salary.
13. PRODUCT WARRANTY
We provide product warranties for our various products, typically for one year. Liabilities for the estimated future costs of repair or replacement are established and charged to cost of sales at the time the sale is recognized. We established our reserve based on such historical data, taking into consideration specific product information. The following table sets forth the movement in the warranty reserve (in thousands):
|
2011
|
2010
|
|
|
Balance at beginning of period
|
$ 50
|
$ 50
|
|
Provisions
|
38
|
19
|
|
Warranty services provided
|
(38)
|
(19)
|
|
$ 50
|
$ 50
|
14. COMMITMENTS AND CONTINGENCIES
At December 31, 2011, we were obligated under operating and capital leases, expiring at various dates through 2019, covering facility space and equipment as follows (in thousands):
|
Operating
|
Capital
|
|
|
2012
|
$ 653
|
$ 38
|
|
2013
|
677
|
20
|
|
2014
|
688
|
13
|
|
2015
|
671
|
10
|
|
2016
|
693
|
|
|
thereafter
|
1,897
|
-
|
The operating lease contains provisions for escalations and for facility maintenance. Total rent expense was approximately $0.7 million in 2011 and 2010.
We have severance arrangements for key and virtually all other employees of the Company that provide for payment of a portion of their salary and continuance of their benefits for their severance period, in the event they are involuntarily terminated. The severance periods range from a week to a number of months depending on the length of service and/or level of the employee within the Company. Had all such key and other covered employees been terminated at December 31, 2011, for a reason other than a change in control, the estimated total severance and benefits would have approximated $2.4 million. In addition, two executive officers have change in control agreements entitling them to certain additional benefits totaling $1.7 million that would be payable in the event of a change in control.
72
At December 31, 2011, we had firm purchase commitments for inventory components of $1.7 million to be delivered during 2012.
On December 1, 2009, one of our customers, International Broadcast Consultants, Inc., or IBC, filed a lawsuit against us in the Superior Court of the State of California for the County of Los Angeles, which was subsequently removed to the United States District Court for the Central District of California on January 4, 2010. In August 2011, after various motions and proceedings before the court, Chyron settled this lawsuit for de minimis consideration. The settlement of this lawsuit did not have a material impact on our business, financial condition, results of operations or liquidity.
A letter of notification, dated March 10, 2011, was received from counsel for Turner Broadcasting System, Inc., Turner Network Television, Inc., Cable News Network, Inc., and The Cartoon Network, Inc. (“Turner”) alleging that we are obligated to indemnify Turner as a result of a recently filed patent infringement action against Turner by Multimedia Patent Trust (“MPT”) in the United States District Court for the Southern District of California. Chyron supplies various products to Turner. We have notified Turner that its request is without merit. We believe Turner’s request for indemnification lacks merit because our products do not infringe any of MPT’s patents and we are not obligated to indemnify Turner for those portions of our products that are allegedly involved. Should any of such parts of our products be found to be infringing, then indemnification should lawfully be sought from our outside supplier of such parts and not Chyron. We have denied Turner’s request. Based on our current knowledge, we believe that the amount of reasonably possible loss or range of loss is not reasonably estimable. Moreover, legal matters are inherently unpredictable and subject to significant uncertainties, some of which are beyond our control. As such, there can be no assurance that the final outcome will not have a material adverse effect upon our financial condition and results of operations.
We are not a party to any other legal proceedings that we believe will have a material impact on our business, financial condition, results of operations or liquidity.
15. SEGMENT AND GEOGRAPHIC INFORMATION
The Company operates and evaluates its business as one reporting unit. Substantially all long-lived assets are located in the United States.
The details of the Company’s geographic sales are as follows (in thousands):
|
2011
|
2010
|
|
|
Revenues from external customers:
|
||
|
United States
|
$22,766
|
$20,732
|
|
Europe
|
3,864
|
4,295
|
|
Other
|
4,957
|
2,700
|
|
$31,587
|
$27,727
|
73
ITEM 9. CHANGES IN AND DISAGREEMENTS WITH ACCOUNTANTS
ON ACCOUNTING AND FINANCIAL DISCLOSURE
None.
ITEM 9A. CONTROLS AND PROCEDURES
Evaluation of Disclosure Controls and Procedures
Our principal executive officer and principal financial officer, after evaluating the effectiveness of our disclosure controls and procedures (as defined in paragraph (e) of Rules 13a-15 and 15d-15 under the Securities Exchange Act of 1934) as of the end of the period covered by this Annual Report on Form 10-K, have concluded, that, based on such evaluation, our disclosure controls and procedures were effective to ensure that information required to be disclosed by us in the reports that we file or submit under the Securities Exchange Act of 1934 is recorded, processed, summarized and reported, within the time periods specified in the SEC’s rules and forms and is accumulated and communicated to management, including the Chief Executive Officer and Chief Financial Officer, or persons performing similar functions, as appropriate to allow timely decisions regarding required disclosure, particularly during the period in which this Annual Report on Form 10-K was being prepared.
Changes in Internal Control Over Financial Reporting
There were no changes in our internal control over financial reporting, identified in connection with the evaluation of such internal control that occurred during the fourth quarter of our last fiscal year that have materially affected, or are reasonably likely to materially affect, our internal control over financial reporting.
Management’s Report on Internal Control Over Financial Reporting
Our management is responsible for establishing and maintaining adequate internal control over financial reporting. Our internal control over financial reporting was designed to provide reasonable assurance to our management and board of directors regarding the preparation and fair presentation of published financial statements. Internal control over financial reporting is defined in Rules 13a-15(f) and 15d-15(f) under the Securities Exchange Act of 1934, as amended, as a process designed by, or under the supervision of, our principal executive and principal financial officer and effected by our board of directors, management and other personnel, to provide reasonable assurance regarding the reliability of financial reporting and the preparation of financial statements for external purposes in accordance with generally accepted accounting principles. Our internal control over financial reporting includes those policies and procedures that:
74
|
·
|
pertain to the maintenance of records that in reasonable detail accurately and fairly reflect our transactions and dispositions of our assets;
|
|
·
|
provide reasonable assurance that our transactions are recorded as necessary to permit preparation of financial statements in accordance with generally accepted accounting principles, and that our receipts and expenditures are being made only in accordance with authorizations of our management and directors; and
|
|
·
|
provide reasonable assurance regarding prevention or timely detection of unauthorized acquisition or disposition of our assets that could have a material effect on the financial statements.
|
Internal control over financial reporting, no matter how well designed, has inherent limitations and may not prevent or detect misstatements. Also, projections of any evaluation of effectiveness to future periods are subject to the risk that controls may become inadequate because of changes in conditions, or that the degree of compliance with policies or procedures may deteriorate. Therefore, even effective internal control over financial reporting can only provide reasonable assurance with respect to financial statement preparation and presentation.
Our management assessed the design and effectiveness of our internal control over financial reporting as of December 31, 2011. In making this assessment, management used the criteria set forth by the Committee of Sponsoring Organizations of the Treadway Commission in “Internal Control - Integrated Framework.” Based on its assessment, management believes that as of December 31, 2011, the Company’s internal control over financial reporting is effective.
This Annual Report on Form 10-K does not include an attestation report of our independent registered public accounting firm regarding internal control over financial reporting.
ITEM 9B. OTHER INFORMATION
None.
75
PART III
ITEM 10. DIRECTORS, EXECUTIVE OFFICERS AND CORPORATE GOVERNANCE
The information called for by this item will be presented under the captions ELECTION OF DIRECTORS and SECTION 16(a) BENEFICIAL OWNERSHIP REPORTING COMPLIANCE, in our definitive proxy statement to be filed with the Securities and Exchange Commission in connection with our 2012 Annual Meeting of Shareholders (“Proxy Statement”), and is incorporated herein by reference in response to this item.
We have a written code of ethics for senior financial officers, including our principal executive officer, principal financial officer, principal accounting officer or controller and any other persons performing similar functions. The code of ethics is available on the Investor Relations section of our website under the heading “Investors” at www.chyron.com. In addition, the Company will provide to any person, without charge, a copy of such code of ethics, upon written request to: Corporate Secretary, Chyron Corporation, 5 Hub Drive, Melville, NY 11747.
ITEM 11. EXECUTIVE COMPENSATION
The information called for by this item will be presented under the captions COMPENSATION COMMITTEE REPORT, COMPENSATION DISCUSSION AND ANALYSIS, EXECUTIVE COMPENSATION, DIRECTOR COMPENSATION, and COMPENSATION COMMITTEE INTERLOCKS AND INSIDER PARTICIPATION in our Proxy Statement, and is incorporated herein by reference in response to this item.
ITEM 12. SECURITY OWNERSHIP OF CERTAIN BENEFICIAL OWNERS
AND MANAGEMENT AND RELATED STOCKHOLDER MATTERS
The information called for by this item will be presented under the captions PRINCIPAL SHAREHOLDERS and EQUITY COMPENSATION PLAN INFORMATION in our Proxy Statement, and is incorporated herein by reference in response to this item.
ITEM 13. CERTAIN RELATIONSHIPS AND RELATED TRANSACTIONS, AND
DIRECTOR INDEPENDENCE
The information called for by this item will be presented under the caption ELECTION OF DIRECTORS and CERTAIN RELATIONSHIPS AND RELATED TRANSACTIONS in our Proxy Statement, and is incorporated herein by reference in response to this item.
ITEM 14. PRINCIPAL ACCOUNTING FEES AND SERVICES
The information called for by this item will be presented under the caption AUDIT COMMITTEE REPORT in our Proxy Statement, and is incorporated herein by reference in response to this item.
76
PART IV
ITEM 15. EXHIBITS, FINANCIAL STATEMENT SCHEDULES
|
(a)
|
The following documents are filed as part of this Annual Report on Form 10-K:
|
(a)(1) and (2)
See Index to Consolidated Financial Statements on page 48 at Item 8 to this Annual Report on Form 10-K. Other financial statement schedules have not been included because they are not applicable or the information is included in the financial statements or notes thereto.
(a)(3) Exhibits
The following exhibits are filed as part of, or are incorporated by reference into, this Annual Report on Form 10-K.
Exhibit Index
|
Exhibit
Number
|
Description
|
|
3.1
|
Restated Certificate of Incorporation filed with the State of New York on December 27, 1991 (previously filed as Exhibit 3(a) to the Registrant’s Annual Report on Form 10-K for the fiscal year ended June 30, 1991 (File No. 000-05110) and incorporated herein by reference)
|
|
3.2
|
Certificate of Amendment of the Restated Certificate of Incorporation filed with the State of New York on February 7, 1997 (previously filed as Exhibit 3(c) to the Registrant’s Annual Report on Form 10-K for the fiscal year ended December 31, 1996 (File No. 001-09014) and incorporated herein by reference)
|
|
3.3
|
Certificate of Amendment of the Restated Certificate of Incorporation filed with the State of New York on September 19, 2007 (previously filed as Exhibit 3(i) to the Registrant’s Current Report on Form 8-K filed with the Commission on September 24, 2007 (File No. 001-09014) and incorporated herein by reference)
|
|
3.4
|
Amended and Restated By-Laws (previously filed as Exhibit 3.1 to the Registrant’s Current Report on Form 8-K filed with the Commission on May 15, 2009 (File No. 001-09014) and incorporated herein by reference)
|
|
10.1*
|
Indemnification Agreement between Chyron Corporation and Christopher R. Kelly effective as of August 30, 1999 (previously filed as Exhibit 10(f) to the Registrant’s Annual Report on Form 10-K for the fiscal year ended December 31, 2002 (File No. 001-09014) and incorporated herein by reference)
|
|
10.2*
|
Indemnification Agreement between Chyron Corporation and Michael Wellesley-Wesley effective as of November 19, 1996 previously filed as Exhibit 10(xx) to the Registrant’s Annual Report on Form 10-K for the fiscal year ended December 31, 1996 (File No. 001-09014) and incorporated herein by reference)
|
|
10.3*
|
Indemnification Agreement between Chyron Corporation and Jerry Kieliszak effective as of March 1, 2002 (previously filed as Exhibit 10(s) to the Registrant’s Annual Report on Form 10-K for the fiscal year ended December 31, 2002 (File No. 001-09014) and incorporated herein by reference)
|
77
|
10.4*
|
Indemnification Agreement between Chyron Corporation and Michael Wheeler effective as of February 1, 2006( previously filed as Exhibit 10(g) to the Registrant’s Annual Report on Form 10-K for the fiscal year ended December 31, 2007 (File No. 001-09014) and incorporated herein by reference)
|
|
10.5*
|
Indemnification Agreement between Chyron Corporation and Peter Frey effective as of May 14, 2008 (previously filed as Exhibit 10.1 to the Registrant’s Current Report on Form 8-K filed with the Commission on May 20, 2008 (File No. 001-09014) and incorporated herein by reference)
|
|
10.6*
|
Indemnification Agreement between Chyron Corporation and Roger L. Ogden effective as of May 14, 2008 (previously filed as Exhibit 10.2 to the Registrant’s Current Report on Form 8-K filed with the Commission on May 20, 2008 (File No. 001-09014) and incorporated herein by reference)
|
|
10.7*
|
Indemnification Agreement between Chyron Corporation and Robert A. Rayne effective as of May 14, 2008 (previously filed as Exhibit 10.3 to the Registrant’s Current Report on Form 8-K filed with the Commission on May 20, 2008 (File No. 001-09014) and incorporated herein by reference)
|
|
10.8*
|
Indemnification Agreement between Chyron Corporation and Susan Clark-Johnson effective as of March 10, 2010 (previously filed as Exhibit 10.30 to the Registrant’s Annual Report on Form 10-K for the fiscal year ended December 31, 2009 (File No. 001-09014) and incorporated herein by reference)
|
|
10.9*
|
Indemnification Agreement between Chyron Corporation and Dawn Johnston effective as of April 3, 2002 (previously filed as Exhibit 10(i) to the Registrant’s Annual Report on Form 10-K for the fiscal year ended December 31, 2007 (File No. 001-09014) and incorporated herein by reference)
|
|
10.10*
|
Amended and Restated Employment Agreement by and between Chyron Corporation and Michael Wellesley-Wesley effective as of September 1, 2010 (previously filed as Exhibit 10.1 to the Registrant’s Current Report on Form 8-K filed with the Commission on August 9, 2010 (File No. 001-09014) and incorporated herein by reference)
|
|
10.11*
|
Change in Control Agreement between Michael Wellesley-Wesley and Chyron Corporation dated September 19, 2008 (previously filed as Exhibit 10.2 to the Registrant’s Current Report on Form 8-K filed with the Commission on September 24, 2008 (File No. 001-09014) and incorporated herein by reference)
|
|
10.12*
|
First Amendment to Change in Control Agreement by and between Chyron Corporation and Michael Wellesley-Wesley dated June 11, 2010 (previously filed as Exhibit 10.2 to the Registrant’s Current Report on Form 8-K filed with the Commission on June 14, 2010 (File No. 001-09014) and incorporated herein by reference)
|
|
10.13*
|
Change in Control Agreement between Chyron Corporation and Jerry Kieliszak dated October 26, 2007 (previously filed as Exhibit 10.2 to the Registrant’s Current Report on Form 8-K filed with the Commission on October 31, 2007 (File No. 001-09014) and incorporated herein by reference)
|
|
10.14*
|
Amendment to Change in Control Agreement by and between Chyron Corporation and Jerry Kieliszak and dated June 11, 2010 (previously filed as Exhibit 10.1 to the Registrant’s Current Report on Form 8-K filed with the Commission on June 14, 2010 (File No. 001-09014) and incorporated herein by reference)
|
|
10.15*
|
Terms of Severance Agreement between Chyron Corporation and Jerry Kieliszak dated October 26, 2007 (previously filed as Exhibit 10.5 to the Registrant’s Current Report on Form 8-K filed with the Commission on October 31, 2007 (File No. 001-09014) and incorporated herein by reference)
|
|
10.16*
|
Chyron Corporation 1999 Incentive Compensation Plan (previously filed as Exhibit 1 to the Registrant’s Definitive Proxy Statement on Schedule 14A filed with the Commission on April 7, 1999 (SEC File No. 000-05110) and incorporated herein by reference)
|
78
|
10.17*
|
Chyron Corporation 2008 Long-Term Incentive Plan approved on May 14, 2008 and amended on May 19, 2010 (previously filed as Exhibit 99.1 to the Registrant’s Current Report on Form 8-K filed with the Commission on May 25, 2010 (File No. 001-09014) and incorporated herein by reference)
|
|
10.18*
|
Chyron Corporation Employees Severance Plan amended August 9, 2006 (previously filed as Exhibit 10.1 to the Registrant’s Current Report on Form 8-K filed with the Commission on August 14, 2006 (File No. 001-09014) and incorporated herein by reference)
|
|
10.19
|
Loan and Security Agreement between Silicon Valley Bank and Chyron Corporation dated as of June 19, 2008 (previously filed as Exhibit 10.1 to the Registrant’s Current Report on Form 8-K filed with the Commission on June 23, 2008 (File No. 001-09014) and incorporated herein by reference)
|
|
10.20
|
First Loan Modification Agreement between Silicon Valley Bank and Chyron Corporation dated April 16, 2009 (previously filed as Exhibit 10.1 to the Registrant’s Current Report on Form 8-K filed with the Commission on June 18, 2009 (File No. 001-09014) and incorporated herein by reference)
|
|
10.21
|
Second Loan Modification Agreement between Silicon Valley Bank and Chyron Corporation dated June 18, 2009 (previously filed as Exhibit 10.2 to the Registrant’s Current Report on Form 8-K filed with the Commission on June 18, 2009 (File No. 001-09014) and incorporated herein by reference)
|
|
10.22
|
Third Loan Modification Agreement between Silicon Valley Bank and Chyron Corporation dated March 24, 2010 and effective as of March31, 2010 (previously filed as Exhibit 10.1 to the Registrant’s Current Report on Form 8-K filed with the Commission on March 30, 2010 (File No. 001-09014) and incorporated herein by reference)
|
|
10.23
|
Fourth Loan Modification Agreement between Silicon Valley Bank and Chyron Corporation dated March 24, 2011 and effective as of March 30, 2011 (previously filed as Exhibit 10.1 to the Registrant’s Current Report on Form 8-K filed with the Commission on March 25, 2011 (File No. 001-09014) and incorporated herein by reference)
|
|
10.24
|
Fifth Loan Modification Agreement between Silicon Valley Bank and Chyron Corporation dated December 28, 2011 and effective as of December 31, 2011 (previously filed as Exhibit 10.1 to the Registrant’s Current Report on Form 8-K filed with the Commission on January 4, 2012 (File No. 001-09014) and incorporated herein by reference)
|
|
10.25
|
Asset Purchase Agreement by and among Chyron Corporation, AXIS Graphics, LLC, and Pyburn Films, Inc. (previously filed as Exhibit 10.1 to the Registrant’s Current Report on Form 8-K filed with the Commission on January 17, 2008 (File No. 001-09014) and incorporated herein by reference)
|
|
10.26
|
Subordinated 5% Promissory Note issued by Chyron Corporation to AXIS Graphics, LLC (previously filed as Exhibit 10.2 the Registrant’s Current Report on Form 8-K filed with the Commission on January 17, 2008 (File No. 001-09014) and incorporated herein by reference)
|
|
10.27
|
Second Amendment to Lease by and between Rechler Equity B-1 LLC and Chyron Corporation dated January 20, 2009 (previously filed as exhibit 10.29 to the Registrant’s Annual Report on Form 10-K filed with the commission on March 25, 2009 (File No. 001-09014) and incorporated herein by reference)
|
|
10.28*
|
2011 Management Incentive Compensation Plan (previously filed as Exhibit 10.1 to the Registrant’s Current Report on Form 8-K filed with the Commission on May 11, 2011 (File No. 001-09014) and incorporated herein by reference)
|
|
10.29*
|
Form of Restricted Stock Unit Award under the Chyron Corporation 2008 Long-Term Incentive Plan (previously filed as Exhibit 10.1 the Registrant’s Current Report on Form 8-K filed with the Commission on November 13, 2009 (File No. 001-09014) and incorporated herein by reference)
|
|
10.30*
|
Chyron Corporation Non-Employee Director Compensation Policy **
|
79
|
10.31*
|
2012 Management Incentive Compensation Plan (previously filed as Exhibit 10.1 to the Registrant’s Current Report on Form 8-K filed with the Commission on March 13, 2012 (File No. 001-09014) and incorporated herein by reference)
|
|
10.32*
|
Form of Restricted Stock Unit Award Cancellation Agreement under the Chyron Corporation 2008 Long-Term Incentive Plan**
|
|
21.1
|
Subsidiaries of the Registrant**
|
|
23.1
|
Consent of BDO USA, LLP **
|
|
31.1
|
Certification of Principal Executive Officer pursuant to Section 302 of the Sarbanes-Oxley Act of 2002**
|
|
31.2
|
Certification of Principal Financial Officer pursuant to Section 302 of the Sarbanes-Oxley Act of 2002**
|
|
32
|
Certifications of Principal Executive Officer and Principal Financial Officer pursuant to Section 906 of the Sarbanes-Oxley Act of 2002**
|
|
101
|
The following materials from Chyron Corporation’s Annual Report on Form 10-K for the year ended December 31, 2011, formatted in XBRL (eXtensible Business Reporting Language): (i) the Consolidated Balance Sheets, (ii) the Consolidated Statements of Operations, (iii) the Consolidated Statements of Cash Flows, (iv) the Consolidated Statements of Shareholders’ Equity, and (v) Notes to Consolidated Financial Statements, tagged as blocks of text***
|
|
*
|
Management contract or compensatory plan or arrangement.
|
|
**
|
Filed herewith.
|
|
***
|
Pursuant to Rule 406T of Regulation S-T, the Interactive Data Files on Exhibit 101 hereto are deemed not filed or part of a registration statement or prospectus for purposes of Sections 11 or 12 of the Securities Act of 1933, as amended, are deemed not filed for purposes of Section 18 of the Securities and Exchange Act of 1934, as amended, and otherwise are not subject to liability under those sections.
|
80
SIGNATURES
Pursuant to the requirements of Section 13 or 15(d) of the Securities Exchange Act of 1934, the registrant has duly caused this report to be signed on its behalf by the undersigned, thereunto duly authorized.
|
CHYRON CORPORATION
|
|
|
Date: March 21, 2012
|
/s/ Michael Wellesley-Wesley
|
|
Michael Wellesley-Wesley
|
|
|
President and Chief Executive Officer
|
|
|
(Principal Executive Officer)
|
Pursuant to the requirements of the Securities Exchange Act of 1934, this report has been signed below by the following persons on behalf of the registrant and in the capacities indicated below on the dates indicated.
|
Signature
|
Title
|
Date
|
|
|
/s/ Michael Wellesley-Wesley
|
President, CEO and Director
|
March 21, 2012
|
|
|
Michael Wellesley-Wesley
|
(principal executive officer)
|
||
|
/s/ Jerry Kieliszak
|
Senior Vice President and Chief Financial
|
March 21, 2012
|
|
|
Jerry Kieliszak
|
Officer (principal financial officer)
|
||
|
/s/ Roger L. Ogden
|
Chairman of the Board of Directors
|
March 21, 2012
|
|
|
Roger L. Ogden
|
|||
|
/s/ Susan Clark-Johnson
|
Director
|
March 21, 2012
|
|
|
Susan Clark-Johnson
|
|||
|
/s/ Peter F. Frey
|
Director
|
March 21, 2012
|
|
|
Peter F. Frey
|
|||
|
/s/ Christopher R. Kelly
|
Director
|
March 21, 2012
|
|
|
Christopher R. Kelly
|
|||
|
/s/ Robert A. Rayne
|
Director
|
March 21, 2012
|
|
|
Robert A. Rayne
|
|||
|
/s/ Michael C. Wheeler
|
Director
|
March 21, 2012
|
|
|
Michael C. Wheeler
|
|||
|
/s/ Dawn R. Johnston
|
Corporate Controller
|
March 21, 2012
|
|
|
Dawn R. Johnston
|
81