Attached files
| file | filename |
|---|---|
| 8-K - FORM 8-K - MOSAIC CO | d318096d8k.htm |
 North American Phosphate Outlook
Dr. Michael Rahm
Vice President
Market and Strategic Analysis
CRU Phosphates 2012 Conference
Hotel Mazagan
El-Jadida, Morocco
March 19-21, 2012
Exhibit 99.1 |
 2
Safe Harbor Statement
This presentation contains forward-looking statements within the meaning of the Private Securities
Litigation Reform Act of 1995. Such statements include, but are not limited to, statements about
future financial and operating results. Such statements are based upon the current beliefs and
expectations of The Mosaic Company’s management and are subject to significant risks and
uncertainties. These risks and uncertainties include but are not limited to the predictability and volatility of, and
customer expectations about, agriculture, fertilizer, raw material, energy and transportation
markets that are subject to competitive and other pressures and economic and credit market
conditions; the level of inventories in the distribution channels for crop nutrients; changes in
foreign currency and exchange rates; international trade risks; changes in government policy; changes in
environmental and other governmental regulation, including greenhouse gas regulation, and
implementation of the U.S. Environmental Protection Agency’s numeric water quality
standards for the discharge of nutrients into Florida lakes and streams or possible efforts to
reduce the flow of excess nutrients into the Gulf of Mexico; further developments in the lawsuit
involving the federal wetlands permit for the extension of the Company’s South Fort Meade,
Florida, mine into Hardee County, including orders, rulings, injunctions or other actions by the
court or actions by the plaintiffs, the Army Corps of Engineers or others in relation to the
lawsuit, or any actions the Company may identify and implement in an effort to mitigate the
effects of the lawsuit; other difficulties or delays in receiving, or increased costs of, necessary governmental permits or
approvals; the effectiveness of our processes for managing our strategic priorities; adverse weather
conditions affecting operations in Central Florida or the Gulf Coast of the United States,
including potential hurricanes or excess rainfall; actual costs of various items differing from
management’s current estimates, including, among others, asset retirement, environmental
remediation, reclamation or other environmental regulation, or Canadian resources taxes and royalties;
accidents and other disruptions involving Mosaic’s operations, including brine inflows at its
Esterhazy, Saskatchewan potash mine and other potential mine fires, floods, explosions, seismic
events or releases of hazardous or volatile chemicals, as well as other risks and uncertainties
reported from time to time in The Mosaic Company’s reports filed with the Securities and
Exchange Commission. Actual results may differ from those set forth in the forward-looking
statements. |
 Topics
Current Situation and Near Term Outlook
Long Term Outlook
Evolving Role of U.S. Industry
3 |
 Current Situation and Near Term Outlook |
 Expected
Features
Positive crop nutrient demand drivers
Record global phosphate shipments but . . .
A slow start followed by a fast finish this year
Lower and less volatile raw materials costs
Several supply and demand uncertainties
Impacted by sentiment and intangibles
5 |
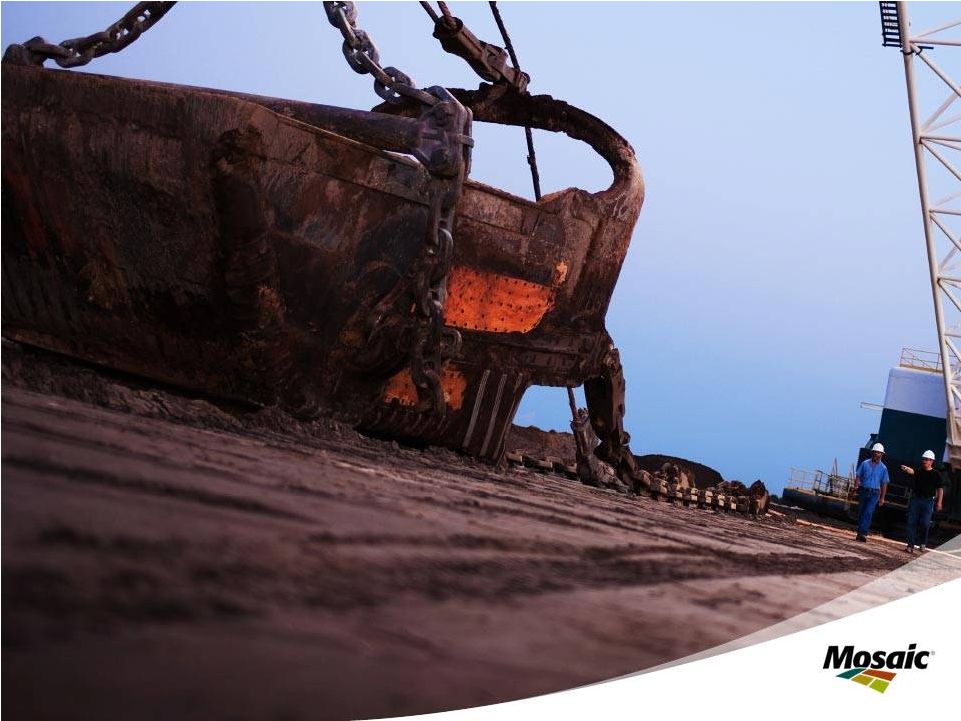
 Positive crop nutrient demand drivers
6
Markets still signaling for more area and yield
3.50
4.00
4.50
5.00
5.50
6.00
6.50
7.00
7.50
8.00
O
N
D
J
F
M
A
M
J
J
US$ BU
New Crop Corn Prices
Daily Close of the New Crop Option October 1 to June 30
2008
2009
2010
2011
2012
Source: CBOT
7.00
8.00
9.00
10.00
11.00
12.00
13.00
14.00
15.00
16.00
O
N
D
J
F
M
A
M
J
J
US$ BU
New Crop Soybean Prices
Daily Close of the New Crop Option October 1 to June 30
2008
2009
2010
2011
2012
Source: CBOT |
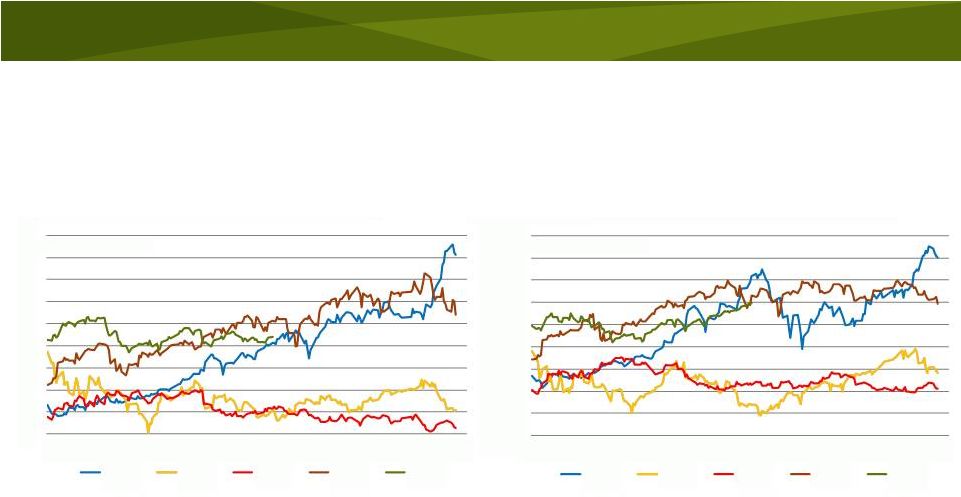
 High
prices in 2011 did not move the needle 7
300
350
400
450
500
550
600
650
00/01
01/02
02/03
03/04
04/05
05/06
06/07
07/08
08/09
09/10
10/11E11/12F12/13F13/14F
Mil Tonnes
World Grain & Oilseed Stocks
Source: USDA and Mosaic
2013/14 Grain and Oilseed Scenario Assumptions
Low
Medium
High
Harvested Area Change
0.00%
0.25%
0.50%
Yield Deviation from Trend *
Largest Negative
0.0%
Largest Positve
Demand Growth
1.75%
2.00%
2.25%
* Largest deviation from the 11-year trend 2000-2010
Trend yields in 2012
and
2013
don’
t
keep pace with 2%
demand growth! |
 Potential for a strong supply response
8
2.40
2.50
2.60
2.70
2.80
2.90
3.00
3.10
780
800
820
840
860
880
900
920
00/01
01/02
02/03
03/04
04/05
05/06
06/07
07/08
08/09
09/10
10/11
11/12
MT Ha
Mil Ha
World Grain and Oilseed Area and Yields
Harvested Area
Yield
Trend
Source: USDA
2000
2100
2200
2300
2400
2500
2600
2700
2800
2900
3000
00/01
01/02
02/03
03/04
04/05
05/06
06/07
07/08
08/09
09/10
10/11E
11/12F
12/13F
Mil Tonnes
World Grain & Oilseed Production
Historical
2012/13 Range
2012/13 Medium Scenario
Source: USDA and Mosaic
Record harvested area record average
yield record production global
demand in 2011/12 +
=
= |
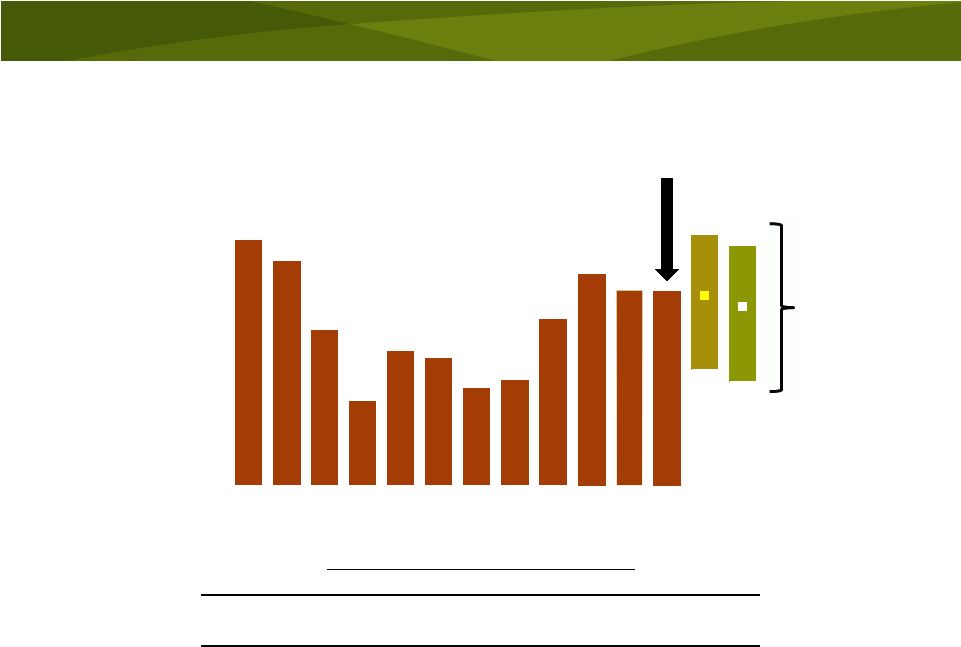
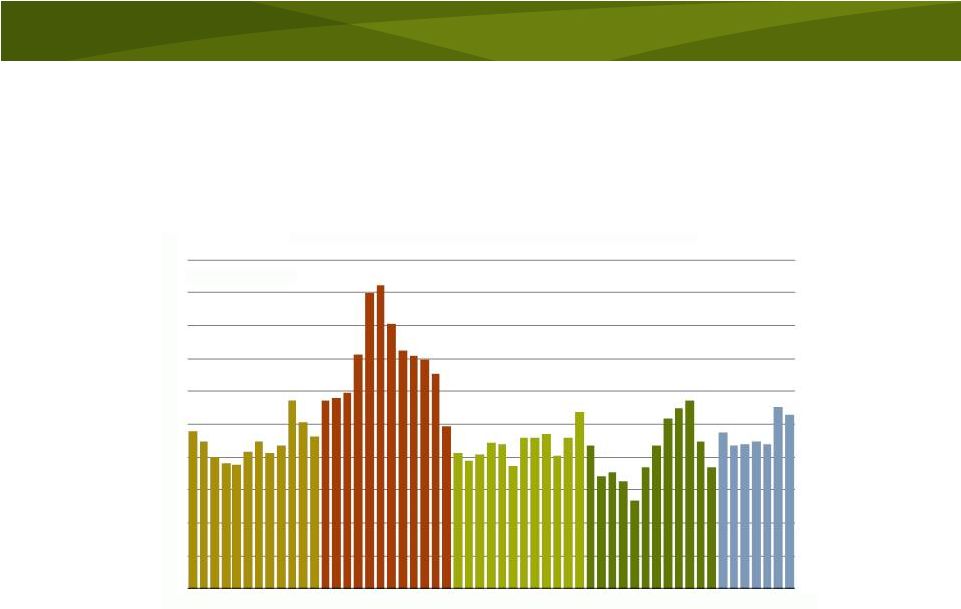
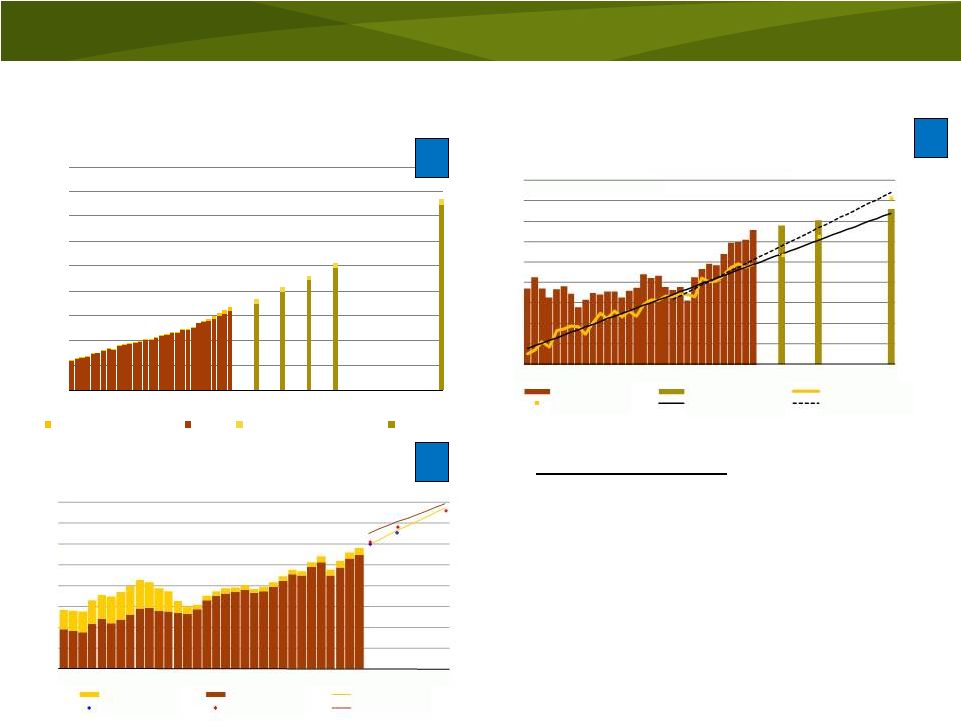
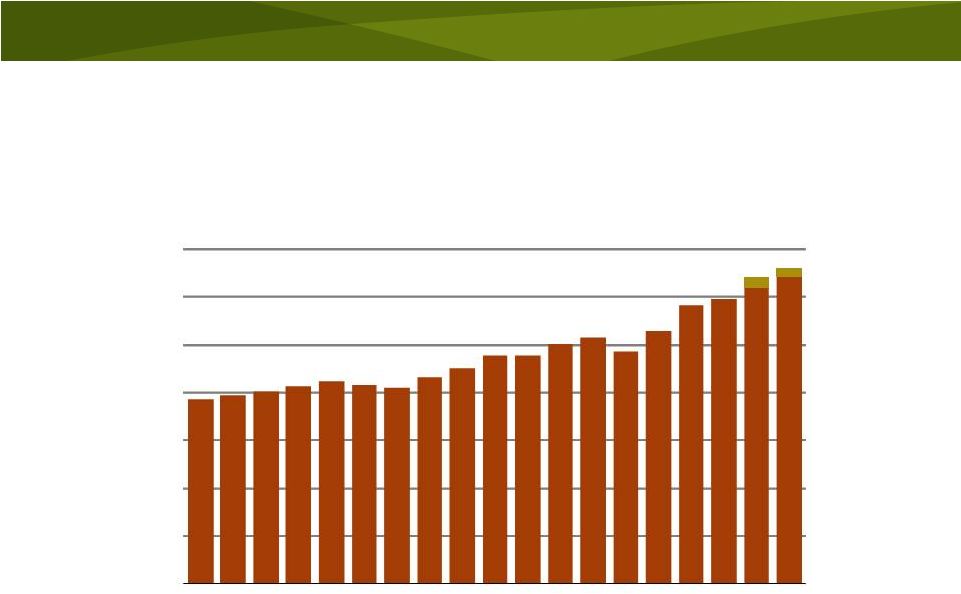 Positive drivers underpin record phosphate
shipment forecasts
9
Source: Fertecon and Mosaic
51
47
52
58
60
62-64
64-66
0
10
20
30
40
50
60
70
95
96
97
98
99
00
01
02
03
04
05
06
07
08
09
10
11E
12F
13F
Mil Tonnes
DAP/MAP/MES/TSP
World Processed Phosphate Shipments |
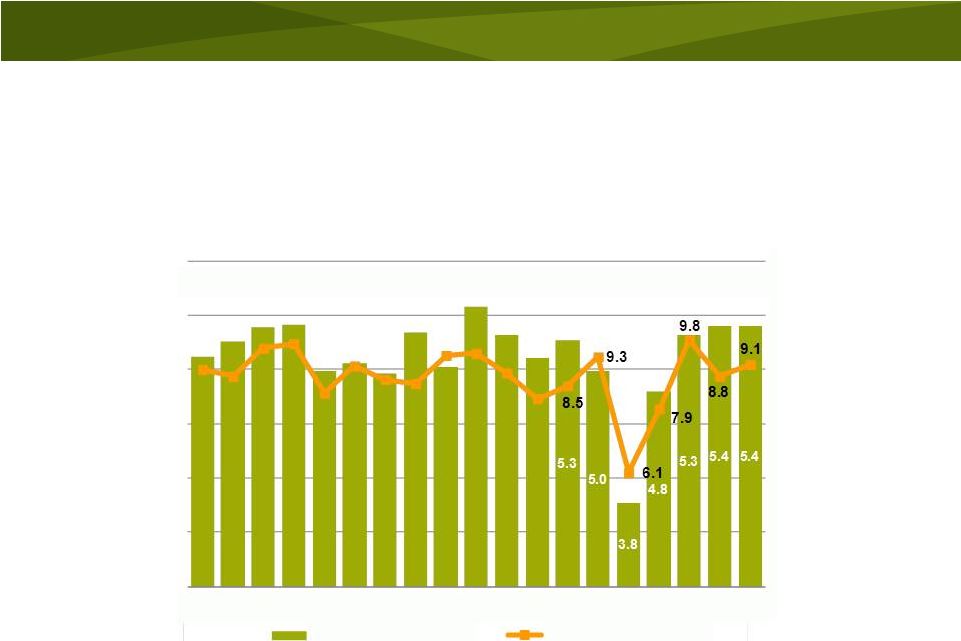 North American phosphate shipments and
use have recovered to high levels
10
3.0
4.5
6.0
7.5
9.0
10.5
12.0
3.0
3.5
4.0
4.5
5.0
5.5
6.0
95
96
97
98
99
00
01
02
03
04
05
06
07
08
09
10
11E12F
13F
Mil Tons
Product
Mil Tons
P
2
O
5
NA Phosphate Use and DAP/MAP/MES/TSP Shipments
Phosphate Use
Total Shipments
Source: AAPFCO, TFI, IFA and Mosaic
Fertilizer Year Ending June 30 |
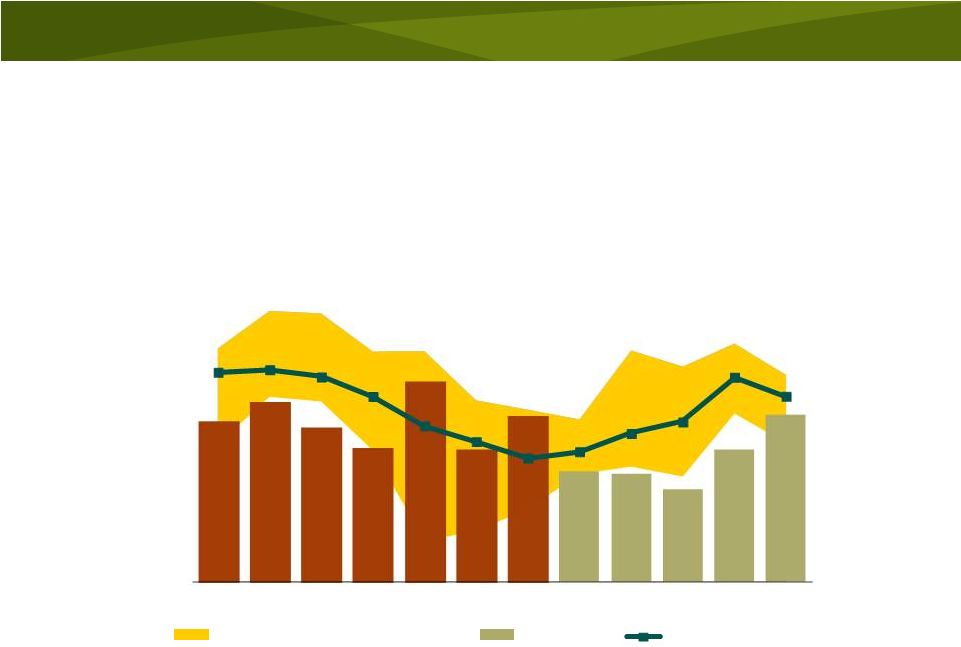
 Strong U.S. shipments last Fall followed by
slow movement this Winter
11
0.0
0.2
0.4
0.6
0.8
1.0
1.2
Jul
Aug
Sep
Oct
Nov
Dec
Jan
Feb
Mar
Apr
May
Jun
Mil Tons
U.S. DAP and MAP/MES Domestic Shipments
2011/12 Fcst
6-Yr Olympic Avg
Source: TFI and Mosaic
MIN MAX Range (2005/06-2010/11) |
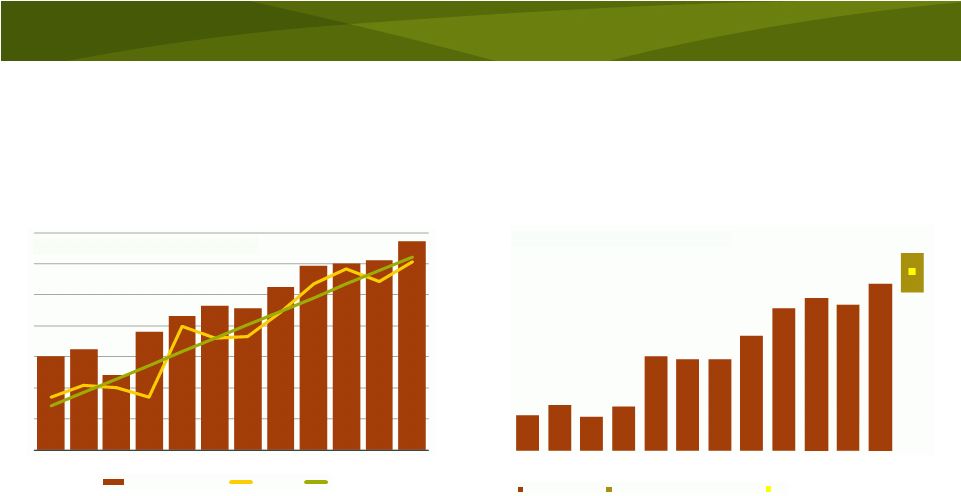
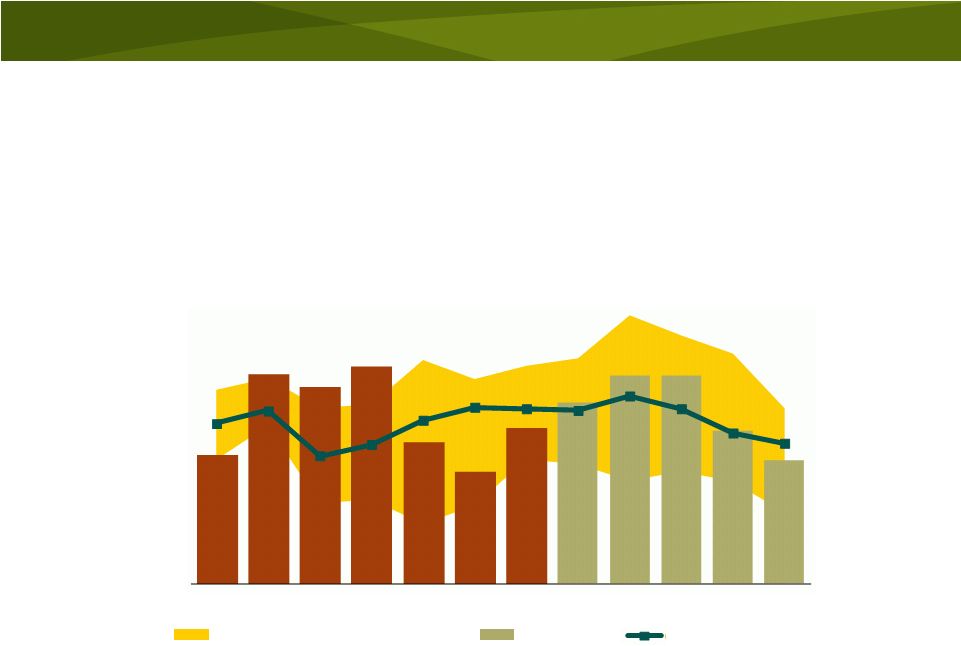
 Average North American shipments expected
this Spring
12
Source: TFI, USDC and Mosaic
0.0
1.0
2.0
3.0
4.0
5.0
6.0
7.0
Jul-Dec
Jan
Jun
Mil Tons
Implied North American Phosphate Shipments
5
Yr Min-Max Range
2011/12
5-Yr Average
-
- |
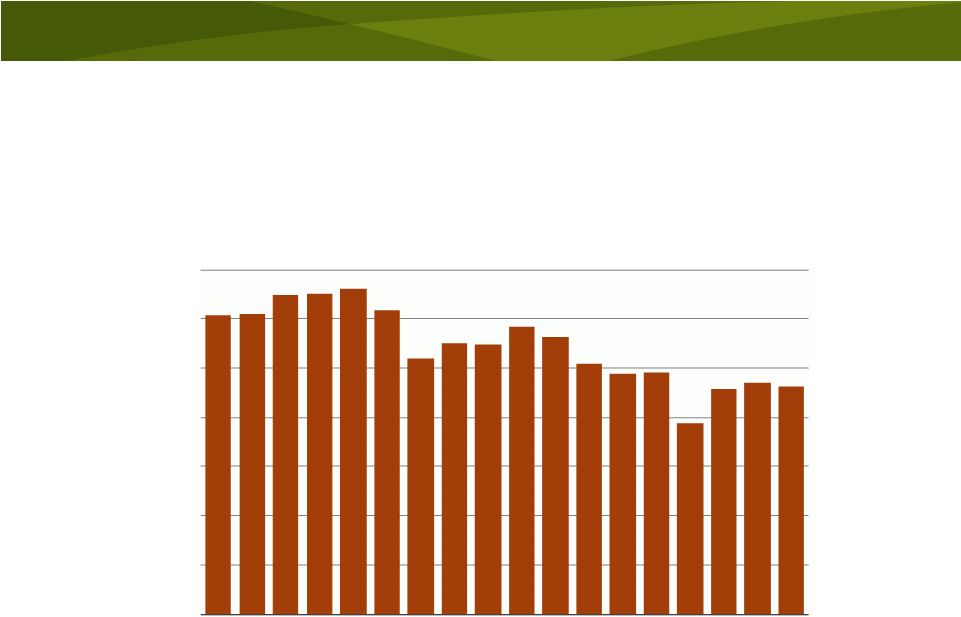
 U.S. exports have stabilized in the 6-7 million
ton range during the last five years
13
95
96
97
98
99
00
01
02
03
04
05
06
07
08
09
10
11
12F
0.0
2.0
4.0
6.0
8.0
10.0
12.0
14.0
Mil Tons
U.S. DAP and MAP/MES Exports
Source: TFI and Mosaic
Fertilizer Year Ending June 30 |
 Low
shipments during the FH of 2012 expected to
reduce
U.S.
exports
this
fertilizer
year
14
0.0
0.2
0.4
0.6
0.8
1.0
1.2
Jul
Aug
Sep
Oct
Nov
Dec
Jan
Feb
Mar
Apr
May
Jun
Mil Tons
U.S. DAP and MAP/MES Exports
MIN
MAX
Range
(2005/06-2010/11)
2011/12 Fcst
6-Yr Olympic Avg
Source: TFI and Mosaic |
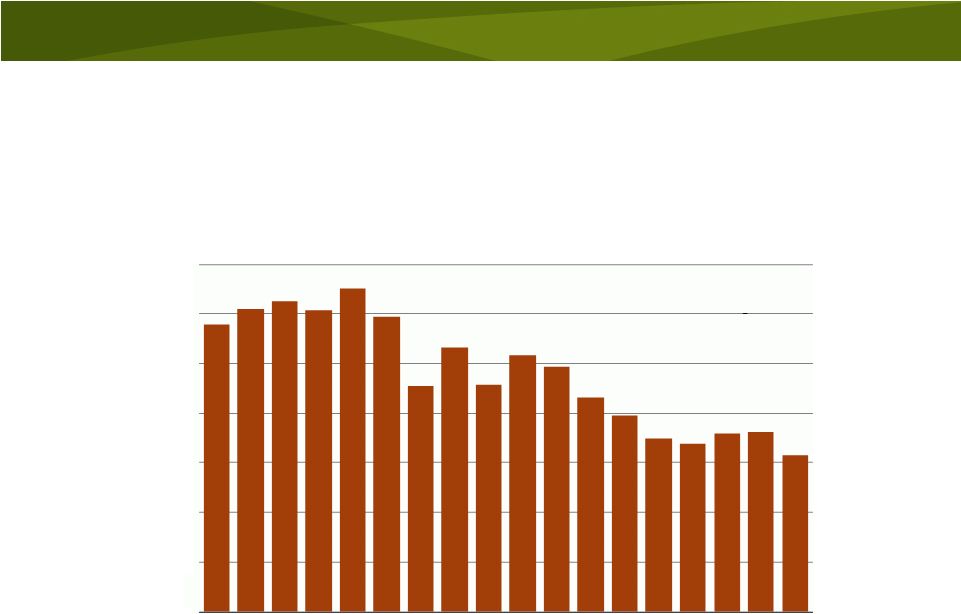
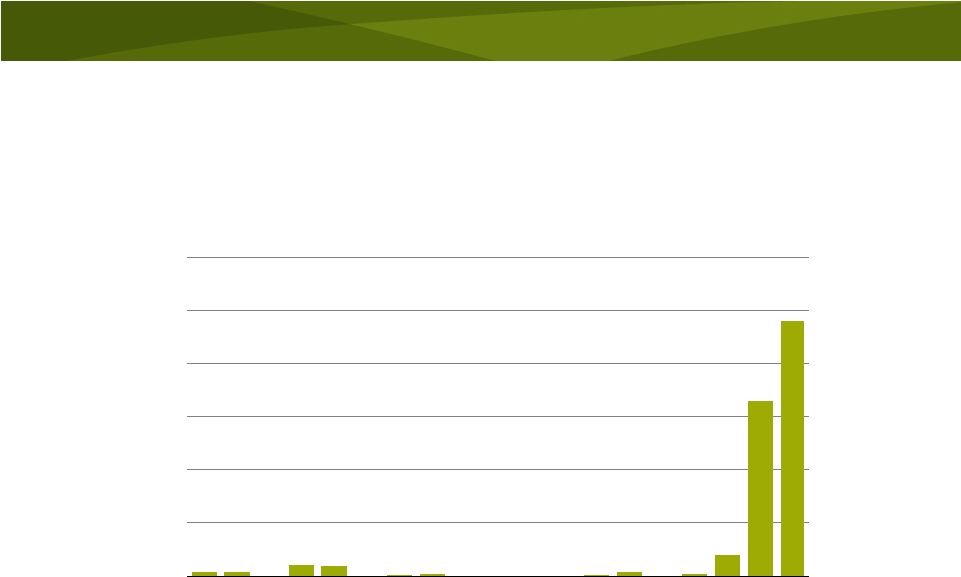
 U.S. DAP/MAP/MES production has
remained steady at about 14 million tons
15
0.0
3.0
6.0
9.0
12.0
15.0
18.0
21.0
95
96
97
98
99
00
01
02
03
04
05
06
07
08
09
10
11
12F
Mil Tons
U.S. DAP and MAP/MES Production
Source: TFI and Mosaic
Fertilizer Year Ending June 30 |
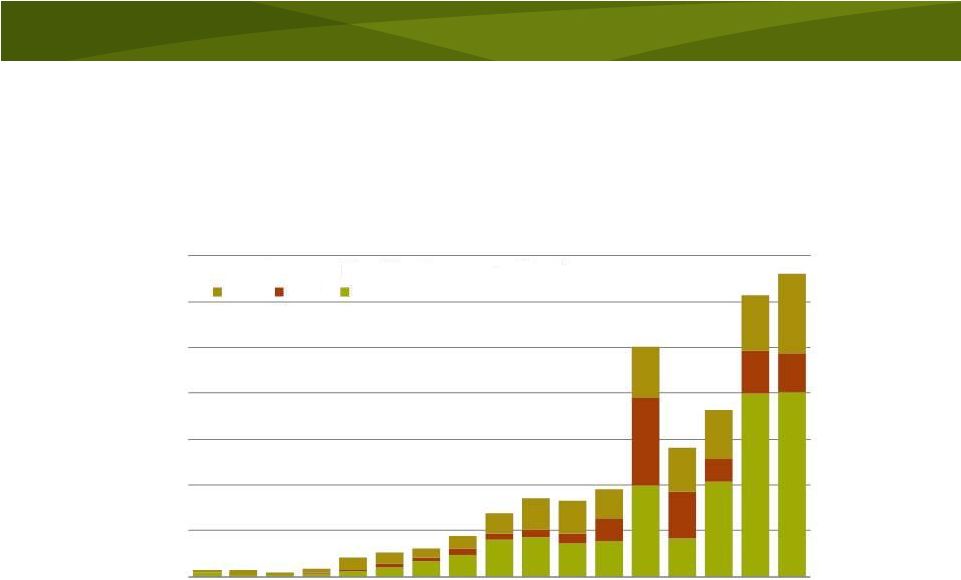
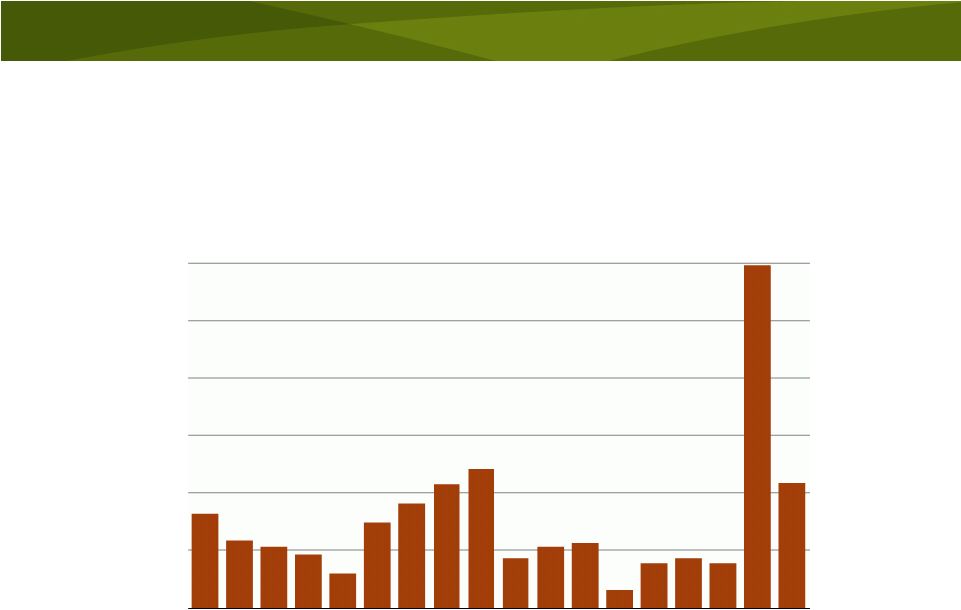 Record shattering U.S. imports in 2010/11
but significantly less expected in 2011/12
16
0.0
0.2
0.4
0.6
0.8
1.0
1.2
95
96
97
98
99
00
01
02
03
04
05
06
07
08
09
10
11
12F
Mil Tons
U.S. DAP and MAP Imports
Source: TFI, USDOC, and Mosaic
Fertilizer Year Ending June 30 |
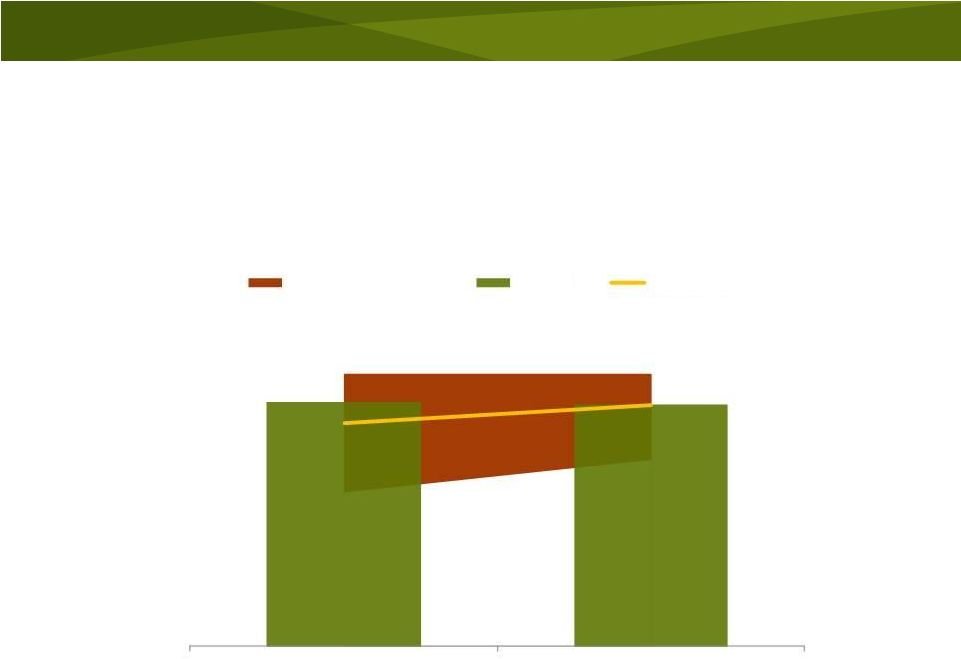
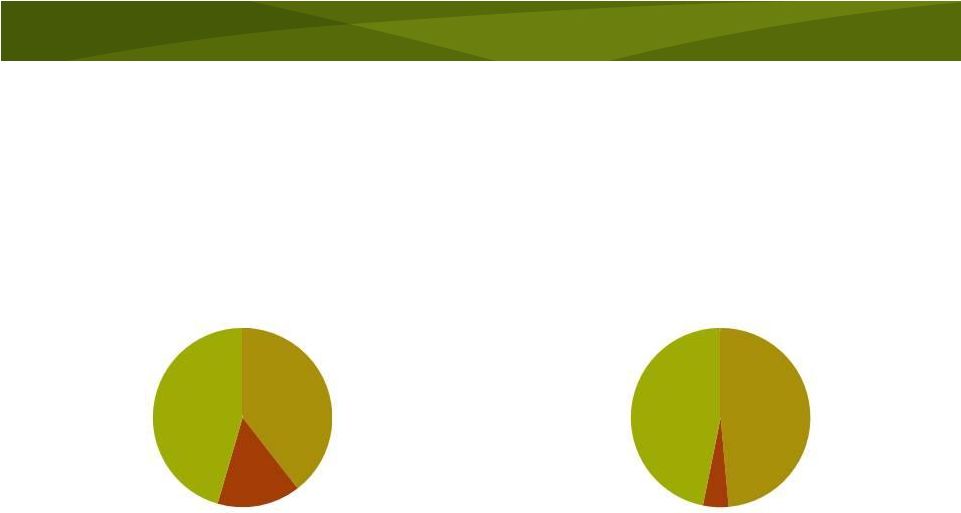 North American offshore imports have
declined from record levels in 2010/11
17
Mosaic 39.5%
Imports
15.0%
Other NA
45.5%
North American Phosphate Shipments
2010/11
Mosaic 48.6%
Imports 4.6%
Other NA
46.8%
North American Phosphate Shipments
2011/12 YTD |
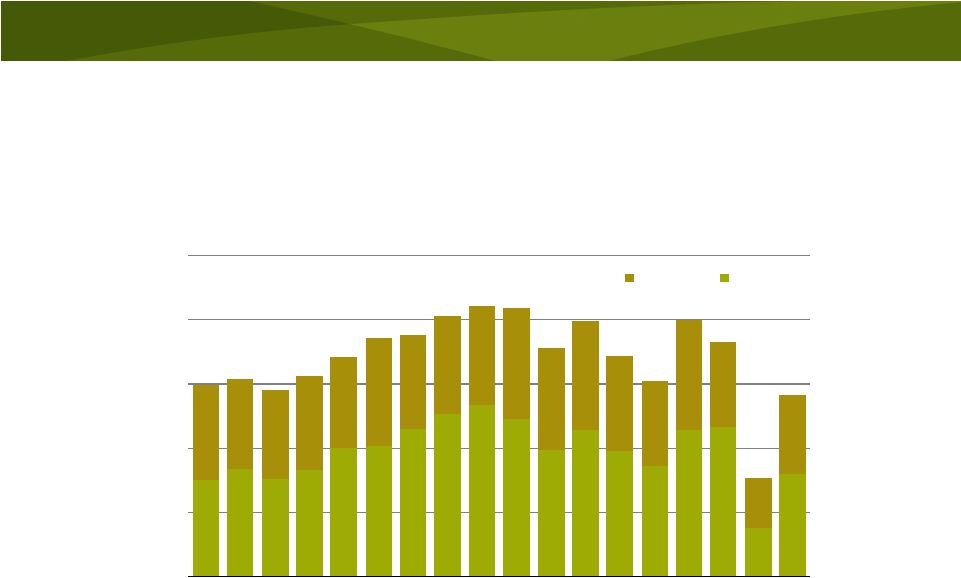
 U.S. DAP/MAP producer stocks have
increased but remain within recent ranges
18
0.0
0.2
0.4
0.6
0.8
1.0
1.2
1.4
1.6
1.8
2.0
Jul
07/08
Oct
Jan
Apr
Jul
08/09
Oct
Jan
Apr
Jul
09/10
Oct
Jan
Apr
Jul
10/11
Oct
Jan
Apr
Jul
11/12
Oct
Jan
Mil Tons
U.S. DAP and MAP Producer Stocks
Source: TFI |
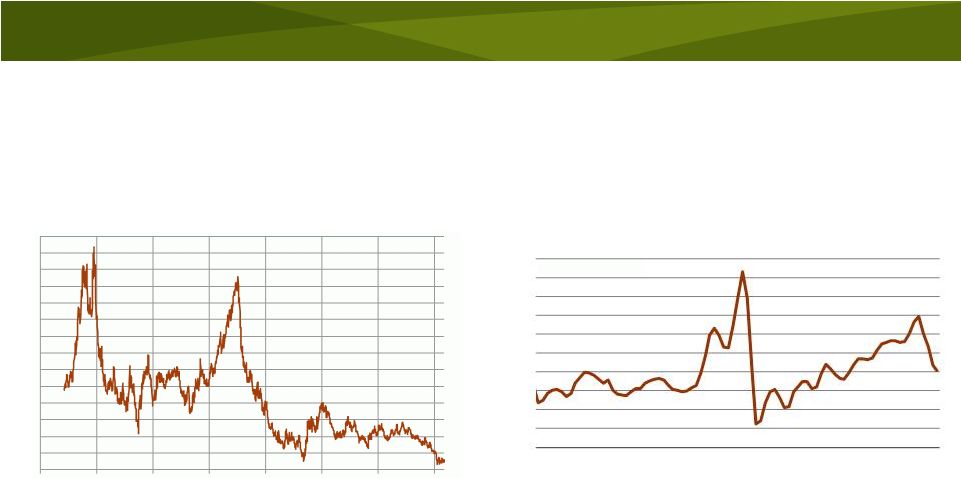
 Lower and less volatile raw materials costs
19
0
100
200
300
400
500
600
700
05
06
07
08
09
10
11
12
$ LT
Sulphur Prices
c&f Tampa
Source: Green Markets
0
50
100
150
200
250
05
06
07
08
09
10
11
12
$ MT
Phosphate Rock Prices
fob Morocco
Source: Fertilizer Week |
 Lower and less volatile raw materials costs
20
2
3
4
5
6
7
8
9
10
11
12
13
14
15
16
Jan 05
Jan 06
Jan 07
Jan 08
Jan 09
Jan 10
Jan 11
Jan 12
$ MM Btu
Henry Hub Natural Gas Price
Daily Closing Price of the Front Month Contract
Source: NYMEX
0
100
200
300
400
500
600
700
800
900
1000
05
06
07
08
09
10
11
12
$ MT
Ammonia Prices
c&f Tampa
Source: Fertecon |
 Several Uncertainties
Indian demand
Chinese exports
Ma’aden ramp-up
Arab Spring production disruptions
21 |
 Impact of higher retail prices on Indian demand
22
Rupees Tonne Unless Noted
2010/11
2011/12 FH
2011/12 SH
2012/13A
2012/13B
2012/13C
(1)
DAP Contract Price c&f India (US$ Tonne)
$500
$612
$677
$525
$565
$600
(2)
Rupee/US$ (Average for Period or Forecast)
45.6
45.3
50.6
49.5
49.5
49.5
(3)
DAP Contract Price c&f India Duty Unpaid
22,785
27,703
34,262
25,988
27,968
29,700
(4)
DAP Contract Price c&f India Duty/Taxes Paid+Insurance
23,998
29,464
36,425
27,643
29,744
31,583
(5)
Estimated Bogey from Vessel to Retail Shelf
2,400
2,400
2,400
2,400
2,400
2,400
(6)
Estimated Cost Retail Shelf
26,398
31,864
38,825
30,043
32,144
33,983
(7)
Subsidy (excluding primary and secondary freight subsidy)
16,268
19,763
19,763
14,348
14,348
18,288
(8)
Implied Retail Price
10,130
12,101
19,062
15,695
17,796
15,695
(9)
Percent Change
8%
19%
88%
-18%
-7%
-18%
The Maximum Retail Price of DAP was unchanged at R9350 from April 2002 to
April 2010. Scenario A - Based on recent bids for spot cargos at
$525 tonne c&f India and the approved subsidy level of R14,348 tonne.
Scenario B - Based on Q1 acid price of $960 tonne c&f India, a spot
ammonia price of $375 tonne c&f India and the approved subsidy of R14,348 tonne.
Scenario C - Based on spot price plus a risk premium for potential
sulphur and ammonia price increases. Solves for subsidy to achieve Scenario A retail price.
0.0
1.0
2.0
3.0
4.0
5.0
6.0
7.0
8.0
9.0
95
96
97
98
99
00
01
02
03
04
05
06
07
08
09
10
11E
Mil Tonnes
India Processed Phosphate Import Demand
Source: Fertecon, IFA and Mosaic
TSP
MAP
DAP |
 Chinese exports in 2012
23
0.0
1.0
2.0
3.0
4.0
5.0
6.0
7.0
95
96
97
98
99
00
01
02
03
04
05
06
07
08
09
10
11E
Mil Tonnes
China Processed Phosphate Export Supply
TSP
MAP
DAP
Source: Fertecon, IFA, China Customs and Mosaic |
 Ma’aden ramp-up
24
0.0
0.5
1.0
1.5
2.0
2.5
3.0
95
96
97
98
99
00
01
02
03
04
05
06
07
08
09
10
11E
12F
13F
Mil Tonnes
Saudi Arabia DAP Export Supply
Source: Fertecon |
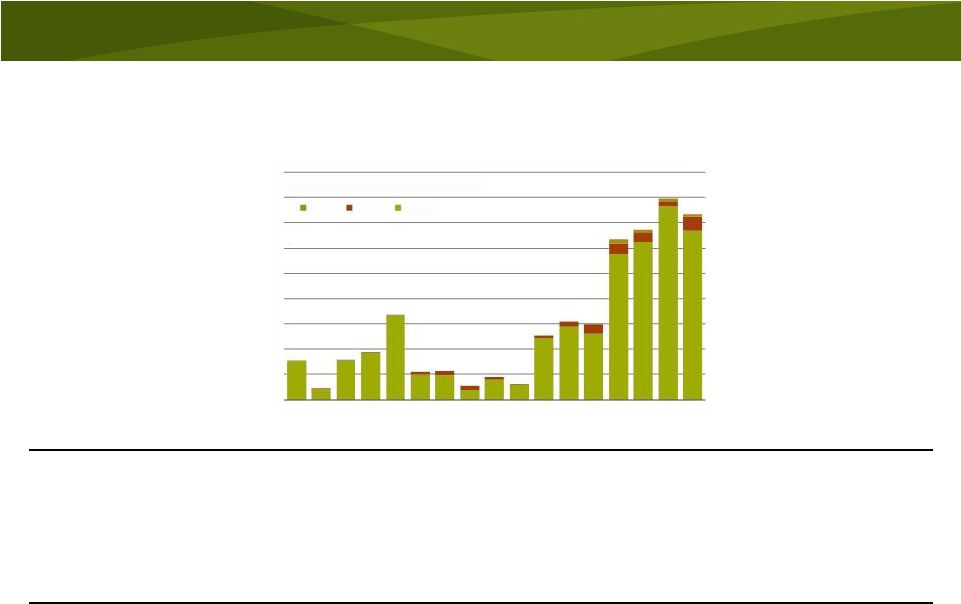
 Arab Spring production disruptions
25
0.0
0.5
1.0
1.5
2.0
2.5
95
96
97
98
99
00
01
02
03
04
05
06
07
08
09
10
11E
12F
Mil Tonnes
Tunisia Processed Phosphate Export Supply
TSP
DAP
Source: Fertecon |
 Key Factors to Handicap
Agricultural commodity prices
-
Weather
–
beware
a
big
supply
response
-
Political
and
economic
developments
–
impact
on
energy
prices and the value of the dollar
-
Speculative positions
The Uncertainties
-
Indian demand
-
Chinese exports
-
Ma’aden ramp-up
-
Arab Spring
Sentiment and Intangibles
-
Buyer caution
-
Price expectations and channel inventories
-
Marketing strategies of suppliers with new capacity or new
product mix
26 |
 Long Term Outlook |
 Expected
Developments
28
Strong demand growth underpinned by the food
and energy stories
-
Relatively high commodity prices
-
Profitable farm economics
-
Global phosphate demand growth of 2.5%-3.0% per year
-
DAP/MAP/TSP shipment growth of ~3% per year
Net capacity increases expected to keep pace
with demand growth
Nearly all of the projected demand and capacity
growth outside North America
North American industry projected to remain a
large and stable producer and exporter |
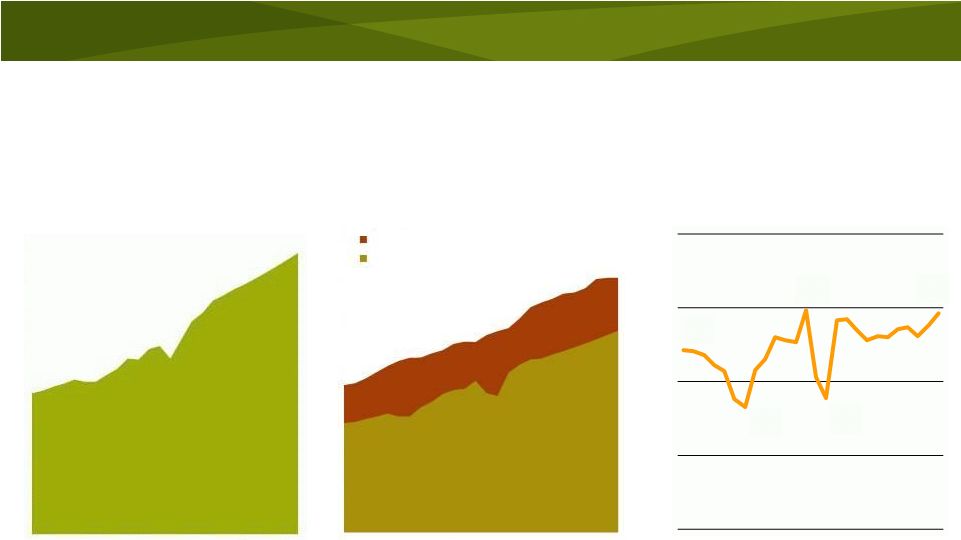
 The
food story by the numbers 29
1,000
1,500
2,000
2,500
3,000
3,500
4,000
4,500
5,000
5,500
80
85
90
95
00
05
10
15
20
25
30
50
Mil Tonnes
Source: USDA and Mosaic
World Grain and Oilseed Use
Actual for U.S. Ethanol
Actual
Forecast for U.S. Ethanol
Forecast
1.
Population growth and increases in per capital GDP
are expected to generate steady and predictable
increases in global grain and oilseed (food) demand.
2.
Farmers around the globe will need to harvest record
area and produce yields that exceed the 30-year
trend in order to meet projected demand.
3.
Additional harvested area and higher yields will drive
continued increases in crop nutrient demand.
2
3
1
Connecting
the
Dots
60
80
100
120
140
160
180
200
220
80
85
90
95
00
05
10
15
20
Mil Tonnes
World Crop Nutrient Use
Actual -
FSU
Actual -
ROW
Mosaic Model
IFA
Fertecon
Mosaic Survey
1.75
2.00
2.25
2.50
2.75
3.00
3.25
3.50
3.75
4.00
750
775
800
825
850
875
900
925
950
975
80
85
90
95
00
05
10
15
20
25
30
MT Ha
Mil Ha
Source: USDA and Mosaic
World Harvested Area and Average Yield
Actual Area
Forecast Area
Actual Yield
Required Yield
1980-10 Yield Trend
2000-10 Yield Trend |
 Positive long term outlook
30
World Acid Production
Million Tonnes P
O
5
2
0
10
20
30
40
50
60
70
95
00
05
10
15
20
Capacity
Production to Meet Demand
0
10
20
30
40
50
60
70
80
95
00
05
10
15
20
World Phosphate Shipments
Million Tonnes DAP/MAP/MES/TSP
74%
66%
80%
68%
79%
50%
60%
70%
80%
90%
95
00
05
10
15
20
World Acid Operating Rates |
 The Evolving Role of the U.S. Industry |
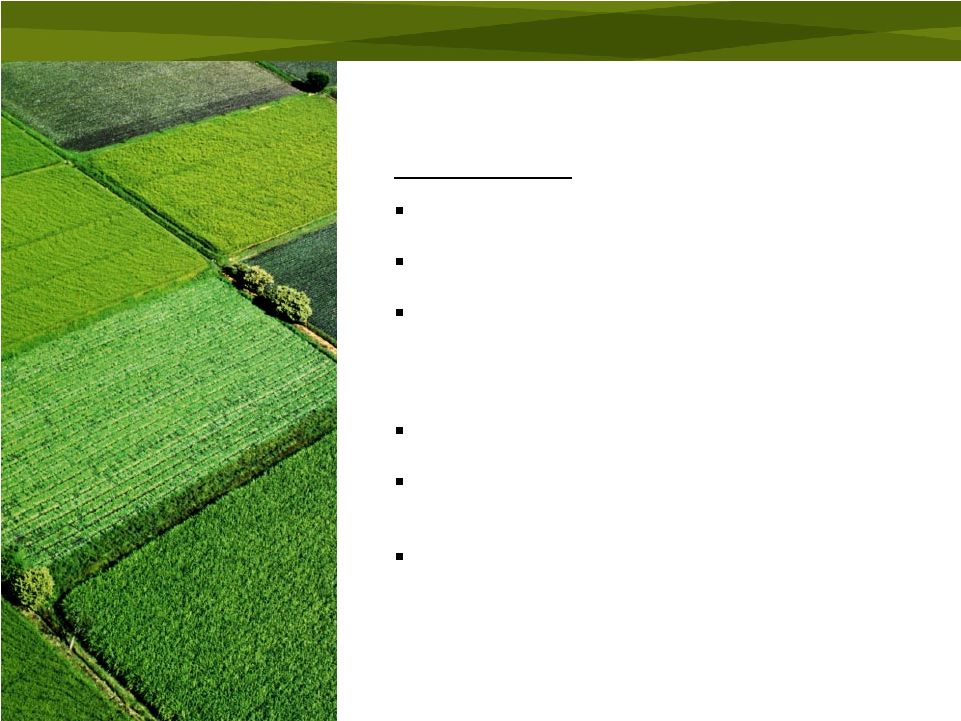 Expected
Evolution
32
Lesser role in a growing global market but . . .
Still a large and stable U.S. industry
Focus on maintaining a competitive advantage
-
Florida
–
large
scale,
low
cost
rock
mining
operations
-
Louisiana
–
cost
advantaged
sulphur,
ammonia
and
access
to major U.S. agricultural regions
Focus on productivity/efficiency enhancements
Focus on innovative premium products
More limited geographic reach but . . .
-
Moving further down the value chain
-
Marketing innovative premium products
-
Focusing on high productivity agricultural systems
-
Shipping to freight advantaged regions
The next generation of crop nutrients for the next generation of farming |
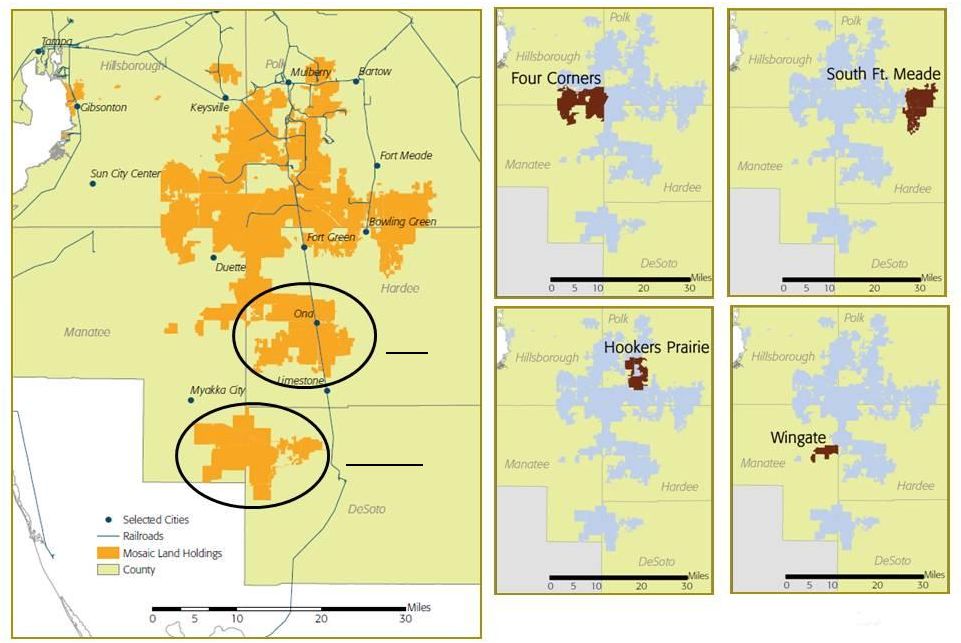 33
Rock is our competitive advantage in Florida
Ona
DeSoto |
 Our
Florida operations have more than 45 years of rock reserves
34
Our Florida chemical plants require
about 11.8 million tonnes of rock per
year when running at 90% of
capacity.
Our current reserves are sufficient
to run our Florida operations for
more than 45 years.
Source: Mosaic 2010/11 10-K.
Phosphate Rock Reserves
Reserve
Average
Percent
Unit: million tonnes
Tonnes
BPL
P
2
O
5
Active Mines
Four Corners, FL
53.6
65.9
30.2
South Fort Meade, FL
53.8
64.2
29.4
Hookers Prairie, FL
5.7
65.5
30.0
Wingate, FL
36.5
63.5
29.1
Total Active Mines
149.6
64.2
29.4
Future Mines
Ona
245.5
63.5
29.0
DeSoto
148.0
64.8
29.7
Total Future Mining
393.5
64.0
29.3
Total Mining
543.1
64.2
29.4 |
 35
Innovative Premium Products
MicroEssentials
®
deliver significant value
-
Sulphur in elemental and sulphate form as well as
micronutrients ribboned throughout each granule
-
Yield increases of 3%-7% based on field trials conducted
during the last 10 years
-
Largest yield boost in the most intensive cropping systems
Rapid adoption of MicroEssentials
®
-
Production of 1.3 million tonnes in CY 2011, up from 1.0
million tonnes in 2010
-
Marketed to strategic customers in both North America and
key offshore geographies
Investing in expected future demand growth
-
Produced today in two granulation plants at Bartow and
Riverview with annual capacity of ~1.5 million tonnes
-
Capacity will increase to 2.3 million tonnes in April 2012
with the conversion of our Faustina C train
-
Projects under evaluation to increase capacity to match
expected demand growth |
 North American Phosphate Outlook
Dr. Michael Rahm
Vice President
Market and Strategic Analysis
CRU Phosphates 2012 Conference
Hotel Mazagan
El-Jadida, Morocco
March 19-21, 2012
Thank You! |