UNITED STATES
SECURITIES AND EXCHANGE COMMISSION
Washington, D.C. 20549
FORM 8-K
CURRENT REPORT
Pursuant to Section 13 or 15(d) of the Securities Exchange Act of 1934
Date of Report (Date of earliest event reported): March 14, 2012
|
Eagle Bulk Shipping Inc.
|
||
|
(Exact name of registrant as specified in its charter)
|
||
|
Republic of the Marshall Islands
|
001-33831
|
98-0453513
|
|
(State or other jurisdiction of incorporation or organization)
|
(Commission File Number)
|
(IRS employer identification no.)
|
|
477 Madison Avenue
New York, New York
|
10022
|
|
|
(Address of principal executive offices)
|
(Zip Code)
|
|
(Registrant's telephone number, including area code): (212) 785-2500
(Former Name or Former Address, if Changed Since Last Report): None
Check the appropriate box below if the Form 8-K filing is intended to simultaneously satisfy the filing obligation of the registrant under any of the following provisions (see General Instruction A.2. below):
|
[_]
|
Written communications pursuant to Rule 425 under the Securities Act (17 CFR 230.425)
|
|
[_]
|
Soliciting material pursuant to Rule 14a-12 under the Exchange Act (17 CFR 240.14a-12)
|
|
[_]
|
Pre-commencement communications pursuant to Rule 14d-2(b) under the Exchange Act (17 CFR 240.14d-2(b))
|
|
[_]
|
Pre-commencement communications pursuant to Rule 13e-4(c) under the Exchange Act (17 CFR 240.13e-4(c))
|
Item 2.02. Results of Operations and Financial Condition
On March 14, 2012, Eagle Bulk Shipping Inc. (the "Company") issued a press release (the "Press Release") relating to its financial results for the fourth quarter and fiscal year ended December 31, 2011.
In accordance with General Instruction B.2 to the Form 8-K, the information under this Item 2.02 and the Press Release, attached hereto as Exhibit 99.1, shall be deemed to be "furnished" to the Securities and Exchange Commission (the "SEC") and not be deemed to be "filed" with the SEC for purposes of Section 18 of the Exchange Act or otherwise subject to the liabilities of that section.
Item 8.01. Other Events
On March 15, 2012, the Company posted on its website, www.eagleships.com, under the section entitled "Investors - Webcasts & Presentations" a presentation dated March 15, 2012 of its financial results for the full year and fourth quarter ended December 31, 2011. A copy of the presentation is hereby furnished to the SEC and is attached as Exhibit 99.2.
Item 9.01. Financial Statements and Exhibits
(d) Exhibits
|
Exhibit Number
|
Description
|
|
|
|
|
99.1
|
Press Release dated March 14, 2012.
|
| 99.2 | Financial Presentation dated March 15, 2012. |
SIGNATURES
Pursuant to the requirements of the Securities Exchange Act of 1934, the registrant has duly caused this report to be signed on its behalf by the undersigned hereunto duly authorized.
|
EAGLE BULK SHIPPING INC.
|
||
|
(registrant)
|
||
|
Dated: March 19, 2012
|
By:
|
/s/ Alan S. Ginsberg
|
|
Name:
|
Alan S. Ginsberg
|
|
|
Title:
|
Chief Financial Officer
|
|
EXHIBIT INDEX
|
Exhibit No.
|
Description
|
|
99.1
99.2
|
Press Release dated March 14, 2012.
Financial Presentation dated March 15, 2012. |
|
Press Release
|
Exhibit 99.1
|
Eagle Bulk Shipping Inc. Reports Fourth Quarter and Fiscal Year 2011 Results
NEW YORK, NY, March 14, 2012-- Eagle Bulk Shipping Inc. (Nasdaq: EGLE) today announced its results for the fourth quarter and fiscal year ended December 31, 2011.
For the Fourth Quarter:
|
|
·
|
Net reported loss of $1.7 million or $0.03 per share (based on a weighted average of 62,700,719 diluted shares outstanding for the quarter), compared to net income of $3.03 million, or $0.05 per share, for the comparable quarter in 2010.
|
|
|
·
|
Net revenues of $70.0 million, compared to $72.4 million for the comparable quarter in 2010. Gross time charter and freight revenues of $71.7 million, compared to time charter revenues of $75.6 million for the comparable quarter in 2010.
|
|
|
·
|
EBITDA, as adjusted for exceptional items under the terms of the Company's credit agreement, was $30.0 million for the fourth quarter of 2011, compared with $32.9 million for the fourth quarter of 2010.
|
|
|
·
|
Fleet utilization rate of 99.7%.
|
|
|
·
|
Took delivery of the Sandpiper Bulker, the last vessel of our newbuilding program.
|
For the Fiscal Year 2011:
|
|
·
|
Net reported loss of $14.8 million or $.24 per share (based on a weighted average of 62,621,771 diluted shares outstanding for the year), compared to net income of $26.8 million, or $0.43 per share, for the comparable fiscal year in 2010.
|
|
|
·
|
Net revenues of $313.4 million, an increase of 18% compared to $265.0 million for the comparable year in 2010. Gross time charter and freight revenues increased 18% to $327.2 million, compared to gross time charter and freight revenues of $278.5 million for the comparable year in 2010.
|
|
|
·
|
EBITDA, as adjusted for exceptional items under the terms of the Company's credit agreement, was $108.9 million for the year of 2011, compared with $148.7 million for the year of 2010.
|
|
|
·
|
Fleet utilization rate of 99.4%.
|
|
|
·
|
Took delivery of eight newbuilding vessels and sold the Heron, 2001-built Supramax.
|
Sophocles N. Zoullas, Chairman and CEO, commented, "With the completion of our newbuilding program in 2011, Eagle Bulk now operates a fleet of 45 homogenous vessels with an average age of 4.8 years. We believe our Supramax vessels will continue to demonstrate resilience through their optimal size, diversified cargo mix, onboard cranes, and general supply/demand fundamentals as compared to other asset classes.
"We are realistic about the year ahead. Newbuilding deliveries flooded the market in January, and while demand is steady, it is insufficient at this point to meet unfavorable supply dynamics. Our singular focus in this environment is to continue our record of operational and commercial excellence while working towards a satisfactory agreement with our lenders. We will update the market accordingly going forward."
Results of Operations for the three-month period ended December 31, 2011 and 2010
For the fourth quarter of 2011, the Company reported a net loss of $1,698,979 or $0.03 per share, based on a weighted average of 62,700,719 diluted shares outstanding. In the comparable fourth quarter of 2010, the Company reported net income of $3,032,942 or $0.05 per share, based on a weighted average of 62,629,178 diluted shares outstanding.
The Company's revenues were earned from time and voyage charters. Gross revenues in the quarter ended December 31, 2011 were $71,704,158, a decrease of 5% from $75,641,650 recorded in the comparable quarter in 2010. The decrease in gross revenues is attributable to lower charter rates offset by operation of a larger fleet. Gross revenues recorded in the quarter ended December 31, 2011 and 2010, include an amount of $1,254,697 and $1,330,202, respectively, relating to the non-cash amortization of fair value below contract value of time charters acquired. Brokerage commissions incurred on revenues earned in the quarter ended December 31, 2011 and 2010 were $1,693,259 and $3,287,732, respectively. Net revenues during the quarter ended December 31, 2011, decreased 3% to $70,010,899 from $72,353,918 in the comparable quarter in 2010.
Total operating expenses for the quarter ended December 31, 2011 were $60,857,843 compared with $57,502,627 recorded in the fourth quarter of 2010. The Company operated 45 vessels in the fourth quarter of 2011 compared with 38 vessels in the corresponding quarter in 2010. The increase in operating expenses was primarily due to increase in operating a larger fleet size which includes increases in vessels crew cost and vessel depreciation expense.
EBITDA, adjusted for exceptional items under the terms of the Company's credit agreement, decreased to $29,989,681 for the fourth quarter of 2011, compared with $32,925,831 for the fourth quarter of 2010. (Please see below for a reconciliation of EBITDA to net income/loss).
Results of Operations for the twelve-month period ended December 31, 2011 and 2010
For the twelve months ended December 31, 2011, the Company reported net loss of $14,819,749 or $0.24 per share, based on a weighted average of 62,621,771 diluted shares outstanding. In the comparable period of 2010, the Company reported net income of $26,844,650 or $0.43 per share, based on a weighted average of 62,417,247 diluted shares outstanding.
The Company's revenues were earned from time and voyage charters. Gross revenues for the twelve-month period ended December 31, 2011 were $327,210,063, an increase of 18% from $278,476,584 recorded in the comparable period in 2010. The increase in gross revenues is attributable to operation of a larger fleet as reflected by the increased operating days, offset by lower charter rates earned. Gross revenues recorded in the twelve-month period ended December 31, 2011 and 2010, include an amount of $5,088,268 and $4,754,407, respectively, relating to the non-cash amortization of fair value below contract value of time charters acquired. Brokerage commissions incurred on revenues earned in the twelve-month periods ended December 31, 2011 and 2010 were $13,777,632 and $13,440,518, respectively. Net revenues during the twelve-month period ended December 31, 2011, increased 18% to $313,432,431 from $265,036,066 in the comparable period in 2010.
Total operating expenses were $281,764,140 in the twelve-month period ended December 31, 2011 compared to $189,376,882 recorded in the same period of 2010. The increase in operating expenses was primarily due to increase in voyage expenses, charter hire expenses and operating a larger fleet size which includes increases in vessels crew cost, insurance cost and vessel depreciation expense.
EBITDA, adjusted for exceptional items under the terms of the Company's credit agreement, decreased by 27% to $108,853,142 for the twelve months ended December 31, 2011 from $148,663,208 for the same period in 2010. (Please see below for a reconciliation of EBITDA to net income/loss).
Legal Proceedings
We evaluated the KLC matter to make a determination as to the impact, if any, on our business, liquidity, results of operations, financial condition and cash flows, and recorded an initial allowance for bad debt in the first quarter of 2011 of $6,586,900, which was updated in the fourth quarter of 2011 to reflect the settlement on November 24, 2011. Accordingly, we adjusted the allowance to $1,811,320, which reflects our recovery of $1,269,070 and write off of $3,506,510. As of December 31, 2011, KLC is not performing in accordance with the $17,000 per vessel per day shortfall arrangement and KLC owes us approximately $4.9 million relating to fourth quarter activities. That revenue does not meet our revenue recognition policy and is not included in our financial statements. We will recognize that revenue and any future revenue from KLC when collectability is assured.
Liquidity and Capital Resources
Net cash provided by operating activities during the years ended December 31, 2011 and 2010 was $58,296,117 and $94,339,830, respectively. The change in 2011 and 2010 was primarily due to lower rates on time charter renewals offset by cash generated from operation of the fleet for 17,514 days in 2011, compared to 13,274 operating days in 2010.
Net cash used in investing activities during the twelve-month period ended December 31, 2011, was $157,786,210, compared to $280,995,791 during the corresponding twelve-month period ended December 31, 2010. Investing activities during the twelve-month period ended December 31, 2011 and 2010 related primarily to making progress payments and incurring related vessel construction expenses for the newbuilding vessels, of which eight and twelve delivered during the first twelve months of 2011 and 2010, respectively.
Net cash used in financing activities in 2011 was $4,556,384, compared to net cash provided by of $244,432,868 in 2010. In 2011, we repaid $21,875,735 toward our revolving facility, and as part of our sixth amendatory and commercial framework agreement with our lenders we reduced our restricted cash by $19,000,000. In 2010 we borrowed $251,183,596 from our revolving credit facility which was used to partly fund advances for construction of newbuilding vessels, twelve of which, Golden Eagle, Imperial Eagle, Thrasher, Crane, Egret Bulker, Avocet, Gannet Bulker, Grebe Bulker, Ibis Bulker, Jay, Kingfisher and Martin delivered during the year.
As of December 31, 2011, our cash balance was $25,075,203 compared to a cash balance of $129,121,680 at December 31, 2010. In addition, our restricted cash balance includes $276,056, for collateralizing letters of credit relating to our office leases and $394,362 which collateralize our derivatives positions as of December 31, 2011.
At December 31, 2011, the Company's debt consisted of $1,129,478,741 in net borrowings under the amended Revolving Credit Facility, which funded the Company's newbuilding program.
On September 26, 2011, we entered into the Sixth Amendatory and Commercial Framework Implementation Agreement (the "Sixth Amendment") to the Third Amended and Restated Credit Agreement dated October 19, 2007, most of the provisions of this Sixth Amendment, unless amended, expire on April 30, 2012. Among other provisions, the Sixth Amendment suspends the Company's compliance with the Minimum Adjusted Net Worth covenant until April 30, 2012 for accounting periods ended March 31, 2011, June 30, 2011, September 30, 2011, and December 31, 2011, and suspends compliance with the Minimum Liquidity covenant until January 30, 2012. From January 31, 2012 until March 30, 2012, the Minimum Liquidity covenant is reduced to $500,000 multiplied by the number of vessels owned and from March 31 until April 29, 2012 the Company is required to maintain cash and cash equivalents in the amount of $27,000,000 and at April 30, 2012 in the amount of $36,000,000. Until April 30, 2012, the calculation of Minimum Liquidity covenant includes undrawn facility amounts as cash and cash equivalents. As of December 31, 2011 the undrawn amount is $21,875,735. In addition to the Minimum Liquidity covenant, the Sixth Amendment requires the Company to obtain the lenders' consent for additional vessel dispositions during the commercial framework period, and to make reasonable efforts to meet certain reporting requirements to the lenders. The Company was in compliance with all of the covenants related to this Sixth Amendment as of December 31, 2011 and expects to be in compliance through all covenants in effect in 2012 through the April 30, 2012 expiration of the Sixth Amendment.
At the end of the commercial framework period we will provide to our lenders the compliance certificates for the deferred periods. As described in note 6, on August 4, 2009, we entered into a third amendatory agreement to our revolving credit facility. Among other things, the third amendatory agreement reduced the facility to $1.2 billion and changed the applicable interest rate to 2.5% over LIBOR. In addition, among other changes, the third amendatory agreement amended the facility's net worth covenant from a market value to book value measurement with respect to the value of our fleet and reduced the facility's EBITDA to interest coverage ratio, with these changes to stay in effect until we were in compliance with the facility's original covenants for two consecutive accounting periods. Based on information which we provided in 2010 to the lenders under the revolving credit facility, the agent for the lenders notified us that according to its interpretation we were in compliance with the original covenants for the second and third quarters during 2010, and, therefore, our original collateral covenants have been reinstated. We disagree with the interpretation of the original covenant calculation being used by the agent and have advised the agent that we were not in compliance with the original covenants for these two consecutive quarters, and, therefore, the amended collateral covenants should remain in place. Under the agent's interpretation of the covenant, we were in compliance both with the original collateral covenants and the amended collateral covenants during the accounting period ended December 31, 2010. We have remained in compliance with the amended collateral covenants during the accounting periods ended March 31, 2011, June 30, 2011, September 30, 2011, and December 31, 2011, but would not have been in compliance for these periods under the agent's interpretation of the original collateral covenants. We believe that our interpretation of the facility agreement's covenant calculation is correct, that the reinstatement of the original loan covenant has not occurred, and that we remain in compliance with all covenants in effect at December 31, 2011. However, if the agent's interpretation is determined to be correct, we would not be in compliance with the original covenants for the periods ending March 31, 2011, June 30, 2011, September 30, 2011, and December 31, 2011, which would constitute a default under the facility agreement and would result in the classification as current of the amounts due under the facility agreement and would lead to substantial doubt about our ability to continue as a going concern, if we are unable to agree on satisfactory alternative terms or obtain a waiver from the lenders. We are in discussions with our lenders as part of the Sixth Amendment to either amend the facility's amortization schedule or the covenants then in effect. Although there is no assurance that we will be successful in doing so, we continue to seek a satisfactory agreement with our lenders.
Disclosure of Non-GAAP Financial Measures
EBITDA represents operating earnings before extraordinary items, depreciation and amortization, interest expense, and income taxes, if any. EBITDA is included because it is used by certain investors to measure a company's financial performance. EBITDA is not an item recognized by GAAP and should not be considered a substitute for net income, cash flow from operating activities and other operations or cash flow statement data prepared in accordance with accounting principles generally accepted in the United States or as a measure of profitability or liquidity. EBITDA is presented to provide additional information with respect to the Company's ability to satisfy its obligations including debt service, capital expenditures, and working capital requirements. While EBITDA is frequently used as a measure of operating results and the ability to meet debt service requirements, the definition of EBITDA used here may not be comparable to that used by other companies due to differences in methods of calculation.
The following table is a reconciliation of net income, as reflected in the consolidated statements of operations, to the Credit Agreement EBITDA:
|
Three Months Ended
|
Twelve Months Ended
|
|||||||||||||||
|
December 31, 2011
|
December 31, 2010
|
December 31, 2011
|
December 31, 2010
|
|||||||||||||
|
Net income (loss)
|
$
|
(1,698,979)
|
$
|
3,032,942
|
$
|
(14,819,749)
|
$
|
26,844,650
|
||||||||
|
Interest expense
|
11,370,603
|
11,668,048
|
46,769,965
|
48,885,674
|
||||||||||||
|
Depreciation and amortization
|
19,624,596
|
16,508,187
|
73,084,105
|
62,945,478
|
||||||||||||
|
Amortization of fair value below contract value of time charter acquired
|
(1,254,697
|
)
|
(1,330,202
|
)
|
(5,088,268
|
)
|
(4,754,407
|
)
|
||||||||
|
EBITDA
|
28,041,523
|
29,878,975
|
99,946,053
|
133,921,395
|
||||||||||||
|
Adjustments for exceptional items:
|
||||||||||||||||
|
Non-cash compensation expense (1)
|
1,948,158
|
3,046,856
|
8,907,089
|
14,741,813
|
||||||||||||
|
Credit agreement EBITDA
|
$
|
29,989,681
|
$
|
32,925,831
|
$
|
108,853,142
|
$
|
148,663,208
|
||||||||
(1) Stock based compensation related to stock options and restricted stock units.
Capital Expenditures and Drydocking
Our capital expenditures relate to the purchase of vessels and capital improvements to our vessels which are expected to enhance the revenue earning capabilities and safety of these vessels.
We make capital expenditures from time to time in connection with our vessel acquisitions. As of December 31, 2011, our fleet consisted of 43 Supramax and 2 Handymax vessels.
In addition to acquisitions that we may undertake in future periods, the Company's other major capital expenditures include funding the Company's program of regularly scheduled drydocking necessary to comply with international shipping standards and environmental laws and regulations. Although the Company has some flexibility regarding the timing of its dry docking, the costs are relatively predictable. Management anticipates that vessels are to be drydocked every two and a half years. Funding of these requirements is anticipated to be met with cash from operations. We anticipate that this process of recertification will require us to reposition these vessels from a discharge port to shipyard facilities, which will reduce our available days and operating days during that period.
Drydocking costs incurred are deferred and amortized to expense on a straight-line basis over the period through the date of the next scheduled drydocking for those vessels. In 2011, four of our vessels were drydocked and we incurred $2,809,406 in drydocking related costs. In 2010, five of our vessels were drydocked and we incurred $2,827,534 in drydocking related costs. In 2009, eight of our vessels were drydocked and we incurred $4,477,244 in drydocking related costs. The following table represents certain information about the estimated costs for anticipated vessel drydockings in the next four quarters, along with the anticipated off-hire days:
|
Quarter Ending
|
Off-hire Days(1)
|
Projected Costs(2)
|
||||||
|
March 31, 2012
|
30 |
$0.75 million
|
||||||
|
June 30, 2012
|
- | - | ||||||
|
September 30, 2012
|
15 |
$0.35 million
|
||||||
|
December 31, 2012
|
22 |
$0.55 million
|
||||||
|
(1)
|
Actual duration of drydocking will vary based on the condition of the vessel, yard schedules and other factors.
|
|
(2)
|
Actual costs will vary based on various factors, including where the drydockings are actually performed.
|
Summary Consolidated Financial and Other Data:
The following table summarizes the Company's selected consolidated financial and other data for the periods indicated below.
CONSOLIDATED STATEMENT OF OPERATIONS
|
Three Months Ended (unaudited)
|
Twelve Months Ended
|
|||||||||||||||
|
December 31, 2011
|
December 31, 2010
|
December 31, 2011
|
December 31, 2010
|
|||||||||||||
|
Revenues, net of commissions
|
$ | 70,010,899 | $ | 72,353,918 | $ | 313,432,431 | $ | 265,036,066 | ||||||||
|
Voyage expenses
|
8,403,814 | 2,288,326 | 44,345,774 | 3,726,847 | ||||||||||||
|
Vessel expenses
|
22,285,822 | 22,492,719 | 85,049,671 | 72,983,630 | ||||||||||||
|
Charter hire expenses
|
3,202,586 | 7,144,697 | 41,215,875 | 9,982,677 | ||||||||||||
|
Depreciation and amortization
|
19,624,596 | 16,508,187 | 73,084,105 | 62,945,478 | ||||||||||||
|
General and administrative expenses
|
7,341,025 | 9,068,698 | 37,559,639 | 40,029,261 | ||||||||||||
|
Loss (gain) from sale of vessel
|
- |
-
|
509,076 | (291,011 | ) | |||||||||||
|
Total operating expenses
|
60,857,843 | 57,502,627 | 281,764,140 | 189,376,882 | ||||||||||||
|
Operating income
|
9,153,056 | 14,851,291 | 31,668,291 | 75,659,184 | ||||||||||||
|
Interest expense
|
11,370,603 | 11,668,048 | 46,769,965 | 48,885,674 | ||||||||||||
|
Interest income
|
(7,077 | ) | (148,117 | ) | (130,007 | ) | (369,558 | ) | ||||||||
|
Other (income) expense
|
(511,491 | ) | 298,418 | (151,918 | ) | 298,418 | ||||||||||
|
Total other expense, net
|
10,852,035 | 11,818,349 | 46,488,040 | 48,814,534 | ||||||||||||
|
Net income (loss)
|
$ | (1,698,979 | ) | $ | 3,032,942 | $ | (14,819,749 | ) | $ | 26,844,650 | ||||||
|
Weighted average shares outstanding :
|
||||||||||||||||
|
Basic
|
62,700,719 | 62,325,549 | 62,621,771 | 62,204,443 | ||||||||||||
|
Diluted
|
62,700,719 | 62,629,178 | 62,621,771 | 62,417,247 | ||||||||||||
|
Per share amounts:
|
||||||||||||||||
|
Basic net income (loss)
|
$ | (0.03 | ) | $ | 0.05 | $ | (0.24 | ) | $ | 0.43 | ||||||
Fleet Operating Data
|
Three Months Ended
|
Twelve Months Ended
|
|||||||||||||||
|
December 31, 2011
|
December 31, 2010
|
December 31, 2011
|
December 31, 2010
|
|||||||||||||
|
Ownership Days
|
4,122 | 3,496 | 15,290 | 12,958 | ||||||||||||
|
Chartered-in under operating lease Days
|
182 | 336 | 2,421 | 426 | ||||||||||||
|
Available Days
|
4,283 | 3,802 | 17,619 | 13,323 | ||||||||||||
|
Operating Days
|
4,272 | 3,794 | 17,514 | 13,274 | ||||||||||||
|
Fleet Utilization
|
99.7 | % | 99.8 | % | 99.4 | % | 99.6 | % | ||||||||
CONSOLIDATED BALANCE SHEETS
|
December 31,
|
||||||||
|
2011
|
2010
|
|||||||
|
ASSETS:
|
||||||||
|
Current assets:
|
||||||||
|
Cash and cash equivalents
|
$ | 25,075,203 | $ | 129,121,680 | ||||
|
Accounts receivable
|
13,960,777 | 14,366,495 | ||||||
|
Prepaid expenses
|
3,969,905 | 3,459,721 | ||||||
|
Inventories
|
11,083,331 | 3,190,052 | ||||||
|
Investment
|
988,196 | — | ||||||
|
Fair value above contract value of time charters acquired
|
567,315 | 594,611 | ||||||
|
Fair value of derivative instruments
|
246,110 | — | ||||||
|
Total current assets
|
55,890,837 | 150,732,559 | ||||||
|
Noncurrent assets:
|
||||||||
|
Vessels and vessel improvements, at cost, net of accumulated
depreciation of $239,568,767 and $176,824,438, respectively
|
1,789,381,046 | 1,509,798,249 | ||||||
|
Advances for vessel construction
|
— | 191,477,225 | ||||||
|
Other fixed assets, net of accumulated amortization of $324,691
and $153,375, respectively
|
605,519 | 420,204 | ||||||
|
Restricted cash
|
670,418 | 19,790,341 | ||||||
|
Deferred drydock costs
|
3,303,363 | 4,217,071 | ||||||
|
Deferred financing costs
|
11,766,779 | 16,458,496 | ||||||
|
Fair value above contract value of time charters acquired
|
3,041,496 | 3,608,812 | ||||||
|
Other assets, net
|
2,597,270 | 70,001 | ||||||
|
Total noncurrent assets
|
1,811,365,891 | 1,745,840,399 | ||||||
|
Total assets
|
$ | 1,867,256,728 | $ | 1,896,572,958 | ||||
|
LIABILITIES & STOCKHOLDERS' EQUITY
|
||||||||
|
Current liabilities:
|
||||||||
|
Accounts payable
|
$ | 10,642,831 | $ | 6,089,273 | ||||
|
Accrued interest
|
2,815,665 | 6,651,554 | ||||||
|
Other accrued liabilities
|
11,822,582 | 5,850,474 | ||||||
|
Current portion of long-term debt
|
32,094,006 | — | ||||||
|
Deferred revenue and fair value below contract value of time charters
Acquired
|
5,966,698 | 5,705,326 | ||||||
|
Unearned charter hire revenue
|
5,779,928 | 6,091,332 | ||||||
|
Fair value of derivative instruments
|
— | 127,758 | ||||||
|
Total current liabilities
|
69,121,710 | 30,515,717 | ||||||
|
Noncurrent liabilities:
|
||||||||
|
Long-term debt
|
1,097,384,735 | 1,151,354,476 | ||||||
|
Deferred revenue and fair value below contract value of time charters
Acquired
|
17,088,464 | 23,480,740 | ||||||
|
Fair value of derivative instruments
|
9,486,116 | 22,135,507 | ||||||
|
Total noncurrent liabilities
|
1,123,959,315 | 1,196,970,723 | ||||||
|
Total liabilities
|
1,193,081,025 | 1,227,486,440 | ||||||
|
Commitment and contingencies
|
||||||||
|
Stockholders' equity:
|
||||||||
|
Preferred stock, $.01 par value, 25,000,000 shares authorized, none issued
|
— | — | ||||||
|
Common stock, $.01 par value, 100,000,000 shares authorized, 63,003,286 and
62,126,665 shares issued and outstanding, respectively
|
630,033 | 625,604 | ||||||
|
Additional paid-in capital
|
745,473,169 | 738,251,158 | ||||||
|
Retained earnings (net of dividends declared of $262,118,388 as of
December 31, 2011 and 2010, respectively)
|
(62,474,486 | ) | (47,654,737 | ) | ||||
|
Accumulated other comprehensive loss
|
(9,453,013 | ) | (22,135,507 | ) | ||||
|
Total stockholders' equity
|
674,175,703 | 669,086,518 | ||||||
|
Total liabilities and stockholders' equity
|
$ | 1,867,256,728 | $ | 1,896,572,958 | ||||
CONSOLIDATED STATEMENTS OF CASH FLOWS:
|
Year Ended December 31,
|
||||||||||||
|
2011
|
2010
|
2009
|
||||||||||
|
Cash flows from operating activities
|
||||||||||||
|
Net income (loss)
|
$ | (14,819,749 | ) | $ | 26,844,650 | $ | 33,287,271 | |||||
|
Adjustments to reconcile net income/(loss) to net cash provided by operating activities:
|
||||||||||||
|
Items included in net income not affecting cash flows:
|
||||||||||||
|
Depreciation and amortization
|
69,887,121 | 59,503,895 | 41,380,917 | |||||||||
|
Amortization of deferred drydocking costs
|
3,196,984 | 3,441,583 | 2,948,341 | |||||||||
|
Amortization of deferred financing costs
|
4,172,604 | 3,202,455 | 1,373,998 | |||||||||
|
Write-off of deferred financing costs
|
— | — | 3,383,289 | |||||||||
|
Amortization of fair value (below) above contract value of time charter acquired
|
(5,088,268 | ) | (4,754,407 | ) | (2,643,820 | ) | ||||||
|
Loss (gain) on sale of vessel
|
509,076 | (291,011 | ) | — | ||||||||
|
Unrealized (gain) loss on derivatives, net
|
(373,868 | ) | 127,758 | — | ||||||||
|
Allowance for accounts receivable
|
1,811,320 | — | — | |||||||||
|
Non-cash compensation expense
|
8,907,089 | 14,741,813 | 13,977,974 | |||||||||
|
Changes in operating assets and liabilities:
|
||||||||||||
|
Accounts receivable
|
(1,405,602 | ) | (6,923,045 | ) | (3,085,613 | ) | ||||||
|
Prepaid expenses
|
(510,184 | ) | 1,529,725 | (1,691,645 | ) | |||||||
|
Inventories
|
(7,893,279 | ) | (3,190,052 | ) | — | |||||||
|
Other assets
|
(2,527,269 | ) | (70,001 | ) | — | |||||||
|
Accounts payable
|
4,553,558 | 3,799,940 | 252,273 | |||||||||
|
Accrued interest
|
(4,526,690 | ) | (4,211,361 | ) | 1,429,939 | |||||||
|
Accrued expenses
|
5,972,108 | 2,022,756 | 805,743 | |||||||||
|
Drydocking expenditures
|
(2,809,406 | ) | (2,827,534 | ) | (4,477,244 | ) | ||||||
|
Deferred revenue
|
(448,024 | ) | 159,467 | 4,684,138 | ||||||||
|
Unearned charter hire revenue
|
(311,404 | ) | 1,233,199 | (1,100,700 | ) | |||||||
|
Net cash provided by operating activities
|
58,296,117 | 94,339,830 | 90,524,861 | |||||||||
|
Cash flows from investing activities:
|
||||||||||||
|
Vessels and vessel improvements and Advances for vessel construction
|
(179,105,635 | ) | (301,795,862 | ) | (228,530,198 | ) | ||||||
|
Purchase of other fixed assets
|
(356,631 | ) | (255,713 | ) | (94,065 | ) | ||||||
|
Proceeds from sale of vessel
|
22,511,226 | 21,055,784 | — | |||||||||
|
Investment
|
(955,093 | ) | — | — | ||||||||
|
Changes in restricted cash
|
119,923 | — | — | |||||||||
|
Net cash used in investing activities
|
(157,786,210 | ) | (280,995,791 | ) | (228,624,263 | ) | ||||||
|
Cash flows from financing activities
|
||||||||||||
|
Issuance of common stock
|
— | — | 99,999,997 | |||||||||
|
Equity issuance costs
|
— | — | (2,708,951 | ) | ||||||||
|
Bank borrowings
|
— | 251,183,596 | 159,215,000 | |||||||||
|
Repayment of debt
|
(21,875,735 | ) | — | (48,645,523 | ) | |||||||
|
Changes in restricted cash
|
19,000,000 | (6,014,285 | ) | (2,000,000 | ) | |||||||
|
Deferred financing costs
|
— | — | (4,515,623 | ) | ||||||||
|
Cash used to settle net share equity awards
|
(1,680,649 | ) | (736,443 | ) | (1,109,587 | ) | ||||||
|
Net cash provided by (used in) financing activities
|
(4,556,384 | ) | 244,432,868 | 200,235,313 | ||||||||
|
Net increase/(decrease) in Cash
|
(104,046,477 | ) | 57,776,907 | 62,135,911 | ||||||||
|
Cash at beginning of period
|
129,121,680 | 71,344,773 | 9,208,862 | |||||||||
|
Cash at end of period
|
$ | 25,075,203 | $ | 129,121,680 | $ | 71,344,773 | ||||||
|
Supplemental cash flow information:
|
||||||||||||
|
Cash paid during the period for Interest (including capitalized interest and commitment fees of $3,200,486, $13,725,858 and $26,643,519 in 2011, 2010 and 2009, respectively)
|
$ | 48,498,289 | $ | 57,480,100 | $ | 52,760,344 | ||||||
The following table represents certain information about our revenue earning charters on our operating fleet as of December 31, 2011:
|
Vessel
|
Year Built
|
Dwt
|
Charter Expiration (1)
|
Daily Charter Hire Rate | ||||||
|
Avocet (2)
|
2010
|
53,462 |
Jan 2012
|
$ | 8,050(3) | |||||
|
Bittern (2)
|
2009
|
57,809 |
Feb 2012
|
$ | 13,500(3) | |||||
|
Canary (2)
|
2009
|
57,809 |
Jan 2012
|
$ | 15,500(3) | |||||
|
Cardinal
|
2004
|
55,362 |
Dec 2012 to Feb 2013
|
Index (4)
|
||||||
|
Condor
|
2001
|
50,296 |
Jan 2012 to Mar 2012
|
$ | 15,250 | |||||
|
Crane (2)
|
2010
|
57,809 |
Feb 2012
|
Voyage(3) | ||||||
|
Crested Eagle
|
2009
|
55,989 |
Jan 2012
|
$ | 13,300(3) | |||||
|
Crowned Eagle
|
2008
|
55,940 |
Aug 2012 to Oct 2012
|
$ | 14,000 | |||||
|
Egret Bulker
|
2010
|
57,809 |
Oct 2012 to Feb 2013
|
$ 17,650(5)
(with 50% profit share over $20,000)
|
||||||
|
Falcon
|
2001
|
50,296 |
Jan 2012 to Mar 2012
|
$ | 14,000 | |||||
|
Gannet Bulker
|
2010
|
57,809 |
Jan 2013 to May 2013
|
$ 17,650(5)
(with 50% profit share over $20,000)
|
||||||
|
Golden Eagle
|
2010
|
55,989 |
Mar 2012
|
$ | 15,750 | |||||
|
Goldeneye
|
2002
|
52,421 |
Oct 2012 to Jan 2013
|
Index(4)
|
||||||
|
Grebe Bulker
|
2010
|
57,809 |
Feb 2013 to Jun 2013
|
$17,650(5)
(with 50% profit share over $20,000)
|
||||||
|
Harrier
|
2001
|
50,296 |
Feb 2012
|
$ | 15,000(3) | |||||
|
Hawk I
|
2001
|
50,296 |
Jan 2012 to Feb 2012
|
$ | 13,500(3) | |||||
|
Ibis Bulker
|
2010
|
57,775 |
Mar 2013 to Jul 2013
|
$17,650(5)
(with 50% profit share over $20,000)
|
||||||
|
Imperial Eagle
|
2010
|
55,989 |
Nov 2012 to Feb 2013
|
Index(4)
|
||||||
|
Jaeger
|
2004
|
52,248 |
Nov 2012 to Jan 2013
|
Index(4)
|
||||||
|
Jay(2)
|
2010
|
57,802 |
Jan 2012
|
Spot(3)
|
||||||
|
Vessel
|
Year Built
|
Dwt
|
Charter Expiration (1)
|
Daily Charter Hire Rate | ||||||
|
Kestrel I
|
2004
|
50,326 |
Aug 2012 to Oct 2012
|
Index(4)
|
||||||
|
Kingfisher (2)
|
2010
|
57,776 |
Feb 2012
|
Voyage
|
||||||
|
Kite
|
1997
|
47,195 |
Feb 2012 to May 2012
|
$ | 10,000 | |||||
|
Kittiwake
|
2002
|
53,146 |
Jan 2012 to Mar 2012
|
$ | 14,950(3) | |||||
|
Martin(2)
|
2010
|
57,809 |
Jan 2012
|
Voyage(3)
|
||||||
|
Merlin
|
2001
|
50,296 |
Jan 2012 to Mar 2012
|
$ | 15,625 | |||||
|
Nighthawk(2)
|
2011
|
57,809 |
Jan 2012
|
Voyage(3)
|
||||||
|
Oriole(2)
|
2011
|
57,809 |
Feb 2012
|
$ | 26,750(3) | |||||
|
Osprey I
|
2002
|
50,206 |
Jan 2012 to Feb 2012
|
$ | 14,000(3) | |||||
|
Owl(2)
|
2011
|
50,809 |
Feb 2012 to Apr 2012
|
Voyage(3)
|
||||||
|
Peregrine
|
2001
|
50,913 |
Jan 2012
|
$ | 12,750(3) | |||||
|
Petrel Bulker
|
2011
|
57,809 |
May 2014 to Sep 2014
|
$ 17,650(5) (with 50% | ||||||
| profit share over $20,000) | ||||||||||
|
Puffin Bulker
|
2011
|
57,809 |
May 2014 to Sep 2014
|
$17,650(5) (with 50% | ||||||
| profit share over $20,000) | ||||||||||
|
Redwing
|
2007
|
53,411 |
Jan 2012
|
Voyage(3) | ||||||
|
Roadrunner Bulker
|
2011
|
57,809 |
Aug 2014 to Dec 2014
|
$17,650(5) (with 50% | ||||||
| profit share over $20,000) | ||||||||||
|
Sandpiper Bulker
|
2011
|
57,809 |
Aug 2014 to Dec 2014
|
$17,650(5) (with 50% | ||||||
| profit share over $20,000) | ||||||||||
|
Shrike
|
2003
|
53,343 |
Jan 2012 to Mar 2012
|
$ | 14,500 | |||||
|
Skua
|
2003
|
53,350 |
Jan 2012 to Apr 2012
|
$ | 14,500 | |||||
|
Sparrow
|
2000
|
48,225 |
Feb 2012
|
Spot(3)
|
||||||
|
Stellar Eagle
|
2009
|
55,989 |
Feb 2012 to Apr 2012
|
$ | 15,100 | |||||
|
Tern
|
2003
|
50,200 |
Feb 2012
|
Spot(3)
|
||||||
|
Thrasher (2)
|
2010
|
53,360 |
Mar 2012
|
$ | 13,250(3) | |||||
|
Thrush
|
2011
|
53,297 |
Jan 2012 to Apr 2012
|
$ | 15,500 | |||||
|
Woodstar (2)
|
2008
|
53,390 |
Feb 2012
|
$ | 15,000(3) | |||||
|
Wren (2)
|
2008
|
53,349 |
Feb 2012
|
Spot(3)
|
||||||
|
|
(1)
|
The date range provided represents the earliest and latest date on which the charterer may redeliver the vessel to the Company upon the termination of the charter. The time charter hire rates presented are gross daily charter rates before brokerage commissions, ranging from 0.625% to 5.00%, to third party ship brokers.
|
|
|
(2)
|
The charter rate does not include any shortfall between the vessels' actual daily earnings and the $17,000 per day that KLC is responsible for. Revenue from KLC will be recognized when collectability is assured. In addition, up to December 2015 Eagle is entitled to 100% profit share is between $17,000 to $21,000 and 50% profit share thereafter, from January 2016 to Dec 2018/Apr 2019 with 50% profit share above $17,000.
|
|
|
(3)
|
Upon conclusion of the previous charter the vessel will commence a short term charter for up to six months.
|
|
|
(4)
|
Index, an average of the trailing Baltic Supramax Index.
|
|
|
(5)
|
The charterer has an option to extend the charter by 2 periods of 11 to 13 months each.
|
Glossary of Terms:
Ownership days: The Company defines ownership days as the aggregate number of days in a period during which each vessel in its fleet has been owned. Ownership days are an indicator of the size of the fleet over a period and affect both the amount of revenues and the amount of expenses that is recorded during a period.
Chartered-in under operating lease days: The Company defines chartered-in under operating lease days as the aggregate number of days in a period during which the Company chartered-in vessels.
Available days: The Company defines available days as the number of ownership days less the aggregate number of days that its vessels are off-hire due to vessel familiarization upon acquisition, scheduled repairs or repairs under guarantee, vessel upgrades or special surveys and the aggregate amount of time that we spend positioning our vessels. The shipping industry uses available days to measure the number of days in a period during which vessels should be capable of generating revenues.
Operating days: The Company defines operating days as the number of its available days in a period less the aggregate number of days that the vessels are off-hire due to any reason, including unforeseen circumstances. The shipping industry uses operating days to measure the aggregate number of days in a period during which vessels actually generate revenues.
Fleet utilization: The Company calculates fleet utilization by dividing the number of our operating days during a period by the number of our available days during the period. The shipping industry uses fleet utilization to measure a company's efficiency in finding suitable employment for its vessels and minimizing the amount of days that its vessels are off-hire for reasons other than scheduled repairs or repairs under guarantee, vessel upgrades, special surveys or vessel positioning. Our fleet continues to perform at very high utilization rates.
Conference Call Information
As previously announced, members of Eagle Bulk's senior management team will host a teleconference and webcast at Thursday, March 15th, to discuss these results.
To participate in the teleconference, investors and analysts are invited to call 866-730-5770 in the U.S., or 857-350-1594outside of the U.S., and reference participant code 28295256. A simultaneous webcast of the call, including a slide presentation for interested investors and others, may be accessed by visiting http://www.eagleships.com.
A replay will be available following the call until 11:59 PM ET on March 22, 2012. To access the replay, call 888-286-8010in the U.S., or 617-801-6888 outside of the U.S., and reference passcode 40739533.
About Eagle Bulk Shipping Inc.
Eagle Bulk Shipping Inc. is a Marshall Islands corporation headquartered in New York. The Company is a leading global owner of Supramax dry bulk vessels that range in size from 50,000 to 60,000 deadweight tons and transport a broad range of major and minor bulk cargoes, including iron ore, coal, grain, cement and fertilizer, along worldwide shipping routes.
Forward-Looking Statements
Matters discussed in this release may constitute forward-looking statements. Forward-looking statements reflect our current views with respect to future events and financial performance and may include statements concerning plans, objectives, goals, strategies, future events or performance, and underlying assumptions and other statements, which are other than statements of historical facts.
The forward-looking statements in this release are based upon various assumptions, many of which are based, in turn, upon further assumptions, including without limitation, management's examination of historical operating trends, data contained in our records and other data available from third parties. Although Eagle Bulk Shipping Inc. believes that these assumptions were reasonable when made, because these assumptions are inherently subject to significant uncertainties and contingencies which are difficult or impossible to predict and are beyond our control, Eagle Bulk Shipping Inc. cannot assure you that it will achieve or accomplish these expectations, beliefs or projections.
Important factors that, in our view, could cause actual results to differ materially from those discussed in the forward-looking statements include the strength of world economies and currencies, general market conditions, including changes in charter hire rates and vessel values, changes in demand that may affect attitudes of time charterers to scheduled and unscheduled drydocking, changes in our vessel operating expenses, including dry-docking and insurance costs, or actions taken by regulatory authorities, potential liability from future litigation, domestic and international political conditions, potential disruption of shipping routes due to accidents and political events or acts by terrorists.
Risks and uncertainties are further described in reports filed by Eagle Bulk Shipping Inc. with the US Securities and Exchange Commission.
Visit our website at www.eagleships.com
Contact:
Company Contact:
Alan Ginsberg
Chief Financial Officer
Eagle Bulk Shipping Inc.
Tel. +1 212-785-2500
Investor Relations / Media:
Jonathan Morgan
Perry Street Communications, New York
Tel. +1 212-741-0014
--------------------------------------------------------------------------------
Source: Eagle Bulk Shipping Inc.
|
|
Exhibit 99.2
|
EAGLE BULK SHIPPING INC.
4Q 2011 Results Presentation
15 March 2012

EAGLE BULK SHIPPING INC.
2
Forward Looking Statements
This presentation contains certain statements that may be deemed to be “forward-looking statements”
within the meaning of the Securities Acts. Forward-looking statements reflect management’s current
views with respect to future events and financial performance and may include statements concerning
plans, objectives, goals, strategies, future events or performance, and underlying assumptions and other
statements, which are other than statements of historical facts. The forward-looking statements in this
presentation are based upon various assumptions, many of which are based, in turn, upon further
assumptions, including without limitation, management's examination of historical operating trends, data
contained in our records and other data available from third parties. Although Eagle Bulk Shipping Inc.
believes that these assumptions were reasonable when made, because these assumptions are
inherently subject to significant uncertainties and contingencies which are difficult or impossible to predict
and are beyond our control, Eagle Bulk Shipping Inc. cannot assure you that it will achieve or accomplish
these expectations, beliefs or projections. Important factors that, in our view, could cause actual results
to differ materially from those discussed in the forward-looking statements include the strength of world
economies and currencies, general market conditions, including changes in charter hire rates and vessel
values, changes in demand that may affect attitudes of time charterers to scheduled and unscheduled
drydocking, changes in our vessel operating expenses, including dry-docking and insurance costs, or
actions taken by regulatory authorities, ability of our counterparties to perform their obligations under
sales agreements, charter contracts, and other agreements on a timely basis, potential liability from
future litigation, domestic and international political conditions, potential disruption of shipping routes due
to accidents and political events or acts by terrorists. Risks and uncertainties are further described in
reports filed by Eagle Bulk Shipping Inc. with the US Securities and Exchange Commission.

EAGLE BULK SHIPPING INC.
3
§ Results and Highlights
§ Company
§ Industry
§ Financials
§ Q&A
§ Appendix
Agenda

Results and Highlights
EAGLE BULK SHIPPING INC.
2011 Results
5
5
4Q 2011
§ Net reported loss of $1.7 million, or $0.03 per share.
§ Net revenues of $70.0 million.
§ EBITDA* of $30.0 million.
§ Fleet utilization rate of 99.7%.
Full Year 2011
§ Net reported loss of $14.8 million, or $0.24 per share.
§ Net revenues of $313.4 million.
§ EBITDA* of $108.9 million.
§ Fleet utilization rate of 99.4%.
Positive Operating Cash Flow in a Challenging Year for the Industry
*EBITDA, as defined in our Credit Agreement

EAGLE BULK SHIPPING INC.
2011 Highlights
6
6
Strategic
§ Took delivery of final eight Supramaxes completing newbuilding program.
§ Four vessels fixed for three years at $17,650 per day plus profit share.
§ Sold the Heron, a 2001-built Supramax, for $22.5 million, net.
Commercial
§ Thirteen vessels fixed to Korea Line Corporation (“KLC”) affected by
the charterer’s reorganization in February.
the charterer’s reorganization in February.
§ Took-back operating control of all thirteen vessels and successfully
minimized negative cash impact to the Company.
minimized negative cash impact to the Company.

EAGLE BULK SHIPPING INC.
Recent Developments
7
7
Korea Line Corporation Charters
§ Eagle Bulk continues to employ vessels on short-to-medium charters with a
diversified group of customers.
diversified group of customers.
§ As of December 31, 2011, KLC has not been performing in accordance with
the $17,000 per vessel per day shortfall arrangement and owes us approximately
$4.9 million.
the $17,000 per vessel per day shortfall arrangement and owes us approximately
$4.9 million.
§ Short-fall revenue from KLC is recognized when collectability is assured.
Discussions with Lending Group
§ Eagle Bulk continues to operate under certain waivers as outlined in the Sixth
Amendment to the Credit Facility and remains in ongoing discussions with
Lending Group on reaching an amendment to its loan.
Amendment to the Credit Facility and remains in ongoing discussions with
Lending Group on reaching an amendment to its loan.

Company
EAGLE BULK SHIPPING INC.
9
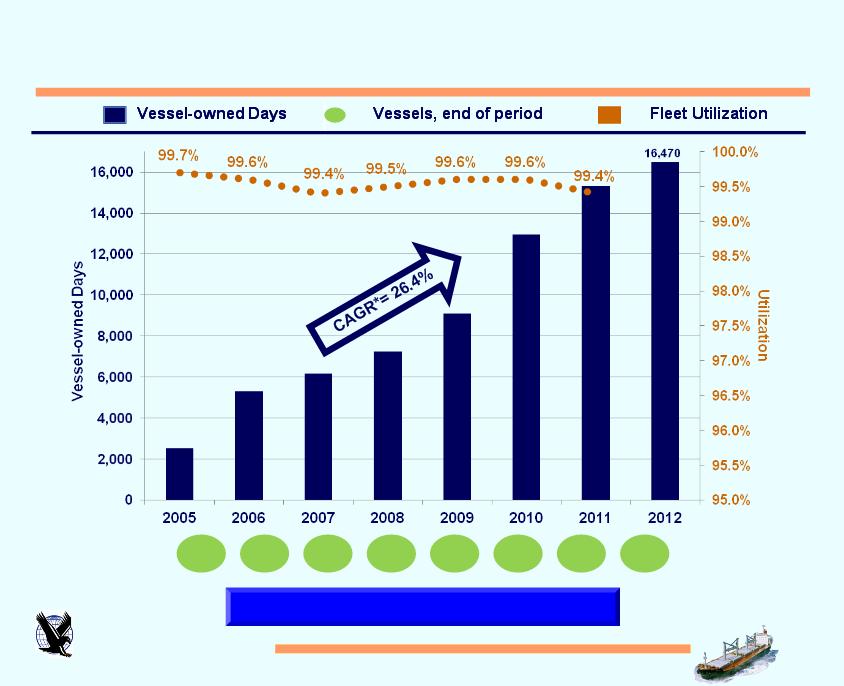
Growth Executed
Excellent fleet utilization maintained
13
16
18
23
27
38
45
45
* Estimated fleet cumulative annual growth rate (“CAGR”) between 2005 and 2012
EAGLE BULK SHIPPING INC.
10
Second Largest Supramax Fleet in the World
|
|
Vessel
|
DWT
|
Year
Built |
|
Vessel
|
DWT
|
Year
Built |
|
Vessel
|
DWT
|
Year
Built |
|
1
|
Sandpiper Bulker
|
57,809
|
2011
|
16
|
Avocet
|
53,462
|
2010
|
31
|
Kestrel I
|
50,326
|
2004
|
|
2
|
Roadrunner Bulker
|
57,809
|
2011
|
17
|
Thrasher
|
53,360
|
2010
|
32
|
Skua
|
53,350
|
2003
|
|
3
|
Puffin Bulker
|
57,809
|
2011
|
18
|
Golden Eagle
|
55,989
|
2010
|
33
|
Shrike
|
53,343
|
2003
|
|
4
|
Petrel Bulker
|
57,809
|
2011
|
19
|
Egret Bulker
|
57,809
|
2010
|
34
|
Tern
|
50,200
|
2003
|
|
5
|
Owl
|
57,809
|
2011
|
20
|
Crane
|
57,809
|
2010
|
35
|
Kittiwake
|
53,146
|
2002
|
|
6
|
Oriole
|
57,809
|
2011
|
21
|
Canary
|
57,809
|
2009
|
36
|
Goldeneye
|
52,421
|
2002
|
|
7
|
Nighthawk
|
57,809
|
2011
|
22
|
Bittern
|
57,809
|
2009
|
37
|
Osprey I
|
50,206
|
2002
|
|
8
|
Thrush
|
53,297
|
2011
|
23
|
Stellar Eagle
|
55,989
|
2009
|
38
|
Falcon
|
50,296
|
2001
|
|
9
|
Martin
|
57,809
|
2010
|
24
|
Crested Eagle
|
55,989
|
2009
|
39
|
Peregrine
|
50,913
|
2001
|
|
10
|
Kingfisher
|
57,776
|
2010
|
25
|
Crowned Eagle
|
55,940
|
2008
|
40
|
Condor
|
50,296
|
2001
|
|
11
|
Jay
|
57,802
|
2010
|
26
|
Woodstar
|
53,390
|
2008
|
41
|
Harrier
|
50,296
|
2001
|
|
12
|
Ibis Bulker
|
57,775
|
2010
|
27
|
Wren
|
53,349
|
2008
|
42
|
Hawk I
|
50,296
|
2001
|
|
13
|
Grebe Bulker
|
57,809
|
2010
|
28
|
Redwing
|
53,411
|
2007
|
43
|
Merlin
|
50,296
|
2001
|
|
14
|
Gannet Bulker
|
57,809
|
2010
|
29
|
Cardinal
|
55,362
|
2004
|
44
|
Sparrow
|
48,225
|
2000
|
|
15
|
Imperial Eagle
|
55,989
|
2010
|
30
|
Jaeger
|
52,248
|
2004
|
45
|
Kite
|
47,195
|
1997
|
* Average age calculated on a DWT-basis
Modern and homogeneous fleet yields commercial advantage
|
VESSEL COUNT
|
45
|
DWT
|
2,451,259
|
AVERAGE AGE*
|
4.8 yrs
|
EAGLE BULK SHIPPING INC.
11
Dynamic Approach to Chartering
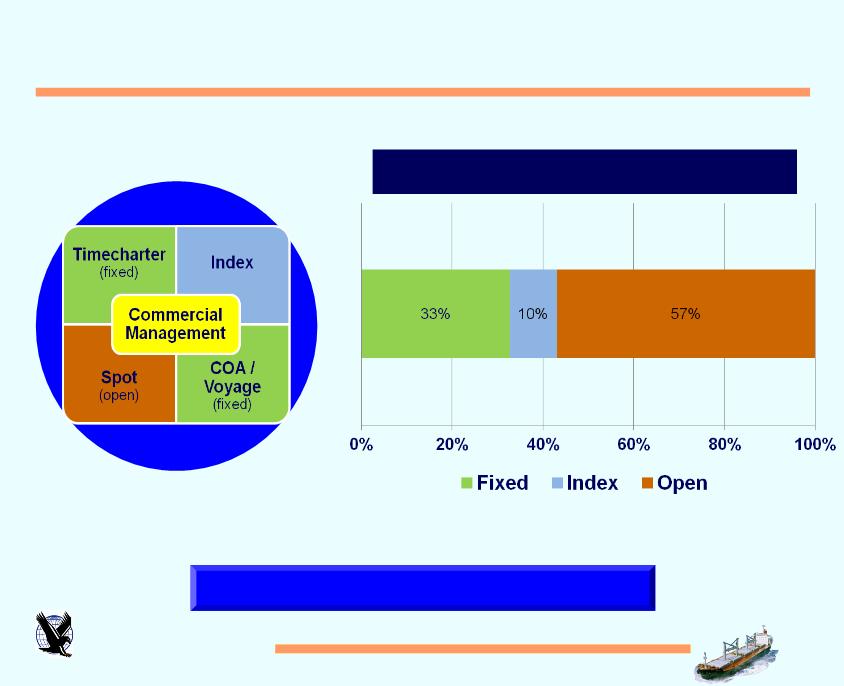
Focus on trading fleet short-term until market recovers
*KLC charters not included
Full Year 2012 Chartering Profile* (as
of 12/31/11)
of 12/31/11)
EAGLE BULK SHIPPING INC.
12
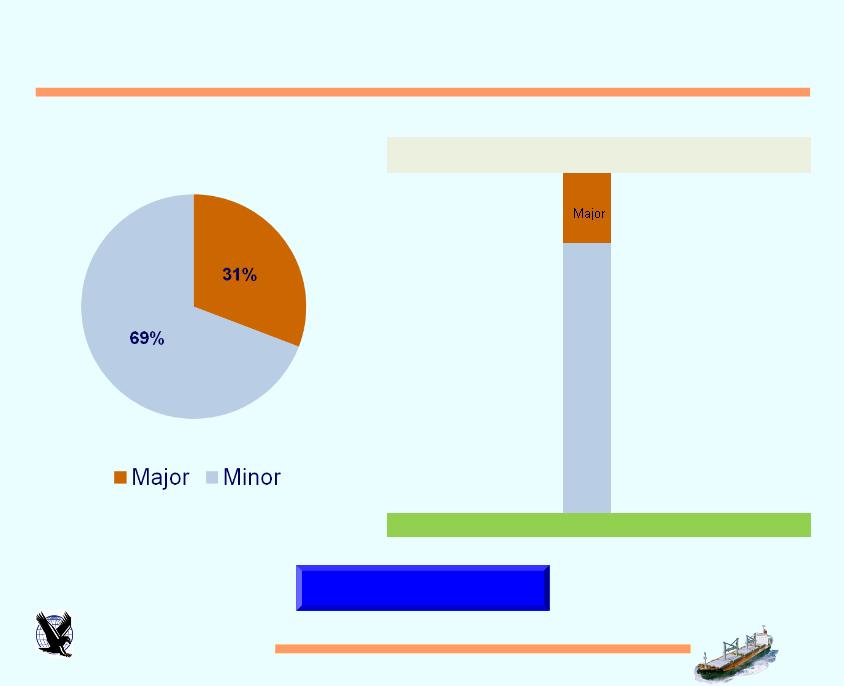
5.4m Tons Carried in 4Q 2011, +34% Y/Y
Diversified Cargo Mix
|
Cargo
|
Type
|
MT
|
as a % of Total
|
|
|
1
|
Iron Ore
|
Major
|
624,680
|
11.7%
|
|
2
|
Coal
|
Major
|
619,848
|
11.6%
|
|
3
|
Grains / Agricultural
|
Major
|
405,202
|
7.6%
|
|
4
|
Sand
|
Minor
|
1,763,035
|
32.9%
|
|
5
|
Copper Ore
|
Minor
|
601,049
|
11.2%
|
|
6
|
Cement
|
Minor
|
407,745
|
7.6%
|
|
7
|
Steels / Pig Iron / Scrap
|
Minor
|
258,368
|
4.8%
|
|
8
|
Other Ores
|
Minor
|
189,878
|
3.5%
|
|
9
|
Potash / Fertilizer
|
Minor
|
131,316
|
2.5%
|
|
10
|
Petcoke
|
Minor
|
101,396
|
1.9%
|
|
11
|
Metals
|
Minor
|
77,465
|
1.4%
|
|
12
|
Forest Products
|
Minor
|
68,164
|
1.3%
|
|
13
|
Alumina/Bauxite
|
Minor
|
55,700
|
1.0%
|
|
14
|
Sugar
|
Minor
|
47,430
|
0.9%
|
|
TOTAL
|
5,351,276
|
100.0%
|
||

Industry
EAGLE BULK SHIPPING INC.
14
Source: Clarksons
2011: Peak Orderbook Deliveries Pressure Rates
Drybulk Demand
(% annual growth measured in MT)
(% annual growth measured in MT)
Drybulk Supply
(% annual net growth in DWT)
(% annual net growth in DWT)
|
Average Spot Rates
|
|||
|
|
Supramax
|
Panamax
|
Capesize
|
|
2010
|
$22,428
|
$24,984
|
$33,210
|
|
2011
|
$14,378
|
$13,952
|
$15,751
|
|
Year-on-Year % Change
|
-35.9%
|
-44.2%
|
-52.6%
|
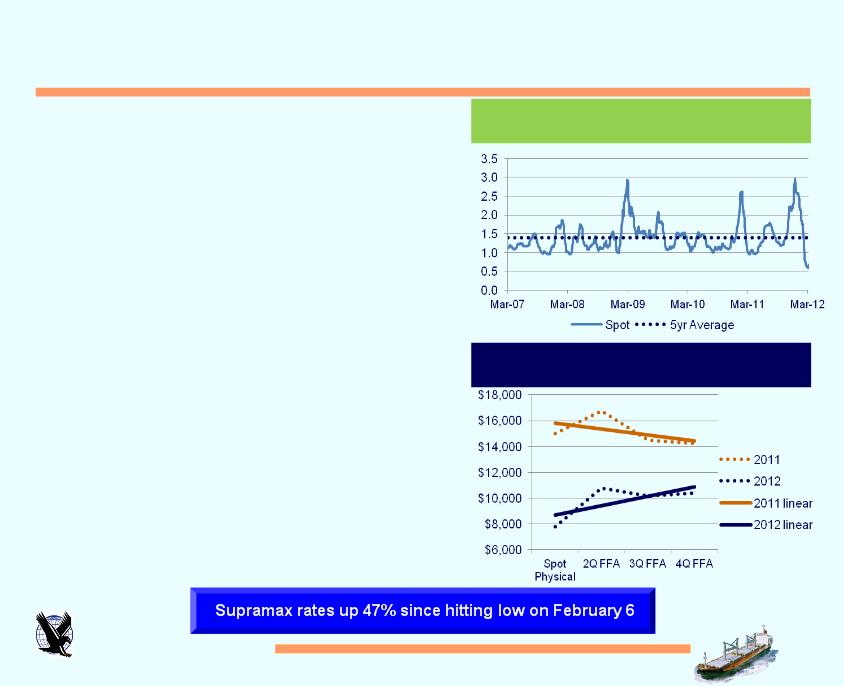
Supramax outperforms
EAGLE BULK SHIPPING INC.
15
Source(s): Clarksons, Platou, WSA, WSJ
§ Newbuilding deliveries flood market in January.
§ Over 12m DWT delivered, a record month.
§ Global steel production down 8% Y/Y in January
to total 117m tons.
to total 117m tons.
§ Timing of Chinese New Year negatively
affected local production and importing
activity as the holiday commenced two
weeks earlier than usual.
affected local production and importing
activity as the holiday commenced two
weeks earlier than usual.
Market Weakness Intensifies in 1Q 2012
Bottom reached?
Drybulk Newbuilding Deliveries
(in m DWT)
(in m DWT)
EAGLE BULK SHIPPING INC.
16
Source(s): Clarksons, Commodore, ICAP, Platou, WSJ
§ Supply growth momentum normalizing-newbuilding
deliveries plunged in February to 5.3m DWT, -57%
M/M.
deliveries plunged in February to 5.3m DWT, -57%
M/M.
§ Supramax global fleet disbursement correcting.
§ Poor rate environment during January/February
led to many vessels ballasting (from the Pacific)
towards the Atlantic for business causing the
Atlantic-to-Pacific rate ratio to fall to a 5yr low.
led to many vessels ballasting (from the Pacific)
towards the Atlantic for business causing the
Atlantic-to-Pacific rate ratio to fall to a 5yr low.
§ Pick-up in Indian iron ore exports after reduction in
railway freight charges.
railway freight charges.
§ Chinese coal stockpiling trend reversing.
§ February inventories down 16% M/M to reach
7.4m MT.
7.4m MT.
§ Planned annual maintenance on the Daqin
Railway to affect 6m MT of domestic supplies.
Railway to affect 6m MT of domestic supplies.
§ Supramax forward curve expectations turn positive.
Short-term Dislocations
Supramax Atlantic vs. Pacific Rates
(Atlantic R/V to Pacific R/V Ratio)
(Atlantic R/V to Pacific R/V Ratio)
Supramax Forward Curve (as
of March 2011 and 2012, respectively)
of March 2011 and 2012, respectively)
EAGLE BULK SHIPPING INC.
17
Source(s): Clarksons, ICAP, Platou, WSJ
§ Global GDP growth estimates for 2012 revised down
to +3.8% (from +5.8%) due to potential recession in
Euro area and lower growth expectations for emerging
markets.
to +3.8% (from +5.8%) due to potential recession in
Euro area and lower growth expectations for emerging
markets.
§ Strong growth expected in China but revised
downward to 7.5%.
downward to 7.5%.
§ PBOC has lowered deposit reserve ratio twice in
2012 already adding over $125 billion in liquidity.
2012 already adding over $125 billion in liquidity.
§ Demand growth expected to remain firm in 2012.
§ Realized net supply growth dependent on both
slippage/cancellations and scrapping.
slippage/cancellations and scrapping.
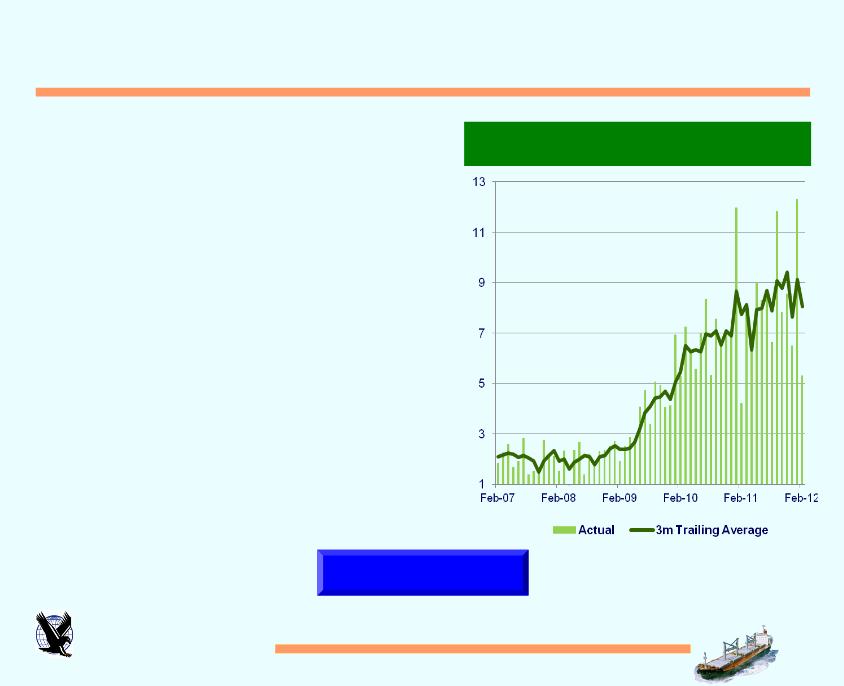
2012 to Remain Challenging Due to Supply Growth
Last year of major supply growth
Chinese Deposit Reserve Ratio
EAGLE BULK SHIPPING INC.
18
Source(s): Clarksons, Macquarie, MAF, and USDA
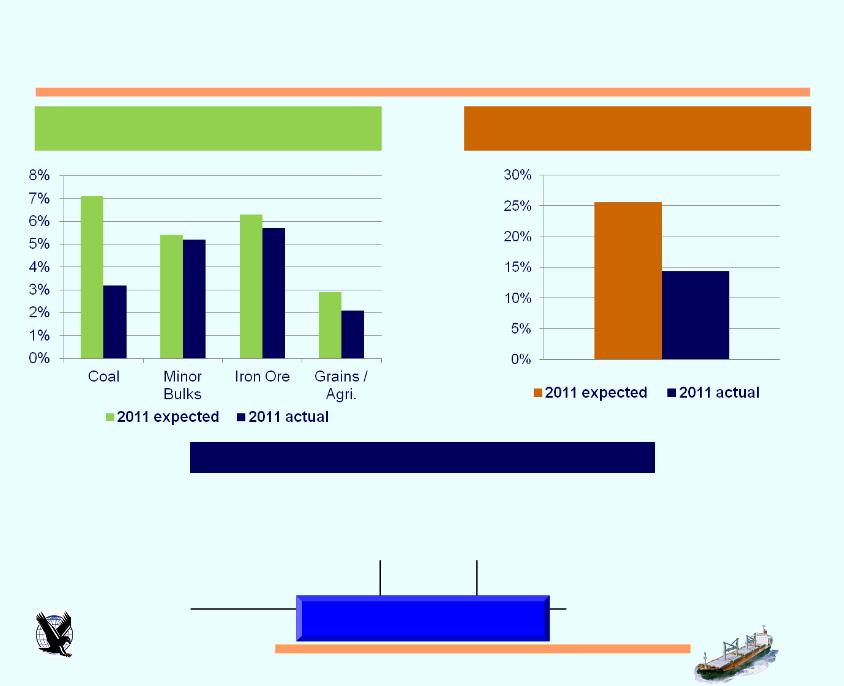
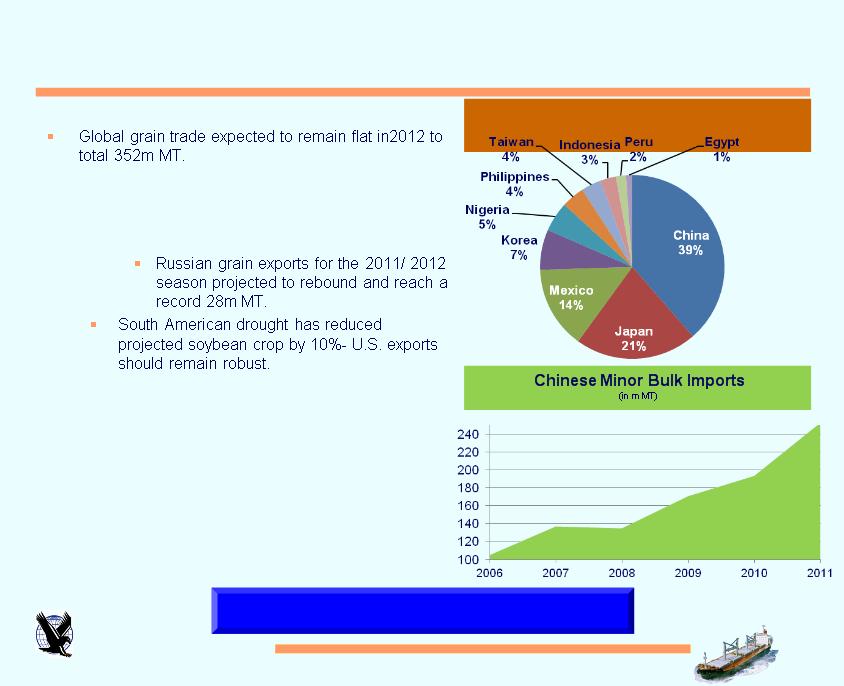
§ U.S. exports facing increased global
competition from Former Soviet Union (FSU)
republics.
competition from Former Soviet Union (FSU)
republics.
§ Chinese minor bulk demand remains robust.
§ Imports totaled 253m MT in 2011, +31% Y/Y.
§ Growth has been driven by forest products,
bauxite and alumina.
bauxite and alumina.
Grain/Agricultural and Minor Bulk Trades Firm
Minor bulks represents 1/3 of total drybulk trade
Top Ten Importers of U.S. Grain Products
EAGLE BULK SHIPPING INC.
Source(s): Clarksons, Macquarie, Peabody
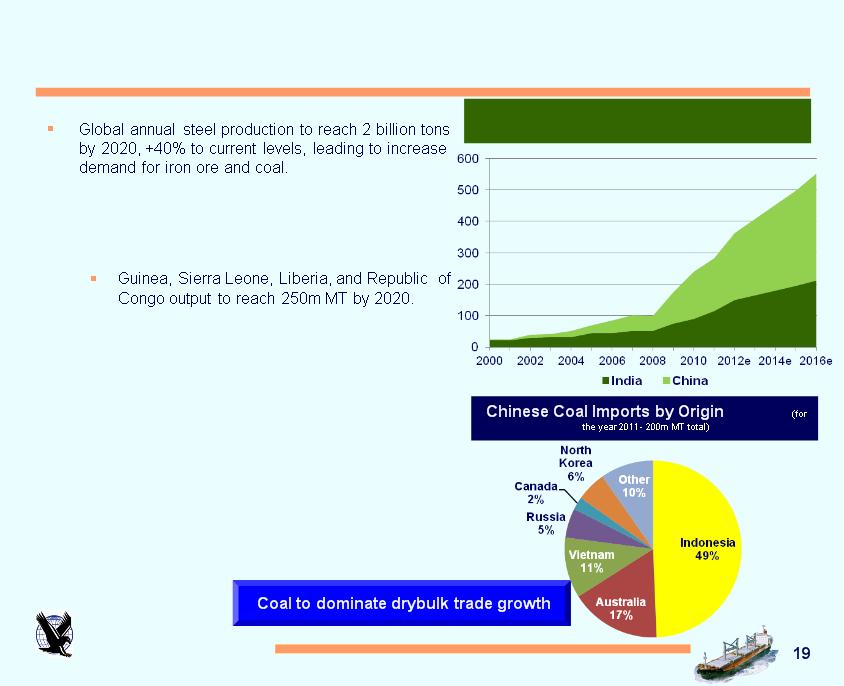
§ African-sourced iron ore to gain market share and
increase ton-mile demand.
increase ton-mile demand.
§ Sierra Leone shipped its first cargo ever
(destined to China) on an Eagle Bulk vessel.
(destined to China) on an Eagle Bulk vessel.
§ Over 350 GW of new coal-fueled power capacity
to come online globally by 2016:
to come online globally by 2016:
§ China- 240 GW
§ India- 70 GW
§ Other- 40 GW
§ Majority of incremental coal required to be
sourced from Indonesia and Australia.
sourced from Indonesia and Australia.
Strong L/T Fundamentals for Coal and Iron Ore
Indian and Chinese Coal Imports
(in m MT)
(in m MT)
EAGLE BULK SHIPPING INC.
20
Source(s): Clarksons, FT
Supply Growth Decreasing
§ Newbuilding deliveries peaking and orderbook
continues to shrink.
continues to shrink.
§ New orders in 2011 down 66% Y/Y.
§ Orderbook stands at 32% of the on-the-water
fleet, -60% since peak in 2008.
fleet, -60% since peak in 2008.
§ Slippage/cancellations remain at +35%.
§ Debt financing availability remains tight.
§ Shipyards continue to face pressure on already
thin/negative margins due to increasing input and
payroll costs and local currency strength (against
the USD).
thin/negative margins due to increasing input and
payroll costs and local currency strength (against
the USD).
§ Create a (price) floor for newbuildings.
§ Leading to shipyard bankruptcies.
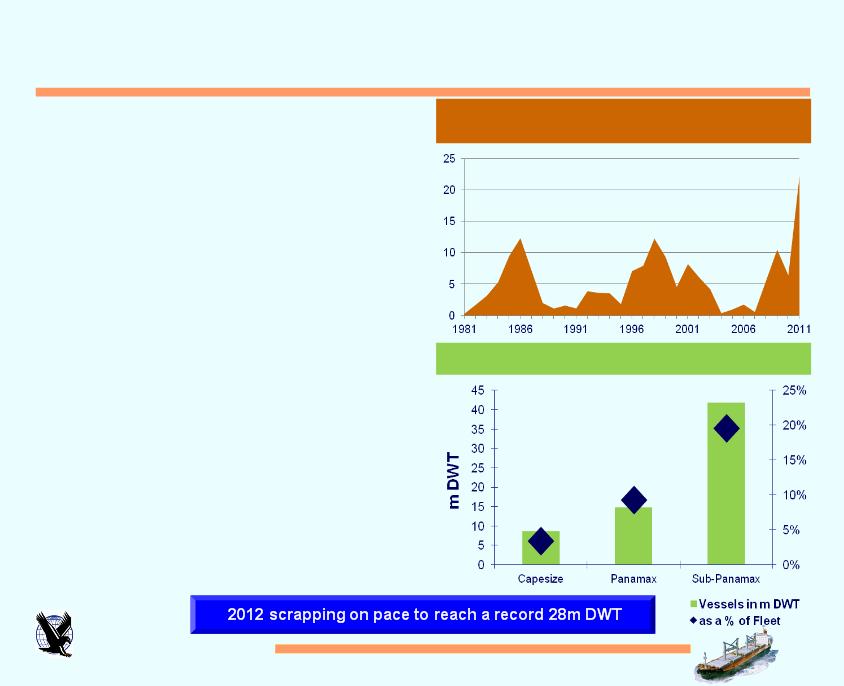
§ Scrapping to remain at records levels.
§ Over 1,600 vessels are over the age of 25.
§ Scrap prices remain at attractive levels.
Drybulk Scrapping
(annual, in m DWT)
(annual, in m DWT)
Drybulk Fleet Over 25 years of Age
46 vessels
221 vessels
1368 vessels

Financials

EAGLE BULK SHIPPING INC.
22
Earnings (in thousands, except per share data)
|
Periods ending December 31, 2011
|
|||
|
|
3 months
|
12 months
|
|
|
|
ended
|
ended
|
|
|
REVENUES, net of commissions
|
$70,010.9
|
$313,432.4
|
|
|
EXPENSES
|
|
|
|
|
|
Voyage expenses
|
8,403.8
|
44,345.8
|
|
|
Vessel expenses
|
22,285.8
|
85,049.6
|
|
|
Charter hire expenses
|
3,202.6
|
41,215.9
|
|
|
Depreciation and amortization
|
19,624.6
|
73,084.1
|
|
|
General and administrative expenses
|
7,341.0
|
37,559.6
|
|
|
Loss from sale of vessel
|
-
|
509.1
|
|
|
Total operating expenses
|
60,857.8
|
281,764.1
|
|
OPERATING INCOME
|
9,153.1
|
31,668.3
|
|
|
OTHER EXPENSES
|
|
|
|
|
|
Interest expense
|
11,370.6
|
46,770.0
|
|
|
Interest income
|
(7.1)
|
(130.0)
|
|
|
Other income
|
(511.5)
|
(151.9)
|
|
|
Total other expense, net
|
10,852.0
|
46,488.1
|
|
NET LOSS
|
$(1,698.9)
|
$(14,819.8)
|
|
|
EBITDA
|
29,989.7
|
108,853.1
|
|
|
EPS (Basic and Diluted)
|
$(0.03)
|
$(0.24)
|
|
|
Weighted average shares outstanding
|
|
|
|
|
|
Basic and Diluted
|
62,700,719
|
62,621,771
|

EAGLE BULK SHIPPING INC.
23
Balance Sheet (in thousands)
|
As of December 31, 2011
|
||
|
|
|
|
|
|
|
|
|
Cash and Restricted Cash
|
$25,745.6
|
|
|
Other Current Assets
|
30,815.6
|
|
|
Vessels, net
|
1,789,381.0
|
|
|
Advances for vessel construction
|
-
|
|
|
Noncurrent Assets
|
21,314.5
|
|
|
Total Assets
|
$1,867,256.7
|
|
|
Current Liabilities
|
37,027.7
|
|
|
Current Portion of Long-term Debt
|
|
32,094.0
|
|
Long-term Debt
|
1,097,384.7
|
|
|
Noncurrent Liabilities
|
26,574.6
|
|
|
Stockholder's Equity
|
$674,175.7
|
|
|
Total Liabilities and Stockholder's Equity
|
$1,867,256.7
|
|

EAGLE BULK SHIPPING INC.
24
2012 Estimated Daily Cash Expense Breakeven
|
Expense breakdown*
|
|
|
Vessel Opex
|
$5,103
|
|
Technical Management
|
319
|
|
G&A
|
1,214
|
|
Interest
|
2,728
|
|
Drydocking
|
100
|
|
Total
|
$9,464
|
*ASSUMPTIONS:
§ Vessel expenses are comprised of the following: crew wages and related, insurance, repair and maintenance, stores, spares and related inventory, and
tonnage taxes.
tonnage taxes.
§ Interest expense takes into consideration Eagle Bulk’s view and projection of LIBOR rates.
§ Drydocking expense is based on estimated costs for anticipated vessel drydockings in the next four quarters.

Q&A
Appendix

EAGLE BULK SHIPPING INC.
28
Charter Summary (as of December 31, 2011)
|
|
Vessel
|
Charter Expiry
|
Charter
Base Rate |
|
Vessel
|
Charter Expiry
|
Charter
Base Rate |
|
Vessel
|
Charter Expiry
|
Charter
Base Rate |
|||
|
Earliest
|
Latest
|
Earliest
|
Latest
|
Earliest
|
Latest
|
|||||||||
|
1
|
Sandpiper Bulker
|
8/2014
|
12/2014
|
$17,650
|
16
|
Avocet
|
1/2012
|
1/2012
|
$8,050
|
31
|
Kestrel I
|
8/2012
|
10/2012
|
BSI*
|
|
2
|
Roadrunner Bulker
|
8/2014
|
12/2014
|
$17,650
|
17
|
Thrasher
|
3/2012
|
3/2012
|
$13,250
|
32
|
Skua
|
1/2012
|
4/2012
|
$14,500
|
|
3
|
Puffin Bulker
|
5/2014
|
9/2014
|
$17,750
|
18
|
Golden Eagle
|
3/2012
|
3/2012
|
$15,750
|
33
|
Shrike
|
1/2012
|
3/2012
|
$14,500
|
|
4
|
Petrel Bulker
|
5/2014
|
9/2014
|
$17,650
|
19
|
Egret Bulker
|
10/2012
|
2/2013
|
$17,650
|
34
|
Tern
|
2/2012
|
2/2012
|
spot
|
|
5
|
Owl
|
2/2012
|
4/2012
|
voyage
|
20
|
Crane
|
2/2012
|
2/2012
|
voyage
|
35
|
Kittiwake
|
1/2012
|
3/2012
|
$14,950
|
|
6
|
Oriole
|
2/2012
|
2/2012
|
$26,750
|
21
|
Canary
|
1/2012
|
1/2012
|
$15,500
|
36
|
Goldeneye
|
10/2012
|
1/2013
|
BSI*
|
|
7
|
Nighthawk
|
1/2012
|
1/2012
|
voyage
|
22
|
Bittern
|
2/2012
|
2/2012
|
$13,500
|
37
|
Osprey I
|
1/2012
|
2/2012
|
$14,000
|
|
8
|
Thrush
|
1/2012
|
4/2012
|
$15,500
|
23
|
Stellar Eagle
|
2/2012
|
4/2012
|
$15,100
|
38
|
Falcon
|
1/2012
|
3/2012
|
$14,000
|
|
9
|
Martin
|
1/2012
|
1/2012
|
voyage
|
24
|
Crested Eagle
|
1/2012
|
1/2012
|
$13,300
|
39
|
Peregrine
|
1/2012
|
1/2012
|
$12,650
|
|
10
|
Kingfisher
|
2/2012
|
2/2012
|
voyage
|
25
|
Crowned Eagle
|
8/2012
|
10/2012
|
$14,000
|
40
|
Condor
|
1/2012
|
3/2012
|
$15,250
|
|
11
|
Jay
|
1/2012
|
1/2012
|
spot
|
26
|
Woodstar
|
2/2012
|
2/2012
|
$15,000
|
41
|
Harrier
|
2/2012
|
2/2012
|
$15,000
|
|
12
|
Ibis Bulker
|
3/2013
|
7/2013
|
$17,650
|
27
|
Wren
|
2/2012
|
2/2012
|
spot
|
42
|
Hawk I
|
1/2012
|
2/2012
|
$13,500
|
|
13
|
Grebe Bulker
|
2/2013
|
6/2013
|
$17,650
|
28
|
Redwing
|
1/2012
|
1/2012
|
voyage
|
43
|
Merlin
|
1/2012
|
3/2012
|
$15,625
|
|
14
|
Gannet Bulker
|
1/2013
|
5/2013
|
$17,650
|
29
|
Cardinal
|
12/2012
|
2/2013
|
BSI*
|
44
|
Sparrow
|
2/2012
|
2/2012
|
spot
|
|
15
|
Imperial Eagle
|
11/2012
|
2/2013
|
BSI*
|
30
|
Jaeger
|
11/2012
|
1/2013
|
BSI*
|
45
|
Kite
|
2/2012
|
5/2012
|
$10,000
|
*BSI= Baltic Supramax Index