Attached files
| file | filename |
|---|---|
| EX-32.1 - CERT OF CHIEF EXECUTIVE OFFICER - Oxford Square Capital Corp. | d311578dex321.htm |
| EX-32.2 - CERT OF CHIEF FINANCIAL OFFICER - Oxford Square Capital Corp. | d311578dex322.htm |
| EX-31.2 - CERT OF CHIEF FINANCIAL OFFICER - Oxford Square Capital Corp. | d311578dex312.htm |
| EX-31.1 - CERT OF CHIEF EXECUTIVE OFFICER - Oxford Square Capital Corp. | d311578dex311.htm |
Table of Contents
UNITED STATES
SECURITIES AND EXCHANGE COMMISSION
WASHINGTON, D.C. 20549
FORM 10-K
| x | ANNUAL REPORT PURSUANT TO SECTION 13 OR 15(d) OF THE SECURITIES EXCHANGE ACT OF 1934 |
FOR THE FISCAL YEAR ENDED DECEMBER 31, 2011
OR
| ¨ | TRANSITION REPORT PURSUANT TO SECTION 13 OR 15(d) OF THE SECURITIES EXCHANGE ACT OF 1934 |
FOR THE TRANSITION PERIOD FROM TO
COMMISSION FILE NUMBER: 0-50398
TICC CAPITAL CORP.
(Exact name of registrant as specified in its charter)
| Maryland | 20-0188736 | |
| (State of Incorporation) | (I.R.S. Employer Identification Number) |
8 Sound Shore Drive, Suite 255
Greenwich, CT 06830
(Address of principal executive offices) (Zip Code)
Registrant’s telephone number, including area code: (203) 983-5275
Securities registered pursuant to Section 12(b) of the Act:
| Title of Each Class |
Name of Each Exchange On Which Registered | |
| Common Stock, par value $0.01 per share | NASDAQ Global Select Market |
Securities registered pursuant to Section 12(g) of the Act:
Common Stock, par value
None
Indicate by check mark if the registrant is a well-known seasoned issuer, as defined in Rule 405 of the Securities Act. Yes ¨ No x.
Indicate by check mark if the registrant is not required to file reports pursuant to Section 13 or Section 15(d) of the Act. Yes ¨ No x.
Indicate by check mark whether the Registrant (1) has filed all reports required to be filed by Section 13 or 15(d) of the Securities Exchange Act of 1934 during the preceding 12 months (or for such shorter period that the Registrant was required to file such reports), and (2) has been subject to such filing requirements for the past 90 days. Yes x No ¨.
Indicate by check mark whether the registrant has submitted electronically and posted on its corporate Web site, if any, every Interactive Data File required to be submitted and posted pursuant to Rule 405 of Regulation S-T (§232.405 of this chapter) during the preceding 12 months (or for such shorter period that the registrant was required to submit and post such files). Yes ¨ No ¨
Indicate by check mark if disclosure of delinquent filers pursuant to Item 405 of Regulation S-K is not contained herein, and will not be contained, to the best of Registrant’s knowledge, in definitive proxy or information statements incorporated by reference in Part III of this Form 10-K or any amendment to this Form 10-K. x
Indicate by check mark whether the registrant is a large accelerated filer, an accelerated filer, a non-accelerated filer, or a smaller reporting company. See definition of “accelerated filer,” “large accelerated filer” and “smaller reporting company” in Rule 12b-2 of the Exchange Act. (Check one):
| Large accelerated filer | ¨ | Accelerated filer | x | |||
| Non-accelerated filer | ¨ (Do not check if a smaller reporting company) | Smaller reporting company | ¨ | |||
Indicate by check mark whether the registrant is a shell company (as defined in Rule 12b-2 of the Act). Yes ¨ No x.
The aggregate market value of common stock held by non-affiliates of the Registrant on June 30, 2011, based on the closing price on that date of $9.60 on the NASDAQ Global Select Market, was $306,079,528. For the purposes of calculating this amount only, all directors and executive officers of the Registrant have been treated as affiliates. There were 32,818,428 shares of the Registrant’s common stock outstanding as of March 13, 2012.
Documents Incorporated by Reference
Portions of the registrant’s definitive Proxy Statement relating to the registrant’s 2012 Annual Meeting of Stockholders, to be filed with the Securities and Exchange Commission within 120 days following the end of the Company’s fiscal year, are incorporated by reference in Part III of this Annual Report on Form 10-K as indicated herein.
Table of Contents
TICC CAPITAL CORP.
FORM 10-K FOR THE FISCAL YEAR
ENDED DECEMBER 31, 2011
Table of Contents
| Item 1. | Business |
TICC Capital Corp. (“TICC,” “Company,” “we,” “us,” or “our”) is a specialty finance company principally providing capital to primarily non-public small- and medium-sized companies. Our investment objective is to maximize our portfolio’s total return. Our primary focus is to seek current income by investing primarily in corporate debt securities. Our debt investments may include bilateral loans (loans where we hold the entirety of a particular loan) and syndicated loans (those where multiple investors hold portions of that loan). We have and may continue to invest in structured finance investments, including collateralized loan obligation (“CLO”) investment vehicles, that own debt securities. We may also seek to provide our stockholders with long-term capital growth through the appreciation in the value of warrants or other equity instruments that we may receive when we make debt investments or equity investments. We may also invest in publicly traded debt and/or equity securities. As a business development company (“BDC”), we may not acquire any asset other than “qualifying assets” unless, at the time we make the acquisition, the value of our qualifying assets represents at least 70% of the value of our total assets.
Our capital is generally used by our portfolio companies to finance organic growth, acquisitions, recapitalizations and working capital. Our investment decisions are based on extensive analysis of potential portfolio companies’ business operations supported by an in-depth understanding of the quality of their recurring revenues and cash flow, variability of costs and the inherent value of their assets, including proprietary intangible assets and intellectual property.
We generally expect to invest between $5 million and $25 million in each of our portfolio companies, although this investment size may vary proportionately as the size of our capital base changes and market conditions warrant, and accrue interest at fixed or variable rates. We expect that our investment portfolio will be diversified among a large number of investments with few investments, if any, exceeding 5% of the total portfolio.
While the structure of our investments will vary, and while we invest across a wide range of different industries, we have historically overweighted our investments in the debt of technology-related companies. We seek to invest in entities that, as a general matter, have been operating for at least one year prior to the date of our investment and that will, at the time of our investment, have employees and revenues, and are cash flow positive. Many of these companies will have financial backing provided by private equity or venture capital funds or other financial or strategic sponsors at the time we make an investment.
We have historically and may continue to borrow funds to make investments. As a result, we may be exposed to the risks of leverage, which may be considered a speculative investment technique. Borrowings, also known as leverage, magnify the potential for gain and loss on amounts invested and therefore increase the risks associated with investing in our securities. In addition, the costs associated with our borrowings, including any increase in the management fee payable to our investment adviser, TICC Management, LLC (“TICC Management”), will be borne by our common stockholders.
On August 10, 2011, we completed a $225.0 million debt securitization financing transaction. The Class A Notes offered in the debt securitization were issued by TICC CLO LLC (“Securitization Issuer” or “TICC CLO”), a subsidiary of TICC Capital Corp. 2011-1 Holdings, LLC (“Holdings”), which is in turn a direct subsidiary of TICC, and the notes are secured by the assets held by the Securitization Issuer. The securitization was executed through a private placement of $101.25 million of Aaa/AAA Class A Notes of the Securitization Issuer. Holdings retained all of the subordinated notes, which totaled $123.75 million (the “Subordinated Notes”), and retained all the membership interests in the Securitization Issuer.
Our investment activities are managed by TICC Management. TICC Management is an investment adviser registered under the Investment Advisers Act of 1940, as amended (the “Advisers Act”). TICC Management is owned by BDC Partners, LLC (“BDC Partners”), its managing member, and Charles M. Royce, our non-executive Chairman, who holds a minority, non-controlling interest in TICC Management. Jonathan H. Cohen, our Chief Executive Officer, and Saul B. Rosenthal, our President and Chief Operating Officer, are the members of BDC Partners. Under our investment advisory agreement with TICC Management (the “Investment Advisory Agreement”), we have agreed to pay TICC Management an annual base management fee based on our gross assets as well as an incentive fee based on our performance. See “Portfolio Management – Investment Advisory Agreement.”
We were founded in July 2003 and completed an initial public offering of shares of our common stock in November 2003. We are a Maryland corporation and a closed-end, non-diversified management investment company that has elected to be regulated as a business development company under the Investment Company Act of 1940, as amended (the “1940 Act”). As a business development company, we are required to meet certain regulatory tests, including the requirement to invest at least 70% of our total assets in eligible portfolio companies. See “Regulation as a Business Development Company.” In addition, we have elected to be treated for federal income tax purposes as a regulated investment company (“RIC”), under Subchapter M of the Internal Revenue Code of 1986 (the “Code”).
Our headquarters are located at 8 Sound Shore Drive, Suite 255, Greenwich, Connecticut and our telephone number is (203) 983-5275.
1
Table of Contents
We file annual, quarterly and current reports, proxy statements and other information with the Securities and Exchange Commission (“SEC”). You can inspect any materials we file with the SEC, without charge, at the SEC’s Public Reference Room at 100 F Street, N.E., Washington, D.C. 20549. Please call the SEC at 1-800-SEC-0330 for further information on the Public Reference Room. The information we file with the SEC is available free of charge by contacting us at 8 Sound Shore Drive, Suite 255, Greenwich, CT 06830 or by telephone at (203) 983-5275 or on our website at http://www.ticc.com. The SEC also maintains a website that contains reports, proxy statements and other information regarding registrants, including us, that file such information electronically with the SEC. The address of the SEC’s web site is http://www.sec.gov. Information contained on our website or on the SEC’s web site about us is not incorporated into this report and you should not consider information contained on our website or on the SEC’s website to be part of this report.
MARKET OPPORTUNITY
Beginning in mid-2007, global credit and other financial markets suffered substantial stress, volatility, illiquidity and disruption. These developments caused a series of failures and restructurings among a large number of financial institutions, which either participated in the origination and distribution of structured finance or syndicated loan credit products, or invested in them. The debt and equity capital markets in the U.S. were impacted by significant write-offs in the financial services sector relating to these products and the re-pricing of credit risk in the loan market, among other things.
These events constrained the availability of capital for the market as a whole, and the financial services sector in particular. During 2009, the syndicated corporate loans market experienced both unprecedented price declines and volatility. While prices remained depressed across many sectors and ratings categories through most of 2009, we witnessed a strong upward move during the second half of 2009, which continued through 2010. During 2011, we saw ongoing price volatility for corporate loans, consistent with many other parts of the debt and equity markets. Although corporate loan prices may still be below historical averages, our view is that certain, primarily larger-issuer, broadly syndicated corporate loans still may not adequately reflect the spreads necessary to compensate investors for the risks involved. In view of the above circumstances, we continue to focus more heavily on middle-market issuers and to a limited extent larger issuers, and, opportunistically, on certain structured finance investments, including CLO investment vehicles, and have recently made a number of selective purchases in these markets.
COMPETITIVE ADVANTAGES
We believe that we are well positioned to provide financing primarily to middle market companies for the following reasons:
| • | Expertise in credit analysis and monitoring investments; |
| • | Flexible investment approach; and |
| • | Established transaction sourcing network. |
Expertise in credit analysis and monitoring investments
While our investment focus is on middle-market companies, we have invested, and in the future will likely continue to invest, in larger and smaller companies and in other investment structures on an opportunistic basis. Most recently, we have invested in a number of CLO investment vehicles. We believe our experience in analyzing middle-market companies and CLO investment structures, as detailed in the biographies of TICC Management’s senior investment professionals, affords us a sustainable competitive advantage over lenders with limited experience in investing in these markets. In particular, we have expertise in evaluating the operating characteristics of middle-market companies as well as the structural features of CLO investments, and monitoring the credit risk of such investments after closing until full repayment.
| • | Jonathan H. Cohen, our Chief Executive Officer, has more than 21 years of experience in debt and equity research and investment. Mr. Cohen is also the Chief Executive Officer of T2 Advisers, LLC, the investment manager of Greenwich Loan Income Fund Limited (LSE AIM: GLIF), a Guernsey fund that invests primarily in senior loans, and which also serves as collateral manager of T2 Income Fund CLO I Ltd., a CLO vehicle sponsored by Greenwich Loan Income Fund Limited. Mr. Cohen has also served as Chief Executive Officer and a Director of Oxford Lane Capital Corp. (NasdaqGS: OXLC), a registered closed-end fund, and as Chief Executive Officer of its investment adviser, Oxford Lane Management, LLC (“Oxford Lane Management”), since 2010. Mr. Cohen was also the owner, managing member, and a principal of JHC Capital Management, a registered investment adviser that served as the sub-adviser to the Royce Technology Value Fund, a technology-focused mutual fund, and was previously a managing member and principal of Privet Financial Securities, LLC, a registered broker-dealer, from 2003 to 2004. Prior to founding JHC Capital Management in 2001, Mr. Cohen managed technology research groups at Wit Capital and SoundView Technology Group from 1999 to 2001. He has also managed securities research groups at Merrill Lynch & Co. from 1998 to 1999. He was named to Institutional Investor’s “All-American” research team in 1996, 1997 and 1998. |
2
Table of Contents
| • | Saul B. Rosenthal, our President and Chief Operating Officer, has 13 years of experience in the capital markets, with a focus on middle-market transactions. Mr. Rosenthal is also the President of T2 Advisers, LLC, which serves as the investment manager of Greenwich Loan Income Fund Limited (LSE AIM: GLIF), a Guernsey fund that invests primarily in senior loans, and which also serves as collateral manager of T2 Income Fund CLO I Ltd., a CLO vehicle sponsored by Greenwich Loan Income Fund Limited. In addition, Mr. Rosenthal has served as President and a Director of Oxford Lane Capital Corp. (NasdaqGS: OXLC), a registered closed-end fund, and as President of Oxford Lane Management, since 2010. Mr. Rosenthal previously was a Vice President and co-founder of the Private Equity Group at Wit Capital. Prior to joining Wit Capital, Mr. Rosenthal was an attorney at the law firm of Shearman & Sterling LLP. Mr. Rosenthal serves on the board of Algorithmic Implementations, Inc. (d/b/a Ai Squared) and the New York City chapter of the Young Presidents’ Organization (YPO-WPO). |
| • | Darryl Monasebian is the Senior Managing Director, Head of Portfolio Management of TICC Management. Previously, Mr. Monasebian was a Director in the Merchant Banking Group at BNP Paribas, and prior to that was a Director at Swiss Bank Corporation and a Senior Account Officer at Citibank. He began his business career at Metropolitan Life Insurance Company as an Investment Analyst in the Corporate Investments Department. Mr. Monasebian has more than 20 years of banking and investment management experience. |
| • | Hari Srinivasan is Managing Director and Portfolio Manager of TICC Management. Previously, Mr. Srinivasan was a Credit Manager focusing on the restructuring and monetization of distressed assets in Lucent Technologies’ vendor finance portfolio, and on the credit analysis of several of Lucent’s telecom customers. Prior to that, he was an analyst in Fixed Income with Lehman Brothers. Mr. Srinivasan began his career as a Computer Science engineer. |
Flexible investment approach
While we must comply with the 1940 Act provisions applicable to BDCs, we have significant flexibility in selecting and structuring our investments. We also have fairly broad latitude as to the term and nature of our investments. We recognize that middle-market companies in some cases may make corporate development decisions that favorably impact long-term enterprise value at the expense of short-term financial performance. We believe that this fundamental investment perspective results in a more flexible approach to managing investments which facilitates positive, long-term relationships with our portfolio companies, bankers and other intermediaries and enables us to be a preferred source of capital to them. We also believe our approach enables our debt financing to be a viable alternative capital source for funding middle-market companies that wish to avoid the dilutive effects of equity financings.
We are not generally subject to the investment time requirements and reinvestment limitations of many private investment funds. These provisions typically require that such private funds invest capital within a set period of time and then ultimately return to investors the initial capital and associated capital gains, with certain limitation on reinvesting such capital. We believe that our ability to make investments at the most opportune time rather than based on a pre-agreed time horizon with the ability to reinvest such funds on an ongoing basis should help us to maximize returns on our invested capital.
Established deal sourcing network
Through the investment professionals of TICC Management, we have extensive contacts and sources from which to generate investment opportunities. These contacts and sources include private equity funds, companies, brokers and bankers. We believe that senior professionals of TICC Management have developed strong relationships within the investment community over their years within the banking, investment management and equity research field.
INVESTMENT PROCESS
Identification of prospective portfolio companies
We identify and source new prospective portfolio companies through a network of venture capital and private equity funds, investment banks, accounting and law firms and direct company relationships. We have identified several criteria that we believe are important in seeking our investment objective. These criteria provide general guidelines for our investment decisions; however, we do not require each prospective portfolio company in which we choose to invest to meet all or any specific number of these criteria.
| • | Experienced management. We generally require that our portfolio companies have an experienced management team. We also prefer the portfolio companies to have in place proper incentives to induce management to succeed and to act in concert with our interests as investors, including having significant equity interests. |
3
Table of Contents
| • | Significant financial or strategic sponsor and / or strategic partner. We prefer to invest in companies in which established private equity or venture capital funds or other financial or strategic sponsors have previously invested and are willing to make an ongoing contribution to the management of the business, including participation as board members or as business advisers. |
| • | Strong competitive position in industry. We seek to invest in companies that have developed a strong competitive position within their respective sector or niche of a specific industry. |
| • | Profitable on a cash flow basis. We focus on companies that are profitable or nearly profitable on an operating cash flow basis. Typically, we would not expect to invest in start-up companies. |
| • | Clearly defined exit strategy. Prior to making an investment in a debt security that is accompanied by an equity-based security in a portfolio company, we analyze the potential for that company to increase the liquidity of its common equity through a future event that would enable us to realize appreciation, if any, in the value of our equity interest. Liquidity events may include an initial public offering, a merger or an acquisition of the company, a private sale of our equity interest to a third party, or a purchase of our equity position by the company or one of its stockholders. |
| • | Liquidation value of assets. Although we do not operate as an asset-based lender, the prospective liquidation value of the assets, if any, collateralizing the debt securities that we hold is an important factor in our credit analysis. We emphasize both tangible assets, such as accounts receivable, inventory and equipment, and intangible assets, such as intellectual property, software code, customer lists, networks and databases. |
Due diligence
If a company meets some of the characteristics described above, we perform a preliminary due diligence review including company and technology assessments, market analysis, competitive analysis, evaluation of management, risk analysis and transaction size, pricing and structure analysis. The criteria delineated below provide general parameters for our investment decisions, although not all of such criteria will be followed in each instance. In the case of bilateral loans, upon successful completion of this preliminary evaluation process, we will decide whether to deliver a non-binding letter of intent, after which our administrator, BDC Partners, generally receives an upfront advance to cover our due diligence-related expenses, begin the due diligence process and move forward towards the completion of a transaction.
Our due diligence process generally includes some or all of the following elements:
Management team and financial sponsor
| • | management assessment including a review of management’s track record with respect to product development, sales and marketing, mergers and acquisitions, alliances, collaborations, research and development outsourcing and other strategic activities, reference and background checks; and |
| • | financial sponsor reputation, track record, experience and knowledge (where a financial sponsor is present in a transaction). |
Business
| • | industry and competitive analysis; |
| • | customer and vendor interviews to assess both business prospects and standard practices of the company; |
| • | assessment of likely exit strategies; and |
| • | potential regulatory / legal issues. |
Financial condition
| • | detailed review of the historical financial performance and the quality of earnings; |
| • | development of detailed pro forma financial projections; |
| • | review of internal controls and accounting systems; and |
| • | review of assets and liabilities, including contingent liabilities. |
Technology assessment
| • | evaluation of intellectual property position; |
4
Table of Contents
| • | review of research and development milestones; |
| • | analysis of core technology under development; |
| • | assessment of collaborations and other technology validations; and |
| • | assessment of market and growth potential. |
Contemporaneous with our due diligence process, the investment team prepares a detailed credit memorandum for presentation to our Investment Committee, which currently consists of Messrs. Cohen and Rosenthal. Our Investment Committee reviews and approves each of our portfolio investments.
Investment Structuring
We seek to achieve a high level of current income by investing in debt securities, consisting primarily of senior debt, senior subordinated debt and junior subordinated debt, of primarily non-public small- and medium-sized companies. We may also seek to provide our stockholders with long-term capital growth through the appreciation in the value of warrants or other equity instruments that we may receive when we make loans.
In structuring our investments, we seek to ascertain the asset quality as well as the earnings quality of our prospective portfolio companies. Frequently, we obtain a senior secured position and thus receive a perfected, first priority security interest in substantially all of our portfolio companies’ assets, which entitles us to a preferred position on payments in the event of liquidation, and in many cases a pledge of the equity by the equity owners. It should be noted, however, that because we are not primarily an asset-based lender, in the current economic environment, the value of collateral and security interests may dissipate rapidly. In addition, we seek to structure loan covenants to assist in the management of risk. Our loan documents ordinarily include affirmative covenants that require the portfolio company to take specific actions such as periodic financial reporting, notification of material events and compliance with laws, restrictive covenants that prevent portfolio companies from taking a range of significant actions such as incurring additional indebtedness or making acquisitions without our consent, covenants requiring the portfolio company to maintain or achieve specified financial ratios such as debt to cash flow and interest coverage, and operating covenants requiring them to maintain certain operational benchmarks such as minimum revenue or minimum cash flow. Our loan documents also provide protection against customary events of default such as non-payment, breach of covenant, insolvency and change of control.
Senior Debt
The senior debt in which we invest generally holds a senior position in the capital structure of a portfolio company. Such debt may include loans that hold the most senior position, loans that hold an equal ranking with other senior debt, or loans that are, in the judgment of our investment adviser, in the category of senior debt. A senior position in the borrower’s capital structure generally gives the holder of the senior debt a claim on some or all of the borrower’s assets that is senior to that of subordinated debt, preferred stock and common stock in the event the borrower defaults or becomes bankrupt. The senior debt in which we invest may be wholly or partially secured by collateral, or may be unsecured. However, there may be instances in which senior debt held by other investors is in a superior position in the borrower’s capital structure.
Senior Subordinated Debt
Senior subordinated debt is subordinated in its rights to receive its principal and interest payments from the borrower to the rights of the holders of senior debt. As a result, senior subordinated debt is riskier than senior debt. Although such loans are sometimes secured by significant collateral, we principally rely on the borrower’s cash flow for repayment. Additionally, we often receive warrants to acquire shares of stock in borrowers in connection with these loans.
Junior Subordinated Debt
Structurally, junior subordinated debt is subordinate in priority of payment to senior debt (and is often unsecured), but is senior in priority to equity. Junior subordinated debt often has elements of both debt and equity instruments, having the fixed returns associated with senior debt while also providing the opportunity to participate in the future growth potential of a company through an equity component, typically in the form of warrants. Due to its higher risk profile and less restrictive covenants, loans associated with junior subordinated debt financing generally earn a higher return than senior debt or senior subordinated debt instruments.
ONGOING RELATIONSHIPS WITH PORTFOLIO COMPANIES
Monitoring. We monitor the financial trends of each portfolio company to assess the appropriate course of action for each company and to evaluate overall portfolio quality. We closely monitor the status and performance of each individual company on at least a quarterly and, in most cases, a monthly basis.
5
Table of Contents
We have several methods of evaluating and monitoring the performance of our bilateral debt and equity positions, including but not limited to the following:
| • | assessment of business development success, including product development, profitability and the portfolio company’s overall adherence to its business plan; |
| • | periodic and regular contact with portfolio company management to discuss financial position, requirements and accomplishments; |
| • | periodic formal update interviews with portfolio company management and, if appropriate, the financial or strategic sponsor; |
| • | board observation rights; and |
| • | review of monthly and quarterly financial statements and financial projections for portfolio companies. |
In addition, we may from time to time identify investments that require closer monitoring or become workout assets. In such cases, we will develop a strategy for workout assets and periodically gauge our progress against that strategy. As a private equity holder, we may incur losses from our investing activities from time to time, however we attempt where possible to work with troubled portfolio companies in order to recover as much of our investments as is practicable.
Portfolio Grading
We have developed a credit grading system to monitor the quality of our debt investment portfolio. We use an investment rating scale of 1 to 5. The following table provides a description of the conditions associated with each debt investment. Equity securities are not graded.
| Grade |
Summary Description | |
| 1 |
Company is ahead of expectations and/or outperforming financial covenant requirements and such trend is expected to continue. | |
| 2 |
Full repayment of principal and interest is expected. | |
| 3 |
Closer monitoring is required. Full repayment of principal and interest is expected. | |
| 4 |
A reduction of interest income has occurred or is expected to occur. No loss of principal is expected. | |
| 5 |
A loss of some portion of principal is expected. | |
Managerial assistance
As a business development company, we are required to offer managerial assistance to portfolio companies. This assistance typically involves monitoring the operations of portfolio companies, participating in their board and management meetings, consulting with and advising their officers and providing other organizational and financial guidance.
Portfolio Overview
We seek to create a portfolio that includes primarily senior secured loans, senior subordinated and junior subordinated debt investments, as well as warrants and other equity instruments we may receive in connection with such debt investments. We generally expect to invest between $5 million and $25 million in each of our portfolio companies. We expect that our investment portfolio will be diversified among a large number of investments with few investments, if any, exceeding 5% of the total portfolio.
The following is a representative list of the industries in which we have invested:
| • Software |
• Enterprise software | |
| • IT value-added reseller |
• IT consulting | |
| • Structured finance |
• Healthcare | |
| • Printing and publishing |
• Building and development | |
| • Semiconductor capital equipment |
• Telecommunication services | |
| • Food products manufacturer |
• Interactive voice messaging services | |
6
Table of Contents
| • Financial intermediaries |
• Auto parts manufacturer | |
| • Advertising |
• Retail | |
| • Business services |
• Computer hardware | |
| • Packaging and glass |
• Web hosting | |
| • Education |
• Cable/satellite television | |
During 2011 we have seen significant price volatility for corporate loans consistent with many other parts of the debt and equity markets. Although corporate loan prices may still be below historical averages, our view is that certain, primarily larger-issuer, broadly syndicated corporate loans still may not adequately reflect the spreads necessary to compensate investors for the risks involved. In view of the above circumstances, we continue to focus more heavily on middle-market issuers and to a limited extent larger issuers, and, opportunistically, on certain structured finance investments, including CLO investment vehicles, and have recently made a number of selective purchases in these markets. During the fiscal year ended December 31, 2011, we invested approximately $272.5 million comprised of approximately 84.4% in senior secured notes, 11.7% in CLO equity and 3.9% in CLO debt. At December 31, 2011, our portfolio was invested approximately 74.1% in senior secured notes and bonds, 13.0% in CLO debt, 10.0% in CLO equity, 1.3% in subordinated notes and 1.6% in equity.
TEN LARGEST PORTFOLIO INVESTMENTS AS OF DECEMBER 31, 2011
Our ten largest portfolio company investments at December 31, 2011, based on the combined fair value of the debt and equity securities we hold in each portfolio company, were as follows:
| At December 31, 2011 | ||||||||||||||
| ($ in millions) | ||||||||||||||
| Portfolio Company |
Industry | Cost | Fair Value |
Fair Value Percentage of Total Portfolio |
||||||||||
| American Integration Technologies, LLC |
Semiconductor capital equipment | $ | 21.1 | $ | 22.6 | 5.8 | % | |||||||
| Algorithmic Implementations, Inc |
Software | 17.4 | 15.7 | 4.0 | % | |||||||||
| Pegasus Solutions, Inc. |
Enterprise software | 7.9 | 11.3 | 2.9 | % | |||||||||
| Nextag, Inc. |
Retail | 10.2 | 10.4 | 2.7 | % | |||||||||
| Stratus Technologies, Inc |
Computer hardware | 9.7 | 10.1 | 2.6 | % | |||||||||
| Endurance International Group, Inc. |
Web hosting | 9.9 | 10.0 | 2.5 | % | |||||||||
| Decision Resources, LLC. |
Healthcare | 10.2 | 9.9 | 2.5 | % | |||||||||
| Vision Solutions, Inc. |
Software | 9.9 | 9.6 | 2.5 | % | |||||||||
| Unitek Global Services, Inc. |
IT consulting | 7.7 | 7.7 | 2.0 | % | |||||||||
| AKQA, Inc. |
Advertising | 7.7 | 7.6 | 1.9 | % | |||||||||
|
|
|
|
|
|
|
|||||||||
| Total |
$ | 111.7 | $ | 114.9 | 29.4 | % | ||||||||
|
|
|
|
|
|
|
|||||||||
For a description of the factors relevant to the changes in the value of the above portfolio investments for the year ended December 31, 2011, see “Management’s Discussion and Analysis of Financial Condition and Results of Operations—Portfolio Grading.”
Set forth below are descriptions of the ten largest portfolio investments as of December 31, 2011:
American Integration Technologies, LLC
American Integration Technologies, LLC (“AIT”) is a semiconductor capital equipment contract manufacturer. AIT specializes in precision sheet metal fabrication, tubular frame welding, integration of components and assembly of complex equipment, primarily used for the semiconductor industry.
Our original investment in AIT, which closed in May 2006, consisted of $12.0 million in senior secured notes. During April 2007, we invested an additional $15.0 million in senior secured notes. Also, during 2007 through 2008, AIT paid down approximately $6.1 million on the notes. In April 2010, the notes were restructured and AIT paid down approximately $2.0 million of the notes; as of December 31, 2011, $23.4 million remained outstanding.
7
Table of Contents
Algorithmic Implementations, Inc. (d/b/a “Ai Squared”)
Algorithmic Implementations, Inc. (“Ai Squared”) has been providing assistive technology for more than 15 years to computer users with low vision. The Company’s flagship product is ZoomText, a screen magnification and reading software application for the visually impaired.
Our investment in Ai Squared, which closed in September 2006, consisted of $22.0 million in senior secured notes and common stock. TICC and an individual investor each acquired 50% of the outstanding equity of Ai Squared in connection with our investment in the company. As of December 31, 2011, approximately $14.6 million remained outstanding on our investment in the senior secured notes.
Pegasus Solutions, Inc.
Pegasus Solutions, Inc. (“Pegasus”) provides mission-critical technology and services to hotels and travel distributors. Pegasus’ services include central reservations systems (“CRSs”), distribution systems linking CRSs to travel agent systems and travel websites, third-party hotel marketing services and commission processing for hotels, travel agents and travel websites.
In January 2010, we acquired $4.8 million in second lien senior secured notes issued by Pegasus, and during September 2010, we acquired $3.0 million in first lien senior secured notes. As of December 31, 2011, approximately $8.6 million remained outstanding on our combined investment in the senior secured notes, including PIK interest.
Nextag, Inc.
Nextag, Inc. (“Nextag”) is a pure-play online comparison shopping marketplace with diversified operations in multiple vertical categories which enable consumers to find items to buy, compare products, prices and stores, and make purchases from online merchants.
In February 2011, we acquired $11.2 million in senior secured notes issued by Nextag. As of December 31, 2011, approximately $10.8 million remained outstanding on our investment in the senior secured notes.
Stratus Technologies, Inc.
Stratus Technologies, Inc. provides fault tolerant computer products, servers and services for companies which require continuous operations to run mission critical businesses.
In April 2010, we purchased $10.0 million of the first lien secured high yield notes issued by Stratus, as well as common and preferred equity. As of December 31, 2011, approximately $9.8 million remained outstanding on our investment in the notes.
Endurance International Group, Inc.
Endurance International Group, Inc. (“Endurance”) primarily provides web hosting and online services to businesses.
In December 2011, we purchased $10.0 million of the senior secured term loan notes issued by Endurance. As of December 31, 2011, $10.0 million remained outstanding on our investment in the senior secured notes.
Decision Resources, LLC
Decision Resources, LLC (“Decision Resources”) provides information services across pharmaceutical and biotechnology markets, managed care markets and medical technology device markets to assist their clients in decision making and identification of growth opportunities.
In December 2010, we purchased $4.5 million of the 1st lien senior secured notes issued by Decision Resources and during January 2011, we purchased an additional $500,000 of the same notes. In May 2011, we acquired $5.3 million of the 2nd lien senior secured notes issued by Decision Resources. As of December 31, 2011, $10.3 million remained outstanding on our combined investments in the senior secured notes.
Vision Solutions, Inc.
Vision Solutions, Inc. (“Vision”) is a provider of information availability software, which is defined as software that prevents and manages system downtime.
8
Table of Contents
In March 2011, we acquired $10.0 million of the 2nd lien senior secured notes issued by Vision. As of December 31, 2011, $10.0 million remained outstanding on our investment in the senior secured notes.
Unitek Global Services, Inc.
Unitek Global Services, Inc. (“Unitek”) is a full-service provider of permanently outsourced infrastructure services, offering an end-to-end suit of technical services to the wireless and wireline telecommunications, satellite television and broadband cable industries, operating throughout the U.S. and Canada. Unitek’s services include network engineering and design, construction and project management, comprehensive installation and fulfillment, and wireless telecommunication infrastructure services.
In April 2011, we acquired $8.0 million in the senior secured notes issued by Unitek. As of December 31, 2011, $7.9 million remained outstanding on our investment in the senior secured notes.
AKQA, Inc.
AKQA, Inc. (“AKQA”) is a digital interactive advertising company that delivers marketing solutions to blue chip clients. AKQA focuses on creating and delivering marketing solutions in digital media such as the Internet, mobile products, digital outdoor signage, gaming consoles and kiosks.
In March 2007, we acquired $25.0 million in senior secured notes issued by AKQA. During 2008 and 2009, we sold approximately $15.0 million of those notes. As of December 31, 2011, approximately $7.7 million remained outstanding on our investment in the notes.
INVESTMENT ADVISORY AGREEMENT
Management Services
TICC Management serves as our investment adviser. TICC Management is registered as our investment adviser under the Advisers Act. Subject to the overall supervision of our Board of Directors, TICC Management manages our day-to-day operations of, and provides investment advisory services to us. Under the terms of the Investment Advisory Agreement, TICC Management:
| • | determines the composition of our portfolio, the nature and timing of the changes to our portfolio and the manner of implementing such changes; |
| • | identifies, evaluates and negotiates the structure of the investments we make; |
| • | closes, monitors and services the investments we make; and |
| • | determines what securities we will purchase, retain or sell. |
TICC Management’s services under the Investment Advisory Agreement are not exclusive, and it is free to furnish similar services to other entities so long as its services to us are not impaired. TICC Management has agreed that, during the term of its Investment Advisory Agreement with us, it will not serve as investment adviser to any other public or private entity that utilizes a principal investment strategy of providing debt financing to middle-market companies similar to those we target.
Management Fee
We pay TICC Management a fee for its services under the Investment Advisory Agreement consisting of two components—a base management fee and an incentive fee. The cost of both the base management fee payable to TICC Management and any incentive fees earned by TICC Management are ultimately borne by our common stockholders.
The base management fee (the “Base Fee”) is calculated at an annual rate of 2.00% of our gross assets. For services rendered under the Investment Advisory Agreement, the Base Fee is payable quarterly in arrears, and is calculated based on the average value of our gross assets at the end of the two most recently completed calendar quarters, and appropriately adjusted for any equity or debt capital raises, repurchases or redemptions during the current calendar quarter. The Base Fee for any partial quarter will be appropriately pro rated.
The incentive fee has two parts. The first part is calculated and payable quarterly in arrears based on our “Pre-Incentive Fee Net Investment Income” for the immediately preceding calendar quarter. For this purpose, “Pre-Incentive Fee Net Investment Income” means interest income, dividend income and any other income (including any other fees, such as commitment, origination, structuring, diligence and consulting fees or other fees that we receive from portfolio companies) accrued during the calendar quarter minus our operating expenses for the quarter (including the Base Fee, expenses payable under our administration agreement with BDC Partners (the “Administration Agreement”), and any interest expense and dividends paid on any issued and outstanding preferred stock, but excluding the incentive fee). Pre-Incentive Fee Net Investment Income includes, in the case of investments with a deferred interest
9
Table of Contents
feature (such as original issue discount, debt instruments with PIK interest and zero coupon securities), accrued income that we have not yet received in cash. Pre-Incentive Fee Net Investment Income does not include any realized capital gains, realized capital losses or unrealized capital appreciation or depreciation. Pre-Incentive Fee Net Investment Income, expressed as a rate of return on the value of our net assets at the end of the immediately preceding calendar quarter, is compared to one-fourth of an annual “hurdle rate.”
For each year commencing on or after January 1, 2005, the annual hurdle rate has been determined as of the immediately preceding December 31st by adding 5.0% to the interest rate then payable on the most recently issued five-year U.S. Treasury Notes, up to a maximum annual hurdle rate of 10.0%. The annual hurdle rate for the 2010 calendar year was 7.69% and the annual hurdle rate for the 2011 calendar year was 7.01%. The current hurdle rate for the 2012 calendar year, calculated as of December 31, 2011, is 5.83%. Our net investment income (to the extent not distributed to our shareholders) used to calculate this part of the incentive fee is also included in the amount of our gross assets used to calculate the 2% base management fee. In addition, in the event we recognize PIK loan interest in excess of our available capital, we may be required to liquidate assets in order to pay a portion of the incentive fee. TICC Management, however, is not required to reimburse us for the portion of any fees attributable to accrued deferred loan interest in the event of a default by the obligor. The operation of the incentive fee with respect to our Pre-Incentive Fee Net Investment Income for each quarter is as follows:
| • | no incentive fee is payable to TICC Management in any calendar quarter in which our Pre-Incentive Fee Net Investment Income does not exceed one fourth of the annual hurdle rate (currently 5.83% for the 2012 calendar year). |
| • | 20% of the amount of our Pre-Incentive Fee Net Investment Income, if any, that exceeds one-fourth of the annual hurdle rate in any calendar quarter (currently 5.83% for the 2012 calendar year) is payable to TICC Management (i.e., once the hurdle rate is reached, 20% of all Pre-Incentive Fee Net Investment Income thereafter is allocated to TICC Management). |
For example, for the quarter ended December 31, 2011, pre-incentive fee net investment income of $9,345,654 exceeded the hurdle of $5,359,164 (based upon net assets of $305,801,069 at September 30, 2011 and the quarterly hurdle rate of 1.7525%). The incentive fee rate of 20% resulted in an incentive of $797,298 for the quarter.
The second part of the incentive fee is determined and payable in arrears as of the end of each calendar year (or upon termination of the Investment Advisory Agreement, as of the termination date), and equals 20% of our “Incentive Fee Capital Gains,” which consist of our realized capital gains for each calendar year, computed net of all realized capital losses and unrealized capital depreciation for that calendar year. For accounting purposes only, in order to reflect the theoretical capital gains incentive fee that would be payable for a given period as if all unrealized gains were realized, we will accrue a capital gains incentive fee based upon net realized capital gains and unrealized capital depreciation for that calendar year (in accordance with the terms of the Investment Advisory Agreement), plus unrealized capital appreciation on investments held at the end of the period. It should be noted that a fee so calculated and accrued would not necessarily be payable under the Investment Advisory Agreement, and may never be paid based upon the computation of capital gains incentive fees in subsequent periods. Amounts paid under the Investment Advisory Agreement will be consistent with the formula reflected in the Investment Advisory Agreement.
Example 1: Income Related Portion of Incentive Fee for Each Calendar Quarter (*)
Alternative 1
Assumptions
Investment income (including interest, dividends, fees, etc.) = 1.25%
Quarterly Hurdle rate(1) = 1.4575%
Management fee(2) = 0.5%
Other expenses (legal, accounting, custodian, transfer agent, etc.) = 0.2%
Pre-Incentive Fee Net Investment Income
(investment income – (management fee + other expenses)) = 0.55%
Pre-Incentive Fee Net Investment Income does not exceed the hurdle rate, therefore there is no income-related incentive fee.
Alternative 2
Assumptions
Investment income (including interest, dividends, fees, etc.) = 4.0%
Quarterly Hurdle rate(1) = 1.4575%
Management fee(2) = 0.5%
10
Table of Contents
Other expenses (legal, accounting, custodian, transfer agent, etc.) = 0.2%
Pre-Incentive Fee Net Investment Income
(investment income – (management fee + other expenses)) = 3.3%
| Incentive fee | = 20% x Pre-Incentive Fee Net Investment Income in excess of the hurdle rate | |
| = 20% x (3.3% – 1.4575%) | ||
| = 20% x 1.8425% | ||
| = 0.3685% |
Pre-Incentive Fee Net Investment Income exceeds hurdle rate, therefore the income-related incentive fee is 0.3685%
| (1) | Represents 5.83% annualized hurdle rate for 2012 calendar year. |
| (2) | Represents 2% annualized management fee. |
Example 2: Capital Gains Portion of Incentive Fee (*)
Capital Gains Incentive Fee = 20% x Incentive Fee Capital Gains (i.e., our realized capital gains for each calendar year, computed net of all realized capital losses and unrealized capital depreciation for that calendar year)
Assumptions:
Year 1 = no realized capital gains or losses
Year 2 = 9% realized capital gains, 0% realized capital losses, 1% unrealized depreciation and 0% unrealized appreciation
Year 3 = 12% realized capital gains, 0% realized capital losses, 2% unrealized depreciation and 2% unrealized appreciation
| Year 1 incentive fee |
• Total Incentive Fee Capital Gains = 0 | |
| • No capital gains incentive fee paid to TICC Management in Year 1 | ||
| Year 2 incentive fee |
• Total Incentive Fee Capital Gains = 8% | |
| (9% realized capital gains less 1% unrealized depreciation) | ||
| • Total capital gains incentive fee paid to TICC Management in Year 2 | ||
| = 20% x 8% | ||
| = 1.6% | ||
| Year 3 incentive fee |
• Total Incentive Fee Capital Gains = 10% | |
| (12% realized capital gains less 2% unrealized depreciation; unrealized appreciation has no effect) | ||
| • Total capital gains incentive fee paid to TICC Management in Year 3 | ||
| = 20% x 10% | ||
| = 2% | ||
| (*) | The hypothetical amount of returns shown are based on a percentage of our total net assets and assumes no leverage. There is no guarantee that positive returns will be realized and actual returns may vary from those shown in this example. |
Payment of our Expenses
All personnel of our investment adviser when and to the extent engaged in providing investment advisory services, and the compensation and expenses of such personnel allocable to such services, will be provided and paid for by BDC Partners, the investment adviser’s managing member. We are responsible for all other costs and expenses of our operations and transactions, including, without limitation, the cost of calculating our net asset value; the cost of effecting sales and repurchases of shares of our common stock and other securities; investment advisory fees; fees payable to third parties relating to, or associated with, making investments; transfer agent and custodial fees; federal and state registration fees; any exchange listing fees; federal, state and local taxes; independent directors’ fees and expenses; brokerage commissions; costs of proxy statements, stockholders’ reports and notices; fidelity bond, directors and officers/errors and omissions liability insurance and other insurance premiums; direct costs such as printing, mailing, long distance telephone, staff, independent audits and outside legal costs and all other expenses incurred by either BDC Partners or us in connection with administering our business, including payments under the Administration Agreement that will be based upon our allocable portion of overhead and other expenses incurred by BDC Partners in performing its obligations under the Administration Agreement, including a portion of the rent and the compensation of our Chief Financial Officer, Chief Compliance Officer, Controller and other administrative support personnel. All of these expenses are ultimately borne by our common stockholders.
11
Table of Contents
Duration and Termination
Unless earlier terminated as described below, the Investment Advisory Agreement will remain in effect if approved annually by our Board of Directors or by the affirmative vote of the holders of a majority of our outstanding voting securities, including, in either case, approval by a majority of our directors who are not interested persons. The Investment Advisory Agreement will automatically terminate in the event of its assignment. The Investment Advisory Agreement may be terminated by either party without penalty upon 60 days’ written notice to the other. See “Risk Factors—Risks relating to our business and structure — We are dependent upon TICC Management’s key management personnel for our future success, particularly Jonathan H. Cohen and Saul B. Rosenthal.”
Indemnification
The Investment Advisory Agreement provides that, absent willful misfeasance, bad faith or gross negligence in the performance of their respective duties or by reason of the reckless disregard of their respective duties and obligations, TICC Management and its officers, managers, agents, employees, controlling persons, members and any other person or entity affiliated with it, including without limitation BDC Partners, are entitled to indemnification from TICC for any damages, liabilities, costs and expenses (including reasonable attorneys’ fees and amounts reasonably paid in settlement) arising from the rendering of TICC Management’s services under the Investment Advisory Agreement or otherwise as an investment adviser of TICC.
Organization of the Investment Adviser
TICC Management is a Delaware limited liability company that is registered as an investment adviser under the Advisers Act. BDC Partners, a Delaware limited liability company, is its managing member and provides our investment adviser with all personnel necessary to manage our day-to-day operations and provide the services under the Investment Advisory Agreement. The principal address of TICC Management and of BDC Partners is 8 Sound Shore Drive, Suite 255, Greenwich, Connecticut 06830.
During 2011, Royce and Associates, a Delaware limited liability company, transferred to Mr. Charles M. Royce its membership interest in TICC Management. Following this transaction, Mr. Royce became a non-managing member of TICC Management.
ADMINISTRATION AGREEMENT
Pursuant to a separate Administration Agreement, BDC Partners furnishes us with office facilities, together with equipment and clerical, bookkeeping and record keeping services at such facilities. Under the Administration Agreement, BDC Partners also performs, or oversees the performance of our required administrative services, which includes being responsible for the financial records which we are required to maintain and preparing reports to our stockholders and reports filed with the SEC. In addition, BDC Partners assists us in determining and publishing our net asset value, overseeing the preparation and filing of our tax returns and the printing and dissemination of reports to our stockholders, and generally overseeing the payment of our expenses and the performance of administrative and professional services rendered to us by others. Payments under the Administration Agreement are based upon our allocable portion of overhead and other expenses incurred by BDC Partners in performing its obligations under the Administration Agreement, including a portion of the rent and the compensation of our Chief Financial Officer, Chief Compliance Officer, Controller, and other administrative support personnel. The Administration Agreement may be terminated by either party without penalty upon 60 days’ written notice to the other party.
The Administration Agreement provides that, absent willful misfeasance, bad faith or gross negligence in the performance of their respective duties or by reason of the reckless disregard of their respective duties and obligations, BDC Partners and its officers, manager, agents, employees, controlling persons, members and any other person or entity affiliated with it are entitled to indemnification from TICC for any damages, liabilities, costs and expenses (including reasonable attorneys’ fees and amounts reasonably paid in settlement) arising from the rendering of BDC Partners’ services under the Administration Agreement or otherwise as administrator for TICC.
COMPETITION
Our primary competitors to provide financing to primarily non-public small- and medium-sized companies include private equity and venture capital funds, other equity and non-equity based investment funds, including other business development companies, and investment banks and other sources of financing, including traditional financial services companies such as commercial banks and specialty finance companies. Many of these entities have greater financial and managerial resources than we will have. For additional information concerning the competitive risks we face, see “Risk Factors—Risks Relating to Our Business and Structure—We operate in a highly competitive market for investment opportunities.”
12
Table of Contents
EMPLOYEES
We have no employees. Our day-to-day investment operations are managed by our investment adviser. In addition, we reimburse BDC Partners for an allocable portion of expenses incurred by it in performing its obligations under the Administration Agreement, including a portion of the rent and the compensation of our Chief Financial Officer, Chief Compliance Officer, Controller and other administrative support personnel.
MATERIAL U.S. FEDERAL INCOME TAX CONSIDERATIONS
As a business development company, we have elected to be treated, and intend to qualify annually, as a RIC under Subchapter M of the Code, beginning with our 2003 taxable year. As a RIC, we generally will not have to pay corporate-level U.S. federal income taxes on any ordinary income or capital gains that we distribute to our stockholders as dividends. To continue to qualify as a RIC, we must, among other things, meet certain source-of-income and asset diversification requirements (as described below). In addition, to qualify for RIC tax treatment we must distribute to our stockholders, for each taxable year, at least 90% of our “investment company taxable income,” which is generally our ordinary income plus the excess of our realized net short-term capital gains over our realized net long-term capital losses (the “Annual Distribution Requirement”).
Taxation as a Regulated Investment Company
If we:
| • | qualify as a RIC; and |
| • | satisfy the Annual Distribution Requirement, |
then we will not be subject to U.S. federal income tax on the portion of our investment company taxable income and net capital gain (i.e., realized net long-term capital gains in excess of realized net short-term capital losses) we distribute to stockholders. We will be subject to U.S. federal income tax at the regular corporate rates on any income or capital gains not distributed (or deemed distributed) to our stockholders.
We will be subject to a 4% nondeductible U.S. federal excise tax on certain undistributed income unless we distribute in a timely manner an amount at least equal to the sum of (1) 98% of our net ordinary income for each calendar year, (2) 98.2% of our capital gain net income for the one-year period ending October 31 in that calendar year and (3) any income realized, but not distributed, and on which we paid no federal income tax, in preceding years (the “Excise Tax Avoidance Requirement”). We generally will endeavor in each taxable year to make sufficient distributions to our stockholders to satisfy the Excise Tax Avoidance Requirement.
In order to qualify as a RIC for U.S. federal income tax purposes, we must, among other things:
| • | continue to qualify as a business development company under the 1940 Act at all times during each taxable year; |
| • | derive in each taxable year at least 90% of our gross income from dividends, interest, payments with respect to loans of certain securities, gains from the sale of stock or other securities, net income from certain “qualified publicly traded partnerships,” or other income derived with respect to our business of investing in such stock or securities (the “90% Income Test”); and |
| • | diversify our holdings so that at the end of each quarter of the taxable year: |
| • | at least 50% of the value of our assets consists of cash, cash equivalents, U.S. Government securities, securities of other RICs, and other securities if such other securities of any one issuer do not represent more than 5% of the value of our assets or more than 10% of the outstanding voting securities of the issuer; and |
| • | no more than 25% of the value of our assets is invested in the securities, other than U.S. Government securities or securities of other RICs, of one issuer, of two or more issuers that are controlled, as determined under applicable Code rules, by us and that are engaged in the same or similar or related trades or businesses or of certain “qualified publicly traded partnerships” (the “Diversification Tests”). |
We may be required to recognize taxable income in circumstances in which we do not receive cash. For example, if we hold debt obligations that are treated under applicable tax rules as having original issue discount (such as debt instruments with PIK interest or, in certain cases, increasing interest rates or issued with warrants), we must include in income each year a portion of the original issue discount that accrues over the life of the obligation, regardless of whether cash representing such income is received by us in the same taxable year. We may also have to include in income other amounts that we have not yet received in cash, such as PIK interest and deferred loan origination fees that are paid after origination of the loan or are paid in non-cash compensation such as warrants or stock. Because any original issue discount or other amounts accrued will be included in our investment company taxable income for the year of accrual, we may be required to make a distribution to our stockholders in order to satisfy the Annual Distribution Requirement, even though we will not have received any corresponding cash amount. In addition, we may be required to accrue for
13
Table of Contents
federal income tax purposes amounts attributable to our investment in CLOs that may differ from the distributions received in respect of such investments. Although we do not presently expect to do so, we are authorized to borrow funds, to sell assets and to make taxable distributions of our stock and debt securities in order to satisfy distribution requirements. Our ability to dispose of assets to meet our distribution requirements may be limited by (1) the illiquid nature of our portfolio and/or (2) other requirements relating to our status as a RIC, including the Diversification Tests. If we dispose of assets in order to meet the Annual Distribution Requirement or the Excise Tax Avoidance Requirement, we may make such dispositions at times that, from an investment standpoint, are not advantageous. If we are unable to obtain cash from other sources to satisfy the Annual Distribution Requirement, we may fail to qualify as a RIC and become subject to tax as an ordinary corporation.
Under the 1940 Act, we are not permitted to make distributions to our stockholders while our debt obligations and other senior securities are outstanding unless certain “asset coverage” tests are met. If we are prohibited to make distributions, we may fail to qualify as a RIC and become subject to tax as an ordinary corporation.
We have purchased and may in the future purchase residual or subordinated interests in CLOs that are treated for federal income tax purposes as shares in a “passive foreign investment company” (a “PFIC”). We may be subject to federal income tax on our allocable share of a portion of any “excess distribution” received on, or any gain from the disposition of, such shares even if our allocable share of such income is distributed as a taxable dividend to the PFIC’s stockholders. Additional charges, in the nature of interest, generally will be imposed on us in respect of deferred taxes arising from any such excess distribution or gain. If we elect to treat a PFIC as a “qualified electing fund” under the Code (a “QEF”), in lieu of the foregoing requirements, we will be required to include in income each year our proportionate share of the ordinary earnings and net capital gain of the QEF, even if such income is not distributed by the QEF. Alternatively, we may be able to elect to mark-to-market at the end of each taxable year our shares in a PFIC; in this case, we will recognize as ordinary income our allocable share of any increase in the value of such shares, and as ordinary loss our allocable share of any decrease in such value to the extent that any such decrease does not exceed prior increases included in our income. Under either election, we may be required to recognize in a year income in excess of distributions from PFICs and proceeds from dispositions of PFIC shares during that year, and such income will nevertheless be subject to the Annual Distribution Requirement and will be taken into account for purposes of the 4% excise tax.
Under certain circumstances, a CLO may be treated as a controlled foreign corporation (“CFC”) for U.S. federal income tax purposes. If a CLO is treated as a CFC, and we are considered to own 10% or more of total voting power in such CLO, we would be required to include in income each year any “subpart F income” generated by such CLO, which would generally include its net investment income, regardless of whether we received any distributions with respect to such income.
Although the Code generally provides that income inclusions from a QEF and subpart F income will be “good income” for purposes of the 90% Income Test to the extent it is distributed to a RIC in the year it is included in the RIC’s income, the Code does not specifically provide whether income inclusions from a QEF and subpart F income for which no distribution is received during the RIC’s taxable year would be “good income” for the 90% Income Test. The IRS has issued a series of private rulings in which it has concluded that all income inclusions from a QEF and subpart F income included in a RIC’s income would constitute “good income” for purposes of the 90% Income Test. Such rulings are not binding on the IRS except with respect to the taxpayer to whom such rulings were issued. Accordingly, although we believe that the income inclusions from a QEF and subpart F income of a CLO that we are required to include in our taxable income would be “good income” for purposes of the 90% Income Test, no guaranty can be made that the IRS would not assert that such income would not be “good income” for purposes of the 90% Income Test. If such income were not considered “good income” for purposes of the 90% Income Test, we may fail to qualify as a RIC.
Failure to Qualify as a Regulated Investment Company
If we were unable to qualify for treatment as a RIC, we would be subject to tax on all of our taxable income at regular corporate rates, regardless of whether we make any distributions to our stockholders. Distributions would not be required, and any distributions made in taxable years beginning before January 1, 2013 would be taxable to our stockholders as ordinary dividend income that, subject to certain limitations, may be eligible for the 15% maximum rate to the extent of our current and accumulated earnings and profits. Subject to certain limitations under the Code, corporate distributees would be eligible for the dividends-received deduction. Distributions in excess of our current and accumulated earnings and profits would be treated first as a return of capital to the extent of the stockholder’s tax basis, and any remaining distributions would be treated as a capital gain.
REGULATION AS A BUSINESS DEVELOPMENT COMPANY
General
A business development company is regulated by the 1940 Act. A business development company must be organized in the United States for the purpose of investing in or lending to primarily private companies and making managerial assistance available to them. A business development company may use capital provided by public stockholders and from other sources to invest in long -term, private investments in businesses. A business development company provides stockholders the ability to retain the liquidity of a publicly traded stock, while sharing in the possible benefits, if any, of investing in primarily privately owned companies.
14
Table of Contents
We may not change the nature of our business so as to cease to be, or withdraw our election as, a business development company unless authorized by vote of a majority of the outstanding voting securities, as required by the 1940 Act. A majority of the outstanding voting securities of a company is defined under the 1940 Act as the lesser of: (i) 67% or more of such company’s voting securities present at a meeting if more than 50% of the outstanding voting securities of such company are present or represented by proxy, or (ii) more than 50% of the outstanding voting securities of such company. We do not anticipate any substantial change in the nature of our business.
As with other companies regulated by the 1940 Act, a business development company must adhere to certain substantive regulatory requirements. A majority of our directors must be persons who are not interested persons, as that term is defined in the 1940 Act. Additionally, we are required to provide and maintain a bond issued by a reputable fidelity insurance company to protect the business development company. Furthermore, as a business development company, we are prohibited from protecting any director or officer against any liability to the company or our stockholders arising from willful misfeasance, bad faith, gross negligence or reckless disregard of the duties involved in the conduct of such person’s office.
As a business development company, we are required to meet a coverage ratio of the value of total assets to total senior securities, which include all of our borrowings and any preferred stock we may issue in the future, of at least 200%. We may also be prohibited under the 1940 Act from knowingly participating in certain transactions with our affiliates without the prior approval of our directors who are not interested persons and, in some cases, prior approval by the SEC.
We are not generally able to sell our common stock at a price below net asset value per share. See “Risk Factors—Risks Relating to our Business and Structure—Regulations governing our operation as a business development company affect our ability to, and the way in which we raise additional capital which may expose us to risks, including the typical risks associated with leverage.” We may, however, sell our common stock at a price below net asset value per share (i) in connection with a rights offering to our existing stockholders, (ii) with the consent of the majority of our common stockholders, or (iii) under such other circumstances as the SEC may permit. For example, we may sell our common stock, or warrants, options or rights to acquire our common stock, at a price below the then current net asset value of our common stock if our Board of Directors determines that such sale is in our best interests and the best interests of our stockholders, and our stockholders approve our policy and practice of making such sales. In any such case, under such circumstances, the price at which our common stock to be issued and sold may not be less than a price which, in the determination of our Board of Directors, closely approximates the market value of such common stock. In addition, we may generally issue new shares of our common stock at a price below net asset value in rights offerings to existing stockholders, in payment of dividends and in certain other limited circumstances.
We may be examined by the SEC for compliance with the 1940 Act.
As a business development company, we are subject to certain risks and uncertainties. See “Risk Factors—Risks Relating to our Business and Structure.”
Qualifying Assets
As a business development company, we may not acquire any asset other than “qualifying assets” unless, at the time we make the acquisition, the value of our qualifying assets represent at least 70% of the value of our total assets. The principal categories of qualifying assets relevant to our business are:
| • | Securities purchased in transactions not involving any public offering, the issuer of which is an eligible portfolio company; |
| • | Securities received in exchange for or distributed with respect to securities described in the bullet above or pursuant to the exercise of options, warrants or rights relating to such securities; and |
| • | Cash, cash items, government securities or high quality debt securities (within the meaning of the 1940 Act), maturing in one year or less from the time of investment. |
An eligible portfolio company is generally a domestic company that is not an investment company (other than a small business investment company wholly owned by a business development company) and that:
| • | does not have a class of securities with respect to which a broker may extend margin credit at the time the acquisition is made; |
| • | is controlled by the business development company and has an affiliate of the business development company on its board of directors; |
15
Table of Contents
| • | does not have any class of securities listed on a national securities exchange; |
| • | is a public company that lists its securities on a national securities exchange with a market capitalization of less than $250 million; or |
| • | meets such other criteria as may be established by the SEC. |
Control, as defined by the 1940 Act, is presumed to exist where a business development company beneficially owns more than 25% of the outstanding voting securities of the portfolio company.
In addition, a business development company must have been organized and have its principal place of business in the United States and must be operated for the purpose of making investments in eligible portfolio companies, or in other securities that are consistent with its purpose as a business development company.
Significant Managerial Assistance
To include certain securities described above as qualifying assets for the purpose of the 70% test, a business development company must offer to the issuer of those securities managerial assistance such as providing guidance and counsel concerning the management, operations, or business objectives and policies of a portfolio company. We offer to provide managerial assistance to our portfolio companies.
Code of Ethics
As required by the 1940 Act, we maintain a Code of Ethics that establishes procedures for personal investments and restricts certain transactions by our personnel. See “Risk Factors—Risks Relating to our Business and Structure—There are significant potential conflicts of interest.” Our Code of Ethics generally does not permit investments by our employees in securities that may be purchased or held by us. You may read and copy the Code of Ethics at the SEC’s Public Reference Room in Washington, D.C. You may obtain information on the operation of the Public Reference Room by calling the SEC at 1-800-SEC-0330. In addition, the Code of Ethics is available on the EDGAR Database on the SEC’s Internet site at http://www.sec.gov. You may obtain copies of the Code of Ethics, after paying a duplicating fee, by electronic request at the following Email address: publicinfo@sec.gov, or by writing the SEC’s Public Reference Section, 100 F Street, N.E., Washington, D.C. 20549. Our code of ethics is also available on our website at http://www.ticc.com.
Compliance Policies and Procedures
We and our investment adviser have adopted and implemented written policies and procedures reasonably designed to prevent violation of the federal securities laws, and are required to review these compliance policies and procedures annually for their adequacy and the effectiveness of their implementation, and designate a Chief Compliance Officer to be responsible for administering the policies and procedures.
Sarbanes-Oxley Act of 2002
The Sarbanes-Oxley Act of 2002 imposes a wide variety of new regulatory requirements on publicly-held companies and their insiders. Many of these requirements affect us. For example:
| • | Pursuant to Rule 13a-14 of the 1934 Act, our Chief Executive Officer and Chief Financial Officer must certify the accuracy of the consolidated financial statements contained in our periodic reports; |
| • | Pursuant to Item 307 of Regulation S-K, our periodic reports must disclose our conclusions about the effectiveness of our disclosure controls and procedures; |
| • | Pursuant to Rule 13a-15 of the 1934 Act, our management must prepare a report regarding its assessment of our internal control over financial reporting; and |
| • | Pursuant to Item 308 of Regulation S-K and Rule 13a-15 of the 1934 Act, our periodic reports must disclose whether there were significant changes in our internal controls or in other factors that could significantly affect these controls subsequent to the date of their evaluation, including any corrective actions with regard to significant deficiencies and material weaknesses. |
The Sarbanes-Oxley Act requires us to review our current policies and procedures to determine whether we comply with the Sarbanes-Oxley Act and the regulations promulgated thereunder. We will continue to monitor our compliance with all regulations that are adopted under the Sarbanes-Oxley Act and will take actions necessary to ensure that we are in compliance therewith.
16
Table of Contents
Fundamental Investment Policies
The restrictions identified as fundamental below, along with our investment objective of seeking to maximize total return, are our only fundamental policies. Fundamental policies may not be changed without the approval of the holders of a majority of our outstanding voting securities, as defined in the 1940 Act. The percentage restrictions set forth below, apply at the time a transaction is effected, and a subsequent change in a percentage resulting from market fluctuations or any cause will not require us to dispose of portfolio securities or to take other action to satisfy the percentage restriction.
As a matter of fundamental policy, we will not: (1) act as an underwriter of securities of other issuers (except to the extent that we may be deemed an “underwriter” of securities we purchase that must be registered under the 1933 Act before they may be offered or sold to the public); (2) purchase or sell real estate or interests in real estate or real estate investment trusts (except that we may (A) purchase and sell real estate or interests in real estate in connection with the orderly liquidation of investments, or in connection with foreclosure on collateral, (B) own the securities of companies that are in the business of buying, selling or developing real estate or (C) finance the purchase of real estate by our portfolio companies); (3) sell securities short (except with regard to managing the risks associated with publicly-traded securities issued by our portfolio companies); (4) purchase securities on margin (except to the extent that we may purchase securities with borrowed money); or (5) engage in the purchase or sale of commodities or commodity contracts, including futures contracts (except where necessary in working out distressed loan or investment situations or in hedging the risks associated with interest rate fluctuations), and, in such cases, only after all necessary registrations (or exemptions from registration) with the Commodity Futures Trading Commission have been obtained.
We may invest up to 100% of our assets in securities acquired directly from issuers in privately negotiated transactions. With respect to such securities, we may, for the purpose of public resale, be deemed an “underwriter” as that term is defined in the 1933 Act. Our intention is to not write (sell) or buy put or call options to manage risks associated with the publicly-traded securities of our portfolio companies, except that we may enter into hedging transactions to manage the risks associated with interest rate fluctuations, and, in such cases, only after all necessary registrations (or exemptions from registration) with the Commodity Futures Trading Commission have been obtained. However, we may purchase or otherwise receive warrants to purchase the common stock or other equity securities of our portfolio companies in connection with acquisition financing or other investment. Similarly, in connection with an acquisition, we may acquire rights to require the issuers of acquired securities or their affiliates to repurchase them under certain circumstances. We also do not intend to acquire securities issued by any investment company that exceed the limits imposed by the 1940 Act. Under these limits, unless otherwise permitted by the 1940 Act, we currently cannot acquire more than 3% of the voting securities of any registered investment company, invest more than 5% of the value of our total assets in the securities of one investment company or invest, in the aggregate, in excess of 10% of the value of our total assets in the securities of one or more investment companies. With regard to that portion of our portfolio invested in securities issued by investment companies, it should be noted that such investments might subject our stockholders to additional expenses.
Proxy Voting Policies and Procedures
We have delegated our proxy voting responsibility to our investment adviser, TICC Management. The Proxy Voting Policies and Procedures of TICC Management are set forth below. The guidelines are reviewed periodically by TICC Management and our non-interested directors, and, accordingly, are subject to change. For purposes of these Proxy Voting Policies and Procedures described below, “we” “our” and “us” refers to TICC Management.
Introduction
As an investment adviser registered under the Advisers Act, we have a fiduciary duty to act solely in the best interests of our clients. As part of this duty, we recognize that we must vote client securities in a timely manner free of conflicts of interest and in the best interests of our clients.
These policies and procedures for voting proxies for our investment advisory clients are intended to comply with Section 206 of, and Rule 206(4)-6 under, the Advisers Act.
Proxy Policies
We vote proxies relating to our portfolio securities in the best interests of our clients’ shareholders. We review on a case-by-case basis each proposal submitted to a shareholder vote to determine its impact on the portfolio securities held by our clients. Although we generally vote against proposals that may have a negative impact on our clients’ portfolio securities, we may vote for such a proposal if there exist compelling long-term reasons to do so.
Our proxy voting decisions are made by the senior officers who are responsible for monitoring each of our clients’ investments. To ensure that our vote is not the product of a conflict of interest, we require that: (i) anyone involved in the decision making process disclose to our Chief Compliance Officer any potential conflict that he or she is aware of and any contact that he or she has had with any interested party regarding a proxy vote; and (ii) employees involved in the decision making process or vote administration are prohibited from revealing how we intend to vote on a proposal in order to reduce any attempted influence from interested parties.
17
Table of Contents
Proxy Voting Records
You may obtain information about how we voted proxies by making a written request for proxy voting information to: Chief Compliance Officer, TICC Management, LLC, 8 Sound Shore Drive, Suite 255, Greenwich, CT 06830.
Periodic Reporting and Audited Financial Statements
We have registered our common stock under the Securities Exchange Act of 1934, and have reporting obligations thereunder, including the requirement that we file annual and quarterly reports with the SEC. In accordance with the requirements of the Securities Exchange Act of 1934, this annual report contains consolidated financial statements audited and reported on by our independent registered public accounting firm. You may obtain our annual reports on Form 10-K, our quarterly reports on Form 10-Q, and our current reports on Form 8-K on our website at http://www.ticc.com free of charge as soon as reasonably practicable after we file such reports electronically with the SEC.
NASDAQ Global Select Market Requirements
We have adopted certain policies and procedures intended to comply with the NASDAQ Global Select Market’s corporate governance rules. We will continue to monitor our compliance with all future listing standards that are approved by the SEC and will take actions necessary to ensure that we are in compliance therewith.
| Item 1A. | Risk Factors |
An investment in our securities involves certain risks relating to our structure and investment objectives. The risks set forth below are not the only risks we face, and we face other risks which we have not yet identified, which we do not currently deem material or which are not yet predictable. If any of the following risks occur, our business, financial condition and results of operations could be materially adversely affected. In such case, our net asset value and the trading price of our common stock could decline, and you may lose all or part of your investment.
RISKS RELATING TO OUR BUSINESS AND STRUCTURE
Any failure on our part to maintain our status as a business development company would reduce our operating flexibility.
If we do not remain a business development company, we might be regulated as a closed-end investment company under the 1940 Act, which would subject us to substantially more regulatory restrictions under the 1940 Act and correspondingly decrease our operating flexibility.
We are dependent upon TICC Management’s key management personnel for our future success, particularly Jonathan H. Cohen and Saul B. Rosenthal.
We depend on the diligence, skill and network of business contacts of the senior management of TICC Management. The senior management, together with other investment professionals, will evaluate, negotiate, structure, close, monitor and service our investments. Our future success will depend to a significant extent on the continued service and coordination of the senior management team, particularly Jonathan H. Cohen, the Chief Executive Officer of TICC Management, and Saul B. Rosenthal, the President and Chief Operating Officer of TICC Management. Neither Mr. Cohen nor Mr. Rosenthal will devote all of their business time to our operations, and both will have other demands on their time as a result of their other activities. Neither Mr. Cohen nor Mr. Rosenthal is subject to an employment contract. The departure of either of these individuals could have a material adverse effect on our ability to achieve our investment objective.
Our financial condition and results of operations will depend on our ability to manage our existing portfolio and future growth effectively.
Our ability to achieve our investment objective will depend on our ability to manage our existing portfolio and to grow, which will depend, in turn, on our investment adviser’s ability to identify, analyze, invest in and finance companies that meet our investment criteria, and our ability to raise and retain debt and equity capital. Accomplishing this result on a cost-effective basis is largely a function of our investment adviser’s structuring of the investment process, its ability to provide competent, attentive and efficient services to us and our access to financing on acceptable terms.
18
Table of Contents
We and TICC Management, through its managing member, BDC Partners, will need to continue to hire, train, supervise and manage new employees. Failure to manage our future growth effectively could have a material adverse effect on our business, financial condition and results of operations.
We operate in a highly competitive market for investment opportunities.
A large number of entities compete with us to make the types of investments that we make. We compete with a large number of hedge funds and CLO investment vehicles, other equity and non-equity based investment funds, including other business development companies, investment banks and other sources of financing, including traditional financial services companies such as commercial banks and specialty finance companies. Many of our competitors are substantially larger than us and have considerably greater financial, technical and marketing resources than we do. For example, some competitors may have a lower cost of funds and access to funding sources that are not available to us. In addition, some of our competitors may have higher risk tolerances or different risk assessments, which could allow them to consider a wider variety of investments and establish more relationships than us. Furthermore, many of our competitors are not subject to the regulatory restrictions that the 1940 Act imposes on us as a business development company. There can be no assurance that the competitive pressures we face will not have a material adverse effect on our business, financial condition and results of operations. Also, as a result of this competition, we may not be able to take advantage of attractive investment opportunities from time to time, and we can offer no assurance that we will be able to identify and make investments that are consistent with our investment objective.
Our business model depends upon the development and maintenance of strong referral relationships with private equity and venture capital funds and investment banking firms.
If we fail to maintain our relationships with key firms, or if we fail to establish strong referral relationships with other firms or other sources of investment opportunities, we will not be able to grow our portfolio of loans and achieve our investment objective. In addition, persons with whom we have informal relationships are not obligated to provide us with investment opportunities, and therefore there is no assurance that such relationships will lead to the origination of debt or other investments.
We may not realize gains from our equity investments.
When we invest in debt securities, we may acquire warrants or other equity securities as well. However, the equity interests we receive may not appreciate in value and, in fact, may decline in value. Accordingly, we may not be able to realize gains from our equity interests, and any gains that we do realize on the disposition of any equity interests may not be sufficient to offset any other losses we experience.
Because our investments are generally not in publicly traded securities, there is uncertainty regarding the fair value of our investments, which could adversely affect the determination of our net asset value.
Our portfolio investments are generally not in publicly traded securities. As a result, the fair value of these securities is not readily determinable. We value these securities at fair value as determined in good faith by our Board of Directors based upon the recommendation of the Board’s Valuation Committee. In connection with that determination, members of TICC Management’s portfolio management team prepare portfolio company valuations using the most recent portfolio company financial statements and forecasts. We utilize the services of a third party valuation firm which prepares valuations for each of our bilateral portfolio securities that, when combined with all other investments in the same portfolio company (i) have a value as of the previous quarter of greater than or equal to 2.5% of our total assets as of the previous quarter, and (ii) have a value as of the current quarter of greater than or equal to 2.5% of our total assets as of the previous quarter, after taking into account any repayment of principal during the current quarter. In addition, the frequency of the third party valuations of our bilateral portfolio securities is based upon the grade assigned to each such security under our credit grading system as follows: Grade 1, at least annually; Grade 2, at least semi-annually; Grades 3, 4, and 5, at least quarterly.
TICC Management also retains the authority to seek, on our behalf, additional third party valuations with respect to both our bilateral portfolio securities and our syndicated loan investments. On April 9, 2009, the FASB issued additional guidelines under ASC 820-10-35, “Determining Fair Value When the Volume and Level of Activity for the Asset or Liability Have Significantly Decreased and Identifying Transactions That Are Not Orderly,” which provides guidance on factors that should be considered in determining when a previously active market becomes inactive and whether a transaction is orderly. In accordance with ASC 820-10-35, our valuation procedures specifically provide for the review of indicative quotes supplied by the large agent banks that make a market for each security. However, the marketplace for which we obtain indicative bid quotes for purposes of determining the fair value of our syndicated loan investments have shown these attributes of illiquidity as described by ASC-820-10-35. Due to limited market liquidity in the syndicated loan market, TICC believes that the non-binding indicative bids received from agent banks for certain syndicated investments that we own may not be determinative of their fair value and therefore alternative valuation procedures may need to be undertaken. As a result, TICC has engaged third-party valuation firms to provide assistance in valuing certain syndicated investments
19
Table of Contents
that we own. In addition, TICC Management prepares an analysis of each syndicated loan, including a financial summary, covenant compliance review, recent trading activity in the security, if known, and other business developments related to the portfolio company. All available information, including non-binding indicative bids which may not be determinative of fair value, is presented to the Valuation Committee to consider in its determination of fair value. In some instances, there may be limited trading activity in a security even though the market for the security is considered not active. In such cases the Valuation Committee will consider the number of trades, the size and timing of each trade, and other circumstances around such trades, to the extent such information is available, in its determination of fair value. The Valuation Committee will evaluate the impact of such additional information, and factor it into its consideration of the fair value that is indicated by the analysis provided by third-party valuation firms. We have considered the factors described in ASC 820-10 and have determined that we are properly valuing the securities in our portfolio.
Our Board of Directors retains ultimate authority as to the third-party review cycle as well as the appropriate valuation of each investment. The types of factors that the Valuation Committee takes into account in providing its fair value recommendation to our Board of Directors includes, as relevant, the nature and value of any collateral, the portfolio company’s ability to make payments and its earnings, the markets in which the portfolio company does business, comparison to valuations of publicly traded companies, comparisons to recent sales of comparable companies, the discounted value of the cash flows of the portfolio company and other relevant factors. Because such valuations are inherently uncertain and may be based on estimates, our determinations of fair value may differ materially from the values that would be assessed if a readily available market for these securities existed.
The lack of liquidity in our investments may adversely affect our business.
As stated above, our investments are generally not in publicly traded securities. Substantially all of these securities are subject to legal and other restrictions on resale or will otherwise be less liquid than publicly traded securities. The illiquidity of our investments may make it difficult for us to sell such investments if the need arises. Also, if we are required to liquidate all or a portion of our portfolio quickly, we may realize significantly less than the value at which we have previously recorded our investments.
In addition, because we generally invest in debt securities with a term of up to seven years and generally intend to hold such investments until maturity of the debt, we do not expect realization events, if any, to occur in the near-term. We expect that our holdings of equity securities may require several years to appreciate in value, and we can offer no assurance that such appreciation will occur.
We may experience fluctuations in our quarterly results, and as a result, our financial results for any period should not be relied upon as being indicative of performance of future periods.
We may experience fluctuations in our quarterly operating results due to a number of factors, including the rate at which we make new investments, the interest rates payable on the debt securities we acquire, the default rate on such securities, the level of our expenses, variations in and the timing of the recognition of realized and unrealized gains or losses, the degree to which we encounter competition in our markets and general economic conditions. As a result of these factors, results for any period should not be relied upon as being indicative of performance in future periods.
Capital markets have recently been in a period of disruption and instability. These market conditions have materially and adversely affected debt and equity capital markets in the United States and abroad, which had, and may in the future have, a negative impact on our business and operations.
The global capital markets have recently been in a period of disruption as evidenced by a lack of liquidity in the debt capital markets, significant write-offs in the financial services sector, the re-pricing of credit risk in the broadly syndicated credit market and the failure of certain major financial institutions. Despite actions of the United States federal government and foreign governments, these events contributed to worsening general economic conditions that materially and adversely impacted the broader financial and credit markets and reduced the availability of debt and equity capital for the market as a whole and financial services firms in particular. These conditions could return in the future. Should these conditions return, we and other companies in the financial services sector may have to access, if available, alternative markets for debt and equity capital. Equity capital may be difficult to raise because, subject to some limited exceptions which apply to us, as a BDC we are generally not able to issue additional shares of our common stock at a price less than net asset value. In addition, our ability to incur indebtedness (including by issuing preferred stock) is limited by applicable regulations such that our asset coverage, as defined in the 1940 Act, must equal at least 200% immediately after each time we incur indebtedness. The debt capital that will be available, if at all, may be at a higher cost and on less favorable terms and conditions in the future. Any inability to raise capital could have a negative effect on our business, financial condition and results of operations.
The illiquidity of our investments may make it difficult for us to sell such investments if required. As a result, we may realize significantly less than the value at which we have recorded our investments. In addition, significant changes in the capital markets, including the recent period of extreme volatility and disruption, have had, and may in the future have, a negative effect on the
20
Table of Contents
valuations of our investments and on the potential for liquidity events involving our investments. An inability to raise capital, and any required sale of our investments for liquidity purposes, could have a material adverse impact on our business, financial condition or results of operations.
Economic recessions or downturns could impair our portfolio companies and harm our operating results.
During portions of 2010, the economy was in the midst of a recession and in a period of tightening credit. Many of our portfolio companies may be susceptible to economic slowdowns or recessions and may be unable to repay our loans during these periods. Therefore, our non-performing assets may increase and the value of our portfolio may decrease during these periods as we are required to record the values of our investments. Adverse economic conditions also may decrease the value of collateral securing some of our loans and the value of our equity investments at fair value. Economic slowdowns or recessions could lead to financial losses in our portfolio and a decrease in revenues, net income and assets. Unfavorable economic conditions also could increase our funding costs, limit our access to the capital markets or result in a decision by lenders not to extend credit to us. These events could prevent us from increasing investments and harm our operating results.
A portfolio company’s failure to satisfy financial or operating covenants imposed by us or other lenders could lead to defaults and, potentially, acceleration of the time when the loans are due and foreclosure on its secured assets, which could trigger cross-defaults under other agreements and jeopardize the portfolio company’s ability to meet its obligations under the debt that we hold. We may incur additional expenses to the extent necessary to seek recovery upon default or to negotiate new terms with a defaulting portfolio company. In addition, if one of our portfolio companies were to go bankrupt, depending on the facts and circumstances, including the extent to which we actually provided significant managerial assistance to that portfolio company, a bankruptcy court might recharacterize our debt holding and subordinate all or a portion of our claim to that of other creditors. These events could harm our financial condition and operating results.
The recent downgrade of the U.S. credit rating and the economic crisis in Europe could negatively impact our business, financial condition and results of operations.
Recent U.S. debt ceiling and budget deficit concerns, together with signs of deteriorating sovereign debt conditions in Europe, have increased the possibility of additional credit-rating downgrades and economic slowdowns. Although U.S. lawmakers passed legislation to raise the federal debt ceiling, Standard & Poor’s Ratings Services lowered its long-term sovereign credit rating on the United States from “AAA” to “AA+” in August 2011. The impact of this or any further downgrades to the U.S. government’s sovereign credit rating, or its perceived creditworthiness, and the impact of the current crisis in Europe with respect to the ability of certain European Union countries to continue to service their sovereign debt obligations is inherently unpredictable and could adversely effect the U.S. and global financial markets and economic conditions. There can be no assurance that governmental or other measures to aid economic recovery will be effective. These developments, and the government’s credit concerns in general, could cause interest rates and borrowing costs to rise, which may negatively impact our ability to access the capital markets on favorable terms. In addition, the decreased credit rating could create broader financial turmoil and uncertainty, which may weigh heavily on our stock price. Continued adverse economic conditions could have a material adverse effect on our business, financial condition and results of operations.
21
Table of Contents
The affect of global climate change may impact the operations of our portfolio companies.
There may be evidence of global climate change. Climate change creates physical and financial risk and some of our portfolio companies may be adversely affected by climate change. For example, the needs of customers of energy companies vary with weather conditions, primarily temperature and humidity. To the extent weather conditions are affected by climate change, energy use could increase or decrease depending on the duration and magnitude of any changes. Increases in the cost of energy could adversely affect the cost of operations of our portfolio companies if the use of energy products or services is material to their business. A decrease in energy use due to weather changes may affect some of our portfolio companies’ financial condition, through decreased revenues. Extreme weather conditions in general require more system backup, adding to costs, and can contribute to increased system stresses, including service interruptions.
The impact of recent financial reform legislation on us is uncertain.
In light of current conditions in the U.S. and global financial markets and the U.S. and global economy, legislators, the presidential administration and regulators have increased their focus on the regulation of the financial services industry. The Dodd-Frank Wall Street Reform and Consumer Protection Act (the “Dodd-Frank Reform Act”) became effective on July 21, 2010, although many provisions of the Dodd-Frank Reform Act have delayed effectiveness or will not become effective until the relevant federal agencies issue new rules to implement the Dodd-Frank Reform Act. Nevertheless, the Dodd-Frank Reform Act may have a material adverse impact on the financial services industry as a whole and on our business, results of operations and financial condition. Accordingly, we cannot predict the effect the Dodd-Frank Act or its implementing regulations will have on our business, results of operations or financial condition.
A disruption in the capital markets and the credit markets could negatively affect our business.
As a BDC, we seek to maintain our ability to raise additional capital for investment purposes. Without sufficient access to the capital markets or credit markets, we may not be able to pursue new business opportunities. Disruptive conditions in the financial industry and the impact of new legislation in response to those conditions could restrict our business operations and could adversely impact our results of operations and financial condition.
Our ability to grow our business could be impaired by an inability to access the capital markets or to enter into new credit facilities. At various times over the past three years, reflecting concern about the stability of the financial markets, many lenders and institutional investors have reduced or ceased providing funding to borrowers. This market disruption and tightening of credit has led to increased market volatility and widespread reduction of business activity generally. If we are unable to raise additional equity capital or consummate new credit facilities on terms that are acceptable to us, we may not be able to initiate significant originations.
These situations may arise due to circumstances that we may be unable to control, such as access to the credit markets, a severe decline in the value of the U.S. dollar, a further economic downturn or an operational problem that affects third parties or us, and could materially damage our business. Even though if such conditions have improved broadly and significantly over the short-term, adverse conditions in particular sectors of the financial markets could adversely impact our business over the long-term.
Price declines and illiquidity in the corporate debt markets have adversely affected, and may continue to adversely affect, the fair value of our portfolio investments, reducing our net asset value through increased net unrealized depreciation.
As a BDC, we are required to carry our investments at market value or, if no market value is ascertainable, at fair value as determined in good faith by or under the direction of our Board of Directors. Decreases in the market values or fair values of our investments are recorded as unrealized depreciation. Depending on market conditions, we may incur substantial losses in future periods, which could have a material adverse impact on our business, financial condition and results of operations.
Even in the event the value of your investment declines, the management fee and, in certain circumstances, the incentive fee will still be payable.
The management fee is calculated as 2.0% of the value of our gross assets at a specific time. Accordingly, the management fee will be payable regardless of whether the value of our gross assets and/or your investment have decreased. Moreover, a portion of the incentive fee is payable if our net investment income for a calendar quarter exceeds a designated hurdle rate. This portion of the incentive fee is payable without regard to any capital gain, capital loss or unrealized depreciation that may occur during the quarter. Accordingly, this portion of our adviser’s incentive fee may also be payable notwithstanding a decline in net asset value that quarter. In addition, in the event we recognize deferred loan interest income in excess of our available capital as a result of our receipt of payment-in-kind, or “PIK” interest, we may be required to liquidate assets in order to pay a portion of the incentive fee. TICC Management, however, is not required to reimburse us for the portion of any incentive fees attributable to deferred loan interest income in the event of a subsequent default.
22
Table of Contents
We are permitted to borrow money, which magnifies the potential for gain or loss on amounts invested and may increase the risk of investing in us.
On August 10, 2011, we completed a $225,000,000 debt securitization financing transaction. The notes were issued by a newly formed special purpose vehicle in which our wholly-owned subsidiary owns all of the equity. The notes have an initial face amount of $101,250,000, are rated AAA/Aaa by Standard & Poor’s Ratings Services and Moody’s Investors Service, Inc., respectively, and bear interest, after the effective date, at three-month London Inter Bank Offered Rate (“LIBOR”) plus 2.25% (prior to the effective date, the Class A Notes bear interest at five-month LIBOR plus 2.25%). The notes have a stated maturity date of July 25, 2021 and are subject to a three year non-call period. TICC CLO has a three year reinvestment period.
Borrowings, also known as leverage, magnify the potential for gain or loss on amounts invested and, therefore, increase the risks associated with investing in our securities. We may borrow from and issue senior debt securities to banks, insurance companies, and other lenders. Lenders of these senior securities have fixed dollar claims on our assets that are superior to the claims of our common stockholders. If the value of our assets increases, then leveraging would cause the net asset value attributable to our common stock to increase more sharply than it would have had we not leveraged. Conversely, if the value of our assets decreases, leveraging would cause net asset value to decline more sharply than it otherwise would have had we not leveraged. Similarly, any increase in our income in excess of interest payable on the borrowed funds would cause our net income to increase more than it would without the leverage, while any decrease in our income would cause net income to decline more sharply than it would have had we not borrowed. Such a decline could negatively affect our ability to make common stock dividend payments. Leverage is generally considered a speculative investment technique. Our ability to service any debt that we incur will depend largely on our financial performance and will be subject to prevailing economic conditions and competitive pressures. Moreover, as the management fee payable to TICC Management will be payable on our gross assets, including those assets acquired through the use of leverage, TICC Management may have a financial incentive to incur leverage which may not be consistent with our stockholders’ interests. In addition, our common stockholders will bear the burden of any increase in our expenses as a result of leverage, including any increase in the management fee payable to TICC Management.
Illustration. The following table illustrates the effect of leverage on returns from an investment in our common stock assuming various annual returns on the portfolio, net of expenses. The calculations in the table below are hypothetical and actual returns may be higher or lower than those appearing in the table below.
| Assumed total return on our portfolio (net of expenses) |
||||||||||||||||||||
| (10.0 | )% | (5.0 | )% | 0.0 | % | 5.0 | % | 10.0 | % | |||||||||||
|
|
|
|
|
|
|
|
|
|
|
|||||||||||
| Corresponding return to stockholder(1) |
(14.3 | )% | (7.7 | )% | (1.0 | )% | 5.7 | % | 12.3 | % | ||||||||||
| (1) | Assumes $404.8 million in total assets and $101.25 million in total debt outstanding, which reflects our total assets and total debt outstanding as of December 31, 2011, and a cost of funds of 3.0%. Excludes non-portfolio investment assets and non-leverage related liabilities. |
We are subject to risks associated with the debt securitization financing transaction that we completed on August 10, 2011.
As a result of the debt securitization financing transaction that we completed on August 10, 2011, we are subject to a variety of risks, including those set forth below:
We are subject to certain risks as a result of our indirect interests in the subordinated notes and membership interests of the Securitization Issuer.
Under the terms of the master loan sale agreement governing the debt securitization financing transaction, (1) we sold and/or contributed to Holdings all of our ownership interest in our portfolio loans and participations for the purchase price and other consideration set forth in the master loan sale agreement and (2) Holdings, in turn, sold and/or contributed to the Securitization Issuer all of its ownership interest in such portfolio loans and participations for the purchase price and the consideration set forth in the master loan sale agreement. Following these transfers, the Securitization Issuer, and not Holdings or us, held all of the ownership interest in such portfolio loans and participations. As a result of the debt securitization financing transaction, we hold indirectly through Holdings Subordinated Notes as well as membership interests, which comprise 100% of the equity interests, in the Securitization Issuer. As a result, we consolidate the financial statements of Holdings and the Securitization Issuer in our consolidated
23
Table of Contents
financial statements. Because each of Holdings and the Securitization Issuer is disregarded as an entity separate from its owner for U.S. federal income tax purposes, the sale or contribution by us to Holdings, and by Holdings to the Securitization Issuer, did not constitute a taxable event for U.S. federal income tax purposes. If the U.S. Internal Revenue Service were to take a contrary position, there could be a material adverse effect on our business, financial condition, results of operations or cash flows. The securities issued by the Securitization Issuer, or by any securitization vehicle we sponsor in the future, could be acquired by another business development company or securitization vehicle subject to the satisfaction of certain conditions. We may also, from time to time, hold asset-backed securities, or the economic equivalent thereof, issued by a securitization vehicle sponsored by another business development company to the extent permitted under the 1940 Act.
The Subordinated Notes and membership interests in the Securitization Issuer are subordinated obligations of the Securitization Issuer.
The Subordinated Notes are the junior class of notes issued by the Securitization Issuer, are subordinated in priority of payment to the Class A Notes issued by the Securitization Issuer and are subject to certain payment restrictions set forth in the indenture governing the notes. Therefore, Holdings only receives cash distributions on the Subordinated Notes if the Securitization Issuer has made all cash interest payments on the Class A Notes it has issued, and we only receive cash distributions in respect of our indirect ownership of the Securitization Issuer to the extent that Holdings receives any cash distributions in respect of its direct ownership of the Securitization Issuer. The Subordinated Notes are also unsecured and rank behind all of the secured creditors, known or unknown, of the Securitization Issuer, including the holders of the Class A Notes it has issued. Consequently, to the extent that the value of the Securitization Issuer’s portfolio of loan investments has been reduced as a result of conditions in the credit markets, or as a result of defaulted loans or individual fund assets, the value of the Subordinated Notes at their redemption could be reduced. Accordingly, our investment in the Securitization Issuer may be subject to complete loss.
The membership interests in the Securitization Issuer represent all of the equity interest in the Securitization Issuer. As such, the holder of the membership interests is the residual claimant on distributions, if any, made by the Securitization Issuer after holders of all classes of notes issued by the Securitization Issuer have been paid in full on each payment date or upon maturity of such notes under the debt securitization financing transaction documents. Such payments may be made by the Securitization Issuer only to the extent permitted under such documents on any payment date or upon payment in full of the notes issued by the Securitization Issuer. We cannot assure you that distributions on the assets held by the Securitization Issuer will be sufficient to make any distributions to us or that such distributions will meet our expectations.
The interests of holders of the senior class of securities issued by the Securitization Issuer may not be aligned with our interests.
The Class A Notes are the debt obligations ranking senior in right of payment to the Subordinated Notes. As such, there are circumstances in which the interests of holders of the Class A Notes may not be aligned with the interests of holders of the Subordinated Notes and the membership interests of the Securitization Issuer. For example, under the terms of the Class A Notes, holders of the Class A Notes have the right to receive payments of principal and interest prior to holders of the Subordinated Notes and the membership interests.
For as long as the Class A Notes remain outstanding, holders of the Class A Notes have the right to act, in certain circumstances, with respect to the portfolio loans in ways that may benefit their interests but not the interests of holders of Subordinated Notes and membership interests, including by exercising remedies under the indenture in the debt securitization financing transaction.
If an event of default has occurred and acceleration occurs in accordance with the terms of the indenture, the Class A Notes then outstanding will be paid in full before any further payment or distribution on the Subordinated Notes. In addition, if an event of default occurs, holders of a majority of the Class A Notes will be entitled to determine the remedies to be exercised under the indenture, subject to the terms of the indenture. For example, upon the occurrence of an event of default with respect to the notes issued by the Securitization Issuer, the trustee or holders of a majority of the Class A Notes may declare the principal, together with any accrued interest, of all the notes of such class and any junior classes to be immediately due and payable. This would have the effect of accelerating the principal on such notes, triggering a repayment obligation on the part of the Securitization Issuer. If at such time the portfolio loans were not performing well, the Securitization Issuer may not have sufficient proceeds available to enable the trustee under the indenture to repay the obligations of holders of the Subordinated Notes, or to pay a dividend to holders of the membership interests.
Remedies pursued by the holders of Class A Notes could be adverse to the interests of the holders of the Subordinated Notes, and the holders of Class A Notes will have no obligation to consider any possible adverse effect on such other interests. Thus, any remedies pursued by the holders of Class A Notes may not be in the best interests of Holdings and that Holdings may not receive payments or distributions upon an acceleration of the Subordinated Notes. Any failure of the Securitization Issuer to make distributions on the notes we indirectly hold, whether as a result of an event of default or otherwise, could have a material adverse effect on our business, financial condition, results of operations and cash flows and may result in an inability of us to make distributions sufficient to allow our qualification as a RIC.
24
Table of Contents
The Securitization Issuer may fail to meet certain asset coverage tests.
Under the documents governing the debt securitization financing transaction, there are two asset coverage tests applicable to the Class A Notes. The first such test compares the amount of interest received on the portfolio loans held by the Securitization Issuer to the amount of interest payable in respect of the Class A Notes, interest received on the portfolio loans must equal at least 200% or greater (based upon a graduated scale provided for in the indenture) of the interest payable in respect of the Class A Notes. The second such test compares the principal amount of the portfolio loans to the aggregate outstanding principal amount of the Class A Notes. To meet this test at any time, the aggregate principal amount of the portfolio loans must equal at least 135% of the outstanding principal amount of the Class A Notes. If either coverage test is not satisfied, interest and principal received by the Securitization Issuer are diverted on the following payment date to pay the Class A Notes in full to the extent necessary to cause all coverage tests to be satisfied on a pro forma basis after giving effect to all payments made in respect of the notes, which we refer to as a mandatory redemption. If any asset coverage test with respect to the Class A Notes is not met or if the Securitization Issuer fails to obtain a confirmation of the initial ratings of the Class A Notes after the effective date (defined under the indenture as the earlier to occur of April 3, 2012 or the time that the Securitization Issuer has acquired (or committed to acquire) at least $224.1 million in assets), proceeds from the portfolio of loan investments that otherwise would have been distributed to the Securitization Issuer and the holders of the Subordinated Notes will instead be used to redeem first the Class A Notes, to the extent necessary to satisfy the applicable asset coverage tests or to obtain the necessary ratings confirmation.
We may not receive cash on our equity interests in the Securitization Issuer.
We receive cash from the Securitization Issuer only to the extent that Holdings receives payments on the Subordinated Notes or membership interests. The Securitization Issuer may only make payments on such securities to the extent permitted by the payment priority provisions of the indenture governing the notes, which generally provides that principal payments on the Subordinated Notes may not be made on any payment date unless all amounts owing under the Class A Notes are paid in full. In addition, if the Securitization Issuer does not meet the asset coverage tests or the interest coverage test set forth in the documents governing the debt securitization financing transaction, cash would be diverted from the Subordinated Notes to first pay the Class A Notes in amounts sufficient to cause such tests to be satisfied. In the event that we fail to indirectly receive cash from the Securitization Issuer, we could be unable to make such distributions in amounts sufficient to maintain our status as a RIC, or at all. We also could be forced to sell investments in portfolio companies at less than their fair value in order to continue making such distributions. However, the indenture places significant restrictions on the Securitization Issuer’s ability to sell investments. As a result, there may be times or circumstances during which the Securitization Issuer is unable to sell investments or take other actions that might be in our best interests.
We may be required to assume liabilities of the Securitization Issuer.
As part of the debt securitization financing transaction, we entered into a master loan sale agreement under which we would be required to repurchase any loan (or participation interest therein) which was sold to the Securitization Issuer in breach of any representation or warranty made by us with respect to such loan on the date such loan was sold. To the extent we fail to satisfy any such repurchase obligation, the trustee may, on behalf of the Securitization Issuer, bring an action against us to enforce these repurchase obligations.
The structure of the debt securitization financing transaction is intended to prevent, in the event of our bankruptcy or the bankruptcy of Holdings, the consolidation of the Securitization Issuer with our operations or those of Holdings. If the true sale of these assets were not respected in the event of our insolvency, a trustee or debtor-in-possession might reclaim the assets of the Securitization Issuer for our estate. However, in doing so, we would become directly liable for all of the indebtedness then outstanding under the debt securitization financing transaction, which would equal the full amount of debt of the Securitization Issuer reflected on our consolidated balance sheet. In addition, we cannot assure that the recovery in the event we were consolidated with the Securitization Issuer for purposes of any bankruptcy proceeding would exceed the amount to which we would otherwise be entitled as an indirect holder of the Subordinated Notes had we not been consolidated with the Securitization Issuer.
Regulations governing our operation as a BDC affect our ability to, and the way in which we raise additional capital, which may expose us to risks, including the typical risks associated with leverage.
Our ability to grow our business requires a substantial amount of capital, which we may acquire from the following sources:
Senior Securities and Other Indebtedness
We may issue debt securities or preferred stock and/or borrow money from banks or other financial institutions, which we refer to collectively as “senior securities,” up to the maximum amount permitted by the 1940 Act. Under the provisions of the 1940 Act, we
25
Table of Contents
are permitted, as a business development company, to issue senior securities in amounts such that our asset coverage ratio, as defined in the 1940 Act, equals at least 200% of gross assets less all liabilities and indebtedness not represented by senior securities, after each issuance of senior securities. This requirement of sustaining a 200% asset coverage ratio limits the amount that we may borrow. Because we will continue to need capital to grow our loan and investment portfolio, this limitation may prevent us from incurring debt. Further additional debt financing may not be available on favorable terms, if at all, or may be restricted by the terms of our debt facilities. If we are unable to incur additional debt, we may be required to raise additional equity at a time when it may be disadvantageous to do so.
As a result of the issuance of senior securities, including preferred stock and debt securities, we are exposed to typical risks associated with leverage, including an increased risk of loss and an increase in expenses, which are ultimately borne by our common stockholders. Because we may incur leverage to make investments, a decrease in the value of our investments would have a greater negative impact on the value of our common stock. When we issue debt securities or preferred stock, it is likely that such securities will be governed by an indenture or other instrument containing covenants restricting our operating flexibility. In addition, such securities may be rated by rating agencies, and in obtaining a rating for such securities, we may be required to abide by operating and investment guidelines that could further restrict our operating flexibility.
On August 10, 2011, we completed a $225,000,000 debt securitization financing transaction. The notes were issued by a newly formed special purpose vehicle in which our wholly-owned subsidiary owns all of the equity. The notes have an initial face amount of $101,250,000, are rated AAA/Aaa by Standard & Poor’s Ratings Services and Moody’s Investors Service, Inc., respectively, and bear interest, after the effective date, at three-month LIBOR plus 2.25% (prior to the effective date, the Class A Notes bear interest at five-month LIBOR plus 2.25%). The notes have a stated maturity date of July 25, 2021 and are subject to a three year non-call period. TICC CLO has a three year reinvestment period.
Our ability to pay dividends or issue additional senior securities would be restricted if our asset coverage ratio was not at least 200%. If the value of our assets declines, we may be unable to satisfy this test. If that happens, we may be required to sell a portion of our investments and, depending on the nature of our leverage, repay a portion of our indebtedness at a time when such sales may be disadvantageous. Furthermore, any amounts that we use to service our indebtedness would not be available for distributions to our common stockholders.
Common Stock
We are not generally able to issue and sell our common stock at a price below net asset value per share. We may, however, sell our common stock, or warrants, options or rights to acquire our common stock, at a price below the then-current net asset value of our common stock if our Board of Directors determines that such sale is in the best interests of TICC and its stockholders, and our stockholders approve such sale. In certain limited circumstances, pursuant to an SEC staff interpretation, we may also issue shares at a price below net asset value in connection with a transferable rights offering so long as: (1) the offer does not discriminate among stockholders; (2) we use our best efforts to ensure an adequate trading market exists for the rights; and (3) the ratio of the offering does not exceed one new share for each three rights held. If we raise additional funds by issuing more common stock or senior securities convertible into, or exchangeable for, our common stock, the percentage ownership of our stockholders at that time would decrease and they may experience dilution. Moreover, we can offer no assurance that we will be able to issue and sell additional equity securities in the future, on favorable terms or at all.
Our Board of Directors is authorized to reclassify any unissued shares of common stock into one or more classes of preferred stock, which could convey special rights and privileges to its owners.
Our charter permits our Board of Directors to reclassify any authorized but unissued shares of stock into one or more classes of preferred stock. We are currently authorized to issue up to 100,000,000 shares of common stock, of which 32,818,428 shares are issued and outstanding as of March 13, 2012. In the event our Board of Directors opts to reclassify a portion of our unissued shares of common stock into a class of preferred stock, those preferred shares would have a preference over our common stock with respect to dividends and liquidation. The cost of any such reclassification would be borne by our existing common stockholders. The class voting rights of any preferred shares we may issue could make it more difficult for us to take some actions that may, in the future, be proposed by our Board of Directors and/or the holders of our common stock, such as a merger, exchange of securities, liquidation, or alteration of the rights of a class of our securities, if these actions were perceived by the holders of preferred shares as not in their best interests. The issuance of preferred shares convertible into shares of common stock might also reduce the net income and net asset value per share of our common stock upon conversion. These effects, among others, could have an adverse effect on your investment in our common stock.
26
Table of Contents
A change in interest rates may adversely affect our profitability.
On August 10, 2011, we completed a $225,000,000 debt securitization financing transaction. The notes were issued by a newly formed special purpose vehicle in which our wholly-owned subsidiary owns all of the equity. The notes have an initial face amount of $101,250,000, are rated AAA/Aaa by Standard & Poor’s Ratings Services and Moody’s Investors Service, Inc., respectively, and bear interest, after the effective date, at three-month LIBOR plus 2.25% (prior to the effective date, the Class A Notes bear interest at five-month LIBOR plus 2.25%). As a result, a portion of our income will depend upon the difference between LIBOR and the interest rate on the debt securities in which we invest.
Currently, only three of the debt investments in our investment portfolio are at a fixed rate, while the others are at variable rates. Although we have not done so in the past, we may in the future choose to hedge against interest rate fluctuations by using standard hedging instruments such as futures, options and forward contracts, subject to applicable legal requirements. These activities may limit our ability to participate in the benefits of lower interest rates with respect to the hedged portfolio. Adverse developments resulting from changes in interest rates or hedging transactions could have a material adverse effect on our business, financial condition and results of operations. Also, we have limited experience in entering into hedging transactions, and we will initially have to purchase or develop such expertise if we choose to employ hedging strategies in the future.
We will be subject to corporate-level income tax if we are unable to qualify as a RIC for federal income tax purposes.
To remain entitled to the tax benefits accorded to RICs under the Code, we must meet certain income source, asset diversification and annual distribution requirements. In order to qualify as a RIC, we must derive each taxable year at least 90% of our gross income from dividends, interest, payments with respect to certain securities loans, gains from the sale of stock or other securities, or other income derived with respect to our business of investing in such stock or securities. The annual distribution requirement for a RIC is satisfied if we distribute at least 90% of our ordinary income and realized net short-term capital gains in excess of realized net long-term capital losses, if any, to our stockholders on an annual basis. Because we use debt financing, we are subject to certain asset coverage ratio requirements under the 1940 Act and financial covenants under loan and credit agreements that could, under certain circumstances, restrict us from making distributions necessary to satisfy the annual distribution requirement. If we are unable to obtain cash from other sources, we may fail to qualify for special tax treatment as a RIC and, thus, may be subject to corporate-level income tax on all of our income.
In addition, we have purchased and may in the future purchase residual or subordinated interests in CLOs that are treated for U.S. federal income tax purposes as shares in a PFIC. We may be subject to U.S. federal income tax on our allocable share of a portion of any “excess distribution” received on, or any gain from the disposition of, such shares even if our allocable share of such income is distributed as a taxable dividend to the PFIC’s stockholders. Additional charges, in the nature of interest, generally will be imposed on us in respect of deferred taxes arising from any such excess distribution or gain. If we elect to treat a PFIC as a QEF under the Code, in lieu of the foregoing requirements, we will be required to include in income each year our proportionate share of the ordinary earnings and net capital gain of the QEF, even if such income is not distributed by the QEF. Alternatively, we may elect mark-to-market treatment for a PFIC; in this case, we will recognize as ordinary income our allocable share of any increase in the value of such shares, and as ordinary loss our allocable share of any decrease in such value to the extent that any such decrease does not exceed prior increases included in our income. Under either election, we may be required to recognize in a year income in excess of distributions from PFICs and proceeds from dispositions of PFIC shares during that year, and such income will nevertheless be subject to the annual distribution requirement described above.
To qualify as a RIC, we must also meet certain asset diversification requirements at the end of each calendar quarter. Failure to meet these tests may result in our having to dispose of certain investments quickly in order to prevent the loss of RIC status. Because most of our investments will be in private companies, any such dispositions could be made at disadvantageous prices and may result in substantial losses. If we fail to qualify as a RIC for any reason and remain or become subject to corporate income tax, the resulting corporate taxes could substantially reduce our net assets, the amount of income available for distribution and the amount of our distributions. Such a failure would have a material adverse effect on us and our stockholders.
We may choose to pay dividends in our own common stock, in which case our stockholders may be required to pay federal income taxes in excess of the cash dividends they receive.
We may distribute taxable dividends that are payable in cash or shares of our common stock at the election of each stockholder. IRS Revenue Procedure 2010-12 temporarily allows a RIC whose stock is publicly traded on an established securities market in the U.S. to distribute its own stock as a dividend for the purpose of fulfilling its distribution requirements. Pursuant to this revenue procedure, a RIC may treat a distribution of its own stock as fulfilling its distribution requirements if (i) the distribution is declared on or before December 31, 2012, with respect to a taxable year ending on or before December 31, 2011, and (ii) each stockholder may elect to receive his or her entire distribution in either cash or stock of the RIC subject to a limitation on the aggregate amount of cash to be distributed to all stockholders, which limitation must be at least 10% of the aggregate declared distribution. Under Revenue
27
Table of Contents
Procedure 2010-12, if too many stockholders elect to receive cash, each stockholder electing to receive cash will receive a pro rata amount of cash (with the balance of the distribution paid in stock). In no event will any stockholder, electing to receive cash, receive less than 10% of his or her entire distribution in cash. If the requirements of Revenue Procedure 2010-12 are met, for U.S federal income tax purposes, the amount of the dividend paid in stock will be equal to the amount of cash that could have been received instead of stock.
Where Revenue Procedure 2010-12 is not currently applicable, the IRS has also issued private letter rulings on cash/stock dividends paid by RICs and real estate investment trusts using a 20% cash standard (and, more recently, the 10% cash standard of Revenue Procedure 2010-12) if certain requirements are satisfied. Stockholders receiving such dividends will be required to include the full amount of the dividend (including the portion payable in stock) as ordinary income (or, in certain circumstances, long-term capital gain) to the extent of our current and accumulated earnings and profits for federal income tax purposes. As a result, stockholders may be required to pay income taxes with respect to such dividends in excess of the cash dividends received. If a U.S. stockholder sells the common stock that it receives as a dividend in order to pay this tax, the sales proceeds may be less than the amount included in income with respect to the dividend, depending on the market price of our common stock at the time of the sale. Furthermore, with respect to non-U.S. stockholders, we may be required to withhold U.S. tax with respect to such dividends, including in respect of all or a portion of such dividend that is payable in common stock. In addition, if a significant number of our stockholders determine to sell shares of our common stock in order to pay taxes owed on dividends, it may put downward pressure on the trading price of our common stock. It is unclear whether and to what extent we will be able to pay taxable dividends of the type described in this paragraph (whether pursuant to Revenue Procedure 2010-12, a private letter ruling or otherwise). We have no current intention to make a taxable dividend payable in our stock.
We may have difficulty paying our required distributions if we recognize income before or without receiving cash representing such income.
For federal income tax purposes, we will include in income certain amounts that we have not yet received in cash, such as original issue discount, which may arise if we receive warrants in connection with the making of a loan or possibly in other circumstances, or contracted PIK interest, which represents contractual interest added to the loan balance and due at the end of the loan term. In addition, we may be required to accrue for federal income tax purposes amounts attributable to our investment in CLOs that may differ from the distributions received in respect of such investments. We also may be required to include in income certain other amounts that we will not receive in cash.
Because in certain cases we may recognize income before or without receiving cash representing such income, we may have difficulty satisfying the annual distribution requirement applicable to RICs. Accordingly, we may have to sell some of our investments at times we would not consider advantageous, raise additional debt or equity capital, reduce new investments or make taxable distributions of our stock or debt securities to meet that distribution requirement. If we are not able to obtain cash from other sources, we may fail to qualify for RIC tax treatment and thus be subject to corporate-level income tax.
In addition, original issue discount income for certain portfolio investments may or may not be included as a factor in the determination of the fair value of such investments.
There are significant potential conflicts of interest between TICC and our management team.
In the course of our investing activities, we pay management and incentive fees to TICC Management, and reimburse BDC Partners for certain expenses it incurs. As a result, investors in our common stock invest on a “gross” basis and receive distributions on a “net” basis after expenses, resulting in, among other things, a lower rate of return than one might achieve through direct investments. As a result of this arrangement, there may be times when the management team of TICC Management has interests that differ from those of our stockholders, giving rise to a conflict.
TICC Management receives a quarterly incentive fee based, in part, on our “Pre-Incentive Fee Net Investment Income,” if any, for the immediately preceding calendar quarter. This incentive fee is subject to a quarterly hurdle rate before providing an incentive fee return to TICC Management. To the extent we or TICC Management are able to exert influence over our portfolio companies, the quarterly pre-incentive fee may provide TICC Management with an incentive to induce our portfolio companies to accelerate or defer interest or other obligations owed to us from one calendar quarter to another.
In addition, our executive officers and directors, and the executive officers of TICC Management, and its managing member, BDC Partners, serve or may serve as officers and directors of entities that operate in a line of business similar to our own. Accordingly, they may have obligations to investors in those entities, the fulfillment of which might not be in the best interests of us or our stockholders. Charles M. Royce, the non-executive Chairman of our Board of Directors, holds a minority, non-controlling interest in our investment adviser. BDC Partners is the managing member of Oxford Gate Capital, LLC, a private fund in which Messrs. Cohen, Rosenthal and Conroy, along with certain investment and administrative personnel of TICC Management, are invested.
28
Table of Contents
Messrs. Cohen and Rosenthal also currently serve as Chief Executive Officer and President, respectively, for T2 Advisers, LLC, the investment adviser to Greenwich Loan Income Fund Limited (f/k/a T2 Income Fund Limited) (“GLIF”), a Guernsey fund investing in syndicated loans across a variety of industries globally. BDC Partners is the managing member of T2 Advisers, LLC. Further, Messrs. Cohen and Rosenthal currently serve as Chief Executive Officer and President, respectively, of Oxford Lane Capital Corp., a non-diversified closed-end management investment company that currently invests primarily in CLO debt and equity tranches, and its investment adviser, Oxford Lane Management. BDC Partners provides Oxford Lane Capital Corp. with office facilities and administrative services pursuant to an administration agreement and also serves as the managing member of Oxford Lane Management. In addition, Patrick F. Conroy, the Chief Financial Officer, Chief Compliance Officer and Corporate Secretary of TICC Management, BDC Partners and TICC, serves in the same capacities for Oxford Lane Capital Corp. and Oxford Lane Management and also serves as the Chief Financial Officer of GLIF and as the Chief Financial Officer, Chief Compliance Officer and Treasurer of T2 Advisers, LLC. Because of these possible conflicts of interest, these individuals may direct potential business and investment opportunities to other entities rather than to us or such individuals may undertake or otherwise engage in activities or conduct on behalf of such other entities that is not in, or which may be adverse to, our best interests.
BDC Partners has adopted a written policy with respect to the allocation of investment opportunities among TICC, Oxford Lane Capital Corp., Greenwich Loan Income Fund Limited and Oxford Gate Capital, LLC in view of the potential conflicts of interest raised by the relationships described above.
In the ordinary course of business, we may enter into transactions with portfolio companies that may be considered related party transactions. In order to ensure that we do not engage in any prohibited transactions with any persons affiliated with us, we have implemented certain policies and procedures whereby our executive officers screen each of our transactions for any possible affiliations between the proposed portfolio investment, us, companies controlled by us and our employees and directors. We will not enter into any agreements unless and until we are satisfied that doing so will not raise concerns under the 1940 Act or, if such concerns exist, we have taken appropriate actions to seek board review and approval or exemptive relief for such transaction. Our Board of Directors reviews these procedures on an annual basis.
We have also adopted a Code of Ethics which applies to, among others, our senior officers, including our Chief Executive Officer and Chief Financial Officer, as well as all of our officers, directors and employees. Our Code of Ethics requires that all employees and directors avoid any conflict, or the appearance of a conflict, between an individual’s personal interests and our interests. Pursuant to our Code of Ethics, each employee and director must disclose any conflicts of interest, or actions or relationships that might give rise to a conflict, to our Chief Compliance Officer. Our Audit Committee is charged with approving any waivers under our Code of Ethics. As required by the NASDAQ Global Select Market corporate governance listing standards, the Audit Committee of our Board of Directors is also required to review and approve any transactions with related parties (as such term is defined in Item 404 of Regulation S-K).
Changes in laws or regulations governing our operations may adversely affect our business.
We and our portfolio companies are subject to regulation by laws at the local, state and federal levels. These laws and regulations, as well as their interpretation, may be changed from time to time. Any change in these laws or regulations could have a material adverse effect on our business. In particular, legislative initiatives relating to climate change, healthcare reform and similar public policy matters may impact the portfolio companies in which we invest to the extent they operate in industries that may be subject to such changes.
If we do not invest a sufficient portion of our assets in qualifying assets, we could fail to qualify as a business development company or be precluded from investing according to our current business strategy.
As a business development company, we may not acquire any assets other than “qualifying assets” unless, at the time of and after giving effect to such acquisition, at least 70% of our total assets are qualifying assets. See “Business — Regulation as a Business Development Company.”
We believe that most of our portfolio investments will constitute qualifying assets. However, we may be precluded from investing in what we believe are attractive investments if such investments are not qualifying assets for purposes of the 1940 Act. If we do not invest a sufficient portion of our assets in qualifying assets, we could lose our status as a BDC, which would have a material adverse effect on our business, financial condition and results of operations. Similarly, these rules could prevent us from making follow-on investments in existing portfolio companies (which could result in the dilution of our position) or could require us to dispose of investments at inappropriate times in order to comply with the 1940 Act. If we need to dispose of such investments quickly, it would be difficult to dispose of such investments on favorable terms. For example, we may have difficulty in finding a buyer and, even if we do find a buyer, we may have to sell the investments at a substantial loss.
29
Table of Contents
Provisions of the Maryland General Corporation Law and of our charter and bylaws could deter takeover attempts and have an adverse impact on the price of our common stock.
Our charter and bylaws, as well as certain statutory and regulatory requirements, contain certain provisions that may have the effect of discouraging a third party from making an acquisition proposal for us. These anti-takeover provisions may inhibit a change of control in circumstances that could give the holders of our common stock the opportunity to realize a premium over the market price for our common stock.
RISKS RELATED TO OUR INVESTMENTS
Our investment portfolio may be concentrated in a limited number of portfolio companies, which will subject us to a risk of significant loss if any of these companies defaults on its obligations under any of its debt securities that we hold or if the sectors in which we invest experience a market downturn.
A consequence of our limited number of investments is that the aggregate returns we realize may be significantly adversely affected if a small number of investments perform poorly or if we need to write down the value of any one investment. Beyond our income tax asset diversification requirements, we do not have fixed guidelines for diversification, and our investments could be concentrated in relatively few issuers. On December 3, 2007, we changed our name from Technology Investment Capital Corp. to TICC Capital Corp. While we have historically focused on the technology sector, we expect to actively seek new investment opportunities outside this sector that otherwise meet our investment criteria. As a result, a market downturn, including a downturn in the sectors in which we invest, could materially adversely affect us.
Most of our debt investments will not fully amortize during their lifetime, which may subject us to the risk of loss of our principal in the event a portfolio company is unable to repay us prior to maturity.
Most of our debt investments are not structured to fully amortize during their lifetime. Accordingly, if a portfolio company has not previously pre-paid its debt investment to us, a significant portion of the principal amount due on such a debt investment may be due at maturity. In order to create liquidity to pay the final principal payment, a portfolio company typically must raise additional capital. If they are unable to raise sufficient funds to repay us, the debt investment may go into default, which may compel us to foreclose on the borrower’s assets, even if the debt investment was otherwise performing prior to maturity. This may deprive us from immediately obtaining full recovery on the debt investment and may prevent or delay the reinvestment of the investment proceeds in other, possibly more profitable investments.
The sectors in which we invest are subject to many risks, including volatility, intense competition, decreasing life cycles and periodic downturns which could result in a heightened risk of loss on your investment.
We invest in companies which may have relatively short operating histories. The revenues, income (or losses) and valuations of these companies can and often do fluctuate suddenly and dramatically. Also, the technology-related sector, on which we have historically focused, in particular, is generally characterized by abrupt business cycles and intense competition. The recent cyclical economic downturn has resulted in substantial decreases in the market capitalization of many companies. While such valuations have recovered to some extent, we can offer no assurance that such decreases in market capitalizations will not recur, or that any future decreases in valuations will be insubstantial or temporary in nature. Therefore, our portfolio companies may face considerably more risk of loss than companies in other industry sectors.
In addition, because of rapid technological change, the average selling prices of products and some services provided by the technology-related sector, on which we have historically focused, have historically decreased over their productive lives. As a result, the average selling prices of products and services offered by some of our portfolio companies may decrease over time, which could adversely affect their operating results and their ability to meet their obligations under their debt securities, as well as the value of any equity securities, that we may hold. This could, in turn, materially adversely affect our business, financial condition and results of operations.
Our investments in the companies that we target may be extremely risky and we could lose all or part of our investments.
Although a prospective portfolio company’s assets are one component of our analysis when determining whether to provide debt capital, we generally do not base an investment decision primarily on the liquidation value of a company’s balance sheet assets. Instead, given the nature of the companies that we invest in, we also review the company’s historical and projected cash flows, equity capital and “soft” assets, including intellectual property (patented and non-patented), databases, business relationships (both
30
Table of Contents
contractual and non-contractual) and the like. Accordingly, considerably higher levels of overall risk will likely be associated with our portfolio compared with that of a traditional asset-based lender whose security consists primarily of receivables, inventories, equipment and other tangible assets. Interest rates payable by our portfolio companies may not compensate for these additional risks, any of which could cause us to lose part or all of our investment.
Specifically, investment in certain of the companies that we are invested in involves a number of significant risks, including:
| • | these companies may have limited financial resources and may be unable to meet their obligations under their debt securities that we hold, which may be accompanied by a deterioration in the value of any collateral and a reduction in the likelihood of us realizing any value from the liquidation of such collateral; |
| • | they may have limited operating histories, narrower product lines and smaller market shares than larger businesses, which may tend to render them more vulnerable to competitors’ actions and market conditions, as well as general economic downturns; |
| • | because many of them tend to be privately owned, there is generally little publicly available information about these businesses; therefore, although TICC Management’s agents will perform “due diligence” investigations on these portfolio companies, their operations and their prospects, we may not learn all of the material information we need to know regarding these businesses; |
| • | some of these companies are more likely to depend on the management talents and efforts of a small group of persons; therefore, the death, disability, resignation or termination of one or more of these persons could have a material adverse impact on our portfolio company and, in turn, on us; |
| • | some of these companies may have less predictable operating results, may from time to time be parties to litigation, may be engaged in rapidly changing businesses with products subject to a substantial risk of obsolescence, and may require substantial additional capital to support their operations, finance expansion or maintain their competitive position; and |
| • | many of these companies may be more susceptible to economic recessions or downturns than other better capitalized companies that operate in less capital intensive industries. |
A portfolio company’s failure to satisfy financial or operating covenants imposed by us or other lenders could lead to defaults and, potentially, termination of its loans and foreclosure on its assets, which could trigger cross-defaults under other agreements and jeopardize our portfolio company’s ability to meet its obligations under the debt securities that we hold. We may incur expenses to the extent necessary to seek recovery upon default or to negotiate new terms with a defaulting portfolio company. In addition, if a portfolio company goes bankrupt, even though we may have structured our interest as senior debt, depending on the facts and circumstances, including the extent to which we actually provided significant “managerial assistance” to that portfolio company, a bankruptcy court might recharacterize our debt holding and subordinate all or a portion of our claim to that of other creditors.
Our failure to make follow-on investments in our portfolio companies could impair the value of our investment portfolio.
Following an initial investment in a portfolio company, we may make additional investments in that portfolio company as “follow-on” investments, in order to: (i) increase or maintain in whole or in part our equity ownership percentage; (ii) exercise warrants, options or convertible securities that were acquired in the original or subsequent financing; or (iii) attempt to preserve or enhance the value of our investment.
We may elect not to make follow-on investments or otherwise lack sufficient funds to make those investments. We have the discretion to make any follow-on investments, subject to the availability of capital resources. The failure to make follow-on investments may, in some circumstances, jeopardize the continued viability of a portfolio company and our initial investment, or may result in a missed opportunity for us to increase our participation in a successful operation. Even if we have sufficient capital to make a desired follow-on investment, we may elect not to make a follow-on investment because we may not want to increase our concentration of risk, because we prefer other opportunities, or because we are inhibited by compliance with business development company requirements or the desire to maintain our tax status.
Our incentive fee may induce TICC Management to use leverage and to make speculative investments.
The incentive fee payable by us to TICC Management may create an incentive for TICC Management to use leverage and to make investments on our behalf that are risky or more speculative than would be the case in the absence of such compensation arrangement. The way in which the incentive fee on “Pre-Incentive Fee Net Investment Income” is determined, which is calculated as a percentage of the return on invested capital, may encourage TICC Management to use leverage to increase the return on our investments. Under certain circumstances, the use of leverage may increase the likelihood of default, which would disfavor holders of our common stock. Similarly, because TICC Management may also receive an incentive fee based, in part, upon the capital gains
31
Table of Contents
realized on our investments, the investment adviser may invest more than would otherwise be appropriate in companies whose securities are likely to yield capital gains, as compared to income producing securities. Such a practice could result in our investing in more speculative securities than would otherwise be the case, which could result in higher investment losses, particularly during an economic downturn.
Our portfolio companies may incur debt that ranks equally with, or senior to, our investments in such companies.
We intend to invest primarily in senior debt securities, but may also invest in subordinated debt securities, issued by our portfolio companies. In some cases, portfolio companies will be permitted to have other debt that ranks equally with, or senior to, the debt securities in which we invest. By their terms, such debt instruments may provide that the holders thereof are entitled to receive payment of interest or principal on or before the dates on which we are entitled to receive payments in respect of the debt securities in which we invest. Also, in the event of insolvency, liquidation, dissolution, reorganization or bankruptcy of a portfolio company, holders of debt instruments ranking senior to our investment in that portfolio company would typically be entitled to receive payment in full before we receive any distribution in respect of our investment. After repaying such senior creditors, such portfolio company may not have any remaining assets to use for repaying its obligations to us. In the case of debt ranking equally with debt securities in which we invest, we would have to share on an equal basis any distributions with other creditors holding such debt in the event of an insolvency, liquidation, dissolution, reorganization or bankruptcy of the relevant portfolio company. In addition, we will not be in a position to control any portfolio company by investing in its debt securities. As a result, we are subject to the risk that a portfolio company in which we invest may make business decisions with which we disagree and the management of such companies, as representatives of the holders of their common equity, may take risks or otherwise act in ways that do not best serve our interests as debt investors.
Because we generally do not hold controlling equity interests in our portfolio companies, we may not be in a position to exercise control over our portfolio companies or to prevent decisions by the managements of our portfolio companies that could decrease the value of our investments.
Although we have taken and may in the future take controlling equity positions in our portfolio companies from time to time, we generally do not do so. As a result, we are subject to the risk that a portfolio company may make business decisions with which we disagree, and the stockholders and management of a portfolio company may take risks or otherwise act in ways that are adverse to our interests. Due to the lack of liquidity for the debt and equity investments that we typically hold in our portfolio companies, we may not be able to dispose of our investments in the event we disagree with the actions of a portfolio company, and may therefore suffer a decrease in the value of our investments.
Our investments in CLO vehicles may be riskier and less transparent than direct investments in portfolio companies.
From time to time we have and may in the future invest in debt and residual value interests of CLO vehicles. Generally, there may be less information available to us regarding the underlying debt investments held by such CLOs than if we had invested directly in the underlying companies. Our CLO investments will also be subject to the risk of leverage associated with the debt issued by such CLOs and the repayment priority of debt holders senior to us in such CLOs.
Some instruments issued by CLO vehicles may not be readily marketable and may be subject to restrictions on resale. Securities issued by CLO vehicles are generally not listed on any U.S. national securities exchange and no active trading market may exist for the securities of CLO vehicles in which we may invest. Although a secondary market may exist for our investments in CLO vehicles, the market for our investments in CLO vehicles may be subject to irregular trading activity, wide bid/ask spreads and extended trade settlement periods. As a result, these types of investments may be more difficult to value.
Failure by a CLO vehicle in which we are invested to satisfy certain tests will harm our operating results.
The failure by a CLO vehicle in which we invest to satisfy financial covenants, including with respect to adequate collateralization and/or interest coverage tests, could lead to a reduction in its payments to us. In the event that a CLO vehicle fails certain tests, holders of debt senior to us may be entitled to additional payments that would, in turn, reduce the payments we would otherwise be entitled to receive. Separately, we may incur expenses to the extent necessary to seek recovery upon default or to negotiate new terms, with a defaulting CLO vehicle or any other investment we may make. If any of these occur, it could materially and adversely affect our operating results and cash flows.
Our financial results may be affected adversely if one or more of our significant equity or junior debt investments in a CLO vehicle defaults on its payment obligations or fails to perform as we expect or if the market price fluctuates significantly in such illiquid investments.
32
Table of Contents
Up to 30% of our portfolio may consist of equity and junior debt investments in CLO vehicles, which involves a number of significant risks. CLO vehicles that we invest in are typically very highly levered (10-14 times), and therefore, the junior debt and equity tranches that we invest in are subject to a higher degree of risk of total loss. In particular, investors in CLO vehicles indirectly bear risks of the underlying debt investments held by such CLO vehicles. We will generally have the right to receive payments only from the CLO vehicles, and will generally not have direct rights against the underlying borrowers or the entity that sponsored the CLO vehicle. While the CLO vehicles we have and continue to target generally enable the investor to acquire interests in a pool of leveraged corporate loans without the expenses associated with directly holding the same investments, when we invest in an equity tranche of a CLO vehicle we will generally pay a proportionate share of the CLO vehicles’ administrative and other expenses. Although it is difficult to predict whether the prices of indices and securities underlying CLO vehicles will rise or fall, these prices (and, therefore, the prices of the CLO vehicles) will be influenced by the same types of political and economic events that affect issuers of securities and capital markets generally.
The interests we intend to acquire in CLO vehicles will likely be thinly traded or have only a limited trading market. CLO vehicles are typically privately offered and sold, even in the secondary market. As a result, investments in CLO vehicles may be characterized as illiquid securities. In addition to the general risks associated with investing in debt securities, CLO vehicles carry additional risks, including, but not limited to: (i) the possibility that distributions from collateral securities will not be adequate to make interest or other payments; (ii) the quality of the collateral may decline in value or default; (iii) the fact that our investments in CLO tranches will likely be subordinate to other senior classes of note tranches thereof; and (iv) the complex structure of the security may not be fully understood at the time of investment and may produce disputes with the CLO vehicle or unexpected investment results.
Investments in structured vehicles, including equity and junior debt instruments issued by CLO vehicles, involve risks, including credit risk and market risk. Changes in interest rates and credit quality may cause significant price fluctuations. Additionally, changes in the underlying leveraged corporate loans held by a CLO vehicle may cause payments on the instruments we hold to be reduced, either temporarily or permanently.
Structured investments, particularly the subordinated interests in which we intend to invest, are less liquid than many other types of securities and may be more volatile than the leveraged corporate loans underlying the CLO vehicles we intend to target. Fluctuations in interest rates may also cause payments on the tranches of CLO vehicles that we hold to be reduced, either temporarily or permanently.
Investments in foreign securities may involve significant risks in addition to the risks inherent in U.S. investments.
Our investment strategy involves investments in securities issued by foreign entities, including foreign CLO vehicles. Investing in foreign entities may expose us to additional risks not typically associated with investing in U.S. issues. These risks include changes in exchange control regulations, political and social instability, expropriation, imposition of foreign taxes, less liquid markets and less available information than is generally the case in the U.S., higher transaction costs, less government supervision of exchanges, brokers and issuers, less developed bankruptcy laws, difficulty in enforcing contractual obligations, lack of uniform accounting and auditing standards and greater price volatility. Further, we, and the CLO vehicles in which we invest, may have difficulty enforcing creditor’s rights in foreign jurisdictions. In addition, the underlying companies of the CLO vehicles in which we invest may be foreign, which may create greater exposure for us to foreign economic developments.
Although we expect that most of our investments will be U.S. dollar-denominated, any investments denominated in a foreign currency will be subject to the risk that the value of a particular currency will change in relation to one or more other currencies. Among the factors that may affect currency values are trade balances, the level of short-term interest rates, differences in relative values of similar assets in different currencies, long-term opportunities for investment and capital appreciation, and political developments. We may employ hedging techniques to minimize these risks, but we can offer no assurance that we will, in fact, hedge currency risk, or that if we do, such strategies will be effective.
RISKS RELATED TO AN INVESTMENT IN OUR COMMON STOCK
Our common stock price may be volatile.
The trading price of our common stock may fluctuate substantially depending on many factors, some of which are beyond our control and may not be directly related to our operating performance. These factors include, but are not limited to, the following:
| • | price and volume fluctuations in the overall stock market from time to time; |
| • | significant volatility in the market price and trading volume of securities of regulated investment companies, business development companies or other financial services companies; |
33
Table of Contents
| • | changes in regulatory policies or tax guidelines with respect to regulated investment companies or business development companies; |
| • | actual or anticipated changes in our earnings or fluctuations in our operating results or changes in the expectations of securities analysts; |
| • | general economic conditions and trends; |
| • | loss of a major funding source; or |
| • | departures of key personnel. |
In the past, following periods of volatility in the market price of a company’s securities, securities class action litigation has often been brought against that company. Due to the potential volatility of our stock price, we may therefore be the target of securities litigation in the future. Securities litigation could result in substantial costs and divert management’s attention and resources from our business.
Our shares of common stock have traded at a discount from net asset value and may do so in the future.
Shares of closed-end investment companies have frequently traded at a market price that is less than the net asset value that is attributable to those shares. In part as a result of adverse economic conditions and increasing pressure within the financial sector of which we are a part, our common stock consistently traded below our net asset value per share throughout 2009 and during some periods in 2010 and 2011. Our common stock could trade at a discount to net asset value at any time in the future. The possibility that our shares of common stock may trade at a discount from net asset value over the long term is separate and distinct from the risk that our net asset value will decrease. We cannot predict whether shares of our common stock will trade above, at or below our net asset value. If our common stock trades below its net asset value, we will generally not be able to issue additional shares of our common stock at its market price without first obtaining the approval for such issuance from our stockholders and our independent directors. If additional funds are not available to us, we could be forced to curtail or cease our new lending and investment activities, and our net asset value could decrease and our level of distributions could be impacted.
You may not receive dividends or our dividends may decline or may not grow over time.
We cannot assure you that we will achieve investment results or maintain a tax status that will allow or require any specified level of cash distributions or year-to-year increases in cash distributions. In particular, our future dividends are dependent upon the investment income we receive on our portfolio investments. To the extent such investment income declines, our ability to pay future dividends may be harmed.
Your interest in us may be diluted if you do not fully exercise your subscription rights in any rights offering.
In the event we issue subscription rights to purchase shares of our common stock, stockholders who do not fully exercise their rights should expect that they will, at the completion of the offer, own a smaller proportional interest in us than would otherwise be the case if they fully exercised their rights. We cannot state precisely the amount of any such dilution in share ownership because we do not know at this time what proportion of the shares will be purchased as a result of the offer.
In addition, if the subscription price is less than our net asset value per share, then our stockholders would experience an immediate dilution of the aggregate net asset value of their shares as a result of the offer. The amount of any decrease in net asset value is not predictable because it is not known at this time what the subscription price and net asset value per share will be on the expiration date of the rights offering or what proportion of the shares will be purchased as a result of the offer. Such dilution could be substantial.
If we issue preferred stock, the net asset value and market value of our common stock will likely become more volatile.
We cannot assure you that the issuance of preferred stock would result in a higher yield or return to the holders of the common stock. The issuance of preferred stock would likely cause the net asset value and market value of the common stock to become more volatile. If the dividend rate on the preferred stock were to approach the net rate of return on our investment portfolio, the benefit of leverage to the holders of the common stock would be reduced. If the dividend rate on the preferred stock were to exceed the net rate of return on our portfolio, the leverage would result in a lower rate of return to the holders of common stock than if we had not issued preferred stock. Any decline in the net asset value of our investments would be borne entirely by the holders of common stock. Therefore, if the market value of our portfolio were to decline, the leverage would result in a greater decrease in net asset value to the holders of common stock than if we were not leveraged through the issuance of preferred stock. This greater net asset value decrease
34
Table of Contents
would also tend to cause a greater decline in the market price for the common stock. We might be in danger of failing to maintain the required asset coverage of the preferred stock or of losing our ratings, if any, on the preferred stock or, in an extreme case, our current investment income might not be sufficient to meet the dividend requirements on the preferred stock. In order to counteract such an event, we might need to liquidate investments in order to fund a redemption of some or all of the preferred stock. In addition, we would pay (and the holders of common stock would bear) all costs and expenses relating to the issuance and ongoing maintenance of the preferred stock, including higher advisory fees if our total return exceeds the dividend rate on the preferred stock. Holders of preferred stock may have different interests than holders of common stock and may at times have disproportionate influence over our affairs.
Holders of any preferred stock we might issue would have the right to elect members of our Board of Directors and class voting rights on certain matters.
Holders of any preferred stock we might issue, voting separately as a single class, would have the right to elect two members of our Board of Directors at all times and in the event dividends become two full years in arrears would have the right to elect a majority of the directors until such arrearage is completely eliminated. In addition, preferred stockholders have class voting rights on certain matters, including changes in fundamental investment restrictions and conversion to open-end status, and accordingly can veto any such changes. Restrictions imposed on the declarations and payment of dividends or other distributions to the holders of our common stock and preferred stock, both by the 1940 Act and by requirements imposed by rating agencies, if any, or the terms of our credit facilities, if any, might impair our ability to maintain our qualification as a RIC for federal income tax purposes. While we would intend to redeem our preferred stock to the extent necessary to enable us to distribute our income as required to maintain our qualification as a RIC, there can be no assurance that such actions could be effected in time to meet the tax requirements.
| Item 1B. | Unresolved Staff Comments |
Not applicable.
| Item 2. | Properties |
We do not own any real estate or other physical properties materially important to our operation. Our headquarters are located at 8 Sound Shore Drive, Suite 255, Greenwich, Connecticut, where we occupy our office space pursuant to our Administration Agreement with BDC Partners. We believe that our office facilities are suitable and adequate for our business as it is presently conducted.
| Item 3. | Legal Proceedings |
We are not currently subject to any material legal proceedings, nor, to our knowledge, is any material legal proceeding threatened against us. From time to time, we may be a party to certain legal proceedings in the ordinary course of business, including proceedings relating to the enforcement of our rights under contracts with our portfolio companies. While the outcome of these legal proceedings cannot be predicted with certainty, we do not expect that these proceedings will have a material effect upon our financial condition or results of operations.
| Item 4. | Mine Safety Disclosures. |
Not applicable.
35
Table of Contents
| Item 5. | Market for Registrant’s Common Equity, Related Stockholder Matters and Issuer Purchases of Equity Securities |
Our common stock is traded on the NASDAQ Global Select Market under the symbol “TICC.” The following table sets forth the range of high and low sales prices of our common stock as reported on the NASDAQ Global Select Market and our net asset value per share as determined as of the last day of each quarter over the last two years:
| NAV(a) | Price Range | |||||||||||
| High | Low | |||||||||||
| Fiscal 2011 |
||||||||||||
| Fourth quarter |
$ | 9.30 | $ | 9.24 | 7.07 | |||||||
| Third quarter |
9.34 | 10.04 | 7.71 | |||||||||
| Second quarter |
9.85 | 11.75 | 9.17 | |||||||||
| First quarter |
9.97 | 13.11 | 9.43 | |||||||||
| Fiscal 2010 |
||||||||||||
| Fourth quarter |
$ | 9.85 | $ | 11.62 | 9.90 | |||||||
| Third quarter |
9.27 | 10.70 | 7.88 | |||||||||
| Second quarter |
9.03 | 8.70 | 6.50 | |||||||||
| First quarter |
8.87 | 7.05 | 5.62 | |||||||||
| (a) | Net asset value per share is determined as of the last day in the relevant quarter and therefore may not reflect the net asset value per share on the date of the high and low sales prices. The net asset values shown are based on outstanding shares at the end of each period. |
The last reported sale price for our common stock on the NASDAQ Global Select Market on March 13, 2012 was $10.55 per share. As of March 13, 2012, we had 164 shareholders of record.
Dividends
We currently intend to distribute a minimum of 90% of our ordinary income and short-term capital gains, if any, on a quarterly basis to our stockholders, in accordance with our election to be treated, and intention to qualify annually, as a RIC under Subchapter M of the Code. For a more detailed discussion of the requirements under Subchapter M, please refer to the discussion in “Business—Material U.S. Federal Income Tax Considerations” set forth above. The following table reflects the cash distributions, including dividends and returns of capital, if any, per share that we have declared on our common stock since 2010:
| Date Declared |
Record Date | Payment Date | Amount | |||||
| Fiscal 2012 |
||||||||
| March 1, 2012 |
March 21, 2012 | March 30, 2012 | $ | 0.27 | ||||
|
|
|
|||||||
| Fiscal 2011 |
||||||||
| November 3, 2011 |
December 16, 2011 | December 30, 2011 | $ | 0.25 | ||||
| July 28, 2011 |
September 16, 2011 | September 30, 2011 | 0.25 | |||||
| May 3, 2011 |
June 16, 2011 | June 30, 2011 | 0.25 | |||||
| March 3, 2011 |
March 21, 2011 | March 31, 2011 | 0.24 | |||||
|
|
|
|||||||
| Total (2011) |
$ | 0.99 | ||||||
|
|
|
|||||||
| Fiscal 2010 |
||||||||
| November 2, 2010 |
December 10, 2010 | December 31, 2010 | $ | 0.24 | ||||
| July 29, 2010 |
September 10, 2010 | September 30, 2010 | 0.22 | |||||
| April 29, 2010 |
June 10, 2010 | June 30, 2010 | 0.20 | |||||
| March 4, 2010 |
March 24, 2010 | March 31, 2010 | 0.15 | |||||
|
|
|
|||||||
| Total (2010) |
$ | 0.81 | ||||||
|
|
|
|||||||
In order to qualify as a RIC and to avoid corporate level tax on the income we distribute to our stockholders, we are required, under Subchapter M of the Code, to distribute at least 90% of our ordinary income and realized net short-term capital gains in excess of realized net long-term capital losses to our stockholders on an annual basis.
36
Table of Contents
To the extent our taxable earnings fall below the total amount of our distributions for that fiscal year, a portion of those distributions may be deemed a tax return of capital to our stockholders. Thus, the source of a distribution to our stockholders may be the original capital invested by the stockholder rather than our taxable ordinary income or capital gains. Stockholders should read any written disclosure accompanying a dividend payment carefully and should not assume that the source of any distribution is our taxable ordinary income or capital gains.
During the year ended December 31, 2011, our distributions were made from undistributed net investment income. A written statement identifying the source of dividends for the year was posted on our website. We may not be able to achieve operating results that will allow us to make distributions at a specific level or to increase the amount of these distributions from time to time. In addition, we may be limited in our ability to make distributions due to the asset coverage requirements applicable to us as a business development company under the 1940 Act. If we do not distribute a certain percentage of our income annually, we will suffer adverse tax consequences, including possible loss of favorable regulated investment company tax treatment. We cannot assure shareholders that they will receive any distributions.
Recent Sales of Unregistered Securities
While we did not engage in any sales of unregistered securities during the fiscal year ended December 31, 2011, we issued a total of 280,462 shares of common stock under our dividend reinvestment plan. This issuance was not subject to the registration requirements of the Securities Act of 1933, as amended. The aggregate valuation price for the shares of common stock issued under the dividend reinvestment plan was approximately $2.6 million.
Performance Graph
This graph compares the return on our common stock with that of the NASDAQ Composite Index and the NASDAQ Financial 100, for the period from December 31, 2006 through December 31, 2011. The graph assumes that, on December 31, 2006, a person invested $100 in each of our common stock, the NASDAQ Composite Index and the NASDAQ Financial 100, which includes the 100 largest domestic and international financial organizations listed on the NASDAQ Stock Market based on market capitalization. The NASDAQ Financial 100 contains banks and savings institutions and related holding companies, insurance companies, broker-dealers, investment companies and financial services organizations.
37
Table of Contents
The graph measures total shareholder return, which takes into account both changes in stock price and dividends. It assumes that dividends paid are reinvested in like securities.
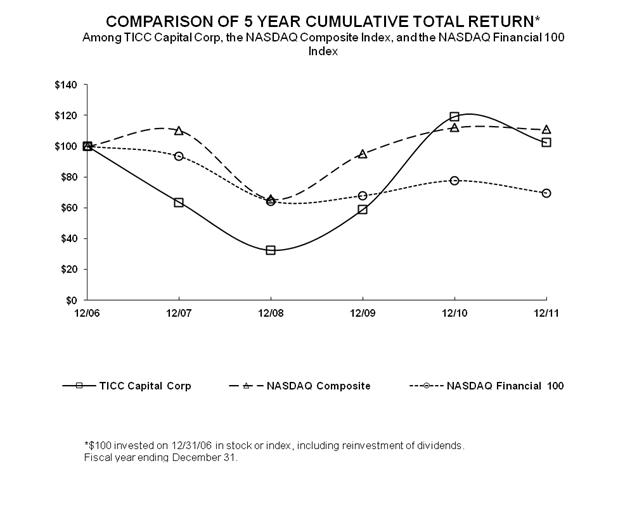
38
Table of Contents
| Item 6. | Selected Financial and Other Data |
The following selected financial data for the years ended December 31, 2011, 2010, 2009, 2008 and 2007 is derived from our consolidated financial statements which have been audited by PricewaterhouseCoopers LLP, our independent registered public accounting firm. The data should be read in conjunction with our consolidated financial statements and related notes thereto and “Management’s Discussion and Analysis of Financial Condition and Results of Operations” included elsewhere in this report.
| Year Ended December 31, 2011 |
Year Ended December 31, 2010 |
Year Ended December 31, 2009 |
Year Ended December 31, 2008 |
Year Ended December 31, 2007 |
||||||||||||||||
| Total Investment Income |
$ | 45,188,190 | $ | 33,506,591 | $ | 20,507,792 | $ | 37,305,635 | $ | 43,841,813 | ||||||||||
| Total Expenses |
$ | 15,188,049 | $ | 9,263,094 | $ | 7,015,808 | $ | 15,114,472 | $ | 16,648,194 | ||||||||||
| Net Investment Income |
$ | 30,000,141 | $ | 24,243,497 | $ | 13,491,984 | $ | 22,191,163 | $ | 27,193,619 | ||||||||||
| Net Increase (Decrease) in Net Assets Resulting from Operations |
$ | 14,208,865 | $ | 63,947,441 | $ | 35,182,458 | $ | (53,266,154 | ) | $ | (11,648,832 | ) | ||||||||
| Per Share Data: |
||||||||||||||||||||
| Net Increase in Net Assets Resulting from Net Investment Income per common share (Basic and Diluted)(1) |
$ | 0.92 | $ | 0.89 | $ | 0.51 | $ | 0.91 | $ | 1.30 | ||||||||||
| Net Increase (Decrease) in Net Assets Resulting from Operations per common share (Basic and Diluted)(1) |
$ | 0.44 | $ | 2.35 | $ | 1.32 | $ | (2.19 | ) | $ | (0.56 | ) | ||||||||
| Distributions Declared per Share |
$ | 0.99 | $ | 0.81 | $ | 0.60 | $ | 1.06 | $ | 1.44 | ||||||||||
| Balance Sheet Data: |
||||||||||||||||||||
| Total Assets |
$ | 424,119,570 | $ | 317,900,083 | $ | 225,340,291 | $ | 204,962,887 | $ | 396,390,153 | ||||||||||
| Total Net Assets |
$ | 305,101,991 | $ | 314,117,541 | $ | 224,091,995 | $ | 203,366,750 | $ | 257,369,503 | ||||||||||
| Other Data: |
||||||||||||||||||||
| Number of Portfolio Companies at Period End |
82 | 50 | 35 | 23 | 33 | |||||||||||||||
| Purchases of Loan Originations |
$ | 272,500,000 | $ | 129,800,000 | $ | 65,700,000 | $ | 18,300,000 | $ | 188,000,000 | ||||||||||
| Loan Repayments |
$ | 107,900,000 | $ | 73,800,000 | $ | 65,600,000 | $ | 90,500,000 | $ | 87,300,000 | ||||||||||
| Proceeds from Loan Sales |
$ | 11,300,000 | $ | 54,800,000 | $ | 14,000,000 | $ | 50,200,000 | $ | 4,500,000 | ||||||||||
| Total Return(2) |
(14.19 | )% | 102.39 | % | 81.15 | % | (50.23 | )% | (36.26 | )% | ||||||||||
| Weighted Average Yield on Debt Investments at Period End(3) |
11.3 | % | 14.1 | % | 9.0 | % | 8.9 | % | 11.3 | % | ||||||||||
| (1) | In accordance with ASC 260-10, the weighted-average shares of common stock outstanding used in computing basic and diluted earnings per share for the years ended December 31, 2008 and December 31, 2007 were increased retroactively by a factor of 1.021 to recognize the bonus element associated with rights to acquire shares of common stock that were issued to shareholders on May 23, 2008. See Note 4—Earnings Per Share, included in the consolidated financial statements, for additional information about the rights offering and the calculation of the associated bonus element. |
| (2) | Total return equals the increase or decrease of ending market value over beginning market value, plus distributions, divided by the beginning market value, assuming dividend reinvestment at prices obtained under our dividend reinvestment plan. |
| (3) | Weighted average yield calculation includes the impact of any loans on non-accrual status as of the year end. |
39
Table of Contents
| Item 7. | Management’s Discussion and Analysis of Financial Condition and Results of Operations |
CAUTIONARY STATEMENT REGARDING FORWARD-LOOKING STATEMENTS
This annual report on Form 10-K contains forward-looking statements that involve substantial risks and uncertainties. These forward-looking statements are not historical facts, but rather are based on current expectations, estimates and projections about TICC, our current and prospective portfolio investments, our industry, our beliefs, and our assumptions. Words such as “anticipates,” “expects,” “intends,” “plans,” “will,” “may,” “continue,” “believes,” “seeks,” “estimates,” “would,” “could,” “should,” “targets,” “projects,” and variations of these words and similar expressions are intended to identify forward-looking statements. The forward-looking statements contained in this annual report on Form 10-K involve risks and uncertainties, including statements as to:
| • | our future operating results; |
| • | our business prospects and the prospects of our portfolio companies; |
| • | the impact of investments that we expect to make; |
| • | our contractual arrangements and relationships with third parties; |
| • | the dependence of our future success on the general economy and its impact on the industries in which we invest; |
| • | the ability of our portfolio companies to achieve their objectives; |
| • | our expected financings and investments; |
| • | the adequacy of our cash resources and working capital; and |
| • | the timing of cash flows, if any, from the operations of our portfolio companies. |
These statements are not guarantees of future performance and are subject to risks, uncertainties, and other factors, some of which are beyond our control and difficult to predict and could cause actual results to differ materially from those expressed or forecasted in the forward-looking statements, including without limitation:
| • | an economic downturn could impair our portfolio companies’ ability to continue to operate, which could lead to the loss of some or all of our investments in such portfolio companies; |
| • | a contraction of available credit and/or an inability to access the equity markets could impair our lending and investment activities; |
| • | interest rate volatility could adversely affect our results, particularly if we elect to use leverage as part of our investment strategy; |
| • | currency fluctuations could adversely affect the results of our investments in foreign companies, particularly to the extent that we receive payments denominated in foreign currency rather than U.S. dollars; and |
| • | the risks, uncertainties and other factors we identify in “Risk Factors” and elsewhere in this annual report on Form 10-K and in our filings with the SEC. |
Although we believe that the assumptions on which these forward-looking statements are based are reasonable, any of those assumptions could prove to be inaccurate, and as a result, the forward-looking statements based on those assumptions also could be inaccurate. Important assumptions include our ability to originate new loans and investments, certain margins and levels of profitability and the availability of additional capital. In light of these and other uncertainties, the inclusion of a projection or forward-looking statement in this annual report on Form 10-K should not be regarded as a representation by us that our plans and objectives will be achieved. These risks and uncertainties include those described or identified in “Risk Factors” and elsewhere in this annual report on Form 10-K. You should not place undue reliance on these forward-looking statements, which apply only as of the date of this annual report on Form 10-K.
The following analysis of our financial condition and results of operations should be read in conjunction with our consolidated financial statements and the related notes thereto contained elsewhere in this Form 10-K.
40
Table of Contents
OVERVIEW
Our investment objective is to maximize our portfolio’s total return. Our primary focus is to seek current income by investing in corporate debt securities. We have also invested and may continue to invest in structured finance investments, including CLO vehicles, which own debt securities. We may also invest in publicly traded debt and/or equity securities. We operate as a closed-end, non-diversified management investment company and have elected to be treated as a business development company under the Investment Company Act of 1940, as amended (the “1940 Act”). We have elected to be treated for tax purposes as a regulated investment company (“RIC”), under the Internal Revenue Code of 1986, as amended (the “Code”), beginning with our 2003 taxable year.
Our investment activities are managed by TICC Management, LLC (“TICC Management”), a registered investment adviser under the Investment Advisers Act of 1940, as amended. TICC Management is owned by BDC Partners, LLC (“BDC Partners”), its managing member, and Charles M. Royce, our non-executive Chairman, who holds a minority, non-controlling interest in TICC Management. Jonathan H. Cohen, our Chief Executive Officer, and Saul B. Rosenthal, our President and Chief Operating Officer, are the members of BDC Partners. Under an investment advisory agreement (the “Investment Advisory Agreement”), we have agreed to pay TICC Management an annual base fee calculated on gross assets, and an incentive fee based upon our performance. Under an administration agreement (the “Administration Agreement”), we have agreed to pay or reimburse BDC Partners, as administrator, for certain expenses incurred in operating TICC. Our executive officers and directors, and the executive officers of TICC Management and BDC Partners, serve or may serve as officers and directors of entities that operate in a line of business similar to our own. Accordingly, they may have obligations to investors in those entities, the fulfillment of which might not be in the best interests of us or our stockholders. For more information, see “Risk Factors—Risks Relating to our Business and Structure—There are significant potential conflicts of interest, which could impact our investment returns.”
On August 10, 2011, the Company completed a $225.0 million debt securitization financing transaction. The Class A Notes offered in the debt securitization were issued by TICC CLO LLC (the “Securitization Issuer” or “TICC CLO”), a subsidiary of TICC Capital Corp. 2011-1 Holdings, LLC (“Holdings”), a direct subsidiary of TICC, and the notes are secured by the assets held by the Securitization Issuer. The securitization was executed through a private placement of $101.25 million of Aaa/AAA Class A Notes of the Securitization Issuer. Holdings retained all of the subordinated notes, which totaled $123.75 million (the “Subordinated Notes”), and retained all the membership interests in the Securitization Issuer.
While the structure of our investments will vary, and while we invest across a wide range of different industries, we have historically overweighted our investments in the debt of technology-related companies. We seek to invest in entities that, as a general matter, have been operating for at least one year prior to the date of our investment and that will, at the time of our investment, have employees and revenues, and are cash flow positive. Many of these companies will have financial backing provided by private equity or venture capital funds or other financial or strategic sponsors at the time we make an investment.
We generally expect to invest between $5 million and $25 million in each of our portfolio companies, although this investment size may vary proportionately as the size of our capital base changes and market conditions warrant, and accrue interest at fixed or variable rates. We expect that our investment portfolio will be diversified among a large number of investments with few investments, if any, exceeding 5% of the total portfolio. As of December 31, 2011, our debt investments had stated interest rates of between 2.33% and 15.75% (excluding our investment in GenuTec Business Solutions, Inc. which carries a zero interest rate through October 30, 2014) and maturity dates of between 12 and 130 months. In addition, our total portfolio had a weighted average yield on debt investments of approximately 11.3% including GenuTec Business Solutions, Inc.
Our loans may carry a provision for deferral of some or all of the interest payments and amendment fees, which will be added to the principal amount of the loan. This form of deferred income is referred to as “payment-in-kind,” or “PIK,” interest or other income and, when earned, is recorded as interest or other income and an increase in the principal amount of the loan. For the year ended December 31, 2011, we recognized approximately $1.5 million of interest income attributable to PIK associated with our investments in Pegasus Solutions, Inc., Merrill Communications, LLC. and Shearers Food, Inc., compared to PIK interest of approximately $710,000 for the year ended December 31, 2010.
We have historically and may continue to borrow funds to make investments. As a result, we are exposed to the risks of leverage, which may be considered a speculative investment technique. Borrowings, also known as leverage, magnify the potential for gain and loss on amounts invested and therefore increase the risks associated with investing in our securities. In addition, the costs associated with our borrowings, including any increase in the management fee payable to TICC Management, will be borne by our common stockholders.
In addition, as a BDC under the 1940 Act, we are required to make available significant managerial assistance, for which we may receive fees, to our portfolio companies. These fees would be generally non-recurring, however in some instances they may have a recurring component. We have received no fee income for managerial assistance to date.
41
Table of Contents
Prior to making an investment, we may enter into a non-binding term sheet with the potential portfolio company. These term sheets are generally subject to a number of conditions, including but not limited to the satisfactory completion of our due diligence investigations of the company’s business and legal documentation for the loan.
To the extent possible, our loans will be collateralized by a security interest in the borrower’s assets or guaranteed by a principal to the transaction. Interest payments, if not deferred, are normally payable quarterly with most debt investments having scheduled principal payments on a monthly or quarterly basis. When we receive a warrant to purchase stock in a portfolio company, the warrant will typically have a nominal strike price, and will entitle us to purchase a modest percentage of the borrower’s stock.
During the year ended December 31, 2011, we closed approximately $272.5 million in portfolio investments, including additional investments of approximately $239.4 million in existing portfolio companies and approximately $33.1 million in new portfolio companies. During the year ended December 31, 2011, we recognized a total of $107.9 million from principal repayments on debt investments, and we recognized approximately $11.3 million from the sale of portfolio investments. We realized net gains on investments during the year ended December 31, 2011 in the amount of approximately $3.6 million. For the year ended December 31, 2011, we had net unrealized depreciation of approximately $19.4 million.
Current Market and Economic Conditions
Beginning in mid-2007, global credit and other financial markets suffered substantial stress, volatility, illiquidity and disruption. These developments caused a series of failures and restructurings among a large number of financial institutions, which either participated in the origination and distribution of structured finance or syndicated loan credit products, or invested in them. The debt and equity capital markets in the U.S. were impacted by significant write-offs in the financial services sector relating to these products and the re-pricing of credit risk in the loan market, among other things.
These events constrained the availability of capital for the market as a whole, and the financial services sector in particular. During 2009, the syndicated corporate loans market experienced both unprecedented price declines and volatility. While prices remained depressed across many sectors and ratings categories through most of 2009, we witnessed a strong upward move during the second half of 2009, which continued through 2010. During 2011, we saw ongoing price volatility for corporate loans, consistent with many other parts of the debt and equity markets. Although corporate loan prices may still be below historical averages, our view is that certain, primarily larger-issuer, broadly syndicated corporate loans still may not adequately reflect the spreads necessary to compensate investors for the risks involved. In view of the above circumstances, we continue to focus more heavily on middle-market issuers and to a limited extent larger issuers, and, opportunistically, on certain structured finance investments, including CLO investment vehicles, and have recently made a number of selective purchases in these markets.
PORTFOLIO COMPOSITION AND INVESTMENT ACTIVITY
The total value of our investments was approximately $391.5 million and $247.5 million at December 31, 2011 and December 31, 2010, respectively. The increase in investments during the year ended December 31, 2011 was due to the deployment of cash of approximately $140.0 million, comprised of the purchases of portfolio investments of approximately $259.2 million and debt repayments and sales of securities of approximately $119.2 million, as well as by the fair value adjustments on our portfolio. The value of cash and cash equivalents decreased by $64.3 million during the year ended December 31, 2011. Our gross originations and advances totaled approximately $129.8 million during the year ended December 31, 2010.
In certain instances we receive payments in our loan portfolio based on scheduled amortization of the outstanding balances. In addition, we receive repayments of some of our loans prior to their scheduled maturity date. The frequency or volume of these repayments may fluctuate significantly from period to period. For the years ended December 31, 2011 and December 31, 2010, we had $107.9 million and $73.8 million, respectively, of loan repayments. Portfolio activity also reflects sales of securities in the amounts of $11.3 million and $54.8 million for 2011 and 2010, respectively. The repayments on our debt positions during the year ended December 31, 2011, largely consisted of repayment of our original investment in senior secured notes issued by Airvana Network Solutions, Inc. ($17.7 million), Endurance International Group, Inc. ($10.0 million on our initial investment), Presidio, Inc. ($9.6 million on our initial investment), Vision Solutions, Inc. ($5.8 million on our initial investment), Diversified Machine, Inc. ($5.5 million), QA Direct Holdings, LLC ($5.5 million), Birch Communications, Inc. ($5.0 million), Flexera Software ($5.0 million), MLM Holdings, Inc. ($5.0 million) and Fairway Group Acquisition Company ($5.0 million). Also, during 2011, the most significant sales of our debt investments were of Springboard Finance ($5.0 million), Shield Finance Co. ($2.0 million) and Hudson Straits CLO 2004-1AE ($1.9 million).
For the year ended December 31, 2011, we recorded net realized gains on investments of approximately $3.6 million, which largely represents relatively small gains on several different investments including the realized gains on the repayment on our investment in Prodigy Health Group ($0.7 million) and the sale of our investments in Hudson Straits CLO 2004-1AE ($0.5 million) and Del Mar CLO I Ltd. 2006-1($0.4 million).
42
Table of Contents
Based upon the fair value determinations made in good faith by the Board of Directors, during the year ended December 31, 2011, we had net unrealized losses of approximately $19.4 million, comprised of $23.3 million in gross unrealized appreciation, $39.9 million in gross unrealized depreciation and approximately $2.8 million relating to the reversal of prior period net unrealized appreciation as certain investments were realized. The most significant changes in net unrealized appreciation and depreciation during the year ended December 31, 2011 were as follows (in millions):
| Portfolio Company |
Changes in Unrealized Appreciation (Depreciation) |
|||
| Emporia CLO 2007 3A E |
$ | (1.0 | ) | |
| Hewetts Island CDO IV 2006-4 |
(1.4 | ) | ||
| Integra Telecomm, Inc. |
(2.1 | ) | ||
| Lightpoint CLO 2007-8a |
(1.0 | ) | ||
| RBS Holding Company |
(1.0 | ) | ||
| SourceHov, LLC |
(1.1 | ) | ||
| Algorithmic Implementations, Inc. common stock |
(1.5 | ) | ||
| Net all other(1) |
(10.3 | ) | ||
|
|
|
|||
| Total |
$ | (19.4 | ) | |
|
|
|
|||
| (1) | Unrealized gains and losses less than $1.0 million have been combined. |
At December 31, 2010, we had investments in debt securities of, or loans to, 47 portfolio companies, with a fair value totaling approximately $230.3 million, and equity investments of approximately $17.2 million. The debt investments include approximately $710,000 in accrued PIK interest which, as described in “—Overview” above, is added to the carrying value of our investments, reduced by repayments of principal.
A reconciliation of the investment portfolio for the years ended December 31, 2011 and 2010 follows:
| December 31, 2011 | December 31, 2010 | |||||||
| (dollars in millions) | (dollars in millions) | |||||||
| Beginning Investment Portfolio |
$ | 247.5 | $ | 200.3 | ||||
| Portfolio Investments Acquired |
272.5 | 129.8 | ||||||
| Debt repayments |
(107.9 | ) | (73.8 | ) | ||||
| Sales of securities |
(11.3 | ) | (54.8 | ) | ||||
| Payment in Kind |
1.5 | 0.7 | ||||||
| Original Issue Discount |
5.0 | 5.6 | ||||||
| Net Unrealized Appreciation |
(19.4 | ) | 81.8 | |||||
| Net Realized Losses |
3.6 | (42.1 | ) | |||||
|
|
|
|
|
|||||
| Ending Investment Portfolio |
$ | 391.5 | $ | 247.5 | ||||
|
|
|
|
|
|||||
The following table indicates the quarterly portfolio investment activity for the years ended December 31, 2011 and 2010:
| New Investments | Debt Repayments | Sales of Securities | ||||||||||
| (dollars in millions) | (dollars in millions) | (dollars in millions) | ||||||||||
| Quarter ended |
||||||||||||
| December 31, 2011 |
$ | 60.3 | $ | 28.5 | $ | 2.9 | ||||||
| September 30, 2011 |
81.0 | 9.0 | 0.0 | |||||||||
| June 30, 2011 |
30.6 | 12.6 | 0.0 | |||||||||
| March 31, 2011 |
100.6 | 57.8 | 8.4 | |||||||||
|
|
|
|
|
|
|
|||||||
| Total |
$ | 272.5 | $ | 107.9 | $ | 11.3 | ||||||
|
|
|
|
|
|
|
|||||||
| December 31, 2010 |
$ | 30.8 | $ | 31.8 | $ | 7.5 | ||||||
| September 30, 2010 |
44.7 | 13.4 | 34.5 | |||||||||
| June 30, 2010 |
15.0 | 10.8 | 6.6 | |||||||||
| March 31, 2010 |
39.3 | 17.8 | 6.2 | |||||||||
|
|
|
|
|
|
|
|||||||
| Total |
$ | 129.8 | $ | 73.8 | $ | 54.8 | ||||||
|
|
|
|
|
|
|
|||||||
43
Table of Contents
The following table shows the fair value of our portfolio of investments by asset class as of December 31, 2011 and 2010:
| 2011 | 2010 | |||||||||||||||
| Investments at Fair Value |
Percentage of Total Portfolio |
Investments at Fair Value |
Percentage of Total Portfolio |
|||||||||||||
| (dollars in millions) | (dollars in millions) | |||||||||||||||
| Senior Secured Notes |
$ | 289.9 | 74.1 | % | $ | 173.9 | 70.3 | % | ||||||||
| CLO Debt |
51.0 | 13.0 | % | 50.4 | 20.4 | % | ||||||||||
| CLO Equity |
39.3 | 10.0 | % | 8.9 | 3.6 | % | ||||||||||
| Subordinated Notes |
4.9 | 1.3 | % | 6.0 | 2.4 | % | ||||||||||
| Common Stock |
3.1 | 0.8 | % | 5.8 | 2.3 | % | ||||||||||
| Preferred Shares |
2.5 | 0.6 | % | 2.0 | 0.8 | % | ||||||||||
| Warrants |
0.8 | 0.2 | % | 0.5 | 0.2 | % | ||||||||||
|
|
|
|
|
|
|
|
|
|||||||||
| Total |
$ | 391.5 | 100.0 | % | $ | 247.5 | 100.0 | % | ||||||||
|
|
|
|
|
|
|
|
|
|||||||||
44
Table of Contents
The following table shows our portfolio of investments by industry at fair value, as of December 31, 2011 and 2010:
| December 31, 2011 | December 31, 2010 | |||||||||||||||
| Investments at Fair Value |
Percentage of Fair Value |
Investments at Fair Value |
Percentage of Fair Value |
|||||||||||||
| Structured finance |
$ | 90.3 | 23.0 | % | $ | 59.3 | 24.0 | % | ||||||||
| Software |
42.5 | 10.9 | % | 66.8 | 27.0 | % | ||||||||||
| Telecommunication services |
32.6 | 8.3 | % | 12.1 | 4.9 | % | ||||||||||
| Business services |
29.4 | 7.5 | % | 9.1 | 3.7 | % | ||||||||||
| Healthcare |
28.1 | 7.2 | % | 7.4 | 3.0 | % | ||||||||||
| Semiconductor capital equipment |
22.6 | 5.8 | % | 21.8 | 8.8 | % | ||||||||||
| Enterprise software |
18.9 | 4.8 | % | 13.2 | 5.3 | % | ||||||||||
| Retail |
18.8 | 4.8 | % | 0.0 | 0.0 | % | ||||||||||
| Printing and publishing |
14.7 | 3.8 | % | 5.2 | 2.1 | % | ||||||||||
| Web hosting |
14.5 | 3.7 | % | 0.0 | 0.0 | % | ||||||||||
| Financial intermediaries |
11.6 | 3.0 | % | 1.8 | 0.7 | % | ||||||||||
| Computer hardware |
10.1 | 2.6 | % | 10.3 | 4.2 | % | ||||||||||
| IT consulting |
9.6 | 2.5 | % | 2.4 | 1.0 | % | ||||||||||
| Auto parts manufacturer |
9.4 | 2.4 | % | 8.8 | 3.5 | % | ||||||||||
| Education |
8.7 | 2.2 | % | 0.0 | 0.0 | % | ||||||||||
| Advertising |
7.6 | 1.9 | % | 7.9 | 3.2 | % | ||||||||||
| Packaging and glass |
4.9 | 1.3 | % | 0.0 | 0.0 | % | ||||||||||
| Cable/satellite television |
4.9 | 1.2 | % | 0.0 | 0.0 | % | ||||||||||
| Building and development |
4.8 | 1.2 | % | 0.0 | 0.0 | % | ||||||||||
| Food products manufacturer |
4.0 | 1.0 | % | 4.1 | 1.6 | % | ||||||||||
| Interactive voice messaging services |
2.0 | 0.5 | % | 2.0 | 0.8 | % | ||||||||||
| IT value-added reseller |
1.5 | 0.4 | % | 2.0 | 0.8 | % | ||||||||||
| Grocery |
0.0 | 0.0 | % | 5.0 | 2.0 | % | ||||||||||
| Shipping & transportation |
0.0 | 0.0 | % | 4.4 | 1.8 | % | ||||||||||
| Retail food products |
0.0 | 0.0 | % | 3.9 | 1.6 | % | ||||||||||
|
|
|
|
|
|
|
|
|
|||||||||
| Total |
$ | 391.5 | 100.0 | % | $ | 247.5 | 100.0 | % | ||||||||
|
|
|
|
|
|
|
|
|
|||||||||
Since our inception in 2003, our portfolio has consisted primarily of senior loans to middle-market companies. We may also invest in publicly traded debt and/or equity securities or take controlling interests in portfolio companies in certain limited circumstances, as well as syndicated corporate loans and structured finance investments. On December 3, 2007, we changed our name from Technology Investment Capital Corp. to TICC Capital Corp. While we continue to maintain our primary focus on the technology sector, we expect to actively seek new investment opportunities outside this sector that otherwise meet our investment criteria.
Beginning in mid-2007, global credit and other financial markets suffered substantial stress, volatility, illiquidity and disruption. These developments caused a series of failures and restructurings among a large number of financial institutions, which either participated in the origination and distribution of structured finance or syndicated loan credit products, or invested in them. The debt and equity capital markets in the United States were impacted by significant write-offs in the financial services sector relating to these products and the re-pricing of credit risk in the loan market, among other things.
45
Table of Contents
PORTFOLIO GRADING
We have adopted a credit grading system to monitor the quality of our debt investment portfolio. Equity securities are not graded. As of December 31, 2011 and 2010 our portfolio had a weighted average grade of 2.2 and 2.1, respectively, based upon the fair value of the debt investments in the portfolio.
At December 31, 2011 and 2010, our debt investment portfolio was graded as follows:
| December 31, 2011 | ||||||||||||||||||
| Grade |
Summary Description |
Principal Value | Percentage of Total Portfolio |
Portfolio at Fair Value |
Percentage of Total Portfolio |
|||||||||||||
| (dollars in millions) | (dollars in millions) | |||||||||||||||||
| 1 | Company is ahead of expectations and/or outperforming financial covenant requirements and such trend is expected to continue. | $ | 13.2 | 3.4 | % | $ | 13.1 | 3.8 | % | |||||||||
| 2 | Full repayment of principal and interest is expected. | 301.9 | 78.3 | % | 267.1 | 77.2 | % | |||||||||||
| 3 | Closer monitoring is required. Full repayment of principal and interest is expected. | 67.2 | 17.4 | % | 63.6 | 18.4 | % | |||||||||||
| 4 | A reduction of interest income has occurred or is expected to occur. No loss of principal is expected. | — | 0.0 | % | — | 0.0 | % | |||||||||||
| 5 | A loss of some portion of principal is expected. | 3.5 | 0.9 | % | 2.0 | 0.6 | % | |||||||||||
|
|
|
|
|
|
|
|
|
|||||||||||
| $ | 385.8 | 100.0 | % | $ | 345.8 | 100.0 | % | |||||||||||
|
|
|
|
|
|
|
|
|
|||||||||||
| December 31, 2010 | ||||||||||||||||||
| Grade |
Summary Description |
Principal Value | Percentage of Total Portfolio |
Portfolio at Fair Value |
Percentage of Total Portfolio |
|||||||||||||
| (dollars in millions) | (dollars in millions) | |||||||||||||||||
| 1 | Company is ahead of expectations and/or outperforming financial covenant requirements and such trend is expected to continue. | $ | 11.8 | 4.6 | % | $ | 11.8 | 5.1 | % | |||||||||
| 2 | Full repayment of principal and interest is expected | 184.9 | 72.4 | % | 163.0 | 70.8 | % | |||||||||||
| 3 | Closer monitoring is required. Full repayment of principal and interest is expected. | 55.1 | 21.6 | % | 53.5 | 23.2 | % | |||||||||||
| 4 | A reduction of interest income has occurred or is expected to occur. No loss of principal is expected. | — | 0.0 | % | — | 0.0 | % | |||||||||||
| 5 | A loss of some portion of principal is expected. | 3.5 | 1.4 | % | 2.0 | 0.9 | % | |||||||||||
|
|
|
|
|
|
|
|
|
|||||||||||
| $ | 255.3 | 100.0 | % | $ | 230.3 | 100.0 | % | |||||||||||
|
|
|
|
|
|
|
|
|
|||||||||||
We expect that a portion of our investments will be in the Grades 3, 4 or 5 categories from time to time, and, as such, we will be required to work with troubled portfolio companies to improve their business and protect our investment. The number and amount of investments included in Grade 3, 4 or 5 may fluctuate from year to year.
During the quarter ending December 31, 2008, we determined that the liquidity of American Integration Technologies, LLC (“AIT”) had severely deteriorated. As a result, we downgraded our investment in AIT to a 5 rating. During the year ending December 31, 2009, business conditions improved, and the fair value of the investment was written-up to approximately $8.4 million at December 31, 2009 from approximately $6.3 million at December 31, 2008. However, business conditions did not improve sufficiently to warrant a change in the investment rating of AIT, which was maintained as a grade 5. AIT was placed on non-accrual status as of January 1, 2009. In April 2010, the notes were restructured and placed back on accrual status. The investment rating of AIT is 2 as of December 31, 2011.
46
Table of Contents
RESULTS OF OPERATIONS
Set forth below is a comparison of our results of operations for the years ended December 31, 2011, 2010 and 2009.
Comparison of the years ended December 31, 2011 and December 31, 2010
Investment Income
As of December 31, 2011, our debt investments had stated interest rates of between 2.33% and 15.75% (excluding our investment in GenuTec Business Solutions, Inc. which carries a zero interest rate through October 30, 2014) and maturity dates of between 12 and 130 months. In addition, our total portfolio had a weighted average yield on debt investments of approximately 11.3% including all investments in the portfolio, compared to 14.1% as of December 31, 2010.
Investment income for the year ended December 31, 2011 was approximately $45.2 million compared to approximately $33.5 million for the period ended December 31, 2010. This increase was due largely to an increase in the amount of performing assets in the portfolio and distributions from the equity interests in our CLO vehicle investments. The total principal value of income producing debt investments as of December 31, 2011 and December 31, 2010 was approximately $382.3 million and $251.8 million, respectively. For the year ended December 31, 2011, investment income consisted of approximately $24.2 million in cash interest from portfolio investments, approximately $5.0 million in amortization of original issue and market discount, approximately $0.5 million of discount income derived from unscheduled principal cash remittances at par on discounted debt securities, approximately $13.1 million in distributions from the equity interest in securitized vehicle investments and approximately $1.5 million in PIK interest income.
For the year ended December 31, 2011, fee income of approximately $921,000 was recorded, compared to fee income of approximately $968,000 for the year ended December 31, 2010. Fee income consists of non-recurring fees in connection with our investments in portfolio companies, including commitment fees, origination fees and amendment fees.
Operating Expenses
Total expenses for the year ended December 31, 2011 were $15.2 million, which includes an accrual of approximately $1.1 million for a capital gains incentive fee.
Expenses before incentive fees for the year ended December 31, 2011 were approximately $11.8 million. This amount consisted primarily of investment advisory fees, compensation expense, interest expense, professional fees, and general and administrative expenses. Expenses before incentive fees increased approximately $3.9 million from the comparable period ended December 31, 2010, attributable primarily to higher investment advisory fees (consisting of the base management fee) and interest expense and other debt financing expenses associated with the senior notes issued under our debt securitization financing transaction. Expenses before incentive fees for the period ended December 31, 2010 were approximately $7.9 million.
The investment advisory fee for the year ended December 31, 2011 was approximately $7.3 million, representing the base fee as provided for in the Investment Advisory Agreement. The investment advisory fee in the comparable period in 2010 was approximately $5.0 million. The increase of approximately $2.3 million is due to an increase in average gross assets. At each of December 31, 2011 and December 31, 2010, respectively, approximately $2.9 million and $1.8 million of investment advisory fees remained payable to TICC Management, including the net investment income incentive fee discussed below.
Interest expense and other debt financing expenses for the year ended December 31, 2011 was approximately $1.2 million, which was directly related to our debt securitization financing transaction. Senior notes in the amount of $101,250,000 were issued by a newly formed special purpose vehicle in which a wholly-owned subsidiary of TICC owns all of the equity. Under this structure, the notes bear interest, after the effective date, at three-month London Inter Bank Offered Rate (“LIBOR”) plus 2.25% (prior to the effective date, the Class A Notes bear interest at five-month LIBOR plus 2.25%). The accrued interest payable on these notes during the year ended December 31, 2011 was $1.1 million. Additionally, for the year ended December 31, 2011, the amortization of the discount on the issued notes was approximately $49,000 and amortization of deferred debt issuance costs was approximately $119,000.
Compensation expense was approximately $1.1 million for the year ended December 31, 2011, compared to approximately $1.0 million for the period ending December 31, 2010, reflecting the allocation of compensation expense for the services of our Chief Financial Officer, Chief Compliance Officer, Controller and senior accountant, and other administrative support personnel. At December 31, 2011 and December 31, 2010, respectively, approximately $650,000 and $0 of compensation expenses remained payable.
47
Table of Contents
Professional fees, consisting of legal, valuation, audit and consulting fees, were approximately $1.2 million for the year ended December 31, 2011, compared to approximately $1.0 million for the year ended December 31, 2010. This was primarily the result of increases in audit fees of approximately $255,000 and legal costs of approximately $34,000 incurred during the twelve months ended December 31, 2011. These increases were partially offset by a decrease in fees related to valuation services of approximately $117,000 for the period ended December 31, 2011.
General and administrative expenses, consisting primarily of printing expenses, listing fees, facilities costs and other expenses, were approximately $587,000 in 2011 compared to approximately $401,000 for the same period in 2010. This increase was due largely to costs associated with regulatory filing fees and proxy materials. Office supplies, facilities costs and other expenses are allocated to us under the terms of the Administration Agreement.
Incentive Fees
The net investment income incentive fee for the year ended December 31, 2011 was approximately $2.2 million compared to $1.4 million for the period ended December 31, 2010. The increase is the result of the increase in pre-incentive fee net investment income. The net investment income incentive fee is calculated and payable quarterly in arrears based on the Company’s “Pre-Incentive Fee Net Investment Income” for the immediately preceding calendar quarter subject to a hurdle rate which is determined as of December 31 of the preceding year. For this purpose, “Pre-Incentive Fee Net Investment Income” means interest income, dividend income and any other income accrued during the calendar quarter minus the Company’s operating expenses for the quarter (including the base fee, expenses payable under the Administration Agreement with BDC Partners, and any interest expense and dividends paid on any issued and outstanding preferred stock, but excluding the incentive fee).
The capital gains incentive fee expense for the year ended December 31, 2011 was approximately $1.1 million. The capital gains incentive fee expense, as reported under generally accepted accounting principles, is calculated on the basis of net realized and unrealized gains and losses at the end of each period. The expense related to the hypothetical liquidation of the portfolio (and assuming no other changes in realized or unrealized gains and losses) would only become payable to our investment adviser in the event of a complete liquidation of our portfolio as of period end and the termination of the Investment Advisory Agreement on such date. The $1.1 million capital gains incentive fee accrual for the year ending December 31, 2011 relates entirely to the hypothetical liquidation calculation. There was no such expense recorded for the year ended December 31, 2010.
The amount of the capital gains incentive fee which will actually be payable is determined in accordance with the terms of the Investment Advisory Agreement and is calculated as of the end of each calendar year (or upon termination of the Investment Advisory Agreement). The terms of the Investment Advisory Agreement state that the capital gains incentive fee calculation is based on net realized gains, if any, offset by gross unrealized depreciation for the calendar year. No effect is given to gross unrealized appreciation in this calculation. Based on the terms of the Investment Advisory Agreement, no capital gains incentive fee is due as of December 31, 2011.
Realized and Unrealized Gains/Losses on Investments
For the year ended December 31, 2011, we recorded net realized gains on investments of approximately $3.6 million, which largely represents relatively small gains on several different investments including the realized gains on the repayment on our investment in Prodigy Health Group ($0.7 million) and the sale of our investments in Hudson Straits CLO 2004-1AE ($0.5 million) and Del Mar CLO I Ltd. 2006-1($0.4 million).
Based upon the fair value determinations made in good faith by the Board of Directors, during the year ended December 31, 2011, we had net unrealized losses of approximately $19.4 million, comprised of $23.3 million in gross unrealized appreciation, $39.9 million in gross unrealized depreciation and approximately $2.8 million relating to the reversal of prior period net unrealized appreciation as certain investments were realized. The most significant changes in net unrealized appreciation and depreciation during the year ended December 31, 2011 were as follows (in millions):
| Portfolio Company |
Changes in Unrealized Appreciation (Depreciation) |
|||
| Emporia CLO 2007 3A E |
$ | (1.0 | ) | |
| Hewetts Island CDO IV 2006-4 |
(1.4 | ) | ||
| Integra Telecomm, Inc. |
(2.1 | ) | ||
| Lightpoint CLO 2007-8a |
(1.0 | ) | ||
| RBS Holding Company |
(1.0 | ) | ||
| SourceHov, LLC |
(1.1 | ) | ||
| Algorithmic Implementations, Inc. common stock |
(1.5 | ) | ||
| Net all other(1) |
(10.3 | ) | ||
|
|
|
|||
| Total |
$ | (19.4 | ) | |
|
|
|
|||
| (1) | Unrealized gains and losses less than $1.0 million have been combined. |
For the year ended December 31, 2010, we had a net realized loss on investments of approximately $42.1 million, which largely represents the loss of approximately $22.9 million on our investment in The CAPS Group, $15.0 million on our investment in WAICCS Las Vegas, LLC, as well as the loss of approximately $7.8 million on our investment in Box Services, LLC. These losses were partially offset by the gain on our investment in Cavtel Holdings, LLC of approximately $1.5 million.
Based upon the fair value determinations made in good faith by the Board of Directors, during the year ended December 31, 2010, we had net unrealized gains of approximately $81.8 million, comprised of $53.6 million in gross unrealized appreciation, $16.0 million in gross unrealized depreciation and approximately $44.2 million relating to the reversal of prior period net unrealized depreciation as certain investments were realized. The most significant changes in net unrealized appreciation and depreciation during the year ended December 31, 2010 were as follows (in millions):
48
Table of Contents
| Portfolio Company |
Changes In Unrealized Appreciation (Depreciation) |
|||
| The CAPS Group |
$ | 22.9 | ||
| American Integration Technologies, LLC |
14.3 | |||
| WAICCS Las Vegas, LLC |
13.5 | |||
| Box Services, LLC |
7.8 | |||
| SCS Holdings II, Inc |
2.6 | |||
| Prospero CLO II BV |
2.1 | |||
| Hewetts Island CDO III 2005-1A D |
2.1 | |||
| Lightpoint CLO 2007-8a |
1.8 | |||
| Pegasus Solutions, Inc |
1.7 | |||
| Power Tools, Inc |
1.5 | |||
| Palm, Inc |
1.1 | |||
| Sargas CLO 2006 -1A |
1.1 | |||
| Workflow Management, Inc |
(1.0 | ) | ||
| Cavtel Holdings, LLC |
(2.2 | ) | ||
| Net all other(1) |
12.5 | |||
|
|
|
|||
| Total |
$ | 81.8 | ||
|
|
|
|||
| (1) | Unrealized gains and losses less than $1.0 million have been combined. |
Please see “—Portfolio Grading” above for more information.
Net Increase in Net Assets Resulting from Net Investment Income
Net investment income for the year ended December 31, 2011 and 2010 was $30.0 million and $24.2 million, respectively. This increase was due largely to greater distributions from the equity interests in our securitization vehicle investments and an increase in the principal amount of income producing investments. This increase was partially offset by the accrual of a capital gains incentive fee recorded for the year ended December 31, 2011.
Excluding the impact of the capital gains incentive fee accrual of approximately $1.1 million, core net investment income would have increased from $24.2 million to $31.1 million over the same period in the prior year.
Based on a weighted-average of 32,433,101 shares outstanding (basic and diluted), the net increase in net assets resulting from net investment income per common share for the year ended December 31, 2011 was approximately $0.92 for basic and diluted, compared to approximately $0.89 per share for the same period in 2010. Excluding the impact of the capital gains incentive fee, the net increase in net assets resulting from core net investment income per common share would have been $0.96, basic and diluted, compared to $0.89 per share for the same period in 2010.
Please see “—Supplemental Information Regarding Core Net Investment Income and Core Net Increase in Net Assets Resulting from Operations” below for more information.
Net Increase in Net Assets Resulting from Operations
We had a net increase in net assets resulting from operations of approximately $14.2 million for the year ended December 31, 2011, compared to a net increase of approximately $63.9 million in 2010. This decrease was attributable directly to a large shift in net unrealized depreciation on investments, partially offset by greater net realized gains.
Based on a weighted-average of 32,433,101 shares outstanding (basic and diluted), the net increase in net assets resulting from operations per common share for the year ended December 31, 2011 was approximately $0.44 for basic and diluted, compared to a net increase in net assets resulting from operations of approximately $2.35 per share in 2010. Excluding the impact of the capital gains incentive fee reduction, the core net increase in net assets resulting from operations per common share would have been $0.47, basic and diluted, compared to $2.35 per share for the same period in 2010.
Please see “—Portfolio Grading” above for more information.
Please see “—Supplemental Information Regarding Core Net Investment Income and Core Net Increase in Net Assets Resulting from Operations” below for more information.
49
Table of Contents
Supplemental Information Regarding Core Net Investment Income and Core Net Increase in Net Assets Resulting from Operations
On a supplemental basis, we provide information relating to core net investment income, its ratio to net assets, and core net increase in net assets resulting from operations, which are non-GAAP measures. These measures are provided in addition to, but not as a substitute for, net investment income and net increase in net assets resulting from operations. Our non-GAAP measures may differ from similar measures by other companies, even if similar terms are used to identify such measures. Core net investment income represents net investment income excluding our capital gains incentive fee. Core net increase in net assets resulting from operations represents net increase in net assets resulting from operations excluding the capital gains incentive fee. As the capital gains incentive fee is based on a hypothetical event that did not occur, we believe that core net investment income and core net increase in net assets resulting from operations are useful indicators of performance during this period. Further, as the capital gains incentive fee is not a currently tax deductible expense and as the RIC requirements are to distribute taxable earnings, the core net investment income provides an indication of taxable income for the year to date.
The following table provides a reconciliation of net investment income to core net investment income (for the year ended December 31, 2011):
| Year Ended December 31, 2011 |
||||||||
| Amount | Per Share Amounts |
|||||||
| Net investment income |
$ | 30,000,141 | $ | 0.925 | ||||
| Capital gains incentive fee |
1,108,749 | 0.034 | ||||||
|
|
|
|
|
|||||
| Core net investment income |
$ | 31,108,890 | $ | 0.959 | ||||
|
|
|
|
|
|||||
The following table provides a reconciliation of net increase in net assets resulting from operations to core net increase in net assets resulting from operations (for the year ended December 31, 2011):
| Year Ended December 31, 2011 |
||||||||
| Amount | Per Share Amounts |
|||||||
| Net increase in net assets resulting from operations |
$ | 14,208,865 | $ | 0.438 | ||||
| Capital gains incentive fee |
1,108,749 | 0.034 | ||||||
|
|
|
|
|
|||||
| Core net increase in net assets resulting from operations |
$ | 15,317,614 | $ | 0.472 | ||||
|
|
|
|
|
|||||
50
Table of Contents
In addition, the following ratio is presented to supplement the financial highlights included in Note 10 to the consolidated financial statements:
| Year Ended December 31, 2011 |
Year Ended December 31, 2010 |
Year Ended December 31, 2009 |
Year Ended December 31, 2008 |
Year Ended December 31, 2007 |
||||||||||||||||
| Ratio of core net investment income to average net assets, for the years ended December 31, 2011, 2010, 2009, 2008 and 2007, respectively |
9.77 | % | 9.95 | % | 6.54 | % | 8.83 | % | 9.78 | % | ||||||||||
|
|
|
|
|
|
|
|
|
|
|
|||||||||||
The following table provides a reconciliation of the ratio of net investment income to average net assets to the ratio of core net investment income to average net assets, for the years ended December 31, 2011, 2010, 2009, 2008 and 2007, respectively.
| Year Ended December 31, 2011 |
Year Ended December 31, 2010 |
Year Ended December 31, 2009 |
Year Ended December 31, 2008 |
Year Ended December 31, 2007 |
||||||||||||||||
| Ratio of net investment income to average net assets |
9.42 | % | 9.95 | % | 6.54 | % | 8.83 | % | 9.78 | % | ||||||||||
| Ratio of capital gain incentive fee to average net assets |
0.35 | % | 0.00 | % | 0.00 | % | 0.00 | % | 0.00 | % | ||||||||||
|
|
|
|
|
|
|
|
|
|
|
|||||||||||
| Ratio of core net investment income to average net assets |
9.77 | % | 9.95 | % | 6.54 | % | 8.83 | % | 9.78 | % | ||||||||||
|
|
|
|
|
|
|
|
|
|
|
|||||||||||
Comparison of the years ended December 31, 2010 and December 31, 2009
Investment Income
As of December 31, 2010, our debt investments had stated interest rates of between 2.19% and 15.58% (excluding our investment in GenuTec Business Solutions, Inc. which carries a zero interest rate through October 30, 2014) and maturity dates of between 7 and 142 months. In addition, our total portfolio had a weighted average yield on debt investments of approximately 14.1% including all investments in the portfolio, compared to 9.0% as of December 31, 2009.
Investment income for the year ended December 31, 2010 was approximately $33.5 million compared to approximately $20.5 million for the period ended December 31, 2009. This increase was due largely to an increase in the amount of performing assets in the portfolio, an increase in the amortization of discounts on new debt investments and distributions from the equity interests in our CLO vehicle investments. The total principal value of income producing debt investments as of December 31, 2010 and December 31, 2009 was approximately $251.8 million and $204.0 million, respectively. For the year ended December 31, 2010, investment income consisted of approximately $20.5 million in cash interest from portfolio investments, approximately $5.6 million in amortization of original issue and market discount, approximately $2.0 million of discount income derived from unscheduled principal cash remittances at par on discounted debt securities, approximately $3.7 million in distributions from the equity interest in securitized vehicle investments and approximately $710,000 in PIK interest income.
For the year ended December 31, 2010, fee income of approximately $968,000 was recorded, compared to fee income of approximately $129,000 for the year ended December 31, 2009. Fee income consists of non-recurring fees in connection with our investments in portfolio companies, including commitment fees, origination fees and amendment fees.
Operating Expenses
Operating expenses for the year ended December 31, 2010 were approximately $9.3 million. This amount consisted primarily of investment advisory fees, compensation expense, professional fees, and general and administrative expenses. Expenses increased approximately $2.3 million from the period ended December 31, 2009, attributable primarily to higher investment advisory fees. Operating expenses for the period ended December 31, 2009 were approximately $7.0 million.
The investment advisory fee for the year ended December 31, 2010 was approximately $6.4 million, representing the base fee for the period as provided for in the Investment Advisory Agreement as well as income incentive fees earned of approximately $1.4 million. The investment advisory fee in the comparable period in 2009 was approximately $4.1 million which consisted of the base fee for the period as well as incentive fees of approximately $52,000. The total increase of approximately $2.3 million is due to an increase in average gross assets and the increase in pre-incentive fee net investment income. For the year ended December 31, 2010, TICC Management determined to waive $50,000 of the fourth quarter income incentive fee. At each of December 31, 2010 and December 31, 2009, respectively, approximately $1.8 million and $1.1 million of investment advisory fees remained payable to TICC Management.
51
Table of Contents
Compensation expenses were approximately $1.0 million for the year ended December 31, 2010, compared to approximately $971,000 for the period ending December 31, 2009, reflecting the allocation of compensation expenses for the services of our Chief Financial Officer, our Chief Compliance Officer and our Controller. For each period ending December 31, 2010 and December 31, 2009, approximately $0 of compensation expenses remained payable.
Professional fees, consisting of legal, valuation, audit and consulting fees, were approximately $1.0 million for the year ended December 31, 2010, compared to approximately $1.3 million for the year ended December 31, 2009. This was primarily the result of decreases in fees for valuation services of approximately $158,000 and legal costs of approximately $118,000 incurred during the twelve months ended December 31, 2010.
General and administrative expenses, consisting primarily of printing expenses, listing fees, facilities costs and other expenses, were approximately $401,000 in 2010 compared to approximately $250,000 for the same period in 2009. This increase was primarily the result of greater proxy related costs of approximately $69,000 as well as an increase in transaction charges related to participations in syndicated loans of approximately $39,000. Office supplies, facilities costs and other office expenses are allocated to us under the terms of the Administration Agreement.
Realized and Unrealized Gains/Losses on Investments
For the year ended December 31, 2010, we had a net realized loss on investments of approximately $42.1 million, which largely represents the loss of approximately $22.9 million on our investment in The CAPS Group, $15.0 million on our investment in WAICCS Las Vegas, LLC, as well as the loss of approximately $7.8 million on our investment in Box Services, LLC. These losses were partially offset by the gain on our investment in Cavtel Holdings, LLC of approximately $1.5 million.
Based upon the fair value determinations made in good faith by the Board of Directors, during the year ended December 31, 2010, we had net unrealized gains of approximately $81.8 million, comprised of $53.6 million in gross unrealized appreciation, $16.0 million in gross unrealized depreciation and approximately $44.2 million relating to the reversal of prior period net unrealized depreciation as certain investments were realized. The most significant changes in net unrealized appreciation and depreciation during the year ended December 31, 2010 were as follows (in millions):
| Portfolio Company |
Changes In Unrealized Appreciation (Depreciation) |
|||
| The CAPS Group |
$ | 22.9 | ||
| American Integration Technologies, LLC |
14.3 | |||
| WAICCS Las Vegas, LLC |
13.5 | |||
| Box Services, LLC |
7.8 | |||
| SCS Holdings II, Inc |
2.6 | |||
| Prospero CLO II BV |
2.1 | |||
| Hewetts Island CDO III 2005-1A D |
2.1 | |||
| Lightpoint CLO 2007-8a |
1.8 | |||
| Pegasus Solutions, Inc |
1.7 | |||
| Power Tools, Inc |
1.5 | |||
| Palm, Inc |
1.1 | |||
| Sargas CLO 2006 -1A |
1.1 | |||
| Workflow Management, Inc |
(1.0 | ) | ||
| Cavtel Holdings, LLC |
(2.2 | ) | ||
| Net all other(1) |
12.5 | |||
|
|
|
|||
| Total |
$ | 81.8 | ||
|
|
|
|||
| (1) | Unrealized gains and losses less than $1.0 million have been combined. |
For the year ended December 31, 2009, we had a net realized loss on investments of approximately $10.5 million, which is primarily comprised of the loss on our debt investment in Falcon Communications, Inc. of approximately $9.5 million, the loss on the partial sale of our debt investment in AKQA, Inc. of approximately $1.4 million, the write off of preferred stock of TrueYou.com Inc. of approximately $1.3 million, as well as a loss of approximately $2.5 million resulting from the restructuring of notes held in, and the
52
Table of Contents
sale of warrants issued by, Punch Software, LLC (new notes were subsequently issued by Punch Software, LLC with an amended interest rate and maturity date). These losses were partially offset by the realized gain associated with the sale of warrants issued by Segovia, Inc. of approximately $5.4 million.
Based upon the fair value determinations made in good faith by the Board of Directors, during the year ended December 31, 2009, we had net unrealized gains of approximately $32.2 million, comprised of $43.9 million in gross unrealized appreciation, $22.5 million in gross unrealized depreciation and approximately $10.8 million relating to the reversal of prior period net unrealized depreciation as certain investments were realized. The most significant changes in net unrealized appreciation and depreciation during the year ended December 31, 2009 were as follows (in millions):
| Portfolio Company |
Changes in Unrealized Appreciation (Depreciation) |
|||
| Falcon Communications, Inc. |
$ | 9.5 | ||
| Questia Media, Inc. |
5.9 | |||
| Palm, Inc. |
4.1 | |||
| AKQA, Inc. |
3.3 | |||
| Punch Software LLC |
3.1 | |||
| Power Tools, Inc. |
2.9 | |||
| Hyland Software, Inc. |
2.7 | |||
| Cavtel Holdings, LLC |
2.2 | |||
| American Integration Technologies, LLC |
2.1 | |||
| Integra Telecom, Inc. |
2.1 | |||
| Netquote, Inc. |
2.0 | |||
| GXS Worldwide Inc. |
1.7 | |||
| TrueYou.com Inc. |
1.3 | |||
| Workflow Management, Inc. |
1.0 | |||
| SCS Holdings II, Inc. |
1.0 | |||
| The CAPS Group |
(1.4 | ) | ||
| Segovia, Inc. |
(1.6 | ) | ||
| Box Services, LLC |
(5.9 | ) | ||
| WAICCS Las Vegas, LLC |
(7.5 | ) | ||
| Net all other(1) |
3.7 | |||
|
|
|
|||
| Total |
$ | 32.2 | ||
|
|
|
|||
| (1) | Unrealized gains and losses less than $1.0 million have been combined. |
Please see “—Portfolio Grading” above for more information.
Net Increase in Net Assets Resulting from Net Investment Income
Net investment income for the years ended December 31, 2010 and 2009 was $24.2 million and $13.5 million, respectively. This increase was due largely to a greater return on our investment portfolio due to market discounts on new debt investments, distributions from the equity interests in our securitization vehicle investments as well as an increase in the amount of performing assets in the portfolio.
Based on a weighted-average of 27,253,552 shares outstanding (basic and diluted), the net increase in net assets resulting from net investment income per common share for the year ended December 31, 2010 was approximately $0.89 for basic and diluted, compared to approximately $0.51 per share for the year ended December 31, 2009.
Net Increase in Net Assets Resulting from Operations
We had a net increase in net assets resulting from operations of approximately $63.9 million for the year ended December 31, 2010, compared to a net increase of approximately $35.2 million in 2009. This net increase in net assets was attributable to greater net unrealized appreciation on investments and increased net investment income, partially offset by increased net realized losses on investments.
53
Table of Contents
Based on a weighted-average of 27,253,552 shares outstanding (basic and diluted), the net increase in net assets resulting from operations per common share for the year ended December 31, 2010 was approximately $2.35 for basic and diluted, compared to a net increase in net assets of approximately $1.32 per share in 2009.
Please see “—Portfolio Grading” above for more information.
LIQUIDITY AND CAPITAL RESOURCES
During the year ended December 31, 2011, cash and cash equivalents decreased from approximately $68.8 million at the beginning of the period to approximately $4.5 million at the end of the period. Net cash used by operating activities for the period, consisting primarily of the items described in “—Results of Operations,” was approximately $114.5 million, largely reflecting purchases of new investments of approximately $261.0 million offset by proceeds from principal repayments and sales of investments of approximately $119.2 million. Net cash used by investing activities reflects the restriction on cash raised in the debt securitization transaction. During the period, net cash provided by financing activities was approximately $73.4 million reflecting primarily the net proceeds of approximately $99.7 million borrowed under the debt securitization financing transaction partially offset by the distribution of dividends. We believe that our current cash and cash equivalents, cash generated from operations, and funds available from our borrowings will be sufficient to meet our working capital and capital expenditure commitments for at least the next 12 months.
“At-the-Market” Share Issuance Plan
During the first and second quarters of 2011, we sold 651,599 shares of our common stock pursuant to an “at-the-market” share issuance plan. Wells Fargo Securities, LLC acted as the sales agent for the “at-the-market” share issuance plan. The total amount of capital raised under these issuances was approximately $6.7 million and net proceeds were approximately $6.4 million, after deducting sales agent’s commissions and offering expenses. We have used, and will continue to use, the net proceeds from these offerings for investing in debt or equity securities, and other general corporate purposes, including working capital requirements.
Share Repurchase Program
On July 30, 2009, the Board of Directors authorized a share repurchase program which provides for the purchase of up to $10 million worth of shares to be implemented at the discretion of our management team. Under the repurchase program, we may, but are not obligated to, repurchase our outstanding common stock in the open market from time to time. The timing and number of shares to be repurchased in the open market will depend on a number of factors, including market conditions and alternative investment opportunities. In addition, any repurchases will be conducted in accordance with the 1940 Act.
Contractual Obligations
We have certain obligations with respect to the investment advisory and administration services we receive. See “—Overview”. We incurred approximately $9.6 million for investment advisory services and $995,000 for administrative services for the year ended December 31, 2011.
Off-Balance Sheet Arrangements
We currently have no off-balance sheet arrangements, including any risk management of commodity pricing or other hedging practices.
Borrowings
In accordance with the 1940 Act, with certain limited exceptions, we are only allowed to borrow amounts such that our asset coverage, as defined in the 1940 Act, is at least 200% after such borrowing. As of December 31, 2011, our asset coverage for borrowed amounts was 400%.
On August 10, 2011, we completed a $225.0 million debt securitization financing transaction. The Class A Notes offered in the securitization were issued by TICC CLO, and are secured by the assets held by the trustee on behalf of the Securitization Issuer. The securitization was executed through a private placement of $101.25 million of Aaa/AAA Class A Notes which bear interest, after the effective date, at three-month LIBOR plus 2.25% (prior to the effective date, the Class A Notes bear interest at five-month LIBOR plus 2.25%). The notes were sold at a discount to par, and the amount of the discount is being amortized over the term of the notes. The Class A Notes are included in the December 31, 2011 consolidated statements of assets and liabilities. Holdings retained all of the subordinated notes totaling $123.75 million and all of the membership interests in the Securitization Issuer. The subordinated notes do not bear interest, but are entitled to the residual economic interest in the Securitization Issuer.
During a period of up to three years from the closing date, all principal collections received on the underlying collateral may be used by the Securitization Issuer to purchase new collateral under our direction in our capacity as collateral manager of the Securitization Issuer and in accordance with our investment strategy, allowing us to maintain the initial leverage in the securitization for such three-year period. The Class A Notes are scheduled to mature on July 25, 2021.
54
Table of Contents
The proceeds of the private placement of the Class A Notes, net of discount and debt issuance costs, were used for investment purposes. As part of the securitization, we entered into a master loan sale agreement with Holdings and the Securitization Issuer under which we agreed to sell or contribute certain senior secured and second lien loans (or participation interests therein) to Holdings, and Holdings agreed to sell or contribute such loans (or participation interests therein) to the Securitization Issuer and to purchase or otherwise acquire subordinated notes issued by the Securitization Issuer. The Class A Notes are the secured obligations of the Securitization Issuer, and an indenture governing the Notes includes customary covenants and events of default.
We serve as collateral manager to the Securitization Issuer under a collateral management agreement. We are entitled to a deferred fee for our services as collateral manager. The deferred fee is eliminated in consolidation.
As of December 31, 2011, there were 45 investments in portfolio companies with a total fair value of approximately $219,696,000, securing the Class A Notes. The pool of loans in the securitization must meet certain requirements, including asset mix and concentration, collateral coverage, term, agency rating, minimum coupon, minimum spread and sector diversity requirements.
For the period from closing until the effective date, the interest charged under the securitization is based on five-month LIBOR, which as of December 31, 2011 was 0.40%. For the year ended December 31, 2011, the effective annualized average interest rate, which includes amortization of discount and debt issuance costs on the securitization, was 3.1%. For the year ended December 31, 2011, interest expense, including the amortization of deferred debt issuance costs and the discount on the face amount of the Class A Notes, was $1,243,584. Cash paid for interest during the year ended December 31, 2011 was $0.
The amounts, ratings and interest rates (expressed as a spread to LIBOR) of the Class A Notes are as follows:
| Description | Class A Notes | |
| Type |
Senior Secured Floating Rate | |
| Amount Outstanding |
$101,250,000 | |
| Moody’s Rating |
“Aaa” | |
| Standard & Poor’s Rating |
“AAA” | |
| Interest Rate |
LIBOR + 2.25% | |
| Stated Maturity |
July 25, 2021 |
Deferred debt issuance costs represent fees and other direct incremental costs incurred in connection with our debt securitization. As of December 31, 2011, we had deferred financing costs of $2,895,873. Discount on the Notes at the time of issuance totaled approximately $1,588,125. These amounts are being amortized and included in interest expense in the consolidated statements of operations over the term of the debt securitization. Amortization expense for the year ended December 31, 2011 was approximately $167,000. There was no amortization expense for the year ended December 31, 2010.
Distributions
In order to qualify as a RIC and to avoid corporate level tax on the income we distribute to our stockholders, we are required, under Subchapter M of the Code, to distribute at least 90% of our ordinary income and realized net short-term capital gains in excess of realized net long-term capital losses to our stockholders on an annual basis.
For the years ended December 31, 2011 and 2010 we believe that we did not have distributions in excess of our taxable earnings. For tax purposes, distributions for 2011 and 2010 were funded from current net investment income. A written statement identifying the source of the dividend accompanied our fourth quarter dividend payment to our shareholders and was posted on our website. We may not be able to achieve operating results that will allow us to make distributions at a specific level or to increase the amount of these distributions from time to time. In addition, we may be limited in our ability to make distributions due to the asset coverage requirements applicable to us as a business development company under the 1940 Act. If we do not distribute a certain percentage of our income annually, we will suffer adverse tax consequences, including possible loss of favorable regulated investment company tax treatment. We cannot assure shareholders that they will receive any distributions.
To the extent our taxable earnings fall below the total amount of our distributions for that fiscal year, a portion of those distributions may be deemed a tax return of capital to our stockholders. Thus, the source of a distribution to our stockholders may be the original capital invested by the stockholder rather than our taxable ordinary income or capital gains. Stockholders should read any written disclosure accompanying a dividend payment carefully and should not assume that the source of any distribution is our taxable ordinary income or capital gains. The final determination of the nature of our distributions can only be made upon the filing of our tax return.
55
Table of Contents
The following table reflects the cash distributions, including dividends and returns of capital, if any, per share that we have declared on our common stock to date:
| Date Declared |
Record Date | Payment Date | Amount | |||||||||
| Fiscal 2012 |
||||||||||||
| March 1, 2012 |
March 21, 2012 | March 30, 2012 | $ | 0.27 | ||||||||
|
|
|
|||||||||||
| Fiscal 2011 |
||||||||||||
| November 3, 2011 |
December 16, 2011 | December 30, 2011 | 0.25 | |||||||||
| July 28, 2011 |
September 16, 2011 | September 30, 2011 | 0.25 | |||||||||
| May 3, 2011 |
June 16, 2011 | June 30, 2011 | 0.25 | |||||||||
| March 3, 2011 |
March 21, 2011 | March 31, 2011 | 0.24 | |||||||||
|
|
|
|||||||||||
| Total (2011) |
0.99 | (1) | ||||||||||
|
|
|
|||||||||||
| Fiscal 2010 |
||||||||||||
| November 2, 2010 |
December 10, 2010 | December 31, 2010 | 0.24 | |||||||||
| July 29, 2010 |
September 10, 2010 | September 30, 2010 | 0.22 | |||||||||
| April 29, 2010 |
June 10, 2010 | June 30, 2010 | 0.20 | |||||||||
| March 4, 2010 |
March 24, 2010 | March 31, 2010 | 0.15 | |||||||||
|
|
|
|||||||||||
| Total (2010) |
0.81 | (1) | ||||||||||
|
|
|
|||||||||||
| Fiscal 2009 |
||||||||||||
| October 29, 2009 |
December 10, 2009 | December 31, 2009 | 0.15 | |||||||||
| July 30, 2009 |
September 10, 2009 | September 30, 2009 | 0.15 | |||||||||
| May 5, 2009 |
June 10, 2009 | June 30, 2009 | 0.15 | |||||||||
| March 5, 2009 |
March 17, 2009 | March 31, 2009 | 0.15 | |||||||||
|
|
|
|||||||||||
| Total (2009) |
0.60 | (1) | ||||||||||
|
|
|
|||||||||||
| Fiscal 2008 |
||||||||||||
| October 30, 2008 |
December 10, 2008 | December 31, 2008 | 0.20 | |||||||||
| July 31, 2008 |
September 10, 2008 | September 30, 2008 | 0.20 | |||||||||
| May 1, 2008 |
June 16, 2008 | June 30, 2008 | 0.30 | |||||||||
| March 11, 2008 |
March 21, 2008 | March 31, 2008 | 0.36 | |||||||||
|
|
|
|||||||||||
| Total (2008) |
1.06 | (2) | ||||||||||
|
|
|
|||||||||||
| Fiscal 2007 |
||||||||||||
| October 25, 2007 |
December 10, 2007 | December 31, 2007 | 0.36 | |||||||||
| July 26, 2007 |
September 7, 2007 | September 28, 2007 | 0.36 | |||||||||
| April 30, 2007 |
June 8, 2007 | June 29, 2007 | 0.36 | |||||||||
| February 27, 2007 |
March 9, 2007 | March 30, 2007 | 0.36 | |||||||||
|
|
|
|||||||||||
| Total (2007) |
1.44 | (3) | ||||||||||
|
|
|
|||||||||||
| Fiscal 2006 |
||||||||||||
| December 20, 2006 |
December 29, 2006 | January 17, 2007 | 0.12 | |||||||||
| October 26, 2006 |
December 8, 2006 | December 29, 2006 | 0.34 | |||||||||
| July 26, 2006 |
September 8, 2006 | September 29, 2006 | 0.32 | |||||||||
| April 26, 2006 |
June 9, 2006 | June 30, 2006 | 0.30 | |||||||||
| February 9, 2006 |
March 10, 2006 | March 31, 2006 | 0.30 | |||||||||
|
|
|
|||||||||||
| Total (2006) |
1.38 | |||||||||||
|
|
|
|||||||||||
| Fiscal 2005 |
||||||||||||
| December 7, 2005 |
December 30, 2005 | January 18, 2006 | 0.12 | |||||||||
| October 27, 2005 |
December 9, 2005 | December 30, 2005 | 0.30 | |||||||||
| July 27, 2005 |
September 10, 2005 | September 30, 2005 | 0.25 | |||||||||
| April 27, 2005 |
June 10, 2005 | June 30, 2005 | 0.20 | |||||||||
| February 9, 2005 |
March 10, 2005 | March 31, 2005 | 0.14 | |||||||||
|
|
|
|||||||||||
| Total (2005) |
1.01 | |||||||||||
|
|
|
|||||||||||
| Fiscal 2004 |
||||||||||||
| October 27, 2004 |
December 10, 2004 | December 31, 2004 | 0.11 | |||||||||
| July 28, 2004 |
September 10, 2004 | September 30, 2004 | 0.11 | |||||||||
56
Table of Contents
| Date Declared |
Record Date | Payment Date | Amount | |||||||||
| May 5, 2004 |
June 10, 2004 | June 30, 2004 | 0.11 | |||||||||
| February 2, 2004 |
March 15, 2004 | April 5, 2004 | 0.10 | |||||||||
|
|
|
|||||||||||
| Total (2004) |
0.43 | (4) | ||||||||||
|
|
|
|||||||||||
| Total Distributions: |
$ | 7.99 | (5) | |||||||||
|
|
|
|||||||||||
| (1) | Distributions for the fiscal years ended December 31, 2011, 2010 and 2009 were funded from undistributed net investment income. |
| (2) | Includes a return of capital of approximately $0.08 per share for tax purposes. |
| (3) | Includes a return of capital of approximately $0.02 per share for tax purposes. |
| (4) | Includes a return of capital of approximately $0.10 per share for tax purposes. |
| (5) | We did not declare a dividend for the period ended December 31, 2003. |
Related Parties
We have a number of business relationships with affiliated or related parties, including the following:
| • | We have entered into the Investment Advisory Agreement with TICC Management. TICC Management is controlled by BDC Partners, its managing member. In addition to BDC Partners, TICC Management is owned by Charles M. Royce, our non-executive Chairman, who holds a minority, non-controlling interest in TICC Management as the non-managing member. BDC Partners, as the managing member of TICC Management, manages the business and internal affairs of TICC Management. In addition, BDC Partners provides us with office facilities and administrative services pursuant to the Administration Agreement. |
| • | Messrs. Cohen and Rosenthal currently serve as Chief Executive Officer and President, respectively, for T2 Advisers, LLC, an investment adviser to Greenwich Loan Income Fund Limited (f/k/a T2 Income Fund Limited) (“GLIF”), a Guernsey fund, established and operated for the purpose of investing in bilateral transactions and syndicated loans across a variety of industries globally. BDC Partners is the managing member of T2 Advisers, LLC. In addition, Mr. Conroy serves as the Chief Financial Officer of GLIF and the Chief Financial Officer, Chief Compliance Officer and Treasurer of T2 Advisers, LLC. |
| • | Messrs. Cohen and Rosenthal currently serve as Chief Executive Officer and President, respectively, of Oxford Lane Capital Corp., a non-diversified closed-end management investment company that invests primarily in leveraged corporate loans, and its investment adviser, Oxford Lane Management, LLC. BDC Partners provides Oxford Lane Capital Corp. with office facilities and administrative services pursuant to an administration agreement and also serves as the managing member of Oxford Lane Management, LLC. In addition, Patrick F. Conroy serves as the Chief Financial Officer, Chief Compliance Officer and Corporate Secretary of Oxford Lane Capital Corp. and Chief Financial Officer, Chief Compliance Officer and Treasurer of Oxford Lane Management, LLC. |
| • | BDC Partners is the managing member of Oxford Gate Capital, LLC, a private fund in which Messrs. Cohen, Rosenthal and Conroy, along with certain investment and administrative personnel of TICC Management, are invested. |
BDC Partners has adopted a written policy with respect to the allocation of investment opportunities among TICC, Oxford Lane Capital Corp., Greenwich Loan Income Fund Limited and Oxford Gate Capital, LLC in view of the potential conflicts of interest raised by the relationships described above.
In the ordinary course of business, we may enter into transactions with portfolio companies that may be considered related party transactions. In order to ensure that we do not engage in any prohibited transactions with any persons affiliated with us, we have implemented certain policies and procedures whereby our executive officers screen each of our transactions for any possible affiliations between the proposed portfolio investment, us, companies controlled by us and our employees and directors. We will not enter into any agreements unless and until we are satisfied that doing so will not raise concerns under the 1940 Act or, if such concerns exist, we have taken appropriate actions to seek board review and approval or exemptive relief for such transaction. Our Board of Directors reviews these procedures on an annual basis.
We have also adopted a Code of Ethics which applies to, among others, our senior officers, including our Chief Executive Officer and Chief Financial Officer, as well as all of our officers, directors and employees. Our Code of Ethics requires that all employees and directors avoid any conflict, or the appearance of a conflict, between an individual’s personal interests and our interests. Pursuant to our Code of Ethics, each employee and director must disclose any conflicts of interest, or actions or relationships that might give rise to a conflict, to our Chief Compliance Officer. Our Audit Committee is charged with approving any waivers under our Code of Ethics. As required by the NASDAQ Global Select Market corporate governance listing standards, the Audit Committee of our Board of Directors is also required to review and approve any transactions with related parties (as such term is defined in Item 404 of Regulation S-K).
57
Table of Contents
Information concerning related party transactions is included in the consolidated financial statements and related notes, appearing elsewhere in this annual report on Form 10-K.
CRITICAL ACCOUNTING POLICIES
The preparation of consolidated financial statements and related disclosures in conformity with generally accepted accounting principles in the United States requires management to make estimates and assumptions that affect the reported amounts of assets and liabilities, disclosure of contingent assets and liabilities at the date of the consolidated financial statements, and revenues and expenses during the periods reported. Actual results could materially differ from those estimates. We have identified our investment valuation policy as a critical accounting policy.
Investment Valuation
The most significant estimate inherent in the preparation of our consolidated financial statements is the valuation of investments and the related amounts of unrealized appreciation and depreciation of investments recorded. There is no single method for determining fair value in good faith. As a result, determining fair value requires that judgment be applied to the specific facts and circumstances of each portfolio investment while employing a consistently applied valuation process for the types of investments we make. We are required to specifically fair value each individual investment on a quarterly basis.
In May 2011, the FASB issued an update to requirements relating to “Fair Value Measurement which represents amendments to achieve common fair value measurement and disclosure requirements in US GAAP and IFRS.” The amendments are of two types: (i) those that clarify the FASB’s intent about the application of existing fair value measurement and disclosure requirements and (ii) those that change a particular principle or requirement for measuring fair value or for disclosing information about fair value measurements. The amendments that change a particular principle or requirement for measuring fair value or disclosing information about fair value measurements relate to (i) measuring the fair value of the financial instruments that are managed within a portfolio; (ii) application of premium and discount in a fair value measurement; and (iii) additional disclosures about fair value measurements. The update is effective for annual periods beginning after December 15, 2011 with early adoption prohibited. The adoption of this update will not have a material impact on our consolidated financial statements; however, certain investments will not be valued under the highest and best use concept and we will enhance the disclosures in our consolidated financial statements.
We adopted ASC 820-10, Fair Value Measurements and Disclosure, which establishes a three-level valuation hierarchy for disclosure of fair value measurements, on January 1, 2008. ASC 820-10 clarified the definition of fair value and requires companies to expand their disclosure about the use of fair value to measure assets and liabilities in interim and annual periods subsequent to initial recognition. ASC 820-10 defines fair value as the price that would be received to sell an asset or paid to transfer a liability in an orderly transaction between market participants at the measurement date. ASC 820-10 also establishes a three-tier fair value hierarchy, which prioritizes the inputs used in measuring fair value. These tiers include: Level 1, defined as observable inputs such as quoted prices in active markets; Level 2, which includes inputs such as quoted prices for similar securities in active markets and quoted prices for identical securities in markets that are not active; and Level 3, defined as unobservable inputs for which little or no market data exists, therefore requiring an entity to develop its own assumptions. We have determined that due to the general illiquidity of the market for our investment portfolio, whereby little or no market data exists, all of our investments are based upon “Level 3” inputs.
Our Board of Directors determines the value of our investment portfolio each quarter. In connection with that determination, members of TICC Management’s portfolio management team prepare portfolio company valuations using the most recent portfolio company financial statements and forecasts. Since March 2004, we have engaged third-party valuation firms to provide assistance in valuing our bilateral investments and, more recently, for certain of our syndicated loans, although our Board of Directors ultimately determines the appropriate valuation of each such investment.
Our process for determining the fair value of a bilateral investment begins with determining the enterprise value of the portfolio company. Enterprise value means the entire value of the company to a potential buyer, including the sum of the values of debt and equity securities used to capitalize the enterprise at a point in time. The fair value of our investment is based, in part, on the enterprise value at which the portfolio company could be sold in an orderly disposition over a reasonable period of time between willing parties other than in a forced or liquidation sale. The liquidity event whereby we exit a private investment is generally the sale, the recapitalization or, in some cases, the initial public offering of the portfolio company.
There is no one methodology to determine enterprise value and, in fact, for any one portfolio company, enterprise value is best expressed as a range of fair values, from which we derive a single estimate of enterprise value. To determine the enterprise value of a portfolio company, we analyze the historical and projected financial results, as well as the nature and value of any collateral. We also
58
Table of Contents
use industry valuation benchmarks and public market comparables. We also consider other events, including private mergers and acquisitions, a purchase transaction, public offering or subsequent debt or equity sale or restructuring, and include these events in the enterprise valuation process. We generally require portfolio companies to provide annual audited and quarterly unaudited financial statements, as well as annual projections for the upcoming fiscal year.
Typically, our bilateral debt investments are valued on the basis of a fair value determination arrived at through an analysis of the borrower’s financial and operating condition or other factors, as well as consideration of the entity’s enterprise value. The types of factors that we may take into account in valuing our investments include: market trading and transaction comparables, applicable market yields and multiples, security covenants, call protection provisions, the nature and realizable value of any collateral, the portfolio company’s ability to make payments and its earnings and discounted cash flows, among other factors. The fair value of equity interests in portfolio companies is determined based on various factors, including the enterprise value remaining for equity holders after the repayment of the portfolio company’s debt and other preference capital, and other pertinent factors such as recent offers to purchase a portfolio company, recent transactions involving the purchase or sale of the portfolio company’s equity securities, or other liquidity events. The determined equity values are generally discounted when we have a minority position, restrictions on resale, specific concerns about the receptivity of the capital markets to a specific company at a certain time, or other factors.
We will record unrealized depreciation on bilateral investments when we believe that an investment has become impaired, including where collection of a loan or realization of an equity security is doubtful. To the extent that we believe that it has become probable that a loan is not collectible or probable that an equity investment is not realizable, we will classify that amount as a realized loss. We will record unrealized appreciation if we believe that the underlying portfolio company has appreciated in value and our equity security has also appreciated in value. Changes in fair value, other than such changes that are considered probable of non-collection or non-realization, as described above, are recorded in the statement of operations as net change in unrealized appreciation or depreciation.
Under the valuation procedures approved by our Board of Directors, upon the recommendation of the Valuation Committee, a third-party valuation firm will prepare valuations for each of our bilateral investments for which market quotations are not readily available that, when combined with all other investments in the same portfolio company, (i) have a value as of the previous quarter of greater than or equal to 2.5% of our total assets as of the previous quarter, and (ii) have a value as of the current quarter of greater than or equal to 2.5% of our total assets as of the previous quarter, after taking into account any repayment of principal during the current quarter. In addition, the frequency of those third-party valuations of our portfolio securities is based upon the grade assigned to each such security under our credit grading system as follows: Grade 1, at least annually; Grade 2, at least semi-annually; Grades 3, 4, and 5, at least quarterly. TICC Management also retains the authority to seek, on our behalf, additional third party valuations with respect to both our bilateral portfolio securities and our syndicated loan investments. Our Board of Directors retains ultimate authority as to the third-party review cycle as well as the appropriate valuation of each investment.
On April 9, 2009, the FASB issued additional guidelines under ASC 820-10-35, “Determining Fair Value When the Volume and Level of Activity for the Asset or Liability Have Significantly Decreased and Identifying Transactions That Are Not Orderly,” which provides guidance on factors that should be considered in determining when a previously active market becomes inactive and whether a transaction is orderly. In accordance with ASC 820-10-35, our valuation procedures specifically provide for the review of indicative quotes supplied by the large agent banks that make a market for each security. However, the marketplace for which we obtain indicative bid quotes for purposes of determining the fair value of our syndicated loan investments have shown these attributes of illiquidity as described by ASC-820-10-35. Due to limited market liquidity in the syndicated loan market, TICC believes that the non-binding indicative bids received from agent banks for certain syndicated investments that we own may not be determinative of their fair value and therefore alternative valuation procedures may need to be undertaken. As a result, TICC has engaged third-party valuation firms to provide assistance in valuing certain syndicated investments that we own. In addition, TICC Management prepares an analysis of each syndicated loan, including a financial summary, covenant compliance review, recent trading activity in the security, if known, and other business developments related to the portfolio company. All available information, including non-binding indicative bids which may not be determinative of fair value, is presented to the Valuation Committee to consider in its determination of fair value. In some instances, there may be limited trading activity in a security even though the market for the security is considered not active. In such cases the Valuation Committee will consider the number of trades, the size and timing of each trade, and other circumstances around such trades, to the extent such information is available, in its determination of fair value. The Valuation Committee will evaluate the impact of such additional information, and factor it into its consideration of the fair value that is indicated by the analysis provided by third-party valuation firms. We have considered the factors described in ASC 820-10 and have determined that we are properly valuing the securities in our portfolio.
During the past several quarters, we have acquired a number of debt and equity positions in CLO investment vehicles. These investments are special purpose financing vehicles. In valuing such investments, we consider the operating metrics of the specific investment vehicle, including compliance with collateralization tests, defaulted and restructured securities, and payment defaults, if any. In addition, we consider the indicative prices provided by the broker who arranges transactions in such investment vehicles, as
59
Table of Contents
well as any available information on other relevant transactions in the market. TICC Management or the Valuation Committee may request an additional analysis by a third-party firm to assist in the valuation process of CLO investment vehicles. All information is presented to our Board of Directors for its determination of fair value of these investments.
Our assets measured at fair value on a recurring basis subject to the disclosure requirements of ASC 820-10-35 at December 31, 2011, were as follows:
| ($ in millions) |
Fair Value Measurements at Reporting Date Using | Total | ||||||||||||||
| Assets |
Quoted Prices in Active Markets for Identical Assets (Level 1) |
Significant Other Observable Inputs (Level 2) |
Significant Unobservable Inputs (Level 3) |
|||||||||||||
| Cash equivalents |
$ | 0.0 | $ | 0.0 | $ | 0.0 | $ | 0.0 | ||||||||
| Senior Secured Notes |
0.0 | 10.7 | 279.2 | 289.9 | ||||||||||||
| CLO Debt |
0.0 | 0.0 | 51.0 | 51.0 | ||||||||||||
| CLO Equity |
0.0 | 0.0 | 39.3 | 39.3 | ||||||||||||
| Subordinated Notes |
0.0 | 0.0 | 4.9 | 4.9 | ||||||||||||
| Common Stock |
0.0 | 0.0 | 3.1 | 3.1 | ||||||||||||
| Preferred Shares |
0.0 | 0.0 | 2.5 | 2.5 | ||||||||||||
| Warrants to purchase equity |
0.0 | 0.0 | 0.8 | 0.8 | ||||||||||||
|
|
|
|
|
|
|
|
|
|||||||||
| Total |
$ | 0.0 | $ | 10.7 | $ | 380.8 | $ | 391.5 | ||||||||
|
|
|
|
|
|
|
|
|
|||||||||
A reconciliation of the fair value of investments for the year ended December 31, 2011, utilizing significant unobservable inputs, is as follows:
| ($ in millions) |
Senior Secured Note Investments |
Collateralized Loan Obligation Debt Investments |
Collateralized Loan Obligation Equity Investments |
Subordinated Note Investments |
Common Stock Investments |
Preferred Share Equity Investments |
Warrants to Purchase Equity Investments |
Total | ||||||||||||||||||||||||
| Balance at December 31, 2010 |
$ | 173.9 | $ | 50.4 | $ | 8.9 | $ | 6.0 | $ | 5.8 | $ | 2.0 | $ | 0.5 | $ | 247.5 | ||||||||||||||||
| Realized Losses included in earnings |
2.7 | 0.9 | 0.0 | 0.0 | 0.0 | 0.0 | 0.0 | 3.6 | ||||||||||||||||||||||||
| Unrealized (depreciation) appreciation included in earnings |
(5.7 | ) | (9.5 | ) | (1.5 | ) | (0.4 | ) | (2.7 | ) | 0.1 | 0.3 | (19.4 | ) | ||||||||||||||||||
| Accretion of discount |
2.8 | 2.2 | 0.0 | 0.0 | 0.0 | 0.0 | 0.0 | 5.0 | ||||||||||||||||||||||||
| Purchases |
230.0 | 10.6 | 31.9 | 0.0 | 0.0 | 0.0 | 0.0 | 272.5 | ||||||||||||||||||||||||
| Repayments and Sales(1) |
(113.8 | ) | (3.6 | ) | 0.0 | (0.7 | ) | 0.0 | 0.4 | 0.0 | (117.7 | ) | ||||||||||||||||||||
| Transfers in and/or out of level 3 |
(10.7 | ) | 0.0 | 0.0 | 0.0 | 0.0 | 0.0 | 0.0 | (10.7 | ) | ||||||||||||||||||||||
|
|
|
|
|
|
|
|
|
|
|
|
|
|
|
|
|
|||||||||||||||||
| Balance at December 31, 2011 |
$ | 279.2 | $ | 51.0 | $ | 39.3 | $ | 4.9 | $ | 3.1 | $ | 2.5 | $ | 0.8 | $ | 380.8 | ||||||||||||||||
|
|
|
|
|
|
|
|
|
|
|
|
|
|
|
|
|
|||||||||||||||||
| The amount of total gains or losses for the period included in earnings attributable to the change in unrealized gains or losses relating to our Level 3 assets still held at the reporting date and reported within the net change in unrealized gains or losses on investments in our Statement of Operations |
($ | 4.1 | ) | ($ | 8.8 | ) | ($ | 1.3 | ) | ($ | 0.3 | ) | ($ | 2.7 | ) | $ | 0.1 | $ | 0.3 | ($ | 16.8 | ) | ||||||||||
|
|
|
|
|
|
|
|
|
|
|
|
|
|
|
|
|
|||||||||||||||||
| (1) | Includes PIK interest of approximately $1.5 million and rounding adjustments to reconcile period balances. |
60
Table of Contents
Our assets measured at fair value on a recurring basis subject to the disclosure requirements of ASC 820-10-35 at December 31, 2010, were as follows:
| ($ in millions) | Fair Value Measurements at Reporting Date Using | Total | ||||||||||||||
| Assets |
Quoted Prices in Active Markets for Identical Assets (Level 1) |
Significant Other Observable Inputs (Level 2) |
Significant Unobservable Inputs (Level 3) |
|||||||||||||
| Cash equivalents |
$ | 68.5 | $ | 0.0 | $ | 0.0 | $ | 68.5 | ||||||||
| Senior Secured Notes |
0.0 | 0.0 | 173.9 | 173.9 | ||||||||||||
| CLO Debt |
0.0 | 0.0 | 50.4 | 50.4 | ||||||||||||
| CLO Equity |
0.0 | 0.0 | 8.9 | 8.9 | ||||||||||||
| Subordinated Notes |
0.0 | 0.0 | 6.0 | 6.0 | ||||||||||||
| Common Stock |
0.0 | 0.0 | 5.8 | 5.8 | ||||||||||||
| Preferred Shares |
0.0 | 0.0 | 2.0 | 2.0 | ||||||||||||
| Warrants to purchase equity |
0.0 | 0.0 | 0.5 | 0.5 | ||||||||||||
|
|
|
|
|
|
|
|
|
|||||||||
| Total |
$ | 68.5 | $ | 0.0 | $ | 247.5 | $ | 316.0 | ||||||||
|
|
|
|
|
|
|
|
|
|||||||||
61
Table of Contents
A reconciliation of the fair value of investments for the year ended December 31, 2010, utilizing significant unobservable inputs, is as follows:
| ($ in millions) |
Senior Secured Note Investments |
Collateralized Loan Obligation Debt Investments |
Collateralized Loan Obligation Equity Investments |
Subordinated Note Investments |
Common Stock Investments |
Preferred Share Equity Investments |
Warrants to Purchase Equity Investments |
Total | ||||||||||||||||||||||||
| Balance at December 31, 2009 |
$ | 180.1 | $ | 4.9 | $ | 2.2 | $ | 2.7 | $ | 5.5 | $ | 0.0 | $ | 0.5 | $ | 195.9 | ||||||||||||||||
| Realized Losses included in earnings |
(42.4 | ) | 0.0 | 0.0 | 0.0 | 0.0 | 0.0 | 0.0 | (42.4 | ) | ||||||||||||||||||||||
| Unrealized appreciation (depreciation) included in earnings |
63.7 | 15.0 | 1.8 | 0.8 | (0.1 | ) | 1.2 | 0.0 | 82.4 | |||||||||||||||||||||||
| Accretion of discount |
4.5 | 1.1 | 0.0 | 0.0 | 0.0 | 0.0 | 0.0 | 5.6 | ||||||||||||||||||||||||
| Purchases |
88.1 | 31.5 | 4.9 | 3.9 | 0.4 | 0.8 | 0.0 | 129.6 | ||||||||||||||||||||||||
| Repayments and Sales(1) |
(120.1 | ) | (2.1 | ) | 0.0 | (1.4 | ) | 0.0 | 0.0 | 0.0 | (123.6 | ) | ||||||||||||||||||||
| Transfers in and/or out of level 3 |
0.0 | 0.0 | 0.0 | 0.0 | 0.0 | 0.0 | 0.0 | 0.0 | ||||||||||||||||||||||||
|
|
|
|
|
|
|
|
|
|
|
|
|
|
|
|
|
|||||||||||||||||
| Balance at December 31, 2010 |
$ | 173.9 | $ | 50.4 | $ | 8.9 | $ | 6.0 | $ | 5.8 | $ | 2.0 | $ | 0.5 | $ | 247.5 | ||||||||||||||||
|
|
|
|
|
|
|
|
|
|
|
|
|
|
|
|
|
|||||||||||||||||
| The amount of total gains or losses for the period included in earnings attributable to the change in unrealized gains or losses relating to our Level 3 assets still held at the reporting date and reported within the net change in unrealized gains or losses on investments in our Statement of Operations |
$ | 18.7 | $ | 15.0 | $ | 1.8 | $ | 0.9 | ($ | 0.1 | ) | $ | 1.1 | $ | 0.1 | $ | 37.5 | |||||||||||||||
|
|
|
|
|
|
|
|
|
|
|
|
|
|
|
|
|
|||||||||||||||||
| (1) | Includes amortization of discounts of approximately $5.6 million and PIK interest of approximately $710,000 and rounding adjustments to reconcile period balances. |
The following table shows the fair value of our portfolio of investments by asset class as of December 31, 2011 and 2010:
| 2011 | 2010 | |||||||||||||||
| Investments at Fair Value |
Percentage of Total Portfolio |
Investments at Fair Value |
Percentage of Total Portfolio |
|||||||||||||
| (dollars in millions) | (dollars in millions) | |||||||||||||||
| Senior Secured Notes |
$ | 289.9 | 74.1 | % | $ | 173.9 | 70.3 | % | ||||||||
| CLO Debt |
51.0 | 13.0 | % | 50.4 | 20.4 | % | ||||||||||
| CLO Equity |
39.3 | 10.0 | % | 8.9 | 3.6 | % | ||||||||||
| Subordinated Notes |
4.9 | 1.3 | % | 6.0 | 2.4 | % | ||||||||||
| Common Stock |
3.1 | 0.8 | % | 5.8 | 2.3 | % | ||||||||||
| Preferred Shares |
2.5 | 0.6 | % | 2.0 | 0.8 | % | ||||||||||
| Warrants |
0.8 | 0.2 | % | 0.5 | 0.2 | % | ||||||||||
|
|
|
|
|
|
|
|
|
|||||||||
| Total |
$ | 391.5 | 100.0 | % | $ | 247.5 | 100.0 | % | ||||||||
|
|
|
|
|
|
|
|
|
|||||||||
62
Table of Contents
OTHER ACCOUNTING POLICIES
Interest Income Recognition
Interest income is recorded on the accrual basis to the extent that such amounts are expected to be collected.
Payment in Kind Interest
We have investments in our portfolio which contain a PIK provision. The PIK income is added to the principal balance of the investment and is recorded as income. To maintain our status as a RIC, this income must be paid out to stockholders in the form of dividends, even though we have not collected any cash. For the year ended December 31, 2011 we recorded PIK interest income of approximately $1,474,000. For the years ended December 31, 2010 and 2009, we recorded approximately $710,000 and $162,000 in PIK interest income, respectively.
In addition, we recorded original issue discount income of approximately $5,011,000, $5,578,000 and $2,783,000 for the years ended December 31, 2011, 2010 and 2009, respectively, representing the amortization of the discount attributed to certain debt securities purchased by us, including original issue discount (“OID”) and market discount.
Other Income
Other income includes closing fees, or origination fees, associated with investments in portfolio companies. Such fees are normally paid at closing of our investments, are fully earned and non-refundable, and are generally non-recurring.
Managerial Assistance Fees
The 1940 Act requires that a business development company offer managerial assistance to its portfolio companies. We offer to provide managerial assistance to our portfolio companies in connection with our investments and may receive fees for our services. We have not received any fees for such services since inception.
Federal Income Taxes
We intend to operate so as to qualify to be taxed as a RIC under Subchapter M of the Code and, as such, to not be subject to federal income tax on the portion of our taxable income and gains distributed to stockholders. To qualify for RIC tax treatment, we are required to distribute at least 90% of our investment company taxable income, as defined by the Code.
Because federal income tax regulations differ from accounting principles generally accepted in the United States, distributions in accordance with tax regulations may differ from net investment income and realized gains recognized for financial reporting purposes. Differences may be permanent or temporary. Permanent differences are reclassified among capital accounts in the financial statement to reflect their tax character. Temporary differences arise when certain items of income, expense, gain or loss are recognized at some time in the future. Differences in classification may also result from the treatment of short-term gains as ordinary income for tax purposes.
For tax purposes, the cost basis of the portfolio investments at December 31, 2011 and December 31, 2010 was approximately $408,054,145 and $241,093,000, respectively.
RECENT DEVELOPMENTS
On March 1, 2012, our Board of Directors declared a cash dividend of $0.27 per share payable on March 30, 2012 to holders of record on March 21, 2012.
| Item 7A. | Quantitative and Qualitative Disclosures About Market Risk |
We are subject to financial market risks, including changes in interest rates. As of December 31, 2011, three debt investments in our portfolio were at a fixed rate, and the remaining sixty-nine debt investments were at variable rates, representing approximately $23.2 million and $362.6 million in principal debt, respectively. At December 31, 2011, $359.2 million of our variable rate investments were income producing. The variable rates are based upon the five-year Treasury note, the Prime rate or LIBOR, and, in the case of our bilateral investments, are generally reset annually, whereas our non-bilateral investments generally reset quarterly. We expect that future debt investments will generally be made at variable rates. Many of the variable rate investments contain floors.
63
Table of Contents
To illustrate the potential impact of a change in the underlying interest rate on our net increase in net assets resulting from operations, we have assumed a 1% increase or decrease in the underlying five-year Treasury note, the Prime rate or LIBOR, and no other change in our portfolio as of December 31, 2011. We have also assumed outstanding borrowings of $101,250,000. Under this analysis, net investment income would be essentially unchanged on an annual basis, due to the amount of investments in our portfolio which have implied floors that would be unaffected by a 1% change in the underlying interest rate. However, if the increase in rates was more significant, such as 5%, the net effect on the net increase in net assets resulting from operations would be an increase of approximately $8.7 million. To the extent that the rate underlying certain investments, as well as our borrowings, is at an historic low, it may not be possible for the underlying rate to decrease by 1% or 5%, and the impact of that reality is reflected in this analysis. Although management believes that this analysis is indicative of our existing interest rate sensitivity, it does not adjust for changes in the credit quality, size and composition of our portfolio, and other business developments, including a change in the level of our borrowings, that could affect the net increase in net assets resulting from operations. Accordingly, no assurances can be given that actual results would not differ materially from the results under this hypothetical analysis.
We may in the future hedge against interest rate fluctuations by using standard hedging instruments such as futures, options and forward contracts. While hedging activities may insulate us against adverse changes in interest rates, they may also limit our ability to participate in the benefits of lower interest rates with respect to the investments in our portfolio with fixed interest rates.
64
Table of Contents
| Item 8. | Consolidated Financial Statements and Supplementary Data |
Index to Consolidated Financial Statements
65
Table of Contents
MANAGEMENT’S REPORT ON INTERNAL CONTROL OVER FINANCIAL REPORTING
Management is responsible for establishing and maintaining adequate internal control over financial reporting, and for performing an assessment of the effectiveness of internal control over financial reporting as of December 31, 2011. Internal control over financial reporting is a process designed to provide reasonable assurance regarding the reliability of financial reporting and the preparation of financial statements for external purposes in accordance with generally accepted accounting principles. The Company’s internal control over financial reporting includes those policies and procedures that (i) pertain to the maintenance of records that, in reasonable detail, accurately and fairly reflect the transactions and dispositions of the assets of the company; (ii) provide reasonable assurance that transactions are recorded as necessary to permit preparation of financial statements in accordance with generally accepted accounting principles, and that receipts and expenditures of the company are being made only in accordance with authorizations of management and directors of the company; and (iii) provide reasonable assurance regarding prevention or timely detection of unauthorized acquisition, use, or disposition of the company’s assets that could have a material effect on the financial statements.
Management performed an assessment of the effectiveness of the Company’s internal control over financial reporting as of December 31, 2011 based upon criteria in Internal Control—Integrated Framework issued by the Committee of Sponsoring Organizations of the Treadway Commission (“COSO”). Based on our assessment, management determined that the Company’s internal control over financial reporting was effective as of December 31, 2011 based on the criteria in Internal Control—Integrated Framework issued by COSO. PricewaterhouseCoopers LLP, our independent registered public accounting firm, has issued an attestation report on the effectiveness of the Company’s internal control over financial reporting as of December 31, 2011, as stated in its report, which is included herein.
66
Table of Contents
REPORT OF INDEPENDENT REGISTERED PUBLIC ACCOUNTING FIRM
To the Board of Directors and Shareholders
of TICC Capital Corp.:
In our opinion, the accompanying consolidated statements of assets and liabilities including the consolidated schedules of investments, and the related consolidated statements of operations, changes in net assets and cash flows present fairly, in all material respects, the consolidated financial position of TICC Capital Corp. and its subsidiaries (“the Company”) at December 31, 2011 and December 31, 2010, and the results of their operations, the changes in net assets, and their cash flows for each of the three years in the period ended December 31, 2011 in conformity with accounting principles generally accepted in the United States of America. Also in our opinion, the Company maintained, in all material respects, effective internal control over financial reporting as of December 31, 2011, based on criteria established in Internal Control—Integrated Framework issued by the Committee of Sponsoring Organizations of the Treadway Commission (COSO). The Company’s management is responsible for these consolidated financial statements, for maintaining effective internal control over financial reporting and for its assessment of the effectiveness of internal control over financial reporting, included in Management’s Report on Internal Control over Financial Reporting appearing on page 66 of the 2011 Annual Report on Form 10-K. Our responsibility is to express opinions on these financial statements and on the Company’s internal control over financial reporting based on our integrated audits. We conducted our audits in accordance with the standards of the Public Company Accounting Oversight Board (United States). Those standards require that we plan and perform the audits to obtain reasonable assurance about whether the financial statements are free of material misstatement and whether effective internal control over financial reporting was maintained in all material respects. Our audits of the financial statements included examining, on a test basis, evidence supporting the amounts and disclosures in the financial statements, assessing the accounting principles used and significant estimates made by management, and evaluating the overall financial statement presentation. Our audit of internal control over financial reporting included obtaining an understanding of internal control over financial reporting, assessing the risk that a material weakness exists, and testing and evaluating the design and operating effectiveness of internal control based on the assessed risk. Our audits also included performing such other procedures as we considered necessary in the circumstances. Our procedures included confirmations of securities at December 31, 2011 by correspondence with the custodian, and where replies were not received, we performed other auditing procedures. We believe that our audits provide a reasonable basis for our opinions.
A company’s internal control over financial reporting is a process designed to provide reasonable assurance regarding the reliability of financial reporting and the preparation of financial statements for external purposes in accordance with generally accepted accounting principles. A company’s internal control over financial reporting includes those policies and procedures that (i) pertain to the maintenance of records that, in reasonable detail, accurately and fairly reflect the transactions and dispositions of the assets of the company; (ii) provide reasonable assurance that transactions are recorded as necessary to permit preparation of financial statements in accordance with generally accepted accounting principles, and that receipts and expenditures of the company are being made only in accordance with authorizations of management and directors of the company; and (iii) provide reasonable assurance regarding prevention or timely detection of unauthorized acquisition, use, or disposition of the company’s assets that could have a material effect on the financial statements.
Because of its inherent limitations, internal control over financial reporting may not prevent or detect misstatements. Also, projections of any evaluation of effectiveness to future periods are subject to the risk that controls may become inadequate because of changes in conditions, or that the degree of compliance with the policies or procedures may deteriorate.
/s/ PricewaterhouseCoopers LLP
New York, New York
March 15, 2012
67
Table of Contents
CONSOLIDATED STATEMENTS OF ASSETS AND LIABILITIES
| December 31, 2011 | December 31, 2010 | |||||||
| ASSETS |
||||||||
| Non-affiliated/non-control investments (cost: $372,091,255 @ 12/31/11; $207,854,154 @ 12/31/10) |
$ | 375,793,839 | $ | 229,385,715 | ||||
| Control investments (cost: $17,434,371 @ 12/31/11; $18,346,533 @ 12/31/10) |
15,675,000 | 18,150,000 | ||||||
|
|
|
|
|
|||||
| Total investments at fair value |
391,468,839 | 247,535,715 | ||||||
|
|
|
|
|
|||||
| Cash and cash equivalents |
4,494,793 | 68,780,866 | ||||||
| Restricted cash |
23,183,698 | — | ||||||
| Deferred debt issuance costs |
2,895,873 | — | ||||||
| Interest receivable |
1,837,882 | 1,488,984 | ||||||
| Other assets |
238,485 | 94,518 | ||||||
|
|
|
|
|
|||||
| Total assets |
$ | 424,119,570 | $ | 317,900,083 | ||||
|
|
|
|
|
|||||
| LIABILITIES |
||||||||
| Notes payable, net of discount |
$ | 99,710,826 | $ | — | ||||
| Accrued interest payable |
1,076,113 | — | ||||||
| Investment advisory fee payable to affiliate |
2,895,799 | 1,760,896 | ||||||
| Accrued capital gains incentive fee to affiliate |
1,108,749 | — | ||||||
| Securities purchased not settled |
13,352,500 | 1,837,500 | ||||||
| Accrued expenses |
873,592 | 184,146 | ||||||
|
|
|
|
|
|||||
| Total liabilities |
119,017,579 | 3,782,542 | ||||||
|
|
|
|
|
|||||
| NET ASSETS |
||||||||
| Common stock, $0.01 par value, 100,000,000 shares authorized, and 32,818,428 and 31,886,367 issued and outstanding, respectively |
328,184 | 318,864 | ||||||
| Capital in excess of par value |
376,991,540 | 369,163,104 | ||||||
| Net unrealized appreciation on investments |
1,943,213 | 21,335,028 | ||||||
| Accumulated net realized losses on investments |
(70,308,108 | ) | (74,545,034 | ) | ||||
| Distributions in excess of investment income |
(3,852,838 | ) | (2,154,421 | ) | ||||
|
|
|
|
|
|||||
| Total net assets |
305,101,991 | 314,117,541 | ||||||
|
|
|
|
|
|||||
| Total liabilities and net assets |
$ | 424,119,570 | $ | 317,900,083 | ||||
|
|
|
|
|
|||||
| Net asset value per common share |
$ | 9.30 | $ | 9.85 | ||||
See Accompanying Notes.
68
Table of Contents
TICC CAPITAL CORP.
CONSOLIDATED SCHEDULE OF INVESTMENTS
DECEMBER 31, 2011
|
COMPANY(1) |
INDUSTRY |
INVESTMENT |
PRINCIPAL AMOUNT |
COST | FAIR VALUE(2) | % of
Net Assets(8) | ||||||||||||
| Senior Secured Notes |
||||||||||||||||||
| Airvana Network Solutions, Inc. |
telecommunication services | senior secured notes (4)(5)(6)(10) (10.00%, due March 25, 2015) |
$ | 5,476,190 | $ | 5,386,864 | $ | 5,465,950 | ||||||||||
| AKQA, Inc. |
advertising | senior secured notes(4)(6)(10) (5.09%, due March 20, 2013) |
7,730,214 | 7,730,214 | 7,575,604 | |||||||||||||
| Algorithmic Implementations, Inc. (d/b/a “Ai Squared”) |
software | senior secured notes(4)(5)(6) (9.84%, due September 11, 2013) |
14,550,000 | 14,434,371 | 14,550,000 | |||||||||||||
| American Integration Technologies, LLC |
semiconductor capital equipment |
senior secured notes(4)(5) (11.75%, due December 31, 2013) |
23,401,906 | 21,116,076 | 22,582,839 | |||||||||||||
| Anchor Glass Container Corporation |
packaging and glass | senior secured notes(4)(10) (6.00%, due March 2, 2016) |
4,957,465 | 4,957,465 | 4,932,678 | |||||||||||||
| Attachmate Corporation |
enterprise software | senior secured notes(4)(5)(10) (6.50%, due April 27, 2017) |
4,937,500 | 4,793,262 | 4,816,531 | |||||||||||||
| Band Digital Inc. (F/K/A “WHITTMANHART, Inc.”) |
IT consulting | senior secured notes(4)(6) (15.58%, due December 31, 2012) |
1,900,000 | 1,900,000 | 1,900,000 | |||||||||||||
| BNY Convergex |
financial intermediaries | second lien senior secured notes(4)(10) (8.75%, due December 17, 2017) |
1,875,000 | 1,858,003 | 1,781,250 | |||||||||||||
| CHS/Community Health Systems, Inc. |
healthcare | senior secured notes(4)(5)(6)(10)(11) (3.96%, due July 25, 2014) |
3,979,849 | 3,714,932 | 3,838,087 | |||||||||||||
| Decision Resources, LLC |
healthcare | first lien senior secured notes(4)(5)(10) (7.00%, due December 28, 2016) |
4,950,000 | 4,890,742 | 4,702,500 | |||||||||||||
| second lien senior secured notes(4)(5) (9.50%, due May 13, 2018) |
5,333,333 | 5,283,543 | 5,226,667 | |||||||||||||||
| Diversified Machine, Inc. |
autoparts manufacturer | first lien senior secured notes(4)(5)(10) (9.25%, due December 1, 2016) |
5,000,000 | 4,926,898 | 4,987,500 | |||||||||||||
| Embanet-Compass Knowledge Group, Inc. |
education | senior secured notes(4)(5)(6)(10) (5.50%, due June 27, 2017) |
4,975,000 | 4,831,896 | 4,825,750 | |||||||||||||
| Emdeon, Inc. |
healthcare | senior secured notes(4)(5)(6)(10) (6.75%, due November 2, 2018) |
1,950,000 | 1,892,562 | 1,964,625 | |||||||||||||
| Endurance International Group, Inc. |
web hosting | first lien senior secured notes(4)(5)(10) (7.75%, due December 28, 2016) |
10,000,000 | 9,900,000 | 9,950,000 | |||||||||||||
| GenuTec Business Solutions, Inc. |
interactive voice messaging services | senior secured notes(4)(5)(7) (0.0%, due October 30, 2014) |
3,476,000 | 3,152,069 | 2,000,000 | |||||||||||||
| Getty Images, Inc. |
printing and publishing | senior secured notes(4)(5)(6)(10) (5.25%, due November 5, 2016) |
5,000,000 | 4,941,392 | 5,000,000 | |||||||||||||
| Global Tel Link Corp. |
telecommunication services | senior secured notes(4)(5)(6)(10) (7.00%, due December 14, 2017) |
5,818,182 | 5,717,186 | 5,727,302 | |||||||||||||
| Goodman Global, Inc. |
building and development | senior secured notes(4)(5)(6)(10) (5.75%, due October 28, 2016) |
4,860,748 | 4,778,271 | 4,847,916 | |||||||||||||
| GRD Holding III |
retail | senior secured notes(4)(5)(6)(10) (8.75%, due October 5, 2017) |
4,000,000 | 3,610,953 | 3,520,000 | |||||||||||||
| GXS Worldwide Inc. |
business services | senior secured notes(5)(10) (9.75%, due June 15, 2015) |
8,000,000 | 7,906,828 | 7,440,000 | |||||||||||||
| (Continued on next page) |
||||||||||||||||||
See Accompanying Notes.
69
Table of Contents
TICC CAPITAL CORP.
CONSOLIDATED SCHEDULE OF INVESTMENTS – (Continued)
DECEMBER 31, 2011
|
COMPANY(1) |
INDUSTRY |
INVESTMENT |
PRINCIPAL AMOUNT |
COST | FAIR VALUE(2) | % of
Net Assets(8) | ||||||||||||
| Senior Secured Notes—(continued) |
||||||||||||||||||
| HHI Holdings LLC |
auto parts manufacturer | senior secured notes(4)(5)(10) (7.00%, due March 21, 2017) |
$ | 4,466,250 | $ | 4,448,122 | $ | 4,393,673 | ||||||||||
| Hyland Software, Inc. |
enterprise software | senior secured notes(4)(5)(6)(10) (5.75%, due December 19, 2016) |
2,852,555 | 2,798,057 | 2,809,767 | |||||||||||||
| Immucor, Inc. |
healthcare | senior secured term B notes(4)(5)(10) (7.25%, due August 19, 2018) |
4,488,750 | 4,332,486 | 4,508,949 | |||||||||||||
| InfoNXX Inc. |
telecommunication services | second lien senior secured notes(4)(5)(10) (6.55%, due December 1, 2013) |
7,000,000 | 6,693,859 | 6,440,000 | |||||||||||||
| Mercury Payment Systems, LLC |
financial intermediaries | senior secured notes(4)(6)(10) (6.50%, due July 1, 2017) |
3,980,000 | 3,980,000 | 3,960,100 | |||||||||||||
| Merrill Communications, LLC |
printing and publishing | second lien senior secured notes(3)(4)(5)(10) (11.75% cash/2.62% PIK, due November 15, 2013) |
6,219,910 | 6,180,828 | 5,867,428 | |||||||||||||
| National Healing Corp. |
healthcare | senior secured notes(4)(5)(10) (8.25%, due November 30, 2017) |
6,000,000 | 5,702,372 | 5,760,000 | |||||||||||||
| Nextag, Inc. |
retail | senior secured notes(4)(5)(6)(10) (7.00%, due January 27, 2016) |
10,766,667 | 10,153,496 | 10,416,750 | |||||||||||||
| Pegasus Solutions, Inc. |
enterprise software | first lien senior secured notes(4)(5)(6)(10) (7.75%, due April 17, 2013) |
2,577,942 | 2,448,984 | 2,496,299 | |||||||||||||
| second lien senior secured notes(3)(5)(6) (0.00% Cash/13.00% PIK, due April 15, 2014) |
6,000,838 | 4,283,558 | 5,640,788 | |||||||||||||||
| Petco, Inc. |
retail | senior secured notes(4)(10) (4.50%, due November 24, 2017) |
5,000,000 | 4,768,740 | 4,865,000 | |||||||||||||
| Phillips Plastics Corporation |
healthcare | senior secured notes(4)(5)(6)(10) (6.50%, due February 12, 2017) |
2,992,500 | 2,967,686 | 2,955,094 | |||||||||||||
| Power Tools, Inc. |
software | senior secured notes(4)(5)(6) (12.00%, due May 16, 2014) |
8,000,000 | 7,947,337 | 7,200,000 | |||||||||||||
| Presidio IS Corp. |
business services | senior secured notes(4)(6)(10) (7.25%, due March 31, 2017) |
4,743,590 | 4,743,590 | 4,672,436 | |||||||||||||
| RBS Holding Company |
printing and publishing | term B senior secured notes(4)(5)(10) (6.50%, due March 23, 2017) |
4,962,500 | 4,917,481 | 3,870,750 | |||||||||||||
| RCN Telecom Services, LLC |
cable/satellite television | senior secured notes(4)(5)(10) (6.50%, due August 26, 2016) |
4,974,811 | 4,890,594 | 4,878,847 | |||||||||||||
| Renaissance Learning |
education | senior secured notes(4)(5)(10) (7.75%, due October 19, 2017) |
3,990,000 | 3,833,900 | 3,920,175 | |||||||||||||
| Securus Technologies |
telecommunication services | second lien senior secured notes(4)(5)(10) (10.00%, due May 18, 2018) |
5,400,000 | 5,298,371 | 5,319,000 | |||||||||||||
| Shield Finance Co. |
software | first lien term notes(4)(5)(10) (11)(12) (7.75%, due June 15, 2016) |
3,790,914 | 3,662,185 | 3,781,437 | |||||||||||||
| SkillSoft Corporation |
business services | senior secured notes(4)(5)(6)(10) (6.50%, due May 26, 2017) |
5,000,000 | 4,952,306 | 4,952,100 | |||||||||||||
| SonicWall, Inc. |
software | first lien senior secured notes(4)(5)(10) (8.27%, due January 23, 2016) |
1,071,774 | 1,043,499 | 1,071,774 | |||||||||||||
| second lien senior secured notes(4)(5)(10) (12.00%, due January 23, 2017) |
5,000,000 | 4,873,705 | 4,950,000 | |||||||||||||||
| (Continued on next page) |
||||||||||||||||||
See Accompanying Notes.
70
Table of Contents
TICC CAPITAL CORP.
CONSOLIDATED SCHEDULE OF INVESTMENTS – (Continued)
DECEMBER 31, 2011
|
COMPANY(1) |
INDUSTRY |
INVESTMENT |
PRINCIPAL AMOUNT |
COST | FAIR VALUE(2) | % of
Net Assets(8) |
||||||||||||||
| Senior Secured Notes—(continued) |
||||||||||||||||||||
| SourceHOV, LLC |
business services | second lien senior secured notes(4)(5) (10.50%, due May 19, 2018) |
$ | 8,000,000 | $ | 7,661,825 | $ | 6,560,000 | ||||||||||||
| Stratus Technologies, Inc. |
computer hardware | first lien high yield notes(5)(10) (12.00%, due March 29, 2015) |
9,753,000 | 9,098,094 | 9,753,000 | |||||||||||||||
| Sunquest Information Systems, Inc. |
healthcare | senior secured notes(4)(5)(6)(10) (6.25%, due December 16, 2016) |
4,975,000 | 4,868,469 | 4,912,813 | |||||||||||||||
| Syniverse Holdings, Inc. |
telecommunication services | senior secured notes(4)(5)(6)(10) (5.25%, due December 21, 2017) |
3,979,900 | 3,836,252 | 3,971,622 | |||||||||||||||
| Teleguam Holdings, LLC |
telecommunication services | second lien senior secured notes(4)(5)(10) (9.75%, due June 9, 2017) |
4,687,500 | 4,643,890 | 4,593,750 | |||||||||||||||
| Unitek Global Services, Inc. |
IT consulting | tranche B term loan(4)(5)(10) (9.00%, due April 15, 2018) |
7,940,000 | 7,713,041 | 7,701,800 | |||||||||||||||
| US FT HoldCo. Inc. (A/K/A US FT HoldCo. Inc.) |
financial intermediaries | senior secured notes(4)(5)(6)(10) (7.50%, due November 30, 2017) |
6,000,000 | 5,844,017 | 5,880,000 | |||||||||||||||
| Vision Solutions, Inc |
software | second lien senior secured notes(4)(5)(10) (9.50%, due July 23, 2017) |
10,000,000 | 9,908,753 | 9,600,000 | |||||||||||||||
| WEB.COM Group, Inc. |
web hosting | senior secured notes(4)(5)(10)(11) (7.00%, due October 27, 2017) |
5,000,000 | 4,428,688 | 4,575,000 | |||||||||||||||
|
|
|
|
|
|
|
|||||||||||||||
| Total Senior Secured Notes |
$ | 290,647,712 | $ | 289,913,551 | 95.0 | % | ||||||||||||||
|
|
|
|
|
|
|
|||||||||||||||
| Subordinated Notes |
||||||||||||||||||||
| Fusionstorm, Inc. |
IT value-added reseller | subordinated notes(4)(5)(6) (11.74%, due February 28, 2013) |
$ | 1,022,500 | $ | 1,022,351 | $ | 962,939 | ||||||||||||
| Shearer’s Food Inc. |
food products manufacturer | subordinated notes(3)(4)(5)(10) (12.00% Cash/3.75% PIK, due March 31, 2016) | 4,221,193 | 4,141,875 | 3,967,921 | |||||||||||||||
|
|
|
|
|
|
|
|||||||||||||||
| Total Subordinated Notes |
$ | 5,164,226 | $ | 4,930,860 | 1.6 | % | ||||||||||||||
|
|
|
|
|
|
|
|||||||||||||||
| Collateralized Loan Obligation—Debt Investments |
||||||||||||||||||||
| Avenue CLO V LTD 2007-5A D1 |
structured finance | CLO secured notes(4)(5)(11)(12) (3.87%, due April 25, 2019) |
$ | 4,574,756 | $ | 2,327,337 | $ | 2,511,999 | ||||||||||||
| Canaras CLO—2007-1A E |
structured finance | CLO secured notes(4)(5)(11)(12) (4.91%, due June 19, 2021) |
3,500,000 | 1,884,762 | 2,152,500 | |||||||||||||||
| CIFC CLO—2006-1A B2L |
structured finance | CLO secured notes(4)(5)(11)(12) (4.41%, due October 20, 2020) |
3,247,284 | 1,679,332 | 2,061,863 | |||||||||||||||
| Emporia CLO 2007 3A E |
structured finance | CLO secured notes(4)(5)(11)(12) (4.12%, due April 23, 2021) |
5,391,000 | 4,140,712 | 3,180,690 | |||||||||||||||
| Flagship 2005-4A D |
structured finance | CLO secured notes(4)(5)(11)(12) (5.28%, due June 1, 2017) |
2,612,988 | 1,644,453 | 1,835,624 | |||||||||||||||
| Harch 2005-2A BB CLO |
structured finance | CLO secured notes(4)(5)(11)(12) (5.42%, due October 22, 2017) |
4,819,262 | 2,580,789 | 3,108,424 | |||||||||||||||
| Hewetts Island CDO 2007—1RA E |
structured finance | CDO secured notes(4)(5)(6)(11)(12) (7.20%, due November 12, 2019) |
3,132,057 | 1,890,861 | 2,380,363 | |||||||||||||||
| Hewetts Island CDO III 2005-1A D |
structured finance | CDO secured notes(4)(5)(11)(12) (6.19%, due August 9, 2017) |
6,456,937 | 3,587,739 | 5,072,944 | |||||||||||||||
| Hewetts Island CDO IV 2006-4 E |
structured finance | CDO secured notes(4)(5)(11)(12) (4.99%, due May 9, 2018) |
7,897,268 | 5,575,257 | 5,176,396 | |||||||||||||||
| Landmark V CDO LTD |
structured finance | CDO senior secured notes(4)(5)(6)(11)(12) (5.78%, due June 1, 2017) |
3,646,669 | 2,243,178 | 2,511,825 | |||||||||||||||
| Latitude II CLO 2006 2A D |
structured finance | CLO senior secured notes(4)(5)(6)(11)(12) (4.30%, due December 15, 2018) |
2,828,018 | 1,575,173 | 1,753,371 | |||||||||||||||
| (Continued on next page) |
||||||||||||||||||||
See Accompanying Notes.
71
Table of Contents
TICC CAPITAL CORP.
CONSOLIDATED SCHEDULE OF INVESTMENTS – (Continued)
DECEMBER 31, 2011
|
COMPANY(1) |
INDUSTRY | INVESTMENT | PRINCIPAL AMOUNT |
COST | FAIR VALUE(2) | % of
Net Assets(8) |
||||||||||||||
|
Collateralized Loan Obligation - Debt Investments — (continued) |
||||||||||||||||||||
| Latitude III CLO 2007-3A |
structured finance | CLO secured notes(4)(5)(11)(12) (4.14%, due April 11, 2021) |
$ | 4,000,000 | $ | 1,935,665 | $ | 2,360,000 | ||||||||||||
| Liberty CDO LTD 2005-1A C |
structured finance | CDO secured notes(4)(5)(6)(11)(12) (2.33%, due November 1, 2017) |
1,986,259 | 1,155,372 | 1,311,924 | |||||||||||||||
| Lightpoint CLO 2007-8A |
structured finance | CLO secured notes(4)(5)(11)(12) (6.90%, due July 25, 2018) |
5,000,000 | 2,896,267 | 3,700,000 | |||||||||||||||
| Loomis Sayles CLO 2006-1AE |
structured finance | CLO secured notes(4)(5)(11)(12) (4.27%, due October 26, 2020) |
3,322,992 | 1,903,601 | 1,993,795 | |||||||||||||||
| Ocean Trails CLO II 2007-2a-d |
structured finance | CLO subordinated secured notes(4)(5)(11)(12) (4.90%, due June 27, 2022) |
3,649,700 | 2,079,669 | 2,189,820 | |||||||||||||||
| Primus 2007 2X Class E CLO |
structured finance | CLO notes (4)(5)(11)(12) (5.15%, due July 15, 2021) |
2,834,633 | 2,168,472 | 1,686,607 | |||||||||||||||
| Prospero CLO II BV |
structured finance | CLO senior secured notes(4)(5)(11)(12) (4.20%, due October 20, 2022) |
9,900,000 | 4,389,696 | 5,940,000 | |||||||||||||||
|
|
|
|
|
|
|
|||||||||||||||
| Total Collateralized Loan Obligation—Debt Investments |
$ | 45,658,335 | $ | 50,928,145 | 16.7 | % | ||||||||||||||
|
|
|
|
|
|
|
|||||||||||||||
| Collateralized Loan Obligation—Equity Investments |
||||||||||||||||||||
| ACA CLO 2006-2, Limited |
structured finance | CLO preferred equity(11)(12) | $ | — | $ | 2,200,000 | $ | 3,750,000 | ||||||||||||
| Canaras CLO Equity - 2007-1A, 1X |
structured finance | CLO income notes(11)(12) | — | 4,355,000 | 3,825,000 | |||||||||||||||
| GALE 2007-4A CLO |
structured finance | CLO income notes(11)(12) | — | 1,965,000 | 1,950,000 | |||||||||||||||
| GSC Partners 2007-8X Sub CDO |
structured finance | CLO income notes(11)(12) | — | 4,110,000 | 4,560,000 | |||||||||||||||
| Harbourview - 2006A CLO Equity |
structured finance | CDO subordinates notes(11)(12) | — | 3,639,870 | 2,729,350 | |||||||||||||||
| Jersey Street 2006-1A CLO LTD |
structured finance | CLO income notes(11)(12) | — | 4,924,237 | 4,229,225 | |||||||||||||||
| Kingsland LTD 2007-4X Sub |
structured finance | CLO income notes(11)(12) | — | 402,500 | 376,250 | |||||||||||||||
| Lightpoint CLO 2005-3X |
structured finance | CLO income notes(11)(12) | — | 3,330,000 | 3,116,250 | |||||||||||||||
| Lightpoint CLO VII LTD 2007-7 |
structured finance | CLO subordinated notes(11)(12) | — | 1,562,500 | 1,360,000 | |||||||||||||||
| Marlborough Street 2007-1A |
structured finance | CLO income notes(11)(12) | — | 1,739,000 | 1,504,000 | |||||||||||||||
| OCT11 2007-1A CLO |
structured finance | CLO income notes(11)(12) | — | 2,434,162 | 2,351,250 | |||||||||||||||
| Rampart 2007-1A CLO Equity |
structured finance | CLO subordinated notes(11)(12) | — | 3,412,500 | 2,870,000 | |||||||||||||||
| Sargas CLO 2006 -1A |
structured finance | CLO subordinated notes(11)(12) | — | 4,945,500 | 6,666,000 | |||||||||||||||
|
|
|
|
|
|
|
|||||||||||||||
| Total Collateralized Loan Obligation—Equity Investments |
$ | 39,020,269 | $ | 39,287,325 | 12.9 | % | ||||||||||||||
|
|
|
|
|
|
|
|||||||||||||||
| Common Stock |
||||||||||||||||||||
| Algorithmic Implementations, Inc. |
software | common stock | $ | — | $ | 3,000,000 | $ | 1,125,000 | ||||||||||||
| (d/b/a “Ai Squared”) |
||||||||||||||||||||
| Integra Telecomm, Inc. |
telecommunication services | common stock(7) | — | 1,712,397 | 1,051,271 | |||||||||||||||
| Pegasus Solutions, Inc. |
enterprise software | common equity(7) | — | 62,595 | 959,999 | |||||||||||||||
| Stratus Technologies, Inc. |
computer hardware | common equity(7) | — | 377,928 | — | |||||||||||||||
|
|
|
|
|
|
|
|||||||||||||||
| Total Common Stock Investments |
$ | 5,152,920 | $ | 3,136,270 | 1.0 | % | ||||||||||||||
|
|
|
|
|
|
|
|||||||||||||||
| (Continued on next page) |
||||||||||||||||||||
See Accompanying Notes.
72
Table of Contents
TICC CAPITAL CORP.
CONSOLIDATED SCHEDULE OF INVESTMENTS—(Continued)
DECEMBER 31, 2011
|
COMPANY(1) |
INDUSTRY |
INVESTMENT |
PRINCIPAL AMOUNT |
COST | FAIR VALUE(2) | % of
Net Assets(8) |
||||||||||||||
| Preferred Equity |
||||||||||||||||||||
| GenuTec Business Solutions, Inc. |
interactive voice messaging services | convertible preferred stock(7) | $ | — | $ | 1,500,000 | $ | — | ||||||||||||
| Pegasus Solutions, Inc. |
enterprise software |
preferred equity(3) (14.00% PIK dividend) |
— | 1,120,542 | 2,176,237 | |||||||||||||||
| Stratus Technologies, Inc. |
computer hardware | preferred equity(7) | — | 186,622 | 318,451 | |||||||||||||||
|
|
|
|
|
|
|
|||||||||||||||
| Total Preferred Equity Investments |
$ | 2,807,164 | $ | 2,494,688 | 0.8 | % | ||||||||||||||
|
|
|
|
|
|
|
|||||||||||||||
| Warrants |
||||||||||||||||||||
| Band Digital Inc. (F/K/A “WHITTMANHART, Inc.”) |
IT consulting | warrants to purchase common stock (7) | $ | — | $ | — | $ | — | ||||||||||||
| Fusionstorm, Inc. |
IT value-added reseller | warrants to purchase common stock (7) | — | 725,000 | 578,000 | |||||||||||||||
| Power Tools, Inc. |
software | warrants to purchase common stock(7) | — | 350,000 | 200,000 | |||||||||||||||
|
|
|
|
|
|
|
|||||||||||||||
| Total Warrants |
$ | 1,075,000 | $ | 778,000 | 0.3 | % | ||||||||||||||
|
|
|
|
|
|
|
|||||||||||||||
| Total Investments |
$ | 389,525,626 | $ | 391,468,839 | 128.3 | % | ||||||||||||||
|
|
|
|
|
|
|
|||||||||||||||
| (1) | Other than Algorithmic Implementation, Inc. (d/b/a Ai Squared), which we may be deemed to control, we do not “control” and are not an “affiliate” of any of our portfolio companies, each as defined in the Investment Company Act of 1940 (the “1940 Act”). In general, under the 1940 Act, we would be presumed to “control” a portfolio company if we owned 25% or more of its voting securities and would be an “affiliate” of a portfolio company if we owned 5% or more of its voting securities. |
| (2) | Fair value is determined in good faith by the Board of Directors of the Company. |
| (3) | Portfolio includes $16,441,941 of principal amount of debt investments which contain a PIK provision. Portfolio also includes one preferred equity position which contains a PIK dividend provision. For the year ending December 31, 2011, total PIK income is $1,474,475, which is derived from the following investments with a PIK provision: Merrill Communications, LLC ($150,893), Pegasus Solutions, Inc. ($710,143), Pegasus Solutions, Inc. Preferred Equity ($463,295) and Shearer’s Food Inc. ($150,144). See also Note 2 to the Consolidated Financial Statements. |
| (4) | Notes bear interest at variable rates. |
| (5) | Cost value reflects accretion of original issue discount or market discount. |
| (6) | Cost value reflects repayment of principal. |
| (7) | Non-income producing at the relevant period end. |
| (8) | As a percentage of net assets at December 31, 2011, investments at fair value are categorized as follows: senior secured notes (95.0%),subordinated notes (1.6%), CLO debt (16.7%), CLO equity (12.9%), common stock (1.0%), preferred shares (0.8%) and warrants to purchase equity securities (0.3%). |
| (9) | Aggregate gross unrealized appreciation for federal income tax purposes is $18,879,992; aggregate gross unrealized depreciation for federal income tax purposes is $35,465,298. Net unrealized depreciation is $16,585,306 based upon a tax cost basis of $408,054,145. |
| (10) | All or a portion of this investment represents TICC CLO LLC collateral. |
| (11) | Non-qualifying asset. |
| (12) | Investment not domiciled in the United States. |
See Accompanying Notes.
73
Table of Contents
TICC CAPITAL CORP.
CONSOLIDATED SCHEDULE OF INVESTMENTS
DECEMBER 31, 2010
| COMPANY(1) |
INDUSTRY |
INVESTMENT |
PRINCIPAL AMOUNT |
COST | FAIR VALUE(2) |
% of Net Assets (8) | ||||||||||||
| Senior Secured Notes |
||||||||||||||||||
| Airvana Network Solutions, Inc. |
software | senior secured notes (4)(5)(6) (11.00%, due August 27, 2014) |
$ | 8,847,171 | $ | 8,700,153 | $ | 8,858,230 | ||||||||||
| AKQA, Inc. |
advertising | senior secured notes(4)(6) (4.96%, due March 20, 2013) |
7,865,342 | 7,865,342 | 7,857,477 | |||||||||||||
| Algorithmic Implementations, Inc. (d/b/a “Ai Squared”) |
software | senior secured notes(4)(5)(6) (9.84%, due September 11, 2013) |
15,550,000 | 15,346,533 | 15,550,000 | |||||||||||||
| American Integration Technologies, LLC |
semiconductor capital | senior secured notes(4)(5) (11.75%, due December 31, 2013) |
23,401,906 | 20,059,705 | 21,763,773 | |||||||||||||
| Band Digital Inc. (F/K/A “WHITTMANHART, Inc.”) |
IT consulting | senior secured notes(4)(6) (15.58%, due December 31, 2011) |
2,425,000 | 2,425,000 | 2,425,000 | |||||||||||||
| Birch Communications, Inc. |
telecommunication services | senior secured notes(4) (15.00%, due June 21, 2015) |
5,000,000 | 5,000,000 | 5,000,000 | |||||||||||||
| BNY Convergex |
financial intermediaries | second lien senior secured notes(4) (8.75%, due December 17, 2017) |
1,875,000 | 1,837,500 | 1,837,500 | |||||||||||||
| Decision Resources, LLC |
healthcare | first lien senior secured notes(4)(5) (7.75%, due December 28, 2016) |
4,500,000 | 4,432,525 | 4,432,500 | |||||||||||||
| Del Mar CLO I Ltd. 2006-1 |
structured finance | CLO secured notes(4)(5)(6) (4.29%, due July 25, 2018) |
1,831,690 | 934,388 | 1,373,768 | |||||||||||||
| Diversified Machine, Inc. |
autoparts manufacturer | first lien senior secured notes(4)(5) (10.50%, due October 28, 2015) |
5,500,000 | 5,339,007 | 5,335,000 | |||||||||||||
| Drew Marine Partners, L.P. |
shipping & transportation | first lien senior secured notes(4)(5)(6) (9.50%, due August 31, 2014) |
4,468,750 | 4,371,448 | 4,424,063 | |||||||||||||
| Fairway Group Acquisition Company |
grocery | first lien senior secured notes(4)(5) (12.00%, due October 1, 2014) |
4,950,008 | 4,832,815 | 4,956,196 | |||||||||||||
| GenuTec Business Solutions, Inc. |
interactive voice messaging | senior secured notes(4)(5)(7) (0.0%, due October 30, 2014) |
3,476,000 | 3,079,396 | 2,000,000 | |||||||||||||
| GXS Worldwide Inc. |
software | senior secured notes(5) (9.75%, due June 15, 2015) |
8,000,000 | 7,885,499 | 7,900,000 | |||||||||||||
| HHI Holdings LLC |
auto parts manufacturer | senior secured notes(4)(5) (10.50%, due March 30, 2015) |
3,381,236 | 3,292,190 | 3,415,049 | |||||||||||||
| Hyland Software, Inc. |
enterprise software | first lien senior secured notes(4)(5) (6.75%, due December 19, 2016) |
3,818,182 | 3,780,029 | 3,822,955 | |||||||||||||
| Krispy Kreme Doughnut Corporation |
retail food products | first lien senior secured notes(4)(5)(6) (10.75% , due February 16, 2014) |
3,899,005 | 3,683,115 | 3,899,005 | |||||||||||||
| MLM Holdings, Inc. |
software | senior secured notes(4)(5) (7.00%, due December 1, 2016) |
4,987,500 | 4,913,231 | 4,912,688 | |||||||||||||
| Pegasus Solutions, Inc. |
enterprise software | first lien senior secured notes(4)(5)(6) (7.75%, due April 17, 2013) |
2,950,461 | 2,722,247 | 2,768,506 | |||||||||||||
| second lien senior secured notes(3)(5)(6) (0.00% Cash/13.00% PIK, due April 15, 2014) |
5,290,695 | 3,153,479 | 4,936,219 | |||||||||||||||
| Power Tools, Inc. |
software | senior secured notes(4)(5)(6) (12.00%, due May 16, 2014) |
9,000,000 | 8,912,088 | 8,235,000 | |||||||||||||
| Presidio Inc. |
business services | first lien senior secured notes(4)(5) (7.50%, due December 16, 2015) |
9,375,000 | 9,141,699 | 9,140,625 | |||||||||||||
| Prodigy Health Group |
healthcare | second lien senior secured notes(4)(5) (8.27%, due November 29, 2013) |
3,013,333 | 2,153,283 | 2,968,133 | |||||||||||||
| QA Direct Holdings, LLC |
printing and publishing | first lien senior secured notes(4)(5)(6) (8.25%, due August 10, 2014) |
5,488,999 | 5,150,835 | 5,205,381 | |||||||||||||
| Shield Finance Co. |
software | first lien term notes(4)(5)(6)(10)(11) (7.75%, due June 15, 2016) |
5,910,000 | 5,681,659 | 5,880,450 | |||||||||||||
| SonicWall, Inc. |
software | first lien senior secured notes(4)(5) (8.25%, due January 23, 2016) |
1,794,355 | 1,743,235 | 1,803,327 | |||||||||||||
| SonicWall, Inc. 2 |
second lien senior secured notes(4)(5) (12.00%, due January 23, 2017) |
5,000,000 | 4,856,725 | 5,000,000 | ||||||||||||||
| (Continued on next page) |
||||||||||||||||||
See Accompanying Notes.
74
Table of Contents
TICC CAPITAL CORP.
CONSOLIDATED SCHEDULE OF INVESTMENTS—(Continued)
DECEMBER 31, 2010
|
COMPANY(1) |
INDUSTRY |
INVESTMENT |
PRINCIPAL AMOUNT |
COST | FAIR VALUE(2) |
% of Net Assets (8) |
||||||||||||||
| Senior Secured Notes—(continued) |
||||||||||||||||||||
| Stratus Technologies, Inc. |
computer hardware | first lien high yield notes(5) (12.00%, due March 29, 2015) |
$ | 10,000,000 | $ | 9,175,912 | $ | 9,885,000 | ||||||||||||
| U.S. Telepacific Corp. |
telecommunication services | senior secured notes(4)(5) (9.25%, due August 4, 2011) |
3,970,000 | 3,946,073 | 4,000,410 | |||||||||||||||
| Vision Solutions, Inc |
software | senior secured notes(4)(5) (7.75%, due July 23, 2016) |
5,775,000 | 5,554,250 | 5,717,250 | |||||||||||||||
|
|
|
|
|
|
|
|||||||||||||||
| Total Senior Secured Note Investments |
$ | 169,969,361 | $ | 175,303,505 | 55.4 | % | ||||||||||||||
|
|
|
|
|
|
|
|||||||||||||||
| Subordinated Notes |
||||||||||||||||||||
| Fusionstorm, Inc. |
IT value-added reseller | subordinated notes(4)(5)(6) (11.74%, due February 28, 2013) |
$ | 1,922,500 | $ | 1,903,984 | $ | 1,840,794 | ||||||||||||
| Shearer’s Food Inc. |
food products manufacturer | subordinated notes(3)(4)(5) (12.00% Cash/3.50% PIK, due March 31, 2016) |
4,071,049 | 3,979,305 | 4,111,759 | |||||||||||||||
|
|
|
|
|
|
|
|||||||||||||||
| Total Subordinated Notes |
$ | 5,883,289 | $ | 5,952,553 | 1.9 | % | ||||||||||||||
|
|
|
|
|
|
|
|||||||||||||||
| Collateralized Loan Obligation—Debt Investments |
||||||||||||||||||||
| Avenue CLO V LTD 2007-5A D1 |
structured finance | CLO secured notes(4)(5)(10)(11) (3.73%, due April 25, 2019) |
$ | 3,659,805 | $ | 1,702,855 | $ | 2,049,491 | ||||||||||||
| Canaras CLO—2007-1A E |
structured finance | CLO secured notes(4)(5)(10)(11) (4.65%, due June 19, 2021) |
3,500,000 | 1,804,206 | 2,660,000 | |||||||||||||||
| CIFC CLO—2006-1A B2L |
structured finance | CLO secured notes(4)(5)(10)(11) (4.29%, due October 20, 2020) |
3,247,284 | 1,593,673 | 2,273,099 | |||||||||||||||
| Flagship 2005-4A D |
structured finance | CLO secured notes(4)(5)(10)(11) (5.05%, due June 1, 2017) |
2,612,988 | 1,538,260 | 1,959,741 | |||||||||||||||
| Harch CLO II LTD 2005-2a e |
structured finance | CDO secured notes(4)(5)(10)(11) (5.29%, due October 22, 2017) |
4,819,262 | 2,382,248 | 3,325,290 | |||||||||||||||
| Hewetts Island CDO 2007—1RA E |
structured finance | CDO secured notes(4)(5)(6)(10)(11) (7.04%, due November 12, 2019) |
3,193,918 | 1,859,658 | 2,746,769 | |||||||||||||||
| Hewetts Island CDO III 2005-1A D |
structured finance | CDO secured notes(4)(5)(10)(11) (6.04%, due August 9, 2017) |
6,640,478 | 3,503,885 | 5,578,002 | |||||||||||||||
| Hewetts Island CDO IV 2006-4X E BB |
structured finance | CDO secured notes(4)(5)(10)(11) (4.84%, due May 9, 2018) |
3,251,816 | 1,491,511 | 2,438,862 | |||||||||||||||
| Hudson Straits CLO 2004-1A E |
structured finance | CLO secured notes(4)(5)(10)(11) (7.04%, due October 15, 2016) |
2,244,290 | 1,283,620 | 1,907,647 | |||||||||||||||
| Landmark V CDO LTD |
structured finance | CDO senior secured notes(4)(5)(6)(10)(11) (5.55%, due June 1, 2017) |
3,722,086 | 2,153,441 | 2,887,222 | |||||||||||||||
| Latitude II CLO 2006 2A D |
structured finance | CLO senior secured notes(4)(5)(6)(10)(11) (4.05%, due December 15, 2018) |
2,828,018 | 1,475,855 | 1,630,635 | |||||||||||||||
| Latitude III CLO 2007-3A |
structured finance | CLO secured notes(4)(5)(10)(11) (4.04%, due April 11, 2021) |
4,000,000 | 1,834,131 | 2,200,000 | |||||||||||||||
| Liberty CDO LTD 2005-1A C |
structured finance | CLO secured notes(4)(5)(6)(10)(11) (2.19%, due November 1, 2017) |
2,371,953 | 1,283,845 | 1,470,611 | |||||||||||||||
| Lightpoint CLO 2007-8A |
structured finance | CLO secured notes(4)(5)(10)(11) (6.79%, due July 25, 2018) |
5,000,000 | 2,738,631 | 4,500,000 | |||||||||||||||
| Loomis Sayles CLO 2006-1AE |
structured finance | CLO secured notes(4)(5)(10)(11) (4.14%, due October 26, 2020) |
3,322,992 | 1,818,151 | 2,359,324 | |||||||||||||||
| Ocean Trails CLO II 2007-2a-d |
structured finance | CLO subordinated secured notes (4)(5)(10)(11) (4.79%, due June 27, 2022) |
3,649,700 | 1,974,935 | 2,737,275 | |||||||||||||||
| Prospero CLO II BV |
structured finance | CLO senior secured notes (4)(5)(10)(11) |
9,900,000 | 4,191,843 | 6,336,000 | |||||||||||||||
|
|
|
|
|
|
|
|||||||||||||||
| Total Collateralized Loan Obligation—Debt Investments |
$ | 34,630,748 | $ | 49,059,968 | 16.1 | % | ||||||||||||||
|
|
|
|
|
|
|
|||||||||||||||
See Accompanying Notes.
75
Table of Contents
TICC CAPITAL CORP.
CONSOLIDATED SCHEDULE OF INVESTMENTS—(Continued)
DECEMBER 31, 2010
| COMPANY(1) |
INDUSTRY |
INVESTMENT |
PRINCIPAL AMOUNT |
COST | FAIR VALUE(2) |
% of Net Assets (8) |
||||||||||||||
| Collateralized Loan Obligation - Equity Investments |
||||||||||||||||||||
| ACA CLO 2006-2, Limited |
structured finance | CLO preferred equity(10)(11) | $ | — | $ | 2,200,000 | $ | 2,850,000 | ||||||||||||
| Sargas CLO 2006 -1A |
structured finance | CLO subordinated notes(10)(11) | — | 4,945,500 | 6,060,000 | |||||||||||||||
|
|
|
|
|
|
|
|||||||||||||||
| Total Collateralized Loan Obligation—Equity Investments |
$ | 7,145,500 | $ | 8,910,000 | 2.8 | % | ||||||||||||||
|
|
|
|
|
|
|
|||||||||||||||
| Common Stock |
||||||||||||||||||||
| Algorithmic Implementations, Inc. (d/b/a “Ai Squared”) |
software | common stock | $ | — | $ | 3,000,000 | $ | 2,600,000 | ||||||||||||
| Integra Telecomm, Inc. |
telecommunication services | common stock(7) | — | 1,712,397 | 3,115,022 | |||||||||||||||
| Pegasus Solutions, Inc. |
enterprise software | common equity(7) | — | 62,595 | 112,238 | |||||||||||||||
| Stratus Technologies, Inc. |
computer hardware | common equity(7) | — | 377,928 | — | |||||||||||||||
|
|
|
|
|
|
|
|||||||||||||||
| Total Common Stock Investments |
$ | 5,152,920 | $ | 5,827,260 | 1.9 | % | ||||||||||||||
|
|
|
|
|
|
|
|||||||||||||||
| Preferred Equity |
||||||||||||||||||||
| GenuTec Business Solutions, Inc. |
interactive voice messaging services | |||||||||||||||||||
| convertible preferred stock(7) | $ | — | $ | 1,500,000 | $ | — | ||||||||||||||
| Pegasus Solutions, Inc. |
enterprise software | preferred equity(3) | — | 657,247 | 1,530,949 | |||||||||||||||
| (14.00% PIK dividend) | ||||||||||||||||||||
| Stratus Technologies, Inc. |
computer hardware | preferred equity(7) | — | 186,622 | 431,480 | |||||||||||||||
|
|
|
|
|
|
|
|||||||||||||||
| Total Preferred Equity Investments |
$ | 2,343,869 | $ | 1,962,429 | 0.6 | % | ||||||||||||||
|
|
|
|
|
|
|
|||||||||||||||
| Warrants |
||||||||||||||||||||
| Band Digital Inc. (F/K/A “WHITTMANHART, Inc.”) |
IT consulting | warrants to purchase common stock(7) | $ | — | $ | — | $ | — | ||||||||||||
| Fusionstorm, Inc. |
IT value-added reseller | warrants to purchase common stock(7) | — | 725,000 | 150,000 | |||||||||||||||
| Power Tools, Inc. |
software | warrants to purchase common stock(7) | — | 350,000 | 370,000 | |||||||||||||||
|
|
|
|
|
|
|
|||||||||||||||
| Total Warrants |
$ | 1,075,000 | $ | 520,000 | 0.2 | % | ||||||||||||||
|
|
|
|
|
|
|
|||||||||||||||
| Total Investments |
$ | 226,200,687 | $ | 247,535,715 | 78.9 | % | ||||||||||||||
|
|
|
|
|
|
|
|||||||||||||||
| (1) | Other than Algorithmic Implementation, Inc. (d/b/a Ai Squared), which we may be deemed to control, we do not “control” and are not an “affiliate” of any of our portfolio companies, each as defined in the Investment Company Act of 1940 (the “1940 Act”). In general, under the 1940 Act, we would be presumed to “control” a portfolio company if we owned 25% or more of its voting securities and would be an “affiliate” of a portfolio company if we owned 5% or more of its voting securities. |
| (2) | Fair value is determined in good faith by the Board of Directors of the Company. |
| (3) | For the year ending December 31, 2010, total PIK income is $710,108, which is derived from the following investments with a PIK provision: Allen Systems Group, Inc. ($52,828), Cavtel Holdings, LLC ($77,459), Pegasus Solutions, Inc. ($322,906), Pegasus Solutions, Inc. Preferred Equity ($137,789), Shearer’s Food Inc. ($71,050) and Workflow Management, Inc. ($48,076). As of December 31, 2010, the Company no longer had investments in Allen Systems Group, Inc., Cavtel Holdings, LLC and Workflow Management, Inc. See also Note 2 to the Consolidated Financial Statements. |
| (4) | Notes bear interest at variable rates. |
| (5) | Cost value reflects accretion of original issue discount or market discount. |
| (6) | Cost value reflects repayment of principal. |
| (7) | Non-income producing at the relevant period end. |
| (8) | As a percentage of net assets at December 31, 2010, investments at fair value are categorized as follows: senior secured notes (55.4%), subordinated notes (1.9%), CLO debt (16.1%), CLO equity (2.8%), common stock (1.9%), preferred shares (0.6%) and warrants to purchase equity securities (0.2%). |
| (9) | Aggregate gross unrealized appreciation for federal income tax purposes is $26,128,474; aggregate gross unrealized depreciation for federal income tax purposes is $19,686,116. Net unrealized appreciation is $6,442,358 based upon a tax cost basis of $241,093,357. |
| (10) | Non-qualifying asset. |
| (11) | Investment not domiciled in the United States. |
See Accompanying Notes.
76
Table of Contents
TICC CAPITAL CORP.
CONSOLIDATED STATEMENTS OF OPERATIONS
| Year Ended December 31, 2011 |
Year Ended December 31, 2010 |
Year Ended December 31, 2009 |
||||||||||
| INVESTMENT INCOME |
||||||||||||
| From non-affiliated/non-control investments: |
||||||||||||
| Interest income—debt investments |
$ | 29,604,441 | $ | 26,959,707 | $ | 17,907,924 | ||||||
| Distributions from securitization vehicles and equity investments |
13,079,923 | 3,728,638 | — | |||||||||
| Commitment, amendment fee income and other income |
920,945 | 968,317 | 129,265 | |||||||||
|
|
|
|
|
|
|
|||||||
| Total investment income from non-affiliated/non-control investments |
43,605,309 | 31,656,662 | 18,037,189 | |||||||||
|
|
|
|
|
|
|
|||||||
| From control investments: |
||||||||||||
| Interest income—debt investments |
1,582,881 | 1,849,929 | 2,470,603 | |||||||||
|
|
|
|
|
|
|
|||||||
| Total investment income |
45,188,190 | 33,506,591 | 20,507,792 | |||||||||
|
|
|
|
|
|
|
|||||||
| EXPENSES |
||||||||||||
| Compensation expense |
1,090,626 | 1,020,950 | 971,356 | |||||||||
| Investment advisory fees |
7,317,273 | 5,043,973 | 4,070,205 | |||||||||
| Professional fees |
1,190,999 | 1,033,650 | 1,305,894 | |||||||||
| Interest expense |
1,243,584 | — | — | |||||||||
| Insurance |
68,450 | 75,419 | 75,974 | |||||||||
| Directors’ fees |
222,749 | 178,750 | 193,000 | |||||||||
| Transfer agent and custodian fees |
116,592 | 105,389 | 98,012 | |||||||||
| General and administrative |
587,314 | 401,366 | 249,567 | |||||||||
|
|
|
|
|
|
|
|||||||
| Total expenses before incentive fees |
11,837,587 | 7,859,497 | 6,964,008 | |||||||||
|
|
|
|
|
|
|
|||||||
| Net investment income incentive fees |
2,241,713 | 1,403,597 | 51,800 | |||||||||
| Capital gains incentive fees |
1,108,749 | — | — | |||||||||
|
|
|
|
|
|
|
|||||||
| Total incentive fees |
3,350,462 | 1,403,597 | 51,800 | |||||||||
|
|
|
|
|
|
|
|||||||
| Total expenses |
15,188,049 | 9,263,094 | 7,015,808 | |||||||||
|
|
|
|
|
|
|
|||||||
| Net investment income |
30,000,141 | 24,243,497 | 13,491,984 | |||||||||
|
|
|
|
|
|
|
|||||||
| Net change in unrealized (depreciation) appreciation on investments |
(19,391,815 | ) | 81,836,604 | 32,203,525 | ||||||||
|
|
|
|
|
|
|
|||||||
| Net realized gains (losses) on investments |
3,600,539 | (42,132,660 | ) | (10,513,051 | ) | |||||||
|
|
|
|
|
|
|
|||||||
| Net increase in net assets resulting from operations |
$ | 14,208,865 | $ | 63,947,441 | $ | 35,182,458 | ||||||
|
|
|
|
|
|
|
|||||||
| Net increase in net assets resulting from net investment income per common share: |
||||||||||||
| Basic and diluted |
$ | 0.92 | $ | 0.89 | $ | 0.51 | ||||||
| Net increase in net assets resulting from operations per common share: |
||||||||||||
| Basic and diluted |
$ | 0.44 | $ | 2.35 | $ | 1.32 | ||||||
| Weighted average shares of common stock outstanding: |
||||||||||||
| Basic and diluted |
32,433,101 | 27,253,552 | 26,624,217 | |||||||||
See Accompanying Notes.
77
Table of Contents
TICC CAPITAL CORP.
CONSOLIDATED STATEMENTS OF CHANGES IN NET ASSETS
| Year
Ended December 31, 2011 |
Year
Ended December 31, 2010 |
Year
Ended December 31, 2009 |
||||||||||
| Increase in net assets from operations: |
||||||||||||
| Net investment income |
$ | 30,000,141 | $ | 24,243,497 | $ | 13,491,984 | ||||||
| Net realized gains (losses) on investments |
3,600,539 | (42,132,660 | ) | (10,513,051 | ) | |||||||
| Net change in unrealized (depreciation) appreciation on investments |
(19,391,815 | ) | 81,836,604 | 32,203,525 | ||||||||
|
|
|
|
|
|
|
|||||||
| Net increase in net assets resulting from operations |
14,208,865 | 63,947,441 | 35,182,458 | |||||||||
|
|
|
|
|
|
|
|||||||
| Distributions to shareholders |
(32,176,536 | ) | (22,959,856 | ) | (15,973,470 | ) | ||||||
|
|
|
|
|
|
|
|||||||
| Capital share transactions: |
||||||||||||
| Issuance of common stock (net of offering costs of $318,630, $2,817,408 and $0, respectively) |
6,360,019 | 46,859,868 | — | |||||||||
| Reinvestment of dividends |
2,592,102 | 2,178,093 | 1,516,257 | |||||||||
|
|
|
|
|
|
|
|||||||
| Net increase in net assets from capital share transactions |
8,952,121 | 49,037,961 | 1,516,257 | |||||||||
|
|
|
|
|
|
|
|||||||
| Total (decrease) increase in net assets |
(9,015,550 | ) | 90,025,546 | 20,725,245 | ||||||||
| Net assets at beginning of period |
314,117,541 | 224,091,995 | 203,366,750 | |||||||||
|
|
|
|
|
|
|
|||||||
| Net assets at end of period (including over distributed net investment income of $3,852,838, $2,154,421 and $3,438,061, respectively) |
$ | 305,101,991 | $ | 314,117,541 | $ | 224,091,995 | ||||||
|
|
|
|
|
|
|
|||||||
| Capital share activity: |
||||||||||||
| Shares sold |
651,599 | 4,834,651 | — | |||||||||
| Shares issued from reinvestment of dividends |
280,462 | 238,500 | 329,670 | |||||||||
|
|
|
|
|
|
|
|||||||
| Net increase in capital share activity |
932,061 | 5,073,151 | 329,670 | |||||||||
|
|
|
|
|
|
|
|||||||
See Accompanying Notes.
78
Table of Contents
TICC CAPITAL CORP.
CONSOLIDATED STATEMENTS OF CASH FLOWS
| Year
Ended December 31, 2011 |
Year
Ended December 31, 2010 |
Year Ended December 31, 2009 |
||||||||||
| CASH FLOWS FROM OPERATING ACTIVITIES |
||||||||||||
| Net increase in net assets resulting from operations |
$ | 14,208,865 | $ | 63,947,441 | $ | 35,182,458 | ||||||
| Adjustments to reconcile net increase in net assets resulting from operations to net cash (used) provided by operating activities: |
||||||||||||
| Amortization of discounts |
(5,011,157 | ) | (5,577,631 | ) | (2,782,998 | ) | ||||||
| Increase in investments due to PIK |
(1,474,475 | ) | (710,108 | ) | (162,055 | ) | ||||||
| Purchases of investments |
(260,953,494 | ) | (128,038,228 | ) | (65,671,220 | ) | ||||||
| Repayments of principal and reductions to investment cost value |
107,965,693 | 73,771,623 | 65,639,714 | |||||||||
| Proceeds from the sale of investments |
11,264,033 | 54,811,196 | 14,010,037 | |||||||||
| Net realized (gains) losses on investments |
(3,600,539 | ) | 42,132,660 | 10,513,051 | ||||||||
| Net change in unrealized depreciation (appreciation) on investments |
19,391,815 | (81,836,604 | ) | (32,203,525 | ) | |||||||
| Amortization of discount on notes payable and deferred debt issuance costs |
167,471 | — | — | |||||||||
| (Increase) decrease in interest receivable |
(348,898 | ) | (628,713 | ) | 291,432 | |||||||
| (Increase) decrease in other assets |
(143,967 | ) | 161,494 | (108,206 | ) | |||||||
| Increase in accrued interest payable |
1,076,113 | — | — | |||||||||
| Increase (decrease) in investment advisory fee payable |
1,134,903 | 641,352 | (167,907 | ) | ||||||||
| Increase in accrued capital gains incentive fee |
1,108,749 | — | — | |||||||||
| Increase (decrease) in accrued expenses |
689,446 | 55,394 | (179,934 | ) | ||||||||
|
|
|
|
|
|
|
|||||||
| Net cash (used) provided by operating activities |
(114,525,442 | ) | 18,729,876 | 24,360,847 | ||||||||
|
|
|
|
|
|
|
|||||||
| CASH FLOWS FROM INVESTING ACTIVITIES |
||||||||||||
| Change in restricted cash |
(23,183,698 | ) | — | — | ||||||||
|
|
|
|
|
|
|
|||||||
| Net cash used by investing activities |
(23,183,698 | ) | — | — | ||||||||
|
|
|
|
|
|
|
|||||||
| CASH FLOWS FROM FINANCING ACTIVITIES |
||||||||||||
| Notes payable (net of discount of $1,588,125) |
$ | 99,661,875 | — | — | ||||||||
| Deferred debt issuance costs |
(3,014,393 | ) | — | — | ||||||||
| Proceeds from the issuance of common stock |
6,678,649 | 49,677,276 | — | |||||||||
| Offering expenses from the issuance of common stock |
(318,630 | ) | (2,817,408 | ) | — | |||||||
| Distributions paid (net of stock issued under dividend reinvestment plan of $2,592,102, $2,178,093 and 1,516,257, respectively) |
(29,584,434 | ) | (20,781,763 | ) | (14,457,213 | ) | ||||||
|
|
|
|
|
|
|
|||||||
| Net cash provided (used) by financing activities |
73,423,067 | 26,078,105 | (14,457,213 | ) | ||||||||
|
|
|
|
|
|
|
|||||||
| Net (decrease) increase in cash and cash equivalents |
(64,286,073 | ) | 44,807,981 | 9,903,634 | ||||||||
| Cash and cash equivalents, beginning of period |
68,780,866 | 23,972,885 | 14,069,251 | |||||||||
|
|
|
|
|
|
|
|||||||
| Cash and cash equivalents, end of period |
$ | 4,494,793 | $ | 68,780,866 | $ | 23,972,885 | ||||||
|
|
|
|
|
|
|
|||||||
| NON-CASH FINANCING ACTIVITIES |
||||||||||||
| Value of shares issued in connection with dividend reinvestment plan |
$ | 2,592,102 | $ | 2,178,093 | $ | 1,516,257 | ||||||
| SUPPLEMENTAL DISCLOSURES |
||||||||||||
| Securities purchased not settled |
$ | 13,352,500 | $ | 1,837,500 | $ | — | ||||||
See Accompanying Notes.
79
Table of Contents
TICC CAPITAL CORP.
NOTES TO CONSOLIDATED FINANCIAL STATEMENTS
DECEMBER 31, 2011
NOTE 1. ORGANIZATION
TICC Capital Corp. (“TICC” or the “Company”) was incorporated under the General Corporation Laws of the State of Maryland on July 21, 2003 and is a non-diversified, closed-end investment company. TICC has elected to be treated as a business development company under the Investment Company Act of 1940, as amended (the “1940 Act”). In addition, TICC has elected to be treated for tax purposes as a regulated investment company (“RIC”), under Subchapter M of the Internal Revenue Code of 1986, as amended (the “Code”). The Company’s investment objective is to maximize its total return, by investing primarily in corporate debt securities.
TICC’s investment activities are managed by TICC Management, LLC, (“TICC Management”), a registered investment adviser under the Investment Advisers Act of 1940, as amended. BDC Partners, LLC (“BDC Partners”) is the managing member of TICC Management and serves as the administrator of TICC.
On August 10, 2011, the Company completed a $225.0 million debt securitization financing transaction. The Class A Notes offered in the debt securitization were issued by TICC CLO LLC (the “Securitization Issuer” or “ TICC CLO”), a subsidiary of TICC Capital Corp. 2011-1 Holdings, LLC (“Holdings”), a direct subsidiary of TICC, and the notes are secured by the assets held by the Securitization Issuer. The securitization was executed through a private placement of $101.25 million of Aaa/AAA Class A Notes of the Securitization Issuer. Holdings retained all of the subordinated notes, which totaled $123.75 million, and retained all the membership interests in the Securitization Issuer. For further information on the securitization, see Note 8.
The Company consolidated the results of its subsidiaries, Holdings and TICC CLO, in its consolidated financial statements as the subsidiaries are operated solely for investment activities of the Company, and the Company has substantial equity at risk. The creditors of TICC CLO have received security interests in the assets owned by TICC CLO and such assets are not intended to be available to the creditors of TICC (or any other affiliate of TICC).
NOTE 2. SUMMARY OF SIGNIFICANT ACCOUNTING POLICIES
BASIS OF PRESENTATION
The accompanying consolidated financial statements include the accounts of the Company and its wholly-owned subsidiary, Holdings, and its indirect subsidiary, TICC CLO.
USE OF ESTIMATES
The consolidated financial statements have been prepared in accordance with accounting principles generally accepted in the United States of America that require management to make estimates and assumptions that affect the amounts reported in the consolidated financial statements and accompanying notes. Actual results may differ from those estimates.
In the normal course of business, the Company may enter into contracts that contain a variety of representations and provide indemnifications. The Company’s maximum exposure under these arrangements is unknown as this would involve future claims that may be made against the Company that have not yet occurred. However, based upon experience, the Company expects the risk of loss to be remote.
CASH AND CASH EQUIVALENTS
Cash and cash equivalents consist of demand deposits and highly liquid investments with original maturities of three months or less. Cash and cash equivalents are carried at cost or amortized cost which approximates fair value.
80
Table of Contents
INVESTMENT VALUATION
The most significant estimate inherent in the preparation of TICC’s consolidated financial statements is the valuation of investments and the related amounts of unrealized appreciation and depreciation of investments recorded. There is no single method for determining fair value in good faith. As a result, determining fair value requires that judgment be applied to the specific facts and circumstances of each portfolio investment while employing a consistently applied valuation process for the types of investments TICC makes. TICC is required to specifically fair value each individual investment on a quarterly basis.
In May 2011, the FASB issued an update to requirements relating to “Fair Value Measurement which represents amendments to achieve common fair value measurement and disclosure requirements in US GAAP and IFRS.” The amendments are of two types: (i) those that clarify the FASB’s intent about the application of existing fair value measurement and disclosure requirements and (ii) those that change a particular principle or requirement for measuring fair value or for disclosing information about fair value measurements. The amendments that change a particular principle or requirement for measuring fair value or disclosing information about fair value measurements relate to (i) measuring the fair value of the financial instruments that are managed within a portfolio; (ii) application of premium and discount in a fair value measurement; and (iii) additional disclosures about fair value measurements. The update is effective for annual periods beginning after December 15, 2011 with early adoption prohibited. The adoption of this update will not have a material impact on its consolidated financial statements; however, certain investments will not be valued under the highest and best use concept and TICC will enhance the disclosures in its consolidated financial statements.
TICC adopted ASC 820-10, Fair Value Measurements and Disclosure, which establishes a three-level valuation hierarchy for disclosure of fair value measurements, on January 1, 2008. ASC 820-10 clarified the definition of fair value and requires companies to expand their disclosure about the use of fair value to measure assets and liabilities in interim and annual periods subsequent to initial recognition. ASC 820-10 defines fair value as the price that would be received to sell an asset or paid to transfer a liability in an orderly transaction between market participants at the measurement date. ASC 820-10 also establishes a three-tier fair value hierarchy, which prioritizes the inputs used in measuring fair value. These tiers include: Level 1, defined as observable inputs such as quoted prices in active markets; Level 2, which includes inputs such as quoted prices for similar securities in active markets and quoted prices for identical securities in markets that are not active; and Level 3, defined as unobservable inputs for which little or no market data exists, therefore requiring an entity to develop its own assumptions. TICC has determined that due to the general illiquidity of the market for its investment portfolio, whereby little or no market data exists, all of TICC’s investments are based upon “Level 3” inputs.
TICC’s Board of Directors determines the value of its investment portfolio each quarter. In connection with that determination, members of TICC Management’s portfolio management team prepare portfolio company valuations using the most recent portfolio company financial statements and forecasts. Since March 2004, TICC has engaged third-party valuation firms to provide assistance in valuing its bilateral investments and, more recently, for certain of its syndicated loans, although TICC’s Board of Directors ultimately determines the appropriate valuation of each such investment.
TICC’s process for determining the fair value of a bilateral investment begins with determining the enterprise value of the portfolio company. Enterprise value means the entire value of the company to a potential buyer, including the sum of the values of debt and equity securities used to capitalize the enterprise at a point in time. The fair value of TICC’s investment is based, in part, on the enterprise value at which the portfolio company could be sold in an orderly disposition over a reasonable period of time between willing parties other than in a forced or liquidation sale. The liquidity event whereby TICC exits a private investment is generally the sale, the recapitalization or, in some cases, the initial public offering of the portfolio company.
There is no one methodology to determine enterprise value and, in fact, for any one portfolio company, enterprise value is best expressed as a range of fair values, from which TICC derives a single estimate of enterprise value. To determine the enterprise value of a portfolio company, TICC analyzes the historical and projected financial results, as well as the nature and value of any collateral. TICC also uses industry valuation benchmarks and public market comparables. TICC also considers other events, including private mergers and acquisitions, a purchase transaction, public offering or subsequent debt or equity sale or restructuring, and include these events in the enterprise valuation process. TICC generally requires portfolio companies to provide annual audited and quarterly unaudited financial statements, as well as annual projections for the upcoming fiscal year.
Typically, TICC’s bilateral debt investments are valued on the basis of a fair value determination arrived at through an analysis of the borrower’s financial and operating condition or other factors, as well as consideration of the entity’s enterprise value. The types of factors that TICC may take into account in valuing its investments include: market trading and transaction comparables, applicable market yields and multiples, security covenants, call protection provisions, the nature and realizable value of any collateral, the portfolio company’s ability to make payments and its earnings and discounted cash flows, among other factors. The fair value of equity interests in portfolio companies is determined based on various factors, including the enterprise value remaining for equity holders after the repayment of the portfolio company’s debt and other preference capital, and other pertinent factors such as recent offers to purchase a portfolio company, recent transactions involving the purchase or sale of the portfolio company’s equity securities, or other liquidity events. The determined equity values are generally discounted when TICC has a minority position, restrictions on resale, specific concerns about the receptivity of the capital markets to a specific company at a certain time, or other factors.
81
Table of Contents
TICC will record unrealized depreciation on bilateral investments when TICC believes that an investment has become impaired, including where collection of a loan or realization of an equity security is doubtful. To the extent that TICC believes that it has become probable that a loan is not collectible or probable that an equity investment is not realizable, TICC will classify that amount as a realized loss. TICC will record unrealized appreciation if TICC believes that the underlying portfolio company has appreciated in value and TICC’s equity security has also appreciated in value. Changes in fair value, other than such changes that are considered probable of non-collection or non-realization, as described above, are recorded in the statement of operations as net change in unrealized appreciation or depreciation.
Under the valuation procedures approved by TICC’s Board of Directors, upon the recommendation of the Valuation Committee, a third-party valuation firm will prepare valuations for each of TICC’s bilateral investments for which market quotations are not readily available that, when combined with all other investments in the same portfolio company, (i) have a value as of the previous quarter of greater than or equal to 2.5% of its total assets as of the previous quarter, and (ii) have a value as of the current quarter of greater than or equal to 2.5% of its total assets as of the previous quarter, after taking into account any repayment of principal during the current quarter. In addition, the frequency of those third-party valuations of TICC’s portfolio securities is based upon the grade assigned to each such security under its credit grading system as follows: Grade 1, at least annually; Grade 2, at least semi-annually; Grades 3, 4, and 5, at least quarterly. TICC Management also retains the authority to seek, on TICC’s behalf, additional third party valuations with respect to both TICC’s bilateral portfolio securities and TICC’s syndicated loan investments. TICC’s Board of Directors retains ultimate authority as to the third-party review cycle as well as the appropriate valuation of each investment.
On April 9, 2009, the FASB issued additional guidelines under ASC 820-10-35, “Determining Fair Value When the Volume and Level of Activity for the Asset or Liability Have Significantly Decreased and Identifying Transactions That Are Not Orderly,” which provides guidance on factors that should be considered in determining when a previously active market becomes inactive and whether a transaction is orderly. In accordance with ASC 820-10-35, TICC’s valuation procedures specifically provide for the review of indicative quotes supplied by the large agent banks that make a market for each security. However, the marketplace for which TICC obtains indicative bid quotes for purposes of determining the fair value of its syndicated loan investments have shown these attributes of illiquidity as described by ASC-820-10-35. Due to limited market liquidity in the syndicated loan market, TICC believes that the non-binding indicative bids received from agent banks for certain syndicated investments that TICC owns may not be determinative of their fair value and therefore alternative valuation procedures may need to be undertaken. As a result, TICC has engaged third-party valuation firms to provide assistance in valuing certain syndicated investments that TICC owns. In addition, TICC Management prepares an analysis of each syndicated loan, including a financial summary, covenant compliance review, recent trading activity in the security, if known, and other business developments related to the portfolio company. All available information, including non-binding indicative bids which may not be determinative of fair value, is presented to the Valuation Committee to consider in its determination of fair value. In some instances, there may be limited trading activity in a security even though the market for the security is considered not active. In such cases the Valuation Committee will consider the number of trades, the size and timing of each trade, and other circumstances around such trades, to the extent such information is available, in its determination of fair value. The Valuation Committee will evaluate the impact of such additional information, and factor it into its consideration of the fair value that is indicated by the analysis provided by third-party valuation firms. TICC has considered the factors described in ASC 820-10 and has determined that TICC is properly valuing the securities in its portfolio.
During the past several quarters, TICC has acquired a number of debt and equity positions in collateralized loan obligation (“CLO”) investment vehicles. These investments are special purpose financing vehicles. In valuing such investments, TICC considers the operating metrics of the specific investment vehicle, including compliance with collateralization tests, defaulted and restructured securities, and payment defaults, if any. In addition, TICC considers the indicative prices provided by the broker who arranges transactions in such investment vehicles, as well as any available information on other relevant transactions in the market. TICC Management or the Valuation Committee may request an additional analysis by a third-party firm to assist in the valuation process of CLO investment vehicles. All information is presented to TICC’s Board of Directors for its determination of fair value of these investments.
Our assets measured at fair value on a recurring basis subject to the disclosure requirements of ASC 820-10-35 at December 31, 2011, were as follows:
82
Table of Contents
| ($ in millions) |
Fair Value Measurements at Reporting Date Using | Total | ||||||||||||||
| Assets |
Quoted Prices in Active Markets for Identical Assets (Level 1) |
Significant Other Observable Inputs (Level 2) |
Significant Unobservable Inputs (Level 3) |
|||||||||||||
| Cash equivalents |
$ | 0.0 | $ | 0.0 | $ | 0.0 | $ | 0.0 | ||||||||
| Senior Secured Notes |
0.0 | 10.7 | 279.2 | 289.9 | ||||||||||||
| CLO Debt |
0.0 | 0.0 | 51.0 | 51.0 | ||||||||||||
| CLO Equity |
0.0 | 0.0 | 39.3 | 39.3 | ||||||||||||
| Subordinated Notes |
0.0 | 0.0 | 4.9 | 4.9 | ||||||||||||
| Common Stock |
0.0 | 0.0 | 3.1 | 3.1 | ||||||||||||
| Preferred Shares |
0.0 | 0.0 | 2.5 | 2.5 | ||||||||||||
| Warrants to purchase equity |
0.0 | 0.0 | 0.8 | 0.8 | ||||||||||||
|
|
|
|
|
|
|
|
|
|||||||||
| Total |
$ | 0.0 | $ | 10.7 | $ | 380.8 | $ | 391.5 | ||||||||
|
|
|
|
|
|
|
|
|
|||||||||
A reconciliation of the fair value of investments for the year ended December 31, 2011, utilizing significant unobservable inputs, is as follows:
| ($ in millions) |
Senior Secured Note Investments |
Collateralized Loan Obligation Debt Investments |
Collateralized Loan Obligation Equity Investments |
Subordinated Note Investments |
Common Stock Investments |
Preferred Share Equity Investments |
Warrants to Purchase Equity Investments |
Total | ||||||||||||||||||||||||
| Balance at December 31, 2010 |
$ | 173.9 | $ | 50.4 | $ | 8.9 | $ | 6.0 | $ | 5.8 | $ | 2.0 | $ | 0.5 | $ | 247.5 | ||||||||||||||||
| Realized Losses included in earnings |
2.7 | 0.9 | 0.0 | 0.0 | 0.0 | 0.0 | 0.0 | 3.6 | ||||||||||||||||||||||||
| Unrealized (depreciation) appreciation included in earnings |
(5.7 | ) | (9.5 | ) | (1.5 | ) | (0.4 | ) | (2.7 | ) | 0.1 | 0.3 | (19.4 | ) | ||||||||||||||||||
| Accretion of discount |
2.8 | 2.2 | 0.0 | 0.0 | 0.0 | 0.0 | 0.0 | 5.0 | ||||||||||||||||||||||||
| Purchases |
230.0 | 10.6 | 31.9 | 0.0 | 0.0 | 0.0 | 0.0 | 272.5 | ||||||||||||||||||||||||
| Repayments and Sales(1) |
(113.8 | ) | (3.6 | ) | 0.0 | (0.7 | ) | 0.0 | 0.4 | 0.0 | (117.7 | ) | ||||||||||||||||||||
| Transfers in and/or out of level 3 |
(10.7 | ) | 0.0 | 0.0 | 0.0 | 0.0 | 0.0 | 0.0 | (10.7 | ) | ||||||||||||||||||||||
|
|
|
|
|
|
|
|
|
|
|
|
|
|
|
|
|
|||||||||||||||||
| Balance at December 31, 2011 |
$ | 279.2 | $ | 51.0 | $ | 39.3 | $ | 4.9 | $ | 3.1 | $ | 2.5 | $ | 0.8 | $ | 380.8 | ||||||||||||||||
|
|
|
|
|
|
|
|
|
|
|
|
|
|
|
|
|
|||||||||||||||||
| The amount of total gains or losses for the period included in earnings attributable to the change in unrealized gains or losses relating to our Level 3 assets still held at the reporting date and reported within the net change in unrealized gains or losses on investments in our Statement of Operations |
($ | 4.1 | ) | ($ | 8.8 | ) | ($ | 1.3 | ) | ($ | 0.3 | ) | ($ | 2.7 | ) | $ | 0.1 | $ | 0.3 | ($ | 16.8 | ) | ||||||||||
|
|
|
|
|
|
|
|
|
|
|
|
|
|
|
|
|
|||||||||||||||||
| (1) | Includes PIK interest of approximately $1.5 million and rounding adjustments to reconcile period balances. |
Our assets measured at fair value on a recurring basis subject to the disclosure requirements of ASC 820-10-35 at December 31, 2010, were as follows:
83
Table of Contents
| ($ in millions) |
Fair Value Measurements at Reporting Date Using | Total | ||||||||||||||
| Assets |
Quoted Prices in Active Markets for Identical Assets (Level 1) |
Significant Other Observable Inputs (Level 2) |
Significant Unobservable Inputs (Level 3) |
|||||||||||||
| Cash equivalents |
$ | 68.5 | $ | 0.0 | $ | 0.0 | $ | 68.5 | ||||||||
| Senior Secured Notes |
0.0 | 0.0 | 173.9 | 173.9 | ||||||||||||
| CLO Debt |
0.0 | 0.0 | 50.4 | 50.4 | ||||||||||||
| CLO Equity |
0.0 | 0.0 | 8.9 | 8.9 | ||||||||||||
| Subordinated Notes |
0.0 | 0.0 | 6.0 | 6.0 | ||||||||||||
| Common Stock |
0.0 | 0.0 | 5.8 | 5.8 | ||||||||||||
| Preferred Shares |
0.0 | 0.0 | 2.0 | 2.0 | ||||||||||||
| Warrants to purchase equity |
0.0 | 0.0 | 0.5 | 0.5 | ||||||||||||
|
|
|
|
|
|
|
|
|
|||||||||
| Total |
$ | 68.5 | $ | 0.0 | $ | 247.5 | $ | 316.0 | ||||||||
|
|
|
|
|
|
|
|
|
|||||||||
84
Table of Contents
A reconciliation of the fair value of investments for the year ended December 31, 2010, utilizing significant unobservable inputs, is as follows:
| ($ in millions) |
Senior Secured Note Investments |
Collateralized Loan Obligation Debt Investments |
Collateralized Loan Obligation Equity Investments |
Subordinated Note Investments |
Common Stock Investments |
Preferred Share Equity Investments |
Warrants to Purchase Equity Investments |
Total | ||||||||||||||||||||||||
| Balance at December 31, 2009 |
$ | 180.1 | $ | 4.9 | $ | 2.2 | $ | 2.7 | $ | 5.5 | $ | 0.0 | $ | 0.5 | $ | 195.9 | ||||||||||||||||
| Realized Losses included in earnings |
(42.4 | ) | 0.0 | 0.0 | 0.0 | 0.0 | 0.0 | 0.0 | (42.4 | ) | ||||||||||||||||||||||
| Unrealized appreciation (depreciation) included in earnings |
63.7 | 15.0 | 1.8 | 0.8 | (0.1 | ) | 1.2 | 0.0 | 82.4 | |||||||||||||||||||||||
| Accretion of discount |
4.5 | 1.1 | 0.0 | 0.0 | 0.0 | 0.0 | 0.0 | 5.6 | ||||||||||||||||||||||||
| Purchases |
88.1 | 31.5 | 4.9 | 3.9 | 0.4 | 0.8 | 0.0 | 129.6 | ||||||||||||||||||||||||
|
Repayments and Sales(1) |
(120.1 | ) | (2.1 | ) | 0.0 | (1.4 | ) | 0.0 | 0.0 | 0.0 | (123.6 | ) | ||||||||||||||||||||
| Transfers in and/or out of level 3 |
0.0 | 0.0 | 0.0 | 0.0 | 0.0 | 0.0 | 0.0 | 0.0 | ||||||||||||||||||||||||
|
|
|
|
|
|
|
|
|
|
|
|
|
|
|
|
|
|||||||||||||||||
| Balance at December 31, 2010 |
$ | 173.9 | $ | 50.4 | $ | 8.9 | $ | 6.0 | $ | 5.8 | $ | 2.0 | $ | 0.5 | $ | 247.5 | ||||||||||||||||
|
|
|
|
|
|
|
|
|
|
|
|
|
|
|
|
|
|||||||||||||||||
| The amount of total gains or losses for the period included in earnings attributable to the change in unrealized gains or losses relating to our Level 3 assets still held at the reporting date and reported within the net change in unrealized gains or losses on investments in our Statement of Operations |
$ | 18.7 | $ | 15.0 | $ | 1.8 | $ | 0.9 | ($ | 0.1 | ) | $ | 1.1 | $ | 0.1 | $ | 37.5 | |||||||||||||||
|
|
|
|
|
|
|
|
|
|
|
|
|
|
|
|
|
|||||||||||||||||
| (1) | Includes amortization of discounts of approximately $5.6 million and PIK interest of approximately $710,000 and rounding adjustments to reconcile period balances. |
The following table shows the fair value of TICC’s portfolio of investments by asset class as of December 31, 2011 and 2010:
| 2011 | 2010 | |||||||||||||||
| Investments at Fair Value |
Percentage of Total Portfolio |
Investments at Fair Value |
Percentage of Total Portfolio |
|||||||||||||
| (dollars in millions) | (dollars in millions) | |||||||||||||||
| Senior Secured Notes |
$ | 289.9 | 74.1 | % | $ | 173.9 | 70.3 | % | ||||||||
| CLO Debt |
51.0 | 13.0 | % | 50.4 | 20.4 | % | ||||||||||
| CLO Equity |
39.3 | 10.0 | % | 8.9 | 3.6 | % | ||||||||||
| Subordinated Notes |
4.9 | 1.3 | % | 6.0 | 2.4 | % | ||||||||||
| Common Stock |
3.1 | 0.8 | % | 5.8 | 2.3 | % | ||||||||||
| Preferred Shares |
2.5 | 0.6 | % | 2.0 | 0.8 | % | ||||||||||
| Warrants |
0.8 | 0.2 | % | 0.5 | 0.2 | % | ||||||||||
|
|
|
|
|
|
|
|
|
|||||||||
| Total |
$ | 391.5 | 100.0 | % | $ | 247.5 | 100.0 | % | ||||||||
|
|
|
|
|
|
|
|
|
|||||||||
85
Table of Contents
OTHER ASSETS
Other assets consists of prepaid expenses associated primarily with insurance costs.
INTEREST INCOME RECOGNITION
Interest income is recorded on the accrual basis to the extent that such amounts are expected to be collected.
PAYMENT-IN-KIND
The Company may have investments in its portfolio which contain a payment-in-kind, or PIK, provision. The PIK interest is added to the cost basis of the investment and recorded as income. To maintain the Company’s status as a RIC, this non-cash source of income must be paid out to stockholders in the form of dividends, even though the Company has not yet collected the cash. Amounts necessary to pay these dividends may come from available cash or the liquidation of certain investments. For the year ended December 31, 2011 the Company recorded PIK interest income of approximately $1,474,000. For the years ended December 31, 2010 and 2009, the Company recorded approximately $710,000 and $162,000 in PIK interest income, respectively.
In addition, the Company recorded original issue discount income of approximately $5,011,000, $5,578,000 and $2,783,000 for the years ended December 31, 2011, 2010 and 2009, respectively, representing the amortization of the discount attributed to certain debt securities purchased by the Company, including original issue discount (“OID”) and market discount.
86
Table of Contents
OTHER INCOME
Other income includes closing fees, or origination fees, associated with investments in portfolio companies. Such fees are normally paid at closing of the Company’s investments, are fully earned and non-refundable, and are generally non-recurring.
MANAGERIAL ASSISTANCE FEES
The 1940 Act requires that a business development company offer managerial assistance to its portfolio companies. The Company offers to provide managerial assistance to its portfolio companies in connection with the Company’s investments and may receive fees for its services. The Company has not received any fees for such services since inception.
FEDERAL INCOME TAXES
The Company intends to operate so as to qualify to be taxed as a RIC under Subchapter M of the Code and, as such, to not be subject to federal income tax on the portion of its taxable income and gains distributed to stockholders. To qualify for RIC tax treatment, TICC is required to distribute at least 90% of its investment company taxable income, as defined by the Code.
Because federal income tax regulations differ from accounting principles generally accepted in the United States, distributions in accordance with tax regulations may differ from net investment income and realized gains recognized for financial reporting purposes. Differences may be permanent or temporary. Permanent differences are reclassified among capital accounts in the financial statement to reflect their tax character. Temporary differences arise when certain items of income, expense, gain or loss are recognized at some time in the future. Differences in classification may also result from the treatment of short-term gains as ordinary income for tax purposes.
For tax purposes, the cost basis of the portfolio investments at December 31, 2011 and December 31, 2010 was approximately $408,054,145 and $241,093,000, respectively.
CONCENTRATION OF CREDIT RISK
The Company places its cash and cash equivalents with financial institutions and, at times, cash held in checking accounts may exceed the Federal Deposit Insurance Corporation insured limit. In addition, the Company’s portfolio may be concentrated in a limited number of portfolio companies in the technology-related sector, which will subject the Company to a risk of significant loss if any of these companies defaults on its obligations under any of its debt securities that the Company holds or if the technology-related sector experiences a market downturn.
NOTE 3. CASH AND CASH EQUIVALENTS
At December 31, 2011 and December 31, 2010, respectively, cash and cash equivalents consisted of:
| December 31, 2011 |
December 31, 2010 |
|||||||
| Eurodollar Time Deposit (due 1/3/11) |
$ | — | $ | 68,513,869 | ||||
|
|
|
|
|
|||||
| Total Cash Equivalents |
— | 68,513,869 | ||||||
| Cash |
4,494,793 | 266,997 | ||||||
| Restricted Cash |
23,183,698 | — | ||||||
|
|
|
|
|
|||||
| Cash and Cash Equivalents |
$ | 27,678,491 | $ | 68,780,866 | ||||
|
|
|
|
|
|||||
Restricted cash, approximately $23.2 million at December 31, 2011, include amounts that are collected and are held by Bank of New York as trustee and custodian of the assets for the Company’s debt securitization. Restricted cash is held by the trustee for payment of interest expense and principal on the outstanding borrowings or reinvestment in new assets.
NOTE 4. EARNINGS PER SHARE
The following table sets forth the computation of basic and diluted net increase in net assets resulting from operations per share for the years ended December 31, 2011, 2010 and 2009:
87
Table of Contents
| Year ended December 31, 2011 |
Year ended December 31, 2010 |
Year ended December 31, 2009 |
||||||||||
| Numerator for basic and diluted income per share—net increase in net assets resulting from net investment income |
$ | 30,000,141 | $ | 24,243,497 | $ | 13,491,984 | ||||||
| Numerator for basic and diluted income per share—net increase in net assets resulting from operations |
$ | 14,208,865 | $ | 63,947,441 | $ | 35,182,458 | ||||||
| Denominator for basic and diluted income per share —weighted average shares |
32,433,101 | 27,253,552 | 26,624,217 | |||||||||
| Basic and diluted net investment income per common share |
$ | 0.92 | $ | 0.89 | $ | 0.51 | ||||||
| Basic and diluted net increase in net assets resulting from operations per common share |
$ | 0.44 | $ | 2.35 | $ | 1.32 | ||||||
NOTE 5. RELATED PARTY TRANSACTIONS
TICC has entered into an investment advisory agreement with TICC Management (the “Investment Advisory Agreement”) under which TICC Management, subject to the overall supervision of TICC’s Board of Directors, manages the day-to-day operations of, and provides investment advisory services to, TICC. For providing these services TICC Management receives a fee from TICC, consisting of two components: a base management fee (the “Base Fee”) and an incentive fee. The Base Fee is calculated at an annual rate of 2.00%. The Base Fee is payable quarterly in arrears, and is calculated based on the average value of TICC’s gross assets at the end of the two most recently completed calendar quarters, and appropriately adjusted for any equity or debt capital raises, repurchases or redemptions during the current calendar quarter. Accordingly, the Base Fee will be payable regardless of whether the value of TICC’s gross assets have decreased during the quarter.
The incentive fee has two parts. The first part is calculated and payable quarterly in arrears based on the Company’s “Pre-Incentive Fee Net Investment Income” for the immediately preceding calendar quarter. For this purpose, “Pre-Incentive Fee Net Investment Income” means interest income, dividend income and any other income (including any other fees, such as commitment, origination, structuring, diligence and consulting fees or other fees that TICC receives from portfolio companies) accrued during the calendar quarter, minus the Company’s operating expenses for the quarter (including the Base Fee, expenses payable under the Company’s administration agreement with BDC Partners (the “Administration Agreement”), and any interest expense and dividends paid on any issued and outstanding preferred stock, but excluding the incentive fee). Pre-Incentive Fee Net Investment Income includes, in the case of investments with a deferred interest feature (such as original issue discount, debt instruments with PIK interest and zero coupon securities), accrued income that the Company has not yet received in cash. Pre-Incentive Fee Net Investment Income does not include any realized capital gains, realized capital losses or unrealized capital appreciation or depreciation. Pre-Incentive Fee Net Investment Income, expressed as a rate of return on the value of the Company’s net assets at the end of the immediately preceding calendar quarter, is compared to one- fourth of an annual “hurdle rate.” Given that this portion of the incentive fee is payable without regard to any capital gain, capital loss or unrealized depreciation that may occur during the quarter, this portion of TICC Management’s incentive fee may also be payable notwithstanding a decline in net asset value that quarter.
For each year commencing on or after January 1, 2005, the annual hurdle rate has been determined as of the immediately preceding December 31st by adding 5.0% to the interest rate then payable on the most recently issued five-year U.S. Treasury Notes, up to a maximum annual hurdle rate of 10.0%. The annual hurdle rate for the 2011, 2010 and 2009 calendar year was 7.01%, 7.69% and 6.55%, respectively. The current hurdle rate for the 2012 calendar year, calculated as of December 31, 2011, is 5.83%.
The second part of the incentive fee is determined and payable in arrears as of the end of each calendar year (or upon termination of the Investment Advisory Agreement, as of the termination date), and equals 20% of the Company’s “Incentive Fee Capital Gains,” which consist of the Company’s realized capital gains for each calendar year, computed net of all realized capital losses and unrealized capital depreciation for that calendar year. For accounting purposes only, in order to reflect the theoretical capital gains incentive fee that would be payable for a given period as if all unrealized gains were realized, we will accrue a capital gains incentive fee based upon net realized capital gains and unrealized capital depreciation for that calendar year (in accordance with the terms of the Investment Advisory Agreement), plus unrealized capital appreciation on investments held at the end of the period. It should be noted that a fee so calculated and accrued would not necessarily be payable under the Investment Advisory Agreement, and may never be paid based upon the computation of capital gains incentive fees in subsequent periods. Amounts paid under the Investment Advisory Agreement will be consistent with the formula reflected in the Investment Advisory Agreement. For the years ended December 31, 2011, 2010 and 2009, there was no accrual under this methodology.
Incentive fees, based upon pre-incentive fee net investment income, were approximately $2.2 million, $1.4 million and $51,800 for the years ended December 31, 2011, 2010 and 2009, respectively. Under the terms of the Investment Advisory Agreement, there were no capital gains incentive fees earned for any year in this three-year period. The Investment Advisor determined to waive $50,000 of the income incentive fee for the fourth quarter of 2010.
88
Table of Contents
For the year ending December 31, 2011, the capital gains incentive fee expense was approximately $1.1 million and there was no such expense for the same period in 2010. The amount of capital gains incentive fee expense related to the hypothetical liquidation of the portfolio (and assuming no other changes in realized or unrealized gains and losses) would only become payable to TICC Management in the event of a complete liquidation of our portfolio as of period end and the termination of the Investment Advisory Agreement on such date. Also, it should be noted that the capital gains incentive fee expense fluctuates with our overall investment results.
In addition, in the event the Company recognizes payment-in-kind, or “PIK,” interest income in excess of its available capital, the Company may be required to liquidate assets in order to pay a portion of the incentive fee. TICC Management, however, is not required to reimburse the Company for the portion of any incentive fees attributable to PIK loan interest income in the event of a subsequent default.
TICC has also entered into an Administration Agreement with BDC Partners under which BDC Partners provides administrative services for TICC. For providing these services, facilities and personnel, TICC reimburses BDC Partners for TICC’s allocable portion of overhead and other expenses incurred by BDC Partners in performing its obligations under the Administration Agreement, including rent.
The Company has entered into an investment advisory agreement with TICC Management. TICC Management is controlled by BDC Partners, its managing member. Charles M. Royce holds a minority, non-controlling interest in TICC Management. BDC Partners, as the managing member of TICC Management, manages the business and internal affairs of TICC Management. In addition, BDC Partners provides TICC with office facilities and administrative services pursuant to an administration agreement (the “Administration Agreement”). Jonathan H. Cohen, the Company’s Chief Executive Officer, as well as a Director, is the managing member of BDC Partners. Saul B. Rosenthal, the Company’s President and Chief Operating Officer, is also the President and Chief Operating Officer of TICC Management and a member of BDC Partners. Messrs. Cohen and Rosenthal have an equal equity interest in BDC Partners. Charles M. Royce, the Company’s non-executive Chairman of the Board of Directors, does not take part in the management or participate in the operations of TICC Management; however, Mr. Royce is expected to be available from time to time to TICC Management to provide certain consulting services without compensation. BDC Partners is also the managing member of Oxford Gate Capital, LLC, a private fund in which Messrs. Cohen and Rosenthal, along with certain investment and administrative personnel of TICC Management, are invested.
The Company has also entered into the Administration Agreement with BDC Partners under which BDC Partners provides administrative services for TICC. The Company pays BDC Partners an allocable portion of overhead and other expenses incurred by BDC Partners in performing its obligations under the Administration Agreement, including a portion of the rent and the compensation of the chief financial officer, chief compliance officer, controller and other administrative support personnel, which creates potential conflicts of interest that the Board of Directors must monitor.
For the periods ended December 31, 2011, 2010 and 2009, respectively, TICC incurred investment advisory fees of approximately $7.3 million, $6.4 million and $4.1 million in accordance with the terms of the Investment Advisory Agreement, and incurred approximately $1.1 million, $1.0 million and $1.0 million in compensation expenses for the services of employees allocated to the administrative activities of TICC, pursuant to the Administration Agreement with BDC Partners. In addition, TICC incurred approximately $70,000, $87,000 and $77,000 for facility costs allocated under the agreement for the years ended December 31, 2011, 2010 and 2009, respectively. At December 31, 2011, 2010 and 2009, respectively, $2.9 million, $1.8 million and $1.1 million of investment advisory fees remained payable to TICC Management. At December 31, 2011, approximately $605,000 was accrued for compensation expense. At December 31, 2010 and 2009, no compensation expense remained payable.
NOTE 6. OTHER INCOME
Other income includes primarily exit fees and closing fees, or origination fees, associated with investments in portfolio companies as well as dividends. Fees are normally paid at closing of the Company’s investments, are fully earned and non-refundable, and are generally non-recurring. For the years ended December 31, 2011, 2010 and 2009, respectively, TICC earned approximately $0.9 million, $1.0 million, and $0.1 million, in other income.
The 1940 Act requires that a business development company offer managerial assistance to its portfolio companies. The Company may receive fee income for managerial assistance it renders to portfolio companies in connection with its investments. For the years ended December 31, 2011, 2010 and 2009, the Company received no fee income for managerial assistance.
NOTE 7. COMMITMENTS
In the normal course of business, the Company enters into a variety of undertakings containing a variety of warranties and indemnifications that may expose the Company to some risk of loss. The risk of future loss arising from such undertakings, while not quantifiable, is expected to be remote.
89
Table of Contents
As of December 31, 2011, the Company had not issued any commitments to purchase additional debt investments and/or warrants from any portfolio companies.
NOTE 8. BORROWINGS
In accordance with the 1940 Act, with certain limited exceptions, the Company is only allowed to borrow amounts such that its asset coverage, as defined in the 1940 Act, is at least 200% after such borrowing. As of December 31, 2011, the Company’s asset coverage for borrowed amounts was 400%.
On August 10, 2011, the Company completed a $225.0 million debt securitization financing transaction. The Class A Notes offered in the securitization were issued by TICC CLO, and are secured by the assets held by the trustee on behalf of the Securitization Issuer. The securitization was executed through a private placement of $101.25 million of Aaa/AAA Class A Notes which bear interest, after the effective date, at three-month London Inter Bank Offered Rate (“LIBOR”) plus 2.25% (prior to the effective date, the Class A Notes bear interest at five-month LIBOR plus 2.25%). The notes were sold at a discount to par, and the amount of the discount is being amortized over the term of the notes. The Class A Notes are included in the December 31, 2011 consolidated statements of assets and liabilities. Holdings retained all of the subordinated notes totaling $123.75 million and all of the membership interests in the Securitization Issuer. The subordinated notes do not bear interest, but are entitled to the residual economic interest in the Securitization Issuer.
During a period of up to three years from the closing date, all principal collections received on the underlying collateral may be used by the Securitization Issuer to purchase new collateral under the direction of TICC in its capacity as collateral manager of the Securitization Issuer and in accordance with the Company’s investment strategy, allowing the Company to maintain the initial leverage in the securitization for such three-year period. The Class A Notes are scheduled to mature on July 25, 2021.
The proceeds of the private placement of the Class A Notes, net of discount and debt issuance costs, were used for investment purposes. As part of the securitization, TICC entered into a master loan sale agreement with Holdings and the Securitization Issuer under which TICC agreed to sell or contribute certain senior secured and second lien loans (or participation interests therein) to Holdings, and Holdings agreed to sell or contribute such loans (or participation interests therein) to the Securitization Issuer and to purchase or otherwise acquire subordinated notes issued by the Securitization Issuer. The Class A Notes are the secured obligations of the Securitization Issuer, and an indenture governing the Notes includes customary covenants and events of default.
TICC serves as collateral manager to the Securitization Issuer under a collateral management agreement. TICC is entitled to a deferred fee for its services as collateral manager. The deferred fee is eliminated in consolidation.
As of December 31, 2011, there were 45 investments in portfolio companies with a total fair value of approximately $219,696,000, securing the Class A Notes. The pool of loans in the securitization must meet certain requirements, including asset mix and concentration, collateral coverage, term, agency rating, minimum coupon, minimum spread and sector diversity requirements.
For the period from closing until the effective date, the interest charged under the securitization is based on five-month LIBOR, which as of December 31, 2011 was 0.40%. For the year ended December 31, 2011, the effective annualized average interest rate, which includes amortization of discount and debt issuance costs on the securitization, was 3.1%. For the year ended December 31, 2011, interest expense, including the amortization of deferred debt issuance costs and the discount on the face amount of the Class A Notes, was $1,243,584. Cash paid for interest during the year ended December 31, 2011 was $0.
The amounts, ratings and interest rates (expressed as a spread to LIBOR) of the Class A Notes are as follows:
| Description | Class A Notes | |
| Type |
Senior Secured Floating Rate | |
| Amount Outstanding |
$101,250,000 | |
| Moody’s Rating |
“Aaa” | |
| Standard & Poor’s Rating |
“AAA” | |
| Interest Rate |
LIBOR + 2.25% | |
| Stated Maturity |
July 25, 2021 |
The following are the carrying values and fair values of the Company’s debt liabilities as of December 31, 2011. Fair value is based upon the bid price provided by the placement agent at the measurement date. There were no debt liabilities as of December 31, 2010.
| As of December 31, 2011 (in thousands) |
As of December 31, 2010 (in thousands) |
|||||||||||||||
| Carrying Value |
Fair Value | Carrying Value |
Fair Value | |||||||||||||
| Class A Notes |
$ | 99,711 | $ | 95,723 | $ | — | $ | — | ||||||||
Deferred debt issuance costs represent fees and other direct incremental costs incurred in connection with the Company’s debt securitization. As of December 31, 2011, the Company had deferred financing costs of $2,895,873. Discount on the Notes at the time of issuance totaled approximately $1,588,125. These amounts are being amortized and included in interest expense in the consolidated statements of operations over the term of the debt securitization. Amortization expense for the year ended December 31, 2011 was approximately $167,000. There was no amortization expense for the year ended December 31, 2010.
90
Table of Contents
NOTE 9. SUBSEQUENT EVENTS
On March 1, 2012, the Company’s Board of Directors declared a cash dividend of $0.27 per share payable on March 30, 2012 to holders of record on March 21, 2012.
NOTE 10. FINANCIAL HIGHLIGHTS
| Year Ended December 31, 2011 |
Year Ended December 31, 2010 |
Year Ended December 31, 2009 |
Year Ended December 31, 2008 |
Year Ended December 31, 2007 |
||||||||||||||||
| Per Share Data |
||||||||||||||||||||
| Net asset value at beginning of period |
$ | 9.85 | $ | 8.36 | $ | 7.68 | $ | 11.94 | $ | 13.77 | ||||||||||
|
|
|
|
|
|
|
|
|
|
|
|||||||||||
| Net investment income(1) |
0.92 | 0.89 | 0.51 | 0.91 | 1.32 | |||||||||||||||
| Net realized and unrealized capital gains (losses)(2) |
(0.47 | ) | 1.19 | 0.81 | (2.94 | ) | (1.79 | ) | ||||||||||||
|
|
|
|
|
|
|
|
|
|
|
|||||||||||
| Total from net investment operations |
0.45 | 2.08 | 1.32 | (2.03 | ) | (0.47 | ) | |||||||||||||
|
|
|
|
|
|
|
|
|
|
|
|||||||||||
| Distributions from net investment income |
(0.99 | ) | (0.81 | ) | (0.60 | ) | (0.98 | ) | (1.37 | ) | ||||||||||
| Distributions from net realized capital gains |
— | — | — | — | (0.05 | ) | ||||||||||||||
| Tax return of capital distributions |
— | — | — | (0.08 | ) | (0.02 | ) | |||||||||||||
|
|
|
|
|
|
|
|
|
|
|
|||||||||||
| Total distributions(3) |
(0.99 | ) | (0.81 | ) | (0.60 | ) | (1.06 | ) | (1.44 | ) | ||||||||||
|
|
|
|
|
|
|
|
|
|
|
|||||||||||
| Effect of shares issued, net of offering expenses |
(0.01 | ) | 0.22 | (0.04 | ) | (1.17 | ) | 0.08 | ||||||||||||
|
|
|
|
|
|
|
|
|
|
|
|||||||||||
| Net asset value at end of period |
$ | 9.30 | $ | 9.85 | $ | 8.36 | $ | 7.68 | $ | 11.94 | ||||||||||
|
|
|
|
|
|
|
|
|
|
|
|||||||||||
| Per share market value at beginning of period |
$ | 11.21 | $ | 6.05 | $ | 3.80 | $ | 9.23 | $ | 16.14 | ||||||||||
| Per share market value at end of period |
$ | 8.65 | $ | 11.21 | $ | 6.05 | $ | 3.80 | $ | 9.23 | ||||||||||
| Total return(4) |
(14.19 | %) | 102.39 | % | 81.15 | % | (50.23 | %) | (36.26 | %) | ||||||||||
| Shares outstanding at end of period |
32,818,428 | 31,886,367 | 26,813,216 | 26,483,546 | 21,563,717 | |||||||||||||||
| Ratios/Supplemental Data |
||||||||||||||||||||
| Net assets at end of period (000’s) |
305,102 | 314,118 | 224,092 | 203,367 | 257,370 | |||||||||||||||
| Average net assets (000’s) |
318,305 | 243,723 | 206,183 | 251,320 | 277,994 | |||||||||||||||
| Ratio of expenses to average net assets: |
||||||||||||||||||||
| Expenses before incentive fees |
3.72 | % | 3.22 | % | 3.38 | % | 5.82 | % | 5.90 | % | ||||||||||
| Net investment income incentive fees |
0.70 | % | 0.58 | % | 0.02 | % | 0.19 | % | 0.09 | % | ||||||||||
| Capital gains incentive fees |
0.35 | % | — | — | — | — | ||||||||||||||
|
|
|
|
|
|
|
|
|
|
|
|||||||||||
| Total ratio of expenses to average net assets |
4.77 | % | 3.80 | % | 3.40 | % | 6.01 | % | 5.99 | % | ||||||||||
|
|
|
|
|
|
|
|
|
|
|
|||||||||||
| Ratio of expenses, excluding interest expense, to average net assets |
4.38 | % | 3.80 | % | 3.40 | % | 4.10 | % | 3.72 | % | ||||||||||
| Ratio of net investment income to average net assets |
9.42 | % | 9.95 | % | 6.54 | % | 8.83 | % | 9.78 | % | ||||||||||
91
Table of Contents
| (1) | Represents per share net investment income for the period, based upon average shares outstanding. |
| (2) | Net realized and unrealized capital gains include rounding adjustments to reconcile change in net asset value per share. |
| (3) | Management monitors available taxable earnings, including net investment income and realized capital gains, to determine if a tax return of capital may occur for the year. To the extent the Company’s taxable earnings fall below the total amount of the Company’s distributions for that fiscal year, a portion of those distributions may be deemed a tax return of capital to the Company’s stockholders. For the years ending December 31, 2008 and 2007, approximately $0.08 per share and $0.02 per share of the Company’s distributions were characterized as a tax return of capital to the Company’s stockholders, respectively. |
| (4) | Total return equals the increase or decrease of ending market value over beginning market value, plus distributions, divided by the beginning market value, assuming dividend reinvestment prices obtained under the Company’s dividend reinvestment plan. |
NOTE 11. DIVIDENDS
The following table represents the cash distributions, including dividends and returns of capital, if any, declared per share:
| Date Declared |
Record Date | Payment Date | Amount | |||||
| Fiscal 2012 |
||||||||
| March 1, 2012 |
March 21, 2012 | March 30, 2011 | $ | 0.27 | ||||
|
|
|
|||||||
| Fiscal 2011 |
||||||||
| November 3, 2011 |
December 16, 2011 | December 30, 2011 | 0.25 | |||||
| July 28, 2011 |
September 16, 2011 | September 30, 2011 | 0.25 | |||||
| May 3, 2011 |
June 16, 2011 | June 30, 2011 | 0.25 | |||||
| March 3, 2011 |
March 21, 2011 | March 31, 2011 | 0.24 | |||||
|
|
|
|||||||
| Total (2011) |
$ | 0.99 | ||||||
|
|
|
|||||||
| Fiscal 2010 |
||||||||
| November 2, 2010 |
December 10, 2010 | December 31, 2010 | 0.24 | |||||
| July 29, 2010 |
September 10, 2010 | September 30, 2010 | 0.22 | |||||
| April 29, 2010 |
June 10, 2010 | June 30, 2010 | 0.20 | |||||
| March 4, 2010 |
March 24, 2010 | March 31, 2010 | 0.15 | |||||
|
|
|
|||||||
| Total (2010) |
$ | 0.81 | ||||||
|
|
|
|||||||
The tax character of distributions declared and paid in 2011 represented $32,176,536 from ordinary income, and $0 from tax return of capital. Generally accepted accounting principles require adjustments to certain components of net assets to reflect permanent differences between financial and tax reporting. These reclassifications have no affect on net asset value per share. For 2011, the permanent differences between financial and tax reporting were due to non-deductible excise taxes, gains from unscheduled prepayments, prepayment penalty fees, and capital gains incentive fees, resulting in an increase of distributions in excess of investment income of $477,978, an increase of accumulated net realized losses on investments of $636,387, and a decrease of capital in excess of par value of $1,114,365.
On December 22, 2010, the Regulated Investment Company Modernization Act of 2010 (the “Act”) was enacted which changed various technical rules governing the tax treatment of regulated investment companies. The changes are generally effective for taxable years beginning after the date of enactment. Under the Act, the fund will be permitted to carry forward capital losses incurred in taxable years beginning after the date of enactment for an unlimited period. However, any losses incurred during those future taxable years will be required to be utilized prior to the losses incurred in pre-enactment taxable years, which carry an expiration date. As a result of this ordering rule, pre-enactment capital loss carryforwards may be more likely to expire unused. Additionally, post-enactment capital losses that are carried forward will retain their character as either short-term or long-term losses rather than being considered all short-term as under previous law.
The Company has available $55,308,084 of capital losses which can be used to offset future capital gains. If these losses are not utilized, $17,662,375 will expire in 2016, $8,377,450 will expire in 2017, and $29,268,259 will expire in 2018. Under the current law, capital losses related to securities realized after October 31 and prior to the Company’s fiscal year end may be deferred as occurring the first day of the following year. For the fiscal years ended December 31, 2011 and December 31, 2010, the Company had no such capital losses to defer.
As of December 31, 2011, the estimated components of accumulated earnings on a tax basis were as follow:
| Distributable ordinary income |
$ | 273,050 | ||
| Distributable long-term capital gains (capital loss carry forward) |
(55,308,084 | ) | ||
| Unrealized depreciation on investments |
(16,585,306 | ) |
The amounts will be finalized before filing the federal income tax return.
As of December 31, 2010, the components of accumulated earnings on a tax basis were as follow:
| Distributable ordinary income |
$ | 438,119 | ||
| Distributable long-term capital gains (capital loss carry forward) |
(59,545,010 | ) | ||
| Unrealized appreciation on investments |
3,762,465 |
92
Table of Contents
NOTE 12. SELECTED QUARTERLY DATA (UNAUDITED)
| Year Ended December 31, 2011 | ||||||||||||||||
| Quarter Ended December 31, |
Quarter Ended September 30, |
Quarter Ended June 30, |
Quarter Ended March 31, |
|||||||||||||
| Total Investment Income |
$ | 13,208,818 | $ | 11,084,950 | $ | 11,134,297 | $ | 9,760,125 | ||||||||
| Net Investment Income |
8,312,896 | 11,615,785 | 9,523,437 | 548,023 | ||||||||||||
| Net Increase (Decrease) in Net Assets resulting from Operations |
6,859,856 | (8,415,279 | ) | 4,204,646 | 11,559,642 | |||||||||||
| Net Increase in Net Assets resulting from Net Investment Income, per common share, basic and diluted |
$ | 0.25 | $ | 0.36 | $ | 0.29 | $ | 0.02 | ||||||||
| Net Increase (Decrease) in Net Assets resulting from Operations, per common share, basic and diluted |
$ | 0.21 | $ | (0.26 | ) | $ | 0.13 | $ | 0.36 | |||||||
| Year Ended December 31, 2010 | ||||||||||||||||
| Quarter Ended December 31, |
Quarter Ended September 30, |
Quarter Ended June 30, |
Quarter Ended March 31, |
|||||||||||||
| Total Investment Income |
$ | 9,138,830 | $ | 9,081,118 | $ | 8,730,552 | $ | 6,556,091 | ||||||||
| Net Investment Income |
6,676,672 | 6,603,161 | 6,318,488 | 4,645,176 | ||||||||||||
| Net Increase in Net Assets resulting from Operations |
23,918,817 | 12,442,822 | 9,601,956 | 17,983,846 | ||||||||||||
| Net Increase in Net Assets resulting from Net Investment Income, per common share, basic and diluted(1) |
$ | 0.24 | $ | 0.25 | $ | 0.24 | $ | 0.17 | ||||||||
| Net Increase in Net Assets resulting from Operations, per common share, basic and diluted(1) |
$ | 0.84 | $ | 0.46 | $ | 0.36 | $ | 0.67 | ||||||||
| (1) | Aggregate of quarterly earnings per share differs from calculation of annual earnings per share for the year ending December 31, 2010 due to rounding. |
NOTE 13. RISK DISCLOSURES
The U.S. capital markets have experienced periods of extreme volatility and disruption over the past three years. Disruptions in the capital markets tend to increase the spread between the yields realized on risk-free and higher risk securities, resulting in illiquidity in parts of the capital markets. The Company believes these conditions may reoccur in the future. A prolonged period of market illiquidity may have an adverse effect on the Company’s business, financial condition and results of operations. Adverse economic conditions could also increase the Company’s funding costs, limit the Company’s access to the capital markets or result in a decision by lenders not to extend credit to the Company. These events could limit the Company’s investment originations, limit the Company’s ability to grow and negatively impact the Company’s operating results.
Many of the companies in which the Company has made or will make investments may be susceptible to adverse economic conditions, which may affect the ability of a company to repay TICC’s loans or engage in a liquidity event such as a sale, recapitalization, or initial public offering. Therefore, the Company’s nonperforming assets may increase, and the value of the Company’s portfolio may decrease during this period. Adverse economic conditions also may decrease the value of any collateral securing some of the Company’s loans and the value of its equity investments. Adverse economic conditions could lead to financial losses in the Company’s portfolio and a decrease in its revenues, net income, and the value of the Company’s assets.
A portfolio company’s failure to satisfy financial or operating covenants imposed by the Company or other lenders could lead to defaults and, potentially, termination of the portfolio company’s loans and foreclosure on its secured assets, which could trigger cross-defaults under other agreements and jeopardize the portfolio company’s ability to meet its obligations under the debt securities that the Company holds. The Company may incur expenses to the extent necessary to seek recovery upon default or to negotiate new terms with a defaulting portfolio company. In addition, if a portfolio company goes bankrupt, even though the Company may have structured its investment as senior debt or secured debt, depending on the facts and circumstances, including the extent to which the Company actually provided significant “managerial assistance,” if any, to that portfolio company, a bankruptcy court might re-characterize the Company’s debt holding and subordinate all or a portion of the Company’s claim to that of other creditors. These events could harm the Company’s financial condition and operating results.
As a business development company, the Company is required to carry its investments at market value or, if no market value is ascertainable, at fair value as determined in good faith by or under the direction of its Board of Directors. Decreases in the market values or fair values of the Company’s investments are recorded as unrealized depreciation. Depending on market conditions, the Company could incur substantial losses in future periods, which could have a material adverse impact on its business, financial condition and results of operations.
93
Table of Contents
| Item 9. | Changes in and Disagreements with Independent Registered Public Accounting Firm on Accounting and Financial Disclosure |
There were no changes in or disagreements on accounting or financial disclosure with PricewaterhouseCoopers LLP, the Company’s independent registered public accounting firm, during the fiscal year ended December 31, 2011.
| Item 9A. | Controls and Procedures. |
(a) Evaluation of Disclosure Controls and Procedures
As of December 31, 2011 (the end of the period covered by this report), we, including our Chief Executive Officer and Chief Financial Officer, evaluated the effectiveness of the design and operation of our disclosure controls and procedures (as defined in Rule 13a-15(e) of the 1934 Act). Based on that evaluation, our management, including our Chief Executive Officer and Chief Financial Officer, concluded that our disclosure controls and procedures were effective and provided reasonable assurance that information required to be disclosed in our periodic SEC filings is recorded, processed, summarized and reported within the time periods specified in the SEC’s rules and forms, and that such information is accumulated and communicated to our management, including our Chief Executive Officer and Chief Financial Officer, as appropriate, to allow timely decisions regarding required disclosure. However, in evaluating the disclosure controls and procedures, management recognized that any controls and procedures, no matter how well designed and operated can provide only reasonable assurance of achieving the desired control objectives, and management necessarily was required to apply its judgment in evaluating the cost-benefit relationship of possible controls and procedures.
(b) Management’s Report on Internal Control Over Financial Reporting
Management is responsible for establishing and maintaining adequate internal control over financial reporting, as such term is defined in Rule 13a-15(f) under the Securities Exchange Act of 1934 and for the assessment of the effectiveness of internal control over financial reporting. Management’s Report on Internal Control Over Financial Reporting, which appears on page 66 of this Form 10-K, is incorporated by reference herein.
(c) Attestation Report of the Registered Public Accounting Firm
PricewaterhouseCoopers LLP, the Company’s independent registered public accounting firm, has issued an attestation report on the effectiveness of the Company’s internal control over financial reporting, which appears on page 67 of this Form 10-K.
(d) Changes in Internal Control Over Financial Reporting
Management did not identify any change in the Company’s internal control over financial reporting that occurred during the fourth quarter of 2011 that has materially affected, or is reasonably likely to materially affect, the Company’s internal control over financial reporting.
| Item 9B. | Other Information. |
Not applicable.
94
Table of Contents
We will file a definitive Proxy Statement for our 2012 Annual Meeting of Stockholders with the SEC, pursuant to Regulation 14A, not later than 120 days after the end of our fiscal year. Accordingly, certain information required by Part III has been omitted under General Instruction G(3) to Form 10-K. Only those sections of our definitive Proxy Statement that specifically address the items set forth herein are incorporated by reference.
Item 10. Directors, Executive Officers and Corporate Governance
The information required by Item 10 is hereby incorporated by reference from the Company’s definitive Proxy Statement relating to the Company’s 2012 Annual Meeting of Stockholders, to be filed with the Securities and Exchange Commission within 120 days following the end of the Company’s fiscal year.
Item 11. Executive Compensation
The information required by Item 11 is hereby incorporated by reference from the Company’s definitive Proxy Statement relating to the Company’s 2012 Annual Meeting of Stockholders, to be filed with the Securities and Exchange Commission within 120 days following the end of the Company’s fiscal year.
Item 12. Security Ownership of Certain Beneficial Owners and Management and Related Stockholder Matters
The information required by Item 12 is hereby incorporated by reference from the Company’s definitive Proxy Statement relating to the Company’s 2012 Annual Meeting of Stockholders, to be filed with the Securities and Exchange Commission within 120 days following the end of the Company’s fiscal year.
Item 13. Certain Relationships and Related Transactions, and Director Independence
The information required by Item 13 is hereby incorporated by reference from the Company’s definitive Proxy Statement relating to the Company’s 2012 Annual Meeting of Stockholders, to be filed with the Securities and Exchange Commission within 120 days following the end of the Company’s fiscal year.
Item 14. Principal Accountant Fees and Services
The information required by Item 14 is hereby incorporated by reference from the Company’s definitive Proxy Statement relating to the Company’s 2012 Annual Meeting of Stockholders, to be filed with the Securities and Exchange Commission within 120 days following the end of the Company’s fiscal year.
95
Table of Contents
| Item 15. | Exhibits, Financial Statement Schedules |
a. Documents Filed as Part of this Report
The following consolidated financial statements are set forth in Item 8:
96
Table of Contents
b. Exhibits
The following exhibits are filed as part of this report or hereby incorporated by reference to exhibits previously filed with the SEC:
| 3.1 | Articles of Incorporation (Incorporated by reference to the Registrant’s Registration Statement on Form N-2 (File No. 333-109055), filed on September 23, 2003). | |
| 3.2 | Articles of Amendment (Incorporated by reference to Current Report on Form 8-K (File No. 814-00638) filed December 3, 2007). | |
| 3.3 | Amended and Restated Bylaws (Incorporated by reference to Pre-Effective Amendment No. 2 to the Registrant’s Registration Statement on Form N-2 (File No. 333-109055), filed on November 19, 2003). | |
| 4.1 | Form of Share Certificate (Incorporated by reference to the Registrant’s Registration Statement on Form N-2 (File No. 333-109055), filed on September 23, 2003). | |
| 10.1 | Investment Advisory Agreement between Registrant and TICC Management, LLC (Incorporated by reference to Exhibit 10.1 to the Registrant’s report on Form 8-K filed on July 1, 2011). | |
| 10.2 | Custodian Agreement between Registrant and State Street Bank and Trust Company (Incorporated by reference to Pre-Effective Amendment No. 2 to the Registrant’s Registration Statement on Form N-2 (File No. 333-109055), filed on November 19, 2003). | |
| 10.3 | Administration Agreement between Registrant and BDC Partners, LLC (Incorporated by reference to Pre-Effective Amendment No. 2 to the Registrant’s Registration Statement on Form N-2 (File No. 333-109055), filed on November 19, 2003). | |
| 10.4 | Dividend Reinvestment Plan (Incorporated by reference to Pre-Effective Amendment No. 1 to the Registrant’s Registration Statement on Form N-2 (File No. 333-109055), filed on November 6, 2003). | |
| 10.5 | Purchase Agreement by and among the Registrant, TICC Capital Corp. 2011-1 Holdings, LLC, TICC CLO LLC and Guggenheim Securities, LLC (Incorporated by reference to Exhibit 10.1 to the Registrant’s report on Form 8-K filed on August 11, 2011). | |
| 10.6 | Master Loan Sale Agreement by and among the Registrant, TICC Capital Corp. 2011-1 Holdings, LLC and TICC CLO LLC (Incorporated by reference to Exhibit 10.2 to the Registrant’s report on Form 8-K filed on August 11, 2011). | |
| 10.7 | Indenture by and between TICC CLO LLC and The Bank of New York Mellon Trust Company, National Association (Incorporated by reference to Exhibit 10.3 to the Registrant’s report on Form 8-K filed on August 11, 2011). | |
| 10.8 | Collateral Management Agreement by and between TICC CLO LLC and the Registrant (Incorporated by reference to Exhibit 10.4 to the Registrant’s report on Form 8-K filed on August 11, 2011). | |
| 10.9 | Collateral Administration Agreement by and among TICC CLO LLC, the Registrant and The Bank of New York Mellon Trust Company, National Association (Incorporated by reference to Exhibit 10.5 to the Registrant’s report on Form 8-K filed on August 11, 2011). | |
| 11 | Computation of Per Share Earnings (included in the notes to the audited consolidated financial statements contained in this report). | |
| 31.1* | Certification of Chief Executive Officer pursuant to Rule 13a-14 of the Securities Exchange Act of 1934, as amended. | |
| 31.2* | Certification of Chief Financial Officer pursuant to Rule 13a-14 of the Securities Exchange Act of 1934, as amended. | |
| 32.1* | Certification of Chief Executive Officer pursuant to Section 906 of The Sarbanes-Oxley Act of 2002. | |
| 32.2* | Certification of Chief Financial Officer pursuant to Section 906 of The Sarbanes-Oxley Act of 2002. | |
| * | Filed herewith. |
97
Table of Contents
c. Financial statement schedules
No financial statement schedules are filed herewith because (1) such schedules are not required or (2) the information has been presented in the aforementioned consolidated financial statements.
98
Table of Contents
Pursuant to the requirements of Section 13 or 15(d) of the Securities Exchange Act of 1934, the registrant has duly caused this report to be signed on its behalf by the undersigned, thereunto duly authorized.
| Date: March 15, 2012 | TICC CAPITAL CORP. | |||||
| /S/ JONATHAN H. COHEN | ||||||
| Jonathan H. Cohen | ||||||
| Chief Executive Officer | ||||||
Pursuant to the requirements of the Securities Exchange Act of 1934, this report has been signed below by the following persons on behalf of the registrant and in the capacity and on the dates indicated.
| Date: March 15, 2012 | /S/ CHARLES M. ROYCE | |
| Charles M. Royce Chairman of the Board of Directors | ||
| Date: March 15, 2012 | /S/ JONATHAN H. COHEN | |
| Jonathan H. Cohen Chief Executive Officer and Director (Principal Executive Officer) | ||
| Date: March 15, 2012 | /S/ PATRICK F. CONROY | |
| Patrick F. Conroy Chief Financial Officer, Chief Compliance Officer and Secretary (Principal Accounting and Financial Officer) | ||
| Date: March 15, 2012 | /S/ STEVEN P. NOVAK | |
| Steven P. Novak Director | ||
| Date: March 15, 2012 | /S/ G. PETER O’BRIEN | |
| G. Peter O’Brien Director | ||
| Date: March 15, 2012 | /S/ TONIA L. PANKOPF | |
| Tonia L. Pankopf Director | ||
99