Attached files
| file | filename |
|---|---|
| 8-K - 8-K - AIkido Pharma Inc. | a12-7248_18k.htm |
Exhibit 99.1
Exhibit 99.1: Spherix Incorporated Presentation, “Measurement of Lipoproteins in Treatment with SPX-106,” March 15, 2012
|
|
Measurement of Lipoproteins in Treatment with SPX-106 Claire Kruger, Ph.D., Dietrich Conze, Ph.D., Brittney Metts1, Robert Lodder, Ph.D. 1. University of Kentucky |
|
|
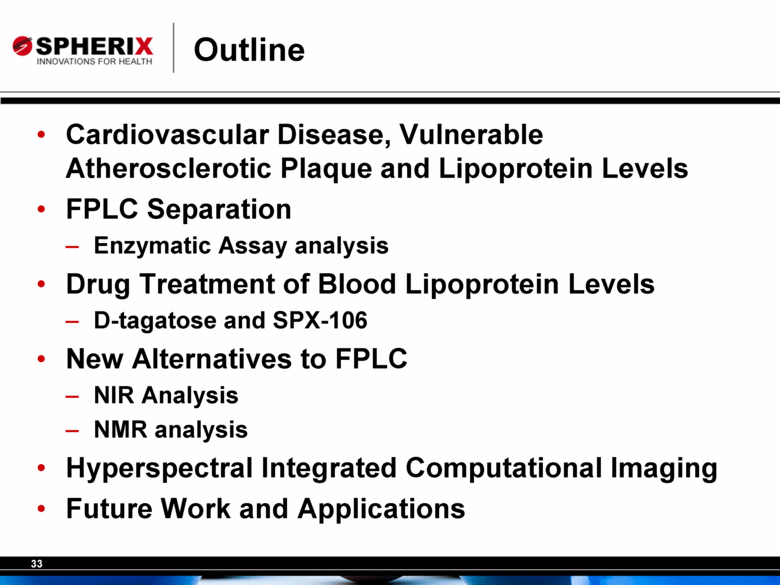
Outline Cardiovascular Disease, Vulnerable Atherosclerotic Plaque and Lipoprotein Levels FPLC Separation Enzymatic Assay analysis Drug Treatment of Blood Lipoprotein Levels D-tagatose and SPX-106 New Alternatives to FPLC NIR Analysis NMR analysis Hyperspectral Integrated Computational Imaging Future Work and Applications |
|
|
Cardiovascular Disease Epidemic Atherosclerotic cardiovascular disease results in >19 million deaths annually A large number of victims who are apparently healthy die suddenly without prior symptoms Available screening and diagnostic methods, as well as therapies, have been insufficient to identify the victims and intervene in the process before the event occurs. |
|
|
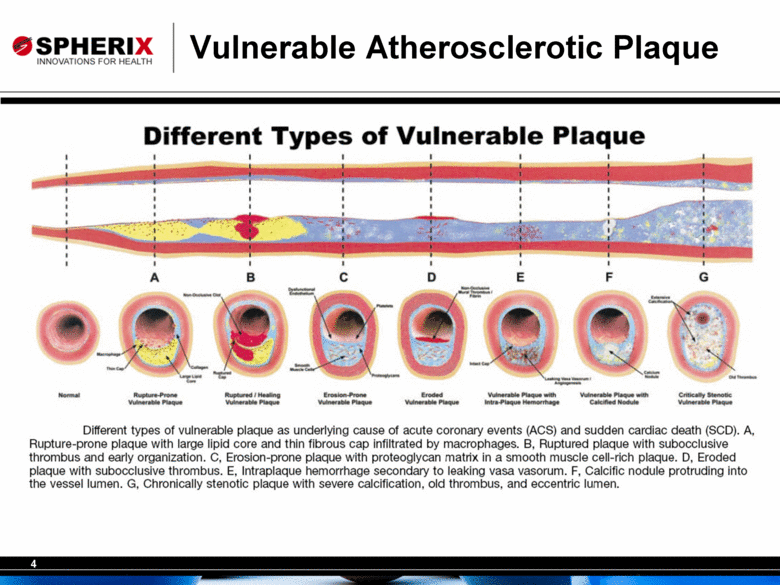
Vulnerable Atherosclerotic Plaque Different Types of Vulnerable Plaque Different types of vulnerable plaque as underlying cause of acute coronary events (ACS) and sudden cardiac death (SCD). A, Rupture-prone plaque with large lipid core and thin fibrous cap infiltrated by macrophages. B, Ruptured plaque with subocclusive thrombus and early organization. C, Erosion-prone plaque with proteoglycan matrix in a smooth muscle cell-rich plaque. D, Eroded plaque with subocclusive thrombus. E, Intraplaque hemorrhage secondary to leaking vasa vasorum. F, Calcific nodule protruding into the vessel lumen. G, Chronically stenotic plaque with severe calcification, old thrombus, and eccentric lumen. |
|
|
Lipoprotein Levels: The Breakdown Type of Lipoprotein Normal Level (mg/dL) Borderline High Level (mg/dL) High Level (mg/dL) Very-Low Density Lipoprotein (VLDL) 5-40 >40 Low Density Lipoprotein (LDL) <100 (optimal) 100-129 (near optimal) 130-159 >159 High Density Lipoprotein (HDL) >60 (best) 50-59 (better) <50 (poor) Total Cholesterol <200 201-249 >249 Triglycerides <150 150-199 >199 |
|
|
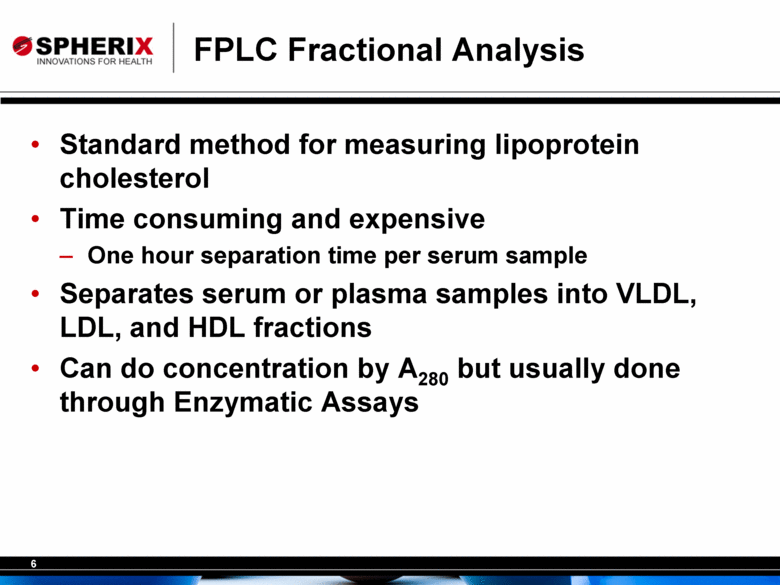
FPLC Fractional Analysis Standard method for measuring lipoprotein cholesterol Time consuming and expensive One hour separation time per serum sample Separates serum or plasma samples into VLDL, LDL, and HDL fractions Can do concentration by A280 but usually done through Enzymatic Assays |
|
|
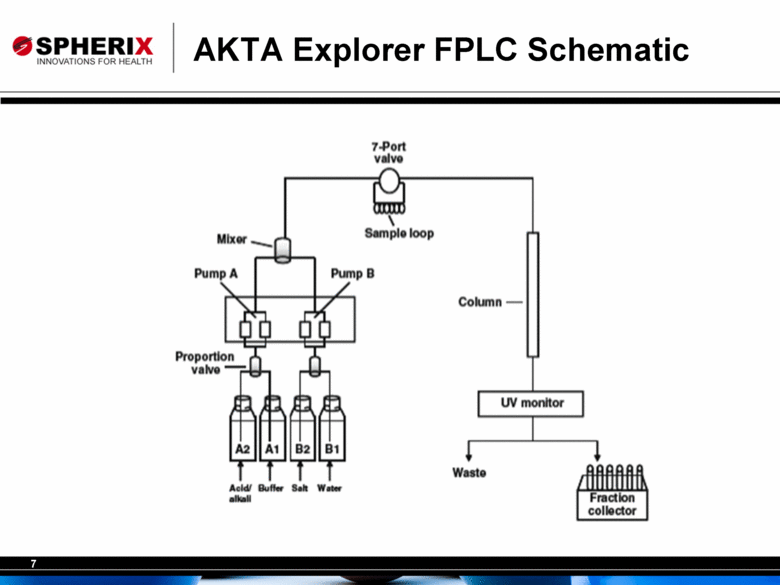
AKTA Explorer FPLC Schematic |
|
|
Fast Protein Liquid Chromatography Differs slightly from HPLC Operates at much lower pressure 40 atm vs 400 atm Used mainly in the separation of biomolecules from complex matrices |
|
|
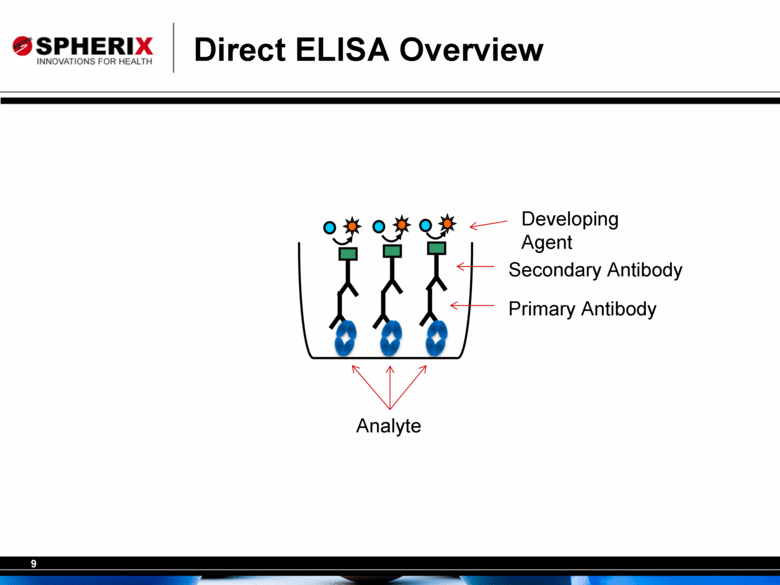
Direct ELISA Overview Analyte Secondary Antibody Primary Antibody Developing Agent |
|
|
Wako Lipoprotein Enzymatic Assay Normal lipoprotein levels require 20 µL of serum to measure total lipoproteins Individual lipoprotein measures require greater volumes from FPLC dilution Assay takes ~1 hour to run between making standards and allowing serum samples to thaw Dynamic range of kit only goes to 1000 mg/dL Hyperlipidemic mouse models can exceed this value1 Dilute and hope the values are on scales 1The Jackson Laboratory |
|
|
Outline Cardiovascular Disease, Vulnerable Atherosclerotic Plaque and Lipoprotein Levels FPLC Separation Enzymatic Assay analysis Drug Treatment of Blood Lipoprotein Levels D-tagatose and SPX-106 New Alternatives to FPLC NIR Analysis NMR analysis Hyperspectral Integrated Computational Imaging Future Work and Applications |
|
|
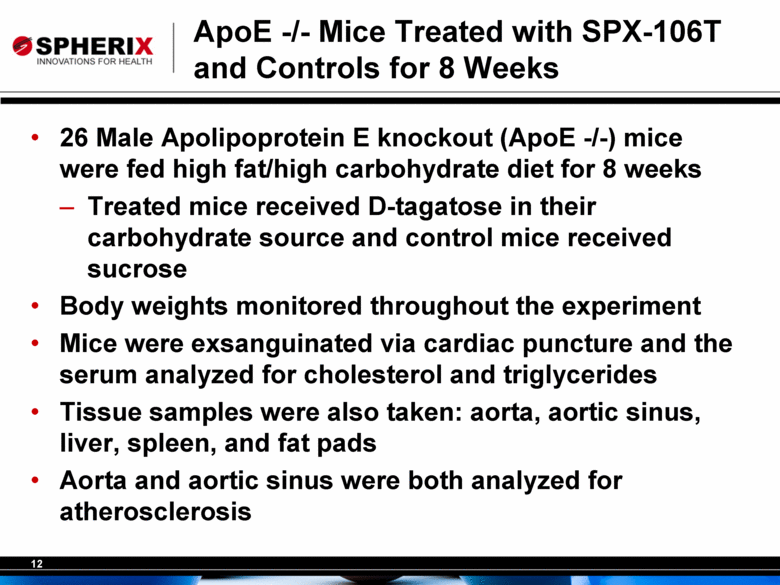
ApoE -/- Mice Treated with SPX-106T and Controls for 8 Weeks 26 Male Apolipoprotein E knockout (ApoE -/-) mice were fed high fat/high carbohydrate diet for 8 weeks Treated mice received D-tagatose in their carbohydrate source and control mice received sucrose Body weights monitored throughout the experiment Mice were exsanguinated via cardiac puncture and the serum analyzed for cholesterol and triglycerides Tissue samples were also taken: aorta, aortic sinus, liver, spleen, and fat pads Aorta and aortic sinus were both analyzed for atherosclerosis |
|
|
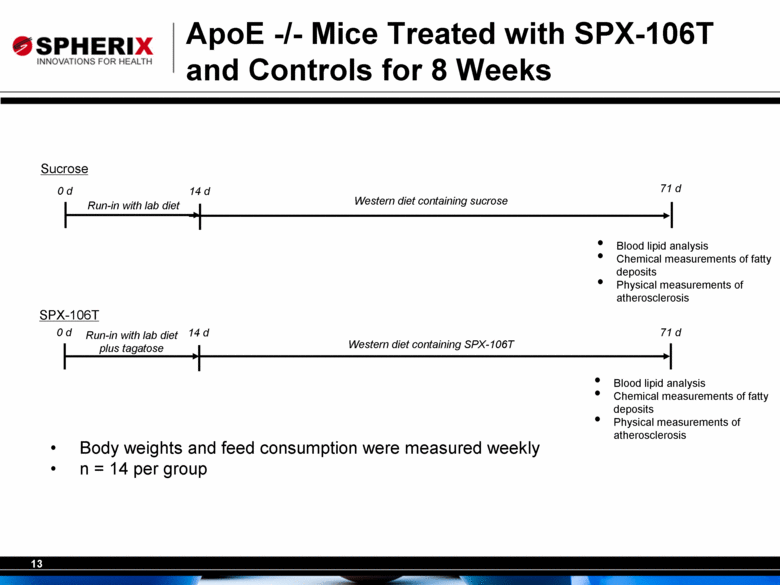
0 d 14 d 71 d 0 d 14 d Sucrose SPX-106T Western diet containing sucrose Body weights and feed consumption were measured weekly n = 14 per group Western diet containing SPX-106T 71 d Blood lipid analysis Chemical measurements of fatty deposits Physical measurements of atherosclerosis ApoE -/- Mice Treated with SPX-106T and Controls for 8 Weeks Run-in with lab diet Blood lipid analysis Chemical measurements of fatty deposits Physical measurements of atherosclerosis Run-in with lab diet plus tagatose |
|
|
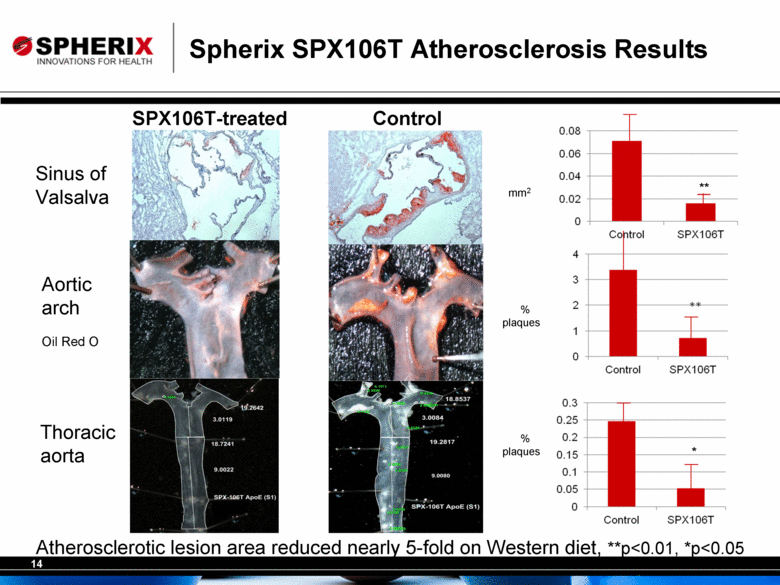
Spherix SPX106T Atherosclerosis Results Atherosclerotic lesion area reduced nearly 5-fold on Western diet, **p<0.01, *p<0.05 SPX106T-treated Control Sinus of Valsalva Aortic arch Thoracic aorta Oil Red O mm2 % plaques % plaques ** * ** |
|
|
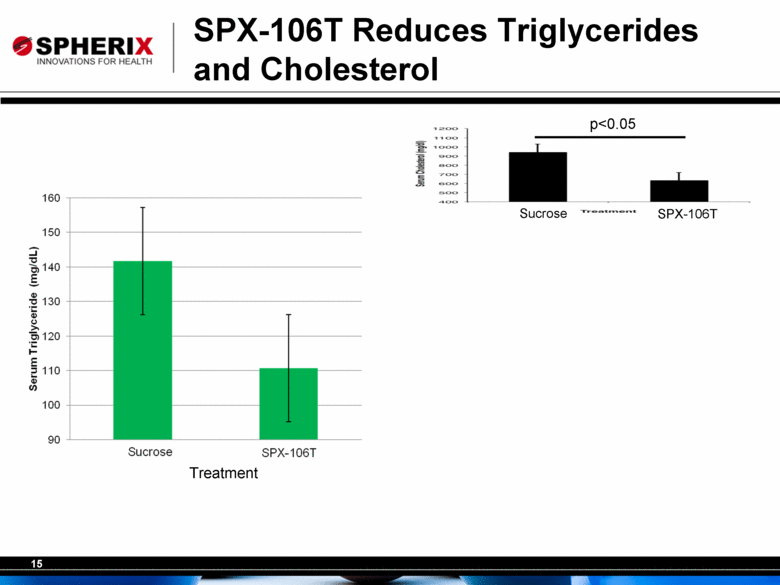
SPX-106T Reduces Triglycerides and Cholesterol p<0.05 Sucrose SPX-106T Treatment |
|
|
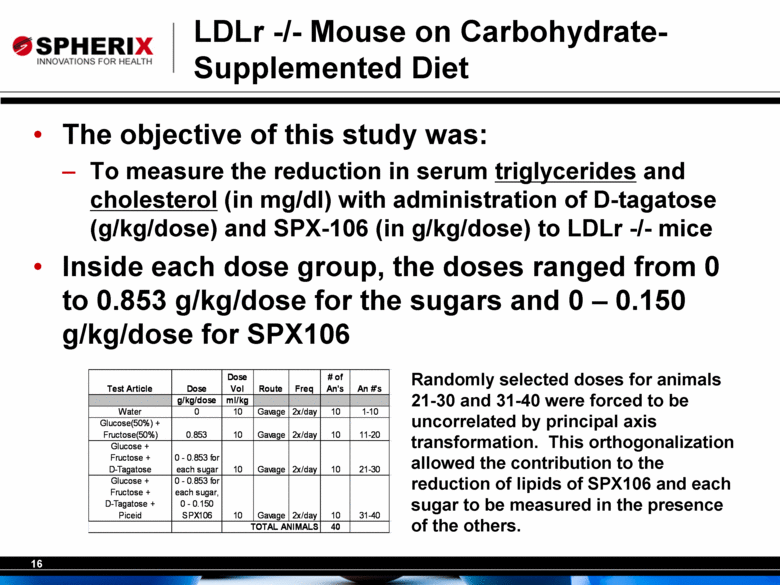
LDLr -/- Mouse on Carbohydrate-Supplemented Diet The objective of this study was: To measure the reduction in serum triglycerides and cholesterol (in mg/dl) with administration of D-tagatose (g/kg/dose) and SPX-106 (in g/kg/dose) to LDLr -/- mice Inside each dose group, the doses ranged from 0 to 0.853 g/kg/dose for the sugars and 0 – 0.150 g/kg/dose for SPX106 Randomly selected doses for animals 21-30 and 31-40 were forced to be uncorrelated by principal axis transformation. This orthogonalization allowed the contribution to the reduction of lipids of SPX106 and each sugar to be measured in the presence of the others. 0 - 0.853 for each sugar, 0 - 0.150 SPX106 Test Article Dose Dose Vol Route Freq # of An’s An #’s g/kg/dose ml/kg Water 0 10 Gavage 2x/day 10 1-10 Glucose(50%) + Fructose(50%) 0.853 10 Gavage 2x/day 10 11-20 Glucose + Fructose + D-Tagatose 0 - 0.853 for each sugar 10 Gavage 2x/day 10 21-30 Glucose + Fructose + D-Tagatose + Piceid 10 Gavage 2x/day 10 31-40 TOTAL ANIMALS 40 |
|
|
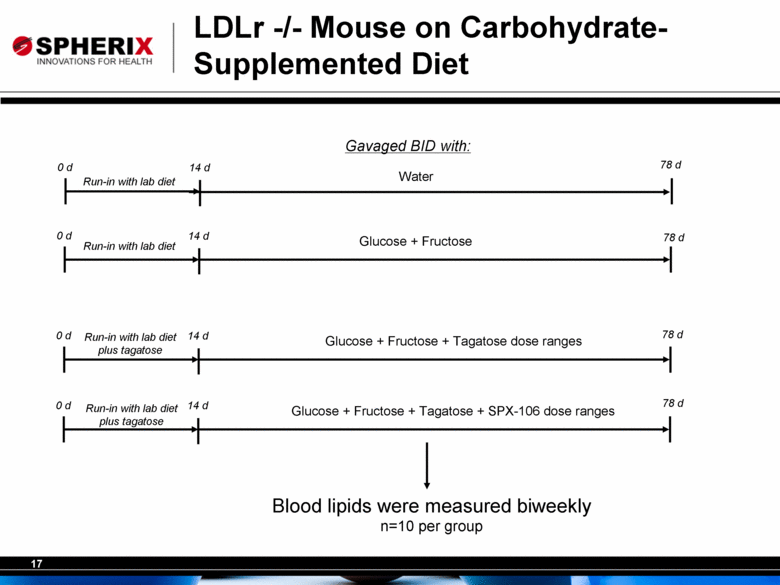
0 d 14 d 0 d 14 d Water Glucose + Fructose 78 d 0 d 14 d Run-in with lab diet plus tagatose 0 d 14 d Glucose + Fructose + Tagatose dose ranges Glucose + Fructose + Tagatose + SPX-106 dose ranges Gavaged BID with: Blood lipids were measured biweekly n=10 per group LDLr -/- Mouse on Carbohydrate-Supplemented Diet Run-in with lab diet Run-in with lab diet Run-in with lab diet plus tagatose 78 d 78 d 78 d |
|
|
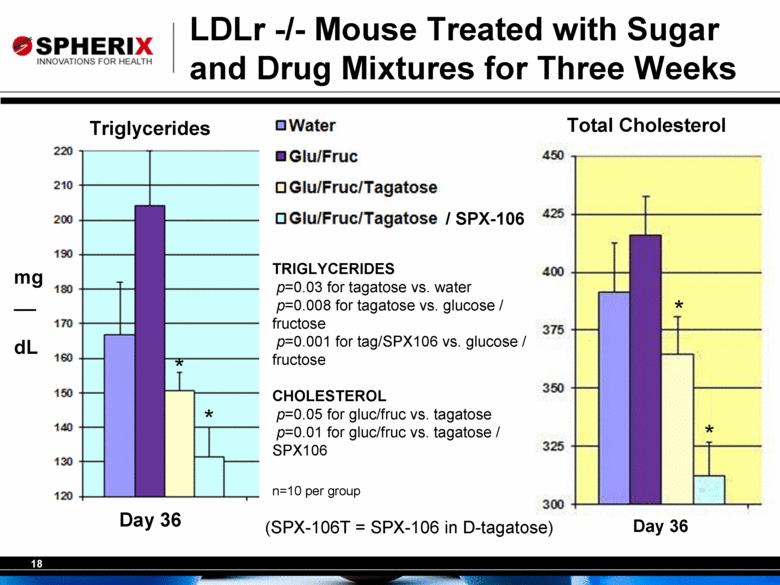
/ SPX-106 Total Cholesterol LDLr -/- Mouse Treated with Sugar and Drug Mixtures for Three Weeks mg dL Day 36 TRIGLYCERIDES p=0.03 for tagatose vs. water p=0.008 for tagatose vs. glucose / fructose p=0.001 for tag/SPX106 vs. glucose / fructose CHOLESTEROL p=0.05 for gluc/fruc vs. tagatose p=0.01 for gluc/fruc vs. tagatose / SPX106 n=10 per group Triglycerides Day 36 * * * * (SPX-106T = SPX-106 in D-tagatose) Water Glu/Fruc Glu/Fruc/Tagatose Glu/Fruc/Tagatose |
|
|
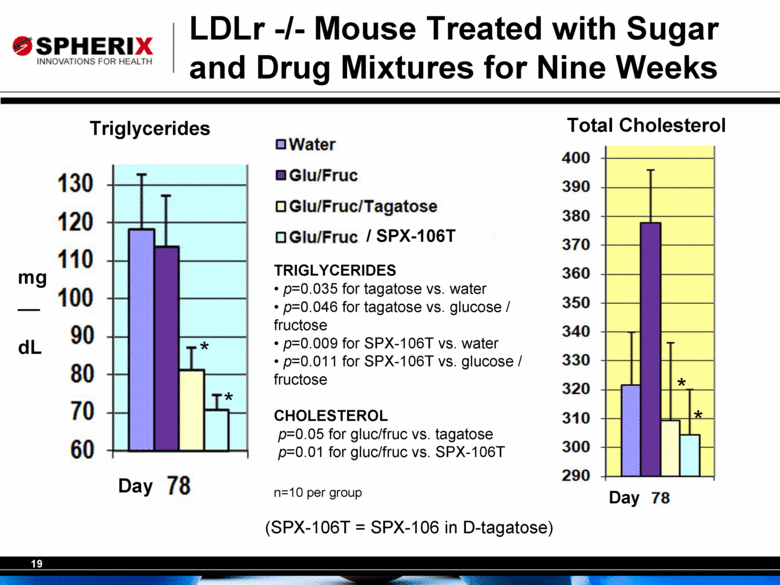
/ SPX-106T Triglycerides Total Cholesterol LDLr -/- Mouse Treated with Sugar and Drug Mixtures for Nine Weeks mg dL Day Day TRIGLYCERIDES p=0.035 for tagatose vs. water p=0.046 for tagatose vs. glucose / fructose p=0.009 for SPX-106T vs. water p=0.011 for SPX-106T vs. glucose / fructose CHOLESTEROL p=0.05 for gluc/fruc vs. tagatose p=0.01 for gluc/fruc vs. SPX-106T n=10 per group * * * * (SPX-106T = SPX-106 in D-tagatose) Water Glu/Fruc Glu/Fruc/Tagatose Glu/Fruc 78 78 |
|
|
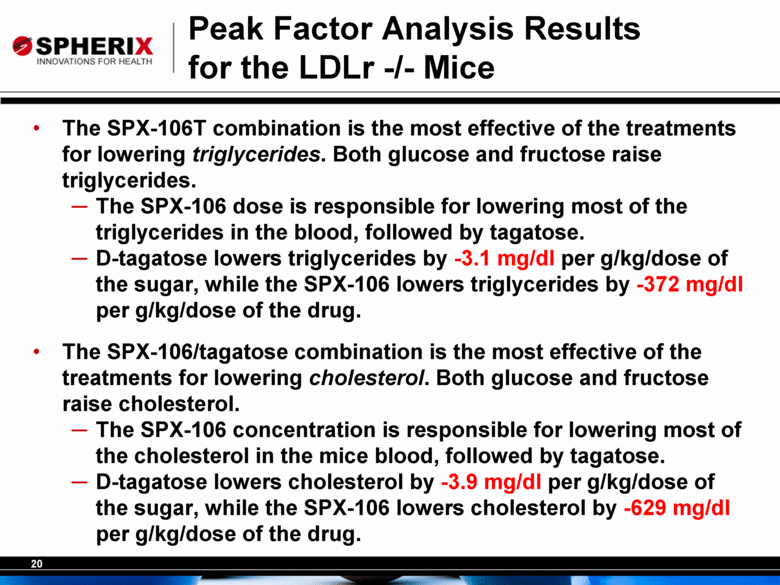
The SPX-106T combination is the most effective of the treatments for lowering triglycerides. Both glucose and fructose raise triglycerides. The SPX-106 dose is responsible for lowering most of the triglycerides in the blood, followed by tagatose. D-tagatose lowers triglycerides by -3.1 mg/dl per g/kg/dose of the sugar, while the SPX-106 lowers triglycerides by -372 mg/dl per g/kg/dose of the drug. The SPX-106/tagatose combination is the most effective of the treatments for lowering cholesterol. Both glucose and fructose raise cholesterol. The SPX-106 concentration is responsible for lowering most of the cholesterol in the mice blood, followed by tagatose. D-tagatose lowers cholesterol by -3.9 mg/dl per g/kg/dose of the sugar, while the SPX-106 lowers cholesterol by -629 mg/dl per g/kg/dose of the drug. Peak Factor Analysis Results for the LDLr -/- Mice |
|
|
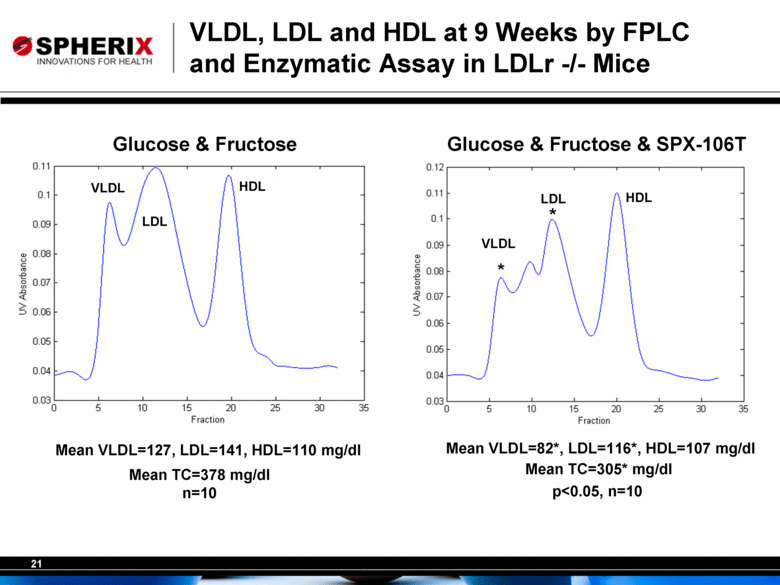
VLDL, LDL and HDL at 9 Weeks by FPLC and Enzymatic Assay in LDLr -/- Mice Glucose & Fructose Glucose & Fructose & SPX-106T Mean VLDL=127, LDL=141, HDL=110 mg/dl Mean VLDL=82*, LDL=116*, HDL=107 mg/dl VLDL LDL HDL VLDL LDL HDL Mean TC=378 mg/dl n=10 Mean TC=305* mg/dl p<0.05, n=10 * * |
|
|
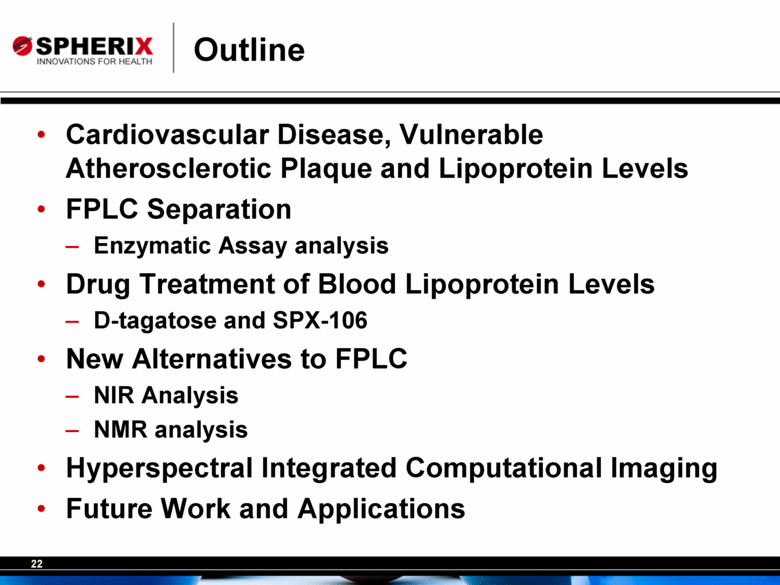
Outline Cardiovascular Disease, Vulnerable Atherosclerotic Plaque and Lipoprotein Levels FPLC Separation Enzymatic Assay analysis Drug Treatment of Blood Lipoprotein Levels D-tagatose and SPX-106 New Alternatives to FPLC NIR Analysis NMR analysis Hyperspectral Integrated Computational Imaging Future Work and Applications |
|
|
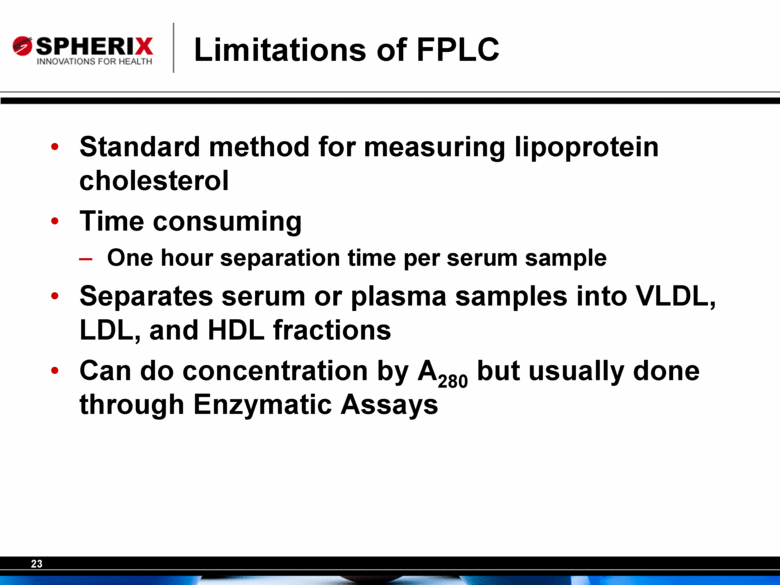
Limitations of FPLC Standard method for measuring lipoprotein cholesterol Time consuming One hour separation time per serum sample Separates serum or plasma samples into VLDL, LDL, and HDL fractions Can do concentration by A280 but usually done through Enzymatic Assays |
|
|
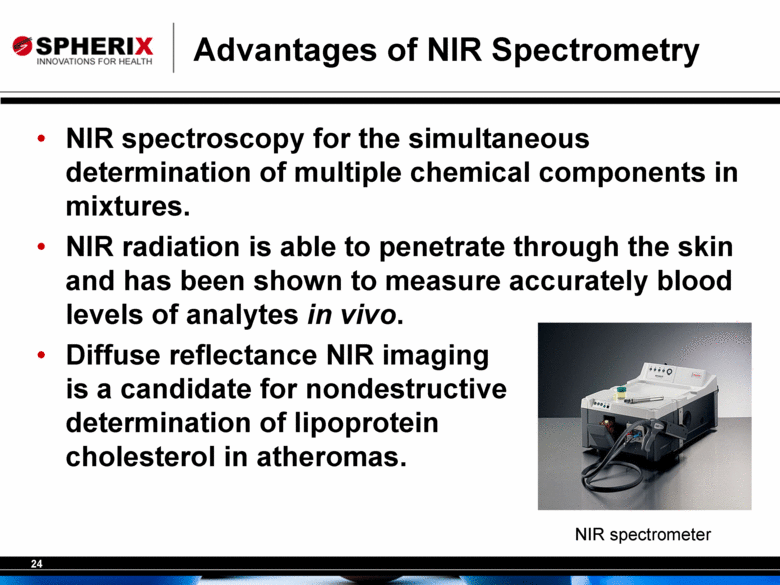
Advantages of NIR Spectrometry NIR spectroscopy for the simultaneous determination of multiple chemical components in mixtures. NIR radiation is able to penetrate through the skin and has been shown to measure accurately blood levels of analytes in vivo. Diffuse reflectance NIR imaging is a candidate for nondestructive determination of lipoprotein cholesterol in atheromas. NIR spectrometer |
|
|
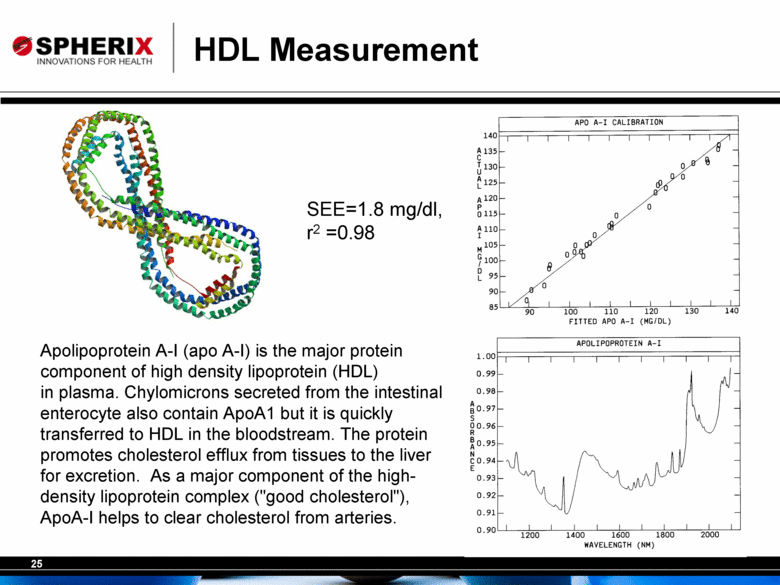
HDL Measurement Apolipoprotein A-I (apo A-I) is the major protein component of high density lipoprotein (HDL) in plasma. Chylomicrons secreted from the intestinal enterocyte also contain ApoA1 but it is quickly transferred to HDL in the bloodstream. The protein promotes cholesterol efflux from tissues to the liver for excretion. As a major component of the high-density lipoprotein complex ("good cholesterol"), ApoA-I helps to clear cholesterol from arteries. SEE=1.8 mg/dl, r2 =0.98 |
|
|
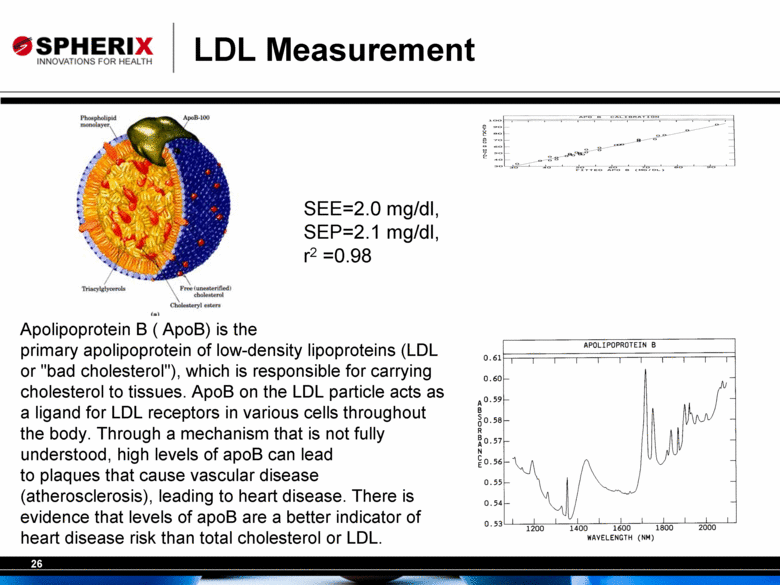
LDL Measurement Apolipoprotein B ( ApoB) is the primary apolipoprotein of low-density lipoproteins (LDL or "bad cholesterol"), which is responsible for carrying cholesterol to tissues. ApoB on the LDL particle acts as a ligand for LDL receptors in various cells throughout the body. Through a mechanism that is not fully understood, high levels of apoB can lead to plaques that cause vascular disease (atherosclerosis), leading to heart disease. There is evidence that levels of apoB are a better indicator of heart disease risk than total cholesterol or LDL. SEE=2.0 mg/dl, SEP=2.1 mg/dl, r2 =0.98 |
|
|
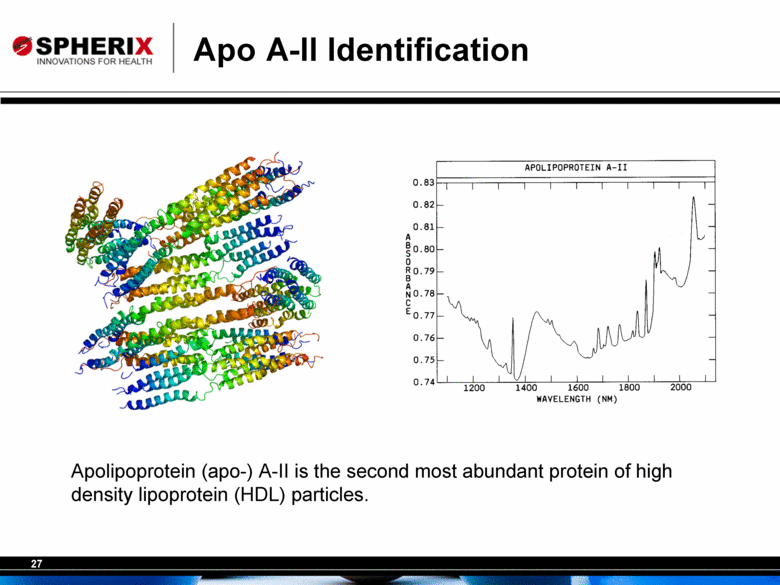
Apo A-II Identification Apolipoprotein (apo-) A-II is the second most abundant protein of high density lipoprotein (HDL) particles. |
|
|
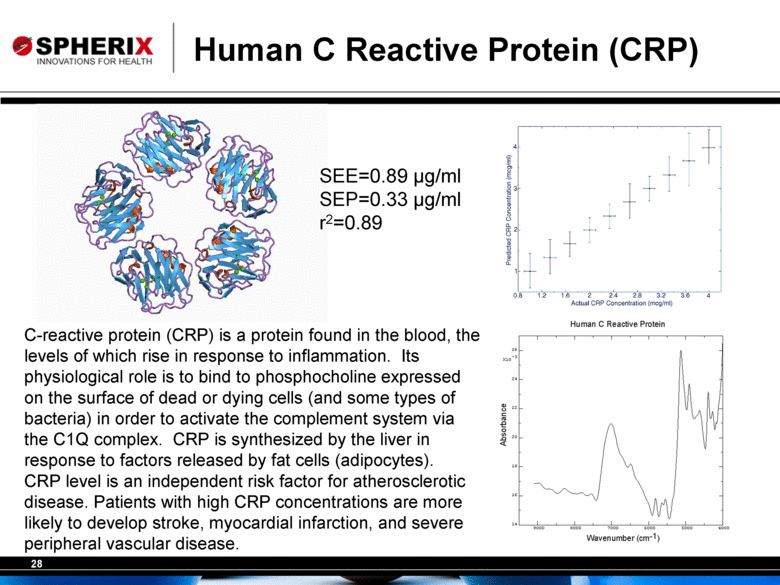
Human C Reactive Protein (CRP) C-reactive protein (CRP) is a protein found in the blood, the levels of which rise in response to inflammation. Its physiological role is to bind to phosphocholine expressed on the surface of dead or dying cells (and some types of bacteria) in order to activate the complement system via the C1Q complex. CRP is synthesized by the liver in response to factors released by fat cells (adipocytes). CRP level is an independent risk factor for atherosclerotic disease. Patients with high CRP concentrations are more likely to develop stroke, myocardial infarction, and severe peripheral vascular disease. SEE=0.89 µg/ml SEP=0.33 µg/ml r2=0.89 |
|
|
Outline Cardiovascular Disease, Vulnerable Atherosclerotic Plaque and Lipoprotein Levels FPLC Separation Enzymatic Assay analysis Drug Treatment of Blood Lipoprotein Levels D-tagatose and SPX-106 New Alternatives to FPLC NIR Analysis NMR analysis Hyperspectral Integrated Computational Imaging Future Work and Applications |
|
|
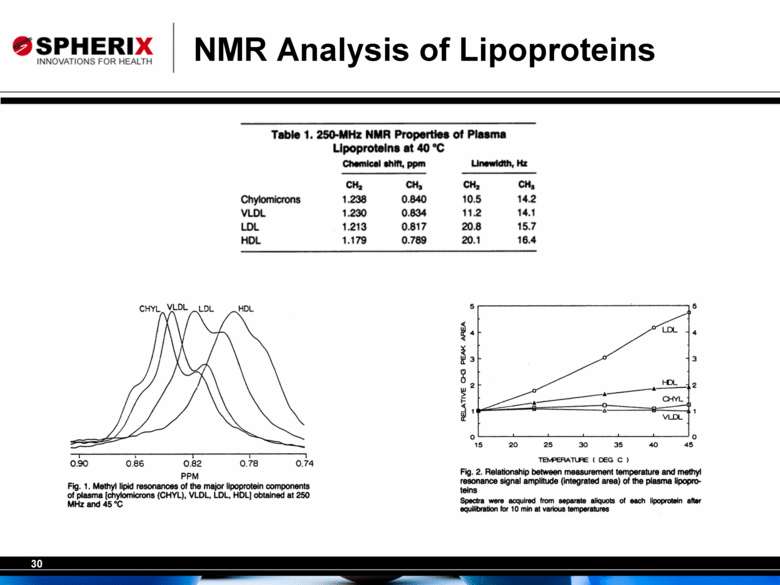
NMR Analysis of Lipoproteins |
|
|
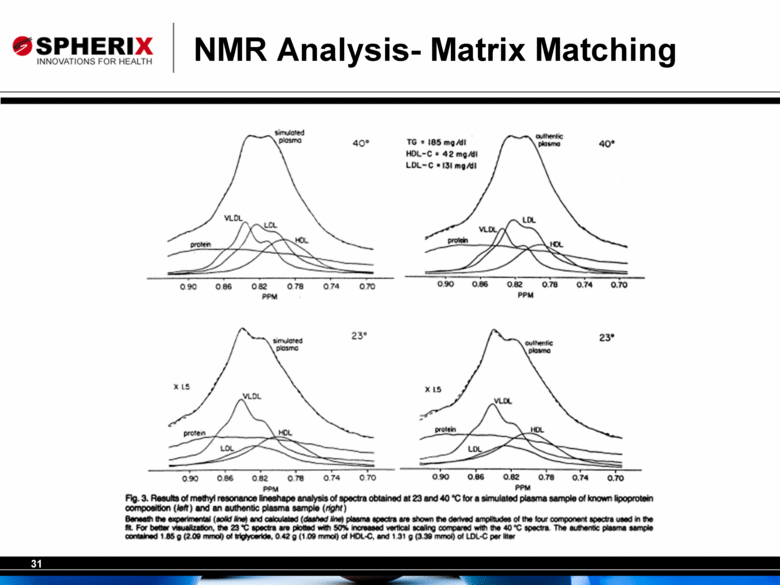
NMR Analysis- Matrix Matching |
|
|
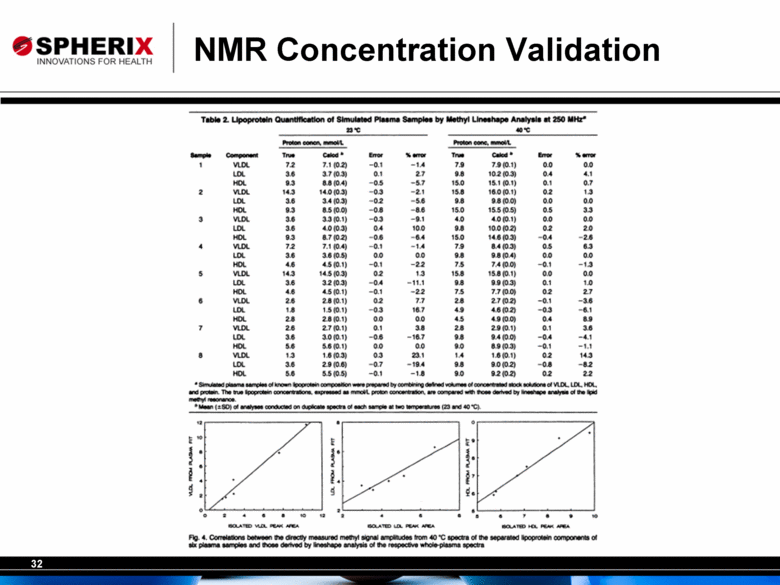
NMR Concentration Validation |
|
|
Outline Cardiovascular Disease, Vulnerable Atherosclerotic Plaque and Lipoprotein Levels FPLC Separation Enzymatic Assay analysis Drug Treatment of Blood Lipoprotein Levels D-tagatose and SPX-106 New Alternatives to FPLC NIR Analysis NMR analysis Hyperspectral Integrated Computational Imaging Future Work and Applications |
|
|
Molecular Factor Computing Based Spectroscopy Principal Component Analysis Molecular Factor Loadings The mathematical loadings are divided into positive and negative values for implementation in molecular filters. |
|
|
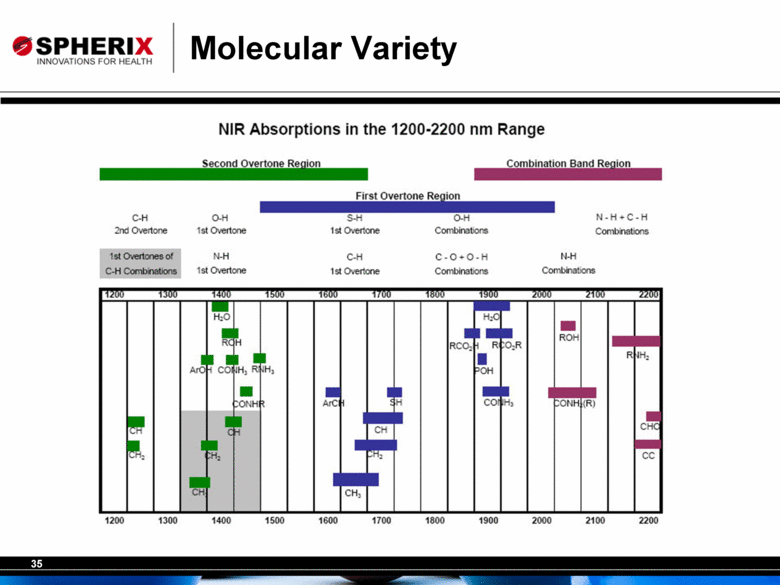
Molecular Variety |
|
|
Questions? 36 |

