Attached files
| file | filename |
|---|---|
| EX-32.1 - EX-32.1 - NiMin Energy Corp. | d314973dex321.htm |
| EX-23.1 - EX-23.1 - NiMin Energy Corp. | d314973dex231.htm |
| EX-99.1 - EX-99.1 - NiMin Energy Corp. | d314973dex991.htm |
| EX-31.1 - EX-31.1 - NiMin Energy Corp. | d314973dex311.htm |
| EX-31.2 - EX-31.2 - NiMin Energy Corp. | d314973dex312.htm |
Table of Contents
UNITED STATES
SECURITIES AND EXCHANGE COMMISSION
Washington, D.C. 20549
FORM 10-K
ANNUAL REPORT PURSUANT TO SECTION 13 OR 15(d) OF THE
SECURITIES EXCHANGE ACT OF 1934
For the fiscal year ended December 31, 2011
Commission file number: 000-54162

(Exact name of registrant as specified in its charter)
| Canada | 61-1606563 | |
| (State or other jurisdiction of incorporation or organization) | (I.R.S. Employer Identification No.) | |
| 1160 Eugenia Place, Suite 100, Carpinteria, California USA 93013 |
Tel: 805.566.2900 Fax: 805.566.2917 | |
| (Address of principal executive offices) | (Registrant’s telephone number, including area code) | |
Securities registered or to be registered pursuant to Section 12(b) of the Act.
| Title of each class |
Name of each exchange on which registered | |
| N/A | N/A |
Securities registered or to be registered pursuant to Section 12(g) of the Act.
| Title of each class |
| Common Shares, no par value |
Indicate by check mark if the registrant is a well-known seasoned issuer, as defined in Rule 405 of the Securities Act. Yes ¨ No x
Indicate by check mark if the registrant is not required to file reports pursuant to Section 13 or 15(d) of the Securities Exchange Act of 1934. Yes ¨ No x
Indicate by check mark whether the registrant (1) has filed all reports required to be filed by Section 13 or 15(d) of the Securities Exchange Act of 1934 during the preceding 12 months (or for such shorter period that the registrant was required to file such reports), and (2) has been subject to such filing requirements for the past 90 days. Yes x No ¨
Indicate by check mark whether the registrant has submitted electronically and posted on its corporate web site, if any, every Interactive Data File required to be submitted and posted pursuant to Rule 405 of Regulation S-T (§232.405 of this chapter) during the preceding 12 months (or for such shorter period that the registrant was required to submit and post such files). Yes ¨ No ¨
Indicate by check mark if disclosure of delinquent filers pursuant to Item 405 of Regulation S-K is not contained herein, and will not be contained, to the best of the registrant’s knowledge, in definitive proxy or information statements incorporated by reference on Part III of this Form 10-K or any amendment to this Form10-K. ¨
Indicate by check mark whether the registrant is a large accelerated filer, an accelerated filer, or a non-accelerated filer. See definition of “accelerated filer and large accelerated filer” in Rule 12b-2 of the Exchange Act. (Check one):
| Large accelerated filer | ¨ | Accelerated filer | x | |||
| Non-accelerated filer | ¨ | |||||
Indicate by check mark whether the registrant is a shell company (as defined in Rule 12b-2 of the Exchange Act). Yes ¨ No x
The aggregate market value of the voting and non-voting common equity held by non-affiliates as of June 30, 2011 based on the closing sales price of the Common Shares on the Toronto Stock Exchange was $ 116,879,107.
The number of Common Shares, without par value, outstanding on March 14, 2012, was 69,834,396.
DOCUMENTS INCORPORATED BY REFERENCE
Certain portions of the registrant’s definitive proxy statement to be filed with the Securities and Exchange Commission pursuant to Regulation 14A not later than April 30, 2012, in connection with the registrant’s 2012 Annual Meeting of Shareholders, are incorporated herein by reference into Part III of this Annual Report on form 10-K.
Table of Contents
NIMIN ENERGY CORP.
FORM 10-K ANNUAL REPORT
2
Table of Contents
Note Regarding Forward-Looking Information
This Annual Report on Form 10-K contains certain forward-looking information, which is based upon the current internal expectations, estimates, projections, assumptions and beliefs of NiMin, as of the date of such statements or information. Words such as “plan”, “expect”, “project”, “intend”, “believe”, “anticipate”, “estimate”, “may”, “will”, “potential”, “proposed” and other similar words, or statements that certain events or conditions “may” or “will” occur, are intended to identify forward-looking information. These statements are not guarantees of future performance and involve known and unknown risks, uncertainties and other factors that may cause actual results or events to differ materially from those anticipated in the forward-looking information. By its nature, forward-looking information involves numerous assumptions, known and unknown risks and uncertainties, both general and specific, that contribute to the possibility that the predictions, forecasts, projections and other forward-looking information will not occur. Such forward looking information in this Annual Report speaks only as of the date of this Annual Report.
Although NiMin believes that the expectations reflected in the forward looking information are reasonable, there can be no assurance that such expectations will prove to be correct. NiMin cannot guarantee future results, levels of activity, performance or achievements. Some of the risks and other factors, some of which are beyond the control of NiMin which could cause results to differ materially from those expressed in the forward-looking information contained in this Annual Report, include, but are not limited to:
| • | general economic conditions in the United States, Canada and globally; |
| • | industry conditions, including fluctuations in the price of oil and natural gas; |
| • | liabilities inherent in oil and natural gas operations; |
| • | governmental regulation of the oil and gas industry, including environmental regulation; |
| • | geological, technical, drilling and processing problems and other difficulties in producing reserves; |
| • | fluctuations in foreign exchange or interest rates; |
| • | failure to realize anticipated benefits of acquisitions; |
| • | unanticipated operating events which can reduce production or cause production to be shut-in or delayed; |
| • | failure to obtain industry partner and other third-party consents and approvals, when required; |
| • | competition for, among other things, capital, acquisitions of reserves, undeveloped land and skilled personnel; |
| • | competition for and/or inability to retain drilling rigs and other services; |
| • | the availability of capital on acceptable terms; |
| • | the need to obtain required approvals from regulatory authorities; and |
| • | the other factors disclosed under the heading Item 1.A—Risk Factors in this Annual Report. |
The above summary of assumptions and risks related to forward-looking information has been provided in this Annual Report in order to provide readers with a more complete perspective on the future operations of the Company. Readers are cautioned that this information may not be appropriate for other purposes. The forward-looking information contained in this Annual Report is expressly qualified by the cautionary statements provided for herein. NiMin is not under any duty to update any of the forward-looking information after the date of this Annual Report or to conform such statements or information to actual results or to changes in the expectations of NiMin except as otherwise required by applicable laws.
3
Table of Contents
In this document, unless the context otherwise requires, the following terms shall have the meanings set out below:
“AcquisitionCo” means NiMin Merger Co., a wholly-owned subsidiary of NiMin incorporated under the laws of the State of Delaware solely for the purpose of effecting the Reverse Triangular Merger in connection with the Merger Transaction.
“Board” means the board of directors of NiMin.
“CAA” means the U.S. federal Clean Air Act.
“Canadian Tax Act” means the Income Tax Act (Canada) and the regulations promulgated thereunder, as amended.
“Capital Pool Company” has the meaning ascribed thereto in the TSXV Policies.
“CERCLA” means the U.S. federal Comprehensive Environmental Response, Compensation and Liability Act.
“Cdn$” means Canadian dollars, the lawful currency of Canada.
“CMD” means Combined Miscible Drive For Heavy Oil Production, NiMin’s patented process for the extraction of heavy oil.
“CMD Project” means the EOR pilot project designed and implemented by NiMin for use in the Santa Margarita Formation, which utilizes CMD.
“Code” means the United States Internal Revenue Code of 1986, as amended.
“Common Shares” means the common stock in the capital of the Company subsequent to the completion of the Consolidation.
“Common Stock” means shares of common stock in the capital of Legacy.
“Computershare” means Computershare Trust Company of Canada.
“Consolidation” means the consolidation of common stock of NiMin based on the Consolidation Ratio.
“Consolidation Ratio” means the consolidation of the Preconsolidated Shares on the basis of one new Common Share for each three existing Preconsolidated Shares.
“CWA” means the U.S. federal Water Pollution Control Act, also known as the Clean Water Act.
“DD&A” means depreciation, depletion, amortization and accretion expense.
“Direct Share Exchange” means the exchange of Common Stock for Common Shares, immediately prior to the Reverse Triangular Merger and pursuant to the Share Exchange Agreement.
“EPA” means the U.S. Environmental Protection Agency.
“Exchange Act” means the Securities Exchange Act of 1934, as amended.
“Exxon” means Exxon Corporation, the successor company to Humble Oil & Refining Company.
“EOR” means the enhanced oil recovery system used in the CMD Project.
“FERC” means the United States Federal Energy Regulatory Commission.
4
Table of Contents
“G&A” means general and administrative expenses.
“Huddleston” means Huddleston & Co., Inc., petroleum and geological engineers of Houston, Texas.
“IPO” means the initial public offering of NiMin completed on November 7, 2007, pursuant to a Capital Pool Company prospectus filed in the provinces of Alberta, British Columbia and Ontario, in connection with the issuance of 1,200,000 Preconsolidated Shares at a per share price of Cdn$0.25 for gross proceeds of Cdn$300,000.
“IPO Escrow Agreement” means the escrow agreement dated September 27, 2007, among NiMin, Computershare as depositary, and the founding shareholders of NiMin.
“Krotz Springs Field” means the Krotz Springs oil field located in St. Landry Parish, Louisiana.
“Legacy” means Legacy Energy, Inc.
“Lender” means CLMG Corp., an administrative agent, and Beal Bank Nevada, as lender, under the Senior Loan.
“Letter of Intent” means the letter of intent dated May 25, 2009, between NiMin and Legacy and pursuant to which the parties agreed to effect the Merger Transaction.
“Macquarie Capital” means Macquarie Capital (USA) Inc.
“MD&A” means the Management Discussion and Analysis and Analysis of Financial Condition and Results of Operation included in this Annual Report as Item 7.
“Merger Agreement” means the definitive merger agreement dated July 17, 2009, among NiMin, Legacy and AcquisitionCo, relating to the Reverse Triangular Merger.
“Merger Transaction” means, collectively, the Direct Share Exchange and the Reverse Triangular Merger.
“NI 52-110” means National Instrument 52-110 – Audit Committees, of the Canadian Securities Administrators.
“NI 51-101” means National Instrument 51-101 – Standards of Disclosure for Oil and Gas Activities, of the Canadian Securities Administrators.
“NiMin” means NiMin Energy Corp.
“NiMin Shareholders’ Meeting” means the special meeting of the holders of common stocks of NiMin, held on July 16, 2009, for the purpose of obtaining the approval of such holders in respect of certain matters relating to the Merger Transaction.
“Non-U.S. shareholder” means a holder of securities who, for U.S. federal income tax purposes, (i) is not a citizen or resident of the United States; (ii) is a corporation created or organized in or under the laws of a jurisdiction other than the United States or any state thereof (including the District of Columbia); (iii) is an estate the income of which is not subject to United States federal income tax regardless of its source; or (iv) is a trust, if a court within the United States cannot exercise primary supervision over its administration, and one or more non-U.S. persons have the authority to control all of the substantial decisions of that trust (and is not a trust which was in existence on August 20, 1996, was treated as a U.S. trust on August 19, 1996 and validly elected to continue to be treated as a U.S. trust).
“Olcese Formation” means a formation within the Pleito Creek Field, situated at a measured depth of 5,250 feet, or approximately 1,500 feet below the Santa Margarita Formation.
“OTC-BB” means the electronic quotation system operated by the Financial Industry Regulatory Authority, Inc. in the United States.
“OTCQX” means the electronic quotation system operated by OTC Markets Group, Inc. in the United States.
5
Table of Contents
“Person” includes an individual, partnership, association, body corporate, trustee, executor, administrator or legal representative.
“Plains” means Plains Marketing, L.P.
“Pleito Creek Field” means the Pleito Creek oil field located in Kern County, California.
“PLC” means private lending company.
“Preconsolidated Shares” means the common stocks of NiMin prior to completion of the Consolidation.
“Preferred Shares” means the preferred shares in the capital of NiMin.
“Private Placement” means the private placement completed in September 1, 2011, in respect to the offering of Units.
“Prospectus” means the prospectus of NiMin dated August 21, 2009 in respect of the offering of Units.
“Prospectus Offering” means the public offering of Units pursuant to the Prospectus.
“Qualifying Transaction” has the meaning ascribed thereto in the TSXV Policies.
“Loan Facility” means the loan facility entered into on April 25, 2007, with a maturity date of April 15, 2009, pursuant to which Legacy was able to obtain up to $15 million in loans.
“RCRA” means the U.S. federal Resource Conservation and Recovery Act.
“Regulation S” means Regulation S under the U.S. Securities Act.
“Registration Statement” means the registration statement on Form 20-F filed with the U.S Securities and Exchange Commission pursuant to section 12 (d) or (g) of the Securities Exchange Act of 1934 to register securities of foreign issuers.
“Reverse Triangular Merger” means the reverse triangular merger pursuant to which AcquisitionCo and Legacy merged, with Legacy, as the Surviving Corporation, becoming a wholly-owned subsidiary of NiMin.
“Santa Margarita Formation” means a geological formation within the Pleito Creek Field, situated at a measured depth of 3,700 feet.
“SEDAR” means the System for Electronic Document Analysis and Retrieval in Canada.
“SEC” means the U.S Securities and Exchange Commission.
“Senior Loan” means the credit agreement entered into on June 30, 2010, between Legacy and the Lender.
“Share Exchange Agreement” means the share exchange agreement that all Canadian resident Legacy stockholders had the option to enter into directly with NiMin in connection with the Direct Share Exchange, in lieu of participating directly in the Reverse Triangular Merger, but in connection with the Merger Transaction.
“Short Form Prospectus” means the prospectus of NiMin dated April 29, 2010 in respect to the offering of Common Shares.
“Short Form Prospectus Offering” means the public offering of Common Shares completed on May 6, 2010, pursuant to the Short Form Prospectus.
“Short-term Loan” means the $5,500,000 and Cdn$17,534,550 syndicated secured non-convertible loan pursuant to a loan agreement between the Company and a private lending company dated December 17, 2009.
6
Table of Contents
“Strategic Review” means management’s broad review of strategic alternatives aimed at maximizing shareholders’ value. To assist in this review process, the Company has engaged Macquarie Capital as its financial advisor. The Company expects to consider and evaluate several alternatives, including strategic financing opportunities, asset divestitures, technology licensing agreements, joint ventures and/or a corporate sale, merger or other business combination. There can be no assurance that this strategic review will result in a significant transaction.
“Subsea TVD” means the depth of a formation as measured from sea level to the bottom of the borehole (or anywhere along its length) in a straight line that is perpendicular to the earth’s surface.
“Surviving Corporation” means the corporation surviving the merger of AcquisitionCo and Legacy.
“Technical Report” means, the technical report prepared by Huddleston dated January 30, 2012, entitled “Estimated Reserves as of January 1, 2012”.
“Texas Capital” means Texas Capital Bank, N.A.
“Texas Credit Agreement” means the credit agreement entered into between Legacy and Texas Capital, pursuant to which Texas Capital agreed to provide up to $50 million in loans to Legacy for use in connection with the development of Legacy’s oil and natural gas properties.
“TSX” means the Toronto Stock Exchange.
“TSX Option Plan” means the new stock option plan adopted by NiMin in connection with the completion of the Merger Transaction, which was approved at the NiMin Shareholders’ Meeting.
“TSXV” means the TSX Venture Exchange Inc.
“TSXV Policies” means the TSXV corporate finance manual, as amended from time to time.
“U.S. Person” has the meaning ascribed thereto under Regulation S of the U.S. Securities Act.
“U.S. Securities Act” means the United States Securities Act of 1933, as amended.
“Unit” means one unit of NiMin, comprised of one Unit Share and one Warrant.
“Unit Share” means one Common Share issued as part of a Unit.
“Warrant” means one Common Share purchase warrant of the Company, which, together with one Unit Share, comprises a Unit.
“Warrant Indenture” means the agreement dated August 28, 2009 between NiMin and Computershare in connection with the Warrants issued pursuant to the Prospectus Offering and relating to, among other things, the issuance and exercise of the Warrants.
“Wyoming Assets” means the fields located in the state of Wyoming which the Company holds a 97% weighted average working interest and is the operator since December 2009.
7
Table of Contents
ABBREVIATIONS
| Crude Oil and Natural Gas Liquids | Natural Gas | |||||
| Bbl | barrel | Mcf | thousand cubic feet | |||
| Bbl/d | barrels per day | MMcf | million cubic feet | |||
| Mbbl | thousands of barrels | Bcf | billion cubic feet | |||
| MMbbl | millions of barrels | Btu | British thermal unit | |||
| boe/d | barrels of oil equivalent of natural gas and crude oil per day | Mcf/d | thousand cubic feet per day | |||
| boe | barrels of oil equivalent of natural gas and crude oil, unless otherwise indicated | Scf | Standard cubic feet | |||
| bopd | barrels of oil per day | |||||
| Mboe bblw/d |
thousand boe barrels of water per day |
|||||
| NGL | natural gas liquids | |||||
| MMBtu | million British thermal units | |||||
| Stb | standard stock tank barrel | |||||
| Mstb | thousand standard stock tank barrels | |||||
Production information is commonly reported in units of barrel of oil equivalent. A boe conversion ratio of 6 Mcf: 1 Bbl is based on an energy equivalency conversion method primarily applicable at the burner tip and does not represent a value equivalency at the wellhead. For purposes of calculating mixed company production, natural gas has been converted to a barrel of oil equivalent using a conversion rate of six thousand cubic feet being equal to one barrel of oil (6 Mcf: 1Bbl).
GLOSSARY OF TECHNICAL TERMS
| API |
measure of how heavy or light a petroleum liquid is in comparison to water as recognized by the American Petroleum Institute | |
|
CO2 |
carbon dioxide | |
| EOR |
enhanced oil recovery | |
| LIBOR |
London Inter-Bank Offer Rate, being the rate at which a bank will loan funds to another bank and which is often used as a benchmark for a bank’s loan activities | |
| mD |
“millidarcies” – a measure of units of permeability | |
| WTI |
West Texas Intermediate, also known as Texas Light Sweet – a type of light crude oil used as a benchmark in oil pricing | |
Financial and Other Information
In this Annual Report, unless otherwise specified, all dollar amounts are expressed in US Dollars (“$”). In this Annual Report, when we provide information as of the date of this Annual Report, we mean as of March 14, 2012.
8
Table of Contents
| ITEMS | 1 & 2. BUSINESS AND PROPERTIES |
NiMin Energy Corp. (“NiMin”, “we” or the “Company”) was incorporated under the name NiMin Capital Corp. under the Business Corporations Act (Alberta) on May 31, 2007. The Company changed its name to NiMin Energy Corp. on September 3, 2009. NiMin is an oil and gas company that is engaged in the acquisition, development and production of oil and gas properties in the United States. NiMin has operated as an exploration and production company since late 2006 and has principal operations in the Bighorn Basin, Wyoming and the San Joaquin Basin, California onshore areas of the United States.
Corporate Strategy
Our corporate strategy is to seek out, investigate and evaluate acquisition opportunities for oil and gas properties, assets and operations situated in the United States. We target assets that have significant oil and natural gas resource potential, operatorship, and both conventional and EOR development potential. In addition to individual properties, we may source, investigate, and evaluate private and public companies for the purpose of asset purchases, mergers or similar transactions. From time to time, we have entered into discussions with third parties regarding acquisitions. Consummation of an acquisition, dependent upon the size, location and nature of related operations, could result in NiMin revising its planned future activities.
As announced on November 21, 2011, we have engaged in the Strategic Review, which is the broad review of strategic alternatives aimed at maximizing shareholders’ value. To assist in this review process, we have engaged Macquarie Capital as our financial advisor. We expect to consider and evaluate several alternatives, including strategic financing opportunities, asset divestitures, technology licensing agreements, joint ventures and/or a corporate sale, merger or other business combination. There can be no assurance that the Strategic Review will result in a significant transaction.
For a summary of our financial information, including revenues from external customers, information on loss, long-lived assets, and total assets, see Item 6 – “Selected Financial Data” and Item 8 – “Financial Statements and Supplementary Data”.
Oil and Natural Gas Properties
We operate in two primary on shore geographical areas: California and Wyoming.
California
The Pleito Creek Field was discovered in 1951 by Exxon and is located along the south side of the San Joaquin basin in Section 35, Township 11N, Range 21W, Kern County, California. Geologically, the Pleito Creek Field is a faulted anticline with a steeply dipping north limb that rolls over into the Wheeler Ridge thrust fault. The Miocene-aged Santa Margarita sand is the primary producing reservoir in the Pleito Creek Field and is found at an average measured depth of 4,000 feet and is on average 115 feet thick. The Olcese Formation, a Miocene age marine sandstone reservoir, discovered at a measured depth of 5,250 feet approximately 1,250 feet deeper than the Santa Margarita Formation also produces at the Pleito Creek Field. Since 1951, the Pleito Creek Field has produced 2.36 MMbbls oil and oil expansion has been the field’s primary drive mechanism with limited recoveries as a result of pilot in-situ combustion operations conducted by Exxon. We hold a 100% working interest and have been the operator of the Pleito Creek Field since September 2006.
Combined Miscible Drive (CMD) Project – Pleito Creek Field, California
CMD is an enhanced oil recovery process designed to increase oil recovery by combining the effects of heat, steam, and CO2 to reduce oil viscosity and increase reservoir pressure. In December 2010, the U.S. Patent and Trademark Office issued a patent to NiMin for its CMD process for enhanced oil recovery. In addition, we have completed CMD patent applications in Canada, Venezuela, Argentina and Ecuador.
As previously reported, our CMD technology has been successful in increasing production in California’s Pleito Creek Field by more than fifty percent. We believe that CMD is an economic method to increase oil recovery in many fields domestically and internationally.
9
Table of Contents
The patent issued to the Company covers the process of the injection of oxygen and water as foam to create CO2 and steam in the reservoir through wet combustion. The CO2 and steam increase reservoir pressure and significantly reduce oil viscosity making the oil substantially more mobile allowing it to flow rapidly into production wells.
We have identified many oil fields which have reservoirs that we believe to be high quality candidates for the CMD process. Reservoirs which are considered candidates for the CMD process have similar characteristics to reservoirs that are targeted for CO2 or steam floods. The advantage with the CMD process, however, is that it can be used in reservoirs that are too deep to be steam flooded with conventional technology and in fields which are relatively distant from a source of CO2.
Wyoming
We hold a 97% weighted average working interest and are the operator of the Wyoming Assets since December 2009. The Wyoming Assets produce oil from the Tensleep, Phosphoria and the Dinwoody Formations which are found at an average measured depth of 3,900 feet. The Tensleep reservoir is a middle to upper Pennsylvanian aged sandstone; the Phosphoria reservoir is a Permian aged dolomitic limestone; and the Dinwoody reservoir is a Lower Triassic aged dolomitic mudstone.
Ferguson Ranch Field
Ferguson Ranch Field was discovered by Hunt Petroleum Corporation in 1963. This field covers a total of 320 acres and has had total cumulative production of 5.3 MMbbls of 14º API oil. Ferguson Ranch Field is a fault bounded anticlinal trap. Ferguson Ranch Field is located on the western margin of the Big Horn Basin and is part of the Basin Margin Anticline Play.
Hunt Field
Hunt Field was discovered by Amax Petroleum Company in 1966. This field covers a total of 650 acres and has had a total cumulative production of 0.9 MMbbls of 14º API oil. Hunt Field is a fault bounded anticlinal trap that produces oil from both the Tensleep and Phosphoria formations. Hunt Field is located on the western margin of the Big Horn Basin and is part of the Basin Margin Anticline Play.
Willow Draw Field
Willow Draw Field was discovered by Oil Development Company of Texas in 1972 and located in Park County, Wyoming. This field covers a total of 1,200 acres and has had a total cumulative production of 2.50 MMbbls of 17º API oil.
Willow Draw Field is a four-way anticlinal trap that produces oil from the Phosphoria and to a lesser extent the Dinwoody. Willow Draw Field is located on the western margin of the Big Horn Basin and is part of the Basin Margin Anticline Play.
Sheep Point Field
Sheep Point Field was discovered by Douglas and Gauntt in 1957 and is also located in Park County, Wyoming, USA. This field covers a total of 300 acres and has had a total cumulative production of 0.70 MMbbls of 17º API oil. Sheep Point Field is a fault bounded anticlinal trap that produces oil from Phosphoria formation. Sheep Point Field is located on the western margin of the Big Horn Basin and is part of the Basin Margin Anticline Play.
Oil and Natural Gas Reserves Estimates
Huddleston prepared the Technical Report in accordance with SEC requirements. The rules require oil and gas reserve information to be reported by publicly held companies as supplemental financial data. The Technical Report, dated January 30, 2012, evaluates, as at January 1, 2012, our oil, NGL and natural gas reserves and is filed herewith as Exhibit 99.1.
The tables below are a summary of our oil and natural gas reserves and the net present value of future net revenue attributable to such reserves as evaluated in the Technical Report. The tables and information contained in this section are only summaries of the data contained in the Technical Report and as a result, may contain slightly different numbers than such report due to rounding. Also due to rounding, certain columns may not add exactly. The net present value of future net revenue attributable to our reserves is stated without provision for interest costs and general and administrative costs, but after providing for estimated royalties, production costs,
10
Table of Contents
development costs, other income, future capital expenditures, and well abandonment costs for only those wells assigned reserves by Huddleston. The net present value of future net revenue attributable to our reserves estimated by Huddleston do not represent the fair market value of those reserves. The recovery and reserve estimates of our oil and natural gas reserves provided herein are estimates only and there is no guarantee that the estimated reserves will be recovered. Actual reserves may be greater than or less than the estimates provided herein.
Table No. 1
Oil and Gas Reserves (1)
| Years Ended December 31, | ||||||||||||||||||||||||||||||||||||||||||||
| 2011 | 2010 | 2009 | ||||||||||||||||||||||||||||||||||||||||||
| California | Wyoming | Total | California | Louisiana (2) | Wyoming | Total | California | Louisiana (2) | Wyoming | Total | ||||||||||||||||||||||||||||||||||
| Proved developed: |
||||||||||||||||||||||||||||||||||||||||||||
| Oil (MBbls) |
931 | 3,451 | 4,382 | 838 | 109 | 2,680 | 3,627 | 432 | 79 | 1,335 | 1,847 | |||||||||||||||||||||||||||||||||
| Gas (MMcf) |
— | — | — | — | 436 | — | 436 | — | 823 | — | 824 | |||||||||||||||||||||||||||||||||
| Proved undeveloped: | ||||||||||||||||||||||||||||||||||||||||||||
| Oil (MBbls) |
2,222 | 9,318 | 11,540 | 1,976 | 64 | 7,965 | 10,005 | 1,359 | 102 | 5,743 | 7,205 | |||||||||||||||||||||||||||||||||
| Gas (MMcf) |
— | — | — | — | 79 | — | 79 | — | 80 | — | 79 | |||||||||||||||||||||||||||||||||
| Total proved: |
||||||||||||||||||||||||||||||||||||||||||||
| Oil (MBbls) |
3,153 | 12,769 | 15,922 | 2,814 | 173 | 10,645 | 13,631 | 1,791 | 182 | 7,078 | 9,051 | |||||||||||||||||||||||||||||||||
| Gas (MMcf) |
— | — | — | — | 515 | — | 515 | — | 903 | — | 903 | |||||||||||||||||||||||||||||||||
|
|
|
|
|
|
|
|
|
|
|
|
|
|
|
|
|
|
|
|
|
|
|
|||||||||||||||||||||||
| Estimated future net cash flows (3) | $ | 167,172 | $ | 362,600 | $ | 529,771 | $ | 101,102 | $ | 8,473 | $ | 303,279 | $ | 412,854 | $ | 50,879 | $ | 8,948 | $ | 182,503 | $ | 242,330 | ||||||||||||||||||||||
|
|
|
|
|
|
|
|
|
|
|
|
|
|
|
|
|
|
|
|
|
|
|
|||||||||||||||||||||||
| Standarized measure of discounted future net cash flows (3) (4) | $ | 58,805 | $ | 156,492 | $ | 215,297 | $ | 35,797 | $ | 6,393 | $ | 128,837 | $ | 171,028 | $ | 15,064 | $ | 6,126 | $ | 77,752 | $ | 98,942 | ||||||||||||||||||||||
|
|
|
|
|
|
|
|
|
|
|
|
|
|
|
|
|
|
|
|
|
|
|
|||||||||||||||||||||||
Notes:
| (1) | These numbers are net to NiMin’s working interest for the relevant properties. |
| (2) | The Louisiana properties were sold on December 1, 2011 (see ITEM 7 – “MD&A – Liquidity and Capital Resources”). |
| (3) | Expressed in thousands of dollars. |
| (4) | The prices of crude oil and natural gas used to estimate reserves in the table shown above were $84.75 per Bbl of oil for the year ended December 31, 2011 (benchmark prices to which differentials were applied to arrive at the prices used to estimate reserves for the year ended December 31, 2011 were $96.19 per Bbl of oil), $69.44 per Bbl of oil and $4.27 per Mcf of natural gas for the year ended December 31, 2010 (benchmark prices to which differentials were applied to arrive at the prices used to estimate reserves for the year ended December 31, 2010 were $79.43 per Bbl of oil and $4.38 per Mcf of natural gas), and $51.38 per Bbl of oil and $4.07 per Mcf of natural gas for the year ended December 31, 2009 (benchmark prices to which differentials were applied to arrive to the prices used to estimate reserves for the year ended December 31, 2009 were $61.03 per Bbl of oil and $4.20 per Mcf of natural gas). |
Our estimates of proved reserves consist of proved developed reserves, proved undeveloped reserves at December 31, 2011, 2010 and 2009 and changes in proved reserves during the last three years are included in Note 19 of our Consolidated Financial Statements. Also included in Note 19 are our estimates of future net cash flows and discounted future net cash flows from proved reserves.
11
Table of Contents
Proved Undeveloped Reserves
In general, once proved undeveloped reserves are identified, they are scheduled into our development plans. Normally, we plan to develop our proved undeveloped reserves within two years. In some instances, larger development programs such as the infill drilling program in Wyoming or full field development at Pleito Creek were spread out beyond two years to optimize capital allocation and facility utilization.
At December 31, 2011 total proved undeveloped reserves increased from 10,018 Mboe to 11,540 Mboe. This increase is due to: (i) conversion of probable reserves to proved reserves in Wyoming and California as a result of our successful 2011 development program; and (ii) identification of secondary reserves in the Hunt and Sheep Point fields in Wyoming.
At December 31, 2010 total proved undeveloped reserves increased from 7,218 Mboe to 10,018 Mboe. This increase is due to: (i) conversion of probable reserves to proved reserves in Wyoming as a result of our successful 2010 development program; and (ii) positive results from the CMD project in California.
At December 31, 2009, total proved undeveloped reserves increased from 1,889 Mboe to 7,218 Mboe. This increase is due to: (i) the acquisition of the Wyoming Assets which added 5,742 Mboe; and (ii) technical revisions to the Louisiana and California assets which reduced the reserves by 413 Mboe.
The Technical Report indicates that the four Wyoming fields, Ferguson Ranch, Hunt, Sheep Point and Willow Draw have a combined 9,318 Mbbl of reserves defined as “proved undeveloped”. Of these reserves, 4,257 Mbbl are associated with a planned infill drilling program constituting 62 wells amongst the four fields. Of these 62 infill wells, a total of 54 locations will be drilled in 2012 and 2013 with the remaining 8 wells to follow in 2014. The remaining 5,061 Mbbl are associated with the implementation of waterflood projects at Ferguson Ranch, Hunt and Sheep Point. The Ferguson Ranch waterflood was initiated in 2012 and the Hunt and Sheep Point waterfloods are scheduled to start in 2013.
The Technical Report also indicates that the Pleito Creek field in California has 2,222 Mbbl of reserves defined as “proved undeveloped”. These reserves are captured by 15 infill Santa Margarita wells, 4 Olcese wells and further development of the CMD project. It is anticipated that during 2012 and 2013, the 19 infill wells will be drilled. The CMD project will be expanded in 2013 with the re-initiation of oxygen injection and the installation of on-site oxygen extraction facilities.
Controls Over Reserve Estimates
Our policies and practices regarding internal controls over the recording of reserves are structured to objectively and accurately estimate our oil and gas reserves quantities and present values in compliance with the SEC’s regulations and US GAAP. Compliance in reserves bookings is the responsibility of our Board’s Reserves Committee. Our controls over reserve estimates included retaining Huddleston & Co, Inc. as our independent petroleum and geological engineering firm. We provided information about our oil and gas properties, including production profiles, prices and costs, to Huddleston and they prepare their own estimates of the reserves attributable to our properties. All of the information regarding reserves in this Annual Report is derived from the Technical Report prepared by Huddleston. The principal engineer at Huddleston who is responsible for preparing our reserve estimates has over 30 years of experience in the oil and gas industry and is a Texas Licensed Professional Engineer. Further, professional qualifications include a degree in petroleum engineering as well as being a member of the Society of Petroleum Engineers. The Huddleston & Co., Inc. engineering firm is a Texas Registered Engineering Firm. The Reserves Committee of our Board of Directors meets with management, including the Chief Operating Officer and Chief Executive Officer to discuss matters and policies including those related to reserves.
There are numerous uncertainties inherent in estimating quantities of proved reserves, including many factors beyond our control or the control of the reserve engineers. Reserve engineering is a subjective process of estimating underground accumulations of oil and gas that cannot be measured in an exact manner. The accuracy of any reserve or cash flow estimate is a function of the quality of available data and of engineering and geological interpretation and judgment. Estimates by different engineers often vary, sometimes significantly. In addition, physical factors, such as the results of drilling, testing and production subsequent to the date of an estimate, as well as economic factors, such as an increase or decrease in product prices that renders production of such reserves more or less economic, may justify revision of such estimates. A significant reduction in our proved reserves may result in a full cost ceiling limitation and/or an accelerated depletion rate. Accordingly, reserve estimates could be different from the quantities of oil and gas that are ultimately recovered (See ITEM 1.A – “Risk Factors”).
Estimated reserves shown for the producing properties have been projected on the basis of the extrapolation of performance data where there was sufficient data to suggest a performance trend. A significant percentage of the completions have extensive production histories and provide substantial data with respect to performance trends. In some cases the information suggests that recent well intervention work has been performed. In such cases we have considered prior historical performance in estimating future reserves. Projections for recently drilled wells have been prepared on the basis of early performance data and/or well tests with consideration for the performance trends observed in those wells with long production histories.
12
Table of Contents
Production Volumes, Average Prices and Average Production Costs
Table No. 2
Production, Prices and Production Costs
| Years ended December 31, | ||||||||||||
| 2011 | 2010 | 2009 | ||||||||||
| Production (1) |
||||||||||||
| Oil (Bbls) |
350,483 | 258,990 | 127,769 | |||||||||
| Gas (Mcf) |
160,070 | 290,218 | 428,054 | |||||||||
|
|
|
|
|
|
|
|||||||
| Total BOE |
377,161 | 307,360 | 199,111 | |||||||||
|
|
|
|
|
|
|
|||||||
| Net Production (2) |
||||||||||||
| Oil (Bbls) |
274,496 | 212,868 | 117,895 | |||||||||
| Gas (Mcf) |
110,848 | 208,068 | 318,330 | |||||||||
|
|
|
|
|
|
|
|||||||
| Total BOE |
292,971 | 247,546 | 170,950 | |||||||||
|
|
|
|
|
|
|
|||||||
| ($) | ($) | ($) | ||||||||||
| Received Prices |
||||||||||||
| Oil ($/Bbl) |
86.44 | 67.30 | 54.29 | |||||||||
| Gas ($/Mcf) |
4.09 | 4.55 | 4.15 | |||||||||
|
|
|
|
|
|
|
|||||||
| BOE ($/BOE) |
82.06 | 61.00 | 43.76 | |||||||||
|
|
|
|
|
|
|
|||||||
| Sales |
||||||||||||
| Oil |
30,296,617 | 17,430,834 | 6,936,793 | |||||||||
| Gas |
654,135 | 1,319,145 | 1,777,087 | |||||||||
|
|
|
|
|
|
|
|||||||
| Total Sales |
30,950,752 | 18,749,979 | 8,713,880 | |||||||||
|
|
|
|
|
|
|
|||||||
| Royalties |
||||||||||||
| Oil |
6,445,562 | 4,350,219 | 1,805,466 | |||||||||
| Gas |
199,505 | 370,561 | 409,625 | |||||||||
|
|
|
|
|
|
|
|||||||
| Total Royalties |
6,645,067 | 4,720,781 | 2,215,091 | |||||||||
|
|
|
|
|
|
|
|||||||
| Net Revenues |
||||||||||||
| Oil |
23,851,055 | 13,080,615 | 5,131,327 | |||||||||
| Gas |
454,630 | 948,583 | 1,367,462 | |||||||||
|
|
|
|
|
|
|
|||||||
| Total Net Revenues |
24,305,685 | 14,029,198 | 6,498,789 | |||||||||
|
|
|
|
|
|
|
|||||||
| Production Cost |
11,565,565 | 9,116,563 | 5,162,936 | |||||||||
|
|
|
|
|
|
|
|||||||
| Average per BOE volumes(1) ($/BOE) |
30.66 | 29.66 | 25.93 | |||||||||
|
|
|
|
|
|
|
|||||||
| Average per Net BOE volumes (2) ($/BOE) |
39.48 | 36.83 | 30.20 | |||||||||
|
|
|
|
|
|
|
|||||||
Notes:
| (1) | These numbers are net to NiMin’s working interest before royalties for the relevant properties. |
| (2) | These numbers are net to NiMin’s net revenue interests after royalties for the relevant properties |
13
Table of Contents
Present Activities and Productive Wells
The following table sets forth the wells we have drilled and completed during the periods indicated. All such wells were drilled in the United States:
Table No. 3
Wells Drilled
| Years Ended December 31, | ||||||||||||||||||||||||
| 2011 | 2010 | 2009 | ||||||||||||||||||||||
| Gross (1) | Net (2) | Gross (1) | Net (2) | Gross (1) | Net (2) | |||||||||||||||||||
| Development: |
||||||||||||||||||||||||
| Oil |
10 | 9.43 | 10 | 10 | 1 | 1 | ||||||||||||||||||
| Gas |
— | — | — | — | — | — | ||||||||||||||||||
| Non-productive |
— | — | — | — | — | — | ||||||||||||||||||
|
|
|
|
|
|
|
|
|
|
|
|
|
|||||||||||||
| Total |
10 | 9.43 | 10 | 10 | 1 | 1 | ||||||||||||||||||
| Exploration: |
||||||||||||||||||||||||
| Oil |
— | — | — | — | — | — | ||||||||||||||||||
| Gas |
— | — | — | — | 1 | 0.2 | ||||||||||||||||||
| Non-productive |
— | — | — | — | 1 | 0.7 | ||||||||||||||||||
|
|
|
|
|
|
|
|
|
|
|
|
|
|||||||||||||
| Total |
— | — | — | — | 2 | 0.9 | ||||||||||||||||||
| Total Drilling: |
||||||||||||||||||||||||
| Oil |
10 | 9.43 | 10 | 10 | 1 | 1 | ||||||||||||||||||
| Gas |
— | — | — | — | 1 | 0.2 | ||||||||||||||||||
| Non-productive |
— | — | — | — | 1 | 0.7 | ||||||||||||||||||
|
|
|
|
|
|
|
|
|
|
|
|
|
|||||||||||||
| Total |
10 | 9.43 | 10 | 10 | 3 | 1.9 | ||||||||||||||||||
Notes:
| (1) | “Gross” wells means the number of wells in which NiMin has a working interest or a royalty interest that may be convertible to a working interest. |
| (2) | “Net” wells means the aggregate number of wells obtained by multiplying each gross well by NiMin’s percentage working interest therein. |
As at December 31, 2011, we had an interest in 48 gross(1) (46.58 net( 2)) producing and 20 gross(1) (19.35 net( 2)) non- producing oil and natural gas wells as follows:
Table No. 4
Productive Wells
| Producing | Non-Producing | |||||||||||||||||||||||||||||||
| Oil | Natural Gas | Oil | Natural Gas | |||||||||||||||||||||||||||||
| Gross(1) | Net(2) | Gross(1) | Net(2) | Gross(1) | Net(2) | Gross(1) | Net(2) | |||||||||||||||||||||||||
| Wells |
||||||||||||||||||||||||||||||||
| California |
9.00 | 9.00 | — | — | 9.00 | 9.00 | — | — | ||||||||||||||||||||||||
| Wyoming |
39.00 | 37.52 | — | — | 11.00 | 10.35 | — | — | ||||||||||||||||||||||||
|
|
|
|
|
|
|
|
|
|
|
|
|
|
|
|
|
|||||||||||||||||
| Total |
48.00 | 46.52 | — | — | 20.00 | 19.35 | — | — | ||||||||||||||||||||||||
Notes:
| (1) | “Gross” wells refers to the number of wells in which NiMin has a working interest or a royalty interest that may be convertible to a working interest. |
| (2) | “Net” wells means the aggregate number of wells obtained by multiplying each gross well by NiMin percentage working interest therein. |
As at the date of this Annual Report we had no commitments to provide a fixed and determinable quantity of oil or gas in the near future under existing contracts or agreements.
14
Table of Contents
The following table sets forth our gross and net acres of properties at December 31, 2011:
Table No. 5
Net Acres of Properties
| DEVELOPED PROPERTIES | ||||||||
| (acres) | ||||||||
| LOCATION |
Gross(1) | Net(2) | ||||||
| California |
245 | 245 | ||||||
| Wyoming |
2,241 | 2,174 | ||||||
|
|
|
|
|
|||||
| TOTAL |
2,486 | 2,419 | ||||||
| UNDEVELOPED PROPERTIES | ||||||||||||
| (acres) | ||||||||||||
| LOCATION |
Gross(1) | Net(2) | Expiration of material leases | |||||||||
| California |
429 | 429 | January 10, 2013 | |||||||||
| Wyoming |
1,181 | 1,181 | June 30, 2015 | |||||||||
|
|
|
|
|
|||||||||
| TOTAL |
1,610 | 1,610 | ||||||||||
Notes:
| (1) | “Gross Acres” are the total acres in which NiMin has or had an interest. |
| (2) | “Net Acres” is the aggregate of the total acres in which NiMin has or had an interest multiplied by its working interest percentage held therein. |
15
Table of Contents
Costs Incurred
Table No. 6
2011 Capital Expenditure
| Incurred during December 31, 2011 (1) ($ 000s) |
||||
| Property Costs |
||||
| - Louisiana |
19 | |||
| - California |
102 | |||
| - Wyoming |
128 | |||
|
|
|
|||
| Total Property Costs |
249 | |||
| Drilling/Workovers |
||||
| - Louisiana |
144 | |||
| - California |
4,100 | |||
| - Wyoming |
11,770 | |||
|
|
|
|||
| Total Drilling/Workovers |
16,014 | |||
| Facilities |
||||
| - Louisiana |
— | |||
| - California |
560 | |||
| - Wyoming |
1,698 | |||
|
|
|
|||
| Total Facilities |
2,258 | |||
|
|
|
|||
|
Total(2) |
18,521 | |||
|
|
|
|||
Notes:
| (1) | See ITEM 7- “MD&A—Capital Expenditures.” |
| (2) | The Louisiana properties were sold on December 1, 2011 (see ITEM 7—“MD&A – Liquidity and Capital Resources”). |
We have invested a total of $18.52 million in capital expenditures during the year ended December 31, 2011 as compared to our 2011 capital expenditures budget of approximately $21 million due to the expiration of the Warrants issued in connection with the Prospectus Offering completed on September 4, 2009. (See ITEM 7- “MD&A—Capital Expenditures” for a complete breakdown and analysis of our incurred capital expenditures during the years ended December 31, 2011, 2010 and 2009).
Subject to the results of the Strategic Review, and access to the capital markets, we plan to invest a total of $34.01 million in capital expenditures during 2012 (See ITEM 7 – “MD&A—Capital Expenditures”).
All capital program expenditures are discretionary and are restricted by the Senior Loan including compliance with any covenants or receiving waivers therefrom (See ITEM 7 – “MD&A—Liquidity and Capital Resources”). We review all capital expenditure programs on a regular basis and adjust spending based on factors such as changes in commodity prices, drilling and production results, and availability of funding. While we believe we have sufficient capital and liquidity to finance current operations through the next twelve months, our long-term liquidity depends on its ability to access the capital markets. There can be no assurance that we will be successful with any of these initiatives (See ITEM 1.A— “Risk Factors”).
16
Table of Contents
Competitive Conditions
The oil and natural gas industry is highly competitive. We actively compete for reserve acquisitions, exploration leases, licenses and concessions and skilled industry personnel with a substantial number of other oil and natural gas companies, many of which have significantly greater financial resources than NiMin. Our competitors include major integrated oil and natural gas companies and numerous other independent oil and natural gas companies and individual producers and operators. Our competitors for the acquisition, exploration, production and development of oil and natural gas properties, and for capital to finance such activities, include companies that have greater financial and personnel resources available to them than NiMin. Certain of our customers and potential customers are themselves exploring for oil and natural gas, and the results of such exploration efforts could affect our ability to sell or supply oil or natural gas to these customers in the future. Our ability to successfully bid on and acquire additional property rights, to discover reserves, to participate in drilling opportunities and to identify and enter into commercial arrangements with customers will be dependent upon developing and maintaining close working relationships with its future industry partners and joint venture operators and its ability to select and evaluate suitable properties and to consummate transactions in a highly competitive environment. Oil and natural gas lease sales generally are a competitive bid process and we assess our interpretation of the value of such leases and then submit a bid. Field equipment availability is competitive and the prices of these goods and services can be volatile. We continue to gain access to equipment through prior agreements and contacts. We believe our distinct competitive advantage is through our scientific, integrated approach in generating drilling prospects.
Effect of Government Regulations
Our oil and natural gas exploration, development, production and related operations and activities are subject to extensive rules and regulations promulgated by federal, state and local governmental agencies. Because such rules and regulations are frequently amended or reinterpreted, we are unable to predict the future cost or impact of complying with such laws. Although the regulatory burden on the oil and natural gas industry increases our cost of doing business and, consequently, affects our profitability, these burdens generally do not affect us differently or to any greater or lesser extent than they affect other operators in the oil and natural gas industry with similar types, quantities, and locations of production. Failure to comply with such rules and regulations can result in substantial penalties. Regulatory issues related to oil and natural gas operations, title to its properties, and other environmental issues, affect our ability to explore for, develop and produce oil and natural gas in the United States. The general regulatory framework and specific issues related to our operations are set forth below.
Regulations Affecting Production
All of the states in which we operate generally require permits for drilling operations, drilling bonds, reports concerning operations, and impose other requirements related to the exploration, development and production of oil and natural gas. Such states also have statutes and regulations addressing conservation matters, including provisions for unitization or pooling of oil and natural gas properties. The establishment of maximum rates of production from oil and natural gas wells, the spacing, plugging, and abandoning of such wells, restrictions on venting, or flaring natural gas, and requirements regarding the rateability of production are also imposed. These laws and regulations may limit the amount of oil and natural gas we can produce from our wells and may limit the number of wells or the locations in which we can drill. Moreover, many states impose a production or severance tax with respect to the production and sale of oil and natural gas within their jurisdiction. States do not generally regulate wellhead prices or engage in other, or similar, direct regulation of production, but there can be no assurance this will not be done in the future. These regulations apply to us either directly when we are the operator of a property, or indirectly, when we are participating in activities operated by a third party.
Regulation of Sales
The sales prices of oil, NGL, and natural gas are presently not regulated, but rather are set by the market. We cannot predict, however, whether new legislation to regulate the price of energy commodities might be proposed, what proposals, if any, might actually be enacted by the U.S. Congress or the various state legislatures and what effect, if any, such proposals might have on our operations.
The FERC regulates interstate natural gas transportation rates and service conditions which affect the marketing of the natural gas we produce as well as the revenues we receive for sales of such production. The price and terms of access to pipeline transportation are subject to extensive federal and state regulation. The FERC is continually proposing and implementing new rules and regulations
17
Table of Contents
affecting interstate transportation. Those initiatives also may affect the interstate transportation of natural gas under certain circumstances. The stated purpose of many of these regulatory changes is to promote competition among the various sectors of the natural gas industry. We do not believe that we will be affected by any such FERC action in a manner materially different than any other natural gas producers in our areas of operation.
The price received from the sale of oil and NGL is affected by the cost of transporting such products to market. Interstate transportation rates for oil, NGL, and other products are regulated by the FERC. The FERC has established an indexing system for such transportation which allows pipelines to take an annual inflation-based rate increase. We are not able to predict with any certainty what effect, if any, these regulations will have on us, but the regulations may, over time, tend to increase transportation costs which may have the effect of reducing wellhead prices for oil and NGL.
Environmental Matters
Our operations with respect to oil and natural gas exploration, production and related activities, are subject to numerous and changing federal, state and local laws governing the discharge of materials into the environment or otherwise relating to environmental protection. These laws and regulations may: (i) require the acquisition of certain permits prior to commencing certain activities or in connection with our operations; (ii) restrict or prohibit the types, quantities and concentration of substances that we can release into the environment; (iii) restrict or prohibit the activities that could impact wetlands, endangered or threatened species or other protected areas or natural resources; (iv) require some degree of remedial action to mitigate pollution from former operations, such as pit cleanups and plugging abandoned wells; and (v) impose substantial liabilities for pollution resulting from our operations. Such laws and regulations may substantially increase the cost of operations and may prevent or delay the commencement or continuation of a given project and thus generally could have an adverse effect upon capital expenditures, earnings or competitive position. Violation of these laws and regulations could result in significant fines or penalties. Some of our properties are located in areas susceptible to destructive acts of nature, which may damage facilities and cause the release of pollutants. Environmental insurance coverage maintained by NiMin or third-party operators may not fully insure all of these risks. Although the costs of remedying such conditions may be significant, we do not believe these costs would have a material adverse impact on our financial condition and operations.
We believe that we are in substantial compliance with all current applicable environmental laws and regulations. The cost of compliance with such laws and regulations has not been material to date and is not expected to be material during 2012. We do not believe that we will be required to incur any material capital expenditures to comply with existing environmental requirements. Nevertheless, changes in existing environmental laws and regulations or in the interpretation thereof could have a significant impact on our operations, as well as the oil and natural gas industry in general and such changes cannot generally be anticipated. For instance, any change in environmental laws and regulations that result in more stringent and costly waste handling, storage, transport, disposal or clean-up requirements could have an adverse impact on our operations.
Global Warming and Climate Change
Significant studies and research have been devoted to climate change and global warming, and climate change has developed into a major political issue in the United States and globally. Certain research suggests that greenhouse gas emissions contribute to climate change and pose a threat to the environment. Recent scientific research and political debate has focused in part on carbon dioxide and methane incidental to oil and natural gas exploration and production. Many state governments have enacted legislation directed at controlling greenhouse gas emissions, and future state and federal legislation and regulation could impose additional restrictions or requirements in connection with our operations and favor use of alternative energy sources, which could increase operating costs and demand for oil products. Depending on the legislation or regulatory program that may be adopted to address emissions of greenhouse gases, we could be required to reduce greenhouse gas emissions resulting from its operations or could be required to purchase and surrender allowances for greenhouse gas emissions associated with its operations or the oil and natural gas it produces. Although we do not anticipate that it would be impacted to a greater degree than other similarly situated producers of oil and natural gas, a stringent greenhouse gas control program could have an adverse effect on our cost of doing business and could reduce the demand for the oil and natural gas that we produce.
Hazardous Substances and Waste Handling
CERCLA imposes joint and several liability, without regard to fault or legality of conduct, on classes of persons who are considered to be responsible for the release of a hazardous substance into the environment. These persons include the owner or operator of a site where a release occurs, and anyone who disposes or arranges for the disposal of a hazardous substance released at a site. Under
18
Table of Contents
CERCLA, such persons may be subject to strict, joint and several liabilities for the costs of cleaning up the hazardous substances that have been released into the environment, for damages to natural resources and for the costs of certain health studies. In addition, it is not uncommon for neighboring landowners and other third-parties to file claims for personal injury and property damage allegedly caused by hazardous substances released into the environment. While we generate substances in the course of our operations that may be regulated as hazardous substances, we have not received notification that we may be potentially responsible for cleanup costs under CERCLA.
The RCRA and comparable state statutes regulate the generation, transportation, treatment, storage, disposal and cleanup of hazardous and non-hazardous wastes. With the approval of the EPA, the individual states administer some or all of the provisions of RCRA, sometimes in conjunction with their own, more stringent requirements. Drilling fluids, produced waters, and most of the other wastes associated with the exploration, development, and production of crude oil or natural gas are currently regulated under RCRA’s non-hazardous waste provisions. However, it is possible that certain oil and natural gas exploration and production wastes now classified as non-hazardous could be classified as hazardous wastes in the future. Any such change could result in an increase in our operating expenses, which could have a material adverse effect on our results of operations and financial position.
We currently own or lease, and have in the past owned or leased, properties that for many years have been used for oil and natural gas exploration, production and development activities. Although we use operating and disposal practices that are standard in the industry at the time such practices are used, petroleum hydrocarbons or wastes may have been disposed of or released on or under the properties owned or leased by us or on or under other locations where such wastes have been taken for disposal. In addition, some of these properties have been operated by third-parties whose treatment and disposal or release of petroleum hydrocarbons and wastes was not under our control. These properties and the materials disposed or released on them may be subject to CERCLA, RCRA and analogous U.S. state laws. Under such laws, we could be required to remove or remediate previously disposed wastes or property contamination, or to perform remedial activities to prevent future contamination.
Air Emissions
The CAA and comparable state laws regulate emissions of various air pollutants through air emissions permitting programs and the imposition of other requirements. In addition, the EPA has developed, and continues to develop, stringent regulations governing emissions of toxic air pollutants at specified sources. These regulatory programs may require us to obtain permits before commencing construction on a new source of air emissions, and may require us to reduce emissions at existing facilities. For example, on July 28, 2011, the EPA issued proposed rules that would subject all oil and gas operations (production, processing, transmission, storage and distribution) to regulation under the New Source Performance Standards (“NSPS”) and National Emission Standards for Hazardous Air Pollutants (“NESHAPS”) programs. The EPA proposed rules also include NSPS standards for completions of hydraulically fractured gas wells. These standards include the reduced emission completion (“REC”) techniques developed in EPA’s Natural Gas STAR program along with pit flaring of gas not sent to the gathering line. The standards would be applicable to newly drilled and fractured wells as well as existing wells that are refractured. Further, the proposed regulations under NESHAPS include maximum achievable control technology (“MACT”) standards for those glycol dehydrators and storage vessels at major sources of hazardous air pollutants not currently subject to MACT standards. We are currently evaluating the effect these proposed rules could have on our business. EPA has indicated that it intends to adopt a final version of the proposed rules sometime in the spring of 2012. As a result, we may be required to incur increased capital and operating costs. Additionally, U.S. federal and state regulatory agencies can impose administrative, civil and criminal penalties for non-compliance with air permits or other requirements of the federal CAA and associated state laws and regulations.
Hydraulic Fracturing
Hydraulic fracturing is an important and common practice that is used to stimulate production of natural gas and/or oil from dense subsurface rock formations. The hydraulic fracturing process involves the injection of water, sand, and chemicals under pressure into the formation to fracture the surrounding rock and stimulate production. We use hydraulic fracturing as part of our operations. Hydraulic fracturing typically is regulated by state oil and natural gas commissions, but the EPA has asserted federal regulatory authority pursuant to the Safe Drinking Water Act over certain hydraulic fracturing activities involving the use of diesel. In addition, legislation has been introduced before Congress to provide for federal regulation of hydraulic fracturing under the Safe Drinking Water Act and to require disclosure of the chemicals used in the hydraulic fracturing process. At the state level, several states have adopted or are considering legal requirements that could impose more stringent permitting, disclosure, and well construction requirements on hydraulic fracturing activities. We follow applicable standard industry practices and legal requirements for groundwater protection in our drilling and hydraulic fracturing activities. Nonetheless, if new or more stringent federal, state, or local legal restrictions relating to
19
Table of Contents
the hydraulic fracturing process are adopted in areas where we operate, we could incur potentially significant added costs to comply with such requirements, experience delays or curtailment in the pursuit of exploration, development, or production activities, and perhaps even be precluded from drilling wells.
In addition, certain governmental reviews are either underway or being proposed that focus on environmental aspects of hydraulic fracturing practices. These ongoing or proposed studies, depending on their degree of pursuit and any meaningful results obtained, could spur initiatives to further regulate hydraulic fracturing under the federal Safe Drinking Water Act or other regulatory mechanisms.
To our knowledge, there have been no citations, suits, or contamination of potable drinking water arising from our fracturing operations. We do not have insurance policies in effect that are intended to provide coverage for losses solely related to hydraulic fracturing operations; however, we believe our general liability and excess liability insurance policies may cover third-party claims related to hydraulic fracturing operations and associated legal expenses in accordance with, and subject to, the terms of such policies.
Water Discharges
The CWA, and analogous U.S. state laws, impose restrictions and strict controls with respect to the discharge of pollutants, including spills and leaks of oil and other substances into state waters or waters of the United States, including wetlands. The discharge of pollutants into regulated waters is prohibited, except in accordance with the terms of a permit issued by EPA or an analogous state agency. United States federal and state regulatory agencies can impose administrative, civil and criminal penalties for non-compliance with discharge permits or other requirements of the CWA and analogous state laws and regulations.
Title to Properties
As is customary in the oil and natural gas industry, only a preliminary title review is conducted at the time we acquire properties we believe to be suitable for drilling operations. Prior to the commencement of drilling operations, a thorough title examination of the drill site tract is conducted and curative work is performed with respect to significant defects, if any, before proceeding with operations. This examination is generally done by the operator of the property which may or may not be NiMin. We believe the title to our leasehold properties is good and defensible in accordance with standards generally acceptable in the oil and natural gas industry subject to the exceptions that, in the opinion of the Company, do not detract substantially from its intended use of such properties.
The leasehold properties owned by the Company are subject to royalty, overriding royalty, and other outstanding interests customary in the industry. All of our oil and natural gas operations are conducted on properties subject to mineral leases granted by legal Persons. Royalties are established in each oil and natural gas lease through negotiations between the lessor (mineral owner) and the lessee. Some operations in Wyoming are conducted on land with mineral rights owned by multiple owners, which interests have been contractually pooled or forcibly pooled by governmental authority into a unit. All of these owners are similarly treated based on their share of the unit so created. In addition, when one lessee transfers an oil and natural gas lease to another, the transferee may reserve an overriding royalty interest, which overriding royalty interest is payable in addition to the royalty on the underlying lease. The leasehold properties may also be burdened by way of liens incident to operating agreements, current California and Wyoming state taxes, development obligations under oil and natural gas leases, and other encumbrances, easements and restrictions. We do not believe any of these burdens will materially interfere with our use of these properties.
Our Employees
Our corporate headquarters are located at 1160 Eugenia Place, Suite 100, Carpinteria, California. At December 31, 2011, we had 19 employees. Our future success will depend partially on our ability to attract, retain and motivate qualified personnel. We are not a party to any collective bargaining agreements and have not experienced any strikes or work stoppages. We consider our relations with our employees to be good. We also utilize the services of independent contractors to perform various field and other services.
Available Information
We file or furnish annual, quarterly and current reports, proxy statements and other documents with the SEC under the Exchange Act. The public may read and copy any materials that we file or furnish with the SEC at the SEC’s Public Reference Room at 100 F Street, N.E., Washington, D.C. 20549. The public may obtain information on the operation of the Public Reference Room by calling the SEC at 1-800-SEC-0330. Also, the SEC maintains a website that contains reports, proxy and information statements, and other information regarding issuers, including us, that file or furnish electronically with the SEC. The public can obtain any documents that we file with the SEC at www.sec.gov.
20
Table of Contents
We also make available free of charge through our website, www.niminenergy.com , our Annual Report on Form 10-K, Quarterly Reports on Form 10-Q, Current Reports on Form 8-K and, if applicable, amendments to those reports filed or furnished pursuant to Section 13(a) of the Exchange Act as soon as reasonably practicable after we electronically file such material with, or furnish it to, the SEC.
The business of exploring for, developing and producing oil and natural gas is inherently risky. Oil and natural gas operations involve many risks which a combination of experience, knowledge and careful evaluation may not be able to overcome. There is no assurance that further commercial quantities of oil and natural gas will be discovered or acquired by NiMin. Investors should carefully consider the following risks and uncertainties.
If we have taxable income, we may be subject to both Canadian and United States federal income tax.
We should be treated as a U.S. corporation for U.S. federal income tax purposes. We are also a “taxable Canadian corporation” for purposes of the Canadian Tax Act. As a result, if we have any taxable income (other than dividends from Legacy), it may be subject to both Canadian and United States federal income tax on such income which would likely give rise to double tax because it is unlikely that tax paid to one country will be creditable against, or deductible in computing, the tax owed the other country. In addition, if we pay a dividend to a Non-U.S. shareholder, we will be required to withhold U.S. income tax at the rate of 30%, or such lower rate as may be provided in an applicable treaty.
Certain federal income tax deductions currently available with respect to oil and natural gas exploration and development may be eliminated as a result of future legislation.
President Obama’s budget proposal for the fiscal year 2012 recommended the elimination of certain key United States federal income tax preferences currently available to oil and natural gas exploration and production companies. These changes include, but are not limited to, (i) the repeal of the percentage depletion allowance for oil and natural gas properties, (ii) the elimination of current deductions for intangible drilling and development costs and (iii) the increase in the amortization period from two years to seven years for geophysical costs paid or incurred in connection with the exploration for, or development of, oil or natural gas within the United States.
It is unclear whether any such changes will actually be enacted or, if enacted, how soon any such changes could become effective. The passage of any legislation as a result of the budget proposal or any other similar change in United States federal income tax law could affect certain tax deductions that are currently available with respect to oil and natural gas exploration and production.
We have a limited operating history and a history of losses.
We have a limited operating history and have never operated at a profit. We cannot assure you that we will operate profitably in the future or provide a return on investment.
Exploration and production requires high levels of investment and are subject to natural hazards and other uncertainties.
Exploration and production activities require high levels of investment and the cost of drilling, completing or operating wells is often uncertain. Exploration, production and drilling activities are subject to natural and operational hazards and other uncertainties, including those relating to the physical characteristics of an oil or natural gas field. After incurring significant costs, we may be required to curtail, delay or cancel drilling operations because of a variety of factors, including unexpected drilling conditions, pressure or irregularities in geological formations, equipment failures or accidents, adverse weather conditions and compliance with governmental requirements, which could adversely affect our financial condition and results of operations.
21
Table of Contents
Our patented and patent pending process for the extraction of heavy oil may not prove successful, commercially viable or result in the issuance of a patent.
We have filed patent applications in Canada, Argentina, Ecuador and Venezuela, for the protection of our U.S. patented CMD process for extracting heavy oil by injecting oxygen and water as foam to create CO2 and steam in the reservoir through wet combustion. This process is designed to increase reservoir pressure and significantly reduce oil viscosity making the oil substantially more mobile so that it will flow more rapidly into production wells. There can be no assurance that our pending patent applications in these countries will result in the issuance of a patent to us, that patents issued to or licensed by us in the past or in the future will not be challenged or circumvented by competitors or that these patents will be found to be valid or sufficiently broad to preclude our competitors from introducing processes or technologies similar to those covered by our patent application.
Oil and natural gas prices fluctuate significantly and prolonged periods of low commodity prices may make exploration or production activities uneconomical.
Oil and natural gas prices fluctuate significantly in response to regional, national and global supply and demand factors beyond our control. Political and economic developments around the world can affect world oil and natural gas supply and prices. Any prolonged period of low oil and natural gas prices could result in a decision by us or our operators to suspend or terminate exploration and/or development, as it may become uneconomical to explore for and/or produce oil or natural gas at such prices. Prolonged periods of low oil and natural gas prices will adversely affect our revenues, results of operations and financial condition. In the past, crude oil and natural gas prices have been volatile, and we expect that volatility to continue. If the United States experiences a sustained economic downturn or recession, oil and natural gas prices may fall for an extended period of time, which may adversely affect our results of operations. Global economic growth drives demand for energy from all sources, including fossil fuels. A sustained reduction in the prices we receive for our oil and natural gas production could have a material adverse effect on our results of operations. In addition, any worsening of domestic and global economic conditions could adversely affect our business and results of operations.
We may become liable for damages arising from operating and natural hazards.
The ownership and operation of oil and natural gas wells, pipelines and facilities involves a number of operating and natural hazards which may result in blowouts, environmental damage and other unexpected or dangerous conditions resulting in damage to our properties and possible liability to third parties. We intend to employ prudent risk management practices and maintain suitable liability insurance, where available. Such risks may not, in all circumstances be insurable or, in certain circumstances, NiMin may elect not to obtain insurance to cover specific risks due to the high premiums associated with such insurance or other reasons. The payment of such uninsured liabilities would reduce the funds available to us. The occurrence of a significant event that we are not fully insured against, or the insolvency of the insurer of such event, could have a material adverse effect on our financial position, results of operations or prospects. Costs incurred to repair such damage or pay such liabilities could have a material adverse effect on us, our operations and our financial condition.
Our success will be, in part, dependent on the performance of our key technical staff and managers.
Successfully exploring for, developing and commercializing oil and natural gas interests depends on a number of factors, including the technical skill of the personnel involved. Our success will be, in part, dependent on the performance of our key technical staff and managers. Failure to retain our technical staff and managers, or to attract or retain additional key personnel, with the necessary skills and experience could have a materially adverse impact upon our growth and profitability. We do not carry key person insurance. In addition, we may not be the operator of certain oil and natural gas properties in which we acquire an interest, and in such cases, we will rely on the technical experience and performance of the operator’s personnel.
Demand for drilling and related equipment and qualified personnel may delay our exploration and development activities.
Oil and natural gas exploration and development activities are dependent on the availability of drilling and related equipment and qualified personnel in the particular areas where such activities will be conducted. Demand for such limited equipment and qualified personnel in certain areas may be high which may result in higher costs. If we are not able to obtain the drilling and related equipment and qualified personnel in an area as a result of high demand, we may be required to delay our exploration and development activities. In addition, the costs of qualified personnel and equipment in the areas where our assets are located are high due to the availability of, and demand for, such qualified personnel and equipment in these areas.
22
Table of Contents
Our future oil and natural gas reserves, production, and cash flows to be derived therefrom are highly dependent on our ability to successfully acquire or discover new reserves.
Without the continual addition of new reserves, any existing reserves we may have at any particular time and the production therefrom will decline over time as such existing reserves are exploited. A future increase in our reserves will depend not only on our ability to develop any properties we may have from time to time, but also on our ability to select and acquire suitable producing properties or prospects. We cannot assure you that our future exploration and development efforts will result in the discovery and development of additional commercial accumulations of oil and natural gas.
There are numerous uncertainties inherent in estimating quantities of oil, natural gas and NGL reserves and cash flows to be derived therefrom, including many factors beyond our control.
The information concerning reserves and associated cash flow set forth in this Annual Report represents estimates only. In general, estimates of economically recoverable oil and natural gas reserves and the future net cash flows therefrom are based upon a number of variable factors and assumptions, such as historical production from the properties, production rates, ultimate reserve recovery, timing and amount of capital expenditures, marketability of oil and natural gas, royalty rates, the assumed effects of regulation by governmental agencies and future operating costs, all of which may vary from actual results. For those reasons, estimates of the economically recoverable oil and natural gas reserves attributable to any particular group of properties, classification of such reserves based on risk of recovery and estimates of future net revenues expected therefrom prepared by different engineers, or by the same engineers at different times, may vary. Our actual production, revenues, taxes and development and operating expenditures with respect to our reserves will vary from estimates thereof and such variations could be material. Further, the evaluations are based, in part, on the assumed success of the exploitation activities intended to be undertaken in future years. The reserves and estimated cash flows to be derived therefrom contained in such evaluations will be reduced to the extent that such exploitation activities do not achieve the level of success assumed in the evaluation.
Estimates of proved reserves that may be developed and produced in the future are often based upon volumetric calculations and upon analogy to similar types of reserves rather than actual production history. Estimates based on these methods are generally less reliable than those based on actual production history. Subsequent evaluation of the same reserves based upon production history and production practices will result in variations in the estimated reserves and such variations could be material. Many of our producing wells have a limited production history and thus there is less historical production on which to base the reserves estimates. In addition, a significant portion of our reserves may be attributable to a limited number of wells and, therefore, a variation in production results or reservoir characteristics in respect of such wells may have a significant impact upon our reserves.
In accordance with applicable securities laws, Huddleston has used constant price and cost estimates in calculating reserve quantities. Actual future net cash flows will be affected by other factors such as actual production levels, supply and demand for oil and natural gas, curtailments or increases in consumption by oil and natural gas purchasers, changes in governmental regulation or taxation and the impact of inflation on costs. Actual production and cash flows derived therefrom will vary from the estimates contained in the Technical Report, and such variations could be material. The Technical Report is based in part on the assumed success of activities we intend to undertake in future years. The reserves and estimated cash flows to be derived therefrom contained in the Technical Report will be reduced to the extent that such activities do not achieve the level of success assumed in the Technical Report.
Future price declines could result in a reduction in the carrying value of our proved oil and natural gas properties, which could adversely affect our results of operations.
Declines in commodity prices may result in having to make substantial downward adjustments to our estimated proved reserves. If this occurs, or if our estimates of production or economic factors change, accounting rules may require us to write-down, as a noncash charge to earnings, the carrying value of our proved oil and natural gas properties for impairments. We are required to perform impairment tests on proved assets whenever events or changes in circumstances warrant a review of our proved oil and natural gas properties. To the extent such tests indicate a reduction of the estimated useful life or estimated future cash flows of our oil and natural gas properties, the carrying value may not be recoverable and therefore require a write-down. We may incur impairment charges in the future, which could materially adversely affect our results of operations in the period incurred.
23
Table of Contents
Approximately 72 percent of our total estimated proved reserves at December 31, 2011 were undeveloped, and those reserves may not ultimately be developed.
At December 31, 2011, approximately 72 percent of our total estimated proved reserves were undeveloped. Recovery of undeveloped reserves requires significant capital expenditures and successful drilling. Our reserve data assumes that we can and will make these expenditures and conduct these operations successfully. These assumptions, however, may not prove correct. Our Technical Report includes estimates of total future development costs over the next five years associated with our proved undeveloped reserves of approximately $109.23 million. Our ability to develop proved reserves is contingent upon our cash flow from operations and obtaining adequate financing. In addition, under the SEC’s reserve rules, because proved undeveloped reserves may be booked only if they relate to wells scheduled to be drilled within five years of the date of booking, we may be required to reclassify to probable any proved undeveloped reserves that are not developed within this five year timeframe.
We may require additional financing in order to carry out our oil and natural gas acquisition, exploration and development activities.
Cash flow from our reserves may not be sufficient to fund our ongoing operating activities at all times and we may require additional financing in order to carry out our oil and natural gas acquisition, exploration and development activities. Failure to obtain such financing on a timely basis could cause us to forfeit our interest in certain properties, miss certain acquisition opportunities and reduce or terminate our operations. If revenues from our production activities decrease as a result of lower oil and natural gas prices or otherwise, it will affect our ability to expend the necessary capital to replace our reserves or to maintain our production. If our cash flow from operations is not sufficient to satisfy our capital expenditure requirements, we cannot assure you that additional debt or equity financing will be available to meet these requirements or available on favorable terms.
Failure to comply with governmental regulations may result in the imposition of fines or other penalties and the cost of compliance may be significant.
The oil and natural gas industry is subject to extensive governmental regulations pursuant to local, provincial and federal legislation. See ITEM 1 – Business Overview—“Effect of Government Regulations”. Because such rules and regulations are frequently amended or reinterpreted, NiMin is unable to predict the future cost or impact of complying with such laws. Failure to comply may result in the imposition of fines or other penalties. Environmental legislation is evolving in a manner expected to result in stricter standards and enforcement, larger fines and liability and potentially increased capital expenditures and operating costs. The discharge of oil, natural gas or other pollutants into the air, soil or water may give rise to liabilities to governments and third parties and may require us to incur costs to remedy such discharge. Should we be unable to fully fund the cost of remedying an environmental problem, we could be required to suspend operations or enter into interim compliance measures pending completion of the required remedy. Although we believe that we are in material compliance with current applicable environmental regulations, we cannot assure you that environmental laws will not result in a curtailment of production or a material increase in the costs of production, development or exploration activities or otherwise adversely affect our financial condition, results of operations or prospects.
A defect in title to our properties could result in a reduction of our revenues.
Although we intend to conduct title reviews according to industry standards prior to purchasing most oil and natural gas producing properties or commencing the drilling of wells, such title reviews do not guarantee that an unforeseen defect in the chain of title will not arise to defeat our claim of title. Any such title defect which could result in a reduction in the revenue we receive.
Certain of our directors also serve as directors and/or officers of other natural resources companies, which may give rise to conflicts.
Certain of our directors are also directors and/or officers of corporations which are in competition to our interests. For example, Mr. Bayley is also a director of American Vanadium Corp., Bearing Resources Ltd., Cypress Hills Resources Corp., Esperanza Silver Corporation, Eurasian Minerals, Inc., Kirkland Lake Gold Inc., Kramer Capital Corp., Sprott Resource Lending Corp. and TransAtlantic Petroleum Corp. In addition, Mr. Peneycad is also a director of Parex Resources Inc., Canadian Wireless Trust and R Split III Corp. Such associations may give rise to conflicts of interests from time to time. In particular, Cypress Hills Resources Corp., TransAtlantic Petroleum Corp. and Parex Resources Inc. are also involved in the oil and gas exploration, development and production business which leads to the possibility that such companies could compete with us for the acquisition of prospects. No assurances can be given that opportunities identified by such individuals will be provided to us. Such conflicts must be disclosed in accordance with, and are subject to such other procedures and remedies as applicable under the applicable corporate legislation.
24
Table of Contents
Delays in payments to us could reduce the amount of cash flow available for our business in a given period and expose us to additional third-party credit risks.
We could be subject to delays in receiving payments from operators and oil and gas purchasers for a number of reasons. We may experience delays in payments by purchasers of oil and natural gas to us or to the operators of our properties and delays by operators in remitting payment to us. In addition, payments between these parties may be delayed due to restrictions imposed by lenders, accounting delays, delays in the sale or delivery of products, delays in the connection of wells to a gathering system, adjustment for prior periods, or recovery by the operator of expenses incurred in the operation of the properties. Any of these delays could reduce the amount of cash flow available for our business in a given period and expose us to additional third-party credit risks.
An extreme winter or wet spring may result in limited access and, as a result, reduced operations or a cessation of operations.
The level of activity in the oil and natural gas industry is influenced by seasonal weather patterns. Municipalities and provincial transportation departments enforce road bans that restrict the movement of drilling rigs and other heavy equipment during periods of wet weather, thereby reducing activity levels. Also, certain oil and natural gas producing areas are located in areas that are inaccessible other than during the winter months because the ground surrounding the sites in these areas consists of swampy terrain. Seasonal factors and unexpected weather patterns may lead to declines in our exploration and production activity.
Our Senior Loan includes restrictions that may make it difficult for us to successfully execute our business strategy or to compete in our industry with companies not similarly restricted.
Our Senior Loan agreement contains several covenants that restrict our operating activities, including provisions pursuant to which we are required to meet certain financial based covenants including the limitation of total capital expenditures to an amount no greater than $25 million for the year ended December 31, 2012. The facility has a material adverse change clause relating to financial stability and for which the Lender can ultimately demand immediate repayment in the event of default. For the period ended December 31, 2011, the Company was in compliance with all covenants.
We cannot assure you that we will remain in compliance with the covenants under the Senior Loan. If we are unable to meet the requirements of the Senior Loan or any new financial transaction that we may enter into, we may be required to seek waivers from the Lender and there is no assurance that such waivers would be granted.
The Lender has been provided with security over all of our assets. If we are unable to pay our debt service charges or we otherwise commit an event of default, our lender may foreclose on or sell our properties. The proceeds of any such sale would be applied to satisfy amounts owed to the Lender and other creditors and only the remainder, if any, would be available to us.
In the event certain parties fail to meet their contractual obligations to us, such failures could have a material adverse effect on us and our financial position.
We are or may be exposed to third-party credit risk through our contractual arrangements with our current or future joint venture partners, marketers of our petroleum and natural gas production and other parties. In the event such entities fail to meet their contractual obligations to us, such failures could have a material adverse effect on us and our financial condition. In addition, poor credit conditions in the industry and of joint venture partners may impact a joint venture partner’s willingness to participate in our ongoing capital program, potentially delaying the program and the result of such program until we find a suitable alternative partner.
Hedging transactions and receivables expose us to counterparty credit risk.
Our hedging transactions expose us to risk of financial loss if a counterparty fails to perform under a contract. We use master agreements which allow us, in the event of default, to elect early termination of all contracts with the defaulting counterparty. If we choose to elect early termination, all asset and liability positions with the defaulting counterparty would be net settled at the time of election. We also monitor the creditworthiness of our counterparty on an ongoing basis. However, the current disruptions occurring in the financial markets could lead to sudden changes in a counterparty’s liquidity, which could impair their ability to perform under the terms of the hedging contract. We are unable to predict sudden changes in a counterparty’s creditworthiness or ability to perform. Even if we do accurately predict sudden changes, our ability to negate the risk may be limited depending upon market conditions. If the creditworthiness of our counterparty deteriorates and results in its nonperformance, we could incur a significant loss.
25
Table of Contents
The adoption of derivatives legislation or regulations related to derivative contracts could have an adverse impact on our ability to hedge risks associated with our business. Recent legislation on certain transactions involving derivatives may affect the use of derivatives in hedging transactions.
Some of our customers are experiencing, or may experience in the future, severe financial problems that have had or may have a significant impact on their creditworthiness. We cannot provide assurance that one or more of our customers will not default on their obligations to us or that such a default or defaults will not have a material adverse effect on our business, financial position, future results of operations, or future cash flows. Furthermore, the bankruptcy of one or more of our customers, or some other similar proceeding or liquidity constraint, might make it unlikely that we would be able to collect all or a significant portion of amounts owed by the distressed entity or entities. In addition, such events might force such customers to reduce or curtail their future use of our products and services, which could have a material adverse effect on our results of operations and financial condition. For the year ended December 31, 2011, approximately 92% of our oil revenue was from two customers. However, the Company does not believe that the loss of a purchaser would materially affect the Company’s business because there are numerous purchasers in the area in which the Company sells its production.
We may never achieve a level of profitability that would permit payment of dividends or making other forms of distributions to our stockholders.
We have never paid a dividend nor made a distribution on any of our securities. Subject to the results of the Strategic Review, given the stage of our development and our history of losses, it will likely be a long period of time before we could be in a position to make dividends or distributions to our investors. The payment of any future dividends by us will be at the sole discretion of the NiMin’s Board. In this regard, we currently intend to retain earnings to finance the expansion of our business and do not anticipate paying dividends in the foreseeable future. Our Senior Loan prohibits the declaration of dividends.
We may be subject to growth-related risks including capacity constraints and pressure on our internal systems and controls.
Our business strategy is to continue to grow our business and prospects. Our ability to effectively manage growth will require us to continue to implement and improve our operations and financial systems and to expand, train and manage our employee base. Our inability to effectively manage future growth could have a material adverse impact on our business, operations and prospects.
We cannot predict the impact of changing demand for oil and natural gas products.
Fuel conservation measures, alternative fuel requirements, increasing consumer demand for alternatives to oil and natural gas, and technological advances in fuel economy and energy generation devices could reduce the demand for crude oil and other liquid hydrocarbons. Any major changes in the demand for oil and natural gas products may have a material adverse effect on our business, financial condition, results of operations and cash flows.
If we are unable to compete effectively, we may lose existing customers or fail to attract new customers, which could have an adverse effect on our results of operations.
We actively compete for acquisitions, leases, licenses, options, concessions, claims, skilled industry personnel and other related interests with a substantial number of other companies, many of which have significantly greater experience and financial resources than we have. Our ability to successfully bid on and acquire additional property rights to participate in opportunities and to identify and enter into commercial arrangements with other parties is dependent upon developing and maintaining close working relationships with our industry partners and joint venture operators and our ability to select suitable properties and to consummate transactions in a highly competitive environment. A decrease in demand for oil and natural gas caused by any number of factors could cause competition among oil and natural gas producers to intensify, potentially resulting in downward pressure on oil and natural gas prices and adversely affecting our results of operations.
The market price of our Common Shares may be subject to wide price fluctuations.
The market price of our Common Shares may be subject to wide fluctuations in response to many factors, including variations in our operating results, divergence in financial results from analysts’ expectations, changes in earnings estimates by stock market analysts, changes in our business prospects, general economic conditions, changes in mineral reserve or resource estimates, results of exploration, legislative changes, and other events and factors outside of our control. In addition, stock markets have from time to time experienced extreme price and volume fluctuations, which, as well as general economic and political conditions, could adversely affect the market price for our Common Shares.
26
Table of Contents
Some of our properties are located in areas susceptible to destructive acts of nature.
Some of our properties are located in areas susceptible to destructive acts of nature, which may damage facilities and cause the release of pollutants. Environmental insurance coverage maintained by NiMin or third-party operators may not fully insure all of these risks (See ITEM 1. – “Business Overview – Environmental Matters”).
Our producing properties are located substantially in the Bighorn Basin, Wyoming and the San Joaquin Basin, California, making us vulnerable to risks associated with operating in limited geographic areas.
Our producing properties are geographically concentrated in the Bighorn Basin, Wyoming and the San Joaquin Basin, California. At December 31, 2011, substantially all of our total estimated proved reserves were attributable to properties located in these areas. As a result of this concentration, we may be disproportionately exposed to the impact of regional supply and demand factors, delays or interruptions of production from wells in these areas caused by governmental regulation, processing or transportation capacity constraints, market limitations, drought related conditions or interruption of the processing or transportation of oil, natural gas or natural gas liquids.
ITEM 1.B. UNRESOLVED STAFF COMMENTS
Not applicable.
We are not aware of any claims which could have a material impact to our financial statements, and we do not know of any material proceedings contemplated by governmental authorities. We are not aware of any material proceedings to which any director, officer or any of our affiliates, any owner of record or beneficially of more than five percent of any class of our voting securities, or any associate of any such director, officer, our affiliates, or security holder, is a party adverse to us or our consolidated subsidiary or has a material interest adverse to us or our consolidated subsidiary.
ITEM 4. MINE SAFETY DISCLOSURE
Not applicable.
27
Table of Contents
ITEM 5. MARKET FOR REGISTRANT’S COMMON EQUITY, RELATED STOCKHOLDER MATTERS AND ISSUER PURCHASES OF EQUITY SECURITIES
The Common Shares were listed on the TSX under the trading symbol “NNN” on September 4, 2009 and began trading on September 8, 2009. Prior thereto, the Preconsolidated Shares were listed on the TSXV under the trading symbol “NNI.P” beginning November 13, 2007.
The following table sets forth the reported high and low prices and the trading volume for the Common Shares on the TSX for the two most recent fiscal periods as reported by a public source we consider reliable.
Table No. 7
Trading Prices on TSX
| High (Cdn$) | Low (Cdn$) | Volume | ||||||
| 4th Quarter 2011 |
1.13 | 0.53 | 9,041,546 | |||||
| 3rd Quarter 2011 |
1.82 | 1.12 | 3,354,941 | |||||
| 2nd Quarter 2011 |
2.15 | 1.54 | 6,775,231 | |||||
| 1st Quarter 2011 |
2.65 | 1.54 | 13,306,222 | |||||
| 4th Quarter 2010 |
1.88 | 1.11 | 4,755,534 | |||||
| 3rd Quarter 2010 |
1.40 | 0.90 | 5,958,757 | |||||
| 2nd Quarter 2010 |
1.77 | 0.91 | 5,015,513 | |||||
| 1st Quarter 2010 |
1.47 | 1.10 | 2,062,113 | |||||
The Company’s Common Shares are traded on the OTCQX under the symbol NEYYF since October 22, 2009. The following table sets forth the reported high and low prices and the trading volume for the Common Shares on the OTCQX for the two most recent fiscal periods as reported by a public source we consider reliable.
Table No. 8
Trading Prices on OTCQX
| High ($) | Low ($) | Volume | ||||||
| 4th Quarter 2011 |
1.09 | 0.50 | 5,161,545 | |||||
| 3rd Quarter 2011 |
1.94 | 1.07 | 1,641,780 | |||||
| 2nd Quarter 2011 |
2.24 | 1.55 | 2,798,738 | |||||
| 1st Quarter 2011 |
2.74 | 1.55 | 5,363,610 | |||||
| 4th Quarter 2010 |
1.85 | 1.09 | 4,602,604 | |||||
| 3rd Quarter 2010 |
1.22 | 0.88 | 637,187 | |||||
| 2nd Quarter 2010 |
1.60 | 0.88 | 1,488,052 | |||||
| 1st Quarter 2010 |
1.41 | 1.13 | 674,560 | |||||
The Company’s Common Shares are traded on the OTC-BB under the symbol NEYYF since March 11, 2011. The following table sets forth the reported high and low prices and the trading volume for the Common Shares on the OTC-BB for the most recent fiscal period as reported by a public source we consider reliable.
28
Table of Contents
Table No. 9
Trading Prices on OTC-BB
| High ($) | Low ($) | Volume | ||||||||||
| 4th Quarter 2011 |
1.09 | 0.50 | 5,161,545 | |||||||||
| 3rd Quarter 2011 |
1.94 | 1.07 | 1,641,780 | |||||||||
| 2nd Quarter 2011 |
2.24 | 1.55 | 2,798,738 | |||||||||
| March, 2011 |
2.37 | 1.93 | 1,182,262 | |||||||||
The Common Shares were listed on the TSX under the trading symbol “NNN” on September 4, 2009 and began trading on September 8, 2009. Prior thereto, the Preconsolidated Shares were listed on the TSXV under the trading symbol “NNI.P”. The Common Shares are also listed on the OTCQX and under the symbol NEYYF since October 22, 2009 and on OTC-BB under the symbol NEYYF since March 11, 2011.
In September 2011, we completed the Private Placement of 2,758,620 Units of the Company at a purchase price of CDN$1.45 per Unit for gross proceeds of CDN$3,999,999 or USD $4,010,545, net of CDN $267,224 or USD $267,928 of agents fees. The net proceeds of the Private Placement are being used to advance our interest in our oil and gas properties in California and Wyoming and for general corporate purposes.
On March 13, 2012, the last reported sales price of our Common Shares on the TSX, OTCQX and OTC-BB was CDN$0.79, USD$0.80 and USD$0.80 per share, respectively.
As of March 13, 2012, there were 69,834,396 holders of record of our Common Shares.
Dividend Policy
We have not previously paid cash dividends on our Common Shares. Subject to the results of the Strategic Review, we do not intend to pay in the foreseeable future, cash dividends on our Common Shares. Covenants contained in our Senior Loan restrict the payment of dividends on our Common Shares. We currently intend to retain all future earnings to fund the development and growth of our business. Any payment of future dividends will be at the discretion of our board of directors and will depend on, among other things, our earnings, financial condition, capital requirements, level of indebtedness, statutory and contractual restrictions applying to the payment of dividends and other considerations that our board of directors deems relevant.
Certain Canadian Federal Income Tax Consequences
The following general summary describes the material Canadian federal income tax consequences applicable to a holder of our Common Shares who is a resident of the United States and is not a resident, or deemed to be a resident of Canada for purposes of the Income Tax Act (Canada) (the “ITA”), that qualifies for benefits under the Canada-United States Convention (1980), as amended (the “Treaty”) and is not affiliated with the Company, did not acquire our Common Shares by virtue of employment, is not a financial institution, partnership or a trust, holds our Common Shares as capital property, and does not use or hold, and is not deemed to use or hold, his or her Common Shares in connection with carrying on a business in Canada (a “Non-Resident of Canada Holder”). Special rules, which are not discussed in this summary, may apply to a Non-Resident of Canada Holder that is an insurer carrying on business in Canada and elsewhere.
This summary is based upon the current provisions of the ITA, the regulations thereunder (the “Regulations”), the current publicly announced administrative and assessing policies of Canada Revenue Agency and all specific proposals (the “Tax Proposals”) to amend the ITA and Regulations announced by the Minister of Finance (Canada) prior to the date hereof. This description is not exhaustive of all possible Canadian federal income tax consequences and, except for the Tax Proposals, does not take into account or anticipate any changes in law, whether by legislative, governmental or judicial action, nor does it take into account any income tax laws or considerations of any province or territory of Canada or foreign tax considerations, which may differ significantly from those discussed herein. This summary assumes that the Tax Proposals will be enacted in their form as of the date hereof.
29
Table of Contents
The following discussion is for general information only and is not intended to be, nor should it be construed to be, legal or tax advice to any holder of Common Shares of the Company and no opinion or representation with respect to the Canadian Federal Income Tax consequences to any such holder or prospective holder is made. Accordingly, holders and prospective holders of Common Shares should consult with their own tax advisors about the federal, provincial and foreign tax consequences of purchasing, owning and disposing of common shares.
Dividends
Canadian withholding tax at a rate of 25% (subject to reduction under the provisions of any applicable income tax treaty or convention) will be payable on dividends paid or credited, or deemed to be paid or credited on the Common Shares, to a Non-Resident of Canada Holder. By virtue of Article X of the Treaty, the rate of withholding tax on dividends paid or credited to residents of the United States is generally limited to 15% of the dividend (or 5% in the case of certain corporate shareholders beneficially owning at least 10% of the Company’s voting shares).
The Company has not, and subject to the results of the Strategic Review, does not anticipate issuing dividends.
Where the Company acquires Common Shares from a Non-Resident of Canada Holder (unless we acquire the Common Shares in the open market in the manner in which shares would normally be acquired by any member of the public), such acquisition will result in a deemed dividend to the Non-Resident of Canada Holder equal to the amount by which the consideration paid by us exceeds the paid-up capital of such Common Shares. The amount of such deemed dividend will be subject to withholding tax as described above.
Disposition of Common Shares
Generally, a Non-Resident of Canada Holder will not be subject to tax under the ITA in respect of any capital gain realized on a disposition of Common Shares provided that such shares do not constitute, and are not deemed to constitute, “taxable Canadian property” of the Non-Resident of Canada Holder. As long as the Common Shares are then listed on a “designated stock exchange” (which includes the TSX) the Common Shares generally will not constitute taxable Canadian property of a Non-Resident of Canada Holder, unless: (a) at any time during the 60-month period preceding the disposition, the Non-Resident of Canada Holder, persons not dealing at arm’s length with such Non-Resident of Canada Holder or the Non-Resident of Canada Holder together with all such persons, owned 25% or more of the issued shares of any class or series of the capital stock of the Company; and (b) more than 50% of the fair market value of the Common Shares was derived, directly or indirectly, from a combination of: (i) real or immoveable property situated in Canada; (ii) “Canadian resource property” (as such term is defined in the ITA); (iii) “timber resource property” (as such term is defined in the ITA); or (iv) options in respect of interests in, or for civil law rights in, any such properties whether or not the property exists.
A Non-Resident of Canada Holder’s capital gain (or capital loss) in respect of Common Shares (that constitute or are deemed to constitute taxable Canadian property) from a disposition or deemed disposition is the amount, if any, by which the taxpayers proceeds of disposition exceed (or are exceeded by) the aggregate of the adjusted cost basis of such Common Shares and any reasonable expenses of disposition. One half of a capital gain (the “taxable capital gain”) is included in income, and one half of a capital loss in a year (the “allowable capital loss”) is deductible from taxable capital gains realized in the same year. The amount by which a shareholder’s allowable capital loss exceeds his taxable capital gains in a year may be deducted from a taxable capital gain realized by the shareholder in the three previous or any subsequent year, in the circumstances and to the extent described in the ITA.
Non-Resident of Canada Holders whose Common Shares may be taxable Canadian property should consult their own tax advisors.
30
Table of Contents
Comparison of Cumulative Return
The following graph compares the percentage change in the cumulative shareholder return over the last five years of our Common Shares (assuming a $100 investment was made on September 4, 2009, the date on which the Corporation’s Common Shares were listed on the Toronto Stock Exchange) and the cumulative total return of the S&P/TSX Composite Index and the S&P/TSX Capped Energy Index.
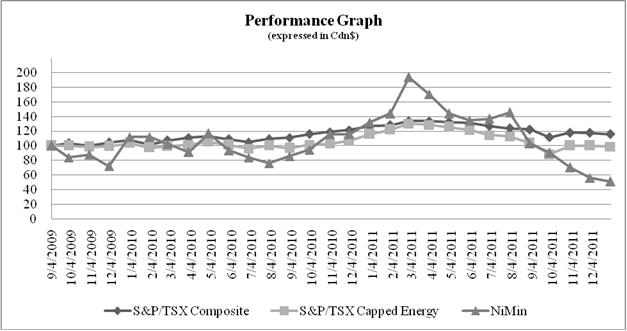
ASSUMES $100 INVESTED ON SEPTEMBER 4, 2009
ASSUMES DIVIDEND REINVESTED
FISCAL YEAR END DEC. 31, 2011
(Expressed in Canadian dollars)
| 12/31/2009 | 12/31/2010 | 12/31/2011 | ||||||||||
| NiMin Energy Corp |
112 | 132 | 51 | |||||||||
| S&P/TSX Composite |
108 | 127 | 99 | |||||||||
| S&P/TSX Capped Energy |
104 | 116 | 116 | |||||||||
31
Table of Contents
ITEM 6. SELECTED FINANCIAL DATA
The selected financial data of the Company for the fiscal years ended December 31, 2011, 2010, 2009, 2008 and 2007 has been derived from the audited annual consolidated financial statements of the Company. The information contained in the selected financial data is qualified in its entirety by reference to the Company’s consolidated financial statements and related notes included in ITEM 8 – Financial Statements, and should be read in conjunction with such financial statements and with the information appearing in ITEM 7. – MD&A. The audited financial statements have been prepared in accordance with generally accepted accounting principles in the United States (“U.S. GAAP”).
Table No. 10
Selected Financial Data
| Year ended December 31, 2011(1) ($) |
Year ended December 31, 2010(1) ($) |
Year ended December 31, 2009(1) ($) |
Year ended December 31, 2008(1) ($) |
Year ended December 31, 2007(1) ($) |
||||||||||||||||
| Revenues |
24,305,685 | 14,029,198 | 6,498,789 | 10,674,567 | 4,946,242 | |||||||||||||||
| Production expense |
(11,565,565 | ) | (9,116,563 | ) | (5,162,936 | ) | (3,183,106 | ) | (765,016 | ) | ||||||||||
| Gain (loss) on derivative contracts |
(753,053 | ) | (708,032 | ) | (300,778 | ) | — | — | ||||||||||||
| General & administrative expenses |
(7,894,479 | ) | (7,888,736 | ) | (6,826,661 | ) | (5,734,454 | ) | (3,070,790 | ) | ||||||||||
| Interest income |
44,595 | 54,070 | 78,127 | 472,746 | 821,676 | |||||||||||||||
| Interest expenses |
(5,406,133 | ) | (7,108,109 | ) | (228,131 | ) | (442,451 | ) | (921,330 | ) | ||||||||||
| Foreign exchange gain (loss) |
(26,101 | ) | 6,617 | (385,626 | ) | (538 | ) | (499,924 | ) | |||||||||||
| Other |
(196,649 | ) | 248,734 | — | (111,975 | ) | (1,014 | ) | ||||||||||||
| DD&A |
(3,507,669 | ) | (3,190,905 | ) | (3,351,753 | ) | (3,393,333 | ) | (1,076,064 | ) | ||||||||||
| Change in fair value of warrants |
1,062,208 | 1,674,053 | (3,523,543 | ) | — | — | ||||||||||||||
| Change in fair value of options |
707,513 | — | — | — | — | |||||||||||||||
| Impairment of oil and natural gas properties |
— | — | (6,313,633 | ) | (35,872,167 | ) | — | |||||||||||||
|
|
|
|
|
|
|
|
|
|
|
|||||||||||
| Loss before income taxes |
(3,229,648 | ) | (11,999,673 | ) | (19,516,145 | ) | (37,590,711 | ) | (566,220 | ) | ||||||||||
| Income tax expense |
— | 386,772 | 232,824 | 11,300 | — | |||||||||||||||
|
|
|
|
|
|
|
|
|
|
|
|||||||||||
| Net loss |
(3,229,648 | ) | (12,386,445 | ) | (19,748,969 | ) | (37,602,011 | ) | (566,220 | ) | ||||||||||
|
|
|
|
|
|
|
|
|
|
|
|||||||||||
| Net loss per share—basic and diluted |
(0.05 | ) | (0.21 | ) | (0.47 | ) | (1.07 | ) | (0.02 | ) | ||||||||||
Note:
| (1) | Audited |
| December 31, 2011 ($) |
December 31, 2010 ($) |
December 31, 2009 ($) |
December 31, 2008 ($) |
December 31, 2007 ($) |
||||||||||||||||
| Working Capital (Deficiency) |
(2,628,937 | ) | 5,239,836 | (16,446,170 | ) | 13,487,399 | 27,218,575 | |||||||||||||
| Stockholders’ equity |
46,984,363 | 32,077,128 | 31,670,532 | 38,304,807 | 54,720,474 | |||||||||||||||
| Long-term Debt |
36,000,000 | 36,000,000 | — | — | 617,767 | |||||||||||||||
| Total Assets |
90,519,375 | 81,908,408 | 64,900,896 | 42,146,268 | 62,199,388 | |||||||||||||||
| Dividends |
— | — | — | — | — | |||||||||||||||
| Common Stock |
108,758,460 | 93,107,905 | 83,106,467 | 72,861,988 | 53,930,045 | |||||||||||||||
| Number of Shares |
69,834,396 | 61,690,977 | 52,410,977 | 37,301,656 | 33,316,392 | |||||||||||||||
32
Table of Contents
| ITEM 7. | MANAGEMENT’S DISCUSSION AND ANALYSIS OF FINANCIAL CONDITION AND RESULTS OF OPERATION |
The following discussion and analysis should be read in conjunction with the “Selected Consolidated Financial Information” in Item 6 above and our historical consolidated financial statements and the accompanying notes included elsewhere in this Annual Report on Form 10-K.
Overview
We are an oil and gas company engaged in the acquisition, development and production of oil and gas properties in the United States. We have operated as an exploration and production company since late 2006 and have principal operations in the Bighorn Basin, Wyoming and the San Joaquin Basin, California.
Oil and Gas Sales Report
Table No. 11
Average daily production sold by region (1)
| Year | Year | Year | ||||||||||
| Ended | Ended | Ended | ||||||||||
| December | December | December | ||||||||||
| 31, 2011 | 31, 2010 | 31, 2009 | ||||||||||
| Louisiana (2) |
||||||||||||
| Oil—Bbl/d |
59 | 66 | 81 | |||||||||
| Gas—Mcf/d |
439 | 795 | 1173 | |||||||||
| Total Louisiana (boe/d) |
133 | 199 | 277 | |||||||||
| California |
||||||||||||
| Oil—Bbl/d |
201 | 218 | 239 | |||||||||
| Gas—Mcf/d |
0 | — | — | |||||||||
| Total California (boe/d) |
201 | 218 | 239 | |||||||||
| Wyoming (3) |
||||||||||||
| Oil—Bbl/d |
700 | 426 | 29 | |||||||||
| Gas—Mcf/d |
— | — | — | |||||||||
| Total Wyoming (boe/d) |
700 | 426 | 29 | |||||||||
| Total Oil (Bbl/d) |
960 | 710 | 350 | |||||||||
| Total Gas (Mcf) |
439 | 795 | 1,173 | |||||||||
| Total (boe/d) |
1,033 | 842 | 546 | |||||||||
Notes:
| (1) | These numbers are net to NiMin’s working interest for the relevant properties. |
| (2) | The Louisiana properties were sold on December 1, 2011 (see ITEM 7—“MD&A – Liquidity and Capital Resources”). |
| (3) | Wyoming average volumes in 2009 are based on 14 days of production and averaged over the entire applicable period. |
33
Table of Contents
Crude oil and natural gas sales
For the year ended December 31, 2011, we recorded gross revenues of $30.95 million, as compared to $18.75 million for the year ended December 31, 2010. Oil sales as a percentage of total revenue during the year ended December 31, 2011 as compared to the same period in 2010 increased from 93% to 98%. Oil volumes increased by 35% to 960 Bopd and the price received increased by 28% to $86.44 during the year ended December 31, 2011 as compared to the same period in 2010. Natural gas sales as a percentage of total revenue during the year ended December 31, 2011 as compared to the same period in 2010 decreased from 7% to 2%. Natural gas volumes decreased by 45% to 439 Mcf/d and the price received decreased by 10% to $4.09 during the year ended December 31, 2011 as compared to the same period in 2010. The increase in gross revenues for the year ended December 31, 2011 as compared to the same period during 2010, is mainly due to successful drilling and work-overs in Wyoming.
For the year ended December 31, 2010, we recorded gross revenues of $18.75 million, as compared to $8.71 million for the year ended December 31, 2009. Oil sales as a percentage of total revenue during the year ended December 31, 2010 as compared to the same period in 2009 increased from 80% to 93%. Oil volumes increased by 103% to 710 Bopd and the price received increased by 24% to $67.30 during the year ended December 31, 2010 as compared to the same period in 2009. Natural gas sales as a percentage of total revenue during the year ended December 31, 2010 as compared to the same period in 2009 decreased from 20% to 7%. Natural gas volumes decreased by 32% to 795 Mcf/d and the price received increased by 9% to $4.55 during the year ended December 31, 2010 as compared to the same period in 2009. The increase in gross revenues for the year ended December 31, 2010 as compared to the same period during 2009, is attributable to higher realized commodity prices, the acquisition of producing fields in the state of Wyoming in December 2009, new drilling and work-overs in Wyoming.
Crude Oil Derivative Contracts
On November 11, 2011, we entered into a swap contract to minimize the variability in cash flows due to price movements in crude oil. We agreed to economically hedge the future sales of 100 barrels of NYMEX WTI crude oil per day at a fixed price of $96.75 starting January 1, 2012 for a period of 12 months.
On December 20, 2010, we agreed to economically hedge the future sales of 125 barrels of NYMEX WTI crude oil per day at a fixed price of $90.40 starting January 1, 2011 for a period of 12 months and 250 barrels of NYMEX WTI crude oil per day at a fixed price of $90.40 starting January 1, 2012 for a period of 12 months.
On January 4, 2010, we agreed to economically hedge the future sale of 7,500 barrels of NYMEX WTI crude oil per month at a fixed price of $85.10 per barrel for a period of 24 months.
On April 1, 2009, we agreed to economically hedge the future sale of 3,000 barrels of NYMEX WTI crude oil per month at a fixed price of $56.85 per barrel for a period of 9 months.
We do not designate our derivative financial instruments as hedging instruments for accounting purposes and, as a result, we recognize the current change in a derivative’s fair value in earnings. At December 31, 2011, we recognized $976,929 as a derivative liability on crude oil derivative contracts.
For the year ended December 31, 2011, the change in derivative contracts included a realized loss of $1.12 million and an unrealized gain of $365,109. For the year ended December 31, 2010, the change in derivative contracts included a realized gain of $501,255 and an unrealized loss of $1.21 million. For the year ended December 31, 2009, the change in derivative contracts included a realized gain of $300,778.
Royalties and Production Taxes
California
For the years ended December 31, 2011, 2010 and 2009, we paid royalties on oil production sold from the Pleito Creek Field located in Kern County, California. Royalties for production extracted below 3,000 feet subsea are 25% and for production extracted from above 3,000 feet subsea are 20%. During the same periods, we also paid a production fee consisting of 635.10 barrels of oil per month which
34
Table of Contents
commenced in 2008 and declines at a rate of 5.5% each year. For the year ended December 31, 2011, the production fee rate was 535.90 barrels of oil per month. For the year ended December 31, 2010, the production fee rate was 567.10 barrels of oil per month. For the year ended December 31, 2009, the production fee rate was 600.10 barrels of oil per month.
For the year ended December 31, 2011, we recorded royalties in California in the amount of $2.19 million as compared to $1.68 million for the same period in 2010. The increase in royalties for the year ended December 31, 2011 is mainly due to higher realized commodity prices.
For the year ended December 31, 2010, we recorded royalties in California in the amount of $1.68 million as compared to $1.29 million for the same period in 2009. The increase in royalties for the year ended December 31, 2010 is mainly due to higher realized commodity prices.
Louisiana
Royalties on our Louisiana production varied by property. For the year ended December 31, 2011, we recorded $842,900 in royalties representing an average rate of 29.56%, as compared to $870,564 representing an average rate of 26.88% for the year ended December 31, 2010. The increase in royalties is mainly due to higher realized commodity prices.
For the year ended December 31, 2010, we recorded $870,564 in royalties representing an average rate of 26.88%, as compared to $784,472 representing an average rate of 22.37% for the year ended December 31, 2009. The increase in royalties is mainly due to higher realized commodity prices.
On December 1, 2011, we sold our Louisiana properties (see ITEM 7—“MD&A – Liquidity and Capital Resources”).
Wyoming
For the year ended December 31, 2011, we recorded $3.62 million in royalties in Wyoming representing an average rate of 17.67%, as compared to $2.12 million or 20.51% for the same period in 2010. The increase in royalties is mainly due to higher realized commodity prices.
For the year ended December 31, 2010, we recorded $2.12 million in royalties in Wyoming representing an average rate of 20.51%, as compared to $143,261 or 21.42% for the same period in 2009. Royalties during 2009 represent 14 days of expense as the properties were acquired in December 2009.
Operating Costs
Table No. 12
Average Operating costs per BOE
| Year ended | Year ended | Year ended | ||||||||||
| December 31, | December 31, | December 31, | ||||||||||
| 2011 | 2010 | 2009 | ||||||||||
| ($) | ($) | ($) | ||||||||||
| Operating costs |
11,565,565 | 9,116,563 | 5,162,936 | |||||||||
| Average operating costs per boe |
30.66 | 29.66 | 25.93 | |||||||||
For the year ended December 31, 2011, we incurred operating costs in the amount of $11.57 million, as compared to $9.12 million for the same period in 2010. During the year ended December 31, 2011, we incurred increased operating costs as compared to the same period in 2010 mainly due to: (i) higher production volumes in 2011, (ii) higher severance taxes paid in 2011 resulting from a 65% increase in oil and gas revenues for the year ended December 31, 2011, (iii) workovers performed in Wyoming during the year ended December 31, 2011, (iv) temporary production equipment rentals and contract labor expense; and (v) costs associated with the Krotz Springs Field and its maintenance due to the south Louisiana flooding.
35
Table of Contents
For the year ended December 31, 2010, we incurred operating costs in the amount of $9.12 million, as compared to $5.16 million for the same period in 2009. During the year ended December 31, 2010, we incurred increased operating costs as compared to the same period in 2009 mainly due to: (i) our newly acquired Wyoming Assets which added a total of $1.23 million during the three months ended December 31, 2009 and $2.80 million during the year ended December 30, 2010 to the overall total increase in operational costs; and (ii) increased operating costs in California associated with the CMD.
Operating costs included severance taxes paid in Louisiana and Wyoming. There is no severance tax in the state of California. Severance taxes in Louisiana consist of 12.5% on gross oil sales and $0.164 per Mcf of gas sales. For the year ended December 31, 2011, we recorded $2.36 million in severance taxes, as compared to $1.32 million for the same period in 2010. The increase in severance taxes is mainly due to higher production volumes and commodity prices.
For the year ended December 31, 2010, we recorded $1.32 million in severance taxes, as compared to $422,786 for the same period in 2009. The increase in severance taxes in 2010 is mainly due to the Wyoming Assets in December 2009.
General and Administrative Expenses
Table No. 13
Average G&A per BOE
| Year ended | Year ended | Year ended | ||||||||||
| December | December | December | ||||||||||
| 31, 2011 | 31, 2010 | 31, 2009 | ||||||||||
| ($) | ($) | ($) | ||||||||||
| G&A expense before stock-based compensation |
5,288,587 | 5,172,115 | 3,881,464 | |||||||||
| Average per boe |
14.02 | 16.83 | 19.49 | |||||||||
| Stock-based compensation (“SBC”) |
2,605,892 | 2,716,621 | 2,945,197 | |||||||||
| Average per boe |
6.91 | 8.84 | 14.79 | |||||||||
|
|
|
|
|
|
|
|||||||
| G&A |
7,894,479 | 7,888,736 | 6,826,661 | |||||||||
|
|
|
|
|
|
|
|||||||
| Average per boe |
20.93 | 25.67 | 34.29 | |||||||||
For the year ended December 31, 2011, we recorded G&A expense, excluding SBC of $5.29 million, as compared to $5.17 million for the same period in 2010. This increase during the year ended December 31, 2011 is due to higher accounting and personnel expense, as compared to the same period in 2010.
For the year ended December 31, 2010, we recorded G&A expense, excluding SBC of $5.17 million, as compared to $3.88 million for the same period in 2009. This increase during the year ended December 31, 2010, is mainly due to: (i) higher personnel expense; (ii) additional expenses related to preparation of the Registration Statement; and (iii) higher accounting and legal services associated with being a U.S. and Canadian registered public company.
We use the grant date fair-value-based method of accounting for SBC and recognizes compensation cost using the straight-line method over the requisite service period for the entire award for stock options.
For the year ended December 31, 2011, we recorded SBC in the amount of $2.61 million, as compared to $2.72 million for the same period in 2010. The decrease in SBC for the year ended December 31, 2011 as compared to the previous year is due to forfeiture of options during 2011.
For the year ended December 31, 2010, we recorded SBC in the amount of $2.72 million, as compared to $2.95 million for the same period in 2009. The decrease in SBC for the year ended December 31, 2010 as compared to the previous year is due to the immediate recognition of expected future costs on cancelled options and additional grants during 2009.
36
Table of Contents
Depreciation, Depletion, Amortization and Accretion Expense
Table No. 14
Average DD&A per BOE
| Year ended | Year ended | Year ended | ||||||||||
| December | December | December | ||||||||||
| 31, 2011 | 31, 2010 | 31, 2009 | ||||||||||
| ($) | ($) | ($) | ||||||||||
| DD&A expense |
3,507,669 | 3,190,905 | 3,351,753 | |||||||||
| Average per boe |
9.30 | 10.38 | 16.83 | |||||||||
We follow the full-cost method of accounting and all costs included in proved properties and all future development costs along with our total proved reserves determine the period’s depletion cost.
For the year ended December 31, 2011, we recorded DD&A in the amount of $3.51 million, as compared to $3.19 million for the same period in 2010. The decrease in the DD&A rate per BOE for the year ended December 31, 2011, is due to an increase in our proved reserves at December 31, 2011 (15,923 Mboe in 2011, as compared to 13,717 Mboe in 2010).
For the year ended December 31, 2010, we recorded DD&A in the amount of $3.19 million, as compared to $3.35 million for the same period in 2009. The decrease in DD&A rate per BOE for the year ended December 31, 2010, as compared to the same period in 2009, is due to an increase in the total proved reserves due to: (i) conversion of probable reserves to proved reserves in Wyoming as a result of our successful 2010 development program; and (ii) positive results from the CMD project in California.
Change in Fair Value of Warrants and Options
The exercise price of certain warrants is denominated in Canadian dollar which is not the functional currency of the Company. As a result, these warrants are classified as a liability on the balance sheet and recorded at their fair value at the end of each period and the change in fair value recognized in earnings.
During the year ended December 31, 2011, 5,354,800 warrants were exercised. At December 31, 2011, the fair value of the warrant liability was $235,134, with a gain of $1.06 million recognized in earnings during the year ended December 31, 2011. At December 31, 2010, the fair value of the outstanding warrants was $5.63 million, with a gain of $1.67 million recognized in earnings during the year ended December 31, 2010. At December 31, 2009, the fair value of the outstanding warrants was $7.38 million, with a charge of $3.52 million recognized in earnings during the year ended December 31, 2009. The fair value of the warrants is calculated using the Black-Scholes Model.
We continue to classify the remaining balance of warrants issued prior to September 4, 2009, as additional paid in capital warrants where the issue date fair value of the original equity classified warrant is greater than the fair value of the liability of the underlying warrant at the balance sheet date.
The exercise price of 1.5 million stock options relating to former employees that transitioned to a consulting role is denominated in Canadian dollars, which is not the functional currency of the Company (which is the U.S. dollar). As a result, the applicable 999,998 vested options are classified as a liability on the balance sheet and recorded at their fair value at the end of each period and the change in fair value is recognized in earnings.
At December 31, 2011, the fair value of the options liability was $136,773 with a gain of $707,513 recognized in earnings during the year ended December 31, 2011. The fair value of the options is calculated using the Black-Scholes Model.
37
Table of Contents
Reduction of Carrying Value of Proved Oil and Natural Gas Properties
Under the full cost method of accounting, capitalized oil and gas property costs less accumulated depletion and net of deferred income taxes may not exceed an amount equal to the present value, discounted at 10%, of estimated future net revenues from proved oil and gas reserves plus the cost of unproved properties not subject to amortization (without regard to estimates of fair value) or estimated fair value, if lower of unproved properties that are subject to amortization. During 2009, we reduced the carrying values of certain of our proved oil and natural gas properties by $6.31 million due to full-cost ceiling limitations. This reduction was recognized in the first quarter of 2009 and resulted from a significant decrease in the full cost ceiling. The lower ceiling value largely resulted from the effects of sharp declines in oil, natural gas, and NGL prices compared to prices in previous periods. There were no impairments to our proved oil and natural gas properties during 2011 or 2010.
Interest Income and Expense
For the year ended December 31, 2011, we recorded interest expense of $5.41 million ($906,569 non-cash) related to the Senior Loan, as compared to $7.11 million ($3.46 million non-cash) for the same period in 2010 related to: (i) the Short-term Loan; (ii) and the Senior Loan. The amortization of debt issuance cost related to the Short-term Loan and Senior Loan is included in interest expense. For the year ended December 31, 2009, we recorded interest expense of $228,131. Interest expense recorded in 2009 was due to the Short-term Loan.
For the year ended December 31, 2011, we recorded interest income in the amount of $44,595 as compared to $54,070 for the same period in 2010. For the year ended December 31, 2010, we recorded interest income in the amount of $54,070 as compared to $78,127 for the same period in 2009. Lower interest income for the years ended December 31, 2011 and 2010 is due to a reduction in average interest-bearing cash balances and lower interest rates.
Income Tax
At December 31, 2011, we had estimated non capital losses of approximately $96.48 million available to reduce future taxable income. The benefit of these losses has not been recognized as a full valuation allowance has been taken. As a result of available deductions and our planned capital expenditures for 2011, we do not expect to pay income taxes in 2011. At December 31, 2010, we had estimated non capital losses of approximately $76.6 million available to reduce future taxable income. At December 31, 2009, we had estimated non capital losses of approximately $54.90 million available to reduce future taxable income.
Foreign Currency Exchange
Our foreign exchange expense is derived from our cash balances denominated in Canadian dollars. For the year ended December 31, 2011, we recorded a foreign exchange loss of $26,101. For the year ended December 31, 2010, we recorded a foreign exchange gain of $6,617. For the year ended December 31, 2009, the Company recorded a loss in foreign exchange of $385,626.
38
Table of Contents
Capital Expenditures
The following tables provide information regarding our capital expenditures incurred during the periods presented:
Table No. 15
Capital Expenditures
| Incurred | Incurred | Incurred | ||||||||||
| during | during | during | ||||||||||
| December 31, | December 31, | December 31, | ||||||||||
| 2011 | 2010 | 2009 | ||||||||||
| ($000s) | ($000s) | ($000s) | ||||||||||
| Property Costs |
||||||||||||
| - Louisiana |
19 | 68 | 827 | |||||||||
| - California |
102 | 244 | 273 | |||||||||
| - Wyoming |
128 | 361 | 27,040 | |||||||||
|
|
|
|
|
|
|
|||||||
| Total Property Costs |
249 | 673 | 28,140 | |||||||||
| Drilling/Workover |
— | — | — | |||||||||
| - Louisiana |
144 | 49 | 3,809 | |||||||||
| - California |
4,100 | 421 | 3,201 | |||||||||
| - Wyoming |
11,770 | 9,647 | — | |||||||||
|
|
|
|
|
|
|
|||||||
| Total Drilling/Workover |
16,014 | 10,117 | 7,010 | |||||||||
| Facilities |
— | — | — | |||||||||
| - Louisiana |
— | — | — | |||||||||
| - California |
560 | 253 | 2,790 | |||||||||
| - Wyoming |
1,698 | 304 | — | |||||||||
|
|
|
|
|
|
|
|||||||
| Total Facilities |
2,258 | 556 | 2,790 | |||||||||
|
|
|
|
|
|
|
|||||||
| Total Capital Expenditures (1) |
18,521 | 11,347 | 37,940 | |||||||||
|
|
|
|
|
|
|
|||||||
Note:
| (1) | The Louisiana properties were sold on December 1, 2011 (see ITEM 7—“MD&A—Liquidity and Capital Resources”). |
Our drilling and work-over capital expenditures during 2011 were focused primarily on the Wyoming Assets and secondarily on the Pleito Creek Field in California. Additional capital costs for oil and gas properties include legal fees associated with the Wyoming properties, geological and geophysical data acquisition, and lease acquisition and rental expenses.
Capital expenditures associated with Louisiana properties during December 31, 2011, included the recompletion of the Jeffers well in Acadia Parish.
Capital expenditures associated with California properties during December 31, 2011, included the drilling and completion of two new wells and capital workovers on two existing wells.
Capital expenditures associated with Wyoming properties during December 31, 2011, included the drilling and completion of three wells at Hunt Field, three wells at Sheep Point Field and two wells at Willow Draw Field, facility expansion at Willow Draw Field and waterflood implementation at Ferguson Ranch Field. In addition, 2011 capital expenditures included: (i) completion costs associated with four wells at Willow Draw Field and one well at Ferguson Ranch Field which were drilled in the fourth quarter of 2010 and (ii) the implementation of polymer treatments at Willow Draw Field and (iii) facility expansion at Willow Draw Field and waterflood construction at Ferguson Ranch Field.
39
Table of Contents
Additional capital expenditures for oil and gas properties include geological and geophysical data acquisition and lease acquisition and rental expenses.
Our drilling and work-over capital expenditures during 2010 were focused primarily on the Wyoming assets and secondarily on the Pleito Creek Field in California. The majority of expenditures in Wyoming were at the Ferguson Ranch Field for drilling. Expenditures in California were for a work-over performed at the Pleito Creek Field. Additional capital costs for oil and gas properties include legal fees associated with the acquisition of the Wyoming properties, geological and geophysical data acquisition, and lease acquisition and rental expenses.
During the year ended December 31, 2010, operational activity in Wyoming included: (i) ten new wells drilled (six on production at December 31, 2010 and four wells awaiting production); (ii) two work-overs; and (iii) three polymer treatments.
During 2009, we spent $827,453 in property costs required to generate, evaluate and acquire new projects in Louisiana. Property costs also include leasehold costs generated by our existing properties.
Drilling costs in Louisiana during the year ended December 31, 2009, included the completion of two additional producing wells, the Trahan and the Jeffers.
In 2009, we designed, implemented and initiated the CMD Project on our Pleito Creek Field located in Kern County, California.
During 2009, we completed the construction of an injection facility and it is currently operational for the CMD process. Five horizontal gravel packed wells and one injection well were drilled in conjunction with the CMD Project.
Significant Acquisition
On December 17, 2009, we acquired the Wyoming Assets. The purchase price for the Wyoming Assets was $27.17 million of which $22 million was funded by a loan syndicated by a private lending company (“PLC”), and the remainder from our working capital. The effective date for the acquisition was December 1, 2009.
The following table details the purchase price allocation for the Wyoming Assets:
Table No. 16
Net Value of Wyoming Assets
| Fair value of assets acquired: |
||||
| Inventory |
$ | 78,763 | ||
| Equipment |
50,000 | |||
| Crude oil and natural gas properties |
27,472,671 | |||
| Asset retirement obligations |
(428,326 | ) | ||
|
|
|
|||
| Total net assets acquired |
$ | 27,173,108 | ||
|
|
|
40
Table of Contents
2012 Capital Expenditure Budget
The following table provides information regarding our 2012 capital expenditure budget:
Table No. 17
2012 Capital Expenditure Budget
| 2012 | ||||
| Capital | ||||
| Expenditures | ||||
| Budget | ||||
| ($000s) | ||||
| Drilling/Workovers |
||||
| - California |
11,120 | |||
| - Wyoming |
21,954 | |||
|
|
|
|||
| Total Drilling/Workovers |
33,074 | |||
|
|
|
|||
| Facilities |
||||
| - Wyoming |
940 | |||
|
|
|
|||
| Total Facilities |
940 | |||
|
|
|
|||
| Total Capital Budget |
34,014 | |||
|
|
|
|||
Highlights for the planned 2012 Capital Expenditure Budget include:
| • | Eighteen new wells in Wyoming |
| • | Nine workovers on existing well in Wyoming |
| • | Eight new wells in California |
| • | Facility upgrades in Wyoming |
Subject to the results of the Strategic Review, and access to the capital markets, we plan to invest a total of $34.01 million in capital expenditures during 2012.
All capital program expenditures are discretionary and are restricted by the Senior Loan including compliance with any covenants or receiving waivers therefrom (see ITEM 7—“MD&A—Liquidity and Capital Resources”). We review all capital expenditure programs on a regular basis and adjust spending based on factors such as changes in commodity prices, drilling and production results, and availability of funding. While we believe we have sufficient capital and liquidity to finance current operations through the next twelve months, our long-term liquidity depends on our ability to access the capital markets. There can be no assurance that we will be successful with any of these initiatives (See ITEM 1.A—“Risk Factors”).
Liquidity and Capital Resources
The following table summarizes our cash flows for the periods presented.
41
Table of Contents
Table No. 18
Cash Flows Summary
| Year
ended December 31, 2011(1) ($) |
Year
ended December 31, 2010(1) ($) |
Year
ended December 31, 2009(1) ($) |
||||||||||
| Cash flows (used in) provided by operating activities |
(713,122 | ) | (984,623 | ) | (2,461,948 | ) | ||||||
| Cash flows (used in) investing activities |
(17,094,341 | ) | (11,829,708 | ) | (37,947,610 | ) | ||||||
| Cash flows provided by financing activities |
12,128,486 | 19,162,118 | 33,016,558 | |||||||||
|
|
|
|
|
|
|
|||||||
| Increase (decrease) in cash and cash equivalents |
(5,678,977 | ) | 6,347,787 | (7,393,000 | ) | |||||||
| Cash and cash equivalents at beginning of year |
9,490,005 | 3,142,218 | 10,535,218 | |||||||||
|
|
|
|
|
|
|
|||||||
| Cash and cash equivalents at end of year |
3,811,028 | 9,490,005 | 3,142,218 | |||||||||
|
|
|
|
|
|
|
|||||||
Note:
| (1) | Audited. |
During the year ended December 31, 2011, our cash balance decreased by $5.68 million, primarily due to $18.52 million invested in oil and natural gas properties and equipment offset by the proceeds of $1 million received for the divestiture of oil and gas properties in Louisiana and a decrease in restrictive investments of $19,208. Cash flows from financing activities of $12.13 million were from the exercise of warrants and the sale of common shares during the period.
In September 2011, we completed the Private Placement of 2,758,620 Units of the Company at a purchase price of CDN$1.45 per Unit for gross proceeds of CDN$3,999,999 or USD $4,010,545, net of CDN $267,224 or USD $267,928 of agents fees.
Effective December 1, 2011, we completed the divestiture of the Company’s non-operated and non-core interests in producing oil and gas properties located in the southern onshore region of Louisiana for a total of $1 million.
During the year ended December 31, 2010, our cash balance increased by $6.35 million, primarily due to $10.07 million from the sale of Common Shares and net proceeds of $31.11 million from long-term borrowings, $11.83 million of investment in oil and natural gas properties and $22.02 million of short-term debt repayments.
On June 30, 2010, we entered into the Senior Loan in the amount of $36 million from the Lender. We borrowed $36 million subject to an original issue discount of 7.5%, a commitment fee of 1%, a placement fee of 1% and a transaction fee of 3%. At our request and subject to approval by the Lender, the Senior Loan availability may be increased by $39 million, up to $75 million, to provide additional development capital.
The Senior Loan has a 12.5% fixed interest rate and a term of five years. Interest is payable quarterly beginning September 30, 2010. Principal is payable quarterly beginning June 29, 2012 in the following annual amounts:
Table 19
Senior Loan Principal Repayments
| 2012 |
$ | 4,050,000 | ||
| 2013 |
5,400,000 | |||
| 2014 |
6,750,000 | |||
| 2015 |
19,800,000 | |||
|
|
|
|||
| $ | 36,000,000 | |||
|
|
|
The Senior Loan is secured by all of our assets. The loan may be repaid after June 30, 2013 without a pre-payment penalty or make whole provision. Prior to June 30, 2012, in the event of prepayment, we will be required to pay a make whole provision compensating the Lender for all unpaid interest. From July 1, 2012 to June 30, 2013, a 2% prepayment premium will be assessed on any outstanding principal being repaid in excess of the scheduled repayments noted above.
42
Table of Contents
We used the net proceeds of the Senior Loan to repay the existing Short-term Loan of $22 million and the remaining proceeds are to be utilized for the capital expenditure program at the Company’s properties in Wyoming and California. We are required to meet certain financial based covenants under the terms of this facility including: (i) total capital expenditures were limited to an amount no greater than $12 million from the date of the loan until December 31, 2010; (ii) total capital expenditures are limited to an amount no greater than $25 million for the year ended December 31, 2011. (iii) total capital expenditures are limited to an amount no greater than $25 million for the year ended December 31, 2012. The facility has a material adverse change clause relating to financial stability and for which the lender can ultimately demand immediate repayment in the event of default. At December 31, 2011, we were in compliance with all financial based covenants.
On May 16, 2010, we completed the Short Form Prospectus Offering of Common Shares at an offering price of CDN $1.25 per share. The Company issued 9,200,000 Common Shares for aggregate gross proceeds of CDN $11,500,000 or USD $11,018,492, net of CDN $989,260 or USD $947,840 of offering costs.
During the year ended December 31, 2009, our cash balance declined by $7.39 million primarily due to the acquisition of the Wyoming Assets for $27.17 million funded partially from the Short-term Loan of $22 million, and $10.85 million invested in oil and natural gas properties and equipment and $11.02 million received from the issuance of Common Shares. On December 17, 2009, we entered into the Short-term Loan with a private lending company, whereby the PLC syndicated a loan to the Company in an aggregate amount of US$5,500,000 and Cdn$17,534,550 (US$ 16,713,738) for the acquisition of the Wyoming Assets. Concurrent with the advances, the Company issued 2,566,666 Common Shares at an attributed price of Cdn $1.15 (US$1.07) per share which was recorded as prepaid interest expense, to be amortized over the term of the loan. We also paid a structuring fee in cash in the amount of US$120,000. Interest on the outstanding principal amount was calculated daily and compounded monthly and payable on a monthly basis at 12% per annum. The principal amount, together with all accrued unpaid interest was due December 17, 2010. The loan was able to be repaid at any time without pre-payment penalty. The loan was secured by a fixed and floating charge debenture which provided the PLC a security interest in all of our present and after-acquired real and personal property. The PLC loan was paid in full on June 30, 2010 from borrowings under the Senior Loan.
In September 2009, we completed a public offering of Units, each consisting of one Common Share and one warrant to acquire one Common Share for an offering price of Cdn $1.25 per Unit (USD $1.13). The Company issued 11,324,900 Units for aggregate gross proceeds of Cdn $14,156,125 or USD $13,078,573, net of Cdn $2,265,671 or USD $2,085,777 of offering costs. The Warrants had a term of two years from the date of issuance, and each Warrant was exercisable into one common share at a price of CDN $1.55 per share. NiMin issued 11.44 million of these warrants and 5.35 million were exercised during the two year term for gross proceeds of Cdn$8.3 million. The remaining 6.09 million warrants expired without being exercised. Offering costs include a fee of 4.5% on Cdn $3,273,625 of Units sold by a sub-agent, payable in 117,851 Units issued on the same terms and conditions as the Units issued pursuant to this offering.
Since inception, we have financed our operations from public and private sales of equity and debt, and revenues from sales of oil and gas reserves. While we believe we have sufficient capital and liquidity to finance current operations through the next twelve months, our long-term liquidity depends on our ability to access the capital markets. Our ability to develop proved reserves is contingent upon our cash flow from operations and obtaining adequate financing. However, if we are unable to obtain financing and do not believe we can develop these reserves pursuant to our plan, then these reserves will be reclassified to probable (See ITEM 1.A – “Risk Factors”).
Research and development, patents and licenses, etc.
In December, 2010, the U.S. Patent and Trademark Office issued a patent to NiMin for its CMD process for enhanced oil recovery. As reported in the third quarter of 2010, our CMD technology has been successful in significantly increasing production in California’s Pleito Creek Field. Our patent covers the process of the injection of oxygen and water as foam to create CO2 and steam in the reservoir through wet combustion. The CO2 and steam increase reservoir pressure and significantly reduce oil viscosity making the oil substantially more mobile allowing it to flow rapidly into production wells. The CMD process is currently being used on the Santa Margarita Formation at the Pleito Creek Field.
43
Table of Contents
Trend information
Over the past few years, the prices for crude oil and natural gas have been increasingly volatile and we expect this volatility to continue. Prolonged increases or decreases in the price of oil could significantly impact us. There is a strong relationship between energy commodity prices and access to both equipment and personnel. High commodity prices also affect the cost structure of services which may impact our ability to accomplish drilling, completion and equipping goals.
Off-Balance Sheet Arrangements
We had no off-balance sheet arrangements during the years ended December 31, 2011, 2010 and 2009 except for the office lease obligations noted below.
Tabular disclosure of contractual obligations
Table No. 20
Contractual Obligations as of December 31, 2011
| Total ($) |
Less than 1 year ($) |
1-3 years ($) |
4 -5 years ($) |
More than
5 years ($) |
||||||||||||||||
| Accounts payable and accrued liabilities |
5,005,515 | 5,005,515 | — | — | — | |||||||||||||||
| Commodity derivative liability |
976,929 | 976,929 | — | — | — | |||||||||||||||
| Office lease obligations |
155,808 | 117,778 | 37,230 | 800 | — | |||||||||||||||
| Interest payable on long-term debt |
12,304,459 | 4,372,746 | 6,760,480 | 1,171,233 | — | |||||||||||||||
| Long-term debt (principal) |
36,000,000 | 4,050,000 | 12,150,000 | 19,800,000 | — | |||||||||||||||
|
|
|
|
|
|
|
|
|
|
|
|||||||||||
| Total contractual obligations |
54,442,711 | 14,522,968 | 18,947,710 | 20,972,033 | — | |||||||||||||||
|
|
|
|
|
|
|
|
|
|
|
|||||||||||
Critical Accounting Policies and Estimates
In preparing financial statements, we make informed judgments and estimates that affect the reported amounts of assets and liabilities as of the date of the financial statements and affect the reported amounts of revenues and expenses during the reporting period.
The amounts recorded for depletion and depreciation of property and equipment, the accretion expense associated with the asset retirement obligation and the cost recovery assessments for property and equipment are based on estimates of proved reserves, production and discount rates, oil and natural gas prices, future costs and other relevant assumptions. The amount recorded for the unrealized gain or loss on financial instruments is based on estimates of future commodity prices and volatility. The recognition of amounts in relation to stock-based compensation requires estimates related to valuation of stock options at the time of issuance or modification. Future taxes require estimates as to the realization of future tax assets and the timing of reversal of tax assets and liabilities. By their nature, these estimates are subject to measurement uncertainty and the effect on the consolidated financial statements from changes in such estimates in future years could be significant.
On an ongoing basis, we review estimates, including those related to the impairment of long-lived assets, contingencies and income taxes. Changes in facts and circumstances may result in revised estimates and actual results may differ from these estimates.
Crude Oil and Natural Gas Properties
We account for our crude oil and natural gas producing activities under the full-cost method of accounting. Accordingly, all costs incurred in the acquisition, exploration, and development of proved crude oil and natural gas properties, including the costs of abandoned properties, dry holes, geological and geophysical costs, and annual lease rentals, are capitalized. All general corporate costs are expensed as incurred. Sales or other dispositions of crude oil and natural gas properties are accounted for as adjustments to capitalized costs with no gain or loss recorded unless such sale would alter the relationship between pool cost and reserves.
44
Table of Contents
Depletion and Depreciation
Depletion of crude oil and natural gas properties is computed under the unit-of-production method where by the ratio of production to proved reserves, after royalties, determines the proportion of depletable costs to be expensed in each period. Costs associated with unevaluated properties are excluded from the full-cost pool until a determination is made whether proved reserves can be attributable to the related properties. Unevaluated properties are evaluated at least annually to determine whether the costs incurred should be classified to the full-cost pool and thereby subject to amortization. A significant reduction in our proved reserves may result in an accelerated depletion rate.
Reserves are determined by an independent reserves engineering firm. Volumes are converted to equivalent units using the ratio of one barrel of oil to six thousand cubic feet of natural gas.
Depreciation of equipment is provided for on a straight-line basis over the useful life (5 to 10 years) of the asset.
Impairment of oil and gas properties
We perform a full-cost ceiling test on proved crude oil and natural gas properties in which the capitalized costs are not allowed to exceed their related estimated future net revenues of proved reserves discounted at 10%, net of tax considerations. Costs associated with unevaluated properties are excluded from the full-cost pool until a determination is made whether proved reserves can be attributable to the related properties. Unevaluated properties are evaluated at least annually to determine whether the costs incurred should be classified to the full-cost pool and thereby subject to amortization. A significant reduction in our proved reserves may result in a full cost ceiling limitation.
Equipment is reviewed for impairment whenever events or changes in circumstances indicate such impairment may have occurred. An impairment is recognized when the estimated undiscounted future net cash flows of an asset are less than its carrying value. If an impairment occurs, the carrying value of the impaired asset is reduced to fair value.
Asset Retirement Obligations
We recognize a liability for the present value of all legal obligations associated with the retirement of tangible, long-lived assets and capitalizes an equal amount as a cost of the asset. The cost associated with the abandonment obligation is included in the computation of depreciation, depletion, amortization and accretion. The liability accretes until we settle the obligation. We use a credit-adjusted risk-free interest rate in its calculation of asset retirement obligations (“ARO”).
Revisions to the original estimated liability would result in an increase or decrease to the ARO liability and related capitalized costs. Actual costs incurred upon settlement of the asset retirement obligation are charged against the obligation to the extent of the liability recorded.
Estimates for future abandonment and reclamation costs are based on historical costs to abandon and reclaim similar sites, taking into consideration current costs. The liability is based on our net interest in the respective sites.
Income Tax
Deferred tax assets and liabilities are recognized for the future tax consequences attributable to differences between the financial statement carrying amounts of existing assets and liabilities and their respective tax bases. Deferred tax assets and liabilities are measured using enacted tax rates expected to apply to taxable income in the years in which those temporary differences are expected to be recovered or settled. The effect on deferred tax assets and liabilities of a change in enacted tax rates is recognized in income in the period that includes the enactment date.
We do not have any unrecognized tax benefits other than those for which a valuation allowance has been provided thereon. Our policy is that we recognize interest and penalties accrued on any unrecognized tax benefits as a component of income tax expense. We did not have any accrued interest or penalties associated with any unrecognized tax benefits, nor were any tax-related interest expense recognized during 2011, 2010 or 2009.
45
Table of Contents
Commodity and Derivative Instruments
Derivative instruments are recognized as either assets or liabilities in the balance sheet at fair value. The accounting for changes in the fair value of derivative instruments depends on their intended use and resulting hedge designation. For derivative instruments designated as hedges, the changes in fair value are recorded in the balance sheet as a component of accumulated other comprehensive income (loss). Changes in the fair value of derivative instruments not designated as hedges are recorded as a gain or loss on derivative contracts in the consolidated statements of operations. We do not designate its derivative financial instruments as hedging instruments and, as a result, recognizes the change in a derivative’s fair value currently in earnings.
Fair value measurements
We categorize our assets and liabilities that are measured at fair value, based on the priority of the inputs to the valuation techniques. The three levels of the fair value measurement hierarchy are as follows:
Level 1: Unadjusted quoted prices in active markets that are accessible at the measurement date for identical, unrestricted assets or liabilities.
Level 2: Quoted prices in markets that are not active, or inputs which are observable, either directly or indirectly, for substantially the full term of the asset or liability.
Level 3: Measured based on prices or valuation models that required inputs that are both significant to the fair value measurement and less observable for objective sources (i.e. supported by little or no market activity).
Financial assets and liabilities are classified based on the lowest level of input that is significant to the fair value measurement. Our assessment of the significance of a particular input to the fair value measurement requires judgment, which may affect the valuation of the fair value of assets and liabilities and their placement within the fair value hierarchy levels. The Company considers active markets as those in which transactions for the assets or liabilities occur in sufficient frequency and volume to provide pricing information on an ongoing basis. For assets and liabilities carried at fair value, the Company measures fair value under the following levels:
| Financial Instrument |
Level | |||
| Cash and cash equivalents |
Level 1 | |||
| Restricted investments |
Level 1 | |||
| Long-term debt |
Level 2 | |||
| Commodity derivative |
Level 2 | |||
| Warrants and options |
Level 3 | |||
Stock-Based Compensation
We measure and recognize compensation expense for all share-based payment awards, including employee stock options, based on estimated fair values. The value of the portion of the award that is ultimately expected to vest is recognized as an expense on a straight-line basis over the requisite vesting period. We estimate the fair value of stock option awards on the date of grant using an option-pricing model. We use the Black-Scholes Model as its method of valuation for share-based awards. Our determination of fair value of share-based payment awards on the date of grant using the Black-Scholes Model is affected by NiMin’s stock price, as well as assumptions regarding a number of subjective variables. These variables include, but are not limited to, our expectation of NiMin’s stock price volatility over the term of the awards, as well as actual and projected exercise and forfeiture activity. The fair value of options granted to consultants, to the extent unvested due to required services not having been fully performed, is determined on subsequent reporting dates.
Foreign Currency Transactions
These consolidated financial statements are presented and measured in U.S. dollars, as substantially all of our operations are located in the United States of America. Transactions and balances using Canadian dollars are expressed in U.S. dollars whereby monetary assets and liabilities are expressed at the period end exchange rate, non-monetary assets and liabilities are expressed at historical exchange rates, and revenue and expenses are expressed at the average exchange rate for the period. Foreign exchange gains and losses are included in the consolidated statements of operations.
46
Table of Contents
Business combinations
We record identifiable assets, liabilities, non-controlling interests, and goodwill acquired in a business combination at “fair value” by applying the acquisition method. Accordingly, transaction costs related to acquisitions are recorded as a reduction of earnings in the period they are incurred and costs related to issuing debt or equity securities that are related to the transaction are recognized in accordance with other applicable rules under U.S. GAAP. Non-controlling interests (previously referred to as minority interests) are treated as a separate component of equity, not as a liability or other item outside of permanent equity.
Recently Issued Accounting Pronouncements
In June 2011, the Financial Accounting Standards Board issued ASU No. 2011-05, “Comprehensive Income (Topic 220): Presentation of Comprehensive Income” (“ASU No. 2011-05”). In ASU No. 2011-05, an entity has the option to present the total of comprehensive income, the components of net income, and the components of other comprehensive income either in a single continuous statement of comprehensive income or in two separate but consecutive statements. In both choices, an entity is required to present each component of net income along with total net income, each component of other comprehensive income along with a total for other comprehensive income, and a total amount for comprehensive income. The amendments in ASU No. 2011-05 do not change the items that must be reported in other comprehensive income or when an item of other comprehensive income must be reclassified to net income. They also do not change the presentation of related tax effects, before related tax effects, or the portrayal or calculation of earnings per share. The amendments in ASU No. 2011-05 should be applied retrospectively. The amendment is effective for fiscal years, and interim periods within those years, beginning after December 15, 2011. The amendments do not require any transition disclosures. This update is not expected to have a material impact on our consolidated financial statements.
| ITEM 7.A. | QUANTITATIVE AND QUALITATIVE DISCLOSURES ABOUT MARKET RISK |
Commodity Price Risk
Our primary market risk is market changes in oil and natural gas prices. Commodity prices for petroleum and natural gas are impacted by world economic events that dictate the levels of supply and demand. During the years ended December 31, 2011, 2010 and 2009, we entered into swap contracts to minimize the variability in cash flows due to price movements in crude oil (See Item 7 – “MD&A – Crude Oil and Derivative Contracts”).
At December 31, 2011, we recognized $976,929 as a derivative liability on crude oil derivative contracts. As of December 31, 2011, if oil prices had been higher by $1.00 per Bbl with all other variables held constant, the net change in the fair value of the commodity derivative liability would have been higher by approximately $128,100.
The objective of the use of derivative financial instruments is to achieve more predictable cash flows in an environment of volatile oil and gas prices and to manage its exposure to commodity price risk. While the use of these derivative instruments limits the downside risk of adverse price movements, these instruments may also limit our ability to benefit from favourable price movements. We may, from time to time, add incremental derivatives to hedge additional production, restructure existing derivative contracts or enter into new transactions to modify the terms of current contracts in order to realize the current value of our existing position.
| ITEM 8. | FINANCIAL STATEMENTS AND SUPPLEMENTARY DATA |
Our financial statements are stated in U.S. Dollars and are prepared in accordance with U.S. generally accepted accounting principles (GAAP).
The financial statements and notes thereto required under Item 8 of this annual report are attached hereto and found immediately following the signature page of this Form 10K annual report.
| ITEM 9. | CHANGES IN AND DISAGREEMENTS WITH ACCOUNTANTS ON ACCOUNTING AND FINANCIAL DISCLOSURE |
Not Applicable.
47
Table of Contents
| ITEM 9.A. | CONTROLS AND PROCEDURES |
(a) Disclosure Controls and Procedures
As required by Rule 13a-15(b) under the Securities Exchange Act of 1934, as amended (the “Exchange Act”), as of the end of the period covered by this Annual Report on Form 10-K, the Company’s management conducted an evaluation under the supervision and with the participation of the Company’s Chief Executive Officer (“CEO”) and Chief Financial Officer (“CFO”), regarding the effectiveness of the design and operation of the Company’s disclosure control and procedures, as defined in Rules 13a-15(e) and 15d-15(e) under the Exchange Act.
Based on the evaluation, management concluded that as of December 31, 2011, the Company’s disclosure controls and procedures were not effective because of the material weaknesses described in Management’s Report on Internal Control over Financial Reporting.
(b) Management’s Report on Internal Control over Financial Reporting
Management of the Company is responsible for establishing and maintaining adequate internal control over financial reporting as defined in rule 13a-15(f) and 15d-15(f) under the Exchange Act. Internal control over financial reporting is a process designed by, or under the supervision of, the CEO and CFO, to provide reasonable assurance regarding the reliability of financial reporting and the preparation of financial statements for external purposes in accordance with generally accepted accounting principles. Internal controls over financial reporting includes those policies and procedures that (i) pertain to the maintenance of records which in reasonable detail accurately and fairly reflect the transactions and disposition of the Company’s assets; (ii) provide reasonable assurance that transactions are recorded as necessary to permit preparation of financial statements in accordance with generally accepted accounting principles, and that receipts and expenditures of the Company are being made in accordance with authorizations of management and directors of the issuer; and (iii) provide reasonable assurance regarding prevention or timely detection of unauthorized acquisition, use, or disposition of the Company’s assets that could have a material effect on the Company’s consolidated financial statements.
Because of its inherent limitations, internal control over financial reporting may not prevent or detect misstatements. Also, projections of any evaluation of effectiveness to future periods are subject to the risk that controls may become inadequate because of changes in conditions, or that the degree of compliance with the policies or procedures may deteriorate.
A material weakness is a deficiency, or a combination of deficiencies in internal control over financial reporting, such that there is a reasonable possibility that a material misstatement of the company’s annual or interim financial statements will not be prevented or detected on a timely basis.
In evaluating the effectiveness of the Company’s internal control over financial reporting as of December 31, 2011, management used the criteria established in the Internal Control – Integrated Framework issued by the Committee of Sponsoring Organizations of the Treadway Commission (“COSO”). Based on the criteria established by COSO, management (with the participation of the CEO and the CFO) identified the following material weaknesses in the Company’s internal control over financial reporting as of December 31, 2011, which arose from the limited number of number of staff at the Company and the inability to achieve proper segregation of duties:
| • | The Company lacked effective controls for ensuring the accuracy of reporting over significant account balances, including the review, approval, and documentation of related transactions and account reconciliations. |
| • | The Company lacked sufficient accounting resources with the necessary technical experience and knowledge. |
As a result of these material weaknesses, there were misstatements in asset retirement obligations, derivatives, share-based compensation, warrants and income taxes in the preliminary consolidated financial statements that were corrected prior to issuance of the Company’s consolidated financial statements. Additionally, there is a reasonable possibility that a material misstatement of the Company’s annual or interim consolidated financial statements would not be prevented or detected on a timely basis.
As a result of these material weaknesses, management concluded that the Company did not maintain effective internal control over financial reporting as of December 31, 2011, based on the criteria established in Internal Control – Integrated Framework issued by COSO.
48
Table of Contents
KPMG LLP, the Company’s independent registered public accounting firm, has issued an attestation report on the effectiveness of internal control over financial reporting, which is set forth below.
(c) Changes in Internal Control Over Financial Reporting
There were no changes in the Company’s internal control over financial reporting during the quarter ended December 31, 2011, that have materially affected or are reasonably likely to materially affect, the Company’s internal control over financial reporting.
(d) Remediation Plan for Material Weakness in Internal Control Over Financial Reporting
Management, in coordination with the input, oversight and support of our Audit Committee, has identified the following measure to strengthen our internal control over financial reporting and to address the material weaknesses described above-
Enhance the quarterly and annual review processes for significant and complex matters by engaging external accounting specialists to support the Company’s financial closing and reporting process. External accounting specialists will assist in the preparation of account reconciliations and assist in performing research on complex accounting matters, which will allow for a more effective review to be performed by the Company’s accounting management.
Management intends to continue to monitor internal controls and progress on the remediation step identified above, and if further improvements or enhancements are identified, take steps to implement such improvements or enhancements.
Management believes the measure described above, once designed and operating effectively, will strengthen our internal control over financial reporting. As the evaluation and work to improve our internal control over financial reporting continues, we may determine to take additional measures or determine to modify, or in appropriate circumstances not to complete, the remediation measure described above. The Company cannot provide assurance that these remediation efforts will be successful or that the Company’s internal control over financial reporting will be effective as a result of these efforts.
49
Table of Contents
REPORT OF INDEPENDENT REGISTERED PUBLIC ACCOUNTING FIRM
The Board of Directors and Stockholders of NiMin Energy Corp.:
We have audited the internal control over financial reporting of NiMin Energy Corp. (the Company) as of December 31, 2011, based on criteria established in Internal Control - Integrated Framework issued by the Committee of Sponsoring Organizations of the Treadway Commission (COSO). The Company’s management is responsible for maintaining effective internal control over financial reporting and for its assessment of the effectiveness of internal control over financial reporting, included in the accompanying Management’s Report on Internal Control over Financial Reporting (Item 9A(b). Our responsibility is to express an opinion on the Company’s internal control over financial reporting based on our audit.
We conducted our audit in accordance with the standards of the Public Company Accounting Oversight Board (United States). Those standards require that we plan and perform the audit to obtain reasonable assurance about whether effective internal control over financial reporting was maintained in all material respects. Our audit included obtaining an understanding of internal control over financial reporting, assessing the risk that a material weakness exists, and testing and evaluating the design and operating effectiveness of internal control based on the assessed risk. Our audit also included performing such other procedures as we considered necessary in the circumstances. We believe that our audit provides a reasonable basis for our opinion.
A company’s internal control over financial reporting is a process designed to provide reasonable assurance regarding the reliability of financial reporting and the preparation of financial statements for external purposes in accordance with generally accepted accounting principles. A company’s internal control over financial reporting includes those policies and procedures that (1) pertain to the maintenance of records that, in reasonable detail, accurately and fairly reflect the transactions and dispositions of the assets of the company; (2) provide reasonable assurance that transactions are recorded as necessary to permit preparation of financial statements in accordance with generally accepted accounting principles, and that receipts and expenditures of the company are being made only in accordance with authorizations of management and directors of the company; and (3) provide reasonable assurance regarding prevention or timely detection of unauthorized acquisition, use, or disposition of the company’s assets that could have a material effect on the financial statements.
Because of its inherent limitations, internal control over financial reporting may not prevent or detect misstatements. Also, projections of any evaluation of effectiveness to future periods are subject to the risk that controls may become inadequate because of changes in conditions, or that the degree of compliance with the policies or procedures may deteriorate.
A material weakness is a deficiency, or a combination of deficiencies, in internal control over financial reporting, such that there is a reasonable possibility that a material misstatement of the company’s annual or interim financial statements will not be prevented or detected on a timely basis. Material weaknesses related to the lack of effective controls for ensuring the accuracy of reporting over significant account balances, including the review, approval, and documentation of related transactions and account reconciliations and; lack of sufficient accounting resources with the necessary technical experience and knowledge have been identified and included in management’s assessment. We also have audited, in accordance with the standards of the Public Company Accounting Oversight Board (United States), the consolidated balance sheet of NiMin Energy Corp. and subsidiary as of December 31, 2011, and the related consolidated statements of operations and comprehensive loss, stockholders’ equity, and cash flows for the year then ended. These material weaknesses were considered in determining the nature, timing, and extent of audit tests applied in our audit of the 2011 consolidated financial statements, and this report does not affect our report dated March 14, 2012, which expressed an unqualified opinion on those consolidated financial statements.
In our opinion, because of the effect of the aforementioned material weaknesses on the achievement of the objectives of the control criteria, NiMin Energy Corp. has not maintained effective internal control over financial reporting as of December 31, 2011, based on criteria established in Internal Control—Integrated Framework issued by the Committee of Sponsoring Organizations of the Treadway Commission.
/s/ KPMG LLP
Los Angeles, California
March 14, 2012
50
Table of Contents
| ITEM 9.B. | OTHER INFORMATION |
None.
51
Table of Contents
ITEM 10. DIRECTORS, EXECUTIVE OFFICERS AND CORPORATE GOVERNANCE
The information responsive to Item 401, 405, 406 and 407 of Regulation S-K to be included in our definitive Proxy Statement for our 2012 Annual Meeting of Shareholders, to be filed within 120 days of December 31, 2011, pursuant to Regulation 14A under the Securities Exchange Act of 1934, as amended (the “2012 Proxy Statement”), is incorporated herein by reference.
ITEM 11. EXECUTIVE COMPENSATION
The information responsive to Item 402 and 407 of Regulation S-K to be included in our 2012 Proxy Statement is incorporated herein by reference.
ITEM 12. SECURITY OWNERSHIP OF CERTAIN BENEFICIAL OWNERS AND MANAGEMENT AND RELATED STOCKHOLDERS MATTERS
The information responsive to Item 201(d) and 403 of Regulation S-K to be included in our 2012 Proxy Statement is incorporated herein by reference.
ITEM 13. CERTAIN RELATIONSHIPS AND RELATED TRANSACTIONS, AND DIRECTOR INDEPENDENCE
Equity Compensation Plans
At December 31, 2011, a total of 9,220,001 Common Shares were authorized for issuance under our equity compensation plan. In the table below, we describe certain information about these shares and the equity compensation plan which provides for their authorization and issuance. You can find descriptions of our stock incentive plan under Note 10 of the Notes to Consolidated Financial Statements included in ITEM 8—“Financial Statements and Supplementary Data.”
Table No. 21
Securities Authorized for Issuence
Under Equity Compensation Plans
| Number of securities to be issued upon exercise of outstanding options |
Weighted Average Exercise Price (CDN$) |
Number of securities remaining available for future issuance under equity compensation plans (excluding securities reflected in column (a)) |
||||||||||
| Equity compensation plan approved by security holders (1) |
9,220,001 | 1.24 | 26,645 | |||||||||
| Equity compensation plan not approved by security holders |
Nil | Nil | Nil | |||||||||
|
|
|
|
|
|
|
|||||||
| Total |
9,220,001 | 1.24 | 26,645 | |||||||||
Note:
| (1) | See Note 10 of the Notes to Consolidated Financial Statements included in ITEM 8 – “Financial Statements and Supplementary Data.” |
The remaining information responsive to Items 404 and 407 of Regulation S-K to be included in our 2012 Proxy Statement is incorporated herein by reference.
ITEM 14. PRINCIPAL ACCOUNTING FEES AND SERVICES
The information responsive to Item 9(e) of Schedule 14A to be included in our 2012 Proxy Statement is incorporated herein by reference.
52
Table of Contents
ITEM 15. EXHIBITS AND FINANCIAL STATEMENT SCHEDULES
| 3.1 | Articles of Incorporation of NiMin Energy Corp., as amended*. |
| 3.2 | Bylaws of NiMin Energy Corp*. |
| 4.1 | Form of Share Certificate of Common Shares of NiMin Energy Corp*. |
| 10.1 | Agreement and Plan of Merger by and among NiMin Capital Corp., NiMin Merger Co. and Legacy Energy, Inc. dated as of July 17, 2009*. |
| 10.2 | Credit Agreement by and among Legacy Energy, Inc., NiMin Energy Corp., CLMG Corp., and Certain Lenders, dated as of June 30,2010*. |
| 10.3 | 2009 Stock Option Plan, effective September 4, 2009*. |
| 10.4 | Form of Stock Option Agreement*. |
| 10.5 | Warrant Indenture between NiMin Capital Corp. and Computershare Trust Company of Canada dated August 28, 2009*. |
| 10.6 | Employment Agreement by and between Legacy Energy, Inc. and Clarence Cottman, III dated as of April 29, 2008*. |
| 10.7 | Amendment to Employment Agreement by and between Legacy Energy, Inc. and Clarence Cottman III dated as of January 1, 2009*. |
| 10.8 | Employment Agreement by and between Legacy Energy, Inc. and E. Sven Hagan dated as of April 29, 2008*. |
| 10.9 | Amendment to Employment Agreement by and between Legacy Energy, Inc. and E. Sven Hagan dated as of January 1, 2009*. |
| 10.10 | Employment Agreement by and between Legacy Energy, Inc. and Jonathan S. Wimbish dated as of April 29, 2008*. |
| 10.11 | Amendment to Employment Agreement by and between Legacy Energy, Inc. and Jonathan S. Wimbish dated as of January 1, 2009*. |
| 10.12 | Employment Agreement by and between Legacy Energy, Inc. and Rick McGee dated as of April 29, 2008*. |
| 10.13 | Amendment to Employment Agreement by and between Legacy Energy, Inc. and Rick McGee dated as of January 1, 2009*. |
| 10.14 | Credit Agreement between Legacy Energy, Inc. and Texas Capital Bank, N.A. dated June 23, 2008*. |
| 10.15 | Second Amended and Restated Schedule to the ISDA 1992 Master Agreement between BP Corporation North America, Inc. and Legacy Energy, Inc. dated June 30, 2010*. |
| 10.16 | CPC Escrow Agreement among NiMin Capital Corp., Computershare Trust Company of Canada and each of the Securityholders named in the Escrow Agreement, dated as of September 27, 2007*. |
| 10.17 | Intercreditor Agreement among BP Corporation North America, Inc., Legacy Energy, Inc., NiMin Energy Corp., and CLMG Corp. dated as of June 30, 2010*. |
| 10.18 | Guaranty Agreement by NiMin Energy Corp. in favor of BP Corporation North America, Inc. dated June 30, 2010*. |
53
Table of Contents
| 10.19 | Wyoming Loan*. |
| 10.20 | Purchase and Sale Agreement by and between Vernon E. Faulconer, Inc., and Legacy Energy, Inc. Dated November 10, 2009*. |
| 10.21 | Agency Agreement dated effective April 29, 2010 among NiMin, Legacy and Thomas Weisel Partners Canada, Inc.* |
| 10.22 | ISDA Master Agreement between B.P. Corporation North America, Inc. and Legacy dated April 1, 2009*. |
| 10.23 | Amended and Restated Schedule to the ISDA Master Agreement between BP Corporation North America, Inc., and Legacy, dated January 4, 2010*. |
| 21.1 | List of Subsidiaries*. |
| 23.1 | Consent of Huddleston & Co., Inc.** |
| 31.1 | Certification of the Principal Executive Officer as required by rule 15d-14(a)**. |
| 31.2 | Certification of the Principal Financial Officer as required by rule 15d-14(a)**. |
| 32.1 | Certification required by rule 15d-14(b)**. |
| 99.1 | Estimated Reserves and Revenues, Proved Reserves Only, As of January 1, 2012 prepared by Huddleston & Co., Inc. dated January 30, 2012**. |
| * | Incorporated by reference to Exhibits to the Company’s Registration Statement (file No.000-54162). |
| ** | Filed herewith. |
54
Table of Contents
WHERE TO FIND ADDITIONAL INFORMATION
Additional information, including directors’ and officers’ remunerations, principal holders of the Company’s securities, options to purchase securities and interests of insiders in material transactions is contained in the Company’s management information circular relating to its most recent annual meeting of shareholders of the Company. Additional financial information is contained in the Company’s financial statements and management’s discussion and analysis for its most recently completed financial year. Additional information relating to the Company may be found on SEDAR at www.sedar.com or the Company’s website at www.niminenergy.com.
Additional copies of this Annual Report, the materials listed in the preceding paragraph, any interim financial statements which have been issued by the Company and any other document incorporated herein by reference will be available upon request by contacting the Company at its offices at 1160 Eugenia Place, Suite 100, Carpinteria, California 90313, Phone: (805) 566-2900 or Fax: (805) 566-2917.
55
Table of Contents
Pursuant to the requirements of Section 13 or 15(d) of the Securities Exchange Act of 1934, the registration has duly caused this report to be signed on its behalf by the undersigned, thereunto duly authorized.
| NIMIN ENERGY CORP. (Registrant) | ||
| By: | /S/ CLARENCE COTTMAN III | |
|
Chief Executive Officer
Date: March 14, 2012 | ||
Pursuant to the requirements of the Securities Exchange Act of 1934, this report has been signed below by the following persons on behalf of the registrant and in the capacities and on the dates indicated.
| By: /s/ CLARENCE COTTMAN III |
Chief Executive Officer and Director |
March 14, 2012 | ||
| By: /s/ JONATHAN WIMBISH |
Chief Financial Officer & Principal Accounting Officer |
March 14, 2012 | ||
| By: /s/ DANIEL S. DOBSON |
Chief Operations Officer |
March 14, 2012 | ||
| By: /s/ BRIAN BAYLEY |
Director |
March 14, 2012 | ||
| By: /s/ WILLIAM GUMMA |
Director |
March 14, 2012 | ||
| By: /s/ ROBERT REDFEARN |
Director |
March 14, 2012 | ||
56
Table of Contents
Consolidated Financial Statements of
NIMIN ENERGY CORP.
As at and for the years ended December 31, 2011, 2010, and 2009
Expressed in US dollars
Table of Contents
Report of Independent Registered Public Accounting Firm
The Board of Directors and Stockholders
NiMin Energy Corp.:
We have audited the accompanying consolidated balance sheet of NiMin Energy Corp. and subsidiary (the Company) as of December 31, 2011, and the related consolidated statements of operations and comprehensive loss, stockholders’ equity, and cash flows for the year then ended. These consolidated financial statements are the responsibility of the Company’s management. Our responsibility is to express an opinion on these consolidated financial statements based on our audit.
We conducted our audit in accordance with the standards of the Public Company Accounting Oversight Board (United States). Those standards require that we plan and perform the audit to obtain reasonable assurance about whether the financial statements are free of material misstatement. An audit includes examining, on a test basis, evidence supporting the amounts and disclosures in the financial statements. An audit also includes assessing the accounting principles used and significant estimates made by management, as well as evaluating the overall financial statement presentation. We believe that our audit provides a reasonable basis for our opinion.
In our opinion, the consolidated financial statements referred to above present fairly, in all material respects, the financial position of NiMin Energy Corp. as of December 31, 2011, and the results of its operations and cash flows for the year then ended, in conformity with U.S. generally accepted accounting principles.
We have also audited, in accordance with the standards of the Public Company Accounting Oversight Board (United States), NiMin Energy Corp.’s internal control over financial reporting as of December 31, 2011, based on criteria established in Internal Control – Integrated Framework issued by the Committee of Sponsoring Organizations of the Treadway Commission, and our report dated March 14, 2012, expressed an adverse opinion on the effectiveness of the Company’s internal control over financial reporting.
/s/ KPMG LLP
Los Angeles, California
March 14, 2012
2
Table of Contents
REPORT OF INDEPENDENT REGISTERED PUBLIC ACCOUNTING FIRM
To the Shareholders of NiMin Energy Corp.
We have audited the accompanying consolidated financial statements of NiMin Energy Corp., which comprise the consolidated balance sheet as at December 31, 2010 and the consolidated statements of operations and comprehensive loss, cash flows and stockholders’ equity for each of the years in the two-year period ended December 31, 2010, and notes, comprising a summary of significant accounting policies and other explanatory information.
Management’s Responsibility for the Consolidated Financial Statements
Management is responsible for the preparation and fair presentation of these consolidated financial statements in accordance with United States generally accepted accounting principles, and for such internal control as management determines is necessary to enable the preparation of consolidated financial statements that are free from material misstatement, whether due to fraud or error.
Auditors’ Responsibility
Our responsibility is to express an opinion on these consolidated financial statements based on our audits. We conducted our audits in accordance with Canadian generally accepted auditing standards and the standards of the Public Company Accounting Oversight Board (United States). Those standards require that we comply with ethical requirements and plan and perform the audit to obtain reasonable assurance about whether the consolidated financial statements are free from material misstatement.
An audit involves performing procedures to obtain audit evidence about the amounts and disclosures in the consolidated financial statements. The procedures selected depend on our judgment, including the assessment of the risks of material misstatement of the consolidated financial statements, whether due to fraud or error. In making those risk assessments, we consider internal control relevant to the entity’s preparation and fair presentation of the consolidated financial statements in order to design audit procedures that are appropriate in the circumstances, but not for the purpose of expressing an opinion on the effectiveness of the entity’s internal control. An audit also includes evaluating the appropriateness of accounting policies used and the reasonableness of accounting estimates made by management, as well as evaluating the overall presentation of the consolidated financial statements.
We believe that the audit evidence we have obtained in our audits is sufficient and appropriate to provide a basis for our audit opinion.
3
Table of Contents
Opinion
In our opinion, the consolidated financial statements present fairly, in all material respects, the consolidated financial position of NiMin Energy Corp. as at December 31, 2010 and its consolidated results of operations and its consolidated cash flows for each of the years in the two-year period ended December 31, 2010 in accordance with United States generally accepted accounting principles.
/s/ KPMG LLP
Chartered Accountants
Calgary, Canada
March 24, 2011
4
Table of Contents
NiMin Energy Corp.
Consolidated Balance Sheets
December 31, 2011 and December 31, 2010
(Expressed in U.S. dollars)
| 2011 | 2010 | |||||||
| Assets |
||||||||
| Current assets: |
||||||||
| Cash and cash equivalents |
$ | 3,811,028 | $ | 9,490,005 | ||||
| Trade accounts receivable |
3,131,004 | 1,823,667 | ||||||
| Prepaid expenses and well costs |
311,922 | 262,210 | ||||||
| Crude oil inventory |
149,553 | 241,375 | ||||||
| Other assets |
— | 1,798 | ||||||
|
|
|
|
|
|||||
| Total current assets |
7,403,507 | 11,819,055 | ||||||
| Debt issuance costs |
3,497,867 | 4,404,436 | ||||||
| Restricted investments |
784,261 | 803,469 | ||||||
| Equipment |
287,918 | 348,498 | ||||||
| Crude oil and natural gas properties—full cost method |
||||||||
| Proved properties, net |
78,077,780 | 64,055,964 | ||||||
| Unproved properties |
468,042 | 476,986 | ||||||
|
|
|
|
|
|||||
| Total assets |
$ | 90,519,375 | $ | 81,908,408 | ||||
|
|
|
|
|
|||||
| Liabilities and Stockholders’ Equity |
||||||||
| Current liabilities: |
||||||||
| Accounts payable |
$ | 3,751,660 | $ | 4,580,128 | ||||
| Accrued liabilities |
1,253,855 | 1,069,564 | ||||||
| Commodity derivative liability |
976,929 | 929,527 | ||||||
| Current portion of long-term debt |
4,050,000 | — | ||||||
|
|
|
|
|
|||||
| Total current liabilities |
10,032,444 | 6,579,219 | ||||||
| Long-term debt |
31,950,000 | 36,000,000 | ||||||
| Asset retirement obligations |
1,180,661 | 1,309,789 | ||||||
| Non-current commodity derivative liability |
— | 310,757 | ||||||
| Options |
136,773 | — | ||||||
| Warrants |
235,134 | 5,631,515 | ||||||
|
|
|
|
|
|||||
| Total liabilities |
43,535,012 | 49,831,280 | ||||||
|
|
|
|
|
|||||
| Commitments and contingencies |
||||||||
| Stockholders’ equity: |
||||||||
| Common stock, no par value, unlimited shares authorized, issued and outstanding 69,834,396 as of December 31, 2011 and 61,690,977 as of December 31, 2010 |
108,758,460 | 93,107,905 | ||||||
| Additional paid in capital |
12,177,534 | 9,861,010 | ||||||
| Accumulated deficit |
(73,951,631 | ) | (70,891,787 | ) | ||||
|
|
|
|
|
|||||
| Total stockholders’ equity |
46,984,363 | 32,077,128 | ||||||
|
|
|
|
|
|||||
| Total liabilities and stockholders’ equity |
$ | 90,519,375 | $ | 81,908,408 | ||||
|
|
|
|
|
|||||
See accompanying notes to consolidated financial statements.
Approved by the Board of Directors
| (signed) “Clarence Cottman III” | (signed) “Brian Bayley” | |||
| Director | Director | |||
5
Table of Contents
NiMin Energy Corp.
Consolidated Statements of Operations and Comprehensive Loss
For the years ended December 31, 2011, 2010 and 2009
(Expressed in U.S. dollars)
| 2011 | 2010 | 2009 | ||||||||||
| Petroleum and natural gas revenues |
$ | 24,305,685 | $ | 14,029,198 | $ | 6,498,789 | ||||||
| Expenses: |
||||||||||||
| Operating costs |
11,565,565 | 9,116,563 | 5,162,936 | |||||||||
| General and administrative |
7,894,479 | 7,888,736 | 6,826,661 | |||||||||
| Depreciation, depletion, amortization, and accretion |
3,507,669 | 3,190,905 | 3,351,753 | |||||||||
| Impairment of oil and natural gas properties |
— | — | 6,313,633 | |||||||||
| Loss on crude oil derivative contracts |
753,053 | 708,032 | 300,778 | |||||||||
|
|
|
|
|
|
|
|||||||
| 23,720,766 | 20,904,236 | 21,955,761 | ||||||||||
|
|
|
|
|
|
|
|||||||
| Income (loss) from operations |
584,919 | (6,875,038 | ) | (15,456,972 | ) | |||||||
|
|
|
|
|
|
|
|||||||
| Interest income |
44,595 | 54,070 | 78,127 | |||||||||
| Interest expense |
(5,406,133 | ) | (7,108,109 | ) | (228,131 | ) | ||||||
| Foreign exchange gain (loss) |
(26,101 | ) | 6,617 | (385,626 | ) | |||||||
| Change in fair value of options |
707,513 | — | — | |||||||||
| Change in fair value of warrants |
1,062,208 | 1,674,053 | (3,523,543 | ) | ||||||||
| Other |
(196,649 | ) | 248,734 | — | ||||||||
|
|
|
|
|
|
|
|||||||
| (3,814,567 | ) | (5,124,635 | ) | (4,059,173 | ) | |||||||
|
|
|
|
|
|
|
|||||||
| Loss before income taxes |
(3,229,648 | ) | (11,999,673 | ) | (19,516,145 | ) | ||||||
| Income tax expense |
— | 386,772 | 232,824 | |||||||||
|
|
|
|
|
|
|
|||||||
| Net loss and comprehensive loss |
(3,229,648 | ) | (12,386,445 | ) | (19,748,969 | ) | ||||||
|
|
|
|
|
|
|
|||||||
| Basic and diluted loss per share |
$ | (0.05 | ) | $ | (0.21 | ) | $ | (0.47 | ) | |||
|
|
|
|
|
|
|
|||||||
See accompanying notes to consolidated financial statements.
6
Table of Contents
NiMin Energy Corp.
Consolidated Statements of Cash Flows
For the years ended December 31, 2011, 2010, and 2009
(Expressed in U.S. dollars)
| 2011 | 2010 | 2009 | ||||||||||
| Cash flows from operating activities: |
||||||||||||
| Net loss |
$ | (3,229,648 | ) | $ | (12,386,445 | ) | $ | (19,748,969 | ) | |||
| Adjustments to reconcile net loss to net cash provided by (used in) operating activities: |
||||||||||||
| Depreciation, depletion, amortization, and accretion |
3,507,669 | 3,190,905 | 3,351,753 | |||||||||
| Impairment of crude oil and gas properties |
— | — | 6,313,633 | |||||||||
| Change in fair value of options |
(707,513 | ) | — | — | ||||||||
| Change in fair value of warrants |
(1,062,208 | ) | (1,749,034 | ) | 3,523,543 | |||||||
| Unrealized foreign exchange (gain) loss |
— | (189,718 | ) | 213,738 | ||||||||
| Stock-based compensation |
2,605,892 | 2,716,621 | 2,945,197 | |||||||||
| Unrealized (gain) loss on crude oil derivative contracts |
(365,109 | ) | 1,240,284 | — | ||||||||
| Non-cash interest expense |
906,569 | 3,461,205 | — | |||||||||
| (Increase) decrease in assets: |
||||||||||||
| Trade accounts receivable |
(1,307,337 | ) | (313,908 | ) | (550,411 | ) | ||||||
| Prepaid expenses |
(49,712 | ) | (450,841 | ) | 60,660 | |||||||
| Crude oil inventory |
91,822 | (20,481 | ) | 3,043 | ||||||||
| Other assets |
1,797 | 274,500 | (243,625 | ) | ||||||||
| Increase (decrease) in liabilities: |
||||||||||||
| Accounts payable and accrued liabilities |
(1,105,344 | ) | 3,242,289 | 1,669,490 | ||||||||
|
|
|
|
|
|
|
|||||||
| Net cash used in operating activities |
(713,122 | ) | (984,623 | ) | (2,461,948 | ) | ||||||
|
|
|
|
|
|
|
|||||||
| Cash flows from investing activities: |
||||||||||||
| Purchase of and expenditures on crude oil and natural gas properties |
(18,044,984 | ) | (11,234,812 | ) | (10,845,772 | ) | ||||||
| Business combination of Wyoming Assets |
— | — | (27,173,108 | ) | ||||||||
| Divestiture of crude and natural gas properties |
1,000,000 | — | — | |||||||||
| Purchase of equipment |
(68,564 | ) | (111,427 | ) | — | |||||||
| Cash acquired in merger |
— | — | 271,270 | |||||||||
| (Increase) decrease in restrictive investments |
19,208 | (483,469 | ) | (200,000 | ) | |||||||
|
|
|
|
|
|
|
|||||||
| Net cash used in investing activities |
(17,094,341 | ) | (11,829,708 | ) | (37,947,610 | ) | ||||||
|
|
|
|
|
|
|
|||||||
| Cash flows from financing activities: |
||||||||||||
| Issuance of long-term debt |
— | 31,109,718 | — | |||||||||
| Issuance of short-term debt |
— | — | 22,000,000 | |||||||||
| Exercise of warrants and options |
8,521,761 | — | — | |||||||||
| Repayment of short-term debt |
— | (22,024,020 | ) | — | ||||||||
| Proceeds from issuance of common shares (net of costs) |
3,606,725 | 10,076,420 | 11,016,558 | |||||||||
|
|
|
|
|
|
|
|||||||
| Net cash provided by financing activities |
12,128,486 | 19,162,118 | 33,016,558 | |||||||||
|
|
|
|
|
|
|
|||||||
| Change in cash and cash equivalents during the period |
(5,678,977 | ) | 6,347,787 | (7,393,000 | ) | |||||||
| Cash and cash equivalents at beginning of the period |
9,490,005 | 3,142,218 | 10,535,218 | |||||||||
|
|
|
|
|
|
|
|||||||
| Cash and cash equivalents at end of the period |
$ | 3,811,028 | $ | 9,490,005 | $ | 3,142,218 | ||||||
|
|
|
|
|
|
|
|||||||
| Supplemental disclosure of cash flow information: |
||||||||||||
| Cash paid for interest |
$ | 4,500,000 | $ | 3,608,293 | $ | 228,131 | ||||||
| Cash paid for income tax expense |
$ | — | $ | 386,772 | $ | 232,824 | ||||||
See accompanying notes to consolidated financial statements.
7
Table of Contents
NiMin Energy Corp.
Consolidated Statements of Stockholders’ Equity
Years ended December 31, 2011, 2010, and 2009
(Expressed in U.S. dollars)
| Common Stock | ||||||||||||||||||||
| Shares | Amount | Additional Paid in Capital |
Accumulated Deficit |
Total Stockholders’ Equity |
||||||||||||||||
| Balance as of December 31, 2008 |
37,301,656 | $ | 72,861,988 | $ | 4,199,192 | $ | (38,756,373 | ) | $ | 38,304,807 | ||||||||||
|
|
|
|
|
|
|
|
|
|
|
|||||||||||
| Issued to NiMin Capital Corp. shareholders |
1,066,665 | 196,450 | 196,450 | |||||||||||||||||
| Issuance of common stock |
11,442,751 | 9,296,549 | 3,782,024 | 13,078,573 | ||||||||||||||||
| Reclassified to liabilities |
(3,857,006 | ) | (3,857,006 | ) | ||||||||||||||||
| Stock issuance costs |
(2,085,777 | ) | (2,085,777 | ) | ||||||||||||||||
| Stock-based compensation expense |
2,945,197 | 2,945,197 | ||||||||||||||||||
| Issued to PLC |
2,566,666 | 2,813,495 | 2,813,495 | |||||||||||||||||
| Sale of common stock |
33,239 | 23,762 | 23,762 | |||||||||||||||||
| Net loss |
(19,748,969 | ) | (19,748,969 | ) | ||||||||||||||||
|
|
|
|
|
|
|
|
|
|
|
|||||||||||
| Balance at December 31, 2009 |
52,410,977 | 83,106,467 | 7,069,407 | (58,505,342 | ) | 31,670,532 | ||||||||||||||
|
|
|
|
|
|
|
|
|
|
|
|||||||||||
| Exercise of options |
80,000 | 74,552 | 74,552 | |||||||||||||||||
| Reclassified from warrant liability |
74,982 | 74,982 | ||||||||||||||||||
| Issuance of common stock |
9,200,000 | 11,018,492 | 11,018,492 | |||||||||||||||||
| Stock issuance cost |
(1,091,606 | ) | (1,091,606 | ) | ||||||||||||||||
| Stock-based compensation expense |
2,716,621 | 2,716,621 | ||||||||||||||||||
| Net loss |
(12,386,445 | ) | (12,386,445 | ) | ||||||||||||||||
|
|
|
|
|
|
|
|
|
|
|
|||||||||||
| Balance at December 31, 2010 |
61,690,977 | 93,107,905 | 9,861,010 | (70,891,787 | ) | 32,077,128 | ||||||||||||||
|
|
|
|
|
|
|
|
|
|
|
|||||||||||
| Exercise of options |
29,999 | 59,411 | (21,022 | ) | 38,389 | |||||||||||||||
| Exercise of warrants |
5,354,800 | 8,483,372 | 8,483,372 | |||||||||||||||||
| Reclassified from warrant liability |
4,258,164 | 4,258,164 | ||||||||||||||||||
| Reclassified to options liability |
(1,025,463 | ) | 169,804 | (855,659 | ) | |||||||||||||||
| Issuance of common stock |
2,758,620 | 3,166,057 | 844,488 | 4,010,545 | ||||||||||||||||
| Stock issuance cost |
(316,449 | ) | (87,371 | ) | (403,820 | ) | ||||||||||||||
| Stock-based compensation expense |
2,605,892 | 2,605,892 | ||||||||||||||||||
| Net loss |
(3,229,648 | ) | (3,229,648 | ) | ||||||||||||||||
|
|
|
|
|
|
|
|
|
|
|
|||||||||||
| Balance at December 31, 2011 |
69,834,396 | $ | 108,758,460 | $ | 12,177,534 | $ | (73,951,631 | ) | $ | 46,984,363 | ||||||||||
|
|
|
|
|
|
|
|
|
|
|
|||||||||||
See accompanying notes to consolidated financial statements.
8
Table of Contents
NiMin Energy Corp.
Notes to Consolidated Financial Statements
December 31, 2011, 2010 and 2009
| 1 | Description of the Business and Reorganization |
NiMin Energy Corp. (the “Company” or “NiMin”) was incorporated under the name NiMin Capital Corp. under the Business Corporations Act (Alberta) on May 31, 2007. The Company changed its name to NiMin Energy Corp. on September 3, 2009, and consolidated its shares on the basis of one new post-consolidation share (“Common Share”) for each three existing common shares.
The principal business of the Company is conducted through its wholly owned subsidiary, Legacy Energy, Inc. (“Legacy”), a Delaware corporation engaged in the exploration, development, and production of crude oil and natural gas properties in the states of California and Wyoming.
| a) | Reverse Triangular Merger |
On July 17, 2009, NiMin Capital Corp. entered into a merger agreement with Legacy whereby NiMin Capital Corp. acquired Legacy in a reverse triangular transaction effected by way of a merger (the “Merger”). NiMin Capital Corp. incorporated NiMin Merger Corp. (“AcquisitionCo”), a wholly owned U.S. subsidiary under the laws of the State of Delaware, solely for the purpose of effecting the proposed merger under which Legacy would merge with AcquisitionCo and as the surviving corporation would become a wholly-owned subsidiary of NiMin.
On September 4, 2009, the Company acquired 100% of the issued and outstanding securities of Legacy by the issuance of 37,301,656 Common Shares in the Merger. As the surviving corporation, Legacy became a wholly-owned subsidiary of the Company. The Company issued a sufficient number of securities to the holders of securities of Legacy such that control of the Company passed to the former security holders of Legacy. As the former shareholders of Legacy controlled greater than 50% of the Company upon completion of the Merger, the Merger was accounted for as a reverse take-over of the Company.
Prior to the Merger, NiMin Capital Corp. consolidated its common shares, options, and warrants on the basis of one new common share, option, or warrant for three existing common shares, options, or warrants of NiMin Capital Corp. The shareholders of Legacy received one Common Share of the Company in exchange for each one of their Legacy shares of common stock. Holders of outstanding options and warrants of Legacy received replacement options and warrants of the Company.
In connection with the Merger, the Common Shares of NiMin, which previously traded on the TSX Venture Exchange (“TSX-V”) under the stock trading symbol NNI.P, were listed on the Toronto Stock Exchange (“TSX”) under the stock trading symbol “NNN”. The Common Shares were delisted from trading on the TSX-V at the closing on September 3, 2009, to facilitate the listing of the Common Shares on the TSX.
Control of the combined companies passed to the former shareholders of Legacy and therefore Legacy is considered the accounting acquirer. Consequently, the consolidated balance sheets and consolidated statements of operations, and cash flows include Legacy’s results of operations, deficit, and cash flows from inception and the Company’s results of operations and cash flows beginning September 4, 2009.
At the date of the Merger, the fair values of the net assets of NiMin were as follows:
| Cash and cash equivalents |
$ | 271,270 | ||
| Accounts receivable |
6,888 | |||
| Accounts payable and accrued liabilities |
(81,708 | ) | ||
|
|
|
|||
| Net assets acquired |
$ | 196,450 | ||
|
|
|
9
Table of Contents
NiMin Energy Corp.
Notes to Consolidated Financial Statements
December 31, 2011, 2010 and 2009
| b) | Principles of Accounting |
As Legacy is the acquirer for accounting purposes, the accompanying financial statements of the Company presented prior to September 4, 2009 are those of Legacy. Therefore after the Merger, references to “the Company” or “NiMin” refer to the consolidated entity and prior to September 4, 2009 refer to Legacy.
| 2 | Basis of Presentation |
The consolidated financial statements have been prepared in accordance with accounting principles generally accepted in the United States (“U.S.GAAP”) and include the accounts of the Company, its wholly-owned subsidiary and the Company’s proportionate interest in Joint Interest Activities. All inter-company balances and transactions have been eliminated upon consolidation.
| 3 | Significant Accounting Policies |
| a. | Crude Oil and Natural Gas Properties and Equipment |
The Company accounts for its crude oil and natural gas producing activities under the full-cost method of accounting. Accordingly, all costs incurred in the acquisition, exploration, and development of proved crude oil and natural gas properties, including the costs of abandoned properties, dry holes, geological and geophysical costs, and annual lease rentals, are capitalized. All general corporate costs are expensed as incurred. Sales or other dispositions of crude oil and natural gas properties are accounted for as adjustments to capitalized costs with no gain or loss recorded unless such sale would significantly alter the relationship between pool cost and reserves.
| b. | Depletion and Depreciation |
Depletion of crude oil and natural gas properties is computed under the unit-of-production method whereby the ratio of production to proved reserves, after royalties, determines the proportion of depletable costs to be expensed in each period. Costs associated with unevaluated properties are excluded from the full-cost pool until a determination is made whether proved reserves can be attributable to the related properties. Unevaluated properties are evaluated at least annually to determine whether the costs incurred should be classified to the full-cost pool and thereby subject to amortization. Reserves are determined by an independent reserves engineering firm. Volumes are converted to equivalent units using the ratio of one barrel of oil to six thousand cubic feet of natural gas. A significant reduction in our proved reserves may result in an accelerated depletion rate.
Depreciation of equipment is provided for on a straight-line basis over the useful life (5 to 10 years) of the asset.
| c. | Impairment of Long-lived Assets |
The Company performs a full-cost ceiling test on proved crude oil and natural gas properties in which the capitalized costs are not allowed to exceed their related estimated future net revenues of proved reserves discounted at 10%, net of tax considerations. When calculating reserves, the Company conformed to SEC rules under “Modernization of Oil and Gas Reporting” for pricing and used constant prices which were adopted by the SEC in December of 2008.
Equipment is reviewed for impairment whenever events or changes in circumstances indicate such impairment may have occurred. Impairment is recognized when the estimated undiscounted future
10
Table of Contents
NiMin Energy Corp.
Notes to Consolidated Financial Statements
December 31, 2011, 2010 and 2009
net cash flows of an asset are less than its carrying value. A significant reduction in our proved reserves may result in a full cost ceiling limitation. If an impairment occurs, the carrying value of the impaired asset is reduced to fair value.
| d. | Revenue Recognition |
Petroleum and natural gas sales are recognized as revenue when the commodities are delivered and title has passed to the purchasers and collection is reasonably assured.
| e. | Joint Interest Activities |
Certain of the Company’s exploration, development and production activities are conducted jointly with other entities and accordingly the consolidated financial statements reflect only the Company’s proportionate interest in such activities.
| f. | Asset Retirement Obligations |
The Company recognizes a liability for the present value of all legal obligations associated with the retirement of tangible, long-lived assets and capitalizes an equal amount as a cost of the asset. The cost associated with the abandonment obligation is included in the computation of depreciation, depletion, amortization and accretion. The liability accretes until the Company settles the obligation. The Company uses a credit-adjusted risk-free interest rate in its calculation of asset retirement obligations (“ARO”).
Revisions to the original estimated liability would result in an increase or decrease to the ARO liability and related capitalized costs. Actual costs incurred upon settlement of the asset retirement obligation are charged against the obligation to the extent of the liability recorded.
Estimates for future abandonment and reclamation costs are based on historical costs to abandon and reclaim similar sites, taking into consideration current costs. The liability is based on the Company’s net interest in the respective sites.
| g. | Crude Oil Inventory |
Unsold crude oil production is carried in inventory at the lower of cost, generally applied on a first-in, first-out (“FIFO”) basis, or net realizable value, and includes costs incurred to bring the inventory to its existing condition.
| h. | Use of Estimates |
In preparing financial statements, management makes informed judgments and estimates that affect the reported amounts of assets and liabilities as of the date of the financial statements and affect the reported amounts of revenues and expenses during the reporting period.
The amounts recorded for the depletion and depreciation of property and equipment, the accretion expense associated with the asset retirement obligation and the cost recovery assessments for property and equipment are based on estimates of proved reserves, production and discount rates, oil and natural gas prices, future costs and other relevant assumptions. The amount recorded for the unrealized gain or loss on financial instruments is based on estimates of future commodity prices and volatility. The recognition of amounts in relation to stock-based compensation and the fair value of warrants requires estimates related to valuation of stock options and warrants. Future taxes require estimates as to the realization of future tax assets and the timing of reversal of tax
11
Table of Contents
NiMin Energy Corp.
Notes to Consolidated Financial Statements
December 31, 2011, 2010 and 2009
assets and liabilities. By their nature, these estimates are subject to measurement uncertainty and the effect on the consolidated financial statements from changes in such estimates in future years could be significant.
On an ongoing basis, management reviews estimates, including those related to the impairment of long-lived assets, contingencies and income taxes. Changes in facts and circumstances may result in revised estimates and actual results may differ from these estimates.
| i. | Income Taxes |
Deferred tax assets and liabilities are recognized for the future tax consequences attributable to differences between the financial statement carrying amounts of existing assets and liabilities and their respective tax bases. Deferred tax assets and liabilities are measured using enacted tax rates expected to apply to taxable income in the years in which those temporary differences are expected to be recovered or settled. The effect on deferred tax assets and liabilities of a change in enacted tax rates is recognized in income in the period that includes the enactment date. The Company does not have any unrecognized tax benefits. The Company does not believe there will be any material changes in its unrecognized tax positions over the next twelve months. The Company’s policy is that it recognizes interest and penalties accrued on any unrecognized tax benefits as a component of income tax expense. The Company did not have any accrued interest or penalties associated with any unrecognized tax benefits, nor was any tax-related interest expense recognized during 2011, 2010 or 2009.
| j. | Cash and Cash Equivalents |
The Company considers all highly liquid investments with original maturities of three months or less at the time of purchase to be cash equivalents and therefore classifies them with cash.
| k. | Accounts Receivable |
The Company’s accounts receivable primarily consists of amounts owed to the Company by customers for sales of crude oil, natural gas and refined products under varying credit arrangements. The allowance for doubtful accounts is the Company’s best estimate of the amount of probable credit losses on these receivables. The Company reviews this allowance for adequacy at least quarterly and bases its assessment on a combination of current information about its customers and historical write-off experience. As at December 31, 2011 and 2010 the Company had no allowance for doubtful accounts.
| l. | Commodity Derivative Instruments |
Derivative instruments are recognized as either assets or liabilities in the balance sheet at fair value. The accounting for changes in the fair value of derivative instruments depends on their intended use and resulting hedge designation. For derivative instruments designated as hedges, the changes in fair value are recorded in the balance sheet as a component of accumulated other comprehensive income (loss). Changes in the fair value of derivative instruments not designated as hedges are recorded as a gain or loss on derivative contracts in the consolidated statements of operations. The Company does not designate its derivative financial instruments as hedging instruments and, as a result, recognizes the change in a derivative’s fair value currently in earnings.
12
Table of Contents
NiMin Energy Corp.
Notes to Consolidated Financial Statements
December 31, 2011, 2010 and 2009
| m. | Fair Value Measurements |
The Company categorizes its assets and liabilities that are measured at fair value, based on the priority of the inputs to the valuation techniques. The three levels of the fair value measurement hierarchy are as follows:
| Level 1: | Unadjusted quoted prices in active markets that are accessible at the measurement date for identical, unrestricted assets or liabilities. |
| Level 2: | Quoted prices in markets that are not active, or inputs which are observable, either directly or indirectly, for substantially the full term of the asset or liability. |
| Level 3: | Measured based on prices or valuation models that required inputs that are both significant to the fair value measurement and less observable for objective sources (i.e., supported by little or no market activity). |
Financial assets and liabilities are classified based on the lowest level of input that is significant to the fair value measurement. The Company’s assessment of the significance of a particular input to the fair value measurement requires judgment, which may affect the valuation of the fair value of assets and liabilities and their placement within the fair value hierarchy levels. The Company considers active markets as those in which transactions for the assets or liabilities occur in sufficient frequency and volume to provide pricing information on an ongoing basis. For assets and liabilities carried at fair value the Company measures fair value under the following levels:
| Financial Instrument |
Level | |||
| Cash and cash equivalents |
Level 1 | |||
| Restricted investments |
Level 1 | |||
| Long-term debt |
Level 2 | |||
| Commodity derivative |
Level 2 | |||
| Warrants and options |
Level 3 | |||
| n. | Stock-Based Compensation |
The Company measures and recognizes compensation expense for all share-based payment awards, including employee stock options, based on estimated fair values. The value of the portion of the award that is ultimately expected to vest is recognized as an expense on a straight-line basis over the requisite vesting period. The Company estimates the fair value of stock option awards on the date of grant using an option-pricing model. The Company uses the Black-Scholes Merton option-pricing model (“Black-Scholes Model”) as its method of valuation for share-based awards. The Company’s determination of fair value of share-based payment awards on the date of grant using the Black-Scholes Model is affected by the Company’s stock price, as well as assumptions regarding a number of subjective variables. These variables include, but are not limited to, the Company’s expected stock price volatility over the term of the awards, as well as actual and projected exercise and forfeiture activity. The fair value of options granted to consultants, to the extent unvested due to required services not having been fully performed, is determined on subsequent reporting dates.
13
Table of Contents
NiMin Energy Corp.
Notes to Consolidated Financial Statements
December 31, 2011, 2010 and 2009
| o. | Foreign Currency Transactions |
These consolidated financial statements are presented and measured in U.S. dollars, as substantially all of the Company’s operations are located in the United States of America. Transactions and balances using Canadian dollars are expressed in U.S. dollars whereby monetary assets and liabilities are expressed at the period end exchange rate, non-monetary assets and liabilities are expressed at historical exchange rates, and revenue and expenses are expressed at the average exchange rate for the period. Foreign exchange gains and losses are included in the consolidated statements of operations.
| p. | Business Combinations |
The Company records identifiable assets, liabilities, non-controlling interests, and goodwill acquired in a business combination at “fair value” by applying the acquisition method. Accordingly, transaction costs related to acquisitions are recorded as a reduction of earnings in the period they are incurred and costs related to issuing debt or equity securities that are related to the transaction are recognized in accordance with other applicable rules under U.S. GAAP. Non-controlling interests (previously referred to as minority interests) are treated as a separate component of equity, not as a liability or other item outside of permanent equity.
| q. | Per Share Amounts |
Basic per share amounts are computed using the weighted average number of common shares outstanding during the year. Diluted per share amounts reflect the potential dilution that could occur if stock options or warrants to purchase common shares were exercised for common shares.
The treasury stock method of calculating diluted per share amounts is used whereby any proceeds from the exercise of stock options or warrants are assumed to be used to purchase common shares of the Company at the average market price during the year.
| 4 | Changes in Accounting Policies |
| a. | In June 2011, the Financial Accounting Standards Board issued ASU No. 2011-05, “Comprehensive Income (Topic 220): Presentation of Comprehensive Income” (“ASU No. 2011-05”). In ASU No. 2011-05, an entity has the option to present the total of comprehensive income, the components of net income, and the components of other comprehensive income either in a single continuous statement of comprehensive income or in two separate but consecutive statements. In both choices, an entity is required to present each component of net income along with total net income, each component of other comprehensive income along with a total for other comprehensive income, and a total amount for comprehensive income. The amendments in ASU No. 2011-05 do not change the items that must be reported in other comprehensive income or when an item of other comprehensive income must be reclassified to net income. They also do not change the presentation of related tax effects, before related tax effects, or the portrayal or calculation of earnings per share. The amendments in ASU No. 2011-05 should be applied retrospectively. The amendment is effective for fiscal years, and interim periods within those years, beginning after December 15, 2011. This update is not expected to have a material impact on the Company’s financial statements. |
14
Table of Contents
NiMin Energy Corp.
Notes to Consolidated Financial Statements
December 31, 2011, 2010 and 2009
| 5 | Equipment |
| December 31, 2011 |
December 31, 2010 |
|||||||
| Equipment |
$ | 688,456 | $ | 619,892 | ||||
| Accumulated depreciation |
(400,538 | ) | (271,394 | ) | ||||
|
|
|
|
|
|||||
| Net book value |
$ | 287,918 | $ | 348,498 | ||||
|
|
|
|
|
|||||
| 6 | Crude Oil and Natural Gas Properties |
| December 31, 2011 |
December 31, 2010 |
|||||||
| Proved properties |
$ | 134,113,786 | $ | 116,799,184 | ||||
| Less: accumulated depletion of oil and gas properties |
(13,850,206 | ) | (10,557,420 | ) | ||||
| Less: accumulated impairments |
(42,185,800 | ) | (42,185,800 | ) | ||||
|
|
|
|
|
|||||
| Proved properties, net |
$ | 78,077,780 | $ | 64,055,964 | ||||
|
|
|
|
|
|||||
| Unproved properties, not being depleted |
$ | 468,042 | $ | 476,986 | ||||
As of December 31, 2011, crude oil and natural gas properties includes $468,042 (December 31, 2010—$476,986) relating to unproved properties which have been excluded from the depletion calculation. At December 31, 2011, future development costs related to the development of proved reserves of $118.54 million (December 31, 2010—$87.8 million) are included in the depletion calculation. For the year ended December 31, 2011, the Company’s depletion rate was $11.25 per barrel of oil equivalent (“boe”) (2010—$12.13 per boe, and 2009—$19.12 per boe).
The following is a summary of the Company’s crude oil and natural gas properties not subject to amortization as of December 31, 2011:
| Costs Incurred In | ||||||||||||||||||||
| Total | 2011 | 2010 | 2009 | Prior to 2009 | ||||||||||||||||
| Acquisitions |
$ | 20,000 | $ | — | — | $ | — | $ | 20,000 | |||||||||||
| Exploration |
176,777 | — | 50,624 | — | 126,153 | |||||||||||||||
| Development |
271,265 | (8,944 | ) | 177,012 | 103,197 | — | ||||||||||||||
|
|
|
|
|
|
|
|
|
|
|
|||||||||||
| Total |
$ | 468,042 | $ | (8,944 | ) | $ | 227,636 | $ | 103,197 | $ | 146,153 | |||||||||
|
|
|
|
|
|
|
|
|
|
|
|||||||||||
The Company expects that substantially all of its unproved property costs in the U.S. as of December 31, 2011 will be reclassified to proved properties within ten years.
During 2009, the Company reduced the carrying values of certain oil and gas properties due to full cost ceiling limitations by $6,313,633. Based on the full cost ceiling limitations, there was no reduction necessary during 2010 or 2011.
15
Table of Contents
NiMin Energy Corp.
Notes to Consolidated Financial Statements
December 31, 2011, 2010 and 2009
Divestiture of Louisiana Assets
On December 1, 2011, the Company completed the divestiture of its non-operated and non-core interests in producing crude oil and natural gas properties located in the southern onshore region of Louisiana for a total cash consideration of $1 million.
Acquisition of Wyoming Assets
On December 17, 2009, the Company acquired four producing oil fields in the state of Wyoming, USA (the “Wyoming Assets”). The cash purchase price for the Wyoming Assets was $27 million, of which $22 million was funded by a loan syndicated by a private lending company (see notes 7 and 15), and the remainder from working capital.
The following table details the purchase price for the Wyoming Assets:
| Fair value of assets acquired: |
||||
| Inventory |
$ | 78,763 | ||
| Equipment |
50,000 | |||
| Crude oil and natural gas properties |
27,472,671 | |||
| Asset retirement obligations |
(428,326 | ) | ||
|
|
|
|||
| Total net assets acquired |
$ | 27,173,108 | ||
|
|
|
The following table presents the pro forma comparative data that reflects the Company’s revenue and earnings for the stated periods as if the Wyoming Assets acquisition had occurred at January 1, 2009.
| Unaudited | ||||||||
| 2009 | 2009 Actual |
|||||||
| Petroleum and natural gas sales |
$ | 10,541,438 | $ | 447,549 | ||||
| Net income (loss) |
(17,795,258 | ) | 140,618 | |||||
| Basic and diluted per share |
(0.43 | ) | 0.00 | |||||
Actual amounts are included in the year-ended December 31, 2009 net loss.
| 7 | Short-Term Debt |
In December 2009, the Company entered into a credit agreement with a private lending company, (the “PLC”) where the PLC syndicated a loan to the Company in an aggregate amount of USD $5,500,000 and CDN$17,534,550 (USD $ 16,713,738). Concurrent with the borrowing, the Company issued 2,566,666 Common Shares to the PLC at a price of CDN $1.15 (USD $1.07) per share which were recorded as prepaid interest expense and were being amortized to earnings over the term of the loan. Interest on the outstanding principal amount was calculated daily and compounded monthly and payable on a monthly basis at 12% per annum. On June 30, 2010, the Company paid in full the interest and principal amount of USD $22,024,020, outstanding and expensed the remaining prepaid interest.
| 8 | Senior Loan |
On June 30, 2010, the Company entered into a senior secured loan (the “Senior Loan”) in the amount of $36 million from a U.S. based institutional private lender (the “Lender”). The Company borrowed $36
16
Table of Contents
NiMin Energy Corp.
Notes to Consolidated Financial Statements
December 31, 2011, 2010 and 2009
million subject to an original issuer discount of 7.5%, a commitment fee of 1%, a placement fee of 1% and a transaction fee of 3%. Debt issuance costs of $4.9 million were incurred and are being amortized to net income under the effective interest method.
The Senior Loan has a 12.5% fixed interest rate and a term of five years. Interest is payable quarterly beginning September 30, 2010. Principal is payable quarterly beginning June 29, 2012 in the following annual amounts:
| 2012 |
$ | 4,050,000 | ||
| 2013 |
5,400,000 | |||
| 2014 |
6,750,000 | |||
| 2015 |
19,800,000 | |||
|
|
|
|||
| $ | 36,000,000 | |||
|
|
|
At December 31, 2011, the fair value of the Senior Loan is $32.89 million. Fair value is based on level two inputs under the fair value hierarchy.
The Senior Loan is secured by all of the Company’s assets. The loan may be repaid after June 30, 2013, without a pre-payment penalty or make whole provision. Prior to June 30, 2012, in the event of prepayment, the Company will be required to pay a make whole provision compensating the Lender for all unpaid interest. From July 1, 2012 to June 30, 2013, a 2% prepayment premium will be assessed on any outstanding principal being repaid in excess of the scheduled repayments noted above.
The Company used the net proceeds of the Senior Loan to repay the existing short-term debt (see note 7) and the remaining proceeds are being utilized for the Company’s capital expenditure program in Wyoming and California. The Company is required to meet certain financial based covenants under the terms of this facility and was committed to drill a minimum of seven development wells on the Ferguson Ranch Field and total capital expenditures were limited to an amount no greater than $12 million from the date of the loan until December 31, 2010, and total capital expenditures were limited to an amount no greater than $25 million for the year ended December 31, 2011. For the period ended December 31, 2011, the Company was in compliance with all covenants. The Senior Loan has a material adverse change clause relating to financial stability and for which the Lender can ultimately demand immediate repayment in the event of default.
| 9 | Asset Retirement Obligations |
The Company’s asset retirement obligations are based on net ownership in wells and facilities and management’s estimate of the timing and expected future costs associated with site reclamation, facilities dismantlement and the plugging and abandonment of wells.
The following table provides a reconciliation of the beginning and ending aggregate carrying amount of the obligation associated with the retirement of property and equipment:
17
Table of Contents
NiMin Energy Corp.
Notes to Consolidated Financial Statements
December 31, 2011, 2010 and 2009
| Year ended | Year ended | Year ended | ||||||||||
| December 31, | December 31, | December 31, | ||||||||||
| 2011 | 2010 | 2009 | ||||||||||
| Balance, beginning of year |
$ | 1,309,789 | $ | 1,220,046 | $ | 575,209 | ||||||
| Liabilites incurred |
313,684 | 17,743 | — | |||||||||
| Liabilies acquired (Note 6) |
— | — | 428,326 | |||||||||
| Change in estimate (i) |
(422,813 | ) | — | 171,439 | ||||||||
| Reduction to liabilities |
(105,737 | ) | (9,110 | ) | — | |||||||
| Accretion expense |
85,738 | 81,110 | 45,072 | |||||||||
|
|
|
|
|
|
|
|||||||
| Balance, end of year |
$ | 1,180,661 | $ | 1,309,789 | $ | 1,220,046 | ||||||
|
|
|
|
|
|
|
|||||||
| (i) | The Company adjusted the remaining life of its California oil and gas properties in calculating its asset retirement obligation from approximately 9 years to 25 years to better reflect estimated useful lives of the properties. |
The present value of the asset retirement obligation is determined using an annual credit adjusted discount rate of 7.3% per annum. The Company estimates the total future amount of cash flows inflated at 2% annually required to settle its asset retirement obligations is approximately $6.81 million which is expected will be incurred between 2013 and 2037.
| 10 | Share Capital |
| a. | Authorized and Outstanding |
Common Shares
NiMin is authorized to issue an unlimited number of Common Shares. As of December 31, 2011, 69,834,396 Common Shares were issued and outstanding and as of December 31, 2010, 61,690,977 Common Shares were issued and outstanding.
Preferred Shares
NiMin is also authorized to issue an unlimited number of Preferred Shares issuable in series. As of December 31, 2011, no Preferred Shares have been issued.
| b. | Issued |
In September 2011, the Company completed a brokered private placement (the “Private Placement”) of 2,758,620 units (“U.S. Units”) of the Company at a purchase price of CDN$1.45 per U.S. Unit for gross proceeds of CDN$3,999,999 or USD $4,010,545, net of CDN $267,224 or USD $267,928 of agents fees. Each U.S. Unit consists of one common share and one-half of one common share purchase warrant (“U.S. Warrant”).
The U.S. Units and underlying securities are subject to a hold period of four months plus one day from the date of issue.
In May 2010, NiMin completed a public offering of Common Shares for an offering price of CDN $1.25. The Company issued 9,200,000 Common Shares for aggregate gross proceeds of CDN $11,500,000 or USD $11,018,492, net of CDN $989,260 or USD $947,840 of offering costs.
18
Table of Contents
NiMin Energy Corp.
Notes to Consolidated Financial Statements
December 31, 2011, 2010 and 2009
In September 2009, the Company completed a public offering of units of the Company (“Units”), each Unit consisting of one Common Share and one warrant (“Warrant”) to acquire one Common Share for an offering price of CDN $1.25 per Unit (USD $1.13). The Company issued 11,324,900 Units for aggregate gross proceeds of CDN $14,156,125 or USD $13,078,573, net of CDN $2,265,671 or USD $2,085,777 of offering costs. The warrants are exercisable at CDN $1.55 on or before September 4, 2011, subject to certain acceleration provisions. Offering costs include a fee of 4.5% on CDN $3,273,625 of Units sold by a sub-agent, paid by the issuance of 117,851 Units issued on the same terms and conditions as the Units issued pursuant to this offering.
| c. | Stock Option Plan |
The Company established a stock option plan as approved by the shareholders whereby options to purchase Common Shares may be granted to the Company’s directors, officers, employees and consultants. The exercise prices of stock options are denominated in Canadian dollars. The number of Common Shares issuable under the Company’s stock option plan cannot exceed 15% of the issued and outstanding common shares of the Company. The exercise price of each option equals the market price of the Company’s stock on the date of grant and the option has a maximum life of ten years. The vesting period is determined by the Board of Directors at the time of grant. Options issued by the Company generally vest one-third on the first, second, and third anniversary of the date of grant.
The following table sets forth a reconciliation of the stock option activity for the years ended December 31, 2011 and 2010:
| Number of shares |
Weighted Average Exercise Price (CDN$) |
|||||||
| Balance at December 31, 2008 |
4,605,450 | 2.84 | ||||||
|
|
|
|
|
|||||
| Options granted |
885,000 | 2.53 | ||||||
| Options forfeited |
(10,000 | ) | 2.09 | |||||
| Options exchanged for warrants (i) |
(1,103,520 | ) | 2.02 | |||||
|
|
|
|
|
|||||
| Balance at September 3, 2009 |
4,376,930 | 2.69 | ||||||
|
|
|
|
|
|||||
| Options cancelled as result of reverse take-over |
(4,376,930 | ) | 2.69 | |||||
| Options exchanged as result of reverse take-over (ii) |
4,376,930 | 1.25 | ||||||
| Options granted |
3,268,070 | 1.26 | ||||||
| Reverse take-over of Nimin |
||||||||
| Capital Corp. options (Note 1) |
50,000 | 0.75 | ||||||
|
|
|
|
|
|||||
| Stock options outstanding at December 31, 2009 |
7,695,000 | 1.25 | ||||||
|
|
|
|
|
|||||
| Options exercised |
(80,000 | ) | 0.94 | |||||
| Options forfeited |
(310,000 | ) | 1.37 | |||||
| Options issued |
50,000 | 1.25 | ||||||
|
|
|
|
|
|||||
| Stock options outstanding at December 31, 2010 |
7,355,000 | 1.25 | ||||||
|
|
|
|
|
|||||
| Options exercised (iii) |
(29,999 | ) | 1.25 | |||||
| Options forfeited |
(105,000 | ) | 1.64 | |||||
| Options issued |
2,000,000 | 1.44 | ||||||
|
|
|
|
|
|||||
| Stock options outstanding at December 31, 2011 (iv) |
9,220,001 | 1.24 | ||||||
|
|
|
|
|
|||||
19
Table of Contents
NiMin Energy Corp.
Notes to Consolidated Financial Statements
December 31, 2011, 2010 and 2009
| (i) | Prior to the Merger, certain option holders were issued warrants in exchange for their options. These warrants have the same terms and conditions as the original stock options (see note 10d). |
| (ii) | Holders of outstanding options and warrants to acquire shares of Legacy received replacement options and warrants to acquire Common Shares. The cancellation of the Legacy options and subsequent replacement with NiMin options resulted in a new modification date and valuation. The resulting incremental fair value of $1,438,359 between the replacement options and the cancelled options immediately before the modification is being recognized over the new service period. |
| (iii) | The intrinsic value of the exercised options during 2011 was CDN $33,299. |
| (iv) | The 1.50 million stock options relating to former employees were modified upon transition to a consulting role to allow for continued vesting. The resulting $310,309 was recognized as incremental stock-based compensation. As the related options are denominated in Canadian dollars, which is not the functional currency of the Company (which is the U.S. dollar), the applicable 999,998 vested options are classified as a liability on the balance sheet and recorded at their fair value at the end of each period and the change in fair value is recognized in earnings. |
At December 31, 2011, stock options to purchase Common Shares were exercisable as follows:
| Number of Options Outstanding |
Exerciseable | Weighted Average Exercise Price (CDN$) |
Average Contractual Life (Years) |
|||||||||||||
| 9,220,001 | 5,136,658 | 1.24 | 7.01 | |||||||||||||
|
|
|
|
|
|
|
|
|
|||||||||
| Intrinsic Value |
— | — | ||||||||||||||
|
|
|
|
|
|||||||||||||
All options granted during the year had an estimated fair value determined using the Black-Scholes Model using the following weighted average assumptions:
| Grant Date |
Expected Life |
Weighted Average Risk Free Interest Rate |
Weighted Average Volatility |
Dividend Yield |
Fair Value per Option |
|||||||||||||||
| 2009 |
6 years | 3.04 | % | 61.81 | % | — | $ | 0.69 | ||||||||||||
| 2010 |
5 years | 1.74 | % | 86.38 | % | — | $ | 0.70 | ||||||||||||
| 2011 |
3 years | 1.38 | % | 87.26 | % | — | $ | 0.66 | ||||||||||||
|
|
|
|
|
|
|
|
|
|
|
|||||||||||
Risk-free interest rate is the Government of Canada marketable bond rate for the day of the grant having a term approximating the expected life of the option.
Expected lives of options are based on the simple average of the average vesting period and the life of the award, or the simplified method, because of the limited historical data. All groups of employees have been determined to have similar historical exercise patterns for valuation purposes. Options granted have a maximum term of five to ten years.
20
Table of Contents
NiMin Energy Corp.
Notes to Consolidated Financial Statements
December 31, 2011, 2010 and 2009
Annualized volatility is a measure of the amount by which the share price fluctuated or is expected to fluctuate. The Company used the average daily price volatility of comparable small cap crude oil and natural gas companies for the retrospective periods corresponding to the respective expected life.
Total compensation expense is amortized over the vesting period of the options. Compensation expense of $2.61 million has been recognized during the year ended December 31, 2011, $2.72 million during the year ended December 31, 2010, and $2.95 million during the year ended December 31, 2009 based on the estimated fair value of the options on the grant date in accordance with the fair value method of accounting for stock-based compensation.
As of December 31, 2011, total unrecognized compensation cost related to unvested stock options was $2,242,153. This amount is expected to be recognized as stock-based compensation expense in the statements of operations over the remaining weighted average vesting period of 1 year.
| Number of Unvested Options |
Weighted- Average Grant- Date Fair Value per Option (CDN$) |
|||||||
| Balance December 31, 2007 |
3,250,395 | 1.64 | ||||||
|
|
|
|
|
|||||
| Vested |
(1,180,395 | ) | 1.60 | |||||
| Granted |
725,000 | 2.81 | ||||||
| Forfeited |
— | — | ||||||
|
|
|
|
|
|||||
| Balance December 31, 2008 |
2,795,000 | 1.96 | ||||||
|
|
|
|
|
|||||
| Vested |
(62,500 | ) | 0.75 | |||||
| Granted |
8,530,000 | 1.28 | ||||||
| Forfeited |
(10,000 | ) | 2.81 | |||||
| Exchanged |
(2,566,480 | ) | — | |||||
| Exchanged for warrants |
(1,103,520 | ) | — | |||||
|
|
|
|
|
|||||
| Balance December 31, 2009 |
7,582,500 | 1.28 | ||||||
|
|
|
|
|
|||||
| Vested |
(2,596,667 | ) | 1.26 | |||||
| Granted |
50,000 | 1.25 | ||||||
| Forfeited |
(102,500 | ) | 1.34 | |||||
|
|
|
|
|
|||||
| Balance December 31, 2010 |
4,933,333 | 1.25 | ||||||
|
|
|
|
|
|||||
| Vested |
(2,744,990 | ) | 1.22 | |||||
| Granted |
2,000,000 | 0.66 | ||||||
| Forfeited |
(105,000 | ) | 0.95 | |||||
|
|
|
|
|
|||||
| Balance December 31, 2011 |
4,083,343 | 0.99 | ||||||
|
|
|
|
|
|||||
When stock options are exercised, the Company issues common shares from the pool of authorized shares.
| d. | Warrants |
Each warrant is exercisable by the holder thereof to acquire one Common Share at any time before the expiry date, after which time the warrants expire and become null and void.
21
Table of Contents
NiMin Energy Corp.
Notes to Consolidated Financial Statements
December 31, 2011, 2010 and 2009
Each whole U.S. Warrant issued in connection with the Private Placement is exercisable for a period of 36 months from September 1, 2011 at an exercise price of USD $1.60. The U.S. Warrants are subject to a hold period of four months plus one day from the date of issue.
On September 6, 2011, the remaining 6.09 million Warrants associated with the September 2009 financing expired. The Warrants had a term of two years from the date of issuance, and each Warrant was exercisable into one common share at a price of CDN $1.55 per share. NiMin issued 11.44 million of these warrants and 5.35 million were exercised during the two year term for gross proceeds of CDN $8.3 million.
The following table sets forth a reconciliation of the warrant activity for the years ended December 31, 2011, 2010 and 2009:
| Number of Warrants |
Equity Component Amount |
Weighted Average Exercise Price (CDN$) |
||||||||||
| Warrants outstanding at December 31, 2008 |
1,094,879 | 584,942 | 2.35 | |||||||||
|
|
|
|
|
|
|
|||||||
| Warrants issued in exchange for options (Note 10c) |
1,103,520 | — | 2.02 | |||||||||
| Warrants cancelled as a result of reverse take-over (i) |
(2,198,399 | ) | — | 2.18 | ||||||||
| Warrants exchanged as a result of reverse take-over (i) |
2,198,399 | — | 2.18 | |||||||||
| Reverse take-over of NiMin Capital Corp. warrants (Note 1) |
33,333 | — | 0.75 | |||||||||
| Warrants issued in connection with public offering (ii) |
11,442,751 | 3,782,024 | 1.55 | |||||||||
| Reclassified to warrant liability (ii) |
(3,857,006 | ) | ||||||||||
| Warrants forfeited |
(94 | ) | — | 0.75 | ||||||||
| Exercise of warrants |
(33,239 | ) | — | 0.75 | ||||||||
|
|
|
|
|
|
|
|||||||
| Warrants outstanding at December 31, 2009 |
13,641,150 | 509,960 | 1.65 | |||||||||
|
|
|
|
|
|
|
|||||||
| Warrants expired |
(1,291,809 | ) | (584,942 | ) | 2.31 | |||||||
| Reclassified from warrant liability |
74,982 | |||||||||||
|
|
|
|
|
|
|
|||||||
| Warrants outstanding at December 31, 2010 |
12,349,341 | — | 1.58 | |||||||||
|
|
|
|
|
|
|
|||||||
| Warrants exercised |
(5,354,800 | ) | — | 1.55 | ||||||||
| Warrants expired |
(6,087,951 | ) | — | 1.55 | ||||||||
| Warrants issued (iii) |
1,379,310 | 844,488 | 1.65 | |||||||||
|
|
|
|
|
|
|
|||||||
| Warrants outstanding at December 31, 2011 |
2,285,900 | 844,488 | 1.79 | |||||||||
|
|
|
|
|
|
|
|||||||
| (i) | On September 4, 2009, as part of the Merger, the Company replaced each Legacy warrant with one NiMin warrant. All terms and conditions of the replacement warrants remained the same as the original Legacy warrants, except that they became exercisable for Common Shares. |
| (ii) | As of September 4, 2009, the exercise prices of the warrants became denominated in Canadian dollars upon completion of the Merger, which is not the functional currency of the Company. As a result, the warrants are classified as a liability on the consolidated balance sheet and recorded at their fair value at the end of each period and the change in fair value is recognized in earnings. |
22
Table of Contents
NiMin Energy Corp.
Notes to Consolidated Financial Statements
December 31, 2011, 2010 and 2009
| (iii) | The weighted average exercise price of the U.S. Warrants is USD$1.60 and is herein expressed in Canadian dollar equivalent using the closing foreign exchange rate at December 31, 2011. |
The fair value of warrants outstanding is calculated using the Black-Scholes Model using the following weighted average assumptions:
| Weighted Average Expected Life |
Weighted Average Risk Free Interest Rate |
Weighted Average Volatility |
Dividend Yield |
Fair Value per Warrant |
||||||||||||||||
| 2011 |
3.70 | 0.55 | % | 87.31 | % | — | $ | 0.52 | ||||||||||||
| 2010 |
1.75 | 1.46 | % | 85.90 | % | — | $ | 0.46 | ||||||||||||
|
|
|
|
|
|
|
|
|
|
|
|||||||||||
At December 31, 2011, the fair value of the warrant liability was $235,134, with a gain of $1.06 million recognized in current period earnings during the year ended December 31, 2011. At December 31, 2010, the fair value of the warrant liability was $5.63 million, with a gain of $1.67 million recognized in earnings during the year ended December 31, 2010.
Warrants issued to consultants in 2009 but prior to September 4, 2009 had a fair value determined using the Black Scholes Model using the following assumptions:
| Weighted Average Expected Life |
Weighted Average Risk Free Interest Rate |
Weighted Average Volatility |
Dividend Yield |
Fair Value per Warrant ($) |
||||||||||||||||
| 2009 |
2 years | 0.93 | % | 64.10 | % | — | 0.33 | |||||||||||||
Risk-free interest rate is the U.S. Treasury rate for the day of the grant having a term approximating the expected life of the warrant.
Expected life of warrants is the period of time over which the warrants are expected to remain outstanding and is based on the contractual terms. Warrants have a maximum term of two to ten years.
Annualized volatility is a measure of the amount by which the share price fluctuated or is expected to fluctuate. The Company used the average daily price volatility of comparable small cap crude oil and natural gas companies for the retrospective periods corresponding to the respective expected life.
23
Table of Contents
NiMin Energy Corp.
Notes to Consolidated Financial Statements
December 31, 2011, 2010 and 2009
The following table summarizes NiMin’s warrants exercisable at December 31, 2011:
| Expiration Date |
Number of Warrants |
Exercise Price per share (CDN$) |
||||||
| March 10, 2016 |
581,590 | 1.72 | ||||||
| October 15, 2017 |
325,000 | 2.48 | ||||||
| September 1, 2014 (i) |
1,379,310 | 1.65 | ||||||
|
|
|
|
|
|||||
| 2,285,900 | 1.79 | |||||||
|
|
|
|
|
|||||
| (i) | The weighted average exercise price of the U.S. Warrants is USD $1.60 and is herein expressed in Canadian dollar equivalent using the closing foreign exchange rate at September 30, 2011. |
| e. | Per Share Amounts |
Basic earnings (loss) per share are computed by dividing net loss available to common shareholders by the weighted average number of common shares outstanding. Diluted earnings per common share are calculated using the treasury stock method to determine the dilutive effect of the stock options. The treasury stock method assumes that the proceeds received from the exercise of “in the money” stock options and warrants are used to repurchase commons shares at the average market price during the period. The weighted average number of shares assumed to be outstanding was as follows:
| Year ended December 31, |
||||||||||||
| 2011 | 2010 | 2009 | ||||||||||
| Net Loss |
$ | (3,229,648 | ) | $ | (12,386,445 | ) | $ | (19,748,969 | ) | |||
| Basic and diluted shares outstanding (i) |
67,009,441 | 58,577,366 | 41,696,430 | |||||||||
| Loss per basic and diluted share |
$ | (0.05 | ) | $ | (0.21 | ) | $ | (0.47 | ) | |||
| (i) | For the year ended December 31, 2011, 7,422,558 stock options and warrants were excluded from the diluted loss per share calculation. For the year ended December 31, 2010, 14,771,008 stock options and warrants were excluded from the diluted loss per share calculation. For the year ended December 31, 2009, 13,753,650 stock options and warrants were excluded from the diluted loss per share calculation. Potential common shares from the exercise of stock options and warrants were excluded from the diluted loss per share calculation because their effect was anti-dilutive as a result of the Company’s net loss for the years 2011, 2010 and 2009. |
11 Income Taxes
The components of the net deferred income tax asset (liability) are as follows:
24
Table of Contents
NiMin Energy Corp.
Notes to Consolidated Financial Statements
December 31, 2011, 2010 and 2009
| December 31, 2011 |
December 31, 2010 |
December 31, 2009 |
||||||||||
| Temporary differences related to: |
||||||||||||
| Crude oil and natural gas property and equipment |
$ | (16,181,217 | ) | $ | (6,448,248 | ) | $ | (2,672,398 | ) | |||
| Asset retirement obligations |
130,803 | 514,747 | 479,966 | |||||||||
| Stock based compensation |
4,137,663 | 3,162,024 | — | |||||||||
| Share issue costs and other |
431,629 | 445,201 | 748,837 | |||||||||
| Research and development credits |
635,130 | 635,130 | 887,581 | |||||||||
| Non-capital losses |
38,200,692 | 30,103,250 | 21,605,671 | |||||||||
| Valuation allowance |
(27,354,700 | ) | (28,412,104 | ) | (21,049,657 | ) | ||||||
|
|
|
|
|
|
|
|||||||
| Deferred income tax asset |
$ | — | $ | — | $ | — | ||||||
|
|
|
|
|
|
|
|||||||
The Company has non-capital losses of $96.48 million that expire between 2026 and 2030.
The provision for income taxes reflects an effective tax rate that differs from the results that would be obtained by applying the applicable statutory income tax rate in Canada, the Company’s country of domicile, which is explained as follows:
| December 31, 2011 |
December 31, 2010 |
December 31, 2009 |
||||||||||
| Combined Federal and Provincial/State corporate tax rate |
28.00 | % | 28.00 | % | 29.00 | % | ||||||
| Loss before income taxes |
$ | (3,229,648 | ) | $ | (11,999,673 | ) | $ | (19,516,145 | ) | |||
| Expected tax recovery |
(904,301 | ) | (3,359,908 | ) | (5,659,682 | ) | ||||||
| Add (deduct) income tax effect of: |
||||||||||||
| Adjustments to prior year tax calculations |
2,227,598 | (2,094,392 | ) | 1,181,836 | ||||||||
| Change in tax jurisdiction |
(221,656 | ) | — | 1,760,120 | ||||||||
| Difference in US & Canadian tax rates & Other |
(316,281 | ) | (1,115,923 | ) | (1,597,959 | ) | ||||||
| Prior Year Permanent Adjustment |
932,728 | — | — | |||||||||
| Change in fair value of warrants |
(660,682 | ) | (657,903 | ) | 1,021,828 | |||||||
| Change in research and development credits |
— | 252,451 | (217,316 | ) | ||||||||
| Change in valuation allowance |
(1,057,406 | ) | 7,362,447 | 3,743,997 | ||||||||
|
|
|
|
|
|
|
|||||||
| Current income tax expense |
$ | — | $ | 386,772 | $ | 232,824 | ||||||
|
|
|
|
|
|
|
|||||||
12 Commitments
The Company entered into operating lease arrangements for office space for the headquarters in Carpinteria, California and for a field office in Cody, Wyoming in February 2010. The future minimum lease payments by calendar year are as follows:
| Year |
Total | |||
| 2012 |
$ | 117,778 | ||
| 2013 |
27,630 | |||
| 2014 |
9,600 | |||
| 2015 and thereafter |
800 | |||
|
|
|
|||
| $ | 155,808 | |||
|
|
|
|||
25
Table of Contents
NiMin Energy Corp.
Notes to Consolidated Financial Statements
December 31, 2011, 2010 and 2009
The Company’s Senior Loan has a 12.5% fixed interest rate payable quarterly with a term of five years. The future interest payments by calendar year are as follows:
| Year |
Total | |||
| 2012 |
$ | 4,372,746 | ||
| 2013 |
3,739,007 | |||
| 2014 |
3,021,473 | |||
| 2015 |
1,171,233 | |||
|
|
|
|||
| $ | 12,304,459 | |||
|
|
|
|||
13 Financial Instruments
| a. | Fair Value |
The Company’s financial instruments consist of cash and cash equivalents, trade accounts receivable, restricted investments, warrants, short-term debt, and accounts payable and accrued liabilities. For all periods presented, the fair value of financial instruments approximated their carrying values due to their near term maturity, except for long-term debt where the fair value was determined using quoted borrowing rates and therefore was considered level 2, the fair value of the commodity derivative was obtained from BP and therefore was considered level 2, and warrants where the fair value was calculated using the Black-Scholes Model and therefore was considered level 3.
| b. | Credit Risk |
Credit risk is the risk of financial loss to the Company if a counterparty to a financial instrument fails to meet its contractual obligations, and arises principally from the Company’s receivables from joint venture partners and from petroleum and natural gas marketers.
The majority of the Company’s receivables are within the oil and gas industry, primarily from its industry partners. The receivables are not collateralized. To date, the Company has experienced minimal bad debts, and has no allowance for doubtful accounts. The majority of the Company’s cash and cash equivalents are held by two financial institutions, one in the U.S. and the other in Canada. As of December 31, 2011 and 2010 the accounts receivable balances are substantially all from the sale of oil and gas. All receivables are current and therefore, no provision was determined to be required.
Our hedging transactions expose us to risk of financial loss if a counterparty fails to perform under a contract. We use master agreements which allow us, in the event of default, to elect early termination of all contracts with the defaulting counterparty. If we choose to elect early termination, all asset and liability positions with the defaulting counterparty would be net settled at the time of election. We also monitor the creditworthiness of our counterparty on an ongoing basis. We are unable to predict sudden changes in a counterparty’s creditworthiness or ability to perform. Even if we do accurately predict sudden changes, our ability to negate the risk may be limited depending upon market conditions. If the creditworthiness of our counterparty, deteriorates and results in its nonperformance, we could incur a significant loss.
The adoption of derivatives legislation or regulations related to derivative contracts could have an adverse impact on our ability to hedge risks associated with our business. Recent legislation on certain transactions involving derivatives may affect the use of derivatives in hedging transactions.
26
Table of Contents
NiMin Energy Corp.
Notes to Consolidated Financial Statements
December 31, 2011, 2010 and 2009
Some of our customers may be experiencing, or may experience in the future, severe financial problems that have had or may have a significant impact on their creditworthiness. We cannot provide assurance that one or more of our customers will not default on their obligations to us or that such a default or defaults will not have a material adverse effect on our business, financial position, future results of operations, or future cash flows. Furthermore, the bankruptcy of one or more of our customers, or some other similar proceeding or liquidity constraint, might make it unlikely that we would be able to collect all or a significant portion of amounts owed by the distressed entity or entities. In addition, such events might force such customers to reduce or curtail their future use of our products and services, which could have a material adverse effect on our results of operations and financial condition.
During the year ended December 31, 2011, approximately 92% of the Company’s production was sold to two customers, Plains Marketing LP and Marathon Oil Company. However, the Company does not believe that the loss of a purchaser would materially affect the Company’s business because there are numerous purchasers in the area in which the Company sells its production. For the years ended December 31, 2011, 2010 and 2009, purchases by the following companies exceeded 10% of the total oil and gas revenues of the Company.
| For the year ended December 31, |
||||||||||||
| 2011 | 2010 | 2009 | ||||||||||
| Plains Marketing LP |
22.43 | % | 28.19 | % | 54.55 | % | ||||||
| Marathon Oil Company |
69.31 | % | 55.65 | % | 7.24 | % | ||||||
| c. | Liquidity Risk |
Liquidity risk includes the risk that, as a result of operational liquidity requirements there will not be sufficient funds to settle a transaction on the due date; the Company will be forced to sell financial assets at a value which is less than fair value; or the Company may be unable to settle or recover any part of a financial asset.
The Company’s operating cash requirements including amounts projected to complete our existing capital expenditure program are continuously monitored and adjusted as input variables change. These variables include but are not limited to, available bank lines, oil and natural gas production from existing wells, results from new wells drilled, commodity prices, cost overruns on capital projects and changes to government regulations relating to prices, taxes, royalties, land tenure, allowable production and availability of markets. As these variables change, liquidity risks may necessitate the need for the Company to conduct equity issues or obtain project debt financing. The Company also mitigates liquidity risk by maintaining an insurance program to minimize exposure to insurable losses.
The following are the contractual maturities of financial liabilities and associated interest payments as of December 31, 2011:
27
Table of Contents
NiMin Energy Corp.
Notes to Consolidated Financial Statements
December 31, 2011, 2010 and 2009
| Financial Liability |
< 1 Year | 1-2 Years | 2-5 Years | Thereafter | ||||||||||||
| Accounts payable |
$ | 3,751,660 | $ | — | $ | — | $ | — | ||||||||
| Accured liabilites |
1,253,855 | — | — | — | ||||||||||||
| Commodity derivative liability |
976,929 | — | — | — | ||||||||||||
| Long-term debt - principal |
4,050,000 | 12,150,000 | 19,800,000 | — | ||||||||||||
| Interest payable on long-term debt |
4,372,746 | 6,760,479 | 1,171,233 | — | ||||||||||||
| Options (i) |
— | 136,773 | — | — | ||||||||||||
| Warrants (ii) |
— | — | 235,134 | — | ||||||||||||
|
|
|
|
|
|
|
|
|
|||||||||
| Total |
$ | 14,405,190 | $ | 19,047,252 | $ | 21,206,367 | $ | — | ||||||||
|
|
|
|
|
|
|
|
|
|||||||||
| (i) | Based upon the expiration date of the underlying options |
| (ii) | Based upon the expiration date of the underlying warrants |
| d. | Derivatives |
Commodity price risk is the risk that the future cash flows will fluctuate as a result of changes in commodity prices. Commodity prices for petroleum and natural gas are impacted by world economic events that dictate the levels of supply and demand.
On April 1, 2009, the Company entered into a swap contract for the future sale of 3,000 barrels of NYMEX West Texas Intermediate (“NYMEX WTI”) crude oil per month at a fixed price of $56.85 per barrel to December 31, 2009. During the year ended December 31, 2009, the Company had realized losses of $300,778 on the settlement of the derivative financial contract.
In January of 2010, the Company entered into a derivative financial contract for 7,500 Bbls of NYMEX WTI crude oil production per month at a fixed rate of $85.10 per barrel until December 2012.
In December 2010, the Company entered into a derivative financial contract for 125 Bbls of oil per day for 2011 and 250 Bbls of oil per day for 2012 at a fixed rate of $90.40 per barrel.
In November 2011, the Company entered into a derivative financial contract for 100 Bbls of oil per day for 2012 at a fixed price of $96.75 per barrel.
At December 31, 2011, the Company recognized $976,929 million as a derivative liability on crude oil derivative contracts.
For the year ended December 31, 2011, the Company’s change in derivative contracts included a realized loss of $1.12 million and an unrealized gain of $365,109. For the year ended December 31, 2010, the Company’s change in derivative contracts included a realized gain of $501,255 and an unrealized loss of $1.21 million. For the year ended December 31, 2009, the Company’s change in derivative contracts included a realized gain of $300,778.
The derivative is recorded at fair value on the consolidated balance sheet. At December 31, 2010, the fair value is calculated based on the future NYMEX WTI prices of crude oil at December 31, 2011, for the remaining 12 months of the contract at credit adjusted present value. Fair value is based on level 2 inputs under the fair value hierarchy. As of December 31, 2011, if oil prices had been higher by $1.00 per Bbl with all other variables held constant, the net change in the fair value of the commodity derivative liability would have been higher by approximately $128,100.
28
Table of Contents
NiMin Energy Corp.
Notes to Consolidated Financial Statements
December 31, 2011, 2010 and 2009
14 Restricted Investments
At December 31, 2011, the Company holds $784,261 of restricted investments, held in bonds for the right to operate in the states of California and Wyoming.
15 Related Party Transactions
In 2009, the Company entered into a credit agreement with the PLC in which a director of the Company is the President of the PLC (see note 7). The transaction was recorded at the amount negotiated and agreed to by the two parties. On June 30, 2010, the Company paid in full the interest and principal outstanding on the short-term debt. For the periods ended December 31, 2010 and 2009, the Company recorded interest expense on this credit agreement of $4,074,709 and $221,008, respectively.
17 Subsequent Events
On January 24, 2012, the Board of Directors of the Company decided not to renew the employment contract of Dr. Sven Hagen, President, as a means to streamline management. Effective January 24, 2012, Dr. Hagen is no longer a director or officer of the Company and its subsidiaries. In connection therewith, the Company and Dr. Hagen entered into a Separation Agreement dated January 24, 2012 pursuant to which the Company has agreed to provide Dr. Hagen with the following severance benefits:
| • | Aggregate severance of $120,000, payable in equal monthly installments during 2012. |
| • | Monthly reimbursement of health and dental insurance premiums in the amount of $1,414 through September 15, 2012. |
| • | Accelerated vesting of 400,001 options, with an exercise price of CDN $1.25 that would have otherwise vested on September 4, 2012, and all vested options may be exercised on or before December 31, 2012. |
18 Quarterly Financial Information (Unaudited)
The Company’s quarterly financial information for fiscal 2011 and 2010 is as follows:
29
Table of Contents
NiMin Energy Corp.
Notes to Consolidated Financial Statements
December 31, 2011, 2010 and 2009
| Year Ended December 31, 2011 |
First Quarter |
Second Quarter |
Third Quarter |
Fourth Quarter |
||||||||||||
| Operating revenue |
$ | 5,232,273 | $ | 5,704,103 | $ | 6,465,744 | $ | 6,903,565 | ||||||||
| Operating income (loss) (i) |
(2,724,654 | ) | 1,943,132 | 2,444,002 | (1,077,561 | ) | ||||||||||
| Other income (expense) |
(5,752,559 | ) | 1,887,692 | 1,198,010 | (1,147,710 | ) | ||||||||||
| Net income (loss) |
(8,477,213 | ) | 3,830,824 | 3,642,012 | (2,225,271 | ) | ||||||||||
| Basic net income (loss) per share (ii) |
(0.13 | ) | 0.06 | 0.05 | (0.03 | ) | ||||||||||
| Diluted net income (loss) per share (ii) |
$ | (0.13 | ) | $ | 0.01 | $ | 0.05 | $ | (0.03 | ) | ||||||
| Year Ended December 31, 2010 |
First Quarter |
Second Quarter |
Third Quarter |
Fourth Quarter |
||||||||||||
| Operating revenue |
$ | 3,605,151 | $ | 3,240,558 | $ | 3,454,857 | $ | 3,728,632 | ||||||||
| Operating income (loss) |
(1,196,597 | ) | (583,849 | ) | (3,306,377 | ) | (1,788,215 | ) | ||||||||
| Other income (expense) |
975,484 | (1,875,617 | ) | (1,329,364 | ) | (2,895,138 | ) | |||||||||
| Net income (loss) |
(221,113 | ) | (2,459,466 | ) | (4,635,741 | ) | (5,070,125 | ) | ||||||||
| Basic and diluted net loss per share (ii) |
$ | (0.00 | ) | $ | (0.05 | ) | $ | (0.08 | ) | $ | (0.08 | ) | ||||
| (i) | During the fourth quarter of 2011, the Company divested its oil and gas properties located in the state of Louisiana. The operating income from divested properties during the fourth quarter of 2011 was $352,099. |
| (ii) | The sum of the individual quarterly net income per common share amounts may not agree with year-to-date net income per common share as each quarterly computation is based on the weighted-average number of common shares outstanding during that period. |
| 19 | Supplemental Crude Oil and Natural Gas Reserves and Standard Measure Information (Unaudited) |
The following reserves and future net revenue calculations in these financial statements have been determined in accordance with the SEC guidelines and the United States Financial Accounting Standards Board (the “U.S. Rules”).
In December 2009, the Company adopted revised oil and gas reserve estimation and disclosure requirements. The primary impact of the new disclosures is to conform the definition of proved reserves with “Modernization of Oil and Gas Reporting”, which was adopted by the SEC in December 2008. The rules revised the definition of proved oil and gas reserves to require that the average, first-day-of-the-month price during the 12-month period before the end of the year rather than the year-end price, must be used when estimating whether reserve quantities are economical to produce. This same 12-month average price is also used in calculating the aggregate amount of (and changes in) future cash inflows related to the standardized measure of discounted future net cash flows. All of the Company’s proved crude oil and natural gas reserves are located in the United States of America. The following table sets forth the Company’s net proved reserves, including changes therein, and proved developed reserves:
30
Table of Contents
NiMin Energy Corp.
Notes to Consolidated Financial Statements
December 31, 2011, 2010 and 2009
Proved Oil and Gas Reserves Quantities
| Crude Oil (Bbls) |
Natual Gas (MMcf) |
|||||||
| Total proved reserves |
||||||||
| December 31, 2008 |
2,604,546 | 2,547 | ||||||
| Extensions, discoveries and other additions |
41,113 | 60 | ||||||
| Revisions of previous estimates |
(554,260 | ) | (1,385 | ) | ||||
| Purchases of minerals in place (i) |
7,077,890 | — | ||||||
| Production |
(117,895 | ) | (318 | ) | ||||
|
|
|
|
|
|||||
| December 31, 2009 |
9,051,394 | 903 | ||||||
| Extensions, discoveries and other additions (ii) |
4,792,874 | 7 | ||||||
| Revisions of previous estimates |
— | (187 | ) | |||||
| Production |
(212,868 | ) | (208 | ) | ||||
|
|
|
|
|
|||||
| December 31, 2010 |
13,631,400 | 515 | ||||||
| Extensions, discoveries and other additions (iii) |
2,859,150 | — | ||||||
| Revisions of previous estimates |
(120,938 | ) | 18 | |||||
| Purchases (divestitures) of minerals in place |
(172,511 | ) | (515 | ) | ||||
| Production |
(274,496 | ) | (18 | ) | ||||
|
|
|
|
|
|||||
| December 31, 2011 |
15,922,605 | — | ||||||
| Proved developed reserves | ||||||||
| Proved developed producing |
3,430,815 | — | ||||||
| Proved developed non-producing |
951,825 | — | ||||||
|
|
|
|
|
|||||
| Total |
4,382,640 | — | ||||||
| Proved developed reserves | ||||||||
| As of December 31, 2009 |
1,846,759 | 824 | ||||||
| As of December 31, 2010 |
3,626,620 | 436 | ||||||
| As of December 31, 2011 |
4,382,640 | — | ||||||
| Proved undeveloped reserves (iv) | ||||||||
| As of December 31, 2009 |
7,204,635 | 79 | ||||||
| As of December 31, 2010 |
10,004,782 | 79 | ||||||
| As of December 31, 2011 |
11,539,965 | — | ||||||
| (i) | The increase in proved reserves for the year ended December 31, 2009 is due to the purchase of the Wyoming Assets. Of the total proved reserves 5,742,840 Bbls are related to proved undeveloped reserves and 1,335,050 Bbls are related to proved producing reserves. |
31
Table of Contents
NiMin Energy Corp.
Notes to Consolidated Financial Statements
December 31, 2011, 2010 and 2009
| (ii) | The increase in proved reserves for the year ended December 31, 2010, is due to conversion of probable reserves to proved reserves in Wyoming as a result of a successful 2010 development program and in California due to positive results from the Combined Miscible Drive Project at Pleito Creek. |
| (iii) | The increase in proved reserves for the year ended December 31, 2011, is due to the conversion of probable reserves to proved reserves in Wyoming as a result of the Company’s successful 2010 development program; and (ii) positive results from the CMD project in California. |
| (iv) | At December 31, 2011, approximately 72 percent of our total estimated proved reserves were undeveloped. Recovery of undeveloped reserves requires significant capital expenditures and successful drilling. Our reserve data assumes that we can and will make these expenditures and conduct these operations successfully. These assumptions, however, may not prove correct. The Company’s reserves at December 31, 2011, include estimates of total future development costs over the next five years associated with our proved undeveloped reserves of approximately $109.23 million. The Company’s ability to develop proved reserves is contingent upon our cash flow from operations and obtaining adequate financing. In addition, under the SEC’s reserve rules, because proved undeveloped reserves may be booked only if they relate to wells scheduled to be drilled within five years of the date of booking, we may be required to reclassify to probable any proved undeveloped reserves that are not developed within this five year timeframe. |
The Company has summarized the standardized measure of discounted future net cash flows related to its proved oil and natural gas reserves. The Company has based the following summary on a valuation of proved reserves using discounted cash flows based on a twelve month average of the first-day-of-the-month price’s, costs and economic conditions and a 10% discount rate for the years ended December 31, 2011, 2010 and 2009. The additions to proved reserves from purchase of reserves in place and new discoveries and extensions could vary significantly from year to year; additionally, the impact of changes to reflect current prices and costs of proved reserves in prior years could also be significant. Accordingly, investors should not view the information presented below as an estimate of the fair value of the Company’s oil and natural gas properties, nor should investors consider the information indicative of any trends. The prices of crude oil and natural gas used to estimate reserves in the table shown below were $84.75 per Bbl of oil and for the year ended December 31, 2011, $69.43 per Bbl of oil and $4.27 per Mcf of natural gas for the year ended December 31, 2010, and $51.38 per Bbl of oil and $4.07 per Mcf of natural gas for the year ended December 31, 2009. The bench mark oil and natural gas prices to which differentials were applied to arrive at the above average adjusted prices were based on WTI $96.19 per Bbl of oil for the year ended December 31, 2011, WTI $79.43 per Bbl of oil and Henry Hub $4.38 per Mcf of natural gas for the year ended December 31, 2010, and WTI $61.03 per Bbl of oil and Henry Hub $4.20 per Mcf of natural gas for the year ended December 31, 2009.
32
Table of Contents
NiMin Energy Corp.
Notes to Consolidated Financial Statements
December 31, 2011, 2010 and 2009
| Total | ||||
| ($000s) | ||||
| As of and for the year ended December 31, 2011 | ||||
| Future cash inflows |
1,349,499 | |||
| Future production costs |
(493,900 | ) | ||
| Future development costs |
(118,545 | ) | ||
| Future income tax expense |
(207,283 | ) | ||
|
|
|
|||
| Future net cash flows |
529,771 | |||
| 10% annual discount for estimated timing of cash flows |
(314,474 | ) | ||
|
|
|
|||
| Standardized measure of discounted future net cash flows related to proved reserves |
215,297 | |||
|
|
|
|||
| As of and for the year ended December 31, 2010 | ||||
| Future cash inflows |
947,258 | |||
| Future production costs |
(323,715 | ) | ||
| Future development costs |
(87,835 | ) | ||
| Future income tax expense |
(122,854 | ) | ||
|
|
|
|||
| Future net cash flows |
412,854 | |||
| 10% annual discount for estimated timing of cash flows |
(241,826 | ) | ||
|
|
|
|||
| Standardized measure of discounted future net cash flows related to proved reserves |
171,028 | |||
|
|
|
|||
| As of and for the year ended December 31, 2009 | ||||
| Future cash inflows |
468,758 | |||
| Future production costs |
(166,332 | ) | ||
| Future development costs |
(60,096 | ) | ||
| Future income tax expense |
— | |||
|
|
|
|||
| Future net cash flows |
242,330 | |||
| 10% annual discount for estimated timing of cash flows |
(143,388 | ) | ||
|
|
|
|||
| Standardized measure of discounted future net cash flows related to proved reserves |
98,942 | |||
|
|
|
|||
33
Table of Contents
NiMin Energy Corp.
Notes to Consolidated Financial Statements
December 31, 2011, 2010 and 2009
The following are the principal sources of changes in the standardized measure of discounted future net cash flows applicable to proved oil and natural gas reserves:
34
Table of Contents
NiMin Energy Corp.
Notes to Consolidated Financial Statements
December 31, 2011, 2010 and 2009
Changes in Standardized Measure of Discounted Future Net Cash Flows
| Total | ||||
| ($000s) | ||||
| Balance at December 31, 2008 |
19,437 | |||
|
|
|
|||
| Net change in sales and transfer prices and in production (lifting) costs related |
14,527 | |||
| Changes in future estimated development costs |
(28,058 | ) | ||
| Sales and transfers of oil and natural gas during the period |
(3,782 | ) | ||
| Net change due to extensions, discoveries and improved recovery |
(38,004 | ) | ||
| Net change due to purchases of minerals in place |
131,000 | |||
| Net change due to revisions in quantity estimates |
— | |||
| Previously estimated development costs incurred during the period |
1,836 | |||
| Accretion of discount |
1,986 | |||
| Other |
— | |||
| Net change in income taxes |
— | |||
|
|
|
|||
| Balance at December 31, 2009 |
98,942 | |||
|
|
|
|||
| Net change in sales and transfer prices and in production (lifting) costs related |
16,325 | |||
| Changes in future estimated development costs |
(33,329 | ) | ||
| Sales and transfers of oil and natural gas during the period |
(13,942 | ) | ||
| Net change due to extensions, discoveries and improved recovery |
132,614 | |||
| Net change due to purchases of minerals in place |
— | |||
| Net change due to revisions in quantity estimates |
(226 | ) | ||
| Previously estimated development costs incurred during the period |
10,613 | |||
| Accretion of discount |
12,383 | |||
| Other |
— | |||
| Net change in income taxes |
(52,352 | ) | ||
|
|
|
|||
| Balance at December 31, 2010 |
171,028 | |||
|
|
|
|||
| Net change in sales and transfer prices and in production (lifting) costs related |
26,656 | |||
| Changes in future estimated development costs |
(30,078 | ) | ||
| Sales and transfers of oil and natural gas during the period |
(12,740 | ) | ||
| Net change due to extensions, discoveries and improved recovery |
66,467 | |||
| Net change due to purchases of minerals in place |
— | |||
| Net change due to sales of minerals in place |
(20,131 | ) | ||
| Net change due to revisions in quantity estimates |
(2,382 | ) | ||
| Previously estimated development costs incurred during the period |
18,521 | |||
| Accretion of discount |
21,406 | |||
| Other |
(1,384 | ) | ||
| Net change in income taxes |
(22,066 | ) | ||
|
|
|
|||
| Balance at December 31, 2011 |
215,297 | |||
|
|
|
|||
35
Table of Contents
NiMin Energy Corp.
Notes to Consolidated Financial Statements
December 31, 2011, 2010 and 2009
Capitalized costs relating to oil and gas producing activities and related accumulated DD&A were as follows:
Capitalized Costs Relating to Oil and Gas Producing Activities
| United States | ||||
| As at December 31, 2011 |
||||
| Crude oil and natural gas properties |
||||
| Proved |
$ | 134,113,786 | ||
| Unproved |
468,042 | |||
|
|
|
|||
| Total crude oil and natural gas properties |
$ | 134,581,828 | ||
| Less accumulated depreciation and depletion |
(13,850,206 | ) | ||
| Less accumulated impairment |
(42,185,800 | ) | ||
|
|
|
|||
| Net crude oil and natural gas properties capitalized costs |
$ | 78,545,822 | ||
| As at December 31, 2010 |
||||
| Crude oil and natural gas properties |
||||
| Proved |
$ | 116,799,184 | ||
| Unproved |
476,986 | |||
|
|
|
|||
| Total crude oil and natural gas properties |
$ | 117,276,170 | ||
| Less accumulated depreciation and depletion |
(10,557,420 | ) | ||
| Less accumulated impairment |
(42,185,800 | ) | ||
|
|
|
|||
| Net crude oil and natural gas properties capitalized costs |
$ | 64,532,950 | ||
| As at December 31, 2009 |
||||
| Crude oil and natural gas properties |
||||
| Proved |
$ | 104,284,860 | ||
| Unproved |
1,516,621 | |||
|
|
|
|||
| Total crude oil and natural gas properties |
$ | 105,801,481 | ||
| Less accumulated depreciation and depletion |
(7,567,124 | ) | ||
| Less accumulated impairment |
(42,185,800 | ) | ||
|
|
|
|||
| Net crude oil and natural gas properties capitalized costs |
$ | 56,048,557 | ||
36
Table of Contents
NiMin Energy Corp.
Notes to Consolidated Financial Statements
December 31, 2011, 2010 and 2009
Costs incurred in crude oil and natural gas property acquisition, exploration and development are summarized as follows:
Capitalized Costs Incurred Relating to Oil and Gas Producing Activities
| United States | ||||
| As at December 31, 2011 |
||||
| Property acquisition cost |
||||
| Proved |
$ | 18,520,525 | ||
| Unproved |
— | |||
|
|
|
|||
| Total acquisition cost |
$ | 18,520,525 | ||
| As at December 31, 2010 |
||||
| Property acquisition cost |
||||
| Proved |
$ | 11,007,176 | ||
| Unproved |
227,636 | |||
|
|
|
|||
| Total acquisition cost |
$ | 11,234,812 | ||
| As at December 31, 2009 |
||||
| Property acquisition cost |
||||
| Proved |
$ | 37,915,683 | ||
| Unproved |
103,197 | |||
|
|
|
|||
| Total acquisition cost |
$ | 38,018,880 | ||
37