Attached files
SECURITIES AND EXCHANGE COMMISSION
Washington, D.C. 20549
FORM 10-K
| x | ANNUAL REPORT PURSUANT TO SECTION 13 OR 15(d) OF THE SECURITIES EXCHANGE ACT OF 1934 |
For the fiscal year ended December 31, 2011
Commission file number 1-3919
Keystone Consolidated Industries, Inc.
(Exact name of Registrant as specified in its charter)
| Delaware | 37-0364250 | |
| (State or other jurisdiction of Incorporation or organization) |
(IRS Employer Identification No.) |
| 5430 LBJ Freeway, Suite 1740, Three Lincoln Centre, Dallas, Texas |
75240-2697 | |
| (Address of principal executive offices) | (Zip Code) |
Registrant’s telephone number, including area code: (972) 458-0028
Securities registered pursuant to Section 12(b) of the Act: None.
| Securities registered pursuant to Section 12(g) of the Act: | Title of each class | |
| Common Stock, $.01 par value |
Indicate by check mark:
If the Registrant is a well-known seasoned issuer, as defined in Rule 405 of the Securities Act. Yes ¨ No x
If the Registrant is not required to file reports pursuant to Section 13 or Section 15(d) of the Act. Yes ¨ No x
Whether the Registrant (1) has filed all reports required to be filed by Section 13 or 15(d) of the Securities Exchange Act of 1934 during the preceding 12 months and (2) has been subject to such filing requirements for the past 90 days. Yes x No ¨
Whether the registrant has submitted electronically and posted on its corporate Web site, if any, every Interactive Data File required to be submitted and posted pursuant to Rule 405 of Regulation S-T during the preceding 12 months (or for such shorter period that the registrant was required to submit and post such files). Yes x No ¨
If disclosure of delinquent filers pursuant to Item 405 of Regulation S-K is not contained herein, and will not be contained, to the best of registrant’s knowledge, in definitive proxy or information statements incorporated by reference in Part III of this Form 10-K or any amendment to this Form 10-K. x
Whether the Registrant is a large accelerated filer, an accelerated filer, a non-accelerated filer or a smaller reporting company (as defined in Rule 12b-2 of the Act).
| Large accelerated filer |
¨ |
Accelerated filer |
¨ | |||
| Non-accelerated filer |
x |
Smaller reporting company |
¨ | |||
Whether the Registrant is a shell company (as defined in Rule 12b-2 of the Exchange Act). Yes ¨ No x
The aggregate market value of the 3.0 million shares of voting stock held by nonaffiliates of the Registrant, as of June 30, 2011 (the last business day of the Registrant’s most-recently completed second fiscal quarter), was approximately $26.0 million.
Whether the Registrant has filed all documents and reports required to be filed by Section 12, 13 or 15(d) of the Securities Exchange Act of 1934 subsequent to the distribution of securities under a plan confirmed by a court. Yes x No ¨
As of March 15, 2012, 12,101,932 shares of common stock were outstanding.
Documents incorporated by reference
The information required by Part III is incorporated by reference from the Registrant’s definitive proxy statement to be filed with the Commission pursuant to Regulation 14A not later than 120 days after the end of the fiscal year covered by this report.
PART I
This Annual Report contains forward-looking statements within the meaning of the Private Securities Litigation Reform Act of 1995. Statements in this Annual Report on Form 10-K that are not historical in nature are forward-looking and are not statements of fact. Some statements found in this report including, but not limited to, statements found in Item 1 – “Business”, Item 1A – “Risk Factors”, Item 3 – “Legal Proceedings”, Item 7 – “Management’s Discussion and Analysis of Financial Condition and Results of Operations” and Item 7A – “Quantitative and Qualitative Disclosures About Market Risk” are forward-looking statements that represent our beliefs and assumptions based on currently available information. In some cases you can identify these forward-looking statements by the use of words such as “believes”, “intends”, “may”, “should”, “could”, “anticipates”, “expected” or comparable terminology, or by discussions of strategies or trends. Although we believe the expectations reflected in forward-looking statements are reasonable, we do not know if these expectations will be correct. Forward-looking statements by their nature involve substantial risks and uncertainties that could significantly impact expected results. Actual future results could differ materially from those predicted. While it is not possible to identify all factors, we continue to face many risks and uncertainties. Among the factors that could cause our actual future results to differ materially from those described herein are the risks and uncertainties discussed in this Annual Report and those described from time to time in our other filings with the Securities and Exchange Commission (“SEC”) including, but not limited to, the following:
| • | Future supply and demand for our products (including cyclicality thereof), |
| • | Customer inventory levels, |
| • | Changes in raw material and other operating costs (such as ferrous scrap and energy), |
| • | Availability of raw materials, |
| • | The possibility of labor disruptions, |
| • | General global economic and political conditions, |
| • | Competitive products (including low-priced imports) and substitute products, |
| • | Customer and competitor strategies, |
| • | The impact of pricing and production decisions, |
| • | Environmental matters (such as those requiring emission and discharge standards for existing and new facilities), |
| • | Government regulations and possible changes thereof, |
| • | Significant increases in the cost of providing medical coverage to employees, |
| • | The ultimate resolution of pending litigation and U.S. Environmental Protection Agency (“U.S. EPA”) investigations, |
| • | International trade policies of the United States and certain foreign countries, |
| • | Operating interruptions (including, but not limited to, labor disputes, fires, explosions, unscheduled or unplanned downtime, supply disruptions and transportation interruptions), |
| • | Our ability to renew or refinance credit facilities, |
| • | The ability of our customers to obtain adequate credit, and |
| • | Any possible future litigation. |
-2-
Should one or more of these risks materialize, if the consequences worsen, or if the underlying assumptions prove incorrect, actual results could differ materially from those forecasted or expected. We disclaim any intention or obligation to update or revise any forward-looking statement whether as a result of changes in information, future events or otherwise.
| ITEM 1. | BUSINESS. |
Keystone Consolidated Industries, Inc. (“KCI”) is a leading domestic producer of steel fabricated wire products, industrial wire and wire rod. We also manufacture wire mesh, coiled rebar, steel bar and other products. Our products are used in the agricultural, industrial, cold drawn, construction, transportation, original equipment manufacturer and retail consumer markets. We are vertically integrated, converting substantially all of our products from billet produced in our steel mini-mill. Historically, our vertical integration has allowed us to benefit from the higher and more stable margins associated with fabricated wire products and wire mesh as compared to wire rod, as well as from lower costs of billet and wire rod as compared to bar manufacturers and wire fabricators that purchase billet and wire rod in the open market. Moreover, we believe our downstream fabricated wire products, wire mesh, coiled rebar and industrial wire businesses are better insulated from the effects of wire rod imports as compared to non-integrated wire rod producers.
Our operating segments are organized by our manufacturing facilities and include three reportable segments:
| • | Keystone Steel & Wire (“KSW”), located in Peoria, Illinois, operates an electric arc furnace mini-mill, rod mill, industrial wire mill and wire product fabrication facilities and manufactures and sells wire rod, coiled rebar, industrial wire, fabricated wire and other products to agricultural, industrial, construction, commercial, original equipment manufacturers and retail consumer markets; |
| • | Engineered Wire Products, Inc. (“EWP”), located in Upper Sandusky, Ohio, primarily manufactures and sells wire mesh in both roll and sheet form that is utilized as reinforcement in concrete construction products including pipe, pre-cast boxes and applications for use in roadways, buildings and bridges; and |
| • | Keystone-Calumet, Inc. (“Calumet”), located in Chicago Heights, Illinois, manufactures and sells merchant and special bar quality products and special sections in carbon and alloy steel grades for use in agricultural, cold drawn, construction, industrial chain, service centers and transportation applications as well as in the production of a wide variety of products by original equipment manufacturers. |
Calumet’s primary raw material is billet and EWP’s primary raw material is wire rod. Both Calumet and EWP source the majority of their primary raw material requirements from KSW.
For additional information about our segments see “Part II – Item 7. Management’s Discussion and Analysis of Financial Condition and Results of Operations” and Note 2 to our Consolidated Financial Statements.
-3-
We are the successor to Keystone Steel & Wire Company, which was founded in 1889. At December 31, 2011, Contran Corporation owned approximately 88% of our outstanding common stock. Substantially all of Contran’s outstanding voting stock is held by trusts established for the benefit of certain children and grandchildren of Harold C. Simmons (for which Mr. Simmons is the sole trustee) or is held directly by Mr. Simmons or other persons or companies related to Mr. Simmons. Consequently, Mr. Simmons may be deemed to control Contran and us.
Unless otherwise indicated, references in this report to “we”, “us” or “our” refer to KCI and its subsidiaries, taken as a whole.
Manufacturing
Overview
Our manufacturing operations consist of an electric arc furnace mini-mill, a rod mill, a wire mill, an industrial wire mill and three steel product fabrication facilities as outlined in our segment discussion above. The manufacturing process commences at KSW where ferrous scrap is melted in an electric arc furnace, converted into molten steel and then transferred to a ladle refining furnace where chemistries and temperatures are monitored and adjusted to specifications prior to casting. The molten steel is transferred from the ladle refining furnace into a six-strand continuous casting machine which produces five-inch square strands, referred to as billets, that are cut to predetermined lengths. These billets are then either transferred to the adjoining rod mill, shipped to Calumet for the production of steel bars or sometimes sold to third party customers.
Upon entering the rod mill, the billets are brought to rolling temperature in a reheat furnace and are fed through the rolling mill, where they are rolled into either wire rod or coiled rebar in a variety of diameters, surface characteristics and specifications. After rolling, the wire rod or rebar is coiled and cooled. After cooling, the coiled wire rod or rebar passes through inspection stations for metallurgical, surface and diameter checks. Finished coils are compacted and tied. Coiled rebar is shipped to customers and wire rod is either further processed into industrial wire and fabricated wire products at KSW, shipped to EWP for the production of wire mesh and industrial wire, or shipped to wire rod customers.
While we do not maintain a significant “shelf” inventory of finished wire rod, we generally have on hand approximately a one-month supply of industrial wire, wire mesh, coiled rebar, fabricated wire products and steel bars inventory which enables us to fill customer orders and respond to shifts in product demand.
Raw Materials and Energy
The primary raw material used in our operations is ferrous scrap. Our steel mill is located close to numerous sources of high density automobile, industrial and railroad ferrous scrap. Currently all of these sources are readily available and we believe they will continue to be available for the foreseeable future. We believe we are one of the largest recyclers of ferrous scrap in Illinois. The purchase of ferrous scrap is highly competitive and its price volatility is influenced by periodic shortages, export activity, freight
-4-
costs, weather and other conditions beyond our control. The cost of ferrous scrap can fluctuate significantly and product selling prices cannot always be adjusted, especially in the short-term, to recover the costs of increases in ferrous scrap prices. We have not entered into any hedging programs or long-term contracts for the purchase or supply of ferrous scrap; therefore, we are subject to the price fluctuation of ferrous scrap.
Our manufacturing processes consume large amounts of energy in the form of electricity and natural gas. Electricity in Illinois is not regulated. KSW and Calumet have energy service agreements whereby, on a daily basis for electricity and on a monthly basis for natural gas, we are required to notify the utility providers of the amount of energy we expect to consume on the next day or over the next month, respectively. The price we pay for energy is determined when we provide such notification based on the next day’s forecasted hourly market rate for electricity or the next month’s forecasted hourly market rate for gas. All other tariff, transmission and utility charges are passed through at cost and the supplier adds a per energy unit charge for administration and margin. Any difference between our forecasted consumption and actual consumption is billed or credited to our account based on the actual hourly market rate. However, to provide us an opportunity to avoid pricing fluctuations, the contracts allow us, at our discretion, to purchase blocks of energy for future usage at prices negotiated at the time of purchase. We could sell any unused quantities under such contracts at market rates such that our only exposure on fixed price quantities is the difference between the contracted price and the market price.
The power supply at our KSW facility is interruptible and we agreed to a minimum interruption period of 4 hours per occurrence and at least 5 or more interruption events during the summer season. We would be compensated for each interruption based on market rates and the difference between our forecasted and actual consumption for the interruption period. We incurred no such interruptions during 2009, 2010 or 2011.
Employment
As of December 31, 2011, we employed 1,024 people as follows:
| • | 6 at our corporate office; |
| • | 847 at KSW, of which 678 are represented by the Independent Steel Workers’ Alliance (the “ISWA”) under an agreement expiring in May 2012 (we are currently scheduled to begin negotiating a new contract in late March 2012); |
| • | 84 at EWP, of which 62 are represented by Local Union #40, an Affiliate to the International Brotherhood of Teamsters’ Chauffeurs Warehousemen and Helpers of America (the “Teamsters”), under an agreement expiring in November 2014; and |
| • | 87 at Calumet. Although the workforce at Calumet is not currently represented by a labor union, under the terms of an agreement with the United Steel, Paper and Forestry, Rubber, Manufacturing, Energy, Allied Industrial and Service Workers International Union (USA) AFL-CIO, CLC (the “USW”), the hourly workforce is scheduled to vote on whether to be represented by the USW in late March 2012. |
We believe our labor relations are good.
-5-
Products, Markets and Distribution
The following table sets forth certain information with respect to our product mix in each of the last three years.
| Years Ended December 31, | ||||||||||||||||||||||||
| 2009 | 2010 | 2011 | ||||||||||||||||||||||
| Product |
Percent of Tons Shipped |
Percent of Sales |
Percent of Tons Shipped |
Percent of Sales |
Percent of Tons Shipped |
Percent of Sales |
||||||||||||||||||
| Wire rod |
60.8 | % | 46.0 | % | 63.8 | % | 52.6 | % | 63.0 | % | 54.1 | % | ||||||||||||
| Fabricated wire products |
15.6 | 28.2 | 12.2 | 20.8 | 12.0 | 18.4 | ||||||||||||||||||
| Industrial wire |
8.2 | 9.6 | 8.8 | 10.7 | 9.2 | 10.8 | ||||||||||||||||||
| Wire mesh |
9.7 | 11.7 | 7.9 | 9.3 | 8.2 | 9.6 | ||||||||||||||||||
| Bar |
3.2 | 3.3 | 4.0 | 4.8 | 4.2 | 5.0 | ||||||||||||||||||
| Coiled rebar |
1.2 | 0.8 | 1.2 | 1.0 | 1.6 | 1.3 | ||||||||||||||||||
| Other |
1.3 | 0.4 | 2.1 | 0.8 | 1.8 | 0.8 | ||||||||||||||||||
|
|
|
|
|
|
|
|
|
|
|
|
|
|||||||||||||
| 100.0 | % | 100.0 | % | 100.0 | % | 100.0 | % | 100.0 | % | 100.0 | % | |||||||||||||
|
|
|
|
|
|
|
|
|
|
|
|
|
|||||||||||||
Wire Rod. We produce primarily low carbon wire rod and some higher carbon wire rod at KSW’s rod mill. Low carbon wire rod, with carbon content of up to 0.38%, is more easily shaped and formed than higher carbon wire rod and is suitable for a variety of applications where ease of forming/manipulation is a primary consideration. High carbon wire rod, with carbon content above 0.38%, is used in applications where strength is a primary consideration. KSW’s high carbon wire rod business represented 16% of its wire rod sales during 2011, and we expect our high carbon business to continue to grow during 2012 in order to meet the developing U.S. demand for high carbon steel. During 2011, we used approximately 33% of the wire rod we manufactured to produce our industrial wire, wire mesh and fabricated wire products. The remainder of our wire rod production was sold directly to producers of construction products, fabricated wire products and industrial wire, including products similar to those we manufacture.
Fabricated Wire Products. KSW is one of the leading U.S. manufacturers of agricultural fencing, barbed wire, stockade panels and a variety of woven wire, fabric and netting for agricultural and industrial applications. We sell these products to agricultural, industrial, consumer do-it-yourself and other end-user markets, which we believe are less cyclical than many steel consuming end-use markets such as the automotive, construction, appliance and machinery manufacturing industries. We serve these markets through distributors, agricultural retailers, building supply centers and consumer do-it-yourself chains such as Tractor Supply Co. and Lowe’s Companies, Inc. We believe our ability to service these customers with a wide range of fabricated wire products through multiple distribution locations provides a competitive advantage. As part of our marketing strategy, we provide category management recommendations based on a data collection and analysis tool we created and we also design merchandise packaging and supportive product literature for marketing many of these products to the retail consumer market.
KSW also manufactures products for residential and commercial construction, including rebar ty wire and stucco netting. The primary customers for these products are construction contractors and building materials manufacturers and distributors.
-6-
We believe our fabricated wire products are less susceptible to selling price changes caused by the cyclical nature of the steel industry than industrial wire, coiled rebar or wire rod because the commodity-priced raw materials used in these products, such as ferrous scrap, represent a lower percentage of the total cost of these value-added products.
Industrial Wire. KSW is one of the largest manufacturers of industrial wire in the United States. We also produce small quantities of industrial wire at EWP. We produce custom-drawn industrial wire in a variety of gauges, finishes and packages for further consumption by our fabricated wire products operations or for sale direct to industrial fabrication and original equipment manufacturer customers, who are generally not our competitors. Our industrial wire is used by customers in the production of a broad range of finished goods, including nails, coat hangers, barbecue grills, air conditioners, tools, containers, refrigerators and other appliances.
Wire mesh. EWP manufactures a wide variety of wire mesh rolls and sheets used to form wire reinforcement in concrete construction projects such as pipe, precast boxes, roadways, buildings and bridges. Our wire mesh customers include pipe manufacturers, culvert manufacturers, rebar fabricators and steel reinforcing distributors. Like our fabricated wire products, we believe our wire mesh products are also less susceptible to selling price changes caused by the cyclical nature of the steel industry than industrial wire, coiled rebar or wire rod because the commodity-priced raw materials used in these products, such as ferrous scrap, represent a lower percentage of the total cost of such value-added products.
Bar. Calumet manufactures merchant and special bar quality products and custom sections in carbon and alloy steel grades, offering a broad range of value-added products for use in agricultural, cold drawn, construction, industrial chain, service centers and transportation applications as well as in the production of a wide variety of products by original equipment manufacturers. Calumet’s product line consists primarily of angles, flats, channels, rounds, squares and other related products.
Coiled Rebar. We produce several sizes of coiled rebar at KSW’s rod mill. The coils are typically used by fabricators who will process the material as straightened and cut-to-length bars or fabricated shapes for specific reinforcement applications such as building and road construction.
Trademarks
Many of our fencing and related fabricated wire products are marketed under our RedBrand® label, a widely recognized brand name in the agricultural fencing and construction marketplaces for more than 85 years. RedBrand sales represented approximately 76% of our fabricated wire products net sales in 2011. We also maintain other trademarks for various products that are promoted in their respective markets.
-7-
Customers
Our customers are primarily located in the Midwestern, Southwestern and Southeastern regions of the United States. Our customers vary considerably by product. We believe our ability to offer a broad range of products represents a competitive advantage in servicing the diverse needs of our customers.
Our segments are not dependent upon a single customer or a few customers, and the loss of any one, or a few, would not have a material adverse effect on our business. No single customer represented 10% or more of our consolidated sales during 2011.
Seasonality
Historically, we have experienced greater sales and profits during the second and third quarters of each year due to the seasonality of sales in principal fabricated wire products and wire mesh markets, including the agricultural and construction markets.
Backlog
Our backlog of unfilled, cancelable customer orders approximated $62.3 million and $84.2 million at December 31, 2010 and 2011, respectively. We do not believe backlog is a significant factor in our business, and we expect all of the backlog at December 31, 2011 will be shipped during 2012.
Industry and Competition
The fabricated wire products, wire mesh, industrial wire, bar, coiled rebar and wire rod businesses in the United States are highly competitive and are comprised primarily of several large mini-mill wire rod producers, many small independent wire companies and a few large diversified wire producers. We also face significant foreign competition. Primarily due to competitive advantages associated with lower wage rates, less regulatory requirements and other cost discrepancies, our competitors will sometimes price their products at levels which result in market prices that significantly reduce or even eliminate the profitability of certain of our products. Despite such competitive disadvantages, we believe we are well positioned to compete effectively due to:
| • | the breadth of our fabricated wire products, wire mesh, industrial wire and bar offerings; |
| • | our ability to service diverse geographic and product markets; |
| • | the relatively low cost of our internal supply of billet and wire rod; and |
| • | our reputation for superior product quality. |
We believe our facilities are well located to serve the Midwestern, Southwestern and Southeastern regions of the United States. Close proximity to our customer base provides us with certain advantages over foreign and certain domestic competition including reduced shipping costs, improved customer service and shortened delivery times.
Wire Rod. Since wire rod is a commodity steel product, we believe the wire rod market is more competitive than the fabricated wire products and industrial wire markets, and price is the primary competitive factor. Among our
-8-
principal domestic competitors in these markets are Gerdau Ameristeel and Rocky Mountain Steel. We also face significant foreign competition. The domestic steel industry continues to experience consolidation. During the last ten years, we and the majority of our major domestic competitors have either filed for protection under Federal bankruptcy laws and discontinued operations, were acquired, or reduced or completely shut-down operations. We believe these shut-downs or production curtailments represent a significant decrease in estimated domestic annual capacity. However, worldwide overcapacity in the steel industry continues to exist and imports of wire rod have become much more substantial in recent years.
Fabricated Wire Products and Industrial Wire. Our principal competitors in the fabricated wire products and industrial wire markets are Bekaert, Leggett & Platt, Deacero, Oklahoma Steel and Wire and Davis Wire. Competition in the fabricated wire products and industrial wire markets is based on a variety of factors, including distribution channels, price, delivery performance, product quality, service and brand name preference. Our RedBrand label has been a widely recognized brand name in the agricultural fencing and construction marketplaces for more than 85 years. Additionally, we believe higher transportation costs and the lack of local distribution centers tend to limit foreign producers’ penetration into our principal fabricated wire products and industrial wire markets, but we do not know if this will continue to be the case.
Wire mesh. Our principal competitor in our wire mesh markets is Insteel Industries, Inc. We also face competition from smaller regional manufacturers and wholesalers of wire mesh products. We believe EWP’s superior products and renowned customer service distinguish EWP from its competitors. In addition, we believe our vertical integration enhances EWP’s ability to compete more effectively in the market as EWP can rely on a stable supply of wire rod. Competitors of EWP have, at times, faced raw material shortages that have negatively impacted their daily production capability and delivery reliability.
Bar. Our principal competitors in our bar business include Gerdau Ameristeel, Nucor Corporation and Alton Steel. The primary competitive factors are delivered price and the breadth of product within the production capability of the mill. Calumet frequently conducts trials for different customer-specific products which usually results in new customers and increased sales volume. Calumet’s mill location in Chicago Heights, Illinois is well suited to serve the bar market in the upper Midwest.
Coiled Rebar. The principal competitors for our assortment of coiled rebar products include Gerdau Ameristeel, Rocky Mountain Steel and Nucor Steel Connecticut, Inc. The primary competitive factors of the coiled rebar business are delivered price, coil size and product quality. Due to our location, we believe we can effectively serve customers in the Midwestern region of the United States.
Environmental Matters
Our production facilities are affected by a variety of environmental laws and regulations, including laws governing the discharge of water pollutants and air contaminants, the generation, containment, transportation, storage, treatment and disposal of solid wastes and hazardous substances and the
-9-
handling of toxic substances, including certain substances used in, or generated by, our manufacturing operations. Many of these laws and regulations require permits to operate the facilities to which they pertain. Denial, revocation, suspension, delay in modification or expiration of such permits could impair the ability of the affected facility to continue operations.
We record liabilities related to environmental issues when information becomes available and is sufficient to support a reasonable estimate of a range of probable loss. If we are unable to determine that a single amount in an estimated range is more likely, the minimum amount of the range is recorded. At December 31, 2011, the upper end of the range of reasonably possible costs to us for sites where we have been named a defendant is approximately $2.1 million, including our recorded accrual of $.4 million.
We believe our current operating facilities are in material compliance with all presently applicable federal, state and local laws regulating the discharge of materials into the environment, or otherwise relating to the protection of the environment. Environmental legislation and regulations change rapidly and we may be subject to increasingly stringent environmental standards in the future.
Information in Note 7 to our Consolidated Financial Statements is incorporated herein by reference.
Financing and Other Activities
We routinely compare our liquidity requirements against our estimated future cash flows. As a result of this process, we have in the past and may in the future seek to raise additional capital, refinance or restructure indebtedness, consider the sale of interests in subsidiaries, business units or other assets, or take a combination of such steps or other steps, to increase liquidity, reduce indebtedness and fund future activities. Such activities have in the past and may in the future involve related companies. From time to time, we and related entities also evaluate the restructuring of ownership interests among our subsidiaries and related companies and expect to continue this activity in the future and may in connection with such activities, consider issuing additional equity securities and increasing our indebtedness.
On August 31, 2005 we emerged from Chapter 11 proceedings that began in 2004. During 2007, the final pending claims of our bankruptcy were settled or fully adjudicated. However, at that time, an amendment to one of our postretirement benefit plans was in negotiation. Upon finalization of that amendment in 2008, we sought final closure of our bankruptcy case and on September 11, 2008, the United States Bankruptcy Court for the Eastern District of Wisconsin issued our final decree.
Availability of Company Reports Filed with the SEC
Our fiscal year is 52 or 53 weeks and ends on the Sunday closest to December 31 of each year. We furnish our stockholders with annual reports containing audited financial statements. In addition, we file annual, quarterly and current reports, proxy and information statements and other information with the SEC. We also make our annual report on Form 10-K, quarterly reports on Form 10-Q, current reports on Form 8-K and amendments
-10-
thereto, available free of charge through our website at www.keystoneconsolidated.com as soon as reasonably practical after they have been filed with the SEC. We also provide to anyone, without charge, copies of such documents upon written request. Requests should be directed to the attention of the Corporate Secretary at our address on the cover page of this Form 10-K.
The general public may read and copy any materials we file with the SEC at the SEC’s Public Reference Room at 100 F Street, NE, Washington, DC 20549. The public may obtain information on the operation of the Public Reference Room by calling the SEC at 1-800-SEC-0330. We are an electronic filer. The SEC maintains an Internet website at www.sec.gov that contains reports, proxy and information statements and other information regarding issuers that file electronically with the SEC, including us.
| ITEM 1A. | RISK FACTORS. |
Listed below are certain risk factors associated with our businesses. In addition to the potential effect of these risk factors discussed below, any risk factor which could result in reduced earnings or operating losses, or reduced liquidity, could in turn adversely affect our ability to service our liabilities or adversely affect the quoted market prices for our publicly-traded securities.
Our leverage may impair our financial condition or limit our ability to operate our businesses.
We fund our operations primarily through cash from operations and borrowings on our revolving credit facility. Our revolving credit facility requires us to use our daily cash receipts to reduce outstanding borrowings, which results in us maintaining zero cash balances when there are balances outstanding under the credit facility. The amount of available borrowings under our revolving credit facility is based on formula-determined amounts of trade receivables and inventories.
Our revolving credit facility requires us to maintain a minimum fixed charge coverage ratio, defined in the agreement as earnings before interest, taxes, depreciation, amortization, restructuring costs, pension and OPEB expense or credits, less OPEB payments, divided by the sum of interest expense, tax payments, principal payments on certain debt and certain capital expenditures, of 1.0 if excess availability falls below $10.0 million. At December 31, 2011 excess availability was $30.9 million and our fixed charge coverage ratio was 1.5. Current forecasts indicate that we will be able to maintain excess availability of at least $10.0 million and a fixed charge coverage ratio of at least 1.0 throughout 2012. However, if future operating results differ materially from our predictions and excess availability falls below $10.0 million, we could violate our fixed charge coverage ratio requirement if the fixed charge coverage ratio at such time is less than 1.0. The credit facility is collateralized by substantially all of our operating assets and failure to comply with the covenants contained in the credit facility could result in the acceleration of the outstanding balance under the facility prior to its stated maturity date. Additionally, our lender can restrict our ability to incur additional secured indebtedness and can declare a default under the credit facility in the event of, among other things, a material adverse change in our business. In the event of an uncured default of our credit
-11-
facility agreement, we would seek to refinance the facility with a new group of lenders or, if required, we will use other existing liquidity resources (which could include funds provided by our affiliates). However, there is no assurance such financing could be obtained, or if obtained it would not be on terms that would result in higher costs to us (such as a higher interest rate on outstanding borrowings). If we were unable to obtain such financing, our liquidity could be negatively affected.
Our dependence on borrowing availability from our revolving credit facility could have important consequences to our stockholders and creditors, including:
| • | making it more difficult for us to satisfy our obligations with respect to our liabilities; |
| • | increasing our vulnerability to adverse general economic and industry conditions; |
| • | requiring a portion of our cash flow from operations be used for the payment of interest on our debt, therefore reducing our ability to use our cash flow to fund working capital, capital expenditures, acquisitions and general corporate requirements; |
| • | limiting our ability to obtain additional financing to fund future working capital, capital expenditures, acquisitions and general corporate requirements; |
| • | limiting our flexibility in planning for, or reacting to, changes in our business, regulatory requirements and the industry in which we operate; and |
| • | placing us at a competitive disadvantage relative to other less-leveraged competitors. |
Demand for, and prices of, certain of our products are cyclical which may result in reduced earnings or operating losses.
A significant portion of our revenues are attributable to sales of products into the agricultural and construction industries. These two industries themselves are cyclical and changes in those industries’ economic conditions can significantly impact our earnings and operating cash flows. Our operating results and our business and financial condition could be adversely affected by, among other things, economic conditions, availability of credit to fund agricultural and construction projects, short and long-term weather patterns, interest rates and embargos placed by foreign countries on U.S. agricultural products.
Many of EWP’s products are ultimately used in infrastructure projects by local, state or federal governments.
Such projects are impacted by the availability of governmental funding for such projects. A decline in the availability of governmental funds for such projects could ultimately result in a decline in demand or selling prices of EWP’s products. Such a decline could result in reduced earnings or operating losses.
-12-
We sell the majority of our products in mature and highly competitive industries and face price pressures in the markets in which we operate, which may result in reduced earnings or operating losses.
The markets in which we operate our businesses are highly competitive. Competition is based on a number of factors, such as price, product quality, delivery times and service. Some of our competitors may be able to drive down prices for our products because the competitors’ costs are lower than our costs. In addition, some of our competitors’ financial, technological and other resources may be greater than our resources, and such competitors may be better able to withstand negative changes in market conditions. Our competitors may be able to respond more quickly than we can to new or emerging technologies and changes in customer requirements. Further, consolidation of our competitors or customers in any of the industries in which we compete may result in reduced demand for our products. Additionally, in some of our businesses new competitors could emerge by modifying their existing production facilities so they could manufacture products that compete with our products. The occurrence of any of these events could result in reduced earnings or operating losses.
Global producers of wire rod are able to import their products into the U.S. with minimal tariffs and duties.
Many of these global wire rod producers are able to produce wire rod at costs lower than we incur in our production. As such, these wire rod imports are often priced at lower levels than similar products manufactured by us. In addition, we believe certain foreign governments subsidize their local wire rod producers. These factors can adversely impact our sales levels and pricing decisions and, as such, could result in reduced earnings or operating losses.
Higher costs or limited availability of ferrous scrap may decrease our liquidity.
The cost of ferrous scrap, our primary raw material, can fluctuate significantly and our product selling prices cannot always be adjusted, especially in the short-term, to recover the costs of increases in ferrous scrap prices. Additionally, should our local suppliers not be able to procure sufficient levels of ferrous scrap, we may incur higher costs for ferrous scrap.
Climate change legislation could negatively impact our financial results or limit our ability to operate our businesses.
We believe all of our production facilities are in substantial compliance with applicable environmental laws. Proposed legislation is being considered to limit green house gases through various means, including emissions permits and/or energy taxes. Our production facilities consume large amounts of energy, including electricity and natural gas. To date the permit system in effect has not had a material adverse effect on our financial results. However, future green house gas legislation could negatively impact our future results from operations through increased costs of production, particularly as it relates to our energy requirements. If such increased costs of production were to materialize, we may be unable to pass price increases on to our customers to compensate for increased production costs, which may decrease our liquidity, operating income and results of operations.
-13-
| ITEM 1B. | UNRESOLVED STAFF COMMENTS. |
None.
-14-
| ITEM 2. | PROPERTIES. |
Our principal executive offices are located in leased space at 5430 LBJ Freeway, Suite 1740, Dallas, Texas 75240-2697.
Our production facilities utilize approximately 2.3 million square feet for manufacturing, approximately 85% of which is located at our Peoria, Illinois facility.
The following table sets forth the location, size and primary product types produced for each of our manufacturing facilities as of December 31, 2011, all of which are owned by us:
| Facility Name |
Location |
Approximate Size (Square Feet) |
Primary Products Produced for External Sales | |||||
| Keystone Steel & Wire |
Peoria, IL | 1,951,000 | Fabricated wire products, industrial wire and wire rod | |||||
| Engineered Wire Products |
Upper Sandusky, OH | 126,000 | Wire mesh | |||||
| Keystone-Calumet |
Chicago Heights, IL | 216,000 | Steel bar | |||||
|
|
|
|||||||
| 2,293,000 | ||||||||
|
|
|
|||||||
We believe all of our facilities are adequately maintained and are satisfactory for their intended purposes.
| ITEM 3. | LEGAL PROCEEDINGS. |
We are also involved in various legal proceedings. Information required by this Item is included in Note 7 to our Consolidated Financial Statements, which information is incorporated herein by reference.
| ITEM 4. | MINE SAFETY DISCLOSURES. |
Not applicable.
-15-
PART II
| ITEM 5. | MARKET FOR REGISTRANT’S COMMON EQUITY AND RELATED STOCKHOLDER MATTERS. |
Our common stock trades on the OTC Market’s OTCQB (Symbol: KYCN).
As of March 6, 2012, we had approximately 1,116 holders of record of our common stock at a closing price of $6.16. The following table sets forth the high and low closing per share sales prices for our common stock for the periods indicated:
| High | Low | |||||||
| Year ended December 31, 2010 |
||||||||
| First quarter |
$ | 5.50 | $ | 4.00 | ||||
| Second quarter |
$ | 5.97 | $ | 4.65 | ||||
| Third quarter |
$ | 6.05 | $ | 4.55 | ||||
| Fourth quarter |
$ | 5.75 | $ | 4.55 | ||||
| Year ended December 31, 2011 |
||||||||
| First quarter |
$ | 9.19 | $ | 4.70 | ||||
| Second quarter |
$ | 9.05 | $ | 6.95 | ||||
| Third quarter |
$ | 10.89 | $ | 7.20 | ||||
| Fourth quarter |
$ | 8.00 | $ | 6.66 | ||||
| First quarter 2012 through March 6, 2012 |
$ | 7.95 | $ | 6.16 | ||||
Historically, we have not paid cash dividends on our common stock as we have chosen to retain all earnings to fund working capital requirements, capital expenditures and scheduled debt repayments.
-16-
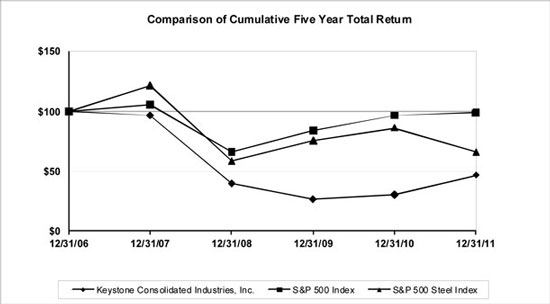
Performance Graph—Set forth below is a line graph comparing the change in our cumulative total stockholder return on our common stock against the cumulative total return of the S&P 500 Index and the S&P 500 Steel Index for the period from December 31, 2006 through December 31, 2011. The graph shows the value at December 31 of each year assuming an original investment of $100 at December 31, 2006.
| December 31, | ||||||||||||||||||||||||
| 2006 | 2007 | 2008 | 2009 | 2010 | 2011 | |||||||||||||||||||
| Keystone common stock |
$ | 100 | $ | 97 | $ | 40 | $ | 27 | $ | 30 | $ | 47 | ||||||||||||
| S&P 500 Index |
100 | 105 | 66 | 84 | 97 | 99 | ||||||||||||||||||
| S&P 500 Steel Index |
100 | 122 | 59 | 76 | 86 | 66 | ||||||||||||||||||
-17-
| ITEM 6. | SELECTED FINANCIAL DATA. |
The following selected consolidated financial data should be read in conjunction with our Consolidated Financial Statements and Item 7. “Management’s Discussion and Analysis of Financial Condition and Results of Operations.”
| Years ended December 31, | ||||||||||||||||||||
| 2007(1) | 2008(1) | 2009(1) | 2010(1) | 2011 | ||||||||||||||||
| (restated) | (restated) | (restated) | (restated) | |||||||||||||||||
| (In thousands, except per share and per ton amounts) | ||||||||||||||||||||
| Statement of Operations Data: |
||||||||||||||||||||
| Net sales |
$ | 451,178 | $ | 562,693 | $ | 322,347 | $ | 450,745 | $ | 563,985 | ||||||||||
| Operating income (loss) |
103,685 | 120,635 | (11,991 | ) | 21,885 | 51,568 | ||||||||||||||
| Defined benefit pension credit (expense) |
80,443 | 73,923 | (5,887 | ) | 4,654 | 24,388 | ||||||||||||||
| OPEB credit |
8,526 | 8,474 | 4,748 | 5,258 | 5,799 | |||||||||||||||
| Operating income (loss) before pension and OPEB(2) |
14,716 | 38,238 | (10,852 | ) | 11,973 | 21,381 | ||||||||||||||
| Gain on cancellation of debt |
10,074 | — | — | — | — | |||||||||||||||
| Gain on legal settlement |
5,400 | — | — | — | — | |||||||||||||||
| Income tax benefit (expense) |
(39,797 | ) | (43,742 | ) | 3,243 | (8,645 | ) | (20,838 | ) | |||||||||||
| Net income (loss) |
$ | 68,300 | $ | 72,528 | $ | (9,424 | ) | $ | 12,014 | $ | 30,211 | |||||||||
|
|
|
|
|
|
|
|
|
|
|
|||||||||||
| Basic and diluted income (loss) per share |
$ | 6.83 | $ | 6.29 | $ | (0.78 | ) | $ | 0.99 | $ | 2.50 | |||||||||
|
|
|
|
|
|
|
|
|
|
|
|||||||||||
| Basic and diluted weighted average shares outstanding(3) |
10,000 | 11,533 | 12,102 | 12,102 | 12,102 | |||||||||||||||
|
|
|
|
|
|
|
|
|
|
|
|||||||||||
| Other Operating Data: |
||||||||||||||||||||
| Shipments (000 tons): |
||||||||||||||||||||
| Wire rod |
395 | 343 | 257 | 381 | 409 | |||||||||||||||
| Fabricated wire products |
103 | 86 | 66 | 73 | 78 | |||||||||||||||
| Industrial wire |
66 | 61 | 34 | 52 | 60 | |||||||||||||||
| Wire mesh |
58 | 54 | 41 | 47 | 53 | |||||||||||||||
| Bar |
9 | 18 | 13 | 24 | 27 | |||||||||||||||
| Coiled rebar |
15 | 15 | 5 | 7 | 10 | |||||||||||||||
| Other |
2 | 9 | 6 | 12 | 12 | |||||||||||||||
|
|
|
|
|
|
|
|
|
|
|
|||||||||||
| Total |
648 | 586 | 422 | 596 | 649 | |||||||||||||||
|
|
|
|
|
|
|
|
|
|
|
|||||||||||
| Per-ton selling prices: |
||||||||||||||||||||
| Wire rod |
$ | 548 | $ | 797 | $ | 575 | $ | 618 | $ | 737 | ||||||||||
| Fabricated wire products |
1,089 | 1,380 | 1,373 | 1,277 | 1,317 | |||||||||||||||
| Industrial wire |
763 | 1,103 | 897 | 915 | 1,009 | |||||||||||||||
| Wire mesh |
896 | 1,168 | 916 | 878 | 1,004 | |||||||||||||||
| Bar |
663 | 946 | 782 | 888 | 1,030 | |||||||||||||||
| Coiled rebar |
563 | 841 | 540 | 622 | 742 | |||||||||||||||
| All products in total |
690 | 955 | 760 | 749 | 859 | |||||||||||||||
| Average per-ton ferrous scrap cost of goods sold |
$ | 235 | $ | 368 | $ | 262 | $ | 294 | $ | 373 | ||||||||||
| Other Financial Data: |
||||||||||||||||||||
| Capital expenditures |
$ | 16,602 | $ | 13,298 | $ | 9,000 | $ | 14,937 | $ | 16,479 | ||||||||||
| Depreciation and amortization |
15,434 | 15,164 | 13,584 | 12,062 | 11,234 | |||||||||||||||
-18-
| As of December 31, | ||||||||||||||||||||
| 2007(1) | 2008(1) | 2009(1) | 2010(1) | 2011 | ||||||||||||||||
| (restated) | (restated) | (restated) | (restated) | |||||||||||||||||
| (In thousands) | ||||||||||||||||||||
| Balance Sheet Data: |
||||||||||||||||||||
| Working capital |
$ | 35,872 | $ | 77,542 | $ | 61,054 | $ | 70,357 | $ | 78,742 | ||||||||||
| Property, plant and equipment, net |
92,469 | 89,987 | 85,169 | 88,009 | 93,003 | |||||||||||||||
| Total assets |
778,265 | 271,389 | 277,075 | 372,479 | 327,947 | |||||||||||||||
| Total debt |
91,577 | 31,630 | 25,370 | 28,681 | 34,614 | |||||||||||||||
| Stockholders’ equity(3) |
419,936 | 141,300 | 159,761 | 206,998 | 152,128 | |||||||||||||||
| (1) | At the end of 2011, we changed our method of accounting for productive inventories at KSW and EWP from last-in first-out (“LIFO”) to first-in first out (“FIFO”) at KSW and average cost at EWP. In accordance with GAAP, operating income (loss), operating income (loss) before pension and OPEB, net income (loss) and basic and diluted net income (loss) per share for the years ended December 31, 2007, 2008, 2009 and 2010, and working capital, total assets and stockholders’ equity as of December 31, 2007, 2008, 2009 and 2010, have been retroactively restated for this change in accounting principle. See Note 1 to our Consolidated Financial Statements for the impact of this change in accounting on amounts for the years ended December 31, 2009, 2010 and 2011 and as of December 31, 2010 and 2011. The following table presents the impact of this change in accounting on amounts as of and for the years ended December 31, 2007, 2008 and 2009. |
| As of and for the years ended December 31, | ||||||||||||||||||||||||||||||||||||
| 2007 | 2008 | 2009 | ||||||||||||||||||||||||||||||||||
| (In thousands) | ||||||||||||||||||||||||||||||||||||
| As Reported under LIFO |
Change in Accounting Principle Increase (Decrease) |
As Currently Reported |
As Reported under LIFO |
Change in Accounting Principle Increase (Decrease) |
As Currently Reported |
As Reported under LIFO |
Change in Accounting Principle Increase (Decrease) |
As Currently Reported |
||||||||||||||||||||||||||||
| Operating income (loss) |
$ | 97,972 | $ | 5,713 | $ | 103,685 | $ | 110,493 | $ | 10,142 | $ | 120,635 | $ | 3,209 | $ | (15,200 | ) | $ | (11,991 | ) | ||||||||||||||||
| Operating income (loss) before pension/OPEB |
9,003 | 5,713 | 14,716 | 28,096 | 10,142 | 38,238 | 4,348 | (15,200 | ) | (10,852 | ) | |||||||||||||||||||||||||
| Income tax expense (benefit) |
37,619 | 2,178 | 39,797 | 40,014 | 3,728 | 43,742 | 2,292 | (5,535 | ) | (3,243 | ) | |||||||||||||||||||||||||
| Net income (loss) |
64,765 | 3,535 | 68,300 | 66,114 | 6,414 | 72,528 | 241 | (9,665 | ) | (9,424 | ) | |||||||||||||||||||||||||
| Basic and diluted income per share |
6.48 | 0.35 | 6.83 | 5.73 | 0.56 | 6.29 | 0.02 | (0.80 | ) | (0.78 | ) | |||||||||||||||||||||||||
| Working capital |
20,630 | 15,242 | 35,872 | 55,886 | 21,656 | 77,542 | 49,063 | 11,991 | 61,054 | |||||||||||||||||||||||||||
| Total assets |
763,023 | 15,242 | 778,265 | 249,733 | 21,656 | 271,389 | 265,084 | 11,991 | 277,075 | |||||||||||||||||||||||||||
| Stockholders’ equity |
404,694 | 15,242 | 419,936 | 119,644 | 21,656 | 141,300 | 147,770 | 11,991 | 159,761 | |||||||||||||||||||||||||||
| (2) | Because pension and other postretirement benefit (“OPEB”) expense or credits are unrelated to the operating activities of our businesses, we measure and evaluate the performance of our businesses using operating income before pension and OPEB credit or expense. As such, we believe the presentation of operating income before pension and OPEB credit or expense provides more useful information to investors. Operating income before pension and OPEB credit or expense is a non-GAAP measure of |
-19-
| profitability that is not in accordance with accounting principles generally accepted in the United States of America (“GAAP”) and it should not be considered in isolation or as a substitute for a measure prepared in accordance with GAAP. A reconciliation of operating income as reported (which reflects the impact of the change in accounting discussed above) to operating income adjusted for pension and OPEB expense or credit is set forth in the following table. |
| Years ended December 31, | ||||||||||||||||||||
| 2007 | 2008 | 2009 | 2010 | 2011 | ||||||||||||||||
| (restated) | (restated) | (restated) | (restated) | |||||||||||||||||
| (In thousands) | ||||||||||||||||||||
| Operating income (loss) as reported |
$ | 103,685 | $ | 120,635 | $ | (11,991 | ) | $ | 21,885 | $ | 51,568 | |||||||||
| Defined benefit pension expense (credit) |
(80,443 | ) | (73,923 | ) | 5,887 | (4,654 | ) | (24,388 | ) | |||||||||||
| OPEB credit |
(8,526 | ) | (8,474 | ) | (4,748 | ) | (5,258 | ) | (5,799 | ) | ||||||||||
|
|
|
|
|
|
|
|
|
|
|
|||||||||||
| Operating income (loss) before pension/OPEB |
$ | 14,716 | $ | 38,238 | $ | (10,852 | ) | $ | 11,973 | $ | 21,381 | |||||||||
|
|
|
|
|
|
|
|
|
|
|
|||||||||||
| (3) | On March 24, 2008 we issued 2.5 million shares of our common stock and received net proceeds of $24.7 million pursuant to a subscription rights offering. |
-20-
| ITEM 7. | MANAGEMENT’S DISCUSSION AND ANALYSIS OF FINANCIAL CONDITION AND RESULTS OF OPERATIONS. |
RESULTS OF OPERATIONS
Business Overview
Recent Developments
Customer orders were strong at the end of 2011 and based on current expectations that the economy will continue to recover at a modest pace, we currently believe 2012 shipment volumes will be slightly higher than 2011 shipment volumes.
We implemented selling price changes throughout 2011 as ferrous scrap market prices fluctuated. Although we are currently experiencing pricing pressure from competitors on certain products, we believe we will be able to maintain overall positive margins on our products throughout 2012.
Results of Operations
Our profitability is primarily dependent on sales volume, per-ton selling prices and per-ton ferrous scrap costs and energy costs.
Operating income before pension and OPEB for 2011 was significantly higher than 2010 primarily due to the net effects of the following factors:
| • | increased shipment volumes, |
| • | a higher margin between selling prices and raw material costs, |
| • | higher insurance costs, and |
| • | an increase of $2.9 million in accrued incentive compensation expense due to improved profitability. |
Operating performance before pension and OPEB for 2010 was significantly better than 2009 primarily due to the net effects of the following factors:
| • | increased sales volume during 2010 as economic conditions during the first half of 2009 resulted in a sharp reduction of customer orders; |
| • | increased selling prices for wire rod, industrial wire, bar and coiled rebar; |
| • | lower selling prices for fabricated wire products and mesh as competitive conditions in those markets resulted in an inability to raise selling prices; |
| • | higher production levels during the first half of 2010 as we operated our facilities on substantially reduced production schedules during the first half of 2009 given the sharp reduction in demand, which resulted in a much higher percentage of fixed costs being included in cost of goods sold during 2009 as these costs could not be capitalized into inventory (fixed costs as a percentage of sales were 6.1% during 2010 as compared to 8.2% during 2009); |
| • | increased electricity costs at our largest manufacturing facility during 2010; |
-21-
| • | impairment charges of $2.8 million to reduce certain inventories to net realizable value during 2009 compared to nominal similar charges during 2010; |
| • | bad debt expense of $2.9 million during 2009 primarily due to the Chapter 11 proceedings of one of our customers compared to nominal similar amounts during 2010; |
| • | an increase of $2.5 million in incentive compensation expense during 2010 due to increased profitability; and |
| • | a $4.2 million credit to general and administrative expense during 2009 related to the release of accrued environmental costs for certain inactive waste management units. |
Segment Operating Results
Our operating segments are organized by our manufacturing facilities and include three reportable segments:
| • | KSW, located in Peoria, Illinois, operates an electric arc furnace mini-mill, rod mill, industrial wire mill and wire product fabrication facilities and manufactures and sells wire rod, industrial wire, coiled rebar, fabricated wire and other products to agricultural, industrial, construction, commercial, original equipment manufacturers and retail consumer markets; |
| • | EWP, located in Upper Sandusky, Ohio, primarily manufactures and sells wire mesh in both roll and sheet form that is utilized as reinforcement in concrete construction products including pipe, pre-cast boxes and applications for use in roadways, buildings and bridges; and |
| • | Calumet, located in Chicago Heights, Illinois, manufactures and sells merchant and special bar quality products and special sections in carbon and alloy steel grades for use in agricultural, cold drawn, construction, industrial chain, service centers and transportation applications as well as in the production of a wide variety of products by original equipment manufacturers. |
Calumet’s primary raw material is billet and EWP’s primary raw material is wire rod. Both Calumet and EWP source the majority of their primary raw material requirements from KSW.
-22-
Our consolidated net sales, cost of goods sold, operating costs and operating performance before pension and OPEB by segment are set forth in the following table:
| KSW(1) | EWP(1) | Calumet | Other(2) | Total | ||||||||||||||||
| (restated) | (restated) | (restated) | ||||||||||||||||||
| (In thousands) | ||||||||||||||||||||
| For the year ended December 31, 2009: |
||||||||||||||||||||
| Net sales |
$ | 298,219 | $ | 37,575 | $ | 11,127 | $ | (24,574 | ) | $ | 322,347 | |||||||||
| Cost of goods sold |
(288,505 | ) | (39,647 | ) | (14,350 | ) | 27,515 | (314,987 | ) | |||||||||||
|
|
|
|
|
|
|
|
|
|
|
|||||||||||
| Gross margin (loss) |
9,714 | (2,072 | ) | (3,223 | ) | 2,941 | 7,360 | |||||||||||||
| Selling and administrative expense |
(12,863 | ) | (2,598 | ) | (480 | ) | (2,271 | ) | (18,212 | ) | ||||||||||
|
|
|
|
|
|
|
|
|
|
|
|||||||||||
| Operating income (loss) before pension/OPEB |
$ | (3,149 | ) | $ | (4,670 | ) | $ | (3,703 | ) | $ | 670 | $ | (10,852 | ) | ||||||
|
|
|
|
|
|
|
|
|
|
|
|||||||||||
| For the year ended December 31, 2010: |
||||||||||||||||||||
| Net sales |
$ | 433,729 | $ | 41,310 | $ | 22,987 | $ | (47,281 | ) | $ | 450,745 | |||||||||
| Cost of goods sold |
(404,464 | ) | (39,254 | ) | (22,028 | ) | 47,828 | (417,918 | ) | |||||||||||
|
|
|
|
|
|
|
|
|
|
|
|||||||||||
| Gross margin |
29,265 | 2,056 | 959 | 547 | 32,827 | |||||||||||||||
| Selling and administrative expense |
(14,154 | ) | (2,418 | ) | (862 | ) | (3,420 | ) | (20,854 | ) | ||||||||||
|
|
|
|
|
|
|
|
|
|
|
|||||||||||
| Operating income (loss) before pension/OPEB |
$ | 15,111 | $ | (362 | ) | $ | 97 | $ | (2,873 | ) | $ | 11,973 | ||||||||
|
|
|
|
|
|
|
|
|
|
|
|||||||||||
| For the year ended December 31, 2011: |
||||||||||||||||||||
| Net sales |
$ | 544,011 | $ | 55,928 | $ | 30,905 | $ | (66,859 | ) | $ | 563,985 | |||||||||
| Cost of goods sold |
(505,769 | ) | (51,363 | ) | (29,896 | ) | 67,013 | (520,015 | ) | |||||||||||
|
|
|
|
|
|
|
|
|
|
|
|||||||||||
| Gross margin |
38,242 | 4,565 | 1,009 | 154 | 43,970 | |||||||||||||||
| Selling and administrative expense |
(15,940 | ) | (2,725 | ) | (860 | ) | (3,064 | ) | (22,589 | ) | ||||||||||
|
|
|
|
|
|
|
|
|
|
|
|||||||||||
| Operating income before pension/OPEB |
$ | 22,302 | $ | 1,840 | $ | 149 | $ | (2,910 | ) | $ | 21,381 | |||||||||
|
|
|
|
|
|
|
|
|
|
|
|||||||||||
| (1) | At the end of 2011, KSW and EWP changed their method of accounting for productive inventories from LIFO to FIFO at KSW and average cost at EWP. See Note 2 to our Consolidated Financial Statements for the impact of this change on their operating income (loss). |
| (2) | Other items primarily consist of the elimination of intercompany sales, the elimination of intercompany profit or loss on ending inventory balances and general corporate expenses. |
-23-
Keystone Steel & Wire
| 2009 | % of sales |
2010 | % of sales |
2011 | % of sales |
|||||||||||||||||||
| (restated) | (restated) | (restated) | (restated) | |||||||||||||||||||||
| ($ in thousands) | ||||||||||||||||||||||||
| Net sales |
$ | 298,219 | 100.0 | % | $ | 433,729 | 100.0 | % | $ | 544,011 | 100.0 | % | ||||||||||||
| Cost of goods sold |
(288,505 | ) | (96.7 | ) | (404,464 | ) | (93.3 | ) | (505,769 | ) | (93.0 | ) | ||||||||||||
|
|
|
|
|
|
|
|
|
|
|
|
|
|||||||||||||
| Gross margin |
9,714 | 3.3 | 29,265 | 6.7 | 38,242 | 7.0 | ||||||||||||||||||
| Selling and administrative |
(12,863 | ) | (4.3 | ) | (14,154 | ) | (3.3 | ) | (15,940 | ) | (2.9 | ) | ||||||||||||
|
|
|
|
|
|
|
|
|
|
|
|
|
|||||||||||||
| Operating income (loss) before pension/OPEB |
$ | (3,149 | ) | (1.0 | )% | $ | 15,111 | 3.4 | % | $ | 22,302 | 4.1 | % | |||||||||||
|
|
|
|
|
|
|
|
|
|
|
|
|
|||||||||||||
The primary drivers of sales, cost of goods sold and the resulting gross margin are as follows:
| 2009 | 2010 | 2011 | ||||||||||
| Sales volume(000 tons): |
||||||||||||
| Wire rod |
291 | 429 | 470 | |||||||||
| Fabricated wire products |
66 | 73 | 78 | |||||||||
| Industrial wire |
34 | 52 | 57 | |||||||||
| Billet |
16 | 45 | 50 | |||||||||
| Coiled rebar |
5 | 7 | 10 | |||||||||
|
|
|
|
|
|
|
|||||||
| Total |
412 | 606 | 665 | |||||||||
|
|
|
|
|
|
|
|||||||
| Per-ton selling prices: |
||||||||||||
| Wire rod |
$ | 575 | $ | 620 | $ | 735 | ||||||
| Fabricated wire products |
1,373 | 1,277 | 1,317 | |||||||||
| Industrial wire |
897 | 915 | 1,016 | |||||||||
| Billet |
366 | 452 | 541 | |||||||||
| Coiled rebar |
540 | 622 | 742 | |||||||||
| All products |
720 | 712 | 813 | |||||||||
| Average per-ton ferrous scrap cost of goods sold |
$ | 262 | $ | 294 | $ | 373 | ||||||
| Average electricity cost per kilowatt hour |
$ | 0.03 | $ | 0.04 | $ | 0.04 | ||||||
| Kilowatt hours consumed (000 hours) |
341,392 | 478,641 | 522,562 | |||||||||
| Average natural gas cost per therm |
$ | 0.50 | $ | 0.50 | $ | 0.47 | ||||||
| Natural gas therms consumed (000 therms) |
14,115 | 18,134 | 18,358 | |||||||||
-24-
KSW’s operating income before pension and OPEB for 2011 as compared to 2010 was also impacted by increased insurance costs and increased accrued incentive compensation expense as a result of higher profitability.
KSW’s operating performance before pension and OPEB for 2010 as compared to 2009 was also impacted by the following:
| • | higher production levels during the first half of 2010 as KSW operated on substantially reduced production schedules during the first half of 2009 given the sharp reduction in demand caused by economic conditions, which resulted in a higher percentage of fixed costs being included in cost of goods sold during 2009 as these costs could not be capitalized into inventory (fixed costs as a percentage of sales were 6.3% during 2010 compared to 8.7% during 2009); |
| • | bad debt expense of $2.9 million during 2009 primarily due to the Chapter 11 proceedings of one of KSW’s customers compared to nominal similar amounts during 2010; |
| • | higher incentive compensation expense during 2010 due to increased profitability; and |
| • | a $4.2 million credit during 2009 related to the release of accrued environmental costs as discussed above. |
Engineered Wire Products, Inc.
| 2009 | % of sales |
2010 | % of sales |
2011 | % of sales |
|||||||||||||||||||
| (restated) | (restated) | (restated) | (restated) | |||||||||||||||||||||
| ($ in thousands) | ||||||||||||||||||||||||
| Net sales |
$ | 37,575 | 100.0 | % | $ | 41,310 | 100.0 | % | $ | 55,928 | 100.0 | % | ||||||||||||
| Cost of goods sold |
(39,647 | ) | (105.5 | ) | (39,254 | ) | (95.0 | ) | (51,363 | ) | (91.8 | ) | ||||||||||||
|
|
|
|
|
|
|
|
|
|
|
|
|
|||||||||||||
| Gross margin (loss) |
(2,072 | ) | (5.5 | ) | 2,056 | 5.0 | 4,565 | 8.2 | ||||||||||||||||
| Selling and administrative |
(2,598 | ) | (6.9 | ) | (2,418 | ) | (5.9 | ) | (2,725 | ) | (4.9 | ) | ||||||||||||
|
|
|
|
|
|
|
|
|
|
|
|
|
|||||||||||||
| Operating income (loss) before pension/OPEB |
$ | (4,670 | ) | (12.4 | )% | $ | (362 | ) | (0.9 | )% | $ | 1,840 | 3.3 | % | ||||||||||
|
|
|
|
|
|
|
|
|
|
|
|
|
|||||||||||||
The primary drivers of sales, cost of goods sold and the resulting gross margin are as follows:
| 2009 | 2010 | 2011 | ||||||||||
| Sales volume (000 tons): |
||||||||||||
| Wire mesh |
41 | 47 | 53 | |||||||||
| Industrial wire |
— | — | 3 | |||||||||
|
|
|
|
|
|
|
|||||||
| Total |
41 | 47 | 56 | |||||||||
|
|
|
|
|
|
|
|||||||
| Per-ton selling prices: |
||||||||||||
| Wire mesh |
$ | 916 | $ | 878 | $ | 1,004 | ||||||
| Industrial wire |
— | — | 853 | |||||||||
| Total |
916 | 878 | 996 | |||||||||
| Average per-ton wire rod cost of goods sold |
$ | 710 | (1) | $ | 634 | $ | 722 | |||||
-25-
| (1) | The wire rod market increased to unprecedented price levels during the second and third quarters of 2008 and due to low shipment volumes during the fourth quarter of 2008 and the first quarter of 2009, the average per-ton wire rod costs included in the products EWP sold during 2009 of $710 was not consistent with KSW’s 2009 average per-ton wire rod selling price of $575. |
EWP’s gross margin during 2011 as compared to 2010 was also impacted by lower salaries due to a decrease in salaried manufacturing employees and depreciation expense. EWP’s selling and administrative expenses during 2011 were higher than 2010 primarily due to increased insurance costs.
EWP’s gross margin during 2010 as compared to 2009 was also impacted by higher compensation costs. EWP’s selling and administrative expenses during 2010 were lower than 2009 primarily due to decreased outside commissions expense.
Keystone-Calumet, Inc.
| 2009 | % of sales |
2010 | % of sales |
2011 | % of sales |
|||||||||||||||||||
| ($ in thousands) | ||||||||||||||||||||||||
| Net sales |
$ | 11,127 | 100.0 | % | $ | 22,987 | 100.0 | % | $ | 30,905 | 100.0 | % | ||||||||||||
| Cost of goods sold |
(14,350 | ) | (129.0 | ) | (22,028 | ) | (95.8 | ) | (29,896 | ) | (96.7 | ) | ||||||||||||
|
|
|
|
|
|
|
|
|
|
|
|
|
|||||||||||||
| Gross margin (loss) |
(3,223 | ) | (29.0 | ) | 959 | 4.2 | 1,009 | 3.3 | ||||||||||||||||
| Selling and administrative |
(480 | ) | (4.3 | ) | (862 | ) | (3.8 | ) | (860 | ) | (2.8 | ) | ||||||||||||
|
|
|
|
|
|
|
|
|
|
|
|
|
|||||||||||||
| Operating income (loss) before pension/OPEB |
$ | (3,703 | ) | (33.3 | )% | $ | 97 | 0.4 | % | $ | 149 | 0.5 | % | |||||||||||
|
|
|
|
|
|
|
|
|
|
|
|
|
|||||||||||||
The primary drivers of sales, cost of goods sold and the resulting gross margin are as follows:
| 2009 | 2010 | 2011 | ||||||||||
| Sales volume(000 tons) – Bar |
13 | 24 | 27 | |||||||||
| Per-ton selling prices – Bar |
$ | 782 | $ | 888 | $ | 1,030 | ||||||
| Average per-ton billet cost of goods sold |
$ | 447 | $ | 507 | $ | 588 | ||||||
Throughout 2011, Calumet experienced significant production delays associated with equipment malfunctions including performance problems related to new equipment installed during the first quarter of 2011. Due to the related production outages, Calumet struggled to meet customer order deadlines on a consistent basis, resulting in lower than expected sales volume. As the equipment malfunctions are remedied and Calumet’s labor force gains experience working with the new equipment, we believe the mill will operate more efficiently, thereby allowing consistent on-time delivery of customer orders as well as reduction of future conversion costs.
-26-
Calumet’s operating performance for 2010 as compared to 2009 was also impacted by the following:
| • | impairment charges of $2.8 million during 2009 to reduce inventory to its net realizable value; |
| • | substantially reduced production volumes during the first half of 2009 resulting in a much higher percentage of fixed costs included in cost of goods sold during 2009 as compared to 2010 (fixed costs as a percentage of sales were 8.0% during 2009 as compared to 4.3% during 2010); |
| • | lower prices for electricity during 2010; and |
| • | higher selling and administrative expenses during 2010 primarily due to the expansion of Calumet’s management team and sales force as well as increased incentive compensation accruals as a result of better operating performance. |
Pension Credits and Expense
During 2009, we recorded defined benefit pension expense of $5.9 million. During 2010 and 2011, we recorded a defined benefit pension credit of $4.7 million and $24.4 million, respectively. The fluctuations in the pension credit or expense were primarily the result of increases in our plans’ assets of $58 million during 2009 and $86 million during 2010. These fluctuations in plan assets impact the subsequent year’s defined benefit pension credit or expense by (i) changing the expected return on plan assets as the plan assets multiplied by the assumed long-term rate of return is higher or lower than the prior year and (ii) changing the amortization of unrealized net gains or losses as any differences between the expected return on plan assets and the actual return on plan assets are deferred and amortized into income over future periods.
Our plans’ assets decreased by approximately $45 million during 2011 and we currently expect to record a defined benefit pension credit of $7.6 million during 2012. See Note 6 to our Consolidated Financial Statements.
OPEB Credits
We recorded an OPEB credit of $4.7 million during 2009, $5.3 million during 2010 and $5.8 million during 2011. We currently expect to record a $6.3 million OPEB credit during 2012. The increases in our OPEB credit from 2009 through our expected 2012 credit were primarily the result of decreases in the rate at which we recognize interest cost on our OPEB liabilities. See Note 6 to our Consolidated Financial Statements.
-27-
Interest Expense
Interest expense during 2009, 2010 and 2011 as well as the primary drivers of interest expense are presented in the following table.
| 2009 | 2010 | 2011 | ||||||||||
| ($ in thousands) | ||||||||||||
| Interest expense |
$ | 1,725 | $ | 1,863 | $ | 1,218 | ||||||
| Average balance of total debt |
$ | 35,129 | $ | 36,983 | $ | 39,992 | ||||||
| Average balance of revolver |
17,889 | 28,662 | 39,992 | |||||||||
| Weighted average interest rate |
4.1 | % | 4.0 | % | 2.7 | % | ||||||
The relatively low average balance of our revolver during 2009 was primarily due to substantially reduced production schedules throughout 2009 and an exceptionally low balance on our revolving credit facility at the end of 2008. The increase in the average balance of our revolver during 2010 was primarily due to increased production during 2010, the early extinguishment of the remaining $5.1 million balance outstanding under our loan agreement with the County of Peoria, Illinois and the retirement of the remaining $2.5 million balance of our term loan with Wells Fargo; both of which were funded with borrowings under our revolving credit facility. The increase in the average balance of our revolver during 2011 was primarily due to increased production schedules.
The decrease in the overall weighted average interest rate from 2010 to 2011 was primarily due to decreases in the rate at which our primary credit facility bore interest. Our primary credit facility bears interest at certain margins over prime and LIBOR rates. In October 2009 and August 2010, these margins changed as a result of amendments to our primary credit agreement. The following table presents the margins in effect over certain periods of time during the last three years.
| Margins on prime |
Margins on LIBOR |
|||||||
| January 2009 – October 2009 |
0% to 0.5% | 2% to 2.75% | ||||||
| October 2009 – August 2010 |
1% or 1.25% | 2.75% or 3% | ||||||
| August 2010 – December 2011 |
0.25% to 0.5% | 2% to 2.25% | ||||||
Provision for Income Taxes
A tabular reconciliation of the difference between the U.S. Federal statutory income tax rate and our effective income tax rates is included in Note 5 to our Consolidated Financial Statements.
-28-
LIQUIDITY AND CAPITAL RESOURCES
Historical Cash Flows
Operating Activities
During 2011, net cash provided by operations totaled $10.3 million as compared to net cash provided by operations of $11.9 million during 2010. The $1.6 million decrease in cash provided by operating activities was primarily due to the net effects of:
| • | higher operating income before pension and OPEB during 2011 of $9.4 million; |
| • | higher net cash used as a result of relative changes in our accounts receivable in 2011 of $6.8 million due to both increased shipment volume and selling prices; |
| • | higher net cash used as a result of relative changes in our inventory in 2011 of $7.9 million primarily due to increased inventory levels in preparation of anticipated sales levels during the first quarter of 2012 and higher ferrous scrap costs at the end of 2011; |
| • | higher net cash provided as a result of relative changes in our accounts payable in 2011 of $6.5 million due to increased production schedules and capital projects in process at the end of 2011 as compared to 2010 as well as more favorable payment terms on raw materials and utilities; |
| • | higher net cash provided as a result of relative changes in our accrued liabilities in 2011 of $3.3 million primarily due to increased accrued incentive compensation related to higher profitability, increased insurance reserves and increased accrued utilities due to increased production schedules; |
| • | an increase in certain prepayments during 2011 as compared to the release of $1.0 million of utility deposits during 2010 as a result of entering into new energy service agreements; and |
| • | higher taxes paid during 2011 of $4.5 million primarily due to higher earnings in 2011. |
During 2010, net cash provided by operations totaled $11.9 million as compared to net cash provided by operations of $13.3 million during 2009. The $1.4 million decline in operating cash flows was primarily due to the net effects of:
| • | better operating performance before pension/OPEB during 2010 of $22.8 million; |
| • | lower net cash used as a result of relative changes in our accounts receivable in 2010 of $11.9 million primarily due to an abnormally low accounts receivable balance at December 31, 2008 as a result of customers limiting orders during the fourth quarter of 2008; |
| • | higher net cash used by relative changes in our inventory of $52.1 million in 2010 primarily due to increased scrap costs and substantially higher production levels during the first half of 2010 to meet increased demand as compared to extremely low production levels during the first half of 2009 as a result of a rapid decline in product demand (production levels were relatively consistent between the last half of 2010 and last half of 2009); |
-29-
| • | higher net cash provided by relative changes in our accounts payable of $3.3 million in 2010 primarily due to increased costs associated with the annual fourth quarter maintenance shutdown at our largest facility; |
| • | higher net cash provided by relative changes in our accrued liabilities of $14.0 million in 2010 primarily as a result of the payment of 2008 employee incentive compensation during the first quarter of 2009 which was significantly higher than 2009 employee incentive compensation paid during the first quarter of 2010; |
| • | the release of $1.0 million of utility deposits during 2010 as discussed above; and |
| • | income tax refunds of $.1 million during 2010 compared to income tax payments of $1.1 million during 2009. |
Investing Activities
During 2009, 2010 and 2011, we had capital expenditures of approximately $9.0 million, $14.9 million and $16.5 million, respectively. Capital expenditures for 2009 were lower than 2010 and 2011 capital expenditures as we limited all non-critical capital projects during 2009 due to the economic conditions. The increase in capital expenditures from 2010 to 2011 primarily relates to upgrades of production equipment at KSW and Calumet.
During 2009, the Illinois Environmental Protection Agency (the “IEPA”) released $2.0 million of previously escrowed funds to us in connection with the IEPA’s approval of the completion of the soil portion of the remediation plan for certain inactive waste management units. These funds were used to reduce our indebtedness under our revolving credit facility.
Financing Activities
We increased borrowings on our revolving credit facility during 2011 by $5.9 million as compared to increasing borrowings by $15.2 million during 2010. The decreased borrowings during 2011 were primarily due to significantly lower principal payments during 2011 as we no longer had significant debt other than our revolving credit facility, partially offset by increased capital expenditures and less cash provided by operations as discussed above.
We increased our borrowings on our revolving credit facility by $15.2 million during 2010 primarily as a result of the early extinguishment of the remaining $5.1 million balance outstanding under our loan agreement with the County of Peoria, Illinois, the retirement of the remaining $2.5 million balance of our term loan with Wells Fargo (both of which were funded with borrowings under our revolving credit facility) and increased production during 2010 as compared to 2009.
We increased our borrowings on our revolving credit facility by $9.3 million during 2009 primarily as a result of decreased profitability and the payment of 2008’s employee incentive compensation during the first quarter of 2009.
-30-
Future Cash Requirements
Capital Expenditures
Capital expenditures for 2012 are expected to be approximately $17 million and are primarily related to upgrades of production equipment. We expect to fund capital expenditures using cash flows from operations and borrowing availability under our revolving credit facility.
Summary of Debt and Other Contractual Commitments
As more fully described in Notes 4 and 7 to our Consolidated Financial Statements, we are a party to various debt, lease and other agreements which contractually and unconditionally commit us to pay certain amounts in the future. The following table summarizes such contractual commitments that are unconditional both in terms of timing and amount by the type and date of payment:
| Payment due date | ||||||||||||||||||||
| Contractual commitment |
2012 | 2013/2014 | 2015/2016 | 2017 and after | Total | |||||||||||||||
| (In thousands) | ||||||||||||||||||||
| Principal payments on debt obligations |
$ | 33,631 | $ | 1,100 | $ | — | $ | — | $ | 34,731 | ||||||||||
| Operating leases |
736 | 588 | 225 | — | 1,549 | |||||||||||||||
| Product supply agreements |
2,237 | 4,474 | 4,474 | 6,732 | 17,917 | |||||||||||||||
| Income taxes |
4,482 | — | — | — | 4,482 | |||||||||||||||
|
|
|
|
|
|
|
|
|
|
|
|||||||||||
| Total |
$ | 41,086 | $ | 6,162 | $ | 4,699 | $ | 6,732 | $ | 58,679 | ||||||||||
|
|
|
|
|
|
|
|
|
|
|
|||||||||||
The timing and amounts shown in the above table are based upon the contractual payment amount and the contractual payment date for such commitments with the exception of our revolving credit facility. As our revolving credit facility requires our daily net cash receipts be used to reduce the outstanding borrowings under the facility, we have presented the payment of the revolving credit facility balance as of December 31, 2011, as being due during 2012 as opposed to its maturity date in 2015. Additionally, due to the short-term nature of the assumed 2012 payment of our revolving credit facility balance and as our other debt obligations are non-interest bearing, we have not included amounts for interest in the table above. Note that our revolving credit facility bears interest at prime plus a margin ranging from 0.25% to 0.5%, for prime-based borrowings, or LIBOR plus a margin ranging from 2.00% to 2.25%, for LIBOR-based borrowings (the weighted average interest rate was 2.8% at December 31, 2011).
The above table does not reflect any amounts that we might pay to fund our defined benefit pension plans and OPEB plans as the timing and amount of any such future fundings are unknown and dependent on, among other things, the future performance of defined benefit pension plan assets, interest rate assumptions and actual future census data.
-31-
Off-balance Sheet Financing
We do not have any off-balance sheet financing agreements other than the operating leases included in the table above. See Note 7 to our Consolidated Financial Statements.
Environmental Obligations
At December 31, 2011, our financial statements reflected accrued liabilities of $.4 million for estimated remediation costs for those environmental matters which we believe are probable and reasonably estimable; $.2 million of which we believe will be paid during 2012. Although we have established an accrual for estimated future required environmental remediation costs, we do not know the ultimate cost of remedial measures that might eventually be required by environmental authorities and additional environmental hazards, requiring further remedial expenditures, might be asserted by such authorities or private parties. Accordingly, the costs of remedial measures may exceed the amounts accrued. The upper end of the range of reasonably possible costs to us for sites where we have been named a defendant is approximately $2.1 million, including the $.4 million currently accrued. See Note 7 to our Consolidated Financial Statements for discussions of our environmental liabilities.
Pension and Other Postretirement Obligations
We were not required to make any cash contributions to our defined benefit pension plans during 2009, 2010 or 2011 and we currently do not expect to be required to make cash contributions during 2012. However, we contributed $1.3 million in each of 2009 and 2010 and $1.1 million in 2011 to our other postretirement benefit plans and we currently expect to contribute $1.2 million during 2012. As allowed under certain of our benefit plans, we exercised our right to create supplemental pension benefits in lieu of certain 2009, 2010, 2011 and 2012 benefit payments due under one of our OPEB plans. If we had not exercised such rights for 2012, our expected OPEB contributions would be $2.9 million higher. We have the ability to decide whether or not to exercise such rights on a year-by-year basis. Future variances from assumed actuarial rates, including the rate of return on plan assets, may result in increases or decreases to pension and other postretirement benefit funding requirements in future periods. See Note 6 to our Consolidated Financial Statements.
Working Capital and Borrowing Availability
| December 31, | ||||||||
| 2010 | 2011 | |||||||
| (restated) | ||||||||
| (In thousands) | ||||||||
| Working capital |
$ | 70,357 | $ | 78,742 | ||||
| Outstanding balance under revolving credit facility |
27,740 | 33,630 | ||||||
| Additional borrowing availability |
38,779 | 30,939 | ||||||
The revolving credit facility requires us to use our daily cash receipts to reduce outstanding borrowings, which results in us maintaining zero cash balances when there are balances outstanding under this credit facility.
-32-
The amount of available borrowings under our revolving credit facility is based on formula-determined amounts of trade receivables and inventories, less the amount of outstanding letters of credit ($5.0 million at December 31, 2011). Our revolving credit facility requires us to maintain a minimum fixed charge coverage ratio, defined in the agreement as earnings before interest, taxes, depreciation, amortization, restructuring costs, pension and OPEB expense or credits, less OPEB payments, divided by the sum of interest expense, tax payments, principal payments on certain debt and certain capital expenditures, of 1.0 if excess availability falls below $10.0 million. At December 31, 2011 our fixed charge coverage ratio was 1.5 and as disclosed above excess availability was $30.9 million. Current forecasts indicate we will maintain excess availability of at least $10.0 million and a fixed charge coverage ratio of at least 1.0 throughout 2012.
RELATED PARTY TRANSACTIONS
As further discussed in Note 11 to our Consolidated Financial Statements, we are party to certain transactions with related parties. It is our policy to engage in transactions with related parties on terms no less favorable than could be obtained from unrelated parties.
RECENT ACCOUNTING PRONOUNCEMENTS
See Note 13 to our Consolidated Financial Statements for the projected impact of recent accounting pronouncements on our financial position and results of operations.
CRITICAL ACCOUNTING POLICIES AND ESTIMATES
The accompanying “Management’s Discussion and Analysis of Financial Condition and Results of Operations” is based upon our Consolidated Financial Statements, which have been prepared in accordance with GAAP. The preparation of these financial statements requires us to make estimates and judgments that affect the reported amounts of assets and liabilities and disclosure of contingent assets and liabilities at the date of the financial statements, and the reported amount of revenues and expenses during the reported period. On an on-going basis, we evaluate our estimates. We base our estimates on historical experience and on various other assumptions we believe to be reasonable under the circumstances, the results of which form the basis for making judgments about the reported amounts of assets, liabilities, revenues and expenses. Actual results may differ from previously-estimated amounts under different assumptions or conditions.
We believe the following critical accounting policies affect our more significant judgments and estimates used in the preparation of our Consolidated Financial Statements.
Impairment of long-lived assets. We recognize an impairment charge associated with our long-lived assets, primarily property and equipment, whenever we determine that recovery of such long-lived asset is not probable. Such determination is made in accordance with the applicable GAAP requirements associated with the long-lived asset, and is based upon, among other things, estimates of the amount of future net cash flows to be generated by the long-lived asset and estimates of the current fair value of the asset. Adverse
-33-
changes in such estimates of future net cash flows or estimates of fair value could result in an inability to recover the carrying value of the long-lived asset, thereby possibly requiring an impairment charge to be recognized in the future.
We assess property and equipment for impairment only when circumstances as specified in ASC 360-10-35, Property, Plant, and Equipment, indicate an impairment may exist. No long-lived assets were tested for impairment during 2011 because there were no circumstances to indicate an impairment may exist.
Income taxes. We record a valuation allowance to reduce our gross deferred income tax assets to the amount believed to be realized under the more-likely-than-not recognition criteria. While we have considered future taxable income and ongoing prudent and feasible tax planning strategies in assessing the need for a valuation allowance, it is possible in the future we may change our estimate of the amount of the deferred income tax assets that would more-likely-than-not be realized in the future, resulting in an adjustment to the deferred income tax asset valuation allowance that would either increase or decrease, as applicable, reported net income or loss in the period such change in estimate was made. We believe the realization of our gross deferred income tax assets meet the more-likely-than-not realizability test at December 31, 2011.
We record a reserve for uncertain tax positions for each tax position where we believe it is more-likely-than-not our position will not prevail with the applicable tax authorities. Our reserve for uncertain tax positions was nil for each of 2009, 2010 and 2011.
Contingencies. We record accruals for environmental, legal and other contingencies when estimated future expenditures associated with such contingencies become probable, and the amounts can be reasonably estimated. However, new information may become available, or circumstances (such as applicable laws and regulations) may change, thereby resulting in an increase or decrease in the amount required to be accrued for such matters (and therefore a decrease or increase in reported net income in the period of such change).
Assumptions on defined benefit pension plans. Under defined benefit pension plan accounting, we recognize defined benefit pension plan expense or credit and pension assets or liabilities based on certain actuarial assumptions, principally the assumed discount rate, the assumed long-term rate of return on plan assets and the assumed increase in future compensation levels. We recognize the full funded status of our defined benefit pension plans as either an asset (for overfunded plans) or a liability (for underfunded plans) in our Consolidated Balance Sheet. At December 31, 2011 our defined benefit pension plan for inactive employees was overfunded while our defined benefit pension plan for active employees was underfunded.
The discount rates we utilize for determining defined benefit pension expense or credit and the related pension obligations are based, in part, on current interest rates earned on long-term bonds that receive one of the two highest ratings given by recognized rating agencies. In addition, we receive advice about appropriate discount rates from our third-party actuaries, who may in some cases utilize their own market indices. The discount rates are adjusted as of each valuation date (December 31st) to reflect then-current
-34-
interest rates on such long-term bonds. Such discount rates are used to determine the actuarial present value of the pension obligations as of December 31st of that year, and such discount rates are also used to determine the interest component of defined benefit pension expense or credit for the following year.
We used the following discount rates for our defined benefit pension plans during the last three years:
| Discount rates used for: | ||||
| Obligations at December 31, 2009 and expense in 2010 |
Obligations at December 31, 2010 and expense in 2011 |
Obligations at December 31, 2011 and expense in 2012 | ||
| 5.6% |
5.0% | 4.0% | ||
The estimated return on plan assets component of each year’s defined benefit expense or credit is based upon the assumed long-term rate of return on plan assets for the plan and the actual fair value of the plan assets as of the beginning of the year. The assumed long-term rate of return on plan assets represents the estimated average rate of earnings expected to be earned on the funds invested or to be invested to fund the benefit payments inherent in the projected benefit obligations. Unlike the discount rate, which is adjusted each year based on changes in current long-term interest rates, the assumed long-term rate of return on plan assets will not necessarily change based upon the actual, short-term performance of the plan assets in any given year.
Substantially all of our plans’ assets are invested in the Combined Master Retirement Trust (“CMRT”), a collective investment trust sponsored by Contran, to permit the collective investment by certain master trusts that fund certain employee benefit plans sponsored by Contran and certain of its affiliates. Mr. Harold C. Simmons is the sole trustee of the CMRT. The CMRT’s investment committee, of which Mr. Simmons is a member, actively manages the investments of the CMRT. The trustee and investment committee periodically change the asset mix of the CMRT based upon, among other things, advice they receive from third-party advisors and their expectations as to what asset mix will generate the greatest overall return. The CMRT’s long-term investment objective is to provide a rate of return exceeding a composite of broad market equity and fixed income indices (including the S&P 500 and certain Russell indices) utilizing both third-party investment managers as well as investments directed by Mr. Simmons. During the 23-year history of the CMRT through December 31, 2011, the average annual rate of return of the CMRT has been 13.9%.
The CMRT’s weighted average asset allocations by asset category were as follows:
| December 31, | ||||||||
| 2010 | 2011 | |||||||
| Equity securities and limited partnerships |
83 | % | 85 | % | ||||
| Fixed income securities |
16 | 14 | ||||||
| Real estate, cash, cash equivalents and other |
1 | 1 | ||||||
|
|
|
|
|
|||||
| Total |
100 | % | 100 | % | ||||
|
|
|
|
|
|||||
-35-
We regularly review our actual asset allocation for our defined benefit pension plans, and will periodically rebalance the investments in the plans to more accurately reflect the targeted allocation when considered appropriate.
For 2009, 2010 and 2011, the assumed long-term rate of return utilized for plan assets invested in the CMRT was 10%. We currently expect to utilize the same long-term rate of return on plan assets assumption in 2012. In determining the appropriateness of such long-term rate of return assumption, we considered the historical rate of return for the CMRT, the current and projected asset mix of the CMRT, the investment objectives of the CMRT’s managers and the advice of our third-party actuaries.
To the extent the defined benefit pension plans’ particular pension benefit formula calculates the pension benefit in whole or in part based upon future compensation levels, the projected benefit obligations and the pension expense will be based in part upon expected increases in future compensation levels. For pension benefits that are so calculated, we generally base the assumed expected increase in future compensation levels upon our average historical experience and managements’ intentions regarding future compensation increases, which generally approximates average long-term inflation rates.
Assumed discount rates and rates of return on plan assets are re-evaluated annually. Different assumptions could result in the recognition of materially different expense amounts over different periods of times and materially different asset and liability amounts in our Consolidated Financial Statements. A reduction in the assumed discount rate generally results in an actuarial loss, as the actuarially-determined present value of estimated future benefit payments will increase. Conversely, an increase in the assumed discount rate generally results in an actuarial gain. In addition, an actual return on plan assets for a given year that is greater than the assumed return on plan assets results in an actuarial gain, while an actual return on plan assets that is less than the assumed return results in an actuarial loss. Other actual outcomes that differ from previous assumptions, such as individuals living longer or shorter than assumed in mortality tables that are used to determine the present value of estimated future benefit payments, changes in such mortality tables themselves or plan amendments, will also result in actuarial losses or gains. Under GAAP, all of such actuarial gains and losses are not recognized in earnings currently, but instead are deferred and amortized into income over future periods based upon the expected average remaining service life of active plan participants (for plans for which benefits are still being earned by active employees) or the average remaining life expectancy of inactive participants (for plans for which benefits are not still being earned by active employees). However, any actuarial gains generated in future periods would reduce the negative amortization effect of any cumulative unamortized actuarial losses, while any actuarial losses generated in future periods would reduce the favorable amortization effect of any cumulative unamortized actuarial gains.
Defined benefit pension expense or credit and the amounts recognized as pension assets or liabilities are based upon the actuarial assumptions discussed above. We believe all of the actuarial assumptions used are reasonable and appropriate. During 2009, we recorded defined benefit pension expense of $5.9 million. During 2010 and 2011, we recorded a defined benefit
-36-
pension credit of $4.7 million and $24.4 million, respectively. The fluctuations in the pension credit or expense were primarily the result of increases in our plans’ assets of $58 million during 2009 and $86 million during 2010. These fluctuations in plan assets impact the subsequent year’s defined benefit pension credit or expense by (i) changing the expected return on plan assets as the plan assets multiplied by the assumed long-term rate of return is higher or lower than the prior year and (ii) changing the amortization of unrealized net gains or losses as any differences between the expected return on plan assets and the actual return on plan assets are deferred and amortized into income over future periods. The amount of funding requirements for our defined benefit pension plans is based upon applicable regulations, and will generally differ from pension expense or credit recognized under GAAP. No contributions were required to be made to our defined benefit pension plans during the past three years and we expect that no cash contributions to our pension plans will be required during 2012.
We currently expect to record a defined benefit pension credit during 2012 of $7.6 million. If we had lowered the assumed discount rate by 25 basis points as of December 31, 2011, our projected and accumulated benefit obligations would have increased by approximately $12.8 million and $12.4 million, respectively at that date, and the expected defined benefit pension credit for 2012 would have decreased by approximately $.5 million. Similarly, if we lowered the assumed long-term rate of return on plan assets by 25 basis points, the expected defined benefit pension credit for 2012 would have decreased by approximately $1.2 million.
Assumptions on other postretirement benefit plans. Under accounting for other postretirement employee benefits, OPEB expense or credits and accrued OPEB costs are based on certain actuarial assumptions, principally the assumed discount rate. We recognize the full unfunded status of our OPEB plans as a liability.
The assumed discount rates we utilize for determining OPEB expense and the related accrued OPEB obligations are generally based on the same discount rates we utilize for our defined benefit pension plans and are re-evaluated annually. We believe all of the actuarial assumptions used are reasonable and appropriate. Changes in discount rates or other actual outcomes that differ from previous assumptions have the same accounting implications as discussed in “Assumptions on defined benefit pension plans” above. Our OPEB plans do not provide for medical benefits to participants. Accordingly, changes in the healthcare cost trend rate do not impact our future OPEB expense or obligations.
We recognized a consolidated OPEB credit of $4.7 million during 2009, $5.3 million during 2010 and $5.8 million during 2011. We currently expect to record a $6.3 million OPEB credit during 2012. If we had lowered the assumed discount rate by 25 basis points for all of our OPEB plans as of December 31, 2011, our aggregate accumulated OPEB obligations would have increased by approximately $1.4 million at that date, and our expected OPEB credit for 2012 would have decreased by $32,000.
Similar to defined benefit pension contributions, the amount of required contributions for our OPEB plans will differ from the expense or credit recognized for financial reporting purposes. We contributed $1.3 million in each of 2009 and 2010 and $1.1 million in 2011 to our other postretirement
-37-
benefit plans and we expect to contribute $1.2 million during 2012. As allowed under certain of our benefit plans, we exercised our right to create supplemental pension benefits in lieu of certain 2009, 2010, 2011 and 2012 benefit payments due under one of our OPEB plans. If we had not exercised such rights for 2012, our expected OPEB contributions would be $2.9 million higher. We have the ability to decide whether or not to exercise such rights on a year-by-year basis. See Note 6 to our Consolidated Financial Statements.
| ITEM 7A. | QUANTITATIVE AND QUALITATIVE DISCLOSURES ABOUT MARKET RISK. |
Our exposure to market risk relates primarily to changes in interest rates related to variable-rate indebtedness. The following table presents principal amounts, interest rates and fair value for our outstanding variable-rate indebtedness at December 31, 2010 and 2011. See Note 4 to our Consolidated Financial Statements.
| Amount | ||||||||||||||||
| Carrying value |
Fair value |
Interest rate |
Maturity date |
|||||||||||||
| (In thousands) | ||||||||||||||||
| December 31, 2011 |
$ | 33,630 | $ | 33,630 | 2.8 | % | 2015 | |||||||||
| December 31, 2010 |
$ | 27,740 | $ | 27,740 | 2.6 | % | 2015 | |||||||||
Substantially all of our debt outstanding at December 31, 2011 is at variable interest rates. We have performed a sensitivity analysis assuming a hypothetical 10% adverse movement in interest rates. As of December 31, 2011 the analysis indicated that such rate movements would not have a material effect on our financial results from operations or cash flows. However, actual gains or losses in the future may differ materially from our analysis based on changes in the timing and amount of interest rate movement.
| ITEM 8. | FINANCIAL STATEMENTS AND SUPPLEMENTARY DATA. |
The information called for by this Item is contained in a separate section of this Annual Report. See “Index of Consolidated Financial Statements” (page F-1).
| ITEM 9. | CHANGES IN AND DISAGREEMENTS WITH ACCOUNTANTS ON ACCOUNTING AND FINANCIAL DISCLOSURE. |
None.
| ITEM 9A. | CONTROLS AND PROCEDURES. |
Evaluation of Disclosure Controls and Procedures
We maintain a system of disclosure controls and procedures. The term “disclosure controls and procedures,” as defined by Exchange Act Rule 13a-15(e), means controls and other procedures that are designed to ensure that information required to be disclosed in the reports we file or submit to the SEC under the Securities Exchange Act of 1934, as amended (the “Act”), is recorded, processed, summarized and reported, within the time periods specified in the SEC’s rules and forms. Disclosure controls and procedures include,
-38-
without limitation, controls and procedures designed to ensure that information we are required to disclose in the reports we file or submit to the SEC under the Act is accumulated and communicated to our management, including our principal executive officer and our principal financial officer, or persons performing similar functions, as appropriate to allow timely decisions to be made regarding required disclosure. Each of David L. Cheek, our Chief Executive Officer, and Bert E. Downing, Jr., our Vice President, Chief Financial Officer, Corporate Controller and Treasurer, have evaluated the design and operating effectiveness of our disclosure controls and procedures as of December 31, 2011. Based upon their evaluation, these executive officers have concluded our disclosure controls and procedures were effective as of December 31, 2011.
Internal Control Over Financial Reporting
We also maintain internal control over financial reporting. The term “internal control over financial reporting,” as defined by Exchange Act Rule 13a-15(f), means a process designed by, or under the supervision of, our principal executive and principal financial officers, or persons performing similar functions, and effected by our board of directors, management and other personnel, to provide reasonable assurance regarding the reliability of financial reporting and the preparation of financial statements for external purposes in accordance with GAAP, and includes those policies and procedures that:
| • | pertain to the maintenance of records that in reasonable detail accurately and fairly reflect our transactions and dispositions of our assets, |
| • | provide reasonable assurance transactions are recorded as necessary to permit preparation of financial statements in accordance with GAAP, and that our receipts and expenditures are made only in accordance with authorizations of our management and directors, and |
| • | provide reasonable assurance regarding prevention or timely detection of unauthorized acquisition, use or disposition of our assets that could have a material effect on our Consolidated Financial Statements. |
Section 404 of the Sarbanes-Oxley Act of 2002 requires us to report on internal control over financial reporting in this Annual Report on Form 10-K for the year ended December 31, 2011. Pursuant to the regulations of the SEC, our independent registered public accounting firm is not required to, and did not, audit our internal control over financial reporting as of December 31, 2011.
Changes in Internal Control Over Financial Reporting
There has been no change to our internal control over financial reporting during the quarter ended December 31, 2011 that has materially affected, or is reasonably likely to materially affect, our internal control over financial reporting.
Management’s Report on Internal Control Over Financial Reporting
Our management is responsible for establishing and maintaining adequate internal control over financial reporting, as such term is defined in Exchange Act Rules 13a-15(f) and 15d-15(f). Our evaluation of the effectiveness of our
-39-
internal control over financial reporting is based upon the criteria established in Internal Control – Integrated Framework issued by the Committee of Sponsoring Organizations of the Treadway Commission (commonly referred to as the “COSO” framework). Based on our evaluation under that framework, we have concluded that our internal control over financial reporting was effective as of December 31, 2011.
This annual report does not include an attestation report of our independent registered public accounting firm regarding our internal control over financial reporting. Management’s report was not subject to attestation by our independent registered public accounting firm pursuant to rules of the SEC that permit us to provide only management’s report in this annual report. See “Scope of Management’s Report on Internal Control Over Financial Reporting” above.
Certifications
Our chief executive officer and chief financial officer are required to, among other things, quarterly file certifications with the SEC regarding the quality of our public disclosures, as required by Section 302 of the Sarbanes-Oxley Act of 2002. We have filed the certifications for the quarter ended December 31, 2011 as exhibits 31.1 and 31.2 to this Annual Report on Form 10-K.
| ITEM 9B. | OTHER INFORMATION. |
Not applicable.
-40-
PART III
| ITEM 10. | DIRECTORS, EXECUTIVE OFFICERS AND CORPORATE GOVERNANCE. |
The information required by this Item is incorporated by reference to our definitive Proxy Statement we will file with the SEC pursuant to Regulation 14A within 120 days after the end of the fiscal year covered by this report (the “Keystone Proxy Statement”).
| ITEM 11. | EXECUTIVE COMPENSATION. |
The information required by this Item is incorporated by reference to the Keystone Proxy Statement.
| ITEM 12. | SECURITY OWNERSHIP OF CERTAIN BENEFICIAL OWNERS AND MANAGEMENT AND RELATED STOCKHOLDER MATTERS. |
The information required by this Item is incorporated by reference to the Keystone Proxy Statement.
| ITEM 13. | CERTAIN RELATIONSHIPS AND RELATED TRANSACTIONS AND DIRECTOR INDEPENDENCE. |
The information required by this Item is incorporated by reference to the Keystone Proxy Statement. See also Note 11 to our Consolidated Financial Statements.
| ITEM 14. | PRINCIPAL ACCOUNTING FEES AND SERVICES. |
The information required by this Item is incorporated by reference to the Keystone Proxy Statement.
PART IV
| ITEM 15. | EXHIBITS AND FINANCIAL STATEMENT SCHEDULES. |
| (a) and (c) | Financial Statements and Schedules |
The Registrant
Our Consolidated Financial Statements listed on the accompanying Index of Consolidated Financial Statements (see page F-1) are filed as part of this Annual Report. All financial statement schedules have been omitted either because they are not applicable or required, or the information that would be required to be included is disclosed in the notes to our Consolidated Financial Statements.
| (b) | Exhibits |
Included as exhibits are the items listed in the Exhibit Index. We have retained a signed original of any of these exhibits that contain
-41-
signatures, and we will provide such exhibit to the Commission or its staff upon request. We will furnish a copy of any of the exhibits listed below upon request and payment of $4.00 per exhibit to cover our costs of furnishing the exhibits. Such requests should be directed to the attention of our Corporate Secretary at our corporate offices located at 5430 LBJ Freeway, Suite 1740, Dallas, Texas 75240. Pursuant to Item 601(b)(4)(iii) of Regulation S-K, we will furnish to the Commission upon request any instrument defining the rights of holders of long-term debt issues and other agreements related to indebtedness which do not exceed 10% of our consolidated total assets as of December 31, 2011.
| Exhibit No. |
Exhibit Item | |
| 3.1 | Amended and Restated Certificate of Incorporation of the Registrant dated January 18, 2008, as filed with the Secretary of State of Delaware. (Incorporated by reference to Exhibit 99.1 to the Registrant’s Report on Form 8-K dated January 18, 2008). | |
| 3.2 | Amended and Restated Bylaws of the Registrant dated August 31, 2005. (Incorporated by reference to Exhibit 3.6 to the Registrant’s Annual Report on Form 10-K for the year ended December 31, 2003). | |
| 4.1 | Loan and Security Agreement dated August 31, 2005 by and between the Registrant and Wachovia Capital Finance Corporation (Central). (Incorporated by reference to Exhibit 4.51 to the Registrant’s Annual Report on Form 10-K for the year ended December 31, 2003). | |
| 4.2 | First Amendment to Loan and Security Agreement dated as of June 30, 2006 by and between the Registrant and Wachovia Capital Finance Corporation (Central). (Incorporated by reference to Exhibit 4.7 to the Registrant’s Annual Report on Form 10-K for the year ended December 31, 2006). | |
| 4.3 | Amendment No. 2 to Loan and Security Agreement dated as of March 23, 2007 by and between the Registrant and Wachovia Capital Finance Corporation (Central). (Incorporated by reference to Exhibit 4.8 to the Registrant’s Annual Report on Form 10-K for the year ended December 31, 2006). | |
| 4.4 | Amendment No. 3 to Loan and Security Agreement dated as of October 2, 2009 by and between the Registrant and Wachovia Capital Finance Corporation (Central). (Incorporated by reference to Exhibit 4.1 to the Registrant’s Report on Form 8-K dated October 2, 2009). | |
| 4.5 | Amendment No. 4 to Loan and Security Agreement dated as of August 17, 2010 by and between the Registrant and Wells Fargo Capital Finance, LLC. (Incorporated by reference to Exhibit 4.1 to the Registrant’s Current Report on Form 8-K dated August 17, 2010). | |
-42-
| Exhibit No. |
Exhibit Item | |
| 10.1 | Agreement Regarding Shared Insurance between Registrant, CompX International Inc., Contran Corporation, Kronos Worldwide, Inc., NL Industries, Inc., Titanium Metals Corp. and Valhi, Inc. dated as of October 30, 2003. (Incorporated by reference to Exhibit 10.1 to the Registrant’s Annual Report on Form 10-K for the year ended December 31, 2003). | |
| 10.2 | The Combined Master Retirement Trust between Contran Corporation and Harold C. Simmons as amended and restated effective September 30, 2005. (Incorporated by reference to Exhibit 10.2 to the Registrant’s Annual Report on Form 10-K for the year ended December 31, 2006). | |
| 10.3 | Keystone Consolidated Industries, Inc. Master Retirement Trust I between the Registrant and U.S. Bank National Association as amended and restated effective January 1, 2006. (Incorporated by reference to Exhibit 10.3 to the Registrant’s Annual Report on Form 10-K for the year ended December 31, 2006). | |
| 10.4 | Keystone Consolidated Industries, Inc. Master Retirement Trust II between the Registrant and U.S. Bank National Association as amended and restated effective January 1, 2006. (Incorporated by reference to Exhibit 10.4 to the Registrant’s Annual Report on Form 10-K for the year ended December 31, 2006). | |
| 10.5* | Form of Deferred Compensation Agreement between the Registrant and certain executive officers. (Incorporated by reference to Exhibit 10.1 to the Registrant’s Quarterly Report on Form 10-Q (File No. 1-3919) for the quarter ended March 31, 1999). | |
| 10.6 | Intercorporate Services Agreement dated as of January 1, 2007 by and between Registrant and Contran Corporation. (Incorporated by reference to Exhibit 10.6 to the Registrant’s Annual Report on Form 10-K for the year ended December 31, 2007). | |
| 10.7** | Tax Sharing Agreement between the Registrant and Contran Corporation dated August 16, 2011. | |
| 14.1** | Amended Code of Business Conduct and Ethics dated March 15, 2012. | |
| 18.1** | Letter from PricewaterhouseCoopers LLP regarding the preferable change in the Company’s accounting for inventory effective December 31, 2011. | |
| 21.1** | Subsidiaries of the Company | |
| 31.1** | Certification | |
| 31.2** | Certification | |
| 32.1** | Certification | |
-43-
| Exhibit No. |
Exhibit Item | |
| 101.INS | XBRL Instance Document | |
| 101.SCH | XBRL Taxonomy Extension Schema | |
| 101.CAL | XBRL Taxonomy Extension Calculation Linkbase | |
| 101.DEF | XBRL Taxonomy Extension Definition Linkbase | |
| 101.LAB | XBRL Taxonomy Extension Label Linkbase | |
| 101.PRE | XBRL Taxonomy Extension Presentation Linkbase | |
| * | Management contract, compensatory plan or agreement. |
| ** | Filed herein. |
-44-
SIGNATURES
Pursuant to the requirements of Section 13 or 15(d) of the Securities Exchange Act of 1934, the registrant has duly caused this report to be signed on its behalf by the undersigned and dated March 15, 2012, thereunto duly authorized.
| KEYSTONE CONSOLIDATED INDUSTRIES, INC. (Registrant) |
| /s/ GLENN R. SIMMONS |
| Glenn R. Simmons |
| Chairman of the Board |
Pursuant to the requirements of the Securities Exchange Act of 1934, as amended, this report has been signed below and dated as of March 15, 2012 by the following persons on behalf of the registrant and in the capacities indicated:
| /s/ GLENN R. SIMMONS |
/s/ STEVEN L. WATSON | |||
| Glenn R. Simmons |
Steven L. Watson | |||
| Chairman of the Board |
Director | |||
| /s/ THOMAS E. BARRY |
/s/ DONALD P. ZIMA | |||
| Thomas E. Barry |
Donald P. Zima | |||
| Director |
Director | |||
| /s/ DAVID L. CHEEK |
/s/ BERT E. DOWNING, JR. | |||
| David L. Cheek |
Bert E. Downing, Jr. | |||
| Chief Executive Officer |
Vice President, Chief Financial Officer, Corporate Controller and Treasurer (Principal Accounting and Financial Officer) | |||
-45-
KEYSTONE CONSOLIDATED INDUSTRIES, INC. AND SUBSIDIARIES
ANNUAL REPORT ON FORM 10-K
Items 8, 15(a) and 15(c)
Index of Consolidated Financial Statements
| Page | ||||
| F-2 | ||||
| Consolidated Balance Sheets - December 31, 2010 (restated) and 2011 |
F-3 | |||
| F-5 | ||||
| F-6 | ||||
| F-7 | ||||
| F-8 | ||||
| F-10 | ||||
We omitted Schedules I, II, III and IV because they are not applicable or the required amounts are either not material or are presented in the Notes to the Consolidated Financial Statements.
F-1
REPORT OF INDEPENDENT REGISTERED PUBLIC ACCOUNTING FIRM
To the Stockholders and Board of Directors of Keystone Consolidated Industries, Inc.:
In our opinion, the accompanying consolidated balance sheets and the related consolidated statements of operations, comprehensive income (loss), stockholders’ equity and cash flows present fairly, in all material respects, the financial position of Keystone Consolidated Industries, Inc. and its subsidiaries at December 31, 2010 and 2011, and the results of their operations and their cash flows for each of the three years in the period ended December 31, 2011 in conformity with accounting principles generally accepted in the United States of America. These financial statements are the responsibility of the Company’s management. Our responsibility is to express an opinion on these financial statements based on our audits. We conducted our audits of these statements in accordance with the standards of the Public Company Accounting Oversight Board (United States). Those standards require that we plan and perform the audit to obtain reasonable assurance about whether the financial statements are free of material misstatement. An audit includes examining, on a test basis, evidence supporting the amounts and disclosures in the financial statements, assessing the accounting principles used and significant estimates made by management, and evaluating the overall financial statement presentation. We believe that our audits provide a reasonable basis for our opinion.
As discussed in Note 1 to the consolidated financial statements, the Company changed its method of accounting for inventories in 2011.
Dallas, TX
March 15, 2012
F-2
KEYSTONE CONSOLIDATED INDUSTRIES, INC.
AND SUBSIDIARIES
(In thousands, except share data)
| December 31, | ||||||||
| 2010 | 2011 | |||||||
| ASSETS | (restated) | |||||||
| Current assets: |
||||||||
| Accounts receivable, net of allowances of $2,938 and $173 |
$ | 46,765 | $ | 58,976 | ||||
| Inventories |
70,601 | 88,567 | ||||||
| Deferred income taxes |
8,106 | 12,194 | ||||||
| Income taxes receivable |
2,029 | — | ||||||
| Prepaid expenses and other |
1,474 | 2,033 | ||||||
|
|
|
|
|
|||||
| Total current assets |
128,975 | 161,770 | ||||||
|
|
|
|
|
|||||
| Property, plant and equipment: |
||||||||
| Land |
1,468 | 1,468 | ||||||
| Buildings and improvements |
63,375 | 64,959 | ||||||
| Machinery and equipment |
338,071 | 348,789 | ||||||
| Construction in progress |
4,628 | 5,607 | ||||||
|
|
|
|
|
|||||
| 407,542 | 420,823 | |||||||
| Less accumulated depreciation |
319,533 | 327,820 | ||||||
|
|
|
|
|
|||||
| Net property, plant and equipment |
88,009 | 93,003 | ||||||
|
|
|
|
|
|||||
| Other assets: |
||||||||
| Pension asset |
153,962 | 71,719 | ||||||
| Other, net |
1,533 | 1,455 | ||||||
|
|
|
|
|
|||||
| Total other assets |
155,495 | 73,174 | ||||||
|
|
|
|
|
|||||
| Total assets |
$ | 372,479 | $ | 327,947 | ||||
|
|
|
|
|
|||||
F-3
KEYSTONE CONSOLIDATED INDUSTRIES, INC.
AND SUBSIDIARIES
CONSOLIDATED BALANCE SHEETS (CONTINUED)
(In thousands, except share data)
| December 31, | ||||||||
| 2010 | 2011 | |||||||
| LIABILITIES AND STOCKHOLDERS’ EQUITY | (restated) | |||||||
| Current liabilities: |
||||||||
| Current maturities of long-term debt |
$ | 27,744 | $ | 33,631 | ||||
| Accounts payable |
6,694 | 14,334 | ||||||
| Accrued OPEB cost |
1,279 | 1,220 | ||||||
| Income taxes payable to Contran |
— | 3,769 | ||||||
| Income taxes payable to tax authorities |
— | 713 | ||||||
| Other accrued liabilities |
22,901 | 29,361 | ||||||
|
|
|
|
|
|||||
| Total current liabilities |
58,618 | 83,028 | ||||||
|
|
|
|
|
|||||
| Noncurrent liabilities: |
||||||||
| Long-term debt |
937 | 983 | ||||||
| Accrued pension cost |
— | 21,664 | ||||||
| Accrued OPEB cost |
45,247 | 50,470 | ||||||
| Deferred income taxes |
58,830 | 17,783 | ||||||
| Other |
1,849 | 1,891 | ||||||
|
|
|
|
|
|||||
| Total noncurrent liabilities |
106,863 | 92,791 | ||||||
|
|
|
|
|
|||||
| Stockholders’ equity: |
||||||||
| Common stock $.01 par value; 20,000,000 shares authorized, 12,500,000 and 12,101,932 shares issued, 12,101,932 shares outstanding |
125 | 121 | ||||||
| Additional paid-in capital |
100,111 | 99,024 | ||||||
| Accumulated other comprehensive loss |
(97,307 | ) | (182,093 | ) | ||||
| Retained earnings |
204,865 | 235,076 | ||||||
| Treasury stock, at cost – 398,068 and nil shares |
(796 | ) | — | |||||
|
|
|
|
|
|||||
| Total stockholders’ equity |
206,998 | 152,128 | ||||||
|
|
|
|
|
|||||
| Total liabilities and stockholders’ equity |
$ | 372,479 | $ | 327,947 | ||||
|
|
|
|
|
|||||
Commitments and contingencies (Note 7).
See accompanying Notes to Consolidated Financial Statements.
F-4
KEYSTONE CONSOLIDATED INDUSTRIES, INC.
AND SUBSIDIARIES
CONSOLIDATED STATEMENTS OF OPERATIONS
(In thousands, except per share data)
| Years Ended December 31, | ||||||||||||
| 2009 | 2010 | 2011 | ||||||||||
| (restated) | (restated) | |||||||||||
| Net sales |
$ | 322,347 | $ | 450,745 | $ | 563,985 | ||||||
| Cost of goods sold |
(314,987 | ) | (417,918 | ) | (520,015 | ) | ||||||
|
|
|
|
|
|
|
|||||||
| Gross margin |
7,360 | 32,827 | 43,970 | |||||||||
|
|
|
|
|
|
|
|||||||
| Other operating income (expense): |
||||||||||||
| Selling expense |
(6,343 | ) | (6,758 | ) | (7,351 | ) | ||||||
| General and administrative expense |
(11,869 | ) | (14,096 | ) | (15,238 | ) | ||||||
| Defined benefit pension credit (expense) |
(5,887 | ) | 4,654 | 24,388 | ||||||||
| Other postretirement benefit credit |
4,748 | 5,258 | 5,799 | |||||||||
|
|
|
|
|
|
|
|||||||
| Total other operating income (expense) |
(19,351 | ) | (10,942 | ) | 7,598 | |||||||
|
|
|
|
|
|
|
|||||||
| Operating income (loss) |
(11,991 | ) | 21,885 | 51,568 | ||||||||
|
|
|
|
|
|
|
|||||||
| Nonoperating income (expense): |
||||||||||||
| Interest expense |
(1,725 | ) | (1,863 | ) | (1,218 | ) | ||||||
| Other, net |
1,049 | 637 | 699 | |||||||||
|
|
|
|
|
|
|
|||||||
| Total nonoperating expense |
(676 | ) | (1,226 | ) | (519 | ) | ||||||
|
|
|
|
|
|
|
|||||||
| Income (loss) before income taxes |
(12,667 | ) | 20,659 | 51,049 | ||||||||
| Income tax benefit (expense) |
3,243 | (8,645 | ) | (20,838 | ) | |||||||
|
|
|
|
|
|
|
|||||||
| Net income (loss) |
$ | (9,424 | ) | $ | 12,014 | $ | 30,211 | |||||
|
|
|
|
|
|
|
|||||||
| Basic and diluted income (loss) per share |
$ | (0.78 | ) | $ | 0.99 | $ | 2.50 | |||||
|
|
|
|
|
|
|
|||||||
| Basic and diluted weighted average shares outstanding |
12,102 | 12,102 | 12,102 | |||||||||
|
|
|
|
|
|
|
|||||||
See accompanying Notes to Consolidated Financial Statements.
F-5
KEYSTONE CONSOLIDATED INDUSTRIES, INC.
AND SUBSIDIARIES
CONSOLIDATED STATEMENTS OF COMPREHENSIVE INCOME (LOSS)
(In thousands)
| Years ended December 31, | ||||||||||||
| 2009 | 2010 | 2011 | ||||||||||
| (restated) | (restated) | |||||||||||
| Net income (loss) |
$ | (9,424 | ) | $ | 12,014 | $ | 30,211 | |||||
|
|
|
|
|
|
|
|||||||
| Other comprehensive income (loss), net of tax: |
||||||||||||
| Defined benefit pension plans |
34,857 | 41,656 | (75,807 | ) | ||||||||
| Other postretirement benefit plans |
(6,972 | ) | (6,433 | ) | (8,979 | ) | ||||||
|
|
|
|
|
|
|
|||||||
| Total other comprehensive income (loss), net |
27,885 | 35,223 | (84,786 | ) | ||||||||
|
|
|
|
|
|
|
|||||||
| Comprehensive income (loss) |
$ | 18,461 | $ | 47,237 | $ | (54,575 | ) | |||||
|
|
|
|
|
|
|
|||||||
| Accumulated other comprehensive income (loss), net of tax: |
||||||||||||
| Defined benefit pension plans: |
||||||||||||
| Balance at beginning of year |
$ | (193,258 | ) | $ | (158,401 | ) | $ | (116,745 | ) | |||
| Other comprehensive income (loss): |
||||||||||||
| Net actuarial gain (loss) arising during year |
21,611 | 31,388 | (80,963 | ) | ||||||||
| Amortization of prior service cost |
805 | 761 | 744 | |||||||||
| Amortization of net actuarial losses |
12,441 | 9,507 | 4,412 | |||||||||
|
|
|
|
|
|
|
|||||||
| Balance at end of year |
$ | (158,401 | ) | $ | (116,745 | ) | $ | (192,552 | ) | |||
|
|
|
|
|
|
|
|||||||
| Defined benefit OPEB plans: |
||||||||||||
| Balance at beginning of year |
$ | 32,843 | $ | 25,871 | $ | 19,438 | ||||||
| Other comprehensive income (loss): |
||||||||||||
| Plan amendment |
(49 | ) | — | — | ||||||||
| Net actuarial loss arising during year |
(2,032 | ) | (1,581 | ) | (4,025 | ) | ||||||
| Amortization of prior service credit |
(10,473 | ) | (9,990 | ) | (9,765 | ) | ||||||
| Amortization of net actuarial losses |
5,582 | 5,138 | 4,811 | |||||||||
|
|
|
|
|
|
|
|||||||
| Balance at end of year |
$ | 25,871 | $ | 19,438 | $ | 10,459 | ||||||
|
|
|
|
|
|
|
|||||||
| Total accumulated other comprehensive income (loss): |
||||||||||||
| Balance at beginning of year |
$ | (160,415 | ) | $ | (132,530 | ) | $ | (97,307 | ) | |||
| Other comprehensive income (loss) |
27,885 | 35,223 | (84,786 | ) | ||||||||
|
|
|
|
|
|
|
|||||||
| Balance at end of year |
$ | (132,530 | ) | $ | (97,307 | ) | $ | (182,093 | ) | |||
|
|
|
|
|
|
|
|||||||
See accompanying Notes to Consolidated Financial Statements.
F-6
KEYSTONE CONSOLIDATED INDUSTRIES, INC.
AND SUBSIDIARIES
CONSOLIDATED STATEMENTS OF STOCKHOLDERS’ EQUITY
Years ended December 31, 2009, 2010 and 2011
(In thousands)
| Common stock | Additional | Accumulated other comprehensive income (loss) |
||||||||||||||||||||||||||||||
| Shares outstanding |
Amount | paid-in capital |
Pensions | OPEB | Retained earnings |
Treasury stock |
Total | |||||||||||||||||||||||||
| (restated) | (restated) | |||||||||||||||||||||||||||||||
| Balance – December 31, 2008 |
12,102 | $ | 125 | $ | 100,111 | $ | (193,258 | ) | $ | 32,843 | $ | 202,275 | $ | (796 | ) | $ | 141,300 | |||||||||||||||
| Net loss |
— | — | — | — | — | (9,424 | ) | — | (9,424 | ) | ||||||||||||||||||||||
| Other comprehensive income (loss), net |
— | — | — | 34,857 | (6,972 | ) | — | — | 27,885 | |||||||||||||||||||||||
|
|
|
|
|
|
|
|
|
|
|
|
|
|
|
|
|
|||||||||||||||||
| Balance – December 31, 2009 |
12,102 | 125 | 100,111 | (158,401 | ) | 25,871 | 192,851 | (796 | ) | 159,761 | ||||||||||||||||||||||
| Net income |
— | — | — | — | — | 12,014 | — | 12,014 | ||||||||||||||||||||||||
| Other comprehensive income (loss), net |
— | — | — | 41,656 | (6,433 | ) | — | — | 35,223 | |||||||||||||||||||||||
|
|
|
|
|
|
|
|
|
|
|
|
|
|
|
|
|
|||||||||||||||||
| Balance – December 31, 2010 |
12,102 | 125 | 100,111 | (116,745 | ) | 19,438 | 204,865 | (796 | ) | 206,998 | ||||||||||||||||||||||
| Net income |
— | — | — | — | — | 30,211 | — | 30,211 | ||||||||||||||||||||||||
| Retirement of treasury stock |
— | (4 | ) | (1,248 | ) | — | — | — | 796 | (456 | ) | |||||||||||||||||||||
| Other comprehensive income (loss), net |
— | — | — | (75,807 | ) | (8,979 | ) | — | — | (84,786 | ) | |||||||||||||||||||||
| Other, net |
— | — | 161 | — | — | — | — | 161 | ||||||||||||||||||||||||
|
|
|
|
|
|
|
|
|
|
|
|
|
|
|
|
|
|||||||||||||||||
| Balance – December 31, 2011 |
12,102 | $ | 121 | $ | 99,024 | $ | (192,552 | ) | $ | 10,459 | $ | 235,076 | $ | — | $ | 152,128 | ||||||||||||||||
|
|
|
|
|
|
|
|
|
|
|
|
|
|
|
|
|
|||||||||||||||||
See accompanying Notes to Consolidated Financial Statements.
F-7
KEYSTONE CONSOLIDATED INDUSTRIES, INC.
AND SUBSIDIARIES
CONSOLIDATED STATEMENTS OF CASH FLOWS
(In thousands)
| Years ended December 31, | ||||||||||||
| 2009 | 2010 | 2011 | ||||||||||
| (restated) | (restated) | |||||||||||
| Cash flows from operating activities: |
||||||||||||
| Net income (loss) |
$ | (9,424 | ) | $ | 12,014 | $ | 30,211 | |||||
| Depreciation and amortization |
13,584 | 12,062 | 11,234 | |||||||||
| Deferred income taxes |
977 | 6,553 | 10,476 | |||||||||
| Defined benefit pension expense (credit) |
5,887 | (4,654 | ) | (24,388 | ) | |||||||
| OPEB credit |
(4,748 | ) | (5,258 | ) | (5,799 | ) | ||||||
| OPEB payments |
(1,347 | ) | (1,303 | ) | (1,139 | ) | ||||||
| Bad debt expense |
2,935 | 78 | 196 | |||||||||
| Impairment of inventory |
2,821 | 303 | — | |||||||||
| Other, net |
384 | (233 | ) | 306 | ||||||||
| Change in assets and liabilities: |
||||||||||||
| Accounts receivable |
(17,516 | ) | (5,575 | ) | (12,407 | ) | ||||||
| Inventories |
42,012 | (10,051 | ) | (17,966 | ) | |||||||
| Accounts payable |
(2,199 | ) | 1,117 | 7,640 | ||||||||
| Accrued environmental costs |
(4,395 | ) | 7 | (332 | ) | |||||||
| Other accrued liabilities |
(10,440 | ) | 3,546 | 6,834 | ||||||||
| Income taxes payable to Contran |
— | — | 3,769 | |||||||||
| Income taxes payable to tax authorities |
(5,322 | ) | 2,177 | 2,742 | ||||||||
| Other, net |
114 | 1,152 | (1,114 | ) | ||||||||
|
|
|
|
|
|
|
|||||||
| Net cash provided by operating activities |
13,323 | 11,935 | 10,263 | |||||||||
|
|
|
|
|
|
|
|||||||
| Cash flows from investing activities: |
||||||||||||
| Capital expenditures |
(9,000 | ) | (14,937 | ) | (16,479 | ) | ||||||
| Restricted investments, net |
2,028 | (1 | ) | 2 | ||||||||
| Other, net |
81 | 110 | 73 | |||||||||
|
|
|
|
|
|
|
|||||||
| Net cash used in investing activities |
(6,891 | ) | (14,828 | ) | (16,404 | ) | ||||||
|
|
|
|
|
|
|
|||||||
| Cash flows from financing activities: |
||||||||||||
| Revolving credit facility, net |
9,282 | 15,194 | 5,890 | |||||||||
| Principal payments on other notes payable and long-term debt |
(15,584 | ) | (11,927 | ) | (4 | ) | ||||||
| Deferred financing costs paid |
(130 | ) | (374 | ) | (12 | ) | ||||||
| Transactions with stockholders |
— | — | 267 | |||||||||
|
|
|
|
|
|
|
|||||||
| Net cash provided by(used in)financing activities |
(6,432 | ) | 2,893 | 6,141 | ||||||||
|
|
|
|
|
|
|
|||||||
F-8
KEYSTONE CONSOLIDATED INDUSTRIES, INC.
AND SUBSIDIARIES
CONSOLIDATED STATEMENTS OF CASH FLOWS (CONTINUED)
(In thousands)
| Years ended December 31, | ||||||||||||
| 2009 | 2010 | 2011 | ||||||||||
| (restated) | (restated) | |||||||||||
| Cash and cash equivalents: |
||||||||||||
| Net change from operations, investing and financing activities |
— | — | — | |||||||||
| Balance at beginning of year |
— | — | — | |||||||||
|
|
|
|
|
|
|
|||||||
| Balance at end of year |
$ | — | $ | — | $ | — | ||||||
|
|
|
|
|
|
|
|||||||
| Supplemental disclosures: |
||||||||||||
| Cash paid for: |
||||||||||||
| Interest, net of amounts capitalized |
$ | 1,462 | $ | 1,631 | $ | 1,088 | ||||||
| Income taxes paid (refunded), net |
1,106 | (85 | ) | 4,411 | ||||||||
See accompanying Notes to Consolidated Financial Statements.
F-9
KEYSTONE CONSOLIDATED INDUSTRIES, INC.
AND SUBSIDIARIES
NOTES TO CONSOLIDATED FINANCIAL STATEMENTS
December 31, 2011
Note 1—Summary of significant accounting policies:
Nature of our business. Keystone Consolidated Industries, Inc. (“KCI” or “Keystone”) (OTCQB: KYCN) is a leading domestic producer of steel fabricated wire products, industrial wire and wire rod. We also manufacture wire mesh, coiled rebar, steel bar and other products. Our products are used in the agricultural, industrial, cold drawn, construction, transportation, original equipment manufacturer and retail consumer markets. We are vertically integrated, converting substantially all of our products from billet produced in our steel mini-mill.
Organization. We are majority owned by Contran Corporation (“Contran”), which owned approximately 88% of our outstanding common stock at December 31, 2011. In March 2011, Contran completed a tender offer in which it purchased 1.6 million shares of our common stock and in August 2011, Contran acquired additional shares of our common stock from another stockholder. See Note 10. Substantially all of Contran’s outstanding voting stock is held by trusts established for the benefit of certain children and grandchildren of Harold C. Simmons (for which Mr. Simmons is the sole trustee) or is held directly by Mr. Simmons or other persons or related companies to Mr. Simmons. Consequently, Mr. Simmons may be deemed to control Contran and us.
Basis of Presentation. Our Consolidated Financial Statements include the accounts of Keystone and our majority-owned subsidiaries. All material intercompany accounts and balances have been eliminated. Certain prior year amounts have been reclassified to conform with the current year presentation.
Our fiscal year is either 52 or 53 weeks and ends on the Sunday closest to December 31 of each year. 2009 and 2011 were each 52-week years while 2010 was a 53-week year.
Unless otherwise indicated, references in this report to “we,” “us” or “our” refer to Keystone Consolidated Industries, Inc. and its subsidiaries, taken as a whole.
Management’s Estimates. The preparation of financial statements in conformity with accounting principles generally accepted in the United States (“GAAP”) requires us to make estimates and assumptions that affect the reported amounts of assets and liabilities and disclosure of contingent assets and liabilities at the date of the financial statements, and the reported amount of revenues and expenses during the reporting period. Actual results may differ from previously estimated amounts under different assumptions or conditions.
F-10
Accounts receivable. We provide an allowance for doubtful accounts for known and estimated potential losses arising from our sales to customers based on a periodic review of these accounts.
Inventories and cost of sales; restatement for change in accounting principle. Inventories include the costs for raw materials and the costs to manufacture raw materials into finished goods. Depending on the inventory’s stage of completion, our manufacturing costs can include the costs of packing and finishing, utilities, maintenance and depreciation, inbound and outbound shipping and handling, and salaries and benefits associated with our manufacturing process. We allocate fixed manufacturing overhead based on normal production capacity. Unallocated overhead costs resulting from periods with abnormally low production levels are charged to expense as incurred. As inventory is sold to third parties, we recognize the cost of sales in the same period the sale occurs. We periodically review our inventory for estimated obsolescence or instances when inventory is no longer marketable for its intended use, and we record any write-down equal to the difference between the cost of inventory and its estimated net realizable value based on assumptions about alternative uses, market conditions and other factors.
We state inventories at lower of cost or market net of allowance for obsolete and slow-moving inventories. Prior to December 31, 2011 the last-in, first-out (“LIFO”) method was used to determine the cost of the productive inventories held at our Keystone Steel & Wire (“KSW”) and Engineered Wire Products (“EWP”) segments, while the first-in, first-out (“FIFO”) method was used to determine the productive inventories held at our Keystone-Calumet segment and the average cost method was used to determine the cost of supplies inventories held at all our facilities. At the end of 2011 KSW changed its method for productive inventory costing from LIFO to FIFO, and EWP changed its method for productive inventory costing from LIFO to an average cost method. We believe the FIFO or average cost methods of accounting for inventories provides more meaningful information for financial statement readers as it enhances comparability to our peers and discloses the current value of inventories on our consolidated balance sheet. As required by accounting principles generally accepted in the United States of America (“GAAP”), we have retroactively reflected this change in accounting by restating our financial statements for prior periods. The following tables provide the effect of the accounting change on each financial statement line impacted as of December 31, 2010 and 2011 and for the years ended December 31, 2009, 2010 and 2011. Retained earnings and total stockholder’s equity as of December 31, 2008 and 2009 were higher as a result of this accounting change by $21.7 million and $12.0 million, respectively. There was no impact to our previously-reported amounts of cash flows from operating, investing or financing activities for any period presented as a result of the accounting change.
F-11
| As of December 31, | ||||||||||||||||||||||||
| 2010 | 2011 | |||||||||||||||||||||||
| (In thousands) | ||||||||||||||||||||||||
| As Reported under LIFO |
Change in Accounting Principle Increase (Decrease) |
As Currently Reported |
As Computed under LIFO |
Change in Accounting Principle Increase (Decrease) |
As Currently Reported |
|||||||||||||||||||
| Inventories |
$ | 45,944 | $ | 24,657 | $ | 70,601 | $ | 60,570 | $ | 27,997 | $ | 88,567 | ||||||||||||
| Current deferred income taxes |
17,501 | (9,395 | ) | 8,106 | 22,971 | (10,777 | ) | 12,194 | ||||||||||||||||
| Total current assets |
113,713 | 15,262 | 128,975 | 144,550 | 17,220 | 161,770 | ||||||||||||||||||
| Total assets |
357,217 | 15,262 | 372,479 | 310,727 | 17,220 | 327,947 | ||||||||||||||||||
| Retained earnings |
189,603 | 15,262 | 204,865 | 217,856 | 17,220 | 235,076 | ||||||||||||||||||
| Total stockholders’ equity |
191,736 | 15,262 | 206,998 | 134,908 | 17,220 | 152,128 | ||||||||||||||||||
| Total liabilities and stockholders’ equity |
357,217 | 15,262 | 372,479 | 310,727 | 17,220 | 327,947 | ||||||||||||||||||
| Years ended December 31, | ||||||||||||||||||||||||||||||||||||
| 2009 | 2010 | 2011 | ||||||||||||||||||||||||||||||||||
| (In thousands) | ||||||||||||||||||||||||||||||||||||
| As Reported under LIFO |
Change in Accounting Principle Increase (Decrease) |
As Currently Reported |
As Reported under LIFO |
Change in Accounting Principle Increase (Decrease) |
As Currently Reported |
As Computed under LIFO |
Change in Accounting Principle Increase (Decrease) |
As Currently Reported |
||||||||||||||||||||||||||||
| Cost of goods sold |
$ | 299,787 | $ | 15,200 | $ | 314,987 | $ | 423,341 | $ | (5,423 | ) | $ | 417,918 | $ | 523,355 | $ | (3,340 | ) | $ | 520,015 | ||||||||||||||||
| Gross margin |
22,560 | (15,200 | ) | 7,360 | 27,404 | 5,423 | 32,827 | 40,630 | 3,340 | 43,970 | ||||||||||||||||||||||||||
| Operating income (loss) |
3,209 | (15,200 | ) | (11,991 | ) | 16,462 | 5,423 | 21,885 | 48,228 | 3,340 | 51,568 | |||||||||||||||||||||||||
| Income (loss) before income taxes |
2,533 | (15,200 | ) | (12,667 | ) | 15,236 | 5,423 | 20,659 | 47,709 | 3,340 | 51,049 | |||||||||||||||||||||||||
| Income tax expense (benefit) |
2,292 | (5,535 | ) | (3,243 | ) | 6,493 | 2,152 | 8,645 | 19,456 | 1,382 | 20,838 | |||||||||||||||||||||||||
| Net income (loss) |
241 | (9,665 | ) | (9,424 | ) | 8,743 | 3,271 | 12,014 | 28,253 | 1,958 | 30,211 | |||||||||||||||||||||||||
| Basic and diluted income (loss) per share |
0.02 | (0.80 | ) | (0.78 | ) | 0.72 | 0.27 | 0.99 | 2.34 | 0.16 | 2.50 | |||||||||||||||||||||||||
| Comprehensive income (loss) |
28,126 | (9,665 | ) | 18,461 | 43,966 | 3,271 | 47,237 | (56,533 | ) | 1,958 | (54,575 | ) | ||||||||||||||||||||||||
Property, plant and equipment and depreciation expense. Property, plant and equipment are stated at cost. Depreciation for financial reporting purposes is computed using principally the straight-line method over the estimated useful lives of 10 to 30 years for buildings and improvements and three to 15 years for machinery and equipment. Accelerated depreciation methods are used for income tax purposes, as permitted. Depreciation expense for financial reporting purposes was $13.6 million, $12.1 million and $11.2 million during 2009, 2010 and 2011, respectively. Upon sale or retirement of an asset, the related cost and accumulated depreciation are removed from the accounts and any gain or loss is recognized in income currently.
F-12
We expense expenditures for maintenance, repairs and minor renewals as incurred, including planned major maintenance. We capitalize expenditures for major improvements. We capitalize interest costs related to major long-term capital projects and renewals as a component of construction costs. We did not capitalize any material interest costs in 2009, 2010 or 2011.
We perform impairment tests when events or changes in circumstances indicate the carrying value of our property, plant and equipment may not be recoverable. We consider all relevant factors. We perform the impairment test by comparing the estimated future undiscounted cash flows associated with the asset to the asset’s net carrying value to determine if an impairment exists.
Long-term debt and deferred financing costs. We state long-term debt net of any unamortized original issue premium or discount. We classify amortization of deferred financing costs and any premium or discount associated with the issuance of indebtedness in interest expense, and compute such amortization by the interest method over the term of the applicable issue.
Pension plans and other postretirement benefits. Accounting and funding policies for our pension plans and other postretirement benefits (“OPEB”) are described in Note 6.
Environmental liabilities. We record liabilities related to environmental remediation when estimated future expenditures are probable and reasonably estimable. If we are unable to determine that a single amount in an estimated range of probable future expenditures is more likely, we record the minimum amount of the range. Such accruals are adjusted as further information becomes available or circumstances change. We do not discount costs of future expenditures for environmental remediation obligations to their present value due to the uncertain timeframe of payout. We expense any legal costs related to environmental remediation as incurred. We record recoveries of environmental remediation costs from other parties as assets when their receipt is deemed probable. We did not have any such assets recorded at December 31, 2010 or 2011. See Note 7.
Income taxes. In August 2011, we became a member of Contran’s consolidated U.S. federal income tax group (the “Contran Tax Group”) pursuant to Contran’s purchase of additional shares of our common stock which resulted in Contran’s ownership interest increasing to more than 80%. See Note 10. We also file consolidated income tax returns with Contran in various U.S. state jurisdictions. As a member of the Contran Tax Group, we are now a party to a tax sharing agreement with Contran which provides that, beginning in August 2011, we compute our tax provision for U.S. income taxes on a separate-company basis using the tax elections made by Contran. Pursuant to the tax sharing agreement, we make payments to, or receive payments from, Contran in amounts we would have paid to or received from the U.S. Internal Revenue Service or the applicable state tax authority had we not been a member of the Contran Tax Group for all periods after August 2011. We paid Contran $.2 million for income taxes in 2011.
F-13
Deferred income tax assets and liabilities are recognized for the expected future tax consequences of temporary differences between the income tax and financial reporting carrying amounts of assets and liabilities. We periodically evaluate our deferred tax assets and adjust any related valuation allowance based on the estimate of the amount of such deferred tax assets which we believe does not meet the more-likely-than-not recognition criteria.
We record a reserve for uncertain tax positions for tax positions where we believe it is more-likely-than-not our position will not prevail with the applicable tax authorities. Our reserve for uncertain tax positions was nil in each of 2009, 2010 and 2011.
Net sales. We record sales when products have shipped and title and other risks and rewards of ownership have passed to the customer. We include amounts charged to customers for shipping and handling in net sales. Our sales are stated net of volume rebates and discounts for price and early payment. We report taxes assessed by a governmental authority such as sales, use, value added and excise taxes on a net basis (i.e., we do not recognize these taxes in either our revenues or in our costs and expenses).
Selling, general and administrative expenses. Selling, general and administrative expenses include costs related to marketing, sales, distribution, environmental costs and administrative functions such as accounting, treasury and finance, and includes costs for salaries and benefits, travel and entertainment, promotional materials and professional fees. Advertising costs, expensed as incurred, were $1.1 million, $1.4 million and $1.8 million in 2009, 2010 and 2011, respectively.
Note 2—Business segment information:
Our operating segments are organized by our manufacturing facilities and include three reportable segments. Each operating segment is separately managed, and each operating segment represents a strategic business unit offering different products as follows:
| • | Keystone Steel & Wire (“KSW”), located in Peoria, Illinois, operates an electric arc furnace mini-mill, rod mill, industrial wire mill and wire fabrication facilities and manufactures and sells wire rod, coiled rebar, industrial wire, fabricated wire and other products to agricultural, industrial, construction, commercial, original equipment manufacturers and retail consumer markets; |
| • | Engineered Wire Products, Inc. (“EWP”), located in Upper Sandusky, Ohio, primarily manufactures and sells wire mesh in both roll and sheet form that is utilized as reinforcement in concrete construction products including pipe, pre-cast boxes and applications for use in roadways, buildings and bridges; and |
| • | Keystone-Calumet, Inc. (“Calumet”), located in Chicago Heights, Illinois, manufactures and sells merchant and special bar quality products and special sections in carbon and alloy steel grades for use in agricultural, cold drawn, construction, industrial chain, service centers and transportation applications as well as in the production of a wide variety of products by original equipment manufacturers. |
F-14
Calumet’s primary raw material is billet and EWP’s primary raw material is wire rod. Both Calumet and EWP source the majority of their primary raw material requirements from KSW.
As discussed in Note 1, at the end of 2011 KSW changed its method for productive inventory costing from LIFO to FIFO and EWP changed its method for productive inventory costing from LIFO to an average cost method. The impact of this change on their operating income is set forth in the following table.
| KSW | EWP | |||||||
| (In thousands) | ||||||||
| Year ended December 31, 2009: |
||||||||
| Operating income under LIFO |
$ | 5,976 | $ | 1,405 | ||||
| Change in accounting principle |
(9,125 | ) | (6,075 | ) | ||||
|
|
|
|
|
|||||
| Operating income (loss) as currently reported |
$ | (3,149 | ) | (4,670 | ) | |||
|
|
|
|
|
|||||
| Year ended December 31, 2010: |
||||||||
| Operating income (loss) under LIFO |
$ | 10,604 | $ | (1,278 | ) | |||
| Change in accounting principle |
4,507 | 916 | ||||||
|
|
|
|
|
|||||
| Operating income (loss) as currently reported |
$ | 15,111 | $ | (362 | ) | |||
|
|
|
|
|
|||||
| Year ended December 31, 2011: |
||||||||
| Operating income (loss) as computed under LIFO |
$ | 21,684 | $ | (882 | ) | |||
| Change in accounting principle |
618 | 2,722 | ||||||
|
|
|
|
|
|||||
| Operating income as currently reported |
$ | 22,302 | $ | 1,840 | ||||
|
|
|
|
|
|||||
The accounting policies of our segments are the same as those described in the summary of significant accounting policies except that no defined benefit pension or OPEB expense or credits are recognized and the elimination of intercompany profit or loss on ending inventory balances is not allocated to each segment. Sales between reportable segments are generally recorded at prices that approximate market prices to third-party customers.
F-15
| Years ended December 31, | ||||||||||||
| 2009 | 2010 | 2011 | ||||||||||
| (restated) | (restated) | |||||||||||
| (In thousands) | ||||||||||||
| Net sales: |
||||||||||||
| KSW |
$ | 298,219 | $ | 433,729 | $ | 544,011 | ||||||
| EWP |
37,575 | 41,310 | 55,928 | |||||||||
| Calumet |
11,127 | 22,987 | 30,905 | |||||||||
| Elimination of intersegment sales |
(24,574 | ) | (47,281 | ) | (66,859 | ) | ||||||
|
|
|
|
|
|
|
|||||||
| Total net sales |
$ | 322,347 | $ | 450,745 | $ | 563,985 | ||||||
|
|
|
|
|
|
|
|||||||
| Operating income (loss): |
||||||||||||
| KSW |
$ | (3,149 | ) | $ | 15,111 | $ | 22,302 | |||||
| EWP |
(4,670 | ) | (362 | ) | 1,840 | |||||||
| Calumet |
(3,703 | ) | 97 | 149 | ||||||||
| Defined benefit pension credit (expense) |
(5,887 | ) | 4,654 | 24,388 | ||||||||
| OPEB credit |
4,748 | 5,258 | 5,799 | |||||||||
|
Other(1) |
670 | (2,873 | ) | (2,910 | ) | |||||||
|
|
|
|
|
|
|
|||||||
| Total operating income (loss) |
(11,991 | ) | 21,885 | 51,568 | ||||||||
| Nonoperating income (expense): |
||||||||||||
| Interest expense |
(1,725 | ) | (1,863 | ) | (1,218 | ) | ||||||
| Other, net |
1,049 | 637 | 699 | |||||||||
|
|
|
|
|
|
|
|||||||
| Income (loss) before income taxes |
$ | (12,667 | ) | $ | 20,659 | $ | 51,049 | |||||
|
|
|
|
|
|
|
|||||||
| (1) | Other items primarily consist of the elimination of intercompany profit or loss on ending inventory balances and general corporate expenses. |
Throughout 2009 Calumet determined it would not be able to recover the cost of certain inventory items in future selling prices and recognized impairment charges of $2.8 million to reduce the inventory to its net realizable value. Nominal impairment charges were incurred during 2010 and none were incurred during 2011. These impairment charges are included in cost of goods sold.
On July 2, 2009, the Illinois Environmental Protection Agency (the “IEPA”) approved the completion of the soil portion of the remediation plan of certain waste management units at KSW which resulted in a $4.2 million decrease (recorded as a credit to general administrative expense) in KSW’s environmental reserves during 2009. See Note 7.
F-16
During 2009, KSW recorded bad debt expense of $2.9 million primarily due to a Chapter 11 filing by one of their customers. Nominal amounts of bad debt expense were incurred during 2010 and 2011. Bad debt expense is included in general and administrative expense.
Substantially all of our assets are located in the United States. Segment assets are comprised of all assets attributable to each reportable operating segment. Corporate assets consist principally of the pension asset, restricted investments, deferred tax assets and corporate property, plant and equipment.
| December 31, | ||||||||||||
| 2009 | 2010 | 2011 | ||||||||||
| (restated) | (restated) | |||||||||||
| (In thousands) | ||||||||||||
| Total assets: |
||||||||||||
|
KSW(1) |
$ | 152,061 | $ | 165,350 | $ | 192,270 | ||||||
|
EWP(1) |
23,302 | 23,757 | 28,069 | |||||||||
| Calumet |
11,940 | 14,820 | 18,865 | |||||||||
| Corporate(1) |
89,772 | 168,552 | 88,743 | |||||||||
|
|
|
|
|
|
|
|||||||
| Total |
$ | 277,075 | $ | 372,479 | $ | 327,947 | ||||||
|
|
|
|
|
|
|
|||||||
| (1) | As discussed above, at the end of 2011 KSW changed their method for productive inventory costing from the LIFO method to FIFO and EWP changed their method for productive inventory costing from the LIFO method to an average cost method. As a result of the accounting change, consolidated total assets increased by their LIFO reserves net of related deferred taxes as of the end of each year. Total assets at the segment level increased by their respective LIFO reserves. KSW’s LIFO reserve was $15.4 million, $19.9 million and $20.6 million as of December 31, 2009, 2010 and 2011, respectively. EWP’s LIFO reserve was $3.8 million, $4.7 million and $7.4 million as of December 31, 2009, 2010 and 2011, respectively. The related deferred tax asset balance recorded at Corporate was $7.2 million, $9.4 million and $10.8 million as of December 31, 2009, 2010 and 2011, respectively. |
F-17
| Years ended December 31, | ||||||||||||
| 2009 | 2010 | 2011 | ||||||||||
| (In thousands) | ||||||||||||
| Depreciation and amortization: |
||||||||||||
| KSW |
$ | 11,362 | $ | 9,874 | $ | 9,160 | ||||||
| EWP |
1,674 | 1,593 | 1,397 | |||||||||
| Calumet |
435 | 481 | 576 | |||||||||
| Corporate |
113 | 114 | 101 | |||||||||
|
|
|
|
|
|
|
|||||||
| Total |
$ | 13,584 | $ | 12,062 | $ | 11,234 | ||||||
|
|
|
|
|
|
|
|||||||
| Capital expenditures: |
||||||||||||
| KSW |
$ | 8,094 | $ | 13,456 | $ | 14,720 | ||||||
| EWP |
375 | 528 | 289 | |||||||||
| Calumet |
531 | 953 | 1,470 | |||||||||
|
|
|
|
|
|
|
|||||||
| Total |
$ | 9,000 | $ | 14,937 | $ | 16,479 | ||||||
|
|
|
|
|
|
|
|||||||
Most of our products are distributed in the Midwestern, Southwestern and Southeastern regions of the United States. Information concerning geographic concentration of net sales based on location of customer is as follows:
| Years ended December 31, | ||||||||||||
| 2009 | 2010 | 2011 | ||||||||||
| (In thousands) | ||||||||||||
| United States |
$ | 319,390 | $ | 446,972 | $ | 559,510 | ||||||
| Canada |
2,169 | 2,982 | 3,669 | |||||||||
| Other |
788 | 791 | 806 | |||||||||
|
|
|
|
|
|
|
|||||||
| Total |
$ | 322,347 | $ | 450,745 | $ | 563,985 | ||||||
|
|
|
|
|
|
|
|||||||
Note 3—Inventories, net:
| December 31, | ||||||||
| 2010 | 2011 | |||||||
| (restated) | ||||||||
| (In thousands) | ||||||||
| Raw materials |
$ | 3,957 | $ | 6,995 | ||||
| Billet |
5,832 | 12,702 | ||||||
| Wire rod |
7,042 | 7,155 | ||||||
| Work in process |
5,030 | 6,771 | ||||||
| Finished product |
22,821 | 29,228 | ||||||
| Supplies |
25,919 | 25,716 | ||||||
|
|
|
|
|
|||||
| Total |
$ | 70,601 | $ | 88,567 | ||||
|
|
|
|
|
|||||
F-18
As discussed in Note 1, at the end of 2011, KSW changed their method for productive inventory costing from LIFO to FIFO and EWP changed their method for productive inventory costing from LIFO to an average cost method. As a result of the accounting change, our net inventory balance increased by $24.7 million at December 31, 2010 (representing the elimination of our aggregate LIFO reserve at such date).
Note 4—Notes payable and long-term debt:
| December 31, | ||||||||
| 2010 | 2011 | |||||||
| (In thousands) | ||||||||
| Wells Fargo revolving credit facility |
$ | 27,740 | $ | 33,630 | ||||
| Other |
941 | 984 | ||||||
|
|
|
|
|
|||||
| Total debt |
28,681 | 34,614 | ||||||
| Less current maturities |
27,744 | 33,631 | ||||||
|
|
|
|
|
|||||
| Total long-term debt |
$ | 937 | $ | 983 | ||||
|
|
|
|
|
|||||
Our revolving credit facility with Wells Fargo, as amended, provides for borrowings up to $70 million and matures in August 2015. Outstanding borrowings bear interest at prime plus a margin ranging from 0.25% to 0.5%, for prime-based borrowings, or LIBOR plus a margin ranging from 2.00% to 2.25%, for LIBOR-based borrowings (the weighted average interest rate was 2.8% at December 31, 2011).
The amount of available borrowings under our revolving credit facility is based on formula-determined amounts of trade receivables and inventories, less the amount of outstanding letters of credit. At December 31, 2011, letters of credit for $5.0 million were outstanding and excess availability under the Wells Fargo Facility was $30.9 million. In the event our excess availability falls below $10.0 million the facility agreement imposes certain limitations on our ability to pay dividends or repurchase our common stock and requires us to maintain a minimum fixed charge coverage ratio, defined in the agreement as earnings before interest, taxes, depreciation, amortization, restructuring costs, pension and OPEB expense or credits, less OPEB payments, divided by the sum of interest expense, tax payments, principal payments on certain debt and certain capital expenditures, of 1.0. As of December 31, 2011 our fixed charge coverage ratio was 1.5.
The Wells Fargo Facility is collateralized by substantially all of our operating assets. In the event our financial covenants were to become applicable, failure to comply with the covenants could result in the acceleration of the outstanding balance under the facility prior to its stated maturity date. Additionally, Wells Fargo can restrict our ability to incur additional secured indebtedness and can declare a default under the credit facility in the event of, among other things, a material adverse change in our business.
F-19
The Wells Fargo Facility requires our daily net cash receipts be used to reduce the outstanding borrowings, which results in us maintaining zero cash balances so long as there is an outstanding balance under this facility. Accordingly, any outstanding balances under the Wells Fargo Facility are always classified as a current liability, regardless of the maturity date of the facility. In the aggregate future maturities of debt table below we have presented the payment of the revolving credit facility balance as of December 31, 2011, as being due during 2012 as opposed to its maturity date in 2015.
The aggregate future maturities of debt at December 31, 2011 are shown in the following table.
| Year ending December 31, |
Amount | |||
| (In thousands) | ||||
| 2012 |
$ | 33,631 | ||
| 2014 |
1,100 | |||
|
|
|
|||
| Total |
$ | 34,731 | ||
|
|
|
|||
Note 5—Income taxes:
Summarized below are (i) the differences between the provision for income taxes and the amounts that would be expected using the U. S. federal statutory income tax rate of 35%, and (ii) the components of the comprehensive provision for income taxes.
| Years ended December 31, | ||||||||||||
| 2009 | 2010 | 2011 | ||||||||||
| (restated | ) | (restated | ) | |||||||||
| (In thousands) | ||||||||||||
| Expected tax provision (benefit), at statutory rate |
$ | (4,432 | ) | $ | 7,231 | $ | 17,868 | |||||
| U.S. state income taxes, net |
1,184 | 1,372 | 3,298 | |||||||||
| Other, net |
5 | 42 | (328 | ) | ||||||||
|
|
|
|
|
|
|
|||||||
| Provision (benefit) for income taxes |
$ | (3,243 | ) | $ | 8,645 | $ | 20,838 | |||||
|
|
|
|
|
|
|
|||||||
| Provision for income taxes: |
||||||||||||
| Currently payable (refundable): |
||||||||||||
| U.S. federal |
$ | (4,246 | ) | $ | 1,984 | $ | 8,800 | |||||
| U.S. state |
26 | 108 | 1,562 | |||||||||
|
|
|
|
|
|
|
|||||||
| Net currently payable (refundable) |
(4,220 | ) | 2,092 | 10,362 | ||||||||
| Deferred income taxes, net |
977 | 6,553 | 10,476 | |||||||||
|
|
|
|
|
|
|
|||||||
| Provision (benefit) for income taxes |
$ | (3,243 | ) | $ | 8,645 | $ | 20,838 | |||||
|
|
|
|
|
|
|
|||||||
| Comprehensive provision for income taxes allocable to: |
||||||||||||
| Net income (loss) |
$ | (3,243 | ) | $ | 8,645 | $ | 20,838 | |||||
| Other comprehensive income (loss): |
||||||||||||
| Pension plans |
18,505 | 25,771 | (49,721 | ) | ||||||||
| OPEB plans |
(3,793 | ) | (3,980 | ) | (5,890 | ) | ||||||
| Additional paid-in capital: |
||||||||||||
| Retirement of treasury stock |
— | — | 456 | |||||||||
| Transactions with stockholders |
— | — | 106 | |||||||||
|
|
|
|
|
|
|
|||||||
| $ | 11,469 | $ | 30,436 | $ | (34,211 | ) | ||||||
|
|
|
|
|
|
|
|||||||
F-20
The components of the net deferred tax asset/(liability) are summarized below.
| December 31, | ||||||||||||||||
| 2010 | 2011 | |||||||||||||||
| Assets | Liabilities | Assets | Liabilities | |||||||||||||
| (restated) | ||||||||||||||||
| (In thousands) | ||||||||||||||||
| Tax effect of temporary differences relating to: |
||||||||||||||||
| Inventories |
$ | — | $ | (2,365 | ) | $ | 4,587 | $ | — | |||||||
| Property and equipment |
— | (14,710 | ) | — | (18,612 | ) | ||||||||||
| Pension asset |
— | (59,661 | ) | — | (28,197 | ) | ||||||||||
| Accrued pension cost |
— | — | 8,430 | |||||||||||||
| Accrued OPEB cost |
18,013 | — | 20,445 | — | ||||||||||||
| Accrued employee benefits |
4,292 | — | 5,604 | — | ||||||||||||
| Accrued insurance |
1,293 | — | 1,389 | — | ||||||||||||
| Other accrued liabilities |
828 | — | 555 | — | ||||||||||||
| Other deductible differences |
1,586 | — | 210 | — | ||||||||||||
|
|
|
|
|
|
|
|
|
|||||||||
| Gross deferred tax assets / (liabilities) |
26,012 | (76,736 | ) | 41,220 | (46,809 | ) | ||||||||||
| Reclassification, principally netting by tax jurisdiction |
(17,906 | ) | 17,906 | (29,026 | ) | 29,026 | ||||||||||
|
|
|
|
|
|
|
|
|
|||||||||
| Net deferred tax asset / (liability) |
8,106 | (58,830 | ) | 12,194 | (17,783 | ) | ||||||||||
| Less current deferred tax asset |
(8,106 | ) | — | (12,194 | ) | — | ||||||||||
|
|
|
|
|
|
|
|
|
|||||||||
| Noncurrent deferred tax liability |
$ | — | $ | (58,830 | ) | — | $ | (17,783 | ) | |||||||
|
|
|
|
|
|
|
|
|
|||||||||
Our provision for income taxes during 2011 includes a $1.0 million non-cash charge for state deferred income taxes. The non-cash charge is related to an increase in our effective state income tax rate primarily as a result of an increase in the tax rate of the State of Illinois.
We file income tax returns in various U.S. federal, state and local jurisdictions. Our income tax returns prior to 2008 are generally considered closed to examination by applicable tax authorities.
As discussed in Note 1, at the end of 2011, KSW changed their method for productive inventory costing from LIFO to FIFO and EWP changed their method for productive inventory costing from LIFO to an average cost method. As a result of the accounting change, our provision for income taxes for the year ended December 31, 2009 decreased $5.5 million resulting in a benefit for income taxes, our provision for income taxes for the years ended December 31, 2010 and 2011 increased by $2.2 million and $1.4 million, respectively, and our current deferred tax asset balance as of December 31, 2010 and 2011 decreased by $9.4 million and $10.8 million, respectively.
F-21
Note 6—Pensions and other postretirement benefits:
We sponsor several pension plans and OPEB plans for certain active employees and certain retirees. The benefits under our defined benefit plans are based upon years of service and employee compensation.
Employer Contributions and Plan Benefit Payments
Our funding policy is to contribute annually the minimum amount required under ERISA regulations plus additional amounts as we deem appropriate. We currently do not anticipate being required to fund any contributions to our defined benefit pension plans during 2012. Additionally, we are permitted, but not required, to create supplemental benefits under one of our defined benefit pension plans in lieu of us paying the benefits granted by one of our OPEB plans. We have the ability to decide whether or not to exercise such right on a year-by-year basis. When we do so, our accumulated OPEB benefit obligation is reduced, and our accumulated defined benefit pension obligation is increased by the amount of OPEB benefits that will be paid via supplemental pension benefits as presented in the Funded Status section below.
Benefit payments to plan participants, which reflect expected future service, as appropriate, are expected to be the equivalent of:
| Pension Benefits |
Other Benefits |
|||||||
| (In thousands) | ||||||||
|
2012(1) |
$ | 31,388 | $ | 1,220 | ||||
| 2013 |
28,631 | 4,026 | ||||||
| 2014 |
28,632 | 3,943 | ||||||
| 2015 |
28,607 | 3,869 | ||||||
| 2016 |
28,658 | 3,791 | ||||||
| Next 5 years |
142,016 | 17,646 | ||||||
| (1) | Pension benefits in 2012 include expected supplemental pension benefits of $2.9 million, created in lieu of the payments that would have been due under one of our OPEB plans, which are excluded from the other benefit payments. |
F-22
Funded Status
The following tables provide the funded status of our plans and a reconciliation of the changes in our plans’ projected benefit obligations and fair value of assets for the years ended December 31, 2010 and 2011:
| Pension Benefits | Other Benefits | |||||||||||||||
| 2010 | 2011 | 2010 | 2011 | |||||||||||||
| (In thousands) | ||||||||||||||||
| Change in projected benefit obligations (“PBO”): |
||||||||||||||||
| Balance at beginning of the year |
$ | 377,337 | $ | 394,556 | $ | 45,601 | $ | 46,526 | ||||||||
| Service cost |
3,218 | 3,419 | 106 | 118 | ||||||||||||
| Interest cost |
20,161 | 19,151 | 2,489 | 2,288 | ||||||||||||
| Actuarial losses |
21,634 | 64,391 | 2,561 | 6,664 | ||||||||||||
| Benefits paid |
(30,720 | ) | (30,561 | ) | (1,305 | ) | (1,139 | ) | ||||||||
| OPEB benefits extinguished by increased pension benefits |
2,926 | 2,767 | (2,926 | ) | (2,767 | ) | ||||||||||
|
|
|
|
|
|
|
|
|
|||||||||
| Balance at end of the year |
$ | 394,556 | $ | 453,723 | $ | 46,526 | $ | 51,690 | ||||||||
|
|
|
|
|
|
|
|
|
|||||||||
| Change in plan assets: |
||||||||||||||||
| Fair value at beginning of the year |
$ | 462,143 | $ | 548,518 | $ | — | $ | — | ||||||||
| Actual return (loss) on plan assets |
117,095 | (14,179 | ) | — | — | |||||||||||
| Employer contributions |
— | — | 1,305 | 1,139 | ||||||||||||
| Benefits paid |
(30,720 | ) | (30,561 | ) | (1,305 | ) | (1,139 | ) | ||||||||
|
|
|
|
|
|
|
|
|
|||||||||
| Fair value at end of the year |
$ | 548,518 | $ | 503,778 | $ | — | $ | — | ||||||||
|
|
|
|
|
|
|
|
|
|||||||||
| Funded status |
$ | 153,962 | $ | 50,055 | $ | (46,526 | ) | $ | (51,690 | ) | ||||||
|
|
|
|
|
|
|
|
|
|||||||||
| Amounts recognized in the Consolidated Balance Sheets: |
||||||||||||||||
| Pension asset |
$ | 153,962 | $ | 71,719 | $ | — | $ | — | ||||||||
| Noncurrent accrued pension costs |
— | (21,664 | ) | — | — | |||||||||||
| Accrued OPEB costs: |
||||||||||||||||
| Current |
— | — | (1,279 | ) | (1,220 | ) | ||||||||||
| Noncurrent |
— | — | (45,247 | ) | (50,470 | ) | ||||||||||
|
|
|
|
|
|
|
|
|
|||||||||
| $ | 153,962 | $ | 50,055 | (46,526 | ) | $ | (51,690 | ) | ||||||||
|
|
|
|
|
|
|
|
|
|||||||||
| Accummulated other comprehensive loss (income): |
||||||||||||||||
| Prior service cost (credit) |
8,897 | 7,664 | (116,505 | ) | (100,335 | ) | ||||||||||
| Actuarial losses |
180,073 | 306,835 | 85,041 | 83,741 | ||||||||||||
|
|
|
|
|
|
|
|
|
|||||||||
| 188,970 | 314,499 | (31,464 | ) | (16,594 | ) | |||||||||||
|
|
|
|
|
|
|
|
|
|||||||||
| Total |
$ | 342,932 | $ | 364,554 | $ | (77,990 | ) | $ | (68,284 | ) | ||||||
|
|
|
|
|
|
|
|
|
|||||||||
| Accumulated benefit obligations (“ABO”) of pension plans |
$ | 389,136 | $ | 446,019 | ||||||||||||
|
|
|
|
|
|||||||||||||
| Pension plan for which the accumulated benefit obligation exceeds plan assets: |
||||||||||||||||
| Projected benefit obligation |
$ | — | $ | 117,532 | ||||||||||||
| Accumulated benefit obligation |
— | 109,829 | ||||||||||||||
| Fair value of plan assets |
— | 95,868 | ||||||||||||||
F-23
The amounts shown in the table above for unamortized actuarial gains and losses and prior service credits and costs at December 31, 2010 and 2011 have not been recognized as components of our periodic defined benefit cost as of those dates. These amounts will be recognized as components of our periodic defined benefit cost in future years. These amounts, net of deferred income taxes, are recognized in our accumulated other comprehensive income (loss) at December 31, 2010 and 2011. We expect approximately $17.8 million and $1.2 million of the unamortized actuarial losses and prior service cost, respectively, will be recognized as components of our periodic defined benefit pension credit in 2012 and that $7.7 million and $16.2 million of the unamortized actuarial losses and prior service credits, respectively, will be recognized as components of our OPEB credit in 2012. The table below details the changes in other comprehensive income (loss) for the years ended December 31, 2009, 2010 and 2011.
| Pension Benefits | Other Benefits | |||||||||||||||||||||||
| 2009 | 2010 | 2011 | 2009 | 2010 | 2011 | |||||||||||||||||||
| (In thousands) | ||||||||||||||||||||||||
| Changes in plan assets and benefit obligations recognized in other comprehensive income (loss): |
||||||||||||||||||||||||
| Plan amendment |
$ | — | $ | — | $ | — | $ | (76 | ) | $ | — | $ | — | |||||||||||
| Net actuarial gain (loss) arising during the year |
33,085 | 50,808 | (134,066 | ) | (3,138 | ) | (2,561 | ) | (6,664 | ) | ||||||||||||||
| Amortization of unrecognized: |
||||||||||||||||||||||||
| Prior service cost (credit) |
1,232 | 1,232 | 1,232 | (16,170 | ) | (16,170 | ) | (16,170 | ) | |||||||||||||||
| Net actuarial losses |
19,045 | 15,389 | 7,306 | 8,619 | 8,317 | 7,965 | ||||||||||||||||||
|
|
|
|
|
|
|
|
|
|
|
|
|
|||||||||||||
| Total |
$ | 53,362 | $ | 67,429 | $ | (125,528 | ) | $ | (10,765 | ) | $ | (10,413 | ) | $ | (14,869 | ) | ||||||||
|
|
|
|
|
|
|
|
|
|
|
|
|
|||||||||||||
Net periodic defined benefit cost or credit
The components of our net periodic defined benefit cost or credits are presented in the table below. During 2009, 2010 and 2011, the amounts shown below for the amortization of actuarial gains and losses and prior service credits and costs, net of deferred income taxes, were recognized as components of our accumulated other comprehensive income (loss) at December 31, 2008, 2009 and 2010, respectively.
| Pension Benefits | Other Benefits | |||||||||||||||||||||||
| 2009 | 2010 | 2011 | 2009 | 2010 | 2011 | |||||||||||||||||||
| (In thousands) | ||||||||||||||||||||||||
| Service cost |
$ | 3,080 | $ | 3,218 | $ | 3,419 | $ | 91 | $ | 106 | $ | 118 | ||||||||||||
| Interest cost |
21,417 | 20,161 | 19,151 | 2,712 | 2,489 | 2,288 | ||||||||||||||||||
| Expected return on plan assets |
(38,887 | ) | (44,654 | ) | (55,496 | ) | — | — | — | |||||||||||||||
| Amortization of: |
||||||||||||||||||||||||
| Prior service cost (credit) |
1,232 | 1,232 | 1,232 | (16,170 | ) | (16,170 | ) | (16,170 | ) | |||||||||||||||
| Net actuarial losses |
19,045 | 15,389 | 7,306 | 8,619 | 8,317 | 7,965 | ||||||||||||||||||
|
|
|
|
|
|
|
|
|
|
|
|
|
|||||||||||||
| Total benefit cost (credit) |
$ | 5,887 | $ | (4,654 | ) | $ | (24,388 | ) | $ | (4,748 | ) | $ | (5,258 | ) | $ | (5,799 | ) | |||||||
|
|
|
|
|
|
|
|
|
|
|
|
|
|||||||||||||
F-24
Actuarial assumptions
A summary of our key actuarial assumptions used to determine the present value of benefit obligations as of December 31, 2010 and 2011 are shown in the following table:
| Pension Benefits | Other Benefits | |||||||||||||||
| 2010 | 2011 | 2010 | 2011 | |||||||||||||
| Discount rate |
5.0% | 4.0% | 5.0% | 4.0% | ||||||||||||
| Rate of compensation increase |
3.6% | 3.6% | — | — | ||||||||||||
A summary of our key actuarial assumptions used to determine the net periodic pension and other retiree benefit credit or expense during 2009, 2010 and 2011 are shown in the following table:
| Pension Benefits | Other Benefits | |||||||||||||||||||||||
| 2009 | 2010 | 2011 | 2009 | 2010 | 2011 | |||||||||||||||||||
| Discount rate |
6.2% | 5.6% | 5.1% | 6.2% | 5.5% | 5.0% | ||||||||||||||||||
| Expected return on plan assets |
10.0% | 10.0% | 10.0% | — | — | — | ||||||||||||||||||
| Rate of compensation increase |
3.4% | 3.6% | 3.6% | — | — | — | ||||||||||||||||||
Variances from actuarially assumed rates will result in increases or decreases in pension assets, accumulated defined benefit obligations, net periodic defined benefit credits or expense and funding requirements in future periods.
At December 31, 2010 and 2011, substantially all of our defined benefit pension plans’ assets were invested in the Combined Master Retirement Trust (“CMRT”), a collective investment trust sponsored by Contran to permit the collective investment by certain master trusts that fund certain employee benefit plans sponsored by Contran and certain of its affiliates. The CMRT’s long-term investment objective is to provide a rate of return exceeding a composite of broad market equity and fixed income indices (including the S&P 500 and certain Russell indicies) while utilizing both third-party investment managers as well as investments directed by Mr. Simmons. Mr. Simmons is the sole trustee of the CMRT. The trustee of the CMRT, along with the CMRT’s investment committee, of which Mr. Simmons is a member, actively manage the investments of the CMRT. The CMRT trustee and investment committee seek to maximize returns in order to meet the CMRT’s long-term investment objective. The CMRT trustee and investment committee do not maintain a specific target asset allocation in order to achieve their objectives, but instead they periodically change the asset mix of the CMRT based upon, among other things, advice they receive from third-party advisors and their expectations regarding potential returns for various investment alternatives and what asset mix will generate the greatest overall return. From its inception in 1988 through December 31, 2011, the CMRT has averaged an annual rate of return of 13.9%. For the years ended December 31, 2009, 2010 and 2011, the assumed long-term rate of return for plan assets invested in the CMRT was 10%. In determining the appropriateness of the long-term rate of return assumption, we primarily rely on the historical rates of return achieved by the CMRT, although we consider other factors as well including, among other things, the investment objectives of the CMRT’s managers and their expectation that such historical returns will in the future continue to be achieved over the long-term.
F-25
The CMRT unit value is determined semi-monthly, and the plans have the ability to redeem all or any portion of their investment in the CMRT at any time based on the most recent semi-monthly valuation. However, the plans do not have the right to individual assets held by the CMRT and the CMRT has the sole discretion in determining how to meet any redemption request. For purposes of our plan asset disclosure, we consider the investment in the CMRT as a Level 2 input because (i) the CMRT value is established semi-monthly and the plans have the right to redeem their investment in the CMRT, in part or in whole, at anytime based on the most recent value and (ii) observable inputs from Level 1 or Level 2 were used to value approximately 83% of the assets of the CMRT at both December 31, 2010 and 2011 as noted below. The aggregate fair value of all of the CMRT assets, including funds of Contran and its other affiliates that also invest in the CMRT, and supplemental asset mix details of the CMRT as of December 31, 2010 and 2011, are as follows:
| December 31, | ||||||||
| 2010 | 2011 | |||||||
| ($ in millions) | ||||||||
| CMRT asset value |
$ | 712.2 | $ | 666.6 | ||||
| CMRT fair value input: |
||||||||
| Level 1 |
83 | % | 82 | % | ||||
| Level 2 |
1 | 1 | ||||||
| Level 3 |
16 | 17 | ||||||
|
|
|
|
|
|||||
| 100 | % | 100 | % | |||||
|
|
|
|
|
|||||
| CMRT asset mix: |
||||||||
| Domestic equities, principally publically traded |
73 | % | 75 | % | ||||
| International equities, publically traded |
2 | 2 | ||||||
| Fixed income securities, publically traded |
16 | 14 | ||||||
| Privately managed limited partnerships |
8 | 8 | ||||||
| Other |
1 | 1 | ||||||
|
|
|
|
|
|||||
| 100 | % | 100 | % | |||||
|
|
|
|
|
|||||
Defined contribution pension plans
We also maintain several defined contribution pension plans. Expense related to these plans was $2.0 million in 2009, $2.2 million in 2010 and $2.5 million in 2011.
F-26
Note 7—Commitments and contingencies
Environmental matters
We have been named as a defendant for certain environmental sites pursuant to governmental laws and private actions, including waste disposal sites and facilities currently or previously owned, operated or used by us. These proceedings seek cleanup costs, damages for personal injury or property damage and/or damages for injury to natural resources. Additionally, KSW’s facilities are subject to regulatory oversight and enforcement activities. These activities may identify compliance violations which may result in penalties. Certain of these proceedings involve claims for substantial amounts.
On a quarterly basis, we evaluate the potential range of our liability at sites where we have been named a defendant by analyzing and estimating the range of reasonably possible costs to us. At December 31, 2011, the upper end of the range of reasonably possible costs to us for sites where we have been named a defendant is approximately $2.1 million, including our recorded accrual of $.4 million. Our cost estimates have not been discounted to present value due to the uncertainty of the timing of the pay out. At each balance sheet date, we make an estimate of the amount of our accrued environmental costs that will be paid out over the subsequent twelve months, and we classify such amount as a current liability. We classify the remainder of the accrued environmental costs as noncurrent liabilities. See Note 8.
It is possible our actual costs could differ materially from the amounts we have accrued or the upper end of the estimated range for the sites where we have been named a defendant. Our ultimate liability may be affected by a number of factors, including the imposition of more stringent standards or requirements under environmental laws or regulations, new developments or changes in remedial alternatives and costs or a determination that we are potentially responsible for the release of hazardous substances at other sites. Although we believe our comprehensive general liability insurance policies provide indemnification for certain costs that we incur with respect to our environmental remediation obligations, we do not currently have receivables recorded for any such recoveries.
Issues Outstanding at December 31, 2011
Prior to one of our subsidiaries’ 1996 acquisition of DeSoto, Inc. (“DeSoto”), DeSoto was notified by the Texas Natural Resource Conservation Commission (now called the Texas Commission on Environmental Quality or “TCEQ”) that there were certain deficiencies in prior reports to the TCEQ relative to one of DeSoto’s non-operating facilities located in Gainesville, Texas. During 1999, that subsidiary entered into the TCEQ’s Voluntary Cleanup Program as it relates to that facility. We are currently pursuing a Municipal Setting Designation (“MSD”) for this site which would eliminate the need for long-term groundwater remediation and monitoring. We estimate the cost of future remediation under an MSD at approximately $.1 million. If we are not successful in obtaining an MSD, remediation activities at this site would likely continue for another two to three years and could cost as much as $1.7 million.
F-27
In February 2009, we received a Notice of Violation (“NOV”) from the United States Environmental Protection Agency (the “U.S. EPA”) regarding alleged air permit issues at KSW. The U.S. EPA alleges KSW (i) is exceeding its sulfur dioxide emission limits set forth in its permits, (ii) failed to apply for a permit that would be issued under the U.S. Clean Air Act and the Illinois Environmental Protection Act in connection with the installation of certain equipment in its melt shop, and (iii) failed to monitor pH readings of an air scrubber in the wire galvanizing area of the plant. We disagree with the U.S. EPA’s assertions and we were in discussions with the U.S. EPA throughout 2009. On December 31, 2009, we were notified the case had been referred to the Department of Justice (the “DOJ”) for review and follow-up. During the first quarter of 2010, we submitted letters to the DOJ regarding our perspective on the matter. During the second quarter of 2010, the U.S. EPA requested additional information regarding the alleged permit issues and we submitted such information in May 2010.
In July 2011, we received a Notice and Finding of Violation (“NOV/FOV”) from the U.S. EPA alleging KSW failed to properly control air emissions and install a baghouse in accordance with terms and conditions of its Prevention of Significant Deterioration (“PSD”) construction permit issued on June 1, 2000.
While we continue to dispute certain of the U.S. EPA’s underlying assertions about these alleged violations contained in the February 2009 NOV and the July 2011 NOV/FOV, we have already undertaken corrective actions to address others and have worked diligently to reach resolution of the matters. KSW met with EPA Region V and the DOJ during August 2011 and February 2012 to discuss both the February 2009 NOV and the July 2011 NOV/FOV. To date, a formal complaint from the DOJ has not been issued. Settlement discussions cannot proceed until a formal complaint has been filed by the DOJ. Therefore, we cannot estimate any potential costs to us to resolve these matters and we can make no assurance our efforts will be successful or that we can avoid any enforcement action or resulting fines from these alleged violations.
Closure of Waste Management Units During 2009
Since September 1992, we had been involved in the closure of inactive waste management units (the “WMUs”) at KSW’s Peoria, Illinois facility pursuant to a Consent Order (the “Consent Order”) and a closure plan approved by the IEPA. The closure involved a six-phase remediation plan, with each phase requiring separate final approval from the IEPA. In July 2009, we received final approval from the IEPA for the completion of the soil portion of the plan for all of the WMUs. The amount of remediation we were ultimately required to undertake pursuant to such approval was not as extensive as we had estimated in prior years, and accordingly we reduced our accrual for this matter by $4.2 million during 2009.
As part of the Consent Order, we established a trust fund (the “Trust Fund”) in which monies were deposited to create a cash reserve for the
F-28
corrective action work and for the potential of third party claims. Through a modification of the Consent Order in 2005, we were then permitted to withdraw funds from the Trust Fund as we incurred costs related to the remediation. In connection with the IEPA’s final approval of the soil portion of the WMUs, the IEPA released approximately $2.0 million of the escrowed funds to us during 2009.
Current litigation
From time-to-time, we are involved in various environmental, contractual, product liability, patent (or intellectual property), employment and other claims and disputes incidental to our operations. In certain cases, we have insurance coverage for these items. We currently believe the disposition of all claims and disputes, individually or in the aggregate, should not have a material adverse effect on our consolidated financial position, results of operations or liquidity beyond the accruals we have already provided.
Lease commitments
At December 31, 2011, we are obligated under certain operating leases through 2016. Future commitments under these leases are summarized below.
| Lease commitment | ||||
| (In thousands) | ||||
| 2012 |
$ | 736 | ||
| 2013 |
385 | |||
| 2014 |
203 | |||
| 2015 |
150 | |||
| 2016 |
75 | |||
|
|
|
|||
| Total |
$ | 1,549 | ||
|
|
|
|||
Product supply agreements
In 1996, we entered into a fifteen-year product supply agreement with a vendor whereby the vendor constructed a plant at KSW’s Peoria, Illinois facility and, subsequently provided us with all, subject to certain limitations, of our gaseous oxygen and nitrogen needs through 2011. In addition to specifying rates to be paid by us, including a minimum facility fee of approximately $1.5 million per year, the supply agreement also specified provisions for adjustments to the rates and term of the supply agreement. During November 2011, a similar ten-year product supply agreement was executed detailing quantities of delivery, specific rates and provisions for adjustments to those rates, including a minimum facility fee of approximately $1.4 million per year. Purchases made pursuant to the supply agreement during 2009, 2010 and 2011 amounted to $3.1 million, $3.3 million and $3.1 million, respectively.
We also have a product supply agreement with a vendor that processes certain by-products of our electric arc furnace mini-mill under which we are
F-29
required to pay a fixed monthly fee aggregating $.9 million a year through 2016. Purchases, including the fixed monthly fee, pursuant to the supply agreement during 2009, 2010 and 2011 amounted to $2.6 million, $2.2 million and $2.6 million, respectively.
Income taxes
We have agreed to a policy with Contran providing for the allocation of tax liabilities and tax payments as described in Note 1. Under applicable law, we, as well as every other member of the Contran Tax Group, are each jointly and severally liable for the aggregate federal income tax liability of Contran and the other companies included in the Contran Tax Group for all periods in which we are included in the Contran Tax Group. Contran has agreed, however, to indemnify us for any liability for income taxes of the Contran Tax Group in excess of our tax liability previously computed and paid by us in accordance with the tax allocation policy.
Concentration of credit risk
We perform ongoing credit evaluations of our customers’ financial condition and, generally, require no collateral from our customers. Our segments are not dependent upon a single customer or a few customers, and the loss of any one, or a few, would not have a material adverse effect on our business. No single customer represented 10% or more of our consolidated sales during 2011.
Note 8—Other accrued liabilities:
| December 31, | ||||||||
| 2010 | 2011 | |||||||
| (In thousands) | ||||||||
| Current: |
||||||||
| Employee benefits |
$ | 12,679 | $ | 16,549 | ||||
| Self insurance |
4,935 | 6,686 | ||||||
| Environmental |
472 | 240 | ||||||
| Other |
4,815 | 5,886 | ||||||
|
|
|
|
|
|||||
| Total |
$ | 22,901 | $ | 29,361 | ||||
|
|
|
|
|
|||||
| Noncurrent: |
||||||||
| Workers compensation payments |
$ | 1,242 | $ | 1,243 | ||||
| Environmental |
265 | 165 | ||||||
| Other |
342 | 483 | ||||||
|
|
|
|
|
|||||
| Total |
$ | 1,849 | $ | 1,891 | ||||
|
|
|
|
|
|||||
F-30
Note 9—Financial instruments:
The following table presents the carrying value and estimated fair value of our financial instruments:
| December 31, 2010 |
December 31, 2011 |
|||||||||||||||
| Carrying amount |
Fair value |
Carrying amount |
Fair value |
|||||||||||||
| (In thousands) | ||||||||||||||||
| Accounts receivable, net |
$ | 46,765 | $ | 46,765 | $ | 58,976 | $ | 58,976 | ||||||||
| Accounts payable |
6,694 | 6,694 | 14,334 | 14,334 | ||||||||||||
| Long-term debt: |
||||||||||||||||
| Variable-rate debt |
27,740 | 27,740 | 33,630 | 33,630 | ||||||||||||
| Fixed-rate debt |
941 | 1,019 | 984 | 1,029 | ||||||||||||
Due to their nature, the carrying amounts of our restricted cash equivalents and variable rate indebtedness are considered equivalent to fair value. Additionally, due to their near-term maturities, the carrying amounts of accounts receivable and accounts payable are considered equivalent to fair value. The fair value of our fixed-rate indebtedness was based on the net present value of our remaining debt payments at an interest rate commensurate with our variable-rate debt which represents Level 3 inputs as defined in ASC Topic 820-10-35. Note that 99% of the carrying value of our fixed-rate debt at December 31, 2010 and 2011 relates to a $1.1 million non-interest bearing note. Because it is non-interest bearing, we have calculated an imputed interest rate on the note and carry the note at a value discounted for such interest.
Note 10—Stockholders’ Equity:
During 2011, we retired 398,068 shares of our treasury stock and allocated its aggregate $796,000 cost to common stock at par value and additional-paid-in-capital. In addition, certain of these shares had previously been held by one of our subsidiaries prior to their cancellation, and we incurred an income tax charge of $456,000 (also allocated to additional paid-in capital) when such shares were transferred to Keystone immediately prior to their cancellation.
In May 2011, we filed a preliminary registration statement on Form S-1 with the SEC in connection with a proposed distribution of non-transferable subscription rights to our common stockholders. The proposed offering contemplated participation by Contran as a subscribing party to the fullest extent possible. The commencement of and Contran’s participation in the proposed offering was subject to, among other things, Contran and us reaching agreement on the terms of the proposed offering. Prior to reaching such agreement, Contran purchased an additional 1.55 million shares of our common stock from a third-party stockholder in a private transaction, increasing its ownership interest in us to approximately 88%. As a result of such purchase, Contran indicated to us it no longer intended to subscribe for our shares in connection with the proposed offering. Thus, we cancelled the offering. See also Note 1.
F-31
In settlement of any alleged short-swing profit derived from the sale of our stock by the third-party stockholder to Contran, as calculated pursuant to Section 16(b) of the Securities Exchange Act of 1934, as amended, the third-party stockholder remitted approximately $106,000 to us during the third quarter of 2011. Additionally, in accordance with an agreement between Contran and us regarding the proposed stock rights offering, Contran reimbursed us for certain costs of the offering amounting to $161,000. We recorded both of these transactions, net of related income taxes, as capital contributions, increasing our additional paid-in capital.
Note 11—Related party transactions:
We may be deemed to be controlled by Mr. Harold C. Simmons. See Note 1. Corporations that may be deemed to be controlled by or affiliated with Mr. Simmons sometimes engage in (a) intercorporate transactions such as guarantees, management and expense sharing arrangements, shared fee arrangements, joint ventures, partnerships, loans, options, advances of funds on open account, and sales, leases and exchanges of assets, including securities issued by both related and unrelated parties, and (b) common investment and acquisition strategies, business combinations, reorganizations, recapitalizations, securities repurchases, and purchases and sales (and other acquisitions and dispositions) of subsidiaries, divisions or other business units, which transactions have involved both related and unrelated parties and have included transactions which resulted in the acquisition by one related party of a publicly-held minority equity interest in another related party. We periodically consider, review and evaluate, and understand that Contran and related entities consider, review and evaluate such transactions. Depending upon the business, tax and other objectives then relevant, it is possible that we might be a party to one or more such transactions in the future.
Under the terms of an intercorporate services agreement (the “ISA”) entered into between us and Contran, employees of Contran provide certain management, tax planning, legal, financial and administrative services on a fee basis. Such charges are based upon estimates of the time devoted by the employees of Contran to our affairs and the compensation of such persons. Because of the large number of companies affiliated with Contran, we believe we benefit from cost savings and economies of scale gained by not having certain management, legal, financial and administrative staffs duplicated at each entity, thus allowing certain individuals to provide services to multiple companies but only be compensated by one entity. During 2009, 2010 and 2011 the ISA fees charged to us by Contran aggregated approximately $2.0 million, $2.1 million and $2.1 million, respectively.
Tall Pines Insurance Company (“Tall Pines”) and EWI RE, Inc. (“EWI”) provide for or broker certain insurance policies for Contran and certain of its subsidiaries and affiliates, including us. Tall Pines is an indirect subsidiary of Valhi, Inc., a majority-owned subsidiary of Contran. EWI is a wholly-owned subsidiary of NL Industries, Inc., a publically-held company which
F-32
is majority owned by Valhi, Inc. Consistent with insurance industry practices, Tall Pines and EWI receive commissions from the insurance and reinsurance underwriters and/or assess fees for the policies they provide or broker. We paid Tall Pines and EWI $4.0 million in 2009, $3.7 million in 2010 and $4.2 million in 2011 for insurance, reinsurance premiums paid to third parties and commissions. Tall Pines purchases reinsurance from third-party insurance carriers with an A.M. Best Company rating of generally at least A-(Excellent) for substantially all of the risks it underwrites. We expect these relationships with Tall Pines and EWI will continue in 2012.
Contran and certain of its subsidiaries and affiliates, including us, purchase certain of our insurance policies as a group, with the costs of the jointly-owned policies being apportioned among the participating companies. With respect to certain of such policies, it is possible that unusually large losses incurred by one or more insureds during a given policy period could leave the other participating companies without adequate coverage under that policy for the balance of the policy period. As a result, Contran and certain of its subsidiaries and affiliates, including us, have entered into a loss sharing agreement under which any uninsured loss is shared by those entities who have submitted claims under the relevant policy. We believe the benefits in the form of reduced premiums and broader coverage associated with the group coverage for such policies justifies the risk associated with the potential for any uninsured loss.
Prior to 2009, we formed Alter Recycling Company, LLC (“ARC”), a joint venture with Alter Trading Corporation (“ATC”), to operate a ferrous scrap recycling operation at KSW. We have a scrap supply agreement with ATC and we source the majority of our ferrous scrap supply under this agreement. During 2009, 2010 and 2011, we purchased approximately $105.5 million, $205.9 million and $285.2 million respectively, of ferrous scrap from ATC and approximately $.5 million, $.5 million and $.8 million, respectively, of ferrous scrap from ARC. As of December 31, 2011, our payable to ATC approximated $2.7 million.
Note 12—Quarterly financial data (unaudited):
| 1st Quarter | 2nd Quarter | 3rd Quarter | 4th Quarter | |||||||||||||
| (restated) | ||||||||||||||||
| (In thousands, except per share data) | ||||||||||||||||
| Year ended December 31, 2010: |
||||||||||||||||
| Net sales |
$ | 99,743 | $ | 134,970 | $ | 113,608 | $ | 102,424 | ||||||||
| Gross profit (loss) |
10,905 | 14,459 | 7,731 | (268 | ) | |||||||||||
| Net income (loss) |
$ | 4,622 | $ | 6,585 | $ | 3,689 | $ | (2,882 | ) | |||||||
|
|
|
|
|
|
|
|
|
|||||||||
| Basic and diluted net income (loss) per share |
$ | 0.38 | $ | 0.54 | $ | 0.30 | $ | (0.24 | ) | |||||||
|
|
|
|
|
|
|
|
|
|||||||||
| Year ended December 31, 2011: |
||||||||||||||||
| Net sales |
$ | 134,163 | $ | 155,955 | $ | 140,973 | $ | 132,894 | ||||||||
| Gross profit |
13,429 | 16,220 | 11,273 | 3,048 | ||||||||||||
| Net income |
$ | 7,963 | $ | 9,719 | $ | 6,916 | $ | 5,613 | ||||||||
|
|
|
|
|
|
|
|
|
|||||||||
| Basic and diluted net income per share |
$ | 0.66 | $ | 0.80 | $ | 0.57 | $ | 0.46 | ||||||||
|
|
|
|
|
|
|
|
|
|||||||||
F-33
At the end of each year, we measure pension and other postretirement plan assets and obligations which could result in a significant fourth quarter adjustment to pension and OPEB expense or credits. During the fourth quarter of 2011 we recorded a $5.4 million higher pension credit ($3.3 million, net of tax, a $0.27 increase in earnings per share) as compared to the quarterly credits recorded throughout the year.
As disclosed in Note 1, at the end of 2011 KSW changed its method for productive inventory costing from the LIFO method to FIFO, and EWP changed its method for productive inventory costing from the LIFO method to an average cost method. The impact on the quarterly amounts disclosed above is included in the following table.
| As Reported/Computed under LIFO |
Change in Accounting Principle Increase (Decrease) |
As Currently Reported |
||||||||||
| Gross profit (loss): |
||||||||||||
| 2010 Quarter Ended: |
||||||||||||
| March 31 |
$ | 10,505 | $ | 400 | $ | 10,905 | ||||||
| June 30 |
14,724 | (265 | ) | 14,459 | ||||||||
| September 30 |
5,508 | 2,223 | 7,731 | |||||||||
| December 31 |
(3,333 | ) | 3,065 | (268 | ) | |||||||
| 2011 Quarter Ended: |
||||||||||||
| March 31 |
$ | 12,969 | $ | 460 | $ | 13,429 | ||||||
| June 30 |
15,035 | 1,185 | 16,220 | |||||||||
| September 30 |
8,844 | 2,429 | 11,273 | |||||||||
| December 31 |
3,782 | (734 | ) | 3,048 | ||||||||
| Net income (loss): |
||||||||||||
| 2010 Quarter Ended: |
||||||||||||
| March 31 |
$ | 4,375 | $ | 247 | $ | 4,622 | ||||||
| June 30 |
6,749 | (164 | ) | 6,585 | ||||||||
| September 30 |
2,319 | 1,370 | 3,689 | |||||||||
| December 31 |
(4,700 | ) | 1,818 | (2,882 | ) | |||||||
| 2011 Quarter Ended: |
||||||||||||
| March 31 |
$ | 7,683 | $ | 280 | $ | 7,963 | ||||||
| June 30 |
8,996 | 723 | 9,719 | |||||||||
| September 30 |
5,436 | 1,480 | 6,916 | |||||||||
| December 31 |
6,138 | (525 | ) | 5,613 | ||||||||
| Basic and diluted net income (loss) per share: |
||||||||||||
| 2010 Quarter Ended: |
||||||||||||
| March 31 |
$ | 0.36 | $ | 0.02 | $ | 0.38 | ||||||
| June 30 |
0.56 | (0.02 | ) | 0.54 | ||||||||
| September 30 |
0.19 | 0.11 | 0.30 | |||||||||
| December 31 |
(0.39 | ) | 0.15 | (0.24 | ) | |||||||
| 2011 Quarter Ended: |
||||||||||||
| March 31 |
$ | 0.63 | $ | 0.03 | $ | 0.66 | ||||||
| June 30 |
0.74 | 0.06 | 0.80 | |||||||||
| September 30 |
0.45 | 0.12 | 0.57 | |||||||||
| December 31 |
0.51 | (0.05 | ) | 0.46 | ||||||||
F-34
Note 13—Recent accounting pronouncements:
In May 2011, the Financial Accounting Standards Board issued Accounting Standards Update (“ASU”) 2011-04, Amendments to Achieve Common Fair Value Measurements and Disclosure Requirements in U.S. GAAP and IFRSs. ASU 2011-04 contains technical adjustments and clarifications to more closely align the U.S. GAAP and International Financial Reporting Standards (“IFRS”) for fair value and will be effective for our first quarter 2012 report. We do not believe the adoption of this standard will have a material effect on our Consolidated Financial Statements.
In June 2011, the FASB issued ASU 2011-05, Presentation of Comprehensive Income. ASU 2011-05 eliminates the option of presenting comprehensive income as a component of the Consolidated Statement of Shareholders’ Equity and instead requires comprehensive income to be presented as a component of the Consolidated Statement of Income or in a separate Consolidated Statement of Comprehensive Income immediately following the Consolidated Statement of Income. This standard will be effective for our first quarter 2012 report; we intend to present our comprehensive income in a separate Consolidated Statement of Comprehensive Income, the same manner in which we present our comprehensive income in these Consolidated Financial Statements.
Additionally, ASU 2011-05 would have required us to present on the face of our financial statements the effect of reclassifications out of accumulative other comprehensive income on the components of net income and other comprehensive income. However, in December 2011 the FASB issued ASU 2011-12, Comprehensive Income (Topic 220): Deferral of the Effective Date for Amendments to the Presentation of Reclassifications of Items Out of Accumulated Other Comprehensive Income in Accounting Standards Update No. 2011-05. ASU 2011-12 defers the effectiveness for the requirement to present on the face of our financial statements the effects of reclassifications out of accumulated other comprehensive income on the components of net income and other comprehensive income. Adoption of ASU 2011-05, as amended by ASU 2011-12, will not have a material effect on our Consolidated Financial Statements.
In December 2011, the FASB issued ASU 2011-11 Disclosures about Offsetting Assets and Liabilities. ASU 2011-11 requires entities to disclose both gross information and net information about both instruments and transactions eligible for offset in the balance sheet and instruments and transactions subject to an agreement similar to a master netting arrangement. This standard will be effective for annual and interim periods beginning with our first quarter 2013 report. We do not believe the adoption of this standard will have a material effect on our Consolidated Financial Statements.
F-35