Attached files
| file | filename |
|---|---|
| EXCEL - IDEA: XBRL DOCUMENT - EMAGIN CORP | Financial_Report.xls |
| EX-32.1 - EXHIBIT 32.1 - EMAGIN CORP | ex321.htm |
| EX-31.1 - EXHIBIT 31.1 - EMAGIN CORP | ex311.htm |
| EX-23.1 - EXHIBIT 23.1 - EMAGIN CORP | ex231.htm |
| EX-31.2 - EXHIBIT 31.2 - EMAGIN CORP | ex312.htm |
| EX-21.1 - EXHIBIT 21.1 - EMAGIN CORP | ex211.htm |
| EX-32.2 - EXHIBIT 32.2 - EMAGIN CORP | ex322.htm |
UNITED STATES SECURITIES AND EXCHANGE COMMISSION
Washington, D.C. 20549
Form 10-K
|
R
|
ANNUAL REPORT PURSUANT TO SECTION 13 OR 15(d) OF THE
|
|
SECURITIES EXCHANGEACT OF 1934
|
|
|
For the fiscal year ended December 31, 2011
|
|
|
or
|
|
|
£
|
TRANSITION REPORT PURSUANT TO SECTION 13 OR 15(d) OF THE SECURITIES
EXCHANGE ACT OF 1934
|
Commission file number 001-15751
eMAGIN CORPORATION
(Exact name of registrant as specified in its charter)
|
Delaware
|
56-1764501
|
|
(State or other jurisdiction of
|
(I.R.S. Employer
|
|
incorporation or organization)
|
Identification No.)
|
3006 Northup Way, Suite 103, Bellevue, Washington 98004
(Address of principal executive offices)
(425) 284-5200
(Registrant’s telephone number, including area code)
Securities registered pursuant to Section 12(b) of the Act: None
Securities registered pursuant to Section 12(g) of the Act: Common Stock, $.001 Par Value Per Share
Indicate by check mark whether the registrant is a well-known seasoned issuer as defined in Rule 405 of the Securities Act. Yes£ No R
Indicate by check mark if the registrant is not required to file reports pursuant to Section 13 or Section 15(d) of the Act. Yes£ No R
Indicate by check mark whether the registrant (1) has filed all reports required to be filed by Section 13 or 15(d) of the Securities Exchange Act of 1934 during the preceding 12 months (or for such shorter period that the registrant was required to file such reports), and (2) has been subject to such filing requirements for the past 90 days. Yes R No £
Indicate by check mark whether the registrant has submitted electronically and posted on its corporate Web site, if any, every Interactive Data File required to be submitted and posted pursuant to Rule 405 of Regulation S-T (§ 229.405 of this chapter) during the preceding 12 months (or for such shorter period that the registrant was required to submit and post such files). Yes R No ¨
Indicate by check mark if disclosure of delinquent filers pursuant to Item 405 of Regulation S-K is not contained herein, and will not be contained, to the best of registrant’s knowledge, in definitive proxy or information statements incorporated by reference in Part III of this Form 10-K or any amendment to this Form 10-K. £
Indicate by check mark whether the registrant is a large accelerated filer, an accelerated filer, a non-accelerated filer, or a smaller reporting company. See the definition of “large accelerated filer,” “accelerated filer and “smaller reporting company” in Rule 12b-2 of the Exchange Act. (Check one):
Large accelerated filer £ Accelerated filer R Non-accelerated filer £ Smaller Reporting Company £
Indicate by check mark whether the registrant is a shell company (as defined by Rule 12b-2 of the Exchange Act) Yes £ No R
As of June 30, 2011, the aggregate market value of the issued and outstanding common stock held by non-affiliates of the registrant, based upon the closing price of the common stock as traded on the NYSE Amex of $6.07 was approximately $96.95 million. For purposes of the above statement only, all directors, executive officers and 10% shareholders are assumed to be affiliates. This determination of affiliate status is not necessarily a conclusive determination for any other purpose.
Number of shares of common stock outstanding as of January 31, 2012 was 23,531,478.
DOCUMENTS INCORPORATED BY REFERENCE – Portions of the registrant’s definitive Proxy Statement relating to its 2012 Annual Meeting of Shareholders are incorporated by reference into Part III of this Annual Report on Form 10-K where indicated.
1
eMAGIN CORPORATION
FORM 10-K
FOR THE FISCAL YEAR ENDED DECEMBER 31, 2011
|
Page
|
||
|
PART I
|
||
|
Item 1
|
Business
|
4 |
|
Item 1A
|
Risk Factors
|
10 |
|
Item 1B
|
Unresolved Staff Comments
|
17 |
|
Item 2
|
Properties
|
17 |
|
Item 3
|
Legal Proceedings
|
17 |
|
Item 4
|
Mine Safety Disclosures
|
17 |
|
PART II
|
||
|
Item 5
|
Market for Registrant’s Common Equity, Related Shareholder Matters and Issuer Purchases of Equity Securities
|
18 |
|
Item 6
|
Selected Financial Data
|
20 |
|
Item 7
|
Management’s Discussion and Analysis of Financial Condition and Results of Operations
|
21 |
|
Item 7A
|
Quantitative and Qualitative Disclosures About Market Risk
|
29 |
|
Item 8
|
Financial Statements and Supplementary Data
|
30 |
|
Item 9
|
Changes in and Disagreements with Accountants on Accounting and Financial Disclosure
|
53 |
|
Item 9A
|
Controls and Procedures
|
53 |
|
Item 9B
|
Other Information
|
54 |
|
PART III
|
||
|
Item 10
|
Directors, Executive Officers, and Corporate Governance
|
55 |
|
Item 11
|
Executive Compensation
|
55 |
|
Item 12
|
Security Ownership of Certain Beneficial Owners and Management and Related Stockholder Matters
|
55 |
|
Item 13
|
Certain Relationships and Related Transactions and Director Independence
|
55 |
|
Item 14
|
Principal Accountant Fees and Services
|
55 |
|
PART IV
|
||
|
Item 15
|
Exhibits and Financial Statement Schedules
|
55 |
|
Signatures
|
56 | |
2
STATEMENT REGARDING FORWARD-LOOKING STATEMENTS
In this annual report, references to "eMagin Corporation," "eMagin," "Virtual Vision," "the Company," "we," "us," and "our" refer to eMagin Corporation and its wholly owned subsidiary, Virtual Vision, Inc.
Except for the historical information contained herein, some of the statements in this Report contain forward-looking statements that involve risks and uncertainties. These statements are found in the sections entitled "Business," "Management's Discussion and Analysis of Financial Condition and Results of Operation," and "Risk Factors." They include statements concerning: our business strategy; expectations of market and customer response; liquidity and capital expenditures; future sources of revenues; expansion of our proposed product line; and trends in industry activity generally. In some cases, you can identify forward-looking statements by words such as "may," "will," "should," "expect," "plan," "could," "anticipate," "intend," "believe," "estimate," "predict," "potential," "goal," or "continue" or similar terminology. These statements are only predictions and involve known and unknown risks, uncertainties and other factors, including, but not limited to, the risks outlined under "Risk Factors," that may cause our or our industry's actual results, levels of activity, performance or achievements to be materially different from any future results, levels of activity, performance or achievements expressed or implied by such forward-looking statements. For example, assumptions that could cause actual results to vary materially from future results include, but are not limited to: our ability to successfully develop and market our products to customers; our ability to generate customer demand for our products in our target markets; the development of our target markets and market opportunities; our ability to manufacture suitable products at competitive cost; market pricing for our products and for competing products; the extent of increasing competition; technological developments in our target markets and the development of alternate, competing technologies in them; and sales of shares by existing shareholders. Although we believe that the expectations reflected in the forward looking statements are reasonable, we cannot guarantee future results, levels of activity, performance or achievements. Unless we are required to do so under federal securities laws or other applicable laws, we do not intend to update or revise any forward-looking statements.
3
ITEM 1. BUSINESS
Introduction
eMagin Corporation (“eMagin, “we,” “our,” or “us,”) is a leader in the manufacture of microdisplays using OLED (organic light emitting diode) technology. We design, develop, manufacture, and market OLED on silicon microdisplays, virtual imaging products which utilize OLED microdisplays, and related products. We also perform research in the OLED field. Our virtual imaging products integrate OLED technology with silicon chips to produce high-resolution microdisplays smaller than one-inch diagonally which, when viewed through a magnifier, create virtual images that appear comparable in size to that of a computer monitor or a large-screen television. Our products enable our original equipment manufacturer (“OEM”) customers to develop and market improved or new electronic products, especially products that are mobile and highly portable so that people have immediate access to information and may experience immersive forms of communications and entertainment.
We believe our OLED microdisplays offer a number of significant advantages over comparable liquid crystal microdisplays (LCDs) including greatly increased power efficiency, less weight, and dramatically higher contrast, with expected lower overall system costs relative to alternative microdisplay technologies. Using our active matrix OLED technology, many computer and electronic system functions can be built directly into the OLED microdisplay silicon backplane, resulting in compact, high resolution, power efficient systems. Already proven in military and commercial systems, our portfolio of OLED microdisplays deliver high-resolution, flicker-free virtual images, working effectively even in extreme temperatures and high-vibration conditions We have developed our own intellectual property and accumulated over 10 years of manufacturing know-how to create high performance OLED microdisplays.
eMagin Corporation was created through the merger of Fashion Dynamics Corporation ("FDC"), which was organized on January 23, 1996 under the laws of the State of Nevada and FED Corporation ("FED"), a developer and manufacturer of optical systems and microdisplays for use in the electronics industry. Simultaneous with this merger, we changed our name to eMagin Corporation. eMagin is incorporated in the state of Delaware.
We derive the majority of our revenue from sales of our OLED microdisplay products. We also generate revenue from sales of optics, microdisplays combined with optics (“microviewers”), and virtual imaging systems. In addition we earn revenue from both government and commercial development contracts that in some cases complement and support our internal research and development programs.
Our Technology Platforms
Small Molecule, Top-Emitting Active Matrix OLED Technology
There are two basic classes of OLED technology, dubbed single molecule or small molecule (monomer) and polymer. Our microdisplays are currently based upon active matrix small molecule OLED technology, which we refer to as active matrix OLED (“AMOLED”) because we build the displays directly onto silicon chips. Our AMOLED technology uniquely permits millions of individual low-voltage light sources to be built on low-cost, silicon computer chips to produce single color, white or full-color display arrays. Using our OLED technology, many computer and video electronic system functions can be built directly into the silicon chip, under the OLED film, resulting in very compact, integrated systems with lower overall system costs relative to alternative technologies.
OLEDs are thin films of stable organic materials that emit light of various colors when a voltage is impressed across them. OLEDs are emissive devices, which mean they create their own light, as opposed to liquid crystal displays, which require a separate light source. As a result, our OLED microdisplays use less power and can be capable of higher brightness and fuller color than liquid crystal microdisplays. Because the light they emit is Lambertian, which means that it appears equally bright from most forward directions, a moderate movement in the eye does not change the image brightness or color as it does in other technologies.
We have developed numerous and significant enhancements to OLED microdisplay technology as well as key silicon circuit designs to effectively incorporate the OLED film on a silicon integrated circuit. For example, we have developed a unique, top-emitting structure for our OLED devices that enables OLED displays to be built on opaque silicon integrated circuits rather than only on glass. Our OLED microdisplays emit full visible spectrum light that is isolated with color filters to create full color images. Our microdisplays have a brightness that can be greater than that of a typical notebook computer and can have a potential useful life of over 50,000 operating hours, in certain applications. New materials and device improvements, such as our recently developed OLED-XL™ technology, offer the potential for even better performance for brightness, efficiency, and lifespan. In addition to our active matrix OLED technology, we have developed compact optic and lens enhancements which, when coupled with the microdisplay, provide the high quality large screen appearance that we believe a large proportion of the marketplace demands.
4
We believe that our AMOLED technology provides significant advantages over other microdisplay technologies in our targeted microdisplay markets. We believe these key advantages include:
|
·
|
Low power consumption for improved battery life and longer system life;
|
||||||
|
·
|
High-speed performance resulting in clear video images;
|
||||||
|
·
|
Wide angle light emission resulting in large apparent screen size;
|
||||||
|
·
|
Wide operating temperature range;
|
||||||
|
·
|
Good environmental stability (vibration and humidity);
|
||||||
|
·
|
Low manufacturing cost; and
|
||||||
|
·
|
Low cost system solutions.
|
||||||
Prism Optics
High quality, large view lenses with a wide range for eye positioning are essential for using our displays in near-eye systems. We have developed advanced molded plastic prism lenses which permit our AMOLED microdisplays to provide large field of view images that can be viewed for extended periods with reduced eye-fatigue. We have engaged a firm to manufacture our lenses in order to provide them in larger quantities to our customers and are using them in our certain of our own systems.
Our Market Opportunities
The markets we target broadly fall into the categories of military, industrial/medical, and consumer though many products serve multiple markets (“dual use”). Within each of these market sectors, we believe that our OLED microdisplays, when combined with compact optic lenses, will become a key component for a number of mobile electronic products. Many of these products employ head-wearable displays that incorporate microdisplays mounted in or on eyeglasses, goggles, simple headbands, helmets, or hardhats, and are often referred to as head-mounted displays (HMDs) or headsets. Head-wearable displays may block out surroundings for a fully immersive experience, or be designed as "see-through" or "see-around" to the user's surroundings. They may contain one (monocular) or two (binocular) displays. Some of the increased current interest is due to accelerating the timetable to adapt such systems to military applications such as night vision and fire and rescue applications.
Military
Properly implemented, we believe that head-mounted systems incorporating our microdisplays increases the user’s effectiveness by allowing hands-free operation and increasing situational awareness with enough brightness for use in daylight, yet controllable for nighttime light security. As a COTS (commercial off the shelf) component, OLED microdisplays intrinsically demonstrate performance characteristics important to military and other demanding commercial and industrial applications, including high contrast, wide dimming range, shock and vibration resistance and insensitivity to high G-forces. The image does not suffer from flicker or color breakup in vibrating environments, and the microdisplay's wide viewing angle allows ease of viewing for long periods of time. Most importantly, our OLED's very low power consumption reduces battery weight and increases allowed mission length. The OLED's inherent wide temperature tolerance range is of special interest for military applications because the display can turn on instantly at temperatures far below freezing and can operate at very high temperatures in desert conditions. Our microdisplay products provide power advantages over other microdisplay technologies, particularly liquid crystal displays which require backlights and heaters and cannot provide instant-on capabilities at low temperatures.
Our products’ military applications primarily fall into three broad areas: (1) helmet-mounted displays for situational awareness and data, (2) night vision/thermal imaging goggles and viewers, and (3) training and simulation devices. Similar systems are of interest for other military applications as well as for demanding operations such as urban security, homeland defense, fire and rescue.
Situational Awareness. Situational awareness products include head mounted displays that are used to display such things as digital maps or sensor imagery. Handheld imagers also provide improved situational awareness for surveillance and training. In certain situations these products are combined with a weapon system in order to give the user the capability of selecting targets without direct exposure. Our OLED microdisplays have been incorporated into both U.S. and foreign military situational awareness programs.
Night Vision/Thermal Imaging. Night vision goggles allow the user to see in low light conditions. Most versions include two different technologies: infrared/thermal, and image intensification. Third and fourth generation military devices usually use some combination of the two modes. Thermal imagers detect infrared energy (heat) and convert it into an electronic signal. The resulting signal needs to be presented on a display. Heat sensed by an infrared camera can be very precisely quantified, or measured, allowing the user to not only monitor thermal performance, but also identify and evaluate the relative severity of heat-related problems. Thermal imaging systems can be stand-alone handheld systems or integrated as part of the aiming mechanism for a larger system. Our OLED microdisplays are typically targeted to uncooled systems, as opposed to systems that require external cooling in order to increase their sensitivity. Advances in sensor technology, both in sensitivity and resolution as well as economic efficiency, have been the driving factors in the adoption of thermal technologies for military applications. The power efficiency and environmental ruggedness of our products are strong competitive advantages, particularly in these small hand-held non-cooled systems. Fielded products incorporating eMagin OLED microdisplays include Northrop Grumman’s Lightweight Laser Designator Rangefinders (LLDR), Thales SOPHIE™ handheld thermal imagers, and Thales MINIE™, LUCIE™, and MONIE™ night vision goggles.
5
Training and Simulation. Our OLED microdisplays and our Z800 3DVisor are used by OEMs for use with their simulation and training products. The Z800’s capability to integrate 360 degree head tracking and stereo vision, as well as its wide field of view are attractive attributes for any simulation or virtual reality system. The companies that incorporate our OLEDs in their training and simulation products include: Cubic Corporation, Quantum 3D, Rockwell Collins, Intevac Vision Systems, and Sensics.
Our displays have been commercialized or prototyped for situational awareness and night vision/thermal imaging applications by military systems integrators including Elbit, L-3 Communications, Intevac Vision Systems, Nivisys, BAE Oasys Technology, Qioptiq, Rockwell Collins, Saab, Sagem DS, and Thales, among many others, as well as for related operations such as urban security, fire and rescue.
Commercial, Industrial, and Medical
We believe that a wide variety of commercial and industrial markets offer significant opportunities for our products due to increasing demand for instant data accessibility in mobile workplaces. Some examples of potential microdisplay applications include: immediate access to inventory such as parts, tools and equipment availability; instant accessibility to maintenance or construction manuals; routine quality assurance inspection; endoscopic surgery; and real-time viewing of images and data for a variety of applications. As one potential example, a user wearing a HMD while using test equipment, such as oscilloscopes, can view technical data while simultaneously probing printed circuit boards. Current commercial products equipped with our OLED microdisplays in these sectors include those produced by Liteye, FLIR Systems, Nordic NeuroLab, VRmagic GmbH, Sensics and Total Fire Group, among others.
The Company is exploring opportunities in the digital cinema Electronic View Finder (“EVF”) market. These are similar to those found in consumer video cameras but are of significantly higher performance in the area of resolution and overall image quality.
Consumer
We believe that the most significant driver of the longer term near-eye virtual imaging microdisplay market is growing consumer demand for mobile access to larger volumes of information and entertainment in smaller packages. This desire for mobility has resulted in the development of mobile video personal viewer products in two general categories: (i) an established market for electronic viewers incorporated in products such as viewfinders for digital cameras and video cameras which may potentially also be developed as personal viewers for cell phones and (ii) an emerging market for headset-application platforms which include accessories for mobile devices, portable DVD systems, electronic games, and other entertainment, and wearable computers.
As our OLED displays are manufactured in increasingly higher volumes at reduced costs, we believe that our OLED microdisplay products will be increasingly well positioned to compete with and displace liquid crystal displays in the rapidly growing consumer market as demand for higher-resolution, and better image quality evolves to meet the wish for more sophisticated Personal Viewers. Examples of potential applications for mobile Personal Viewers include handheld personal computers and mobile devices, like smartphones, whose small, direct view screens are often limitations, but which are now capable of running software applications that would benefit from a larger display accessory and entertainment and gaming video headset systems, which permit individuals to privately view television, including HDTV, video CDs, DVDs and video games on virtual large screens or stereovision.
Our Products
Our first commercial microdisplay was the SVGA+ OLED microdisplay, which was introduced in 2001. In 2008 we introduced engineering samples of our SXGA OLED microdisplays and began selling significant quantities of the SXGA product in 2010. In the fourth quarter of 2011 we began selling pre-production samples of the WUXGA OLED microdisplays. eMagin OLED display products are being applied or considered for near-eye and headset applications in products to be manufactured by OEM customers for a wide variety of military, medical, industrial, and consumer applications. We offer our products to OEMs and other buyers as both separate components, integrated bundles coupled with our own optics, or full systems. We also offer engineering support to enable customers to quickly integrate our products into their own product development programs and offer design of customized displays with resolutions or features to meet special customer requirements.
SVGA+ OLED Microdisplay Series (Super Video Graphics Array of 852x600). This 0.62 inch diagonal microdisplay has a resolution of 852x600 triad pixels (1.53 million picture elements). The display also has an internal NTSC monochrome video decoder for low power night vision systems. SVGA+ Rev3 OLED-XL microdisplay is a power efficient OLED display solution for near-eye personal viewer applications which, uses less than 115 mW power in monochrome, such as for thermal imaging applications, and lower than 175 mW at 400 cd/m2 (60Hz video at 70 cd/m2) for full color video. This microdisplay has simpler calibration over temperature and is ideal for demanding binocular luminance and color matching.
6
SXGA OLED-XL (Super eXtended Graphics Array, 1280 x 1024). Our SXGA OLED microdisplay with a 0.77 inch diagonal active area provides 3,932,160 sub-pixels in an active area. The display’s triad pixel array comprises triads of vertical sub-pixels stacked side by side to make up each 12 x 12mm color pixel. The SXGA OLED-XL microdisplay offers digital signal processing, requiring less than 200mW under typical operation The supported video formats are SXGA, 720p, DVGA (through 1280 x 960 pixel doubling), and both frame sequential and field sequential stereovision.
WUXGA OLED-XL (Widescreen Ultra eXtended Graphics Array, 1920 x 1200). Our WUXGA OLED-XL microdisplay provides higher resolution than most HD (High Definition) flat screen televisions. With a triad sub-pixel structure this display is built of 7,138,360 active dots at 3.2 microns each. The WUXGA OLED-XL is built upon the voltage pixel drive approach first developed for the SXGA OLED-XL which provides improved uniformity, ultra-high contrast (measured at greater that 100,000:1) and lower power. The advanced of the WUXGA design features eMagin’s proprietary “Deep Black” architecture that ensures that off-pixels are truly black, automatically optimizes contrast under all conditions, and delivers better pixel to pixel uniformity. The WUXGA OLED-XL includes a very low-power, low-voltage-differential-signaling (LVDS) serial interface and the overall display power requirement is typically less than 350 mW running standard video. Also included is eMagin’s proprietary motion enhancement technology which smoothes video display and virtually eliminate unwanted artifacts. Like the SXGA, the WUXGA provides a FPGA driver design available on a separate, lower power driver board, or as source code for integration into end product electronics giving OEM developers maximum versatility and flexibility. On-board circuitry ensures consistent color and brightness over a wide range of operating temperatures.
VGA OLED-XL (Video Graphics Array, 640 x 480). The VGA OLED-XL microdisplay was added to eMagin’s product line in April 2011 and is our smallest (0.5 inches) and lowest powered (<60 mW monochrome/<100 mW color). The VGA OLED-XL utilizes the same voltage pixel drive architecture and “Deep Black” technology as the SXGA and WUXGA designs and includes motion artifact reduction technology like the WUXGA. Also like the SXGA and WUXGA, the VGA provides a FPGA driver design for maximum flexibility and versatility. The VGA interface is 30-bit digital RGB.
Lens and Design Reference Kits. We offer a WF05 prism optic, with mounting brackets or combined with OLED microdisplays to form an optic-display module. We provide Design Reference Kits, which include a microdisplay and associated electronics to help OEMs evaluate our microdisplay products and to assist their efforts to build and test new products incorporating our microdisplays.
Integrated Modules. We provide near-eye virtual imaging modules that incorporate our OLED-on-silicon microdisplays with our lenses and electronic interfaces for integration into OEM products. We have shipped customized modules to several customers, some of which have incorporated our products into their own commercial products.
Z800 3DVisor™ Our Z800 3DVisors™ give users the ability to work with their hands while simultaneously viewing information or video on the display. The Z800 3DVisor enables more versatile portable computing, using a 0.59-inch diagonal microdisplay (SVGA-3D capable of delivering an image that appears comparable to that of a 19-inch monitor at 22 to 24 inches from the eye, or a 105 inch movie screen at 12 foot distance.) Our systems are currently being used for personal entertainment, electronic gaming, and military training and simulation, among other applications.
Government Contract Funding
We derive a portion of our revenue from funding that we receive pursuant to research contracts or subcontracts funded by various agencies of the United States Government. The revenue that we recognize from these contracts represents reimbursement by various government entities. In 2008, we were awarded a contract for the development of power efficient microdisplays for the United States Army Night Vision and Electronic Sensors Directorate (“NVESD”). In 2009, this agreement was renewed through 2010. In 2010 we were awarded a Cooperative Research and Development Agreement by NVESD for the Development, Evaluation and Characterization of Active Matrix Organic Light Emitting Diode (AMOLED) for use in Head Mounted Displays. NVESD also awarded eMagin a contract in 2010 for research and development of microdisplays using Silicon on Insulator technology. In 2007 we were awarded a contract for the development of an ultra-high resolution display for United States Army Telemedicine and Advanced Technology Research Center (“TATRC”). In 2008 and 2009, this agreement was renewed and we will continue to provide research and development services for these displays through the first quarter of 2012. In response to a request from TATRC, we have submitted a proposal to continue this research through 2014. In February of 2012, we were awarded a Small Business Innovation Research contract by the United States Special Operations Command to optimize our WUXGA for mass production for dual use applications. Our government contracts require us to conduct the research effort described in the statement of work section of the contract. These contracts may be modified or terminated at the discretion of the government and are subject to authorization, appropriation and allocation of the required funding on an annual basis. On contracts for which we are the prime contractor, we subcontract portions of the work to various entities and institutions. Approximately 14% of 2011 revenue was related to research contracts funded by the U.S. Government as compared to 16% in 2010.
7
Our Strategy
Our strategy is to strengthen our leadership position as a worldwide supplier of microdisplays and virtual imaging technology solutions for applications in high growth segments of the electronics industry by capitalizing on our experience and expertise in active matrix OLED technology. We aim to provide microdisplays and complementary accessories to enable OEM customers to develop and manufacture new and enhanced electronic products. Some key elements of our strategy to achieve these objectives include the following:
|
·
|
Strengthen our technology leadership. As the first to exploit AMOLED microdisplays, we believe that we enjoy a significant advantage in bringing this technology to market. By continuing to invest in research and development, and protecting our intellectual property, we expect to further develop performance improvements and provide a competitive edge for our customers who integrate our displays into their end products.
|
|
·
|
Optimize microdisplay manufacturing efficiencies while protecting proprietary processes. We intend to reduce our production costs primarily through increasing manufacturing yield and lowering fixed costs through reduced cycle time and increased automation, as well as equipment upgrades. We outsource certain portions of microdisplay production, such as chip fabrication, to minimize both our costs and time to market. We intend to retain the OLED-related processes in-house, where we have a core competency and manufacturing expertise. We also believe that by keeping these processes under tight control we can better protect our proprietary technology and process know-how. This strategy will also enhance our ability to continue to optimize and customize processes and devices to meet customer needs
.
|
|
·
|
Build and maintain strong design capabilities. We employ in-house design capabilities supplemented by outsourced design services. Building and maintaining this capability will allow us to reduce engineering costs, accelerate the design process and enhance design accuracy to respond to our customers' needs as new markets develop. In addition, we intend to maintain a product design staff capable of rapidly developing prototype products for our customers and strategic partners. Contracting third party design support to meet demand and for specialized design skills may also remain a part of our overall long term strategy. Given these capabilities the company continues to look for opportunities to add value to our displays to increase revenue.
|
|
·
|
Leverage strategic relationships. External relationships play an important role in our research and development efforts. Suppliers, equipment vendors, government organizations, contract research groups, external design companies, customer and corporate partners, consortia, and university relationships all enhance the overall research and development effort and bring us new ideas and solutions. In addition, we participate in industry associations such as Society Information Display (“SID”), FlexTech Alliance (formerly known as United States Display Consortium), OLED Association, Consumer Electronics Association, and the Association of the United States Army, among others. Furthermore, we have established a CRADA (Cooperative Research and Development Agreement) with the US Army/RDECOM/NVESD as of August 2010 for the purpose of evaluating and characterizing new and existing AMOLED microdisplay configurations. This agreement expires in 2015. We believe that strategic relationships allow us to better determine the demands of the marketplace and, as a result, allow us to focus our future research and development activities to satisfy our customers’ evolving requirements.
|
Sales and Marketing
We primarily provide our OLED display and optics components for OEMs to incorporate into their branded products and sell through their own well-established distribution channels. We have traditionally marketed and sold our products to customers through targeted selling, promotions, select advertising and attendance at trade shows. We identify companies with end products and applications for which we believe our products will provide a key differentiator. Marketing efforts focus on identifying prospects and communicating the product performance attributes foremost in the minds of purchasing decision-makers. This approach is intended to ensure the highest possible return on investment for our marketing expense.
We market our products in North America, Asia, and Europe directly from our sales office located in our Bellevue, Washington facility. We also have distributors in China and Korea.
An OEM design cycle typically requires between 6 and 36 months, depending on the uniqueness of the market, the complexity of the end product, or in the case of military OEM customers, government procurement schedules. Because our microdisplays are the main functional component that defines many of our customers' end products, we work closely with customers to provide technical assistance throughout the product evaluation and integration process.
Customers
Customers for our products include both large multinational and smaller OEMs. We maintain relationships with OEMs in a diverse range of industries encompassing the military, industrial, medical, and consumer market sectors. During 2011, we estimate 13% of our net product revenues were to firms in the commercial market, 54% to firms in the military market, and 33% to firms in both military and commercial markets as compared to 2010, where 9% were to firms in the commercial market, 41% to firms in the military market, and 50% to firms in both military and commercial markets. During 2011, 63% of our net revenue was to firms based in the United States and 37% was to international firms as compared to 66% domestic revenue and 34% international revenue during 2010. In 2011, we had 10 customers that accounted for approximately 48% of our total revenue as compared to 10 customers that accounted for approximately 57% of our total revenue in 2010. In 2011, we did not have any customer that accounted for more than 10% of our total revenue and in 2010, we had 1 customer that accounted for more than 10% of our total revenue.
8
Backlog
As of January 31, 2012, we had a backlog of approximately $11.5 million for purchases through December 2012. This backlog primarily consists of non-binding purchase orders and purchase agreements but does not include expected revenue from R&D contracts or expected NRE (non-recurring engineering) programs under development.
The majority of our backlog consists of non-binding purchase orders or purchase agreements for delivery over the next six months. Most purchase orders are subject to rescheduling or cancellation by the customer with no or limited penalties. We believe that the backlog metric is of limited utility in predicting future sales because many of our OEM customers operate on a ship-to-order basis. Variations in the magnitude and duration of purchase orders and customer delivery requirements may result in substantial fluctuations in backlog from period to period.
Manufacturing Facilities
Our manufacturing facilities are located at IBM's Microelectronics Division facility, known as the Hudson Valley Research Park, located about 70 miles north of New York City in Hopewell Junction, New York. We lease approximately 37,000 square feet of space which houses our own equipment for OLED microdisplay fabrication and research and development, includes a 16,300 square foot class 10 clean room space, additional lower level clean room space, assembly space and administrative offices.
Facilities services provided by IBM include our clean room, pure gases, high purity de-ionized water, compressed air, chilled water systems, and waste disposal support. This infrastructure provided by our lease with IBM provides us with many of the resources of a larger corporation without the added overhead costs. It further allows us to focus our resources more efficiently on our product development and manufacturing goals.
We believe manufacturing efficiency is an important factor for success, especially in the consumer markets. Although, we currently have the equipment needed for profitable production in place, we purchased $2.9 million and $2.3 million in 2011 and 2010, respectively, of additional equipment mainly related to manufacturing and we plan to add $4.8 million of equipment in 2012 to increase capacity and yield and to meet expected demand for our microdisplays.
Competition
The industry in which we operate is highly competitive. We face competition from legacy technologies such as liquid crystal on silicon microdisplays (LCOS), and transmissive liquid crystal displays (LCDs) as well as from alternative flat panel display technologies such as field emission and virtual scanning retinal displays. There are many large and small companies that manufacture or have in development products based on these technologies. Kopin Corporation manufactures LCDs and is currently our principal competitor.
A few manufacturers of high resolution OLED microdisplays have recently emerged which produce microdisplays that compete with our microdisplay products. Yunnan North OLEiD Opto-Electronic Technology Co., Ltd., in China, has begun shipping OLED microdisplays into the market and we believe that MicroOLED, in France, is preparing to do so. Sony Mobile Display Corp., in Japan, produces OLED microdisplays for integration into Sony’s own higher-level systems such as digital cameras and Head Mounted Displays (HMDs). We are not aware of any plans by Sony to sell its OLED microdisplays to OEMs. We do not expect these companies to affect our military business however we anticipate some price erosion on our international and commercial customers.
Sony has developed and released a 3D consumer HMD that utilizes their OLED microdisplays. We do not expect the introduction of this product to significantly affect sales of our Z800. The Z800 has an established OEM base and has more flexible interfaces for ease of integration into the training and simulation market (largest market segment), where the Sony HMD was specifically designed for consumer electronic interfaces.
We may also compete with potential licensees of Universal Display Corporation or Global OLED Technology LLC among others, each of which potentially can license OLED technology portfolios. If other new OLED-based companies enter our markets with directly relevant display designs and without manufacturing and reliability issues, we will face additional competition, though we believe that our progress to date in this area gives us a significant head start.
In the future, we believe that competition will come from LCOS, small transmissive LCDs, and from OLED microdisplays manufactured by competitors. While we believe that OLED technology has a technical advantage to provide higher quality images, greater environmental ruggedness, reduced electronics cost and complexity, and improved power efficiency microdisplays, there is no assurance that we will continue to be the dominant OLED microdisplay supplier.
9
Intellectual Property
We believe we have developed a substantial intellectual property portfolio of patents, trade secrets and manufacturing know-how. It is important to protect our investment in technology by obtaining and enforcing intellectual property rights, including rights under patent, trademark, trade secret and copyright laws. We seek to protect inventions we consider significant by applying for patents in the United States and other countries when appropriate. The U.S. Government holds licenses to much of our technology as a result of their funding a significant portion of our research and development.
Our intellectual property covers a wide range of materials, device structures, processes, and fabrication techniques, primarily concentrated in the following areas:
|
·
|
OLED Devices, Architecture, Structures, and Processes;
|
||||||
|
·
|
Display Color Processing and Sealing;
|
||||||
|
·
|
Active Matrix Circuit Methodologies and Designs;
|
||||||
|
·
|
Lenses and Tracking (Eye and Head);
|
||||||
|
·
|
Ergonomics and Industrial Design;
|
||||||
|
·
|
Wearable Computer Interface Methodology; and
|
||||||
|
·
|
Legacy Field Emission and General Display Technologies.
|
||||||
We believe that, in addition to patent protection, our success is dependent upon non-patentable trade secrets and technical expertise. To protect this information and know-how from unauthorized use or disclosure, we use nondisclosure agreements and other measures to protect our proprietary rights, and we require all employees, and where appropriate, contractors, consultants, advisors and collaborators to enter into confidentiality and non-competition agreements. We believe that our intellectual property portfolio, coupled with our strategic relationships and accumulated manufacturing know-how in OLED, gives us a significant advantage over potential competitors.
Employees
As of January 31, 2012, we had a total of 92 full time and part time staff. None of our employees are represented by a labor union. We have not experienced any work stoppages and consider our relations with our employees to be good.
Available Information
Our website address is www.emagin.com. We make available free of charge through our website our Annual Reports on Form 10-K, Quarterly Reports on Form 10-Q, Current Reports on Form 8-K, our Proxy Statements and all amendments to such reports filed under the Securities and Exchange Act after we electronically file such material with, or furnish such material to, the Securities and Exchange Commission (SEC). These reports may be accessed from our website by following the links under “Investors,” then “SEC Filings.” The information found on our website is not part of this or any other report we file with or furnish to the SEC. We assume no obligation to update or revise any forward-looking statements in this Annual Report or in other reports filed with the SEC, whether as a result of new information, future events or otherwise, unless we are required to do so by law. A copy of this Annual Report and our other reports is available without charge upon written request to Investor Relations, eMagin Corporation, 3006 Northup Way, Suite 103, Bellevue, WA 98004.
We also post on our website the charters of our Audit, Compensation, Governance and Nominating committees, our Codes of Ethics and any amendments of or waiver to those codes of ethics, and other corporate governance materials recommended by the SEC as they occur, as well as earnings press releases and other business-related press releases.
ITEM 1A. RISK FACTORS
You should carefully consider the following risk factors and the other information included herein as well as the information included in other reports and filings made with the SEC before investing in our common stock. The following factors, as well as other factors affecting our operating results and financial condition, could cause our actual future results and financial condition to differ materially from those projected. The trading price of our common stock could decline due to any of these risks, and you may lose part or all of your investment.
RISKS RELATED TO OUR FINANCIAL RESULTS
We have had losses in the past and may incur losses in the future.
Our accumulated deficit is approximately $187 million as of December 31, 2011. We achieved profitability for three consecutive quarters in 2011. We have been EBITDA positive every quarter for 15 consecutive quarters since the second quarter of 2008. We can give no assurances that we will continue to be profitable in the future. We cannot assure investors that we will sustain profitability or that we will not incur operating losses in the future.
10
We may not be able to execute our business plan due to a lack of cash from operations.
We anticipate that our cash from operations will be sufficient to meet our requirements over the next twelve months. In the event that cash flow from operations is less than anticipated and we are unable to secure additional funding to cover our expenses, in order to preserve cash, we may have to reduce expenditures and effect reductions in our corporate infrastructure, either of which could have a material adverse effect on our ability to continue our current level of operations. No assurance can be given that if additional financing is necessary, that it will be available, or if available, will be on acceptable terms.
Our operating results have significant fluctuations.
In addition to the variability resulting from the short-term nature of commitments from our customers, other factors contribute to significant periodic quarterly fluctuations in results of operations. These factors include, but are not limited to, the following:
|
·
|
the receipt and timing of orders and the timing of delivery of orders;
|
||||
|
·
|
the inability to adjust expense levels or delays in adjusting expense levels, in either case in response to lower than expected revenues or gross margins;
|
||||
|
·
|
the volume of orders relative to our manufacturing capacity;
|
||||
|
·
|
product introductions and market acceptance of new products or new generations of products;
|
||||
|
·
|
changes in cost and availability of labor and components;
|
||||
|
·
|
product mix;
|
||||
|
·
|
variation in operating expenses; regulatory requirements and changes in duties and tariffs;
|
||||
|
·
|
pricing and availability of competitive products and services; and
|
||||
|
·
|
changes, whether or not anticipated, in economic conditions.
|
||||
Accordingly, the results of any past periods should not be relied upon as an indication of our future performance.
RISKS RELATED TO MANUFACTURING
The manufacture of active matrix OLED microdisplays continues to evolve as better methods are discovered and employed and therefore we may encounter manufacturing issues or delays.
Ours is an evolving technology and we are pioneers in this active matrix OLED microdisplay manufacturing technique. As such, we cannot assure you that we will be able to produce our products in sufficient quantity and quality to maintain existing customers and attract new customers. In addition, we cannot assure you that we will not experience manufacturing problems which could result in delays in delivery of orders or product introductions.
We are dependent on a single manufacturing line.
We currently manufacture our products on a single manufacturing line. If we experience any significant disruption in the operation of our manufacturing facility or a serious failure of a critical piece of equipment, we may be unable to supply microdisplays to our customers. For this reason, some OEMs may also be reluctant to commit a broad line of products to our microdisplays without a second production facility in place. However, we try to maintain product inventory to fill the requirements under such circumstances. Interruptions in our manufacturing could be caused by manufacturing equipment problems, the introduction of new equipment into the manufacturing process or delays in the delivery of new manufacturing equipment. Lead-time for delivery, installation and testing of manufacturing equipment can be extensive. No assurance can be given that we will not lose potential sales or be unable to meet production orders due to production interruptions in our manufacturing line.
We rely on key sole source and limited source suppliers.
We depend on a number of sole source or limited source suppliers for certain raw materials, components, and services. These include circuit boards, graphic integrated circuits, passive components, materials and chemicals, and equipment support. We maintain several single-source supplier relationships, either because alternative sources are not available or because the relationship is advantageous due to performance, quality, support, delivery, capacity, or price considerations. Even where alternative sources of supply are available, qualification of the alternative suppliers and establishment of reliable supplies could result in delays and a possible loss of sales, which could be detrimental to operating results. We do not manufacture the silicon integrated circuits on which we incorporate our OLED technology. Instead, we provide the design layouts to a sole semiconductor contract manufacturer who manufactures the integrated circuits on silicon wafers. Our inability to obtain sufficient quantities of components and other materials or services on a timely basis could result in manufacturing delays, increased costs and ultimately in reduced or delayed sales or lost orders which could materially and adversely affect our operating results. Generally, we do not have long term contracts or written agreements with our source suppliers, but instead operate on the basis of short term purchase orders.
11
Our results of operations, financial condition, and business would be harmed if we were unable to balance customer demand and capacity.
As customer demand for our products changes, and as we enter new markets which may require higher volume mass production, we must be able to ramp up or adjust our production capacity to meet demand. We are continually taking steps to address our manufacturing capacity needs for our products. If we are not able to expand or if we increase our capacity too quickly, our prospects may be limited and our business and results of operations could be adversely impacted. If we experience delays or unforeseen costs associated with adjusting our capacity levels, we may not be able to achieve our financial targets. For some of our products, vendor lead times exceed our customers’ required delivery time causing us to order to forecast rather than order based on actual demand. Ordering raw material and building finished goods based on forecasts exposes us to numerous risks including potential inability to service customer demand in an acceptable timeframe, holding excess inventory or having unabsorbed manufacturing overhead.
Variations in our production yields impact our ability to reduce costs and could cause our margins to decline and our operating results to suffer.
All of our products are manufactured using technologies that are highly complex. The number of usable items, or yield, from our production processes may fluctuate as a result of many factors, including but not limited to the following:
|
·
|
variability in our process repeatability and control;
|
|||||
|
·
|
contamination of the manufacturing environment or equipment;
|
|||||
|
·
|
equipment failure, power outages, or variations in the manufacturing process;
|
|||||
|
·
|
lack of consistency and adequate quality and quantity of piece parts and other raw materials;
|
|||||
|
·
|
defects in packaging either within or without our control; and
|
|||||
|
·
|
any transitions or changes in our production process, planned or unplanned.
|
|||||
We could experience manufacturing interruptions, delays, or inefficiencies if we are unable to timely and reliably procure components from single-sourced suppliers.
We maintain several single-source supplier relationships, either because alternative sources are not available or because the relationship is advantageous due to performance, quality, support, delivery, capacity, or price considerations. If the supply of a critical single-source material or component is delayed or curtailed, we may not be able to ship the related product in desired quantities and in a timely manner. Even where alternative sources of supply are available, qualification of the alternative suppliers and establishment of reliable supplies could result in delays and a possible loss of sales, which could harm operating results.
12
RISKS RELATED TO OUR INTELLECTUAL PROPERTY
We may not be successful in protecting our intellectual property and proprietary rights.
We rely on a combination of patents, trade secret protection, licensing agreements and other arrangements to establish and protect our proprietary technologies. If we fail to successfully enforce our intellectual property rights, our competitive position could suffer, which could harm our operating results. Patents may not be issued for our current patent applications, third parties may challenge, invalidate or circumvent any patent issued to us, unauthorized parties could obtain and use information that we regard as proprietary despite our efforts to protect our proprietary rights, rights granted under patents issued to us may not afford us any competitive advantage, others may independently develop similar technology or design around our patents, and protection of our intellectual property rights may be limited in certain foreign countries. On April 30, 2007, the U.S. Supreme Court, in KSR International Co. vs. Teleflex, Inc., mandated a more expansive and flexible approach towards a determination as to whether a patent is obvious and invalid, which may make it more difficult for patent holders to secure or maintain existing patents. Any future infringement or other claims or prosecutions related to our intellectual property could have a material adverse effect on our business. Any such claims, with or without merit, could be time consuming to defend, result in costly litigation, divert management's attention and resources, or require us to enter into royalty or licensing agreements. Such royalty or licensing agreements, if required, may not be available on terms acceptable to us, if at all. Protection of intellectual property has historically been a large yearly expense for eMagin. For a period prior to 2008, we were not in a financial position to properly protect all of our intellectual property, and may not be in a position to properly protect our position or stay ahead of competition in new research and the protecting of the resulting intellectual property.
In addition to patent protection, we also rely on trade secrets and other non-patented proprietary information relating to our product development and manufacturing activities. We try to protect this information through appropriate efforts to maintain its secrecy, including requiring employees and third parties to sign confidentiality agreements. We cannot be sure that these efforts will be successful or that the confidentiality agreements will not be breached. We also cannot be sure that we would have adequate remedies for any breach of such agreements or other misappropriation of our trade secrets or that our trade secrets and proprietary know-how will not otherwise become known or be independently discovered by others.
RISKS RELATED TO THE MICRODISPLAY INDUSTRY
The commercial success of the microdisplay industry depends on the widespread market acceptance of microdisplay systems products.
The commercial market for microdisplays is still emerging. Our long-term success may depend on consumer acceptance of microdisplays as well as the success of the commercialization of the microdisplay market. As an OEM supplier, our customer's products must also be well accepted. At present, it is difficult to assess or predict with any assurance the potential size, timing and viability of market opportunities for our technology in this market.
The microdisplay systems business is intensely competitive.
We do business in intensely competitive markets that are characterized by rapid technological change, changes in market requirements and competition from both other suppliers and our potential OEM customers. Such markets are typically characterized by price erosion. This intense competition could result in pricing pressures, lower sales, reduced margins, and lower market share. Our ability to compete successfully will depend on a number of factors, both within and outside our control. We expect these factors to include the following:
|
·
|
our success in designing, manufacturing and delivering expected new products, including those implementing new technologies on a timely basis;
|
||||||
|
·
|
our ability to address the needs of our customers and the quality of our customer services;
|
||||||
|
·
|
the quality, performance, reliability, features, ease of use and pricing of our products;
|
||||||
|
·
|
successful expansion of our manufacturing capabilities;
|
||||||
|
·
|
our efficiency of production, and ability to manufacture and ship products on time;
|
||||||
|
·
|
the rate at which original equipment manufacturing customers incorporate our product solutions into their own products;
|
||||||
|
·
|
the market acceptance of our customers' products; and
|
||||||
|
·
|
product or technology introductions by our competitors.
|
||||||
Our competitive position could be damaged if one or more potential OEM customers decide to manufacture their own microdisplays, using OLED or alternate technologies. In addition, our customers may be reluctant to rely on a relatively small company such as eMagin for a critical component. We cannot assure you that we will be able to compete successfully against current and future competition, and the failure to do so would have a materially adverse effect upon our business, operating results and financial condition.
The display industry may be cyclical.
Our business strategy is dependent on OEM manufacturers building and selling products that incorporate our OLED displays as components into those products. Industry-wide fluctuations could cause significant harm to our business. The OLED microdisplay sector may experience overcapacity, if and when all of the facilities presently in the planning stage come on line, leading to a difficult market in which to sell our products.
Our competitors have many advantages over us.
As the microdisplay market develops, we expect to experience intense competition from numerous domestic and foreign companies including well-established corporations possessing worldwide manufacturing and production facilities, greater name recognition, larger retail bases and significantly greater financial, technical, and marketing resources than us, as well as from emerging companies who may be subsidized by their governments. We cannot assure you that we will be able to compete successfully against current and future competition, and the failure to do so would have a materially adverse effect upon our business, operating results and financial condition.
Our products are subject to lengthy OEM development periods.
We sell most of our microdisplays to OEMs who will incorporate them into products they sell. OEMs determine during their product development phase whether they will incorporate our products. The time elapsed between initial sampling of our products by OEMs, the custom design of our products to meet specific OEM product requirements, and the ultimate incorporation of our products into OEM consumer products is significant, often with a duration of between one and three years. If our products fail to meet our OEM customers' cost, performance or technical requirements or if unexpected technical challenges arise in the integration of our products into OEM consumer products, our operating results could be significantly and adversely affected. Long delays in achieving customer qualification and incorporation of our products could adversely affect our business.
13
In order to increase or maintain our profit margins we may have to continuously develop new products, product enhancements and new technologies.
In some markets, prices of established products tend to decline over time. In order to increase or maintain our profit margins over the long term, we believe that we will need to continuously develop new products, product enhancements and new technologies that will either slow price declines of our products or reduce the cost of producing and delivering our products. While we anticipate many opportunities to reduce production costs over time, there can be no assurance that these cost reduction plans will be successful, that we will have the resources to fund the expenditures necessary to implement certain cost-saving measures, or that our costs can be reduced as quickly as any reduction in unit prices. We may also attempt to offset the anticipated decrease in our average selling price by introducing new products with higher selling prices that may or may not offset price declines in more mature products. If we fail to do so, our results of operations could be materially and adversely affected.
RISKS RELATED TO OUR BUSINESS
Our success depends on attracting and retaining highly skilled and qualified technical and consulting personnel.
We must hire highly skilled technical personnel as employees and as independent contractors in order to develop our products. The competition for skilled technical employees is intense and we may not be able to retain or recruit such personnel. We must compete with companies that possess greater financial and other resources than we do, and that may be more attractive to potential employees and contractors. To be competitive, we may have to increase the compensation, bonuses, stock options and other fringe benefits offered to employees in order to attract and retain such personnel. The costs of attracting and retaining new personnel may have a materially adverse affect on our business and our operating results.
Our success depends in a large part on the continuing service of key personnel.
Changes in management could have an adverse effect on our business. We are dependent upon the active participation of several key management personnel and will also need to recruit additional management in order to expand according to our business plan. The failure to attract and retain additional management or personnel could have a material adverse effect on our operating results and financial performance.
Our operating results are substantially dependent on the development and acceptance of new products and technology innovations.
Our future success may depend on our ability to develop new and lower cost solutions for existing and new markets and for customers to accept those solutions. We must introduce new products in a timely and cost-efficient manner, and we must secure production orders for those products from our customers. The development of new products is a highly complex process, and we historically have experienced delays in completing the development and introduction of new products. Some or all of those technologies or products may not successfully make the transition from the research and development lab. Even when we successfully complete a research and development effort with respect to a particular product or technology, it may fail to gain market acceptance. The successful development and introduction of these products depends on a number of factors, including the following:
|
·
|
achievement of technology breakthroughs required to make commercially viable devices;
|
|||||||||
|
·
|
the accuracy of our predictions of market requirements;
|
|||||||||
|
·
|
acceptance of our new product designs;
|
|||||||||
|
·
|
acceptance of new technology in certain markets;
|
|||||||||
|
·
|
the availability of qualified research and development and product development personnel;
|
|||||||||
|
·
|
our timely completion of product designs and development;
|
|||||||||
|
·
|
our ability and available resources to expand sales;
|
|||||||||
|
·
|
our ability to develop repeatable processes to manufacture new products in sufficient quantities and at low enough costs for commercial sales;
|
|||||||||
|
·
|
our customers’ ability to develop competitive products incorporating our products; and
|
|||||||||
|
·
|
acceptance of our customers’ products by the market.
|
|||||||||
If any of these or other factors become problematic, we may not be able to develop and introduce these new products in a timely or cost-effective manner.
If government agencies or companies discontinue or curtail their funding for our research and development programs our business may suffer.
Changes in federal budget priorities could adversely affect our contract and display product revenue. Historically, government agencies have funded a significant part of our research and development activities. Our funding has the risk of being redirected to other programs when the government changes budget priorities, such as in time of war or for other reasons. Government contracts are also subject to the risk that the government agency may not appropriate and allocate all funding contemplated by the contract. In addition our government contracts generally permit the contracting authority to terminate the contract for the convenience of the government. The full value of the contracts would not be realized if they were prematurely terminated. We may be unable to incur sufficient allowable costs to generate the full estimated contract values. Furthermore, the research and development and product procurement contracts of the customers we supply may be similarly impacted. If the government funding is discontinued or reduced, our ability to develop or enhance products could be limited and our business results or operations and financial conditions could be adversely affected.
14
Our business depends on new products and technologies.
The market for our products is characterized by rapid changes in product, design and manufacturing process technologies. Our success depends to a large extent on our ability to develop and manufacture new products and technologies to match the varying requirements of different customers in order to establish a competitive position and become profitable. Furthermore, we must adopt our products and processes to technological changes and emerging industry standards and practices on a cost-effective and timely basis. Our failure to accomplish any of the above could harm our business and operating results.
We generally do not have long-term contracts with our customers.
Our business has primarily operated on the basis of short-term purchase orders. We receive some longer term purchase agreements, and procurement contracts, but we cannot guarantee that we will continue to do so. Our current purchase agreements can be cancelled or revised without penalty, depending on the circumstances. We plan production primarily on the basis of internally generated forecasts of demand based on communications with customers, and available industry data which makes it difficult to accurately forecast revenues. If we fail to accurately forecast operating results, our business may suffer and the value of your investment in eMagin may decline.
Our business strategy may fail if we cannot continue to form strategic relationships with companies that manufacture and use products that could incorporate our active matrix OLED technology.
Our prospects could be significantly affected by our ability to develop strategic alliances with OEMs for incorporation of our active matrix OLED microdisplay technology into their products. While we intend to continue to establish strategic relationships with manufacturers of electronic consumer products, personal computers, chipmakers, lens makers, equipment makers, material suppliers and/or systems assemblers, there is no assurance that we will be able to continue to establish and maintain strategic relationships on commercially acceptable terms, or that the alliances we do enter in to will realize their objectives. Failure to do so could have a material adverse effect on our business.
Our business depends to some extent on international transactions.
We purchase needed materials from companies located abroad and may be adversely affected by political and currency risk, as well as the additional costs of doing business with foreign entities. Some customers in other countries have longer receivable periods or warranty periods. In addition, many of the foreign OEMs that are the most likely long-term purchasers of our microdisplays expose us to additional political and currency risk. We may find it necessary to locate manufacturing facilities abroad to be closer to our customers which could expose us to various risks, including management of a multi-national organization, the complexities of complying with foreign laws and customs, political instability and the complexities of taxation in multiple jurisdictions.
Our business may expose us to product liability claims.
Our business may expose us to potential product liability claims. Although no such claims have been brought against us to date, and to our knowledge no such claim is threatened or likely, we may face liability to product users for damages resulting from the faulty design or manufacture of our products. While we plan to maintain product liability insurance coverage, there can be no assurance that product liability claims will not exceed coverage limits, fall outside the scope of such coverage, or that such insurance will continue to be available at commercially reasonable rates, if at all.
Our business is subject to environmental regulations and possible liability arising from potential employee claims of exposure to harmful substances used in the development and manufacture of our products.
We are subject to various governmental regulations related to toxic, volatile, experimental and other hazardous chemicals used in our design and manufacturing process. Our failure to comply with these regulations could result in the imposition of fines or in the suspension or cessation of our operations. Compliance with these regulations could require us to acquire costly equipment or to incur other significant expenses. We develop, evaluate and utilize new chemical compounds in the manufacture of our products. While we attempt to ensure that our employees are protected from exposure to hazardous materials, we cannot assure you that potentially harmful exposure will not occur or that we will not be liable to employees as a result.
15
Some of our business is subject to U.S. government procurement laws and regulations.
We must comply with certain laws and regulations relating to the formation, administration and performance of federal government contracts. These laws and regulations affect how we conduct business with our federal government contracts, including the business that we do as a subcontractor. In complying with these laws and regulations, we may incur additional costs, and non-compliance may lead to the assessment of fines and penalties, including contractual damages, or the loss of business.
Our business is subject to export laws and regulations.
We engage in international work falling under the jurisdiction of U.S. export control laws. Failure to comply with these control regimes can lead to severe penalties, both civil and criminal, and can include debarment from contracting with the U.S. government.
Current adverse economic conditions may adversely impact our business, operating results and financial condition.
The current economic conditions and market instability may affect our customers and suppliers. Any adverse financial or economic impact to our customers may impact their ability to pay timely, or result in their inability to pay. It may also impact their ability to fund future purchases, or increase the sales cycles which could lead to a reduction in revenue and accounts receivable. Our suppliers may increase their prices or may be unable to supply needed raw materials on a timely basis which could result in our inability to meet customers’ demand or affect our gross margins. Our suppliers may, also, impose more stringent payment terms on us. The timing and nature of any recovery in the credit and financial markets remains uncertain, and there can be no assurance that market conditions will improve in the near future or that our results will not be materially and adversely affected.
RISKS RELATED TO OUR STOCK
The substantial number of shares that are or will be eligible for sale could cause our common stock price to decline even if eMagin is successful.
Sales of significant amounts of common stock in the public market, or the perception that such sales may occur, could materially affect the market price of our common stock. These sales might also make it more difficult for us to sell equity or equity-related securities in the future at a time and price that we deem appropriate. As of January 31, 2011, we have outstanding common shares of 23,531,478 plus (i) options to purchase 4,424,751 shares, (ii) warrants to purchase 7,545,333 shares and (iii) convertible preferred stock to purchase 1,000,000 shares of common stock.
Changes in internal controls or accounting guidance could cause volatility in our stock price.
Guidance regarding implementation and interpretation of the provisions of Section 404 of the Sarbanes-Oxley Act continues to be issued by the standards-setting community. In July 2010, smaller reporting companies were granted permanent exemption from having to obtain an auditors’ report on management’s assertion of the effectiveness of its internal control over financial reporting. We became an accelerated filer as of December 31, 2011 and are subject to an audit of our internal controls. As a result of the ongoing interpretation of new guidance and the audit testing which may be required to be completed in the future, our internal controls over financial reporting may include an unidentified material weakness which would result in receiving an adverse opinion on our internal controls over financial reporting from our independent registered public accounting firm. This could result in significant additional expenditures responding to the Section 404 internal control audit, heightened regulatory scrutiny and potentially an adverse effect to the price of our stock.
In addition, due to increased regulatory scrutiny surrounding publicly traded companies, the possibility exists that a restatement of past financial results could be necessitated by an alternative interpretation of present accounting guidance and practice. Although management does not currently anticipate that this will occur, a potential result of such interpretation could be an adverse effect on our stock price.
The market price of our common stock may be volatile.
The market price of our common stock has been subject to wide fluctuations. During our four most recently completed fiscal quarters, the closing price of our stock ranged from $2.37 to $9.04 and decreased to a low of $2.28 on October 4, 2011. The market price of our common stock in the future is likely to continue to be subject to wide fluctuations in response to various factors, including, but not limited to, the following:
|
·
|
variations in our operating results and financial conditions;
|
|||
|
·
|
actual or anticipated announcements of technical innovations, new product developments, or design wins by us or our competitors;
|
|||
|
·
|
general conditions in the semiconductor and flat panel display industries; and
|
|||
|
·
|
worldwide economic and financial conditions.
|
|||
16
In addition, the public stock markets have experienced extreme price and volume fluctuations that have particularly affected the market price for many technology companies and that have often been unrelated to the operating performance of these companies. The broad market fluctuations and other factors may continue to adversely affect the market price of our common stock.
Concentration of ownership of our stock may enable one shareholder or a small number of shareholders to significantly influence matters requiring shareholder approval.
Stillwater Holdings LLC (f/k/a Stillwater LLC) currently owns approximately 31.89% of our outstanding voting stock and the sole member of Stillwater Holdings LLC is the investment manager of Rainbow Gate Corporation, which currently owns approximately 5.54% of our outstanding voting stock. Together such shareholders currently own approximately 37.43% of our outstanding voting stock. As a result, these shareholders, if they act together, may be able to exert a significant degree of influence over matters requiring shareholder approval, including the election of directors and approval of significant corporate transactions. Further, if these shareholders act together with another shareholder, Ginola Limited, which has common directors with Mount Union Corp., Chelsea Trust Company and Crestflower Corporation, they would collectively represent approximately 46.5% of our outstanding voting stock. This concentration of ownership may facilitate or hinder a change of control and might affect the market price of our common stock. Furthermore, the interests of this concentration of ownership may not always coincide with our interests or the interests of other shareholders. Nevertheless, the ability to influence the election of the Board of Directors or otherwise have influence does not modify the fiduciary duties of the Board of Directors to represent the interests of all shareholders.
ITEM 1B. UNRESOLVED STAFF COMMENTS
ITEM 2. PROPERTIES
Our corporate offices are located in Bellevue, Washington. Our Washington location includes administrative, finance, operations, research and development and sales and marketing functions and consists of leased space of approximately 6,300 square feet. The lease expires in 2014. Our manufacturing facility is located in Hopewell Junction, New York, where we lease approximately 37,000 square feet from IBM. The New York facility houses our equipment for OLED microdisplay fabrication, assembly operations, research and development, and product development functions. The lease expires in 2014. In addition, the Company leases approximately 2,400 square feet of office space for design and product development in Santa Clara, California and the lease expires on October 31, 2012.
We believe our facilities are adequate for our current and near-term needs. We believe we will be able to renew these leases or obtain alternative spaces or additional spaces as necessary under acceptable terms. See Note 11 to the Consolidated Financial Statements for more information about lease commitments.
ITEM 3. LEGAL PROCEEDINGS
On March 17, 2010, Gary Jones, a former executive at the Company filed a complaint for damages in the Superior Court of the State of Washington for King County against the Company and the Company's Chief Financial Officer. The court dismissed the matter on April 7, 2011 with prejudice.
ITEM 4. MINE SAFETY DISCLOSURES
None.
17
ITEM 5. MARKET FOR REGISTRANT'S COMMON EQUITY, RELATED SHAREHOLDER MATTERS AND ISSUER PURCHASES OF EQUITY SECURITIES
During 2009 and until May 17, 2010, our common stock was quoted on the OTC Bulletin Board under the symbol "EMAN". As of May 18, 2010, our common stock trades on the NYSE Amex under the symbol “EMAN”. The following table sets forth the range of high and low prices per share of our common stock for each period indicated.
|
2011
|
2010
|
|||||||||||||||
|
High
|
Low
|
High
|
Low
|
|||||||||||||
|
First quarter
|
$
|
9.31
|
$
|
5.91
|
$
|
3.90
|
$
|
1.47
|
||||||||
|
Second quarter
|
$
|
8.94
|
$
|
4.41
|
$
|
5.49
|
$
|
2.88
|
||||||||
|
Third quarter
|
$
|
6.49
|
$
|
2.60
|
$
|
3.65
|
$
|
1.91
|
||||||||
|
Fourth quarter
|
$
|
4.94
|
$
|
2.28
|
$
|
6.00
|
$
|
3.00
|
||||||||
As of January 31, 2012, there were 305 holders of record of our common stock. Because brokers and other institutions hold many of the shares on behalf of shareholders, we are unable to determine the actual number of shareholders represented by these record holders.
Dividends
We have never declared or paid cash dividends on our common stock. We currently anticipate that we will retain all future earnings to fund the operation of our business and do not anticipate paying dividends on our common stock in the foreseeable future.
Recent Issuances of Unregistered Stock
None.
Purchases of Equity Securities by the Issuer
On August 24, 2011, eMagin’s Board of Directors approved a stock repurchase program authorizing the Company to purchase up to $2.5 million in total value. The table below presents information pursuant to Item 703 of Regulation S-K regarding the repurchase of the Company’s common stock by the Company in the three month period December 31, 2011.
|
Period
|
Total Number of Shares Purchased
|
Average Price Paid Per Share
|
Total Number of Shares Purchased as Part of the Publicly Announced Plans or Programs
|
Maximum Approximate Dollar Value of Shares that May Yet be Purchased Under the Plans or Programs
|
||||||||||||
|
October 1 - October 31, 2011
|
— | $ | — | — | $ | 2,500,000 | ||||||||||
|
November 1 - November 30, 2011
|
— | $ | — | — | $ | 2,500,000 | ||||||||||
|
December 1 - December 31, 2011
|
25,000 | $ | 3.81 | 25,000 | $ | 2,404,807 | ||||||||||
|
Total
|
25,000 | $ | 3.81 | 25,000 | ||||||||||||
18
Stock Performance
The following graph shows the comparison of total stockholder return for holders of our common stock (EMAN), the New York Stock Exchange Composite Index (NYSE) and the Philadelphia Stock Exchange Semiconductor Index (SOX) from December 31, 2006 through December 31, 2011. The graph and table assume that $100 was invested on December 31, 2006 in each of our common stock, the NASDAQ Composite Index and the Philadelphia Stock Exchange Semiconductor Index and that all dividends are reinvested. The comparisons in the table are required by the SEC and are not intended to forecast or be indicative of possible future performance of the Company’s common stock.
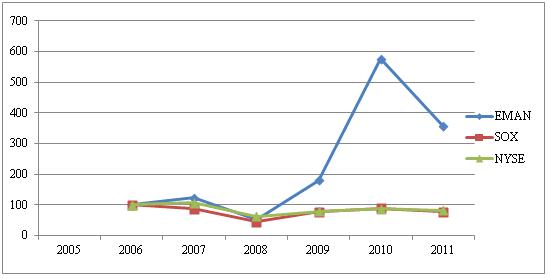
|
2006
|
2007
|
2008
|
2009
|
2010
|
2011
|
|||||||||||||||||||
|
EMAN
|
$
|
100.00
|
$
|
123.08
|
$
|
51.92
|
$
|
180.77
|
$
|
576.92
|
$
|
355.77
|
||||||||||||
|
NYSE
|
$
|
100.00
|
$
|
87.37
|
$
|
45.40
|
$
|
77.09
|
$
|
88.22
|
$
|
77.94
|
||||||||||||
|
SOX
|
$
|
100.00
|
$
|
106.58
|
$
|
62.99
|
$
|
78.61
|
$
|
87.14
|
$
|
81.81
|
||||||||||||
Equity Compensation Plan Information
The following table sets forth the aggregate information of our equity compensation plans in effect as of December 31, 2011:
|
Plan
|
Number of
securities to be
issued upon exercise
of outstanding options
and rights
|
Weighted-average
exercise price of
outstanding options and rights
|
Number of securities
remaining available for
future issuance under
equity compensation plans
(excluding securities reflected
in first column
|
|||||||||
|
Equity compensation plans approved by security holders – 2011 Incentive Stock Plan
|
473,499
|
$
|
4.03
|
926,501
|
||||||||
|
Equity compensation plans approved by security holders – Amended and Restated 2003 Employee Stock Option Plan
|
2,939,238
|
$
|
4.26
|
125,978
|
||||||||
|
Equity compensation plans not approved by security holders – 2008 Incentive Stock Plan
|
829,514
|
$
|
2.70
|
45,500
|
||||||||
19
ITEM 6. SELECTED FINANCIAL DATA
The following selected consolidated financial data should be read in conjunction with our consolidated financial statements and related notes and “Management’s Discussion and Analysis of Financial Condition and Results of Operations”. The consolidated statements of operations data for the years ended December 31, 2011, 2010 and 2009 and the balance sheet data at December 31, 2011,and 2010 are derived from our audited financial statements which are included elsewhere in this Form 10-K. The consolidated statements of operations data for the years ended December 31, 2008 and 2007 and the balance sheet data at December 31, 2009, 2008 and 2007 are derived from our audited financial statements which are not included in this Form 10-K. The historical results are not necessarily indicative of results to be expected for future periods. The following information is presented in thousands, except per share data.
Consolidated Statements of Operations Data:
|
For the Year Ended December 31,
|
||||||||||||||||||||
|
2011
|
2010
|
2009
|
2008
|
2007
|
||||||||||||||||
|
(In thousands, except per share data)
|
||||||||||||||||||||
|
Revenue
|
$
|
29,181
|
$
|
30,458
|
$
|
23,822
|
$
|
18,739
|
$
|
17,554
|
||||||||||
|
Cost of goods sold
|
13,707
|
12,018
|
10,175
|
10,673
|
||||||||||||||||
|
Gross profit
|
15,474
|
18,440
|
13,647
|
8,066
|
4,926
|
|||||||||||||||
|
Operating expenses:
|
||||||||||||||||||||
|
Research and development
|
3,063
|
2,370
|
1,996
|
2,081
|
2,949
|
|||||||||||||||
|
Selling, general and administrative
|
9,136
|
10,055
|
6,900
|
6,254
|
6,591
|
|||||||||||||||
|
Total operating expenses
|
12,199
|
12,425
|
8,896
|
8,335
|
9,540
|
|||||||||||||||
|
Income (loss) from operations
|
3,275
|
6,015
|
4,751
|
(269
|
)
|
(4,614
|
)
|
|||||||||||||
|
Other income (expense), net
|
2,486
|
(16,086
|
)
|
(6,932
|
)
|
(1,590
|
)
|
(13,874
|
)
|
|||||||||||
|
Net income (loss) prior to income tax provision
|
5,761
|
(10,071
|
)
|
(2,181
|
)
|
(1,859
|
)
|
(18,488
|
)
|
|||||||||||
|
Income tax (benefit) expense
|
795
|
(8,931
|
)
|
90
|
—
|
—
|
||||||||||||||
|
Net income (loss)
|
$
|
4,966
|
$
|
(1,140
|
)
|
$
|
(2,271
|
)
|
$
|
(1,859
|
)
|
$
|
(18,488
|
)
|
||||||
|
Income (loss) per share, basic
|
$
|
0.17
|
$
|
(0.06
|
)
|
$
|
(0.14
|
)
|
$
|
(0.13
|
)
|
$
|
(1.59
|
)
|
||||||
|
Income (loss) per share, diluted
|
$
|
0.06
|
$
|
(0.06
|
)
|
$
|
(0.14
|
)
|
$
|
(0.13
|
)
|
$
|
(1.59
|
)
|
||||||
|
Shares used in calculation, basic
|
22,448,138
|
19,239,933
|
16,343,650
|
14,175,220
|
11,633,367
|
|||||||||||||||
|
Shares used in calculation, diluted
|
25,574,522
|
19,239,933
|
16,343,650
|
14,175,220
|
11,633,367
|
|||||||||||||||
Consolidated Balance Sheet Data:
(In thousands)
|
December 31,
|
||||||||||||||||||||
|
2011
|
2010
|
2009
|
2008
|
2007
|
||||||||||||||||
|
Cash and cash equivalents
|
$
|
7,571
|
$
|
7,796
|
$
|
5,295
|
$
|
2,404
|
$
|
713
|
||||||||||
|
Working capital (deficit)
|
$
|
18,839
|
$
|
5,881
|
$
|
8,581
|
$
|
3,300
|
$
|
(4,708
|
)
|
|||||||||
|
Total assets
|
$
|
37,932
|
$
|
32,702
|
$
|
13,980
|
$
|
10,104
|
$
|
6,648
|
||||||||||
|
Long-term obligations
|
$
|
—
|
$
|
5,158
|
$
|
6,844
|
|
$
|
—
|
$
|
60
|
|||||||||
|
Total shareholders’ equity (capital deficit)
|
$
|
34,111
|
$
|
14,697
|
$
|
2,893
|
$
|
3,661
|
$
|
(4,170
|
)
|
|||||||||
20
ITEM 7. MANAGEMENT'S DISCUSSION AND ANALYSIS OF FINANCIAL CONDITION AND RESULTS OF OPERATIONS
Introduction
The following discussion should be read in conjunction with the Financial Statements and Notes thereto. Our fiscal year ends December 31. This document contains certain forward-looking statements including, among others, anticipated trends in our financial condition and results of operations and our business strategy. These forward-looking statements are based largely on our current expectations and are subject to a number of risks and uncertainties. (See Part I, Item 1A, "Risk Factors "). Actual results could differ materially from these forward-looking statements. Important factors to consider in evaluating such forward-looking statements include (i) changes in external factors or in our internal budgeting process which might impact trends in our results of operations; (ii) unanticipated working capital or other cash requirements; (iii) changes in our business strategy or an inability to execute our strategy due to unanticipated changes in the industries in which we operate; and (iv) various competitive market factors that may prevent us from competing successfully in the marketplace.
Overview
We design and manufacture miniature displays, which we refer to as OLED-on-silicon-microdisplays, and microdisplay modules for virtual imaging, primarily for incorporation into the products of other manufacturers. Microdisplays are typically smaller than many postage stamps, but when viewed through a magnifier they can contain all of the information appearing on a high-resolution personal computer screen. Our microdisplays use organic light emitting diodes, or OLEDs, which emit light themselves when a current is passed through the device. Our technology permits OLEDs to be coated onto silicon chips to produce high resolution OLED-on-silicon microdisplays.
We believe that our OLED-on-silicon microdisplays offer a number of advantages in near to the eye applications over other current microdisplay technologies, including lower power requirements, less weight, fast video speed without flicker, and wider viewing angles. In addition, many computer and video electronic system functions can be built directly into the OLED-on-silicon microdisplay, resulting in compact systems with lower expected overall system costs relative to alternate microdisplay technologies.
We have devoted significant resources to the development and commercial launch of our OLED microdisplay products into military, industrial and medical applications world-wide. First sales of our SVGA+ microdisplay began in May 2001 and we launched the SVGA-3D microdisplay in February 2002. Over 200,000 of these products have been sold and fielded. In 2008 the SXGA microdisplay became our first digital display, and in 2011 we introduced the VGA OLED-XL, our lowest powered microdisplay, and the WUXGA OLED-XL which exceeds 1080p HD resolution. As of January 31, 2012, we had a backlog of approximately $11.5 million in products ordered for delivery through December 31, 2012 as compared to a backlog of $9.8 million as of January 31, 2011. This backlog consists of non-binding purchase orders and purchase agreements. These products are being applied or considered for near-eye and headset applications in products such as thermal imagers, night vision goggles, entertainment headsets, handheld Internet and telecommunication appliances, viewfinders, and wearable computers to be manufactured by original equipment manufacturer (OEM) customers. We have also continued to ship our Z800 3DVisor personal display systems.
In addition to marketing OLED-on-silicon microdisplays as components, we also offer microdisplays as an integrated package, which we call microviewer that includes a compact lens for viewing the microdisplay and electronic interfaces to convert the signal from our customer's product into a viewable image on the microdisplay. We have also expanded our design and production activities to include display/optical subsystem assemblies for both military and commercial end-use products. We have developed a strong intellectual property portfolio that includes patents, manufacturing know-how and unique proprietary technologies to create high performance OLED-on-silicon microdisplays and related optical systems. We believe our technology, intellectual property portfolio and position in the marketplace, gives us a leadership position in OLED and OLED-on-silicon microdisplay technology. We are one of only a few companies in the world to market and produce significant quantities of high resolution full-color small molecule OLED-on-silicon microdisplays.
In 2010 we announced the award from ITT Night Vision for design and development of a display/optical assembly for the U.S. Army Enhanced Night Vision Goggle. We expect an announcement regarding this program in the second quarter of 2012. In 2011, we opened additional avenues of growth by securing R&D contracts with ITT, the Department of Energy and others while completing contacts with TATRC and other government agencies. We won a contract to commercialize our new WUXGA high-resolution (1920 x 1200) display. We secured important new customers in a new market for eMagin, electronic viewfinders, while continuing display shipments under the FELIN soldier program, Javelin program, U.S. Army thermal weapon sight remote viewer program, the Viper II thermal sight program and others.
21
Company History
As of January 1, 2003, we were no longer classified as a development stage company. We transitioned to manufacturing our product and have significantly increased our marketing, sales, and research and development efforts, and expanded our operating infrastructure. Currently, most of our operating expenses are labor related and semi-fixed. If we are unable to generate significant revenues, our net income in any given period could be less than expected.
Critical Accounting Policies
The Securities and Exchange Commission ("SEC") defines "critical accounting policies" as those that require application of management's most difficult, subjective or complex judgments, often as a result of the need to make estimates about the effect of matters that are inherently uncertain and may change in subsequent periods. Not all of the accounting policies require management to make difficult, subjective or complex judgments or estimates. However, the following policies could be deemed to be critical within the SEC definition.
Revenue and Cost Recognition
Revenue on product sales is recognized when persuasive evidence of an arrangement exists, such as when a purchase order or contract is received from the customer, the price is fixed, title and risk of loss to the goods has changed and there is a reasonable assurance of collection of the sales proceeds. We obtain written purchase authorizations from our customers for a specified amount of product at a specified price and consider delivery to have occurred at the time of shipment. Products sold directly to consumers have a thirty day right of return. Revenue on consumer products is deferred until the right of return has expired.
Revenues from research and development activities relating to firm fixed-price contracts and cost-type contracts are generally recognized on the percentage-of-completion method of accounting as costs are incurred (cost-to-cost basis). Contract costs include all direct material and labor costs and an allocation of allowable indirect costs as defined by each contract, as periodically adjusted to reflect revised agreed upon rates. These rates are subject to audit by the other party.
Product Warranty
We offer a one-year product replacement warranty. In general, our standard policy is to repair or replace the defective products. We accrue for estimated returns of defective products at the time revenue is recognized based on historical activity as well as for specific known product issues. The determination of these accruals requires us to make estimates of the frequency and extent of warranty activity and estimate future costs to replace the products under warranty. If the actual warranty activity and/or repair and replacement costs differ significantly from these estimates, adjustments to cost of revenue may be required in future periods.
Use of Estimates
In accordance with accounting principles generally accepted in the United States of America, management utilizes certain estimates and assumptions that affect the reported amounts of assets and liabilities at the date of the financial statements and the reported amounts of revenues and expenses during the reporting period. On an on-going basis, management evaluates its estimates and judgments related to, among others, allowance for doubtful accounts, warranty reserves, inventory reserves, stock-based compensation expense, deferred tax asset valuation allowances, litigation and other loss contingencies. Management bases its estimates and judgments on historical experience and on various other assumptions that are believed to be reasonable under the circumstances, the results of which form the basis for making judgments about the carrying values of assets and liabilities that are not readily apparent from other sources. Actual results could differ from those estimates.
Fair Value of Financial Instruments
eMagin’s cash, cash equivalents, accounts receivable, short-term investments, and accounts payable are stated at cost which approximates fair value due to the short-term nature of these instruments. In addition, the long-term investments are stated at cost which approximates fair value. eMagin measures the fair value of our warrants based on the Monte Carlo Simulation approach.
Stock-based Compensation
eMagin maintains several stock equity incentive plans. The 2005 Employee Stock Purchase Plan (the “ESPP”) provides our employees with the opportunity to purchase common stock through payroll deductions. Employees may purchase stock semi-annually at a price that is 85% of the fair market value at certain plan-defined dates. As of December 31, 2011, the number of shares of common stock available for issuance was 300,000. As of December 31, 2011, the plan had not been implemented.
The 2003 Stock Option Plan (the”2003 Plan”) provides for grants of shares of common stock and options to purchase shares of common stock to employees, officers, directors and consultants. Under the 2003 plan, an ISO grant is granted at the market value of our common stock at the date of the grant and a non-ISO is granted at a price not to be less than 85% of the market value of the common stock. These options have a term of up to 10 years and vest over a schedule determined by the Board of Directors, generally over a five year period. The amended 2003 Plan provides for an annual increase in common stock available for issuance by 3% of the diluted shares outstanding on January 1 of each year for a period of 9 years which commenced January 1, 2005. In 2011, there were 1,204,608 options granted from the 2003 Plan.
22
The 2008 Incentive Stock Plan (“the 2008 Plan”) adopted and approved by the Board of Directors on November 5, 2008 provides for shares of common stock and options to purchase shares of common stock to employees, officers, directors and consultants. The 2008 Plan has an aggregate of 2,000,000 shares. In 2011, there were 200,000 options granted from this plan.
The 2011 Incentive Stock Plan (“the 2011 Plan”) adopted and approved by the shareholders on November 3, 2011 provides for shares of common stock and options to purchase shares of common stock to employees, officers, directors and consultants. The 2011 Plan has an aggregate of 1,400,000 shares. In 2011, there were 473,499 options granted from this plan.
We account for the measurement and recognition of compensation expense for all share-based payment awards made to employees and directors by estimating the fair value of stock awards at the date of grant using the Black-Scholes option valuation model. Stock-based compensation expense is reduced for estimated forfeitures and is amortized over the vesting period using the straight-line method. See Note 10 of the Consolidated Financial Statements – Stock Compensation for a further discussion on stock-based compensation.
Income Taxes
We are required to estimate income taxes in each of the jurisdictions in which we operate. The process involves estimating our current tax expense together with assessing temporary differences resulting from the differing treatment of items for accounting and tax purposes. These differences result in deferred tax assets and liabilities. Operating losses and tax credits, to the extent not already utilized to offset taxable income also represent deferred tax assets. We must assess the likelihood that any deferred tax assets will be recovered from future taxable income, and to the extent we believe that recovery is not likely, we must establish a valuation allowance. Significant judgment is required in determining our provision for income taxes, deferred tax assets and liabilities and any valuation allowance recorded against our deferred tax assets.
In assessing the realizabiliy of deferred tax assets, we evaluate both positive and negative evidence that may exist and consider whether it is more likely than not that some portion or all of the deferred tax assets will be realized. From inception through 2009, we maintained a full valuation allowance against our deferred tax assets as we were unable to determine that it was more likely than not that we would generate sufficient future taxable income to utilize them. In 2010, we determined that based on all available evidence, both positive and negative, and based on the weight of the available evidence, including our cumulative taxable income over the past three years and expected profitability in 2011 through 2013 that certain of our deferred tax assets were more likely than not realizable through future earnings. Accordingly, we reduced our valuation allowance by $9.1 million and recorded a corresponding tax benefit of $9.1 million. In 2011, we determined that based on all available evidence, both positive and negative, and based on the weight of the available evidence, including our projected cumulative taxable income through 2016 that certain of our deferred tax assets were more likely than not realizable through future earnings. The projected cumulative taxable income through 2016 was less than the projected cumulative tax benefit used in an analysis prepared in 2010. We determined that the realizable asset was less than the amount recorded in the prior year and accordingly the net asset after the valuation allowance is approximately $ 1 million less as of December 31, 2011. We used projected taxable income though 2016 based on our history of taxable income and losses and estimates that the taxable income through 2016 is more likely than not to be realized and is less likely in periods after 2016.
In determining future taxable income, assumptions are made to forecast operating income, the reversal of temporary timing differences and the implementation of tax planning strategies. Management uses significant judgment in the assumptions it uses to forecast future taxable income which are consistent with the forecasts used to manage the business. Realization of the deferred tax asset is dependent upon future earnings which there is uncertainty as to the timing. We will continue to monitor the realizability of the deferred tax asset.
Our effective income tax rate was a provision of 14% in 2011, compared to a benefit of 89% in 2010. The year over year change in our effective tax rate was primarily due to the recognition of an $8.9 million benefit in 2010 due to the $9.1 million reduction of our deferred tax asset valuation allowance.
23
Results of Operations
The following table presents certain financial data as a percentage of total revenue for the periods indicated. Our historical operating results are not necessarily indicative of the results for any future period.
|
As a Percentage of Total
Revenue
Year Ended December 31,
|
||||||||||||
|
2011
|
2010
|
2009
|
||||||||||
|
Consolidated Statements of Operations Data:
|
||||||||||||
|
Revenue
|
100
|
%
|
100
|
%
|
100
|
%
|
||||||
|
Cost of goods sold
|
47
|
39
|
43
|
|||||||||
|
Gross profit
|
53
|
61
|
57
|
|||||||||
|
Operating expenses:
|
||||||||||||
|
Research and development
|
11
|
8
|
8
|
|||||||||
|
Selling, general and administrative
|
31
|
33
|
29
|
|||||||||
|
Total operating expenses
|
42
|
41
|
37
|
|||||||||
|
Income from operations
|
11
|
20
|
20
|
|||||||||
|
Other income (expense), net
|
9
|
(52
|
)
|
(29
|
)
|
|||||||
|
Income (loss) before provision for income taxes
|
20
|
(33
|
)
|
(9
|
)
|
|||||||
|
Income tax expense (benefit)
|
3
|
(29
|
)
|
—
|
||||||||
|
Net income (loss)
|
17
|
%
|
(4
|
)%
|
(9
|
)%
|
||||||
Year Ended December 31, 2011 Compared to Year Ended December 31, 2010
Revenues
Revenues decreased by approximately $1.3 million to a total of approximately $29.2 million for the year ended December 31, 2011 from approximately $30.5 million for the year ended December 31, 2010, representing a decrease of 4%. The decrease in revenue was due to a 17% decrease in contract revenue and a 54% decrease in headset revenue offset by a 2% increase in display revenues.
For the years ended December 31, 2011 and 2010, product revenue was approximately $23.5 million and $23.6 million, respectively. In 2011, there was a 7% increase in the number of displays sold however it was offset by a 4% decrease in the average selling price, a result of product and customer mix as compared to 2010. The 2011 product revenue was also impacted by the decrease in headset sales as we decided to suspend production of 3D displays for our headset product in order to allocate all production capacity to our customers’ display products. Contract revenue was approximately $5.7 million in 2011 as compared to $6.9 million for 2010, a decrease of approximately $1.2 million, which was a result of the change in the mix of contracts.
Cost of Goods Sold
Cost of goods sold is comprised of costs of product revenue and contract revenue. Cost of product revenue includes materials, labor and manufacturing overhead related to our products. Cost of contract revenue includes direct and allocated indirect costs associated with performance on contracts. Cost of goods sold for the year ended December 31, 2011 was approximately $13.7 million as compared to approximately $12.0 million for the year ended December 31, 2010, an increase of approximately $1.7 million. Cost of goods sold as a percentage of revenues was 47% for the year ended December 31, 2011 up from 39% for the year ended December 31, 2010 which is a result of increased labor and material costs due to the Company increasing the number of production shifts. Additional shifts were required to maximize output. The Company produced 13% more displays in 2011 as compared to 2010.
24
The following table outlines product, contract and total gross profit and related gross margins for the years ended December 31, 2011 and 2010 (dollars in thousands):
|
For the Year ended
December 31,
|
||||||||
|
2011
|
2010
|
|||||||
|
Product revenue gross profit
|
$
|
12,427
|
$
|
15,223
|
||||
|
Product revenue gross margin
|
53
|
%
|
65
|
%
|
||||
|
Contract revenue gross profit
|
$
|
3,047
|
$
|
3,217
|
||||
|
Contract revenue gross margin
|
54
|
%
|
47
|
%
|
||||
|
Total gross profit
|
$
|
15,474
|
$
|
18,440
|
||||
|
Total gross margin
|
53
|
%
|
61
|
%
|
||||
The gross profit for the year ended December 31, 2011 was approximately $15.5 million as compared to approximately $18.4 million for the year ended December 31, 2010, a decrease of $2.9 million. Gross margin was 53% for the year ended December 31, 2011 down from 61% for the year ended December 31, 2010.
The product gross profit for the year ended December 31, 2011 was approximately $12.4 million as compared to approximately $15.2 million for the year ended December 31, 2010, a decrease of $2.8 million. Product gross margin was 53% for the year ended December 31, 2011 down from 65% for the year ended December 31, 2010. The decrease in product gross profit and gross margin was due to lower average selling price and higher labor and material costs. In 2010, the average selling price was higher due to the mix of products sold which included custom display revenues which had a higher sales price. In 2011, production costs per unit including labor and materials were higher due to our output maximization effort including additional production shifts. Additional production personnel were hired to fill the extra shifts. The increased costs combined with the lower average selling price produced the lower gross margin.
The contract gross profit for the year ended December 31, 2011 was approximately $3.0 million as compared to approximately $3.2 million for the year ended December 31, 2010, a decrease of $0.2 million. Contract gross margin was 54% for the year ended December 31, 2011 up from 47% for the year ended December 31, 2010. The contract gross margin is dependent upon the mix of internal versus external third party costs, with the external third party costs causing a lower gross margin and reducing the contract gross profit. In 2011, we added an in-house design team that reduces the amount of external third party costs.
Research and Development Expenses
Research and development expenses include salaries, development materials and other costs specifically allocated to the development of new microdisplay products, OLED materials and subsystems. Research and development expenses for the year ended December 31, 2011 were approximately $3.1 million as compared to approximately $2.4 million for the year ended December 31, 2010, an increase of approximately $0.7 million. The increase was primarily related to an increase in personnel expense of $1.0 million which includes the addition of an in-house design team and a decrease in internal research and development of $0.3 million.
Selling, General and Administrative Expenses
Selling, general and administrative expenses consist principally of salaries, fees for professional services including legal fees, as well as other marketing and administrative expenses. Selling, general and administrative expenses for the year ended December 31, 2011 were approximately $9.1 million as compared to approximately $10.1 million for the year ended December 31, 2010, a decrease of approximately $1.0 million. The decrease is primarily related to a decrease in severance expense of $1.1 million, litigation settlement and legal fees of $1.3 million offset by an increase in non-cash compensation of $0.8 million, accounting fees of $0.2 million and recruiting expenses of $0.2 million.
Other Income (Expense)
Other income (expense), net consists primarily of interest income earned on investments, interest expense and income (expense) applicable to the change in the fair value of the warrant liability.
For the year ended December 31, 2011, interest expense was approximately $103 thousand as compared to approximately $115 thousand for the year ended December 31, 2010. For the year ended December 31, 2011, the interest expense associated with debt was approximately $44 thousand, loan fees associated with the new line of credit was approximately $31 thousand, and interest on liquidated damages expense related to registration payment arrangements of approximately $28 thousand. For the year ended December 31, 2010, the interest expense associated with debt was approximately $60 thousand, loan fees associated with the new line of credit was approximately $27 thousand, and interest on liquidated damages expense related to registration payment arrangements of approximately $28 thousand. The decrease in interest expense was primarily a result of renewing the line of credit in September 2011 and negotiating lower interest payments.
25
Other income for the year ended December 31, 2011 was approximately $44 thousand as compared to approximately $16 thousand for the year ended December 31, 2010. The other income for the year ended December 31, 2010 was interest income of approximately $31 thousand and $11 thousand from equipment salvage. The other income for the year ended December 31, 2010 was interest income of approximately $10 thousand and $6 thousand from equipment salvage.
Change in Fair Value of Warrant Liability. For the year ended December 31, 2011, the change in fair value of the warrant liability was income of $2.5 million as compared to a charge of $16.0 million for the year ended December 31, 2010. The change in the fair value of the warrant liability is primarily due to the change in the common stock price of eMagin period over period. The change in fair value of the warrant liability had no impact on our cash balances, operations, or operating income. As of December 31, 2011, all warrants have been exercised, expired, or modified to remove the anti-dilution provisions which reclassified the warrant liability to equity and therefore there will be no future effect on earnings.
Income Tax (Benefit) Expense
For the year ended December 31, 2011, income tax provision was approximately $0.8 million and for the year ended December 31, 2010, income tax benefit was approximately $8.9 million.
Net Income (Loss)
Net income totaled approximately $5.0 million for the year ended December 31, 2011 as compared to a net loss of approximately $1.1 million for the year ended December 31, 2010.
Year Ended December 31, 2010 Compared to Year Ended December 31, 2009
Revenues
Revenues increased by approximately $6.7 million to a total of approximately $30.5 million for the year ended December 31, 2010 from approximately $23.8 million for the year ended December 31, 2009, representing an increase of 28%. The increase in revenue was due to increased customer demand of our OLED displays and active research and development contracts.
For the year ended December 31, 2010, product revenue increased approximately $3.8 million as compared to the year ended December 31, 2009. The 19% increase was due to higher customer demand along with a shift in the mix of products. For the year ended December 31, 2010, contract revenue increased 70% or approximately $2.9 million as compared to the year ended December 31, 2009. The increase was a result of an increase in the number of active research and development projects in 2010 as compared to 2009.
Cost of Goods Sold
Cost of goods sold is comprised of costs of product revenue and contract revenue. Cost of product revenue includes materials, labor and manufacturing overhead related to our products. Cost of contract revenue includes direct and allocated indirect costs associated with performance on contracts. Cost of goods sold for the year ended December 31, 2010 were approximately $12.0 million as compared to approximately $10.2 million for the year ended December 31, 2009, an increase of approximately $1.8 million. Cost of goods sold as a percentage of revenues improved to 39% for the year ended December 31, 2010 from 43% for the year ended December 31, 2009.
The following table outlines product, contract and total gross profit and related gross margins for the years ended December 31, 2010 and 2009 (dollars in thousands):
|
For the Year ended December 31,
|
||||||||
|
2010
|
2009
|
|||||||
|
Product revenue gross profit
|
$
|
15,223
|
$
|
11,910
|
||||
|
Product revenue gross margin
|
65
|
%
|
60
|
%
|
||||
|
Contract revenue gross profit
|
$
|
3,217
|
$
|
1,737
|
||||
|
Contract revenue gross margin
|
47
|
%
|
43
|
%
|
||||
|
Total gross profit
|
$
|
18,440
|
$
|
13,647
|
||||
|
Total gross margin
|
61
|
%
|
57
|
%
|
||||
The gross profit for the year ended December 31, 2010 was approximately $18.4 million as compared to approximately $13.6 million for the year ended December 31, 2009, an increase of $4.8 million. Gross margin was 61% for the year ended December 31, 2010 up from 57% for the year ended December 31, 2009. The increase was attributable to increases in product gross margin of 5% and the contract gross margin of 4%.
26
The product gross profit for the year ended December 31, 2010 was approximately $15.2 million as compared to approximately $11.9 million for the year ended December 31, 2009, an increase of $3.3 million. Product gross margin was 65% for the year ended December 31, 2010 up from 60% for the year ended December 31, 2009. The increase in product gross profit and gross margin was due to higher sales volumes and improved product mix resulting in a higher average selling price in conjunction with a reduction of the warranty accrual. The higher average selling price was a result of the mix of products sold which included custom displays with a higher sales price.
The contract gross profit for the year ended December 31, 2010 was approximately $3.2 million as compared to approximately $1.7 million for the year ended December 31, 2009, an increase of $1.5 million. Contract gross margin was 47% for the year ended December 31, 2010 up from 43% for the year ended December 31, 2009. The contract gross margin is dependent upon the mix of internal versus external third party costs, with the external third party costs causing a lower gross margin and reducing the contract gross profit.
Research and Development Expenses
Research and development expenses include salaries, development materials and other costs specifically allocated to the development of new microdisplay products, OLED materials and subsystems. Research and development expenses for the year ended December 31, 2010 were approximately $2.4 million as compared to approximately $2.0 million for the year ended December 31, 2009, an increase of approximately $0.4 million. The increase was primarily related to an increase in internal research and development of $0.3 million and personnel expense of $0.1 million.
Selling, General and Administrative Expenses
Selling, general and administrative expenses consist principally of salaries, fees for professional services including legal fees, as well as other marketing and administrative expenses. Selling, general and administrative expenses for the year ended December 31, 2010 were approximately $10.1 million as compared to approximately $6.9 million for the year ended December 31, 2009, an increase of approximately $3.2 million. The increase is primarily related to severance expense of $1.1 million, personnel costs including non-cash compensation of $1.1 million, litigation settlement and legal fees of $1.5 million offset by a decrease in professional services of $0.1 million, accounting fees of $0.1 million and recruiting expenses of $0.2 million.
Other (Expense) Income
Other income (expense), net consists primarily of interest income earned on investments, interest expense and other costs related to the debt, miscellaneous income and expense applicable to the change in fair value of the warrant liability.
For the year ended December 31, 2010, interest expense was approximately $115 thousand as compared to approximately $466 thousand for the year ended December 31, 2009. For the year ended December 31, 2010, the interest expense associated with debt was approximately $60 thousand, loan fees associated with the new line of credit was approximately $27 thousand, and interest on liquidated damages expense related to registration payment arrangements of approximately $28 thousand. For the year ended December 31, 2009, the interest expense associated with debt was approximately $63 thousand, loan fees associated with the new line of credit were approximately $13 thousand, interest on liquidated damages expense related to registration payment arrangements was approximately $28 thousand and the amortization of the deferred costs associated with the debt was approximately $362 thousand. The decrease in interest expense was primarily a result of fully amortizing the deferred debt issuance costs in 2009.
Other income for the year ended December 31, 2010 was approximately $16 thousand as compared to approximately $67 thousand for the year ended December 31, 2009. The other income for the year ended December 31, 2010 was interest income of approximately $10 thousand and $6 thousand from equipment salvage. The other income for the year ended December 31, 2009 was interest income of approximately $6 thousand; approximately $4 thousand of miscellaneous income; and approximately $57 thousand for a settlement of a liability.
Change in Fair Value of Warrant Liability. In accordance with ASC 815, adopted January 1, 2009, certain warrants previously classified within equity are reclassified as liabilities. As a result of this reclassification, the accounting guidance requires revaluation of this liability every reporting period. The fair value of the liability at December 31, 2010 and 2009 was measured by using the Monte Carlo Simulation model. The revaluation resulted in a charge of approximately $16.0 million for the year ended December 31, 2010 as compared to $6.5 million for the year ended December 31, 2009. This revaluation resulted in non-cash changes to other income (expense) and had no impact on our cash balances, operations, or operating income.
Income Tax (Benefit) Expense
For the year ended December 31, 2010, income tax benefit was approximately $8.9 million and for the year ended December 31, 2009, the income tax expense was $90 thousand. For 2010, we incurred $0.13 million of income tax expense related to alternative minimum tax, which is not offset by operating loss carryforwards. As a result of taxable income over the past two years, we concluded that it was more likely than not that we would continue to generate sufficient taxable income to utilize the benefit from a portion of our net operating loss carryforwards; therefore, we recorded a $9.1 million reduction of our deferred tax asset valuation allowance and corresponding income tax benefit.
27
Net Loss
Net loss totaled approximately $1.1 million for the year ended December 31, 2010 as compared to approximately $2.3 million for the year ended December 31, 2009. Net loss for the year ended December 31, 2010 would have been approximately $8.4 million excluding the one-time charges of a $1.1 million severance charge, $0.7 million litigation settlement offer, and the tax benefit of $9.1 million related to the reversal of valuation allowance.
Off-Balance Sheet Arrangements
We have no off balance sheet arrangements that are reasonably likely to have a current or future effect on our financial condition, revenues, results of operations, liquidity or capital expenditures.
Liquidity and Capital Resources
As of December 31, 2011, we had approximately $14.3 million of cash, cash equivalents, and investments in certificates of deposit (“CDs”). As of December 31, 2011, we had approximately $7.6 million of cash and cash equivalents as compared to $7.8 million as of December 31, 2010. The change in cash of $0.2 million was primarily due to cash provided by operations of approximately $3.5 million and financing activities of approximately $1.2 million offset by cash used for investing activities of approximately $5.0 million.
For the year ended December 31, 2011, operating activities provided $3.5 million in cash, which was attributable to our net income of approximately $5.0 million and approximately $1.3 million from the net non-cash expenses and offset by the change in operating assets and liabilities of $2.7 million. For the year ended December 31, 2010, operating activities provided $8.3 million in cash, which was attributable to our net loss of approximately $1.1 million offset by approximately $0.8 million from the change in operating assets and liabilities and the net non-cash expenses of $8.6 million including approximately $9.1 million of non-cash income related to reversal of a portion of a deferred tax valuation allowance and approximately $16.0 million of non-cash loss related to the change in the fair value of the warrant liability.
For the year ended December 31, 2011, investing activities used approximately $5.0 million in cash, which was primarily the result of approximately $2.1 million in purchases of CDs and approximately $2.9 million for equipment purchases primarily for upgrading our production line. For the year ended December 31, 2010, investing activities used approximately $6.9 million in cash, which was primarily the result of approximately $4.5 million in purchases of CDs and approximately $2.4 million for equipment purchases primarily for upgrading our production line.
For the year ended December 31, 2011, financing activities provided approximately $1.2 million in cash which was the result of proceeds from the exercise of stock options and warrants of $1.3 million offset by the purchase of treasury stock of $0.1 million. For the year ended December 31, 2010, financing activities provided approximately $1.1 million in cash which was the result of proceeds from the exercise of stock options and warrants.
Credit Facility
At December 31, 2011, we had a credit facility with Access Business Finance, LLC (“Access”) that provides for up to a maximum amount of $3 million based on a borrowing base equivalent of 75% of eligible accounts receivable. The interest on the credit facility is equal to the Prime Rate plus 5% but may not be less than 8.25% with a minimum monthly interest payment of $1 thousand. The credit facility will automatically renew on September 1, 2012 for a one year term unless written notice is provided. We did not draw on our credit facility in 2011.
The credit facility contains the customary representations and warranties as well as affirmative and negative covenants. We were in compliance with all debt covenants as of December 31, 2011.
We expect our business to grow which may result in higher accounts receivable levels and may require increased production and/or higher inventory levels. We anticipate that our cash needs to fund these requirements as well as other operating or investing cash requirements over the next twelve months will be less than our current cash on hand and the cash we anticipate generating from operations. We anticipate that we will not require additional funds over the next twelve months other than perhaps for discretionary capital spending. If unanticipated events arise during the next twelve months, we believe we can raise sufficient funds. However, if we are unable to obtain sufficient funds, we may have to reduce the size of our organization and/or be forced to reduce and/or curtail our production and operations, all of which could have a material adverse impact on our business prospects.
28
Contractual Obligations
The following chart describes the outstanding contractual obligations of eMagin as of December 31, 2011 (in thousands):
|
Payments due by period
|
||||||||||||||||
|
Total
|
1 Year
|
2-3 Years
|
4-5 Years
|
|||||||||||||
|
Operating lease obligations
|
$
|
2,929
|
1,222
|
1,707
|
—
|
|||||||||||
|
Line of credit
|
9
|
9
|
—
|
—
|
||||||||||||
|
Equipment purchase obligations
|
1,802
|
1,802
|
—
|
—
|
||||||||||||
|
Purchase obligations (a)
|
2,503
|
2,503
|
—
|
—
|
||||||||||||
|
Total
|
$
|
7,243
|
5,536
|
1,707
|
—
|
|||||||||||
(a) The majority of purchase orders outstanding contain no cancellation fees except for minor re-stocking fees.
Effect of Recently Issued Accounting Pronouncements
See Note 2 of the Consolidated Financial Statements in Item 8 for a full description of recent accounting pronouncements, including the expected dates of adoption and estimated effects on results of operations and financial condition.
ITEM 7A. QUANTITATIVE AND QUALITATIVE DISCLOSURES ABOUT MARKET RISK
Market rate risk
We are exposed to market risk related to changes in interest rates.
Interest rate risk
We hold our cash in cash and cash equivalents and certificates of deposits. We do not hold derivative financial instruments or equity securities. At December 31, 2011, we have not withdrawn any funds under our revolving line of credit and therefore do not have any related interest rate risk. A change in interest rates would not have had a material effect on our consolidated financial position, results of operations, or cash flows in the year ended December 31, 2011.
Foreign currency exchange rate risk
We do not have any material foreign currency exchange rate risk.
29
ITEM 8. FINANCIAL STATEMENTS AND SUPPLEMENTARY DATA
Financial Statement Index
|
Page
|
|
|
Reports of Independent Registered Public Accounting Firms
|
31-33 |
|
Consolidated Balance Sheets as of December 31, 2011 and 2010
|
34 |
|
Consolidated Statements of Operations for the years ended December 31, 2011, 2010, and 2009
|
35 |
|
Consolidated Statements of Changes in Shareholders’ Equity (Capital Deficit) for the years ended December 31, 2011, 2010, and 2009
|
36 |
|
Consolidated Statements of Cash Flows for the years ended December 31, 2011, 2010, and 2009
|
37 |
|
Notes to the Consolidated Financial Statements
|
38-53 |
30
|
McGladrey & Pullen, LLP
|
REPORT OF INDEPENDENT REGISTERED PUBLIC ACCOUNTING FIRM
To the Board of Directors and Shareholders
eMagin Corporation
Bellevue, Washington
We have audited the accompanying consolidated balance sheet of eMagin Corporation and subsidiary as of December 31, 2011, and the related consolidated statements of operations, shareholders' equity, and cash flows for the year ended December 31, 2011. Our audit also includes the financial statement schedule of eMagin Corporation listed in Item 15(a). These consolidated financial statements and financial statement schedule are the responsibility of Company’s management. Our responsibility is to express an opinion on these consolidated financial statements based on our audit.
We conducted our audit in accordance with the standards of the Public Company Accounting Oversight Board (United States). Those standards require that we plan and perform the audit to obtain reasonable assurance about whether the financial statements are free of material misstatement and whether effective internal control over financial reporting was maintained in all material respects. An audit includes examining, on a test basis, evidence supporting the amounts and disclosures in the financial statements. An audit also includes assessing the accounting principles used and significant estimates made by management, and evaluating the overall financial statement presentation. We believe that our audit provides a reasonable basis for our opinion.
In our opinion, the consolidated financial statements referred to above present fairly, in all material respects, the financial position of eMagin Corporation as of December 31, 2011, and the results of their operations and their cash flows for the year ended December 31, 2011, in conformity with accounting principles generally accepted in the United States of America, when considered in relation to the basic consolidated financial statements taken as a whole, presents fairly in all material respects the information set forth therein. Also, in our opinion, the related financial statement schedule, when considered in relation to the basic consolidated financial statements taken as a whole, presents fairly in all material respects the information set forth therein.
We have also audited, in accordance with the standards of Public Company Accounting Oversight Board (United States), eMagin Corporation’s internal control over financial reporting as of December 31, 2011, based on criteria established in Internal Control – Integrated Framework issued by the Committee of Sponsoring Organizations of the Treadway Commission, and our report dated March 14, 2012, expressed an unqualified opinion on the effectiveness of eMagin Corporation’s internal control over financial reporting.
/s/ McGladrey & Pullen, LLP
Seattle, Washington
March 14, 2012
31
|
McGladrey & Pullen, LLP
|
REPORT OF INDEPENDENT REGISTERED PUBLIC ACCOUNTING FIRM
To the Board of Directors and Shareholders
eMagin Corporation
Bellevue, Washington
We have audited eMagin Corporation's internal control over financial reporting as of December 31, 2011, based on criteria established in Internal Control — Integrated Framework issued by the Committee of Sponsoring Organizations of the Treadway Commission. eMagin Corporation’s management is responsible for maintaining effective internal control over financial reporting and for its assessment of the effectiveness of internal control over financial reporting included in the accompanying Management’s Report on Internal Control Over Financial Reporting. Our responsibility is to express an opinion on the company's internal control over financial reporting based on our audit.
We conducted our audit in accordance with the standards of the Public Company Accounting Oversight Board (United States). Those standards require that we plan and perform the audit to obtain reasonable assurance about whether effective internal control over financial reporting was maintained in all material respects. Our audit included obtaining an understanding of internal control over financial reporting, assessing the risk that a material weakness exists, and testing and evaluating the design and operating effectiveness of internal control based on the assessed risk. Our audit also included performing such other procedures as we considered necessary in the circumstances. We believe that our audit provides a reasonable basis for our opinion.
A company's internal control over financial reporting is a process designed to provide reasonable assurance regarding the reliability of financial reporting and the preparation of financial statements for external purposes in accordance with generally accepted accounting principles. A company's internal control over financial reporting includes those policies and procedures that (a) pertain to the maintenance of records that, in reasonable detail, accurately and fairly reflect the transactions and dispositions of the assets of the company; (b) provide reasonable assurance that transactions are recorded as necessary to permit preparation of financial statements in accordance with generally accepted accounting principles, and that receipts and expenditures of the company are being made only in accordance with authorizations of management and directors of the company; and (c) provide reasonable assurance regarding prevention or timely detection of unauthorized acquisition, use, or disposition of the company's assets that could have a material effect on the financial statements.
Because of its inherent limitations, internal control over financial reporting may not prevent or detect misstatements. Also, projections of any evaluation of effectiveness to future periods are subject to the risk that controls may become inadequate because of changes in conditions, or that the degree of compliance with the policies or procedures may deteriorate.
In our opinion, eMagin Corporation maintained, in all material respects, effective internal control over financial reporting as of December 31, 2011, based on criteria established in Internal Control — Integrated Framework issued by the Committee of Sponsoring Organizations of the Treadway Commission.
We have also audited, in accordance with the standards of the Public Company Accounting Oversight Board (United States), the consolidated balance sheet and the related consolidated statements of income, shareholders' equity, and cash flows for the year ended December 31, 2011, of eMagin Corporation and our report dated March 14, 2012, expressed an unqualified opinion.
/s/ McGladrey & Pullen, LLP
Seattle, Washington
March 14, 2012
32
REPORT OF INDEPENDENT REGISTERED PUBLIC ACCOUNTING FIRM
Board of Directors and Stockholders
eMagin Corporation
We have audited the accompanying consolidated balance sheet of eMagin Corporation (the "Company") as of December 31, 2010, and the related consolidated statements of operations, changes in shareholders' equity and cash flows for each of the years in the two-year period ended December 31, 2010. Our audits also included the financial statement schedule - Valuation and Qualifying Accounts - listed in the index at item 15. These financial statements and schedule are the responsibility of the Company's management. Our responsibility is to express an opinion on these financial statements and schedule based on our audits.
We conducted our audits in accordance with the standards of the Public Company Accounting Oversight Board (United States). Those standards require that we plan and perform the audit to obtain reasonable assurance about whether the financial statements are free of material misstatement. We were not engaged to perform an audit of the Company's internal control over financial reporting. Our audits include consideration of internal control over financial reporting as a basis for designing audit procedures that are appropriate in the circumstances, but not for the purpose of expressing an opinion on the effectiveness of the Company's internal control over financial reporting. Accordingly, we express no such opinion. An audit includes examining, on a test basis, evidence supporting the amounts and disclosures in the financial statements. An audit also includes assessing the accounting principles used and significant estimates made by management, as well as evaluating the overall financial statement presentation. We believe that our audits provide a reasonable basis for our opinion.
In our opinion, the financial statements referred to above present fairly, in all material respects, the consolidated financial position of eMagin Corporation as of December 31, 2010, and the consolidated results of their operations and their consolidated cash flows for each of the years in the two-year period ended December 31, 2010 in conformity with accounting principles generally accepted in the United States of America. Also in our opinion, the financial statement schedule referred to above, when considered in relation to the basic financial statements taken as a whole, presents fairly in all material respects the information set forth therein.
/s/EisnerAmper LLP
New York, New York
October 6, 2011
33
eMAGIN CORPORATION
CONSOLIDATED BALANCE SHEETS
|
December 31,
|
||||||||
|
2011
|
2010
|
|||||||
|
(In thousands, except
|
||||||||
|
share and per share data)
|
||||||||
|
ASSETS
|
||||||||
|
Current assets:
|
||||||||
|
Cash and cash equivalents
|
$
|
7,571
|
$
|
7,796
|
||||
|
Investments
|
5,745
|
3,100
|
||||||
|
Accounts receivable, net
|
5,576
|
5,150
|
||||||
|
Inventory, net
|
2,760
|
1,905
|
||||||
|
Prepaid expenses and other current assets
|
1,008
|
777
|
||||||
|
Total current assets
|
22,660
|
18,728
|
||||||
|
Long-term investments
|
1,000
|
1,500
|
||||||
|
Equipment, furniture and leasehold improvements, net
|
5,980
|
3,287
|
||||||
|
Intangible assets, net
|
35
|
39
|
||||||
|
Other assets
|
92
|
92
|
||||||
|
Deferred tax asset
|
8,165
|
9,056
|
||||||
|
Total assets
|
$
|
37,932
|
$
|
32,702
|
||||
|
LIABILITIES AND SHAREHOLDERS’ EQUITY
|
||||||||
|
Current liabilities:
|
||||||||
|
Accounts payable
|
$
|
961
|
$
|
1,100
|
||||
|
Accrued compensation
|
1,283
|
1,975
|
||||||
|
Other accrued expenses
|
963
|
1,781
|
||||||
|
Advance payments
|
177
|
101
|
||||||
|
Deferred revenue
|
138
|
26
|
||||||
|
Warrant liability
|
—
|
7,694
|
||||||
|
Other current liabilities
|
299
|
170
|
||||||
|
Total current liabilities
|
3,821
|
12,847
|
||||||
|
Warrant liability
|
—
|
5,158
|
||||||
|
Total liabilities
|
3,821
|
18,005
|
||||||
|
Commitments and contingencies (Note 11)
|
||||||||
|
Shareholders’ equity:
|
||||||||
|
Preferred stock, $.001 par value: authorized 10,000,000 shares:
|
||||||||
|
Series B Convertible Preferred stock, (liquidation preference of $5,659,000) stated value $1,000 per share, $.001 par value: 10,000 shares designated and 5,659 issued and outstanding as of December 31, 2011and 5,679 issued and outstanding as of December 31, 2010
|
—
|
—
|
||||||
|
Common stock, $.001 par value: authorized 200,000,000 shares, issued and outstanding, 23,513,978 shares as of December 31, 2011 and 21,210,445 shares as of December 31, 2010
|
24
|
21
|
||||||
|
Additional paid in capital
|
220,838
|
206,298
|
||||||
|
Accumulated deficit
|
(186,656
|
)
|
(191,622
|
)
|
||||
|
Treasury stock, 25,000 shares as of December 31, 2011
|
(95
|
)
|
—
|
|||||
|
Total shareholders’ equity
|
34,111
|
14,697
|
||||||
|
Total liabilities and shareholders’ equity
|
$
|
37,932
|
$
|
32,702
|
||||
See notes to Consolidated Financial Statements
34
eMAGIN CORPORATION
CONSOLIDATED STATEMENTS OF OPERATIONS
|
For the Year Ended December 31,
|
||||||||||||
|
2011
|
2010
|
2009
|
||||||||||
|
(In thousands, except share and per share data)
|
||||||||||||
|
Revenue:
|
||||||||||||
|
Product
|
$
|
23,507
|
$
|
23,596
|
$
|
19,775
|
||||||
|
Contract
|
5,674
|
6,862
|
4,047
|
|||||||||
|
Total revenue, net
|
29,181
|
30,458
|
23,822
|
|||||||||
|
Cost of goods sold:
|
||||||||||||
|
Product
|
11,080
|
8,373
|
7,865
|
|||||||||
|
Contract
|
2,627
|
3,645
|
2,310
|
|||||||||
|
Cost of goods sold
|
13,707
|
12,018
|
10,175
|
|||||||||
|
Gross profit
|
15,474
|
18,440
|
13,647
|
|||||||||
|
Operating expenses:
|
||||||||||||
|
Research and development
|
3,063
|
2,370
|
1,996
|
|||||||||
|
Selling, general and administrative
|
9,136
|
10,055
|
6,900
|
|||||||||
|
Total operating expenses
|
12,199
|
12,425
|
8,896
|
|||||||||
|
Income from operations
|
3,275
|
6,015
|
4,751
|
|||||||||
|
Other income (expense):
|
||||||||||||
|
Interest expense
|
(103
|
)
|
(115
|
)
|
(466
|
)
|
||||||
|
Other income
|
41
|
16
|
67
|
|||||||||
|
Change in the fair value of warrant liability
|
2,548
|
(15,987
|
)
|
(6,533
|
)
|
|||||||
|
Total other income (expense), net
|
2,486
|
(16,086
|
)
|
(6,932
|
)
|
|||||||
|
Income (loss) before provision for income taxes
|
5,761
|
(10,071
|
)
|
(2,181
|
)
|
|||||||
|
Income tax expense (benefit)
|
795
|
(8,931
|
)
|
90
|
||||||||
|
Net income (loss)
|
$
|
4,966
|
$
|
( 1,140
|
)
|
$
|
(2,271
|
)
|
||||
|
Less net income allocated to participating securities
|
1,250
|
—
|
—
|
|||||||||
|
Net income (loss) allocated to common shares
|
$
|
3,716
|
$
|
( 1,140
|
)
|
$
|
(2,271
|
)
|
||||
|
Income (loss) per common share, basic
|
$
|
0.17
|
$
|
(0.06
|
)
|
$
|
(0.14
|
)
|
||||
|
Income (loss) per common share, diluted
|
$
|
0.07
|
$
|
(0.06
|
)
|
$
|
(0.14
|
)
|
||||
|
Weighted average number of shares outstanding:
|
||||||||||||
|
Basic
|
22,448,138
|
19,239,933
|
16,343,650
|
|||||||||
|
Diluted
|
25,574,522
|
19,239,933
|
16,343,650
|
|||||||||
See notes to Consolidated Financial Statements
35
eMAGIN CORPORATION
CONSOLIDATED STATEMENTS OF CHANGES IN SHAREHOLDERS’ EQUITY
(In thousands, except for share data)
|
Preferred Shares
|
Preferred Stock
|
Common Shares
|
Common Stock
|
Treasury Shares
|
Treasury Stock
|
Additional Paid-in Capital
|
Accumulated Deficit
|
Total Shareholders’ Equity
|
||||||||||||||||||||||||||||
|
Balance, December 31, 2008
|
5,739 | $ | — | 15,213,959 | $ | 15 | — | $ | — | $ | 204,818 | $ | (201,172 | ) | $ | 3,661 | ||||||||||||||||||||
|
Cumulative effect of change in accounting principle
|
— | — | — | — | — | — | (15,091 | ) | 12,961 | (2,130 | ) | |||||||||||||||||||||||||
|
Fair value of warrants reclassified from liability to equity upon exercise
|
— | — | — | — | — | — | 1,785 | — | 1,785 | |||||||||||||||||||||||||||
|
Issuance of common stock for services
|
— | — | 498,533 | — | — | — | 304 | — | 304 | |||||||||||||||||||||||||||
|
Expiration of put options
|
— | — | 522,500 | 1 | — | — | 428 | — | 429 | |||||||||||||||||||||||||||
|
Cashless exercise of common stock warrants
|
— | — | 726,910 | 1 | — | — | (1 | ) | — | — | ||||||||||||||||||||||||||
|
Exercise of common stock options
|
— | — | 5,342 | — | — | — | 5 | — | 5 | |||||||||||||||||||||||||||
|
Stock based compensation
|
— | — | — | — | — | — | 1,110 | — | 1,110 | |||||||||||||||||||||||||||
|
Net loss
|
— | — | — | — | — | — | — | (2,271 | ) | (2,271 | ) | |||||||||||||||||||||||||
|
Balance, December 31, 2009
|
5,739 | $ | — | 16,967,244 | $ | 17 | — | $ | — | $ | 193,358 | $ | (190,482 | ) | $ | 2,893 | ||||||||||||||||||||
|
Fair value of warrants reclassified from liability to equity upon exercise
|
— | — | — | — | — | — | 10,013 | — | 10,013 | |||||||||||||||||||||||||||
|
Cashless exercise of common stock warrants
|
— | — | 3,518,110 | 4 | — | — | (4 | ) | — | — | ||||||||||||||||||||||||||
|
Conversion of Series B Preferred Stock to common stock
|
(60 | ) | — | 80,000 | — | — | — | — | — | — | ||||||||||||||||||||||||||
|
Issuance of common stock for services
|
— | — | 15,363 | — | — | — | 55 | — | 55 | |||||||||||||||||||||||||||
|
Exercise of common stock warrants
|
— | — | 100,000 | — | — | — | 250 | — | 250 | |||||||||||||||||||||||||||
|
Exercise of common stock options
|
— | — | 529,728 | — | — | — | 805 | — | 805 | |||||||||||||||||||||||||||
|
Stock based compensation
|
— | — | — | — | — | — | 1,821 | — | 1,821 | |||||||||||||||||||||||||||
|
Net loss
|
— | — | — | — | — | — | — | (1,140 | ) | (1,140 | ) | |||||||||||||||||||||||||
|
Balance, December 31, 2010
|
5,679 | $ | — | 21,210,445 | $ | 21 | — | $ | — | $ | 206,298 | $ | (191,622 | ) | $ | 14,697 | ||||||||||||||||||||
|
Fair value of warrants reclassified from liability to equity
|
— | — | — | — | — | — | 10,304 | — | 10,304 | |||||||||||||||||||||||||||
|
Cashless exercise of common stock warrants
|
— | — | 476,663 | 1 | — | — | (1 | ) | — | — | ||||||||||||||||||||||||||
|
Cashless exercise of common stock options
|
— | — | 49,685 | — | — | — | — | — | — | |||||||||||||||||||||||||||
|
Conversion of Series B Preferred Stock to common stock
|
(20 | ) | — | 26,666 | — | — | — | — | — | — | ||||||||||||||||||||||||||
|
Exercise of common stock warrants
|
— | — | 1,072,116 | 1 | — | — | 561 | — | 562 | |||||||||||||||||||||||||||
|
Exercise of common stock options
|
— | — | 678,403 | 1 | — | — | 769 | — | 770 | |||||||||||||||||||||||||||
|
Stock based compensation
|
— | — | — | — | — | — | 2,907 | — | 2,907 | |||||||||||||||||||||||||||
|
Purchase of treasury stock
|
— | — | — | — | (25,000 | ) | (95 | ) | — | — | (95 | ) | ||||||||||||||||||||||||
|
Net income
|
— | — | — | — | — | — | — | 4,966 | 4,966 | |||||||||||||||||||||||||||
|
Balance, December 31, 2011
|
5,659 | $ | — | 23,513,978 | $ | 24 | (25,000 | ) | $ | (95 | ) | $ | 220,838 | $ | (186,656 | ) | $ | 34,111 | ||||||||||||||||||
See notes to Consolidated Financial Statements
36
eMAGIN CORPORATION
CONSOLIDATED STATEMENTS OF CASH FLOWS
|
Year Ended December 31,
|
||||||||||||
|
2011
|
2010
|
2009
|
||||||||||
|
(In thousands except share data)
|
||||||||||||
|
Cash flows from operating activities:
|
||||||||||||
|
Net income (loss)
|
$
|
4,966
|
$
|
(1,140
|
)
|
$
|
(2,271
|
)
|
||||
|
Adjustments to reconcile net income (loss) to net cash provided by operating activities:
|
||||||||||||
|
Depreciation and amortization
|
170
|
86
|
82
|
|||||||||
|
Amortization of deferred financing and waiver fees
|
—
|
—
|
362
|
|||||||||
|
Reduction of doubtful accounts and sales returns
|
(106
|
)
|
(270
|
)
|
(273
|
)
|
||||||
|
Stock based compensation
|
2,907
|
1,821
|
1,110
|
|||||||||
|
Deferred income taxes (benefit)
|
891
|
(9,056
|
)
|
—
|
||||||||
|
Amortization of common stock issued for services
|
—
|
65
|
233
|
|||||||||
|
Loss on disposal of asset
|
2
|
—
|
—
|
|||||||||
|
Gain on settlement
|
—
|
—
|
(38
|
)
|
||||||||
|
Change in the fair value of warrant liability
|
(2,548
|
)
|
15,987
|
6,533
|
||||||||
|
Changes in operating assets and liabilities:
|
||||||||||||
|
Accounts receivable
|
(320
|
)
|
(377
|
)
|
(647
|
)
|
||||||
|
Inventory
|
(855
|
)
|
274
|
195
|
||||||||
|
Prepaid expenses and other current assets
|
(231
|
)
|
(110
|
)
|
5
|
|||||||
|
Advance payments
|
76
|
(110
|
)
|
(483
|
)
|
|||||||
|
Deferred revenue
|
112
|
(212
|
)
|
74
|
||||||||
|
Accounts payable, accrued compensation, and accrued expenses
|
(1,648
|
)
|
1,998
|
285
|
||||||||
|
Other current liabilities
|
129
|
(662
|
)
|
93
|
||||||||
|
Net cash provided by operating activities
|
3,545
|
8,294
|
5,260
|
|||||||||
|
Cash flows from investing activities:
|
||||||||||||
|
Purchase of equipment
|
(2,861
|
)
|
(2,348
|
)
|
(718
|
)
|
||||||
|
Purchase of investments
|
(2,145
|
)
|
(4,500
|
)
|
(3
|
)
|
||||||
|
Net cash used in investing activities
|
(5,006
|
)
|
(6,848
|
)
|
(721
|
)
|
||||||
|
Cash flows from financing activities:
|
||||||||||||
|
Proceeds from exercise of stock options and warrants
|
1,331
|
1,055
|
5
|
|||||||||
|
Purchase of treasury stock
|
(95
|
)
|
—
|
—
|
||||||||
|
Payments of debt and capitalized lease obligations
|
—
|
—
|
(1,653
|
)
|
||||||||
|
Net cash provided by (used in) financing activities
|
1,236
|
1,055
|
(1,648
|
)
|
||||||||
|
Net (decrease) increase in cash and cash equivalents
|
(225
|
)
|
2,501
|
2,891
|
||||||||
|
Cash and cash equivalents, beginning of year
|
7,796
|
5,295
|
2,404
|
|||||||||
|
Cash and cash equivalents, end of year
|
$
|
7,571
|
$
|
7,796
|
$
|
5,295
|
||||||
|
Cash paid for interest
|
$
|
75
|
$
|
91
|
$
|
107
|
||||||
|
Cash paid for taxes
|
$
|
115
|
$
|
164
|
$
|
138
|
||||||
|
Supplemental non-cash transactions:
|
||||||||||||
|
Issuance of common stock for services charged to prepaid expenses
|
$
|
—
|
$
|
—
|
$
|
304
|
||||||
|
Issuance of 476,673, 3,518,110 and 726,910 shares of common stock for cashless exercise of 581,895, 5,148,811 and 2.9 million warrants in 2011, 2010 and 2009, respectively.
|
$
|
—
|
$
|
—
|
$
|
—
|
||||||
|
Conversion of 20 and 60 shares of Series B Convertible Preferred Stock for 26,666 and 80,000 shares of common stock in 2011 and 2010, respectively.
|
$
|
—
|
$
|
—
|
$
|
—
|
||||||
|
Issuance of 49,685 shares of common stock for cashless exercise of 60,000 stock options in 2011.
|
$
|
—
|
$
|
—
|
$
|
—
|
||||||
37
eMAGIN CORPORATION
NOTES TO THE CONSOLIDATED FINANCIAL STATEMENTS
Note 1 - NATURE OF BUSINESS
eMagin Corporation and its wholly owned subsidiary (the “Company”) designs, develops, manufactures and markets OLED-on-silicon microdisplays and virtual imaging products which utilize OLED microdisplays. The Company’s products are sold mainly in North America, Asia, and Europe.
Note 2 - SIGNIFICANT ACCOUNTING POLICIES
Principles of consolidation
The accompanying consolidated financial statements include the accounts of eMagin Corporation and its wholly owned subsidiary. All intercompany transactions have been eliminated in consolidation.
Use of estimates
In accordance with accounting principles generally accepted in the United States of America, management utilizes certain estimates and assumptions that affect the reported amounts of assets and liabilities at the date of the financial statements and the reported amounts of revenues and expenses during the reporting period. On an on-going basis, management evaluates its estimates and judgments related to, among others, allowance for doubtful accounts, warranty reserves, inventory reserves, stock-based compensation expense, deferred tax asset valuation allowances, litigation, fair value of financial instruments and other loss contingencies. Management bases its estimates and judgments on historical experience and on various other assumptions that are believed to be reasonable under the circumstances, the results of which form the basis for making judgments about the carrying values of assets and liabilities that are not readily apparent from other sources. Actual results could differ from those estimates.
Revenue and cost recognition
Revenue is recognized when persuasive evidence of an arrangement exists, delivery has occurred, selling price is fixed or determinable and collection is reasonably assured. Product revenue is generally recognized when products are shipped to customers. The Company defers revenue recognition on products sold directly to the consumer with a maximum thirty day right of return. Revenue is recognized upon the expiration of the right of return.
The Company also earns revenues from certain R&D activities (contract revenues) under both firm fixed-price contracts and cost-type contracts. Revenues relating to firm fixed-price contracts and cost-type contracts are generally recognized on the percentage-of-completion method of accounting as costs are incurred (cost-to-cost basis). Contract costs include all direct material and labor costs and an allocation of allowable indirect costs as defined by each contract, as periodically adjusted to reflect revised agreed upon rates. These rates are subject to audit by the other party.
Product warranty
The Company offers a one-year product replacement warranty. In general, the standard policy is to repair or replace the defective products. The Company accrues for estimated returns of defective products at the time revenue is recognized based on historical activity as well as for specific known product issues. The determination of these accruals requires the Company to make estimates of the frequency and extent of warranty activity and estimate future costs to replace the products under warranty. If the actual warranty activity and/or repair and replacement costs differ significantly from these estimates, adjustments to cost of revenue may be required in future periods.
Research and development expenses
Research and development costs are expensed as incurred.
Cash and cash equivalents
All highly liquid instruments with an original maturity of three months or less at the date of purchase are considered to be cash equivalents.
Investments
Investments are certificates of deposit in financial institutions carried at cost on the accompanying balance sheet.
Accounts receivable
The majority of the Company’s commercial accounts receivable are due from Original Equipment Manufacturers ("OEM’s”). Credit is extended based on an evaluation of a customer’s financial condition and, generally, collateral is not required. Accounts receivable are payable in U.S. dollars, are due within 30-90 days and are stated at amounts due from customers net of an allowance for doubtful accounts. Any account outstanding longer than the contractual payment terms is considered past due.
38
Allowance for doubtful accounts
The allowance for doubtful accounts reflects an estimate of probable losses inherent in the accounts receivable balance. The allowance is determined based on a variety of factors, including the length of time receivables are past due, historical experience, the customer's current ability to pay its obligation, and the condition of the general economy and the industry as a whole. The Company will record a specific reserve for individual accounts when the Company becomes aware of a customer's inability to meet its financial obligations, deterioration in the customer's operating results or financial position, or deterioration in the customer’s credit history. If circumstances related to customers change, the Company would further adjust estimates of the recoverability of receivables. Account balances, when determined to be uncollectible, are charged against the allowance.
Inventory
Inventory is stated at the lower of cost or market. Cost is determined using the first-in first-out method. Cost includes materials, labor, and manufacturing overhead related to the purchase and production of inventories. The Company regularly reviews inventory quantities on hand, future purchase commitments with the Company’s suppliers, and the estimated utility of the inventory. If the Company review indicates a reduction in utility below carrying value, the inventory is reduced to a new cost basis.
Equipment, furniture and leasehold improvements
Equipment, furniture and leasehold improvements are stated at cost. Depreciation on equipment is calculated using the straight-line method of depreciation over its estimated useful life. Amortization of leasehold improvements is calculated by using the straight-line method over the shorter of their estimated useful lives or lease terms. Expenditures for maintenance and repairs are charged to expense as incurred.
The Company performs impairment tests on its long-lived assets when circumstances indicate that their carrying amounts may not be recoverable. If required, recoverability is tested by comparing the estimated future undiscounted cash flows of the asset or asset group to its carrying value. Impairment losses, if any, are recognized based on the excess of the assets' carrying amounts over their estimated fair values.
Intangible assets
The Company’s intangible assets consist of patents that are amortized over their estimated useful lives of fifteen years using the straight line method. Total intangible amortization expense was approximately $4 thousand for each of the years ended December 31, 2011, 2010, and 2009, respectively. The accumulated amortization as of December 31, 2011 was $30 thousand.
Advertising
Costs related to advertising and promotion of products are charged to sales and marketing expense as incurred. Advertising expense was $3 thousand, $4 thousand and $0 for the years ended December 31, 2011, 2010 and 2009.
Shipping and handling fees
The Company includes costs related to shipping and handling in cost of revenues.
Income taxes
The Company accounts for income taxes under an asset and liability approach that requires the recognition of deferred tax assets and liabilities for the expected future tax consequences of events that have been recognized in the Company’s financial statements or tax returns. The effect on deferred tax assets and liabilities of changes in tax rates will be recognized as income or expense in the period that the change occurs. A valuation allowance for deferred tax assets is recorded when it is more likely than not that some or all of the benefit from the deferred tax asset will not be realized. Changes in circumstances, assumptions and clarification of uncertain tax regimes may require changes to any valuation allowances associated with the Company’s deferred tax assets.
Due to the Company’s operating loss carryforwards, all tax years remain open to examination by the major taxing jurisdictions to which the Company is subject. In the event that the Company is assessed interest or penalties at some point in the future, it will be classified in the financial statements as tax expense.
Net income (loss) per common share
Basic loss per share (“Basic EPS”) is computed by dividing net loss by the weighted average number of common shares outstanding during the reporting period. Diluted loss per share (“Diluted EPS”) is computed by dividing the net loss by the weighted average number of common shares outstanding during the reporting period while also giving effect to all potentially dilutive common shares that were outstanding during the reporting period.
39
In accordance with ASC 260, entities that have issued securities other than common stock that participate in dividends with the common stock (“participating securities”) are required to apply the two-class method to compute basic EPS. The two-class method is an earnings allocation method under which EPS is calculated for each class of common stock and participating security as if all such earnings had been distributed during the period. On December 22, 2008, the Company issued Convertible Preferred Stock – Series B which participates in dividends with the Company’s common stock and is therefore considered to be a participating security. However, the participating convertible preferred stock is not required to absorb any net loss. Thus, the Company calculates EPS using the two-class method. The Company does not intend to pay dividends on its common or preferred stock.
The Company uses the more dilutive method of calculating the diluted earnings per share, either the two class method or “if-converted” method. Under the “if-converted” method, the convertible preferred stock is assumed to have been converted into common shares at the beginning of the period.
The following table summarizes the net income allocated to common shares and the basic and diluted shares used in the net income per share computations (in thousands, except share data):
|
For the Years Ended
|
||||||||||||
|
2011
|
2010
|
2009
|
||||||||||
|
Net income (loss)
|
$
|
4,966
|
$
|
(1,140
|
)
|
$
|
(2,271
|
)
|
||||
|
Less income (loss) allocated to participating securities
|
1,250
|
—
|
—
|
|||||||||
|
Net income (loss) allocated to common shares - basic
|
$
|
3,716
|
$
|
(1,140
|
)
|
$
|
(2,271
|
)
|
||||
|
Less change in fair value of warrant liability allocated to common shares
|
1,907
|
—
|
—
|
|||||||||
|
Net income (loss) allocated to common shares - diluted
|
$
|
1,809
|
$
|
(1,140
|
)
|
$
|
(2,271
|
)
|
||||
|
Weighted average shares outstanding for basic earnings per share
|
22,448,138
|
19,239,933
|
16,343,650
|
|||||||||
|
Dilutive common share equivalents
|
3,126,384
|
—
|
—
|
|||||||||
|
Weighted average shares outstanding for diluted earnings per share
|
25,574,522
|
19,239,933
|
16,343,650
|
|||||||||
|
Potentially dilutive securities not included in weighted average share calculation due to anti-dilutive effect
|
1,933,586
|
13,381,742
|
19,737,395
|
|||||||||
Comprehensive loss
Companies are required to report as comprehensive income all changes in equity during a period, except those resulting from investments by owners and distributions to owners, for the period in which they are recognized. Comprehensive income (loss) is the total of net income (loss) and other comprehensive income (loss) items, such as unrealized gains or losses on foreign currency translation adjustments. Comprehensive income (loss) must be reported on the face of the annual financial statements. The Company's operations did not give rise to any material items includable in comprehensive loss, which were not already in net loss for the years ended December 31, 2011, 2010 and 2009. Accordingly, the Company's comprehensive loss is the same as its net loss for the periods presented.
Stock-based compensation
The Company uses the fair value method of accounting for share-based compensation arrangements. The fair values of stock options are estimated at the date of grant using the Black-Scholes option valuation model. Stock-based compensation expense is reduced for estimated forfeitures and is amortized over the vesting period using the straight-line method. Compensation cost recognized for the years ended December 31, 2011, 2010, and 2009 includes a) compensation cost for all share-based compensation granted prior to, but not vested as of January 1, 2006, based on the estimated grant-date fair value estimated and b) compensation cost for all share-based compensation granted beginning January 1, 2006, based on the estimated grant-date fair value. The compensation cost was recognized using the straight-line attribution method.
Fair value of financial instruments
Authoritative accounting guidance defines fair value, establishes a framework for measuring fair value and establishes a fair value hierarchy which prioritizes the inputs to valuation techniques. The fair value of financial instruments is the amount that would be received in an asset sale or paid to transfer a liability in an orderly transaction between unaffiliated market participants. The fair value hierarchy ranks the quality and reliability of the information used to determine fair values. Financial assets and liabilities carried at fair value will be classified and disclosed in one of the following three categories:
40
Level 1 – valued based on quoted prices at the measurement date for identical assets or liabilities trading in active markets.
Level 2 – quoted prices in active markets for similar assets and liabilities and inputs that are observable for the asset or liability.
Level 3 – valuations derived from valuation techniques in which one or more significant inputs are not readily observable.
Warrant Liability
As of September 30, 2011, the Company and Stillwater Holdings LLC (“the Holder”) signed an agreement to amend the warrant issued to the Holder on December 22, 2008 to purchase 1,875,467 shares of the Company’s common stock. There are 1,000,000 shares remaining as the Holder exercised 875,467 shares in April 2010. The Amendment changed the expiration date from December 22, 2013 to June 22, 2014 and removed the anti-dilution feature. The warrant was reclassified from a warrant liability to equity as of September 30, 2011.
Prior to the amendment, the Company accounted for the warrant as a liability measured at fair value on a recurring basis using the Monte Carlo Simulation method. The warrant liability was categorized as a Level 3 as the fair value was determined using unobservable inputs.
The table below provides a reconciliation of the beginning and ending balances for the warrant liability measured at fair value using significant unobservable inputs (Level 3) (in thousands).
|
December 31,
|
||||||||
|
2011
|
2010
|
|||||||
|
Balance as of January 1
|
$ | 12,852 | $ | 6,878 | ||||
|
Change in fair value of warrants
|
(2,548 | ) | 16,345 | |||||
|
Fair value of warrants exercised
|
(8,490 | ) | (10,013 | ) | ||||
|
Fair value of warrants expired
|
— | (358 | ) | |||||
|
Fair value of warrant modified
|
(1,814 | ) | — | |||||
|
Balance as of December 31
|
$ | — | $ | 12,852 | ||||
For the year ended December 31, 2011, the change in the fair value of the warrant liability of $2.5 million was recorded as other income in the accompanying consolidated statements of operations. For the year ended December 31, 2010, the change in the fair value of the warrant liability of $16.0 million, net of $358,000 due to the expiration of certain warrants, was recorded as other expense in the accompanying consolidated statements of operations.
The Company estimated the fair value of the warrant liability utilizing the Monte Carlo Simulation method. The following assumptions were used in the Monte Carlo Simulation model to determine the fair value of the warrant liability:
|
September 30, 2011
(at modification)
|
December 31, 2010
|
|||||||
|
Risk-free interest rate
|
0.42 | % | 0.19% - 1.02 | % | ||||
|
Expected volatility
|
81.0 | % | 71.9% - 79.2 | % | ||||
|
Expected life ( in years)
|
2.75 | 0.50 – 3.0 | ||||||
|
Expected dividend yield
|
0 | % | 0 | % | ||||
Concentration of credit risk
The majority of eMagin’s products are sold throughout North America, Asia, and Europe. Sales to the Company’s recurring customers are generally made on open account while sales to occasional customers are typically made on a prepaid basis. eMagin performs periodic credit evaluations on its recurring customers and generally does not require collateral. An allowance for doubtful accounts is maintained for credit losses.
Financial instruments which potentially subject the Company to concentrations of credit risk consist of cash and cash equivalents and short-term and long-term investments. The Company’s cash and cash equivalents are deposited with financial institutions which, at times, may exceed federally insured limits. The Company has funds invested in a money market account which are not insured. The Company has Certificates of Deposits (“CDs”), classified as short and long-term investments, which are federally insured. To date, the Company has not experienced any loss associated with this risk.
41
Recently issued accounting standards
In June 2011, the Financial Accounting Standards Board (“FASB”) issued an accounting standard update relating to the presentation of other comprehensive income. The accounting update eliminates the option to present components of other comprehensive income as part of the statement of stockholders’ equity. Instead, companies must report comprehensive income in either a single continuous statement of comprehensive income (which would contain the current income statement presentation followed by the components of other comprehensive income and a total amount for comprehensive income), or in two separate but consecutive statements. This guidance is effective for the Company's fiscal year beginning January 1, 2012. The Company does not expect the guidance to impact its consolidated financial statements.
In May 2011, the FASB issued an accounting standard update related to fair value measurements and disclosures to improve the comparability of fair value measurements presented and disclosed in financial statements prepared in accordance with United States GAAP and International Financial Reporting Standards. This guidance includes amendments that clarify the intent about the application of existing fair value measurement requirements, while other amendments change a principle or requirement for measuring fair value or for disclosing information about fair value measurements. Specifically, the guidance requires additional disclosures for fair value measurements that are based on significant unobservable inputs. The updated guidance is to be applied prospectively and is effective for the Company's interim and annual periods beginning January 1, 2012. The adoption of this guidance is not expected to have a material impact on the Company's consolidated financial statements.
Note 3- RECEIVABLES
Receivables consisted of the following (in thousands):
|
December 31,
|
||||||||
|
2011
|
2010
|
|||||||
|
Trade receivables
|
$
|
5,844
|
$
|
5,524
|
||||
|
Less allowance for doubtful accounts
|
(268
|
)
|
(374
|
)
|
||||
|
Net receivables
|
$
|
5,576
|
$
|
5,150
|
||||
Note 4 - INVENTORY
The components of inventory were as follows (in thousands):
|
December 31,
|
||||||||
|
2011
|
2010
|
|||||||
|
Raw materials
|
$
|
1,092
|
$
|
748
|
||||
|
Work in process
|
985
|
681
|
||||||
|
Finished goods
|
683
|
476
|
||||||
|
Total inventory
|
$
|
2,760
|
$
|
1,905
|
||||
Note 5 – PREPAID EXPENSES AND OTHER CURRENT ASSETS
Prepaid expenses and other current assets consist of the following (in thousands):
|
December 31,
|
||||||||
|
2011
|
2010
|
|||||||
|
Vendor prepayments
|
$
|
237
|
$
|
83
|
||||
|
Other prepaid expenses*
|
771
|
694
|
||||||
|
Total prepaid expenses and other current assets
|
$
|
1,008
|
$
|
777
|
||||
*No individual amounts greater than 5% of current assets.
42
Note 6 – EQUIPMENT, FURNITURE AND LEASEHOLD IMPROVEMENTS
Equipment, furniture and leasehold improvements consist of the following (in thousands):
|
December 31,
|
||||||||
|
2011
|
2010
|
|||||||
|
Computer hardware and software
|
$
|
1,103
|
$
|
1,063
|
||||
|
Lab and factory equipment
|
4,338
|
3,801
|
||||||
|
Furniture, fixtures, and office equipment
|
323
|
309
|
||||||
|
Assets under capital leases
|
66
|
66
|
||||||
|
Construction in progress
|
5,118
|
2,850
|
||||||
|
Leasehold improvements
|
473
|
473
|
||||||
|
Total equipment, furniture and leasehold improvements
|
11,421
|
8,562
|
||||||
|
Less: accumulated depreciation
|
(5,441
|
)
|
(5,275
|
)
|
||||
|
Equipment, furniture and leasehold improvements, net
|
$
|
5,980
|
$
|
3,287
|
||||
Depreciation expense was $166 thousand, $82 thousand and $78 thousand for the years ended December 31, 2011, 2010, and 2009, respectively. Assets under capital leases are fully amortized.
Note 7– DEBT
For the years ended December 31, 2011, 2010, and 2009, interest expense includes interest paid or accrued, of approximately $74 thousand, $87 thousand, and $76 thousand, respectively, on outstanding debt. For the year ended December 31, 2009, approximately $0.4 million of deferred debt issuance costs were amortized to interest expense.
Line of Credit
2011
At December 31, 2011, the Company had available a credit facility with Access Business Finance, LLC (“Access”) under which the Company may borrow up to a maximum of $3 million based on a borrowing base equivalent of 75% of eligible accounts receivable. The terms of the line of credit were amended as follows: the minimum monthly interest payment has decreased from $5,000 to $1,000; the interest rate has increased from Prime plus 4% but not less than 7.25% to Prime plus 5% but not less than 8.25%; the collateral management fee has decreased from .4% to 0%; the early termination fee has decreased from $18,000 to $6,000; and the borrowing minimum monthly income has decreased from $6,000 to $2,000. The renewal date is September 1, 2012.
The Company paid $30,000 in loan fees to Access which were charged to prepaid expense and will be amortized over the life of the Agreement. The Company’s obligations under the agreement are secured by its assets. As of December 31, 2011, the Company had not borrowed on its line of credit.
2010
At December 31, 2010, the Company had available a credit facility with Access Business Finance, LLC (“Access”) under which the Company may borrow up to a maximum of $3 million based on a borrowing base equivalent of 75% of eligible accounts receivable. The terms of the credit facility are unchanged from 2009. The renewal date is September 1, 2011. The Company paid $30,000 in loan fees to Access which were charged to prepaid expense and will be amortized over the life of the Agreement. As of December 31, 2010, the Company had not borrowed on its line of credit.
2009
At December 31, 2009, the Company had available a credit facility with Access under which the Company may borrow up to a maximum of $3 million based on a borrowing base equivalent of 75% of eligible accounts receivable. The interest on the line of credit is equal to the Prime Rate plus 4.00% but may not be less than 7.25% with a minimum monthly interest payment of $5,000. The term of the agreement with Access is for one year and automatically renews for successive one year terms unless, at least 60 days prior to the end of the current term, the Company gives Access prior written notice of its intent not to renew or if Access, at least ten days prior to the end of the current term, gives the Company written notice of its intent not to renew. The renewal date is September 1, 2010. The Company’s obligations under the agreement are secured by its assets. The Company paid $25,000 in loan fees to Access which were charged to prepaid expense and will be amortized over the life of the Agreement. As of December 31, 2009, the Company had not borrowed on its line of credit.
43
Prior to Access, the Company had a line of credit with Moriah Capital, L. P. (“Moriah”) which matured on August 7, 2009 and was not renewed.
Net income (loss) before income taxes consists of the following (in thousands):
|
For the years ended December 31,
|
|||||||||||
|
2011
|
2010
|
2009
|
|||||||||
|
Domestic
|
$
|
5,761
|
$
|
(10,071
|
)
|
$
|
(2,181
|
)
|
|||
|
Total
|
$
|
5,761
|
$
|
(10,071
|
)
|
$
|
(2,181
|
)
|
|||
The federal and state income tax (benefit) provision is summarized as follows (in thousands):
|
For the years ended December 31,
|
||||||||||||
|
2011
|
2010
|
2009
|
||||||||||
|
Current:
|
||||||||||||
|
Federal
|
$
|
(96
|
)
|
$
|
125
|
$
|
90
|
|||||
|
Total current tax (benefit) expense
|
(96
|
)
|
125
|
90
|
||||||||
|
Deferred:
|
||||||||||||
|
Federal
|
962
|
(9,056
|
)
|
—
|
||||||||
|
State
|
(71
|
)
|
—
|
—
|
||||||||
|
Total deferred tax expense ( benefit)
|
891
|
(9,056
|
)
|
—
|
||||||||
|
Total tax expense (benefit)
|
$
|
795
|
$
|
(8,931
|
)
|
$
|
90
|
|||||
Deferred income taxes reflect the net tax effects of (a) temporary differences between the carrying amounts of assets and liabilities for financial reporting purposes and the amounts used for income tax purposes, and (b) operating losses and tax credit carryforwards.
The tax effects of significant items comprising the Company’s deferred taxes as of December 31 are as follows (numbers are in thousands):
|
For the years ended December 31,
|
||||||||||||
|
2011
|
2010
|
2009
|
||||||||||
|
Deferred tax assets:
|
||||||||||||
|
Federal and state net operating loss carryforwards
|
$
|
36,210
|
$
|
37,160
|
$
|
39,391
|
||||||
|
Research and development tax credit carryforwards
|
1,684
|
1,589
|
1,440
|
|||||||||
|
Stock based compensation
|
2,241
|
1,378
|
1,240
|
|||||||||
|
Depreciation and amortization
|
8
|
223
|
385
|
|||||||||
|
Other provisions and expenses not currently deductible
|
614
|
1,019
|
988
|
|||||||||
|
Accrued severance
|
—
|
222
|
—
|
|||||||||
|
Total deferred tax assets
|
$
|
40,757
|
$
|
41,591
|
$
|
43,444
|
||||||
|
Deferred tax liabilities:
|
||||||||||||
|
Prepaid expenses
|
$
|
(227
|
)
|
$
|
(170
|
)
|
$
|
(197
|
)
|
|||
|
Total deferred tax liabilities
|
$
|
(227
|
)
|
$
|
(170
|
)
|
$
|
(197
|
)
|
|||
|
Less valuation allowance
|
$
|
(32,365
|
)
|
$
|
(32,365
|
)
|
$
|
(43,247
|
)
|
|||
|
Net deferred tax asset
|
$
|
8,165
|
$
|
9,056
|
$
|
0
|
||||||
The Company accounts for income taxes under an asset and liability approach that requires the recognition of deferred tax assets and liabilities for the expected future tax consequences of events that have been recognized in the Company’s financial statements or tax returns. The effect on deferred tax assets and liabilities of changes in tax rates will be recognized as income or expense in the period that the change occurs. A valuation allowance for deferred tax assets is recorded when it is more likely than not that some or all of the benefit from the deferred tax asset will not be realized. Changes in circumstances, assumptions and clarification of uncertain tax regimes may require changes to any valuation allowances associated with the Company’s deferred tax assets.
Realization of the future tax benefits is dependent on the Company’s ability to generate sufficient taxable income within the carryforward period. Through December 31, 2009, the Company’s net deferred tax assets were fully reserved due to uncertainty of realization through future earnings. In 2010, the Company determined that based on all available evidence, both positive and negative, and based on the weight of the available evidence, including the Company’s cumulative taxable income over the past three years and expected profitability in 2011 through 2013 that certain of its deferred tax assets were more likely than not realizable through future earnings. Accordingly, the Company reduced its valuation allowance by $9.1 million and recorded a corresponding tax benefit of $9.1 million.
In 2011, the Company determined that based on all available evidence, both positive and negative, and based on the weight of the available evidence, including the Company’s projected cumulative taxable income through 2016 that certain of its deferred tax assets were more likely than not realizable through future earnings. The projected cumulative tax benefit on taxable income through 2016 was less than the projected cumulative tax benefit used in an analysis prepared in 2010. The Company determined that the realizable asset was less than the amount recorded in the prior year and accordingly the net asset after the valuation allowance is approximately $1 million less as of December 31, 2011. The Company used projected taxable income through 2016 based on its history of taxable income and losses and estimates that the taxable income through 2016 is more likely than not to be realized and is less likely in periods after 2016.
44
As of December 31, 2011, 2010, and 2009, the Company has net deferred tax assets of approximately of $40.5, $41.4, and $43.2 million, respectively, primarily resulting from the future tax benefit of net operating loss carryforwards. The valuation allowance decreased by $0, $10.9, and $1.4, million during the years 2011, 2010, and 2009, respectively. The amount of the valuation allowance for deferred tax assets associated with excess tax deduction from stock based compensation arrangement that is allocated to contributed capital if the future tax benefits are subsequently recognized is $3.1 million at December 31, 2011.
During the year ended December 31, 2011, the Company did not utilize its prior years’ net operating loss carryforward. As of December 31, 2011, eMagin has federal and state net operating loss carryforwards of approximately $109 million and $2.7 million, respectively. The federal research and development tax credit carryforwards are approximately $1.8 million. The net operating losses and tax credit carryforwards will be available to offset future taxable income, if any, from 2013 to 2033. The utilization of net operating losses is subject to a limitation due to the change of ownership provisions under Section 382 of the Internal Revenue Code and similar state provisions. Such limitation may result in the expiration of the net operating losses before their utilization. The Company has done an analysis regarding prior year ownership changes, and it has been determined that the Section 382 limitation on the utilization of net operating losses will currently not materially affect the Company's ability to utilize its net operating losses.
The difference between the statutory federal income tax rate on the Company's pre-tax loss and the Company's effective income tax rate is summarized as follows:
|
For the years ended December 31,
|
||||||||||||
|
2011
|
2010
|
2009
|
||||||||||
|
U.S. Federal income tax expense (benefit) at federal statutory rate
|
34
|
%
|
(34
|
)%
|
(34
|
)%
|
||||||
|
Change in valuation allowance
|
—
|
%
|
(108
|
)%
|
(62
|
)%
|
||||||
|
Change in effective state tax rate
|
(2
|
)%
|
—
|
%
|
(3
|
)%
|
||||||
|
Change in the fair value of warrant liability
|
(15
|
)%
|
54
|
%
|
102
|
%
|
||||||
|
Credits
|
(2
|
)%
|
—
|
%
|
—
|
%
|
||||||
|
Other, net
|
(1
|
)%
|
(1
|
)%
|
1
|
%
|
||||||
|
Effective tax rate
|
14
|
%
|
(89
|
)%
|
4
|
%
|
||||||
The Company did not have unrecognized tax benefits which would require an adjustment to the January 1, 2007 beginning balance of retained earnings. The Company did not have any unrecognized tax benefits at December 31, 2011, 2010, or 2009. The Company recognizes interest accrued and penalties related to unrecognized tax benefits in tax expense. During the years ended December 31, 2011, 2010, and 2009, the Company recognized no interest and penalties.
The Company files income tax returns in the U.S. federal jurisdiction, California, New York and Virginia. Due to the Company's operating losses, all tax years remain open to examination by major taxing jurisdictions to which the Company is subject.
Note 9 - SHAREHOLDERS' EQUITY
Preferred Stock
Preferred Stock – Series B Convertible Preferred Stock (“the Preferred Stock – Series B”)
The Company has designated 10,000 shares of the Company’s preferred stock as Preferred Stock – Series B at a stated value of $1,000 per share. The Preferred Stock – Series B is convertible into common stock at a conversion price of $0.75 per share. The Preferred Stock – Series B does not pay interest. The holders of the Preferred Stock – Series B are not entitled to receive dividends unless the Company’s Board of Directors declare a dividend for holders of the Company’s common stock and then the dividend shall be equal to the amount that such holder would have been entitled to receive if the holder converted its Preferred Stock – Series B into shares of the Company’s common stock. Each share of Preferred Stock – Series B has voting rights equal to (i) the number of shares of Common Stock issuable upon conversion of such shares of Preferred Stock – Series B at such time (determined without regard to the shares of Common Stock so issuable upon such conversion in respect of accrued and unpaid dividends on such share of Preferred Stock) when the Preferred Stock – Series B votes together with the Company’s Common Stock or any other class or series of stock of the Company and (ii) one vote per share of Preferred Stock when such vote is not covered by the immediately preceding clause. In the event of a liquidation, dissolution, or winding up of the Company, the Preferred Stock – Series B is entitled to receive liquidation preference before the Common Stock. The Company may at its option redeem the Preferred Stock – Series B by providing the required notice to the holders of the Preferred Stock – Series B and paying an amount equal to $1,000 multiplied by the number of shares for all of such holder’s shares of outstanding Preferred Stock – Series B to be redeemed.
45
On December 22, 2008, the Company entered into a Securities Purchase Agreement pursuant to which the Company sold and issued an aggregate of 4,033 shares of its Preferred Stock – Series B for an aggregate price of approximately $4.03 million and warrants to purchase 1,875,467 shares of common stock at $1.03 per share. The fair value of the warrants was recorded as equity and there was no impact on the consolidated financial position or the results of operations. As of January 1, 2009, the Company adopted ASC 815 and as a result the warrants were reclassified as liabilities using a Monte Carol Simulation model to estimate the fair value of the liabilities. At each reporting date, the change in the fair value of the liability was recorded in the Consolidated Statements of Operations.
The Company and Stillwater Holdings LLC (“the Holder”) signed an agreement to amend the warrant as of September 30, 2011. There were 1,000,000 shares remaining as the Holder had exercised 875,467 shares in April 2010. The Amendment changed the expiration date from December 22, 2013 to June 22, 2014 and removed the anti-dilution feature. As a result, the warrant was reclassified from a warrant liability to equity.
During the years ended December 31, 2011 and 2010, there were 20 and 60 shares of Preferred Stock - Series B converted into 26,666 and 80,000 shares of common stock, respectively. As of December 31, 2011, there were 5,659 shares of Preferred Stock – Series B issued and outstanding.
Common Stock
2011
During the year ended December 31, 2011, the Company received approximately $770 thousand for the exercise of 678,403 options and $561 thousand for 1,072,116 warrants exercised. There were 60,000 options exercised on a cashless basis resulting in 49,685 shares of common stock issued. There were 581,895 warrants exercised on a cashless basis resulting in 476,663 shares of common stock issued.
On August 24, 2011, eMagin’s Board of Directors approved a stock repurchase plan authorizing the Company to repurchase common stock not to exceed $2.5 million in total value. The Company accounts for the treasury stock using the cost method. During the year ended December 31, 2011, the Company repurchased 25,000 shares at an average cost of $3.81 per share.
2010
During the year ended December 31, 2010, the Company received approximately $805 thousand for options exercised and $250 thousand for 100,000 warrants exercised. There were 5,148,811 million warrants exercised on a cashless basis resulting in 3,518,110 shares of common stock issued.
During the year ended December 31, 2010, the Company also issued 15,363 shares of common stock for payment of approximately $55 thousand for services rendered. As such, the Company recorded the fair value of the services in selling, general and administrative expenses in the accompanying consolidated statements of operations for the year ended December 31, 2010.
2009
During the year ended December 31, 2009, the Company received approximately $5 thousand for options exercised and there were 2.9 million warrants exercised on a cashless basis resulting in 726,910 shares of common stock issued.
During the year ended December 31, 2009, the Company also issued 498,533 shares of common stock for payment of approximately $304 thousand for services rendered and to be rendered in the future. As such, the Company recorded the fair value of the services in prepaid expenses and selling, general and administrative expenses in the accompanying consolidated statements of operations for the year ended December 31, 2009.
At December 31, 2008, the 522,500 shares underlying the 2007 and 2008 put options (“put options”) granted to Moriah were presented on the balance sheet as redeemable common stock in the amount of $429 thousand which represented the amount for which the shares may be redeemed at the option of Moriah. On August 7, 2009, the put options expired when Moriah elected not to exercise its put options. The 522,500 shares are classified as permanent equity on the December 31, 2009 balance sheet.
46
Note 10 - STOCK COMPENSATION
Employee stock purchase plan
In 2005, the stockholders approved the 2005 Employee Stock Purchase Plan (“ESPP”). The ESPP provides the Company’s employees with the opportunity to purchase common stock through payroll deductions. Employees may purchase stock semi-annually at a price that is 85% of the fair market value at certain plan-defined dates. At December 31, 2011, the number of shares of common stock available for issuance was 300,000. As of December 31, 2011, the plan had not been implemented.
Incentive compensation plans
In 2003, the Company established the 2003 Stock Option Plan (the "2003 Plan"). The 2003 Plan provided for the granting of options to purchase an aggregate of 920,000 shares of the common stock to employees and consultants. On July 2, 2003, the shareholders approved the plan and the 2003 Plan was subsequently amended by the Board of Directors on July 2, 2003 to reduce the number of additional shares that may be provided for issuance under the "evergreen" provisions of the 2003 Plan. The amended 2003 Plan provides for an increase of 200,000 shares in January 2004 and an annual increase on January 1 of each year for a period of nine (9) years commencing on January 1, 2005 of 3% of the diluted shares outstanding. The shareholders approved an amendment to the 2003 Plan to provide grants of shares of common stock in addition to options to purchase shares of common stock. In 2011, there were 1,204,608 options issued from the 2003 Plan.
The 2008 Incentive Stock Plan (“the 2008 Plan”) adopted and approved by the Board of Directors on November 5, 2008 provides for shares of common stock and options to purchase shares of common stock to employees, officers, directors and consultants. The 2008 Plan has an aggregate of 2,000,000 shares. In 2011, there were 200,000 options issued from the 2008 Plan.
The 2011 Incentive Stock Plan (the “2011 Plan”) was approved by the Company’s shareholders on November 3, 2011. The 2011 Plan provides for grants of common stock and options to purchase common stock to employees, officers, directors and consultants. The Board of Directors reserved 1.4 million shares of common stock for issuance under the 2011 Plan. In addition, the 2011 Plan includes an evergreen provision that provides for an annual increase in common stock available for issuance however, on October 31, 2011 the Board committed to submit an amendment to the 2011 Plan to shareholders to eliminate the evergreen provision and to prohibit the repricing or exchange of stock options without stockholder approval. The Board also committed to maintain an average run rate over 2012 that does not exceed 4.5%. Run rate is defined as the sum of the number of stock options granted during the year, divided by the Company’s fully diluted shares outstanding. In 2011, there were 473,499 options issued from the 2011 Plan.
Vesting terms of the options range from immediate vesting to a ratable vesting period of 5 years. Option activity for the year ended December 31, 2011 is summarized as follows:
|
Number of Shares
|
Weighted Average Exercise Price
|
Weighted Average Remaining Contractual Life (In Years)
|
Aggregate Intrinsic Value
|
||||||
|
Balances at December 31, 2008
|
1,615,673
|
$
|
1.63
|
||||||
|
Options granted
|
1,278,840
|
1.03
|
|||||||
|
Options exercised
|
(5,342
|
)
|
0.98
|
||||||
|
Options forfeited
|
(71,597
|
)
|
2.60
|
||||||
|
Options cancelled
|
—
|
—
|
|||||||
|
Balances at December 31, 2009
|
2,817,574
|
$
|
1.33
|
||||||
|
Options granted
|
949,585
|
2.85
|
|||||||
|
Options exercised
|
(529,728
|
)
|
1.52
|
||||||
|
Options forfeited
|
(67,904
|
)
|
3.17
|
||||||
|
Options cancelled
|
(17,413
|
)
|
1.90
|
||||||
|
Balances at December 31, 2010
|
3,152,114
|
$
|
1.71
|
||||||
|
Options granted
|
1,878,107
|
6.62
|
|||||||
|
Options exercised
|
(728,088
|
)
|
6.60
|
||||||
|
Options forfeited
|
(28,043
|
)
|
4.91
|
||||||
|
Options cancelled
|
(31,839
|
)
|
1.13
|
||||||
|
Balances at December 31, 2011
|
4,242,251
|
$
|
3.93
|
5.76
|
$
|
4,676,445
|
|||
|
Vested or expected to vest at December 31, 2011(1)
|
4,164,959
|
$
|
3.88
|
5.76
|
$
|
4,672,401
|
|||
|
Exercisable at December 31, 2011
|
2,696,412
|
$
|
2.30
|
6.21
|
$
|
4,595,573
|
|||
(1) The expected to vest options are the result of applying the pre-vesting forfeiture rate assumptions to total unvested options.
At December 31, 2011, there were 1,097,979 shares available for grant under the 2011, 2008 and 2003 Plans.
The aggregate intrinsic value in the table above represents the difference between the exercise price of the underlying options and the quoted price of the Company’s common stock on December 31, 2011 for the options that were in-the-money. As of December 31, 2011 there were 2,088,366 options that were in-the-money. The Company’s closing stock price was $3.70 as of December 31, 2011. The Company issues new shares of common stock upon exercise of stock options. The intrinsic value of the 2011 options exercised was $3.6 million.
47
The Company uses the fair value method of accounting for share-based compensation arrangements. The fair value of stock options is estimated at the date of grant using the Black-Scholes option valuation model. Stock-based compensation expense is reduced for estimated forfeitures and is amortized over the vesting period using the straight-line method.
The following table summarizes the allocation of stock-based compensation to expense categories for the years ended December 31, 2011, 2010, and 2009 (in thousands):
|
For the years ended December 31,
|
||||||||||||
|
2011
|
2010
|
2009
|
||||||||||
|
Cost of revenue
|
$
|
208
|
$
|
176
|
$
|
134
|
||||||
|
Research and development
|
412
|
172
|
201
|
|||||||||
|
Selling, general, and administrative
|
2,287
|
1,473
|
775
|
|||||||||
|
Total stock compensation expense
|
$
|
2,907
|
$
|
1,821
|
$
|
1,110
|
||||||
At December 31, 2011, total unrecognized compensation costs related to stock options was approximately $3.8 million, net of estimated forfeitures. Total unrecognized compensation cost will be adjusted for future changes in estimated forfeitures and is expected to be recognized over a weighted average period of approximately 2.4 years.
Options granted to non-employees are measured at the grant date using a fair value options pricing model and remeasured to the current fair market value at each reporting period as the underlying options vest and services are rendered. There were 12,500 options granted to consultants in the year ended December 31, 2011 which were fully vested upon grant. The following assumptions were used in the Black-Scholes option pricing model to determine the fair value of stock options granted to non-employees: dividend yield – 0%; risk free interest rate – 2.32%; expected volatility – 85.7%; and expected term – 5 years.
In determining the fair value of stock options granted during the years ended December 31, 2011, 2010, and 2009, the following key assumptions were used in the Black-Scholes option pricing model:
|
For the years ended December 31,
|
||||||||||||
|
2011
|
2010
|
2009
|
||||||||||
|
Dividend yield
|
0
|
%
|
0
|
%
|
0
|
%
|
||||||
|
Risk free interest rates
|
1.04 - 2.37
|
%
|
1.14 - 2.57
|
%
|
1.44 – 2.51
|
%
|
||||||
|
Expected volatility
|
67 - 86
|
%
|
81% - 87
|
%
|
68% - 86
|
%
|
||||||
|
Expected term ( in years)
|
3.5 - 5.5
|
3.5 - 5.5
|
3 - 5.5
|
|||||||||
The weighted average fair value per share for options granted in 2011, 2010, and 2009 was $3.58, $1.91, and $0.64, respectively. We have not declared or paid any dividends and do not currently expect to do so in the near future. The risk-free interest rate used in the Black-Scholes option pricing model is based on the implied yield currently available on U.S. Treasury securities with an equivalent term. Expected volatility is based on the weighted average historical volatility of the Company’s common stock for the most recent five year period. The expected term of options represents the period that eMagin’s stock-based awards are expected to be outstanding and was determined based on historical experience and vesting schedules of similar awards.
48
Warrants
At December 31, 2011, there are 1,000,000 warrants to purchase shares of common stock outstanding and exercisable at an exercise price of $1.03 and expiration date of June 22, 2014.
|
Outstanding Warrants
|
||||||||
|
Shares
|
Weighted Average Exercise Price
|
|||||||
|
Balances at December 31, 2008
|
12,279,240
|
$
|
1.88
|
|||||
|
Warrants granted
|
—
|
—
|
||||||
|
Warrants exercised
|
(2,900,000
|
)
|
1.03
|
|||||
|
Warrants expired
|
(111,418
|
)
|
1.28
|
|||||
|
Balances at December 31, 2009
|
9,267,822
|
$
|
2.16
|
|||||
|
Warrants granted
|
—
|
—
|
||||||
|
Warrants exercised
|
(5,248,811
|
)
|
1.24
|
|||||
|
Warrants expired
|
(1,361,382
|
)
|
8.17
|
|||||
|
Balances at December 31, 2010
|
2,657,629
|
$
|
0.89
|
|||||
|
Warrants granted
|
—
|
—
|
||||||
|
Warrants exercised
|
(1,654,012
|
)
|
0.79
|
|||||
|
Warrants expired
|
(3,617
|
)
|
7.54
|
|||||
|
Balances at December 31, 2011
|
1,000,000
|
$
|
1.03
|
|||||
Note 11 - COMMITMENTS AND CONTINGENCIES
Royalties
The Company signed a license agreement on March 29, 1999 with Eastman Kodak (“Kodak’), under which it is obligated to make royalty payments. Under this agreement, the Company must pay to Kodak a minimum royalty plus a certain percentage of net sales with respect to certain products, which percentages are defined in the agreement. The percentages are on a sliding scale depending on the amount of sales generated. Any minimum royalties paid will be credited against the amounts due based on the percentage of sales. The royalty agreement terminates upon the expiration of the issued patent which is the last to expire. The Company was notified that Kodak sold substantially all rights and obligations under the Company’s license agreement to Global OLED Technology (“GOT”) as of December 30, 2009.
In late 2008, the Company began evaluating the status of its manufacturing process and the use of the intellectual property (“IP”) associated with its license agreement. After this analysis and after making a few changes to its manufacturing process, by the end of 2008 the Company had stopped using the IP covered under the license agreement. The last royalty payment under the license agreement was made in November 2009. The Company determined that it is no longer required to pay the minimum royalty payment and as such has not paid or accrued this amount.
In April 2011, the Company received a request for royalty payments from a representative of GOT. The Company responded stating that the licenses were no longer in force and that the request for royalties was untimely. Although GOT does not agree, both parties have expressed an interest in resolving the disagreement amicably. Communications to date have been very preliminary regarding its resolution. The Company estimates that the range of loss contingency is between $0 and $250 thousand.
Operating leases
The Company leases office facilities and office, lab and factory equipment under operating leases. The Company currently has lease commitments for space in Hopewell Junction, New York, Bellevue, Washington, and Santa Clara, California.
The Company’s manufacturing facilities are leased from IBM in Hopewell Junction, New York. eMagin leases approximately 37,000 square feet to house its equipment for OLED microdisplay fabrication and for research and development, an assembly area and administrative offices. The lease expires May 31, 2014 with the option of extending the lease for five years. The corporate headquarters are located in Bellevue, Washington where eMagin leases approximately 6,300 square feet. The lease expires on August 31, 2014. In addition, the Company leases approximately 2,400 square feet of office space for design and product development in Santa Clara, California and the lease expires on October 31, 2012.
The future minimum lease payments through 2014 are $2.9 million. Rent expense was approximately $1.2 million, $1.1 million, and $1.3 million for the years ended December 31, 2011, 2010 and 2009, respectively.
49
The following is a schedule of future minimum lease payments under long-term operating leases (in thousands):
|
Year Ending December 31,
|
||||
|
2012
|
$
|
1,222
|
||
|
2013
|
1,227
|
|||
|
2014
|
480
|
|||
|
Net minimum lease payments
|
$
|
2,929
|
||
Equipment purchase commitments
eMagin has committed to equipment purchases of $1.8 million at December 31, 2011.
Employee benefit plans
eMagin has a defined contribution plan (the 401(k) Plan) under Section 401(k) of the Internal Revenue Code, which is available to all employees who meet established eligibility requirements. Employee contributions are generally limited to 15% of the employee's compensation. Under the provisions of the 401(k) Plan, eMagin may match a portion of the participating employees' contributions. There was no matching contribution to the 401(k) Plan for the years ended December 31, 2011, 2010 and 2009.
Legal proceedings
On March 17, 2010, Gary Jones, a former executive at the Company, filed a complaint for damages in the Superior Court of the State of Washington for King County (the "Court") against the Company and the Company's Chief Financial Officer. The complaint alleged unspecified damages for failure to pay contractual payments and wages under Washington law and included, among other claims, breach of contract, breach of the duty of good faith and fair dealing, promissory estoppel and misrepresentation.
On May 21, 2010, the Court granted eMagin's and the Chief Financial Officer’s motions to dismiss certain of the claims. Then, on March 21, 2011, the Company executed a Settlement Agreement and Full and Complete Mutual Release (the “Settlement Agreement”) among the Company, Mr. Jones and the Company’s Chief Financial Officer, which became effective on March 29, 2011.On April 5, 2011, pursuant to the Settlement Agreement, the Company made the following payments in the aggregate amount of $650 thousand: (i) payment to Mr. Jones in the gross amount of $478 thousand for payment amounts set forth in the Executive Separation and Consulting Agreement (“ECSA”) and Expense Reimbursement and Compensation Schedule (“ERCS”) entered into by Mr. Jones and the Company in January 2007; (ii) payment to Mr. Jones in the amount of approximately $27 thousand for a negotiated interest amount pursuant to the ECSA and ERCS; and (iii) approximately $145 thousand in attorney’s fees paid to Mr. Jones’ attorneys (collectively, the “Settlement Payments”). The settlement offer was recorded as a liability on the Company’s Consolidated Balance Sheet and included in selling, general, and administrative expense on the Company’s Consolidated Statements of Operations as of December 31, 2010.
The Settlement Agreement contains mutual releases among the Company, its Chief Financial Officer and Mr. Jones, and pursuant to the Settlement Agreement, Mr. Jones agreed to dismiss the Complaint against the Company and its Chief Financial Officer with prejudice. On April 7, 2011 the Complaint was dismissed with prejudice by the Court.
On December 6, 2005, New York State Urban Development Corporation commenced action against eMagin in the Supreme Court of the State of New York, County of New York asserting breach of contract and seeking to recover a $150,000 grant which was made to eMagin based on goals set forth in the agreement for recruitment of employees. On July 13, 2006, eMagin agreed to a settlement with the New York State Urban Development Corporation to repay $112,200 of the $150,000 grant. The settlement required that repayments be made on a monthly basis in the amount of $3,116.67 per month commencing August 1, 2006 and ending on July 1, 2009. As of December 31, 2009, the settlement was paid in full and $37,800 was forgiven as a result of timely payments and was recorded in other income on the Company’s Consolidated Statements of Operations.
Separation and employment agreements
2011
Effective as of June 1, 2011, the Company and Andrew G. Sculley entered into an executive employment agreement (the “Employment Agreement”) pursuant to which Mr. Sculley will continue serving as the Company’s President and Chief Executive Officer until December 31, 2013 unless the contract is terminated sooner pursuant to its terms. Under the Employment Agreement, Mr. Sculley is paid an annual base salary of $384,000. Pursuant to the Employment Agreement, the Company agreed to use reasonable efforts to submit a proposal to its shareholders at its next annual meeting relating to the approval of a new incentive stock plan (“Plan”) and to grant Mr. Sculley stock options (the “Options”) and/or restricted shares of the Company’s Common Stock, valued at $400,000 (based on a Black Scholes valuation method for the Options and the market price on the day of the grant for the restricted stock), within ten days of the annual meeting, provided the Plan was approved. On November 3, 2011, Mr. Sculley was granted 188,333 options at $4.03 per share, of which (i) 1/3 shall vest on the 1st annual anniversary of the Employment Agreement, (ii) 1/3 shall vest on the 2nd annual anniversary of the Employment Agreement and (iii) 1/3 shall vest on December 31, 2013.
50
Pursuant to the Employment Agreement, Mr. Sculley’s employment may be terminated by the Company with or without cause and he may terminate his employment for Good Reason (as defined in the Employment Agreement) and such other reasons set forth in the Employment Agreement. If Mr. Sculley’s employment agreement is terminated without cause or if he terminates it for Good Reason, then Mr. Sculley, at the Company’s sole discretion, shall be entitled to the lesser of (i) the total amount of his base salary that remains unpaid under the Employment Agreement, which shall be paid monthly or (ii) monthly salary payments for twelve (12) months, based on his monthly rate of base salary at the date of such termination, provided, however in lieu of the aforementioned monthly payments, the Company may in its sole discretion pay such payments in a lump-sum. Mr. Sculley shall also be entitled to receive (i) payment for accrued and unpaid vacation pay and (ii) all bonuses that have accrued during the term of the Employment Agreement, but have not been paid. Additionally, any non-vested options held by Mr. Sculley shall vest immediately. If the Employment Agreement is terminated with cause or if Mr. Sculley terminates it without Good Reason then Mr. Sculley shall cease to accrue salary, personal time off, benefits and other compensation on the date of such termination.
On March 15, 2011, the Company signed an executive employment agreement (the “Employment Agreement”) with Jerry Carollo to serve as the Company’s Senior Vice President Business Development effective March 21, 2011. Pursuant to the Employment Agreement, Mr. Carollo is paid a base salary of $270,000 and was granted 100,000 options which are exercisable at $6.89 per share, the market price on the date of the grant, of which one third will vest annually on the subsequent three anniversary dates. If Mr. Carollo voluntarily terminates his employment with the Company, other than for Good Reason as defined in the Employment Agreement, he shall cease to accrue salary, personal time off, benefits and other compensation on the date of voluntary termination. The Company may terminate Mr. Carollo’s employment with or without cause. If the Company terminates without cause, Mr. Carollo will be entitled to the lesser of (i) the total amount of base salary that remains unpaid under the Employment Agreement which shall be paid monthly or (ii) monthly salary payments for twelve (12) months, based on his monthly rate of base salary at the date of such termination, or in lieu of the aforementioned monthly payments, the Company may in its sole discretion pay such payments in a lump- sum. Mr. Carollo shall also be entitled to receive (i) payment for accrued and unpaid vacation pay and (ii) all bonuses that have accrued during the term of the Employment Agreement, but not been paid. All non-vested options shall vest immediately.
On January 19, 2011, the Company signed an executive employment agreement (the “Employment Agreement”) with Susan R. Taylor to serve as the Company’s Corporate Secretary, Senior Vice President and General Counsel effective February 1, 2011. Pursuant to the Employment Agreement, Ms. Taylor is paid a base salary of $175,000 and was granted 225,000 options which are exercisable at $6.82 per share, the market price on the date of the grant, of which one third will vest annually on the subsequent three anniversary dates. If Ms. Taylor voluntarily terminates her employment with the Company, other than for Good Reason as defined in the Employment Agreement, she shall cease to accrue salary, personal time off, benefits and other compensation on the date of voluntary termination. The Company may terminate Ms. Taylor’s employment with or without cause. If the Company terminates without cause, Ms. Taylor will be entitled to, at the Company’s sole discretion, either (i) monthly salary payments for twelve (12) months, based on her monthly rate of base salary at the date of such termination, or (ii) a lump-sum payment of her salary for such 12 month period, based on her monthly rate of base salary at the date of such termination. Ms. Taylor shall also be entitled to receive (i) payment for accrued and unpaid vacation pay and (ii) all bonuses that have accrued during the term of the Employment Agreement, but not been paid. All non-vested options shall vest immediately.
2010
Pursuant to the Employment Agreement between the Company and Susan Jones (as previously amended and extended, the “Employment Agreement”), the term of Ms. Jones’ contract with the Company ended May 12, 2010 and her employment with the Company ceased at that time. Under the terms of the Employment Agreement between Susan Jones and the Company, Ms. Jones was entitled to a payment of eighteen months salary totaling approximately $473 thousand which payment was made as of June 30, 2010, incentive payments of 1% of revenue paid quarterly for a period of eighteen months, continuation of health insurance for twenty four months and a moving allowance for personal effects of $7.5 thousand. In addition, 12,696 unvested options immediately vested and became exercisable upon termination. As a result, the Company took a one-time non-cash compensation charge of $28 thousand in the second quarter of 2010.
The Company accounted for the incentive payments under guidance that benefits provided in accordance with an agreement be recorded as a liability when it is probable that the employee is entitled to the benefits and the amount can be reasonably estimated. At June 30, 2010, the Company estimated that $440 thousand was a reasonable estimate of the eighteen months of incentive payments and approximately $21 thousand was a reasonable estimate for the continuation of health insurance for twenty four months. Thus, at that time the Company recorded a liability of approximately $469 thousand which included the incentive payments, health insurance coverage, and the moving allowance and the associated expense as a selling, general and administrative expense in the financial statements issued for the period ended June 30, 2010. At December 31, 2010, the Company reviewed the estimates and assessed the liability for the incentive payments and health insurance coverage, and recorded an additional liability of $175 thousand. Total severance expense for 2010 was $1.1 million.
51
2009
On May 8, 2009, the Company signed a three year executive employment agreement with Paul Campbell to serve as the Company’s Chief Financial Officer, Senior Vice President and Treasurer. Mr. Campbell had been serving as the Company’s Interim Chief Financial Officer since April 15, 2008. Pursuant to the employment agreement, Mr. Campbell was paid an initial annual salary of $282 thousand and was granted options to purchase 340,000 shares of the Company’s common stock which are exercisable at $1.09 per share, the market price on the date of the grant. The options vested as follows: one third of the options vested immediately and one third vested annually on the subsequent two anniversary dates. If Mr. Campbell voluntarily terminates his employment with the Company, other than for good reason as defined in the employment agreement, he shall cease to accrue salary, personal time off, benefits and other compensation on the date of voluntary termination. The Company may terminate Mr. Campbell’s employment with or without cause. If the Company terminates without cause, Mr. Campbell will be entitled to one year of salary.
In connection with the employment of Paul Campbell, the Company entered into an agreement with Tatum LLC (“Tatum”). Pursuant to the agreement with Tatum, the Company paid Tatum a signing fee of approximately $99 thousand. In addition, the Company granted Tatum 60,000 options with the same vesting and exercise price as Mr. Campbell's.
Note 12 - CONCENTRATIONS
The following is a schedule of domestic and international revenue as a percentage of total net revenues:
|
For the years ended December 31,
|
||||||||||||
|
2011
|
2010
|
2009
|
||||||||||
|
Domestic
|
63%
|
66%
|
57%
|
|||||||||
|
International
|
37%
|
34%
|
43%
|
|||||||||
The following is a schedule of revenue by geographic location (in thousands):
|
For the years ended December 31,
|
||||||||||||
|
2011
|
2010
|
2009
|
||||||||||
|
North and South America
|
$
|
19,068
|
$
|
20,609
|
$
|
13,742
|
||||||
|
Europe, Middle East, and Africa
|
7,107
|
6,874
|
5,939
|
|||||||||
|
Asia Pacific
|
3,006
|
2,975
|
4,141
|
|||||||||
|
Total
|
$
|
29,181
|
$
|
30,458
|
$
|
23,822
|
||||||
The Company purchases principally all of its silicon wafers from a single supplier located in Taiwan.
In 2011, there was no customer that accounted for more than 10% of its net revenue and there was one customer that accounted for approximately 13% and 12% of its net revenue in 2010 and 2009, respectively.
At December 31, 2011 and 2010, there were 10 customers who comprised 59% and 74%, respectively, of the outstanding accounts receivable. The Company had no customers that accounted for more than 10% of its outstanding receivable in 2011 and three customers that each accounted for more than 10% of its outstanding accounts receivable in 2010.
52
Note 13 – QUARTERLY FINANCIAL INFORMATION (UNAUDITED)
Summarized quarterly financial information for 2011 and 2010 are as follows (in thousands except share data):
|
Quarters Ended
|
||||||||||||||||
|
March 31, 2011
|
June 30, 2011
|
September 30, 2011
|
December 31, 2011
|
|||||||||||||
|
Revenues
|
$
|
5,441
|
$
|
7,449
|
$
|
8,263
|
$
|
8,028
|
||||||||
|
Gross margin
|
$
|
2,246
|
$
|
3,626
|
$
|
4,359
|
$
|
5,243
|
||||||||
|
Net (loss) income before provision for income tax
|
$
|
(3,497
|
)
|
$
|
3,184
|
$
|
4,607
|
$
|
1,467
|
|||||||
|
Net (loss) income
|
$
|
(3,339
|
)
|
$
|
2,971
|
$
|
4,119
|
$
|
1,215
|
|||||||
|
Net (loss) income per share – basic
|
$
|
(0.16
|
)
|
$
|
0.10
|
$
|
0.13
|
$
|
0.04
|
|||||||
|
Net (loss) income per share – diluted
|
$
|
(0.16
|
)
|
$
|
0.01
|
$
|
0.03
|
$
|
0.04
|
|||||||
|
Weighted average number of shares outstanding – basic
|
21,522,716
|
21,853,631
|
23,084,229
|
23,331,975
|
||||||||||||
|
Weighted average number of shares outstanding –diluted
|
21,522,716
|
25,717,758
|
25,322,920
|
23,371,771
|
||||||||||||
|
Quarters Ended
|
||||||||||||||||
|
March 31, 2010
|
June 30, 2010
|
September 30, 2010
|
December 31, 2010
|
|||||||||||||
|
Revenues
|
$
|
5,927
|
$
|
8,312
|
$
|
8,256
|
$
|
7,963
|
||||||||
|
Gross margin
|
$
|
3,318
|
$
|
4,739
|
$
|
5,468
|
$
|
4,915
|
||||||||
|
Net (loss) income before provision for income tax
|
$
|
(8,616
|
)
|
$
|
84
|
$
|
3,607
|
$
|
(5,146
|
)
|
||||||
|
Net (loss) income
|
$
|
(8,617
|
)
|
$
|
66
|
$
|
3,551
|
$
|
3,860
|
(1)
|
||||||
|
Net (loss) income per share – basic
|
$
|
(0.50
|
)
|
$
|
0.00
|
$
|
0.13
|
$
|
0.14
|
|||||||
|
Net (loss) income per share – diluted
|
$
|
(0.50
|
)
|
$
|
0.00
|
$
|
0.08
|
$
|
0.13
|
|||||||
|
Weighted average number of shares outstanding – basic
|
17,109,706
|
19,338,241
|
19,883,029
|
20,583,516
|
||||||||||||
|
Weighted average number of shares outstanding –diluted
|
17,109,706
|
22,258,364
|
24,244,477
|
22,594,197
|
||||||||||||
|
(1)
|
Included in net income for the three months ended December 31, 2010 is the tax benefit of $9.1 million related to the reversal of the deferred tax valuation allowance. See Note 8 – Income Taxes.
|
|||||||||||||||
53
ITEM 9. CHANGES IN AND DISAGREEMENTS WITH ACCOUNTANTS ON ACCOUNTING AND FINANCIAL DISCLOSURE
ITEM 9A. CONTROLS AND PROCEDURES
(a) Evaluation of Disclosure Controls and Procedures
Our principal executive and principal financial officers have evaluated the effectiveness of our disclosure controls and procedures, as defined in Rules 13a – 15(e) and 15d – 15(e) under the Securities Exchange Act of 1934, as amended (the “Exchange Act”), as of the end of the period covered by this annual report. They have concluded that, based on such evaluation, our disclosure controls and procedures were effective as of December 31, 2011.
(b) Management’s Annual Report on Internal Control Over Financial Reporting
Overview
Internal control over financial reporting as defined in Rules 13a-15(f) and 15d-15(f) refers to the process designed by, or under the supervision of, our principal executive officer and principal financial officer, and effected by our board of directors, management and other personnel, to provide reasonable assurance regarding the reliability of financial reporting and the preparation of financial statements for external purposes in accordance with generally accepted accounting principles in the United States of America. Management is responsible for establishing and maintaining adequate internal control over financial reporting for eMagin.
Internal control over financial reporting cannot provide absolute assurance of achieving financial reporting objectives because of its inherent limitations. Internal control over financial reporting is a process that involves human diligence and compliance and is subject to lapses in judgment and breakdowns resulting from human failures. Internal control over financial reporting also can be circumvented by collusion or improper management override. Because of such limitations, there is a risk that material misstatements may not be prevented or detected on a timely basis by internal control over financial reporting. However, these inherent limitations are known features of the financial reporting process. Therefore, it is possible to design into the process safeguards to reduce, though not eliminate, this risk.
Management has used the framework set forth in the report entitled “Internal Control -- Integrated Framework” published by the Committee of Sponsoring Organizations (“COSO”) of the Treadway Commission to evaluate the effectiveness of eMagin’s internal control over financial reporting. A material weakness is a deficiency, or a combination of deficiencies, in internal control over financial reporting such that there is a reasonable possibility that a material misstatement of our annual or interim financial statements will not be prevented or detected on a timely basis.
Management’s Assessment
As of December 31, 2011, our management has assessed the effectiveness of our internal control over financial reporting and has determined that our internal control over financial reporting were effective.
McGladrey & Pullen LLP, the Company’s independent registered public accounting firm, have issued an opinion on the effectiveness of the Company’s internal control over financial reporting as of December 31, 2011, which is included in this Annual Report on Form 10-K.
Restatement of Consolidated Financial Statements
On August 10, 2011, the Audit Committee of the Board of Directors (“Audit Committee”) in consultation with the Company’s management concluded that the financial statements included in the Company’s Annual Reports issued on Form 10-K for the years ended December 31, 2009 and 2010 and quarterly reports issued on Form 10-Q for the quarters ended March 31, June 30, and September 30, 2009; March 31, June 30, and September 30, 2010; and March 31, 2011 did not use the proper method to calculate earnings per share and as a result, should not be relied upon. On August 15, 2011, after consulting with the Audit Committee on August 10, 2011 and with the Company’s auditors and former auditors, management concluded that the Company did not properly account for certain common stock warrants as liabilities and as a result, the financial statements, as mentioned above, should not be relied upon. The Audit Committee authorized and directed Company’s management to restate its consolidated financial statements for the above mentioned periods.
54
Remediation Plan
Since the determination regarding this deficiency, we have devoted significant effort and resources to remediation and improvement of our internal control over financial reporting. While we had processes in place to identify and apply developments in accounting standards, we enhanced these processes to better evaluate our research of the nuances of complex accounting standards. Our enhancements included retaining a third party consultant, who is a technical accounting professional, to assist us in the interpretation and application of new and complex accounting guidance. Additionally, we have improved training of accounting personnel and communication among our internal staff, our legal team and our consultant. Management will continue to review and make necessary changes to the overall design of our internal control environment.
(c) Changes in Internal Control over Financial Reporting
Other than mentioned above, there have been no changes in the Company’s internal control over financial reporting that occurred during the Company’s last fiscal year that have materially affected, or are reasonably likely to materially affect, our internal control over financial reporting. These conclusions were communicated to the Audit Committee.
ITEM 9B. OTHER INFORMATION
None.
55
ITEM 10. DIRECTORS, EXECUTIVE OFFICERS AND CORPORATE GOVERNANCE
The information required by this Item will be included in the Company’s 2012 Proxy Statement to be filed with the U.S. Securities and Exchange Commission (“SEC”) in connection with the solicitation of proxies for the Company’s 2012 Annual Meeting of Shareholders (“2012 Proxy Statement”) and is incorporated herein by reference. Such Proxy Statement will be filed with the SEC within 120 days after the end of the fiscal year to which this report relates.
ITEM 11. EXECUTIVE COMPENSATION
The information required by this Item will be included in the Company’s 2012 Proxy Statement and is incorporated herein by reference.
ITEM 12. SECURITY OWNERSHIP OF CERTAIN BENEFICIAL OWNERS AND MANAGEMENT AND RELATED STOCKHOLDER MATTERS
The information required by this Item will be included in the Company’s 2012 Proxy Statement and is incorporated herein by reference.
ITEM 13. CERTAIN RELATIONSHIPS AND RELATED TRANSACTIONS AND DIRECTOR INDEPENDENCE
The information required by this Item will be included in the Company’s 2012 Proxy Statement and is incorporated herein by reference.
ITEM 14. PRINCIPAL ACCOUNTANT FEES AND SERVICES
The information required by this Item will be included in the Company’s 2012 Proxy Statement and is incorporated herein by reference.
PART IV
(a) Financial Statements and Schedules
1. Financial Statements
The following consolidated financial statements are filed as part of this report under Item 8 of Part II “Financial Statements and Supplementary Data.:
A. Consolidated Balance Sheets at December 31, 2011 and 2010.
B. Consolidated Statements of Operations for the Years Ended December 31, 2011, 2010, and 2009.
C. Consolidated Statements of Changes in Shareholders’ Equity for the Years Ended December 31, 2011, 2010, and 2009.
D. Consolidated Statements of Cash Flows for the Years Ended December 31, 2011, 2010 and 2009.
2. Financial Statement Schedules
The following financial statement schedule is filed as part of this report:
A. Schedule II – Valuation and Qualifying Accounts
Financial statement schedules not included herein have been omitted because they are either not required, not applicable, or the information is otherwise included herein.
(b) Exhibits
The exhibits listed in the accompanying Index to Exhibits on pages 59 to 60 are filed or incorporated by reference as part of this Annual Report on Form 10-K.
56
SIGNATURES
In accordance with Section 13 or 15(d) of the Exchange Act, the registrant caused this report to be signed on its behalf by the undersigned, thereunto duly authorized on this 15th day of March, 2012.
|
eMAGIN CORPORATION
|
|||
|
By:
|
/s/ Andrew G. Sculley
|
||
|
Andrew G. Sculley
|
|||
|
Chief Executive Officer
|
|||
In accordance with the Exchange Act, this report has been signed below by the following persons on March 15, 2012, on behalf of the registrant and in the capacities Indicated.
|
Signature
|
Title
|
|
|
/s/ Andrew G. Sculley
|
President and Chief Executive Officer, Director
|
|
|
Andrew G. Sculley
|
(Principal Executive Officer)
|
|
|
/s/ Paul Campbell
|
Chief Financial Officer
|
|
|
Paul Campbell
|
(Chief Accounting Officer and Principal Financial Officer)
|
|
|
/s/ Jill J. Wittels
|
Chair of the Board, Director
|
|
|
Jill J. Wittels
|
||
|
/s/ Irwin Engelman
|
Director
|
|
|
Irwin Engelman
|
||
|
/s/ Claude Charles
|
Director
|
|
|
Claude Charles
|
||
|
|
Director
|
|
|
Paul Cronson
|
||
|
/s/ Dr. Leslie Polgar
|
Director
|
|
|
Dr. Leslie Polgar
|
||
|
/s/ Brig. Gen. Stephen Seay
|
Director
|
|
|
Brig. Gen. Stephen Seay
|
||
57
eMAGIN CORPORATION
SCHEDULE II – VALUATION AND QUALIFYING ACCOUNTS
(In thousands)
|
Year Ended
|
Beginning Balance
|
Charged to Cost and Expenses
|
Deductions
|
Ending Balance
|
||||||||||||
|
2011
|
||||||||||||||||
|
Allowance for doubtful accounts
|
$
|
374
|
$
|
(98
|
)
|
$
|
(8
|
)
|
$
|
268
|
||||||
|
Inventory reserves
|
55
|
22
|
(70
|
)
|
6
|
|||||||||||
|
Warranty reserves
|
169
|
234
|
(122
|
)
|
281
|
|||||||||||
|
2010
|
||||||||||||||||
|
Allowance for doubtful accounts
|
$ |
584
|
$ |
(200
|
)
|
$ |
(10
|
)
|
$ |
374
|
||||||
|
Inventory reserves
|
117
|
(62
|
)
|
—
|
55
|
|||||||||||
|
Warranty reserves
|
831
|
(506)
|
(156
|
)
|
169
|
|||||||||||
|
2009
|
||||||||||||||||
|
Allowance for doubtful accounts
|
$ |
857
|
$ |
105
|
$ |
(378
|
)
|
$ |
584
|
|||||||
|
Inventory reserves
|
20
|
97
|
—
|
117
|
||||||||||||
|
Warranty reserves
|
738
|
254
|
(161
|
)
|
831
|
|||||||||||
58
INDEX TO EXHIBITS
|
Exhibit Number
|
Description
|
|
|
2.1
|
Agreement and Plan of Merger between Fashion Dynamics Corp., FED Capital Acquisition Corporation and FED Corporation dated March 13, 2000 (incorporated by reference to exhibit 2.1 to the Registrant's Current Report on Form 8-K/A filed on March 17, 2000).
|
|
|
3.1
|
Amended and Restated Certificate of Incorporation (incorporated by reference to an appendix to the Registrant's Definitive Proxy Statement filed on September 21, 2006).
|
|
|
3.2
|
Certificate of Amendment of Amended and Restated Certificate of Incorporation (incorporated by reference to an appendix to the Registrant’s Definitive Proxy Statement filed on October 26, 2010).
|
|
|
3.3
|
Bylaws of the Registrant (incorporated by reference to exhibit 99.3 to the Registrant's Definitive Proxy Statement filed on June 14, 2001).
|
|
|
3.4
|
Certificate of Designations of Series B Convertible Preferred Stock (incorporated by reference to Exhibit 4.2 of the Registrant’s current report on Form 8-K filed on December 23, 2008).
|
|
|
4.1
|
Form of Common Stock Purchase Warrant (incorporated by reference to Exhibit 4.1 to the Registrant’s current report on Form 8-K filed on December 23, 2008).
|
|
|
10.1
|
2000 Stock Option Plan, (incorporated by reference to Annex A to Exhibit 99.1 to the Registrant's Registration Statement on Form S-8 filed on March 14, 2000).*
|
|
|
10.2
|
Form of Agreement for Stock Option Grant pursuant to 2003 Stock Option Plan (incorporated by reference to exhibit 99.2 to the Registrant's Registration Statement on Form S-8 filed on March 14, 2000).*
|
|
|
10.3
|
Nonexclusive Field of Use License Agreement relating to OLED Technology for miniature, high resolution displays between the Eastman Kodak Company and FED Corporation dated March 29, 1999 (incorporated by reference to exhibit 10.6 to the Registrant's Annual Report on Form 10-K/A for the year ended December 31, 2000 filed on April 30, 2001).
|
|
|
10.4
|
Amendment Number 1 to the Nonexclusive Field of Use License Agreement relating to the LED Technology for miniature, high resolution displays between the Eastman Kodak Company and FED Corporation dated March 16, 2000 (incorporated by reference to exhibit 10.7 to the Registrant's Annual Report on Form 10-K/A for the year ended December 31, 2000 filed on April 30, 2001).
|
|
|
10.5
|
Lease between International Business Machines Corporation (“IBM”) and FED Corporation dated May 28, 1999 (incorporated by reference to exhibit 10.9 to the Registrant's Annual Report on Form 10-K for the year ended December 31, 2000 filed on March 30, 2001).
|
|
|
10.6
|
Amendment Number 1 to the Lease between IBM and FED Corporation dated July 9, 1999 (incorporated by reference to exhibits 10.8 to the Registrant's Annual Report on Form 10-K for the year ended December 31, 2000 filed on March 30, 2001)
|
|
|
10.7
|
Amendment Number 2 to the Lease between IBM and FED Corporation dated January 29, 2001 (incorporated by reference to exhibit 10.11 to the Registrant’s Annual Report on Form 10-K for the year ended December 31, 2000 filed on March 30, 2001).
|
|
|
10.8
|
Amendment Number 3 to Lease between IBM and FED Corporation dated May 28, 2002 (incorporated by reference to the Company’s Form S-1A as filed November 12, 2008).
|
|
|
10.9
|
Amendment Number 4 to Lease between IBM and FED Corporation dated December 14, 2004 (incorporated by reference to the Registrant’s Current Report on Form 8-K filed on December 20, 2004).
|
59
|
10.10
|
Amended and Restated 2003 Stock Option Plan, filed September 1, 2005, as filed in the Registrant’s Definitive Proxy Statement, incorporated herein by reference.*
|
|
|
10.11
|
2005 Employee Stock Purchase Plan, filed September 1, 2005, as filed in the Registrant’s Definitive Proxy Statement, incorporated herein by reference.*
|
|
|
10.12
|
Employment Agreement effective as of January 1, 2006 by and between eMagin and Susan Jones, filed January 27, 2006, as filed in the Registrant's Form 8-K incorporated herein by reference.
|
|
|
10.13
|
Amendment to Employment Agreement as of April 17, 2006 by and between eMagin and Susan Jones.
|
|
|
10.14
|
2004 Amended and Restated Non-Employee Compensation Plan, filed September 21, 2006, as filed in the Registrant's Definitive Proxy Statement incorporated herein by reference.*
|
|
|
10.15
|
Securities Purchase Agreement, dated December 18, 2008 (incorporated by reference to exhibit 99.1 of the Registrant’s Current Report on Form 8-K filed on December 22, 2008).
|
|
|
10.16
|
Registration Rights Agreement, dated December 18, 2008 (incorporated by reference to exhibit 99.2 of the Registrant’s Current Report on Form 8-K filed on December 22, 2008).
|
|
|
10.17
|
Exchange Agreement, dated December 18, 2008 (incorporated by reference to exhibit 99.3 of the Registrant’s Current Report on Form 8-K filed on December 22, 2008).
|
|
|
10.18
|
Employment Agreement effective as of May 8, 2009 by and between eMagin and Paul Campbell, incorporated by reference to the Company’s Form 8-K as filed May 14, 2009.
|
|
|
10.19
|
Amendment Number 6 to the lease between IBM and eMagin Corporation dated May 27, 2009 (incorporated by reference to the Registrant’s Current Report on Form 8-k filed on June 19, 2009).
|
|
|
10.20
|
Lease between Northup Building LLC and eMagin dated May 28, 2009 (incorporated by reference to the Registrant’s Current Report on Form 8-k filed on June 19, 2009).
|
|
|
10.21
|
Amendment No. 2 to the Employment Agreement between eMagin Corporation and Susan Jones.
|
|
|
10.22
|
Loan and Security Agreement between the Company and Access Business Finance, LLC (incorporated by reference to exhibit 99.1 of the Registrant’s Current Report on Form 8-K filed on September 11, 2009).
|
|
|
10.23
|
Executive Employment Agreement between Susan R. Taylor and the Company dated January 19, 2011 (incorporated by reference to exhibit 99.1 of the Registrant’s Current Report on Form 8-K filed January 25, 2011).
|
|
|
10.24
|
Executive Employment Agreement between the Company and Andrew G. Sculley dated June 1, 2011 (incorporated by reference to exhibit 99.1 of the Registrant’s Current Report on Form 8-K filed on June 7, 2011).
|
|
|
10.25
|
First Amendment of Loan and Security Agreement, dated as of September 1, 2011, between the Company and Access Business Finance L.L.C. (incorporated by reference to exhibit 99.1 of the Registrant’s Current Report on Form 8-K filed on September 30, 2011.
|
|
|
10.26
|
2011 Incentive Stock Plan, filed as exhibit 99.1 of the Registrant’s Current Report on Form 8-K filed on November 8, 2011).
|
|
|
21.1
|
Subsidiaries of the Company (filed herewith).
|
|
|
23.1
|
Consents of Independent Registered Public Accounting Firms (filed herewith).
|
|
|
31.1
|
Certification by Chief Executive Officer pursuant to Sarbanes Oxley Section 302 (filed herewith).
|
|
|
31.2
|
Certification by Chief Financial Officer pursuant to Sarbanes Oxley Section 302 (filed herewith).
|
|
|
32.1
|
Certification by Chief Executive Officer pursuant to 18 U.S.C. Section 1350 (filed herewith).
|
|
|
32.2
|
Certification by Chief Financial Officer pursuant to 18 U.S.C. Section 1350 (filed herewith).
|
|
|
101.INS
|
XBRL Instance Document
|
|
|
101.SCH
|
XBRL Taxonomy Extension Schema Document
|
|
|
101.CAL
|
XBRL Taxonomy Extension Calculation Linkbase Document
|
|
|
101.DEF
|
XBRL Taxonomy Extension Definition Linkbase Document
|
|
|
101.LAB
|
XBRL Taxonomy Extension Label Linkbase Document
|
|
|
101.PRE
|
XBRL Taxonomy Extension Presentation Linkbase Document
|
|
|
* Each of the Exhibits noted by an asterisk is a management compensatory plan or arrangement.
|
||
|
** The confidential portions of the exhibit has been omitted and filed separately with the Securities and Exchange Commission
|
||
60