Attached files
Table of Contents
UNITED STATES
SECURITIES AND EXCHANGE COMMISSION
Washington, D.C. 20549
Form 10-K
(Mark One)
| x | ANNUAL REPORT PURSUANT TO SECTION 13 OR 15(d) OF THE SECURITIES EXCHANGE ACT OF 1934 |
For the fiscal year ended December 31, 2011
or
| ¨ | TRANSITION REPORT PURSUANT TO SECTION 13 OR 15(d) OF THE SECURITIES EXCHANGE ACT OF 1934 |
For the transition period from to
Commission file number 0-27975
Mattersight Corporation
(Exact Name of Registrant as Specified in Its Charter)
| Delaware | 36-4304577 | |
| (State or other Jurisdiction of Incorporation or Organization) |
(I.R.S. Employer Identification No.) |
200 S. Wacker Drive, Suite 820
Chicago, Illinois 60606
(Address of Registrant’s Principal Executive Offices) (Zip Code)
Registrant’s telephone number, including area code: (877) 235-6925
Securities registered pursuant to Section 12(b) of the Act:
| Title of Each Class |
Name of Each Exchange on Which Registered | |
| Common Stock, par value $0.01 per share | NASDAQ Global Market |
Securities registered pursuant to Section 12(g) of the Act: None
Indicate by check mark if the registrant is a well-known seasoned issuer, as defined in Rule 405 of the Securities Act. Yes ¨ No x
Indicate by check mark if the registrant is not required to file reports pursuant to Section 13 or Section 15(d) of the Act. Yes ¨ No x
Indicate by check mark whether the registrant (1) has filed all reports required to be filed by Section 13 or Section 15(d) of the Securities Exchange Act of 1934 during the preceding 12 months (or for such shorter period that the registrant was required to file such reports), and (2) has been subject to such filing requirements for the past 90 days. Yes x No ¨
Indicate by check mark whether the registrant has submitted electronically and posted on its corporate Web site, if any, every Interactive Data File required to be submitted and posted pursuant to Rule 405 of Regulation S-T (Section 232.405 of this chapter) during the preceding 12 months (or for such shorter period that the registrant was required to submit and post such files). Yes x No ¨
Indicate by check mark if disclosure of delinquent filers pursuant to Item 405 of Regulation S-K is not contained herein, and will not be contained, to the best of registrant’s knowledge, in definitive proxy or information statements incorporated by reference in Part III of this Form 10-K or any amendment to this Form 10-K. ¨
Indicate by check mark whether the registrant is a large accelerated filer, an accelerated filer, a non-accelerated filer, or a smaller reporting company. See the definitions of “large accelerated filer,” “accelerated filer” and “smaller reporting company” in Rule 12b-2 of the Exchange Act. (Check one):
| Large accelerated filer ¨
|
Accelerated filer x
|
Non-accelerated filer ¨
|
Smaller reporting company ¨
| |||
| (Do not check if a smaller reporting company) | ||||||
Indicate by check mark whether the registrant is a shell company (as defined in Rule 12b-2 of the Act). Yes ¨ No x
The aggregate market value of Common Stock held by non-affiliates of the registrant, based upon the closing price per share of registrant’s Common Stock on July 1, 2011, as reported by The NASDAQ Stock Market LLC, is approximately $79,833,592.
The number of shares of the registrant’s Common Stock outstanding as of March 9, 2012 was 16,784,717.
DOCUMENTS INCORPORATED BY REFERENCE
Portions of Mattersight’s Proxy Statement for its 2012 Annual Meeting of Stockholders, to be filed with the Securities and Exchange Commission within 120 days after the end of Mattersight’s fiscal year, are incorporated herein by reference into Part III where indicated; provided, that if such Proxy Statement is not filed with the Securities and Exchange Commission within 120 days after the fiscal year end covered by this Form 10-K, an amendment to this Form 10-K shall be filed no later than the end of such 120-day period.
Table of Contents
| Item |
Page | |||||
| Item 1. |
2 | |||||
| Item 1A. |
5 | |||||
| Item 1B. |
8 | |||||
| Item 2. |
8 | |||||
| Item 3. |
8 | |||||
| Item 4. |
9 | |||||
| PART II | ||||||
| Item 5. |
9 | |||||
| Item 6. |
10 | |||||
| Item 7. |
Management’s Discussion and Analysis of Financial Condition and Results of Operations |
11 | ||||
| Item 7A. |
23 | |||||
| Item 8. |
24 | |||||
| Item 9. |
Changes in and Disagreements with Accountants on Accounting and Financial Disclosure |
55 | ||||
| Item 9A. |
55 | |||||
| Item 9B. |
55 | |||||
| PART III | ||||||
| Item 10. |
55 | |||||
| Item 11. |
56 | |||||
| Item 12. |
Security Ownership of Certain Beneficial Owners and Management and Related Stockholder Matters |
57 | ||||
| Item 13. |
Certain Relationships and Related Transactions, and Director Independence |
57 | ||||
| Item 14. |
57 | |||||
| PART IV | ||||||
| Item 15. |
58 | |||||
| 59 | ||||||
| I-1 | ||||||
Table of Contents
| Item 1. | Business. |
Overview
Mattersight Corporation (together with its subsidiaries and predecessors, “Mattersight,” “we,” “us,” or the “Company”) is a leader in enterprise analytics focused on customer and employee interactions and behaviors. Mattersight’s Behavioral Analytics service captures and analyzes customer and employee interactions, employee desktop data, and other contextual information to improve operational performance and predict future customer and employee outcomes. Mattersight’s analytics are based on millions of proprietary algorithms and the application of unique behavioral models. The Company’s SaaS+ delivery model combines analytics in the cloud with deep customer partnerships to drive significant business value. Mattersight’s applications are used by leading companies in the healthcare, insurance, financial services, telecommunications, cable, utilities, and government industries.
Following the sale by the Company of its Integrated Contact Solutions (“ICS”) Business Unit on May 28, 2011, the Company changed its corporate name from eLoyalty Corporation to Mattersight Corporation, and began operating in a single business segment, focused primarily on its Behavioral Analytics service (“Behavioral Analytics”). Through Behavioral Analytics, the Company generates two types of revenue:
| (1) | Managed services revenue, which is recurring, annuity revenue from long-term (generally three- to five-year) contracts and includes subscription and amortized deployment revenue; and |
| (2) | Consulting services revenue, which is generally project-based and sold on a time-and-materials or fixed-fee basis and includes follow-on consulting services revenue. |
Set forth below is a more detailed description of the capabilities that the Company currently offers.
Behavioral Analytics
The Company’s multi-channel technology captures the unstructured data of voice interactions (conversations), related customer and employee data, and employee desktop activity, and applies millions of proprietary algorithms against those interactions. Each interaction contains hundreds of attributes that get scored and ultimately detect patterns of behavior or business process that provide the transparency and predictability necessary to enhance revenue, improve the customer experience, improve efficiency, and predict and navigate outcomes. Adaptive across industries, programs, and industry-specific processes, the Company’s Behavioral Analytics offerings enable its clients to drive measurable economic benefit through the improvement of contact center performance, customer satisfaction and retention, fraud reduction, and streamlined back office operations. Specifically, through its Behavioral Analytics offerings, Mattersight helps its clients:
| • | Automatically measure customer satisfaction and agent performance on every analyzed call; |
| • | Identify and understand customer personality; |
| • | Improve rapport between agent and customer; |
| • | Reduce call handle times while improving customer satisfaction; |
| • | Identify opportunities to improve self-service applications; |
| • | Improve cross-sell and up-sell success rates; |
| • | Improve the efficiency and effectiveness of collection efforts; |
| • | Identify customer experience issues and score calls for retention risk; |
| • | Measure and improve supervisor effectiveness and coaching; |
| • | Improve agent effectiveness by analyzing key attributes of desktop usage; |
| • | Predict likelihood of a customer attrition; and |
| • | Identify fraud callers and improve authentication processes. |
The Company has designed a highly-scalable, flexible, and adaptive application platform to enable the Company to implement and operate its Behavioral Analytics offerings for its clients. These offerings are primarily delivered through a SaaS+ model, as a managed subscription service from which Mattersight derives Managed services revenue and Consulting services revenue. Managed services revenue consists of deployment and subscription services and Consulting services revenue consists of post-deployment follow-on services, including coaching, training, and custom data analysis.
2
Table of Contents
In addition to our Behavioral Analytics offerings, Mattersight also generates revenue from the following services:
Marketing Managed Services
Marketing Managed Services revenue, which is derived from marketing application hosting services.
CRM Services
CRM Services revenue, which is derived from operational consulting services that enhance business performance through improved process efficiencies and redesign of workflows.
Types of Revenue
Managed Services Revenue
Growth in Managed services revenue is primarily driven by the execution of new Behavioral Analytics contracts, under which we deploy and provide the ongoing hosting of our proprietary Behavioral Analytics System. Based on each client’s business requirements, the Behavioral Analytics System is configured and integrated into the client’s environment and then deployed in either a remote-hosted or, in one case, an on-premise hosted environment. Thereafter, the client’s selection of our Behavioral Analytics offerings is provided, on a subscription basis, for a term that is generally three to five years. The fees and costs related to the initial deployment are deferred and amortized over the term of the contract.
We also generate Managed services revenue from Marketing Managed Services, specifically, from hosted customer and campaign data management. This source of Managed services revenue is likely to diminish over time as we focus on growth through Behavioral Analytics.
Consulting Services Revenue
In addition to the Consulting services revenue generated by the Consulting services provided under our Behavioral Analytics contracts, we derive a portion of this type of revenue from CRM Services for long-standing accounts. Consulting services revenue from CRM Services is anticipated to diminish over time as demand for these services continues to decline and we focus on growth through Behavioral Analytics. We bill for Consulting services on a time-and-materials or fixed-fee basis.
Business Segments
The Company operated in two business segments, the Behavioral Analytics Service Business Unit and the ICS Business Unit, until May 28, 2011, the date of the close of the sale of the ICS Business Unit, at which point the Company began operating in a single business segment, focused primarily on Behavioral Analytics.
International Operations
The Company’s services are delivered to clients in North America (U.S. and Canada) and Europe (the United Kingdom). The Company’s long-lived assets are and have been predominately located in North America and consist of equipment, software, furniture and fixtures, and leasehold improvements (net of accumulated depreciation).
Methods of Distribution
Our Managed services revenue and Consulting services revenue are generated by direct contractual relationships with our clients.
Intellectual Property Rights
General
Our ability to protect our software, methodologies, and other intellectual property is important to our success and our competitive position. We view as proprietary the software (including source code), algorithms, analyses, and other ideas, concepts, and developments that we create in order to provide, improve, and enhance our service offerings, as well as the work product we create in the course of providing services for clients. We seek to protect our intellectual property rights in these developments and work product by relying on a combination of patent, copyright, trademark, and trade secret law, and confidentiality and non-disclosure agreements with our employees and third parties.
Patents
As of December 31, 2011, we hold six U.S. and one European patent and have applied for several additional patents. These patents cover a broad range of our analytics capabilities, including methods for analyzing language to assess customer personality and analyzing data to improve employee performance. We regularly review new areas of development in order to assess patentability.
Trademarks
In connection with the sale of our ICS business unit, we sold the “eLoyalty” trademark and logo. Effective as of May 31, 2011, we began doing business as Mattersight Corporation. We have applied to register the trademarks in “MATTERSIGHT”, our logo (the “eye”), and our tagline “SEE WHAT MATTERS”.
3
Table of Contents
Licenses
A majority of our clients require that we grant to them licenses in and to the intellectual property rights associated with the work product we create in the course of providing services. In some cases, our clients require assignment of ownership in the intellectual property rights to such work product, typically where such work product embodies their confidential information or would provide them some competitive advantage in their industry. Absent an agreement to the contrary, each assignment of ownership in intellectual property rights would result in our inability to reuse the relevant work product with other clients. As a result, it is our practice to retain the rights in the underlying core intellectual property on which such work product is based, including methodologies, workplans, and software. Further, it is our policy to obtain from our clients a license to permit us to market custom software and other original materials to other clients. These arrangements may be nonexclusive or exclusive, and licensors to us may retain the right to sell products and services that compete with those of the Company.
Seasonality
Seasonal impact to our revenue and earnings is limited, as a significant portion of our revenue is earned through our Behavioral Analytics subscription services, which is a recurring annuity revenue stream that is not impacted by holidays and vacations.
Clients
During fiscal year 2011, our five and 10 largest clients accounted for 70% and 90% of our total revenue, respectively. In fiscal year 2011, there were three clients that accounted for 10% or more of total revenue. Vangent, Inc., Allstate Insurance Company, and Health Care Service Corporation, which accounted for 22%, 15%, and 14% of our total revenue, respectively. For fiscal year 2010, there were four clients accounting for more than 10% of the total revenue. Vangent, Inc., United HealthCare Services, Inc., Health Care Service Corporation, and Allstate Insurance Company accounted for 20%, 15%, 14%, and 13% of total revenue, respectively. For fiscal year 2009, three clients accounted for 10% of total revenue. Blue Shield of California, United HealthCare Services, Inc., and Health Care Service Corporation accounted for 16%, 14%, and 11% of total revenue, respectively. For fiscal years 2011, 2010, and 2009 seven, six and nine clients each accounted for over $1 million of total revenue. See Note Two “Summary of Significant Accounting Policies” of the “Notes to Consolidated Financial Statements” included in Part II Item 8 of this Form 10-K.
Competition
Although we view the manner in which we provide Behavioral Analytics, and its benefits, to be unique, we nonetheless operate in a highly competitive and rapidly changing market and compete with a variety of organizations that offer services that may be viewed as similar to ours. These competitive organizations include data analytics solutions providers, voice recording and voice analytic services providers and software licensors, and strategic consulting firms. In our opinion, few competitors offer the full range and depth of services that we can provide, but they may compete with us on individual factors such as expertise, price, or capacity.
Many of our competitors have longer operating histories, more clients, longer relationships with their clients, greater brand or name recognition, and significantly greater financial, technical, marketing, and public relations resources than we do. As a result, our competitors may be in a better position to respond quickly to new or emerging technologies and changes in client requirements. They may also develop and promote their products and services more effectively than we do. New market entrants also pose a threat to our business. Existing or future competitors may develop or offer solutions that are comparable or superior to ours at a lower price.
Environmental Issues
There are no known material compliance issues with any Federal, state, or local environmental regulations.
Employees
As of December 31, 2011, we employed 223 persons, none of whom is represented by a union. We consider our employee relations to be good.
Available Information and Other
Our principal internet address is www.Mattersight.com. Our Annual, Quarterly, and Current Reports on Forms 10-K, 10-Q, and 8-K, and any amendments thereto, as well as the Forms 3, 4, and 5 beneficial ownership reports filed with respect to our stock, are made available free of charge on our website as soon as reasonably practicable after the reports have been filed with, or furnished to, the Securities and Exchange Commission (“SEC”). However, the information found on our website is not part of this or any other report filed by us with the SEC. These reports may also be obtained at the SEC’s public reference room at 100 F Street, N.E., Washington, D.C. 20549. The SEC also maintains a website at www.sec.gov that contains reports, proxy statements, and other information regarding SEC registrants, including Mattersight.
Mattersight was incorporated in Delaware in May 1999. Our executive office is currently located at 200 S. Wacker Drive, Suite 820, Chicago, Illinois 60606 and our main telephone number is (877) 235-6925.
4
Table of Contents
| Item 1A. | Risk Factors. |
There are a number of risks and uncertainties that could adversely affect our business and our overall financial performance. In addition to the matters discussed elsewhere in this Form 10-K, we believe the more significant of such risks and uncertainties include the following:
We have not realized an operating profit in eleven years and there is no guarantee that we will realize an operating profit in the foreseeable future.
As of December 31, 2011, we had an accumulated deficit of $185.8 million. We expect to continue to use cash and incur operating expenses to support our growth, including costs associated with recruiting, training, and managing our sales force, costs to develop and acquire new technology, and promotional costs associated with reaching new clients. These investments, which typically are made in advance of revenue, may not yield increased revenue to offset these expenses. As a result of these factors, our future revenue and income potential is uncertain.
Our financial results are subject to significant fluctuations because of many factors, any of which could adversely affect our stock price.
It is possible that in some future periods our operating results may be below the expectations of public market analysts and investors. In this event, the price of our Common Stock may fall. Our revenue and operating results may vary significantly due to a number of factors, many of which are not in our control. We may incur an impairment of goodwill if our financial results are adversely impacted by these factors and we continue to incur financial losses or our stock price declines. These factors include:
| • | Our ability to continue to grow our revenue and meet anticipated growth targets; |
| • | Our ability to maintain our current relationships, and develop new relationships, with clients, service providers, and business partners; |
| • | Unanticipated cancellations or deferrals of, or reductions in the scope of, major Behavioral Analytics contracts; |
| • | The length of the sales cycle associated with our solutions; |
| • | Our ability to successfully introduce new, and upgrade our existing, service offerings for clients; and |
| • | Our ability to respond effectively to competition. |
If we are unable to address these risks, our business, results of operations, and prospects could suffer.
We depend on a limited number of clients for a significant portion of our revenue, and the loss of a significant client or a substantial decline in the number or scope of projects that we do for a significant client, could have a material adverse effect on our business.
We derive, and expect to continue to derive for the foreseeable future, a significant portion of our total revenue from a limited number of clients. See “Clients” in Part I Item 1 and “Year Ended December 31, 2011 Compared with the Year Ended January 1, 2011” included in “Management’s Discussion and Analysis of Financial Condition and Results of Operations” in Part II Item 7 of this Form 10-K. To the extent that any significant client uses less of our services or terminates its relationship with us, as may occur as clients respond to conditions affecting their own businesses, our total revenue could decline substantially and that could significantly harm our business. In addition, because a high percentage of our revenue is dependent on a relatively small number of clients, delayed payments by a few of our larger clients could result in a reduction of our available cash, which in turn may cause fluctuation in our Days Sales Outstanding (“DSO”).
We depend on good relations with our major clients, and any harm to these good relations may materially and adversely affect our business and our ability to compete effectively.
To attract and retain clients, we depend to a large extent on our relationships with our clients and our reputation for high quality analytics and related services. If a client is not satisfied with our services, including those of subcontractors or vendors that we may utilize, it may be damaging to our reputation and business. Any defects or errors in our services or solutions or failure to meet our clients’ expectations could result in:
| • | Delayed or lost revenue; |
| • | Obligations to provide additional services to a client at a reduced fee or at no charge; |
| • | Negative publicity, which could damage our reputation and adversely affect our ability to attract or retain clients; and |
| • | Claims for damages against us, regardless of our responsibility for such failure. |
5
Table of Contents
If we fail to meet our contractual obligations with our clients, then we could be subject to legal liabilities or loss of clients. Although our contracts typically include provisions to limit our exposure to legal claims for the services and solutions we provide, these provisions may not protect us in all cases.
We must maintain our reputation and expand our name recognition to remain competitive.
We believe that establishing and maintaining a good reputation and brand name is critical for attracting and expanding our targeted client base. This is particularly the case following the close of the sale of our ICS business unit, which resulted in the sale of the “eLoyalty” name and logo and launch of a new brand under the name Mattersight Corporation. We must invest substantially in marketing in order to make our new name known in the marketplace for our services and solutions. If potential clients do not know what solutions we provide, or if our reputation is damaged, then we may become less competitive or lose our market share. Promotion and enhancement of our name will depend largely on both the efficacy of our nascent marketing efforts and our success in providing high quality services, software, and solutions, neither of which can be assured.
Our clients use our solutions for critical applications. If clients do not perceive our solutions to be effective or of higher quality than those available from our competitors, or if our solutions result in errors, defects, or other performance problems, then our brand name and reputation could be materially and adversely affected.
Our industry is very competitive and, if we fail to compete successfully, our market share and business will be adversely affected.
We operate in a highly competitive and rapidly changing market and compete with a variety of organizations that offer services that may be viewed as similar to ours. These competitive organizations include data analytics solutions providers, voice recording and voice analytic service providers and software licensors, and strategic consulting firms. We compete with these organizations on factors such as expertise, price, or capacity.
Many of our competitors have longer operating histories, more clients, longer relationships with their clients, greater brand or name recognition, and significantly greater financial, technical, marketing, and public relations resources than we do. As a result, our competitors may be in a better position to respond quickly to new or emerging technologies and changes in client requirements. They may also develop and promote their products and services more effectively than we do. New market entrants also pose a threat to our business. Existing or future competitors may develop or offer solutions that are comparable or superior to ours at a lower price.
We must keep pace with the rapid rate of innovation in our industry in order to build our business.
The data analytics market, and particularly behavioral analytics, is relatively new and rapidly evolving. Our future business depends upon continued growth in the acceptance and use of Behavioral Analytics by our current and prospective clients. Their acceptance and usage in turn may depend upon factors such as: the actual or perceived benefits of adoption of Behavioral Analytics and related methodologies and technologies, including the predictability of a meaningful return on investment, cost efficiencies, or other measurable economic benefits; the actual or perceived reliability, scalability, ease of use, and access to such new technologies and methodologies; and the willingness to adopt new business methods incorporating a customer-centric approach. Furthermore, our future growth depends on our continuing ability to innovate in the field of data analytics and to incorporate emerging industry standards.
We cannot assure that we will be successful in anticipating or responding to these challenges on a timely or competitive basis or at all, or that our ideas and solutions will be successful in the marketplace. In addition, new or disruptive technologies and methodologies by our competitors may make our service or solution offerings uncompetitive. Any of these circumstances could significantly harm our business and financial results.
Because many of our services and solutions are sophisticated, we must invest greater resources in sales and installation processes with greater risk of loss if we are not successful.
In many cases, it is necessary for us to educate our potential clients about the benefits and value of our services and solutions because many of our services and solutions are not simple, mass-market items with which clients are already familiar. In addition, many of our services and solutions are sophisticated and may not be readily usable by clients without our assistance in system integration and configuration, training, and analysis. The greater need to work with and educate clients as part of the sales process and, after completion of a sale, during the installation and ongoing analysis process for many of our services and solutions, increases the time and difficulty of completing transactions, makes it more difficult to efficiently deploy limited resources, and creates risk that we will have invested in an opportunity that ultimately does not come to fruition. If we are unable to demonstrate the benefits and value of our services and solutions to clients and efficiently convert our sales leads into successful sales and installations, our results of operations may be adversely affected.
The unauthorized disclosure of the confidential customer data that we maintain could result in a significant loss of business and subject us to substantial liability.
In providing Behavioral Analytics, we record and analyze telephone calls and other interactions between our clients’ call center and back office agents and their customers. These interactions may contain numerous references to highly sensitive confidential or personally-identifiable data of the customers of our clients, and many of our clients are required to comply with federal and state laws concerning privacy and security, such as the Health Insurance Portability and Accountability Act of 1996 and the Gramm-Leach-Bliley Act of 1999. In addition, we have made certain contractual commitments to our clients regarding this confidential data.
6
Table of Contents
Increasingly, our clients demand that we agree not to limit our liability in the event of a security breach resulting in the loss of or unauthorized access to personally-identifiable data. As a result, the disclosure or loss of such data despite the extensive precautions we undertake could result in the considerable diminution of our business and prospects and could subject us to substantial liability.
In addition, the laws and regulations and industry standards governing these matters are changing rapidly. It is possible that the resources we devote to comply with such laws and regulations, industry standards, and our clients’ particular requirements could increase materially. In our contracts, we generally agree to indemnify our clients for expenses and liabilities resulting from unauthorized disclosure of confidential data. In some instances, the amount of these indemnity obligations may be greater than the revenue we receive from the client under the applicable contract.
We are a very small public company with a large cash balance.
While all public companies face the costs and burdens associated with being publicly traded, the costs and burden of being a public company is a significant portion of our annual revenues. Additionally, as of December 31, 2011, we have $29.4 million in cash, cash equivalents, and investments. Having a large cash balance relative to our market capitalization could make us a takeover target in the future, which could cause distractions for our management and our board of directors and otherwise prevent us from executing on our strategy to build long-term stockholder value.
Our financial results could be adversely affected by economic and political conditions and the effects of these conditions on our clients’ businesses and levels of business activity.
Global economic and political conditions affect our clients’ businesses and the markets they serve. A severe and/or prolonged economic downturn or a negative or uncertain political climate could adversely affect our clients’ financial conditions and the levels of business activity of our clients and the industries we serve. This may reduce demand for our services or depress pricing of those services and have a material adverse effect on our results of operations. Changes in global economic conditions could also shift demand to services for which we do not have competitive advantages, and this could negatively affect the amount of business that we are able to obtain. In addition, these economic conditions may cause our clients to delay payments for services we have provided to them, resulting in a negative impact to our cash flow. If we are unable to successfully anticipate changing economic and political conditions, then we may be unable to effectively plan for and respond to those changes, and our business could be negatively affected.
We rely heavily on our senior management team for the success of our business.
Given the highly specialized nature of our services, senior management must have a thorough understanding of our service offerings as well as the skills and experience necessary to manage the organization. If one or more members of our senior management team leaves and we cannot replace them with a suitable candidate quickly, then we could experience difficulty in managing our business properly, and this could harm our business prospects, client relationships, employee morale, and results of operations.
Our ability to recruit talented professionals and retain our existing professionals is critical to the success of our business.
We believe that our success will depend substantially on our ability to attract, train, motivate, and retain highly skilled management, strategic, technical, product development, data analysis, and other key professional employees. Our business straddles the information-technology and data analytics services industries, which are people-intensive and face shortages of qualified personnel, especially those with specialized skills or experience. We compete with other companies to recruit and hire from this limited pool, particularly in Austin, Texas, the location of our research and development team.
If we cannot hire and retain qualified personnel, or if a significant number of our current employees should leave, and we had difficulty replacing such persons, then we could potentially suffer the loss of client relationships or new business opportunities and our business could be seriously harmed. In addition, there is no guarantee that the employee and client non-solicitation and non-competition agreements we have entered into with our senior professionals would deter them from departing us for our competitors or that such agreements would be upheld and enforced by a court or other arbiter across all jurisdictions where we engage in business.
We have a limited ability to protect our intellectual property rights, which are important to our success and competitive position.
Our ability to protect our software, methodologies, and other intellectual property is important to our success and our competitive position. We view as proprietary the software (including source code), algorithms, analysis, and other ideas, concepts, and developments that we create in order to provide, improve, and enhance our service offerings, as well as the work product we create in the course of providing services for clients. We seek to protect our intellectual property rights in these developments and work product by applying for patents, copyrights, and trademarks, as appropriate, as well as by enforcing applicable trade secret laws and contractual restrictions on scope of use, disclosure, copying, reverse engineering, and assignment.
7
Table of Contents
Despite our efforts to protect our intellectual property rights from unauthorized use or disclosure, others may attempt to disclose, obtain, or use our rights. The steps we take may not be adequate to prevent or deter infringement or other misappropriation of our intellectual property rights. In addition, we may not detect unauthorized use of, or take timely and effective actions to enforce and protect, our intellectual property rights.
We may be required to obtain licenses from others to refine, develop, market, and deliver current and new services and solutions. There can be no assurance that we will be able to obtain any of these licenses on commercially reasonable terms or at all, or that rights granted by these licenses ultimately will be valid and enforceable.
Others could claim that our services, products, or solutions infringe upon their intellectual property rights or violate contractual protections.
We or our clients may be subject to claims that our services, products, or solutions, or the products of our software providers or other alliance partners, infringe upon the intellectual property rights of others. Any such infringement claims may result in substantial costs, divert management attention and other resources, harm our reputation, and prevent us from offering some services, products, or solutions. A successful infringement claim against us could materially and adversely affect our business.
In our contracts, we agree to indemnify our clients for expenses and liabilities resulting from claimed infringement by our services, products, or solutions, in most cases excluding third-party components, of the intellectual property rights of others. In some instances, the amount of these indemnity obligations may be greater than the revenue we receive from the client under the applicable contract. In addition, we may develop work product in connection with specific projects for our clients. We often assign to clients the copyright and, at times, other intellectual property rights, in and to some aspects of the software, documentation, or other work product developed for these clients in connection with these projects. Although our contracts with our clients generally provide that we also retain rights to our intellectual property, it is possible that clients may assert rights to, and seek to limit our ability to resell or reuse, this intellectual property.
Increasing government regulation could cause us to lose clients or impair our business.
We are subject not only to laws and regulations applicable to businesses generally, but we are also subject to certain United States and foreign laws and regulations applicable to our service offerings, including, but not limited to, those related to data privacy and security, electronic commerce, and call recording. Laws and regulations recently enacted in the United States, both at the state and federal level, have imposed significant new requirements relating to the privacy and security of personal data, as well as the reporting of breaches with respect to personal data. Legislation that may be enacted in the future may add further requirements in these and other areas. In addition, we may be affected indirectly by legislation to the extent that it impacts our existing and prospective clients; for example, our clients in the health care industry are impacted by the continuing uncertainty surrounding the implementation of the 2010 health care reform laws. Any such laws and regulations therefore could affect our existing business relationships or prevent us from obtaining new clients.
It may be difficult for us to access debt or equity markets to meet our financial needs.
In the event, for any reason, we need to raise additional funds in the future, through public or private debt or equity financings, such funds may not be available or may not be available on terms favorable to us.
| Item 1B. | Unresolved Staff Comments. |
Not applicable.
| Item 2. | Properties. |
Our principal physical properties employed in our business consist of our leased office facilities in Chicago, Illinois; Edina, Minnesota; and Austin, Texas. Our executive offices are located at 200 South Wacker Drive, Suite 820, Chicago, Illinois 60606.
Our total employable space is approximately 33,000 square feet. We do not own any real estate and believe that our leased facilities are appropriate for our current business requirements.
| Item 3. | Legal Proceedings. |
On December 19, 2011, we entered into a Purchase and Settlement Agreement (the “Settlement Agreement”) with various affiliates of Technology Crossover Ventures (“TCV”) to settle previously disclosed arbitration. The arbitration related to TCV’s rights as a holder of the Company’s 7% Series B Convertible Preferred Stock, par value $0.01 per share (“Series B Stock”). Under the terms of the Settlement Agreement, we repurchased, as of December 20, 2011, all of the 1,872,805 shares of Series B Stock held by TCV for $8.60 per share plus accrued and unpaid dividends.
In addition, the Company, from time to time, has been subject to legal claims arising in connection with its business. While the results of these claims cannot be predicted with certainty, there are no asserted claims against the Company that, in the opinion of management, if adversely decided, would have a material effect on the Company’s financial position, results of operations, or cash flows.
8
Table of Contents
| Item 4. | Mine Safety Disclosures |
| Item 5. | Market for Registrant’s Common Equity, Related Stockholder Matters, and Issuer Purchases of Equity Securities. |
Our Common Stock, par value $0.01 per share (“Common Stock”), is traded on the NASDAQ Global Market under the symbol MATR. The following table sets forth, for the periods indicated, the quarterly high and low sales prices of our Common Stock on the NASDAQ Global Market.
| High | Low | |||||||
| Fiscal Year 2011 |
||||||||
| Fourth Quarter |
$ | 5.17 | $ | 4.08 | ||||
| Third Quarter |
8.14 | 3.99 | ||||||
| Second Quarter |
7.95 | 5.27 | ||||||
| First Quarter |
7.95 | 6.00 | ||||||
| Fiscal Year 2010 |
||||||||
| Fourth Quarter |
$ | 7.50 | $ | 6.02 | ||||
| Third Quarter |
6.90 | 5.25 | ||||||
| Second Quarter |
7.61 | 5.14 | ||||||
| First Quarter |
7.28 | 4.90 | ||||||
There were approximately 98 owners of record of Common Stock as of March 9, 2012. The last reported sale price of the Common Stock on the NASDAQ Global Market on March 9, 2012 was $5.80.
See “Security Ownership of Certain Beneficial Owners and Management and Related Stockholder Matters” included in Part III Item 12 of this Form 10-K for more information about securities authorized for issuance under our various compensation plans.
Sale of Unregistered Securities
On December 19, 2011, the Company entered into a Purchase Agreement (the “Purchase Agreement”) with IGC Fund VI, LP (the “IGC Fund”). Under the terms of the Purchase Agreement, on December 20, 2011, IGC Fund purchased 1,252,609, shares of Common Stock, at a price of $4.79 per share (the “Shares”). The aggregate consideration received from the sale of the Shares was approximately $6.0 million. No commissions were paid in connection with the sale of the Shares. The Shares were sold without registration under the Securities Act of 1933, as amended (the “Securities Act”), or state securities laws, in reliance on Rule 506 of the Securities Act and in reliance on similar exemptions under applicable state laws. IGC Fund is an accredited investor within the meaning of Rule 501(a) of Regulation D and the securities were sold without any general solicitation by the Company or its representatives. Also on December 19, 2011, the Company entered into a Registration Rights Agreement with IGC Fund pursuant to the terms of which the Company has agreed to file a registration statement on Form S-3 with the SEC within 90 days following the closing of the sale of Shares to IGC Fund to enable the resale of the Shares.
Stock Performance Graph
The following graph compares the cumulative total stockholder return on Common Stock with the cumulative total return of (i) a peer group of other publicly-traded information-technology consulting companies selected by the Company (the “Peer Group Index”), and (ii) the NASDAQ Global Market Index. Cumulative total stockholder return is based on the period from December 29, 2006 through the Company’s fiscal year end on Saturday, December 31, 2011. The comparison assumes that $100 was invested on December 29, 2006 in each of Mattersight Common Stock, the Peer Group Index, the NASDAQ Global Market Index, and the Previous Peer Group Index, and that any and all dividends were reinvested.
Comparative Cumulative Total Return
For Mattersight Corporation,
Peer Group Index, NASDAQ Global Market Index and Previous Peer Group Index
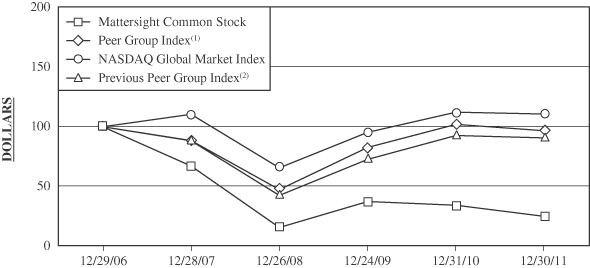
| 12/29/06 | 12/28/07 | 12/26/08 | 12/24/09 | 12/31/10 | 12/30/11 | |||||||||||||||||||
| Mattersight Common Stock |
$ | 100.00 | $ | 67.09 | $ | 15.47 | $ | 37.33 | $ | 34.13 | $ | 24.80 | ||||||||||||
| Peer Group Index(1) |
100.00 | 88.30 | 47.28 | 82.61 | 102.05 | 96.55 | ||||||||||||||||||
| NASDAQ Global Market Index |
100.00 | 110.38 | 65.58 | 95.27 | 112.22 | 110.58 | ||||||||||||||||||
| Previous Peer Group Index(2) |
100.00 | 88.25 | 42.48 | 72.72 | 92.53 | 90.51 | ||||||||||||||||||
| (1) | The Peer Group Index consists of Verint Systems, Inc. and Nice Systems Limited. In fiscal year 2011, The Hackett Group, Sapient Corporation, Ciber, Inc., and Convergys Corporation were removed because they had previously been included in the Peer Group Index in order to provide peer comparison for our ICS Business Unit, which was divested. In fiscal year 2010, Nice Systems Limited was added to the Peer Group Index to replace Diamond Management & Technology Consultants, which was removed because its public information was no longer available. |
9
Table of Contents
| (2) | The previous peer group in fiscal year 2010 consisted of The Hackett Group, Sapient Corporation, Convergys Corporation, Verint Systems, Inc., Ciber, Inc., and Nice Systems Limited. |
Repurchase of Equity Securities
The following table provides information relating to the Company’s purchase of shares of its Common Stock in the fourth quarter of 2011. All of these purchases reflect shares withheld upon vesting of restricted stock or installment stock to satisfy tax-withholding obligations.
| Period |
Total Number of Shares Purchased |
Average Price Paid Per Share |
||||||
| October 3, 2011 – October 31, 2011 |
— | $ | — | |||||
| November 1, 2011 – November 30, 2011 |
— | $ | — | |||||
| December 1, 2011 – December 31, 2011 |
57,334 | $ | 5.71 | |||||
|
|
|
|||||||
| Total |
57,334 | $ | 5.71 | |||||
|
|
|
|||||||
Dividends
Historically, we have not paid cash dividends on our Common Stock, and we do not expect to do so in the future. During fiscal year 2011, the Company purchased 1,872,805 shares of Series B and paid accrued and unpaid dividends of $0.3 million under the terms of the Settlement Agreement entered into by Mattersight and TCV to settle the arbitration relating to the parties’ dispute regarding whether the sale of the ICS Business Unit triggered immediate payment of the liquidation preference under the Certificate of Designations for the Series B Stock. As a result of such purchase from TCV, there are currently 1,670,696 shares of Series B Stock issued and outstanding, upon which any future dividends will be paid, if declared by the Board of Directors.
The Series B Stock accrues dividends at the rate of 7% per year payable semi-annually in January and July if declared by the Board of Directors. On July 1, 2011, the Company’s Board of Directors declared a cash dividend of $1.9 million or $0.1785 per share on the Series B Stock, for the dividend periods January 1, 2011 through June 30, 2011, July 1, 2010 through December 31, 2010, and July 1, 2008 through December 31, 2008. During fiscal year 2010, the Company paid cash dividends of $1.3 million for the payments dates January 4, 2010 and July 1, 2010. Under the terms of the Series B Stock certificate of designations, unpaid dividends are cumulative and accrue at the rate of 7% per annum. Payment of future dividends on the Series B Stock will be determined by the Company’s Board of Directors based on the Company’s outlook and macro-economic conditions. If the Company’s Board of Directors were to declare a semi-annual cash dividend on the Series B Stock for dividend periods subsequent to January 1, 2012, the dividend payment would be approximately $0.3 million, on the 1,670,696 shares of Series B Stock currently issued and outstanding. The amount of each dividend accrual would decrease by any conversions of the Series B Stock into Common Stock, as Series B Stock conversions require us to pay accrued but unpaid dividends at the time of conversion. Conversions of Series B Stock became permissible at the option of the holder after June 19, 2002. For further discussion see Part II, Item 7, “Liquidity and Capital Resources”.
| Item 6. | Selected Financial Data. |
The following tables summarize our selected financial data. This information should be read in conjunction with Management’s Discussion and Analysis of Financial Condition and Results of Operations, and the Consolidated Financial Statements of the Company and notes thereto, which are included elsewhere in this Form 10-K.
| (In thousands, except per share data)(1) | ||||||||||||||||||||
| December 31, 2011 |
January 1, 2011 |
December 26, 2009 |
December 27, 2008 |
December
29, 2007(2) |
||||||||||||||||
| Total revenue |
$ | 29,095 | $ | 30,885 | $ | 32,563 | $ | 37,483 | $ | 102,105 | ||||||||||
| Loss from continuing operations |
$ | (10,560 | ) | $ | (16,304 | ) | $ | (15,354 | ) | $ | (25,733 | ) | $ | (18,738 | ) | |||||
| Basic loss from continuing operations per share |
$ | (0.74 | ) | $ | (1.19 | ) | $ | (1.16 | ) | $ | (2.48 | ) | $ | (2.23 | ) | |||||
| Total assets |
$ | 49,265 | $ | 66,192 | $ | 70,603 | $ | 64,223 | $ | 60,051 | ||||||||||
| Long-term obligations |
$ | 4,437 | $ | 6,247 | $ | 5,368 | $ | 6,117 | $ | 9,041 | ||||||||||
| Redeemable preferred stock |
$ | 8,521 | $ | 18,100 | $ | 18,442 | $ | 18,460 | $ | 19,100 | ||||||||||
| Capital leases |
$ | 2,823 | $ | 2,217 | $ | 2,410 | $ | 2,975 | $ | 1,491 | ||||||||||
| (1) | See Note One “Description of Business” and Note Two “Summary of Significant Accounting Principles” of the “Notes to Consolidated Financial Statements” included in Part II Item 8 of this Form 10-K for business discussion. |
10
Table of Contents
| (2) | The December 29, 2007 data is not adjusted for discontinued operations because it would be impractical to determine this information. |
| Item 7. | Management’s Discussion and Analysis of Financial Condition and Results of Operations. |
Critical Accounting Policies and Estimates
Our management’s discussion and analysis of financial condition and results of operations is based upon our consolidated financial statements, which have been prepared in accordance with accounting principles generally accepted in the United States (“GAAP”). The preparation of these financial statements requires us to make estimates and judgments that affect the reported amounts of assets, liabilities, revenue, and expenses, and related disclosure of contingent assets and liabilities. On an ongoing basis, we evaluate our estimates, including those related to the costs and timing of completion of client projects, our ability to collect accounts receivable, the timing and amounts of expected payments associated with cost reduction activities, and the ability to realize our net deferred tax assets, contingencies, and litigation. We base our estimates on historical experience and on various other assumptions that we believe to be reasonable under the circumstances. Actual results may differ from these estimates under different assumptions or conditions.
The fiscal year-end dates referenced herein for fiscal years 2011, 2010, and 2009 are December 31, 2011, January 1, 2011, and December 26, 2009, respectively.
We believe the following critical accounting policies affect the more significant judgments and estimates used in the preparation of our consolidated financial statements.
Discontinued Operations
ICS Business Unit Transaction
The sale by the Company of the ICS Business Unit and “eLoyalty” registered trademark / trade name to Magellan Acquisition Sub, LLC, a Colorado limited liability company and wholly-owned subsidiary of TeleTech Holdings, Inc., a Delaware corporation, closed on May 28, 2011, and the Company changed its name from eLoyalty Corporation to Mattersight Corporation effective May 31, 2011. Therefore, the results of operations of the ICS Business Unit are reported as discontinued operations for all periods presented. Additionally, certain corporate and general costs that had historically been allocated to the ICS Business Unit were reallocated to the Company and are reflected in all periods presented.
Revenue Recognition
Continuing Operations
Behavioral Analytics Revenue
Behavioral Analytics revenue consists of Managed services revenue and Consulting services revenue.
Managed services revenue consists of planning, deployment, training, and subscription fees derived from Behavioral Analytics contracts. Planning, deployment, and training fees, which are considered to be installation fees related to long-term subscription contracts, are deferred until the installation is complete and are then recognized over the term of the applicable subscription contract. The terms of these subscription contracts generally range from three to five years. Installation costs incurred are deferred up to an amount not to exceed the amount of deferred installation revenue and additional amounts that are recoverable based on the contractual arrangement. These costs are included in Prepaid expenses and Other long-term assets. Such costs are amortized over the term of the subscription contract. Costs in excess of the foregoing revenue amount are expensed in the period incurred.
The amount of revenue generated from subscription fees is based on a number of factors, such as the number of agents accessing the Behavioral Analytics System and/or the number of hours of calls analyzed during the relevant month of the term of the subscription contract. This revenue is recognized as the service is performed for the client.
Consulting services revenue primarily consists of fees charged to the Company’s clients to provide post-deployment follow-on consulting services, which include custom data analysis, the implementation of enhancements, and training. These follow-on consulting services are generally performed for the Company’s clients on a fixed-fee basis. Revenue is recognized as the services are performed, with performance generally assessed on the ratio of actual hours incurred to date compared to the total estimated hours over the entire term of the contract.
11
Table of Contents
Other Revenue
Other revenue consists of Marketing Managed Services revenue and CRM Services revenue.
Marketing Managed Services revenue is derived from marketing application hosting. This revenue is generally in the form of fixed monthly fees received from the Company’s clients and is recognized as the services are performed for each client. Any related setup fee would be recognized over the contract period of the hosting arrangement.
CRM Services revenue consists of fees generated from the Company’s operational consulting services, which are provided to the Company’s clients on a time-and-materials or fixed-fee basis. The Company recognizes revenue as the services are performed for time-and-materials projects. For fixed-fee projects, revenue is recognized based on the ratio of hours incurred to date compared to the total estimated hours over the entire term of the contract.
Reimbursed expenses revenue includes billable costs related to travel and other out-of-pocket expenses incurred while performing services for our clients. The cost of third-party product and support may be included within this category if the transaction does not satisfy the requirements for gross reporting. An equivalent amount of reimbursable expenses is included in Cost of revenue.
Payments received for Managed services contracts in excess of the amount of revenue recognized for these contracts are recorded as unearned revenue until revenue recognition criteria are met.
If the Company’s estimates indicate that a contract loss will occur, then a loss provision is recorded in the period in which the loss first becomes probable and can be reasonably estimated.
The Company maintains allowances for doubtful accounts for estimated losses resulting from clients not paying for unpaid or disputed invoices for contractual services provided. Additional allowances may be required if the financial condition of our clients deteriorates.
Discontinued Operations
ICS Business Unit
Managed services revenue included in the ICS Business Unit consisted of fees generated from the Company’s contact center support and monitoring services. Support and monitoring services generally were contracted for a fixed fee, and the revenue was recognized ratably over the term of the contract. Support fees that were contracted on a time-and-materials basis were recognized as the services were performed for the client.
For fixed fee Managed services contracts, where the Company provided support for third-party software and hardware, revenue was recorded at the gross amount of the sale. If the contract did not meet the requirements for gross reporting, then Managed services revenue was recorded at the net amount of the sale.
Consulting services revenue included in the ICS Business Unit consisted of the modeling, planning, configuring, or integrating of an Internet Protocol network solution within the Company’s clients’ contact center environments. These services were provided to clients on a time-and-materials or fixed-fee basis. For the integration of a system, the Company recognized revenue as the services were performed, with performance generally assessed on the ratio of hours incurred to date compared to the total estimated hours over the entire term of the contract. For all other consulting services, the Company recognized revenue as the services were performed for the client.
Revenue from the sale of Product, which was generated primarily from the resale of third-party software and hardware by the Company, was generally recorded at the gross amount of the sale when it was delivered to the client.
In October 2009, the Financial Accounting Standards Board (“FASB”) amended the accounting standards for revenue recognition to remove tangible products containing software components and non-software components that function together to deliver the product’s essential functionality from the scope of industry-specific software revenue recognition guidance. In October 2009, the FASB also amended the accounting standards for multiple deliverable revenue arrangements to:
| (i) | provide updated guidance on whether multiple deliverables exist, how the deliverables in an arrangement should be separated, and how the consideration should be allocated; |
| (ii) | require an entity to allocate revenue in an arrangement using estimated selling prices (“ESP”) of deliverables if a vendor does not have vendor-specific objective evidence of selling price (“VSOE”) or third-party evidence of selling price (“TPE”); and |
| (iii) | eliminate the use of the residual method and require an entity to allocate revenue using the relative selling price method. |
12
Table of Contents
The Company elected to adopt this accounting guidance at the beginning of its first quarter of fiscal 2011 on a prospective basis. The adoption of this guidance does not impact our revenue recognition with respect to Behavioral Analytics because the implementation services sold with our hosting service are not separated into multiple accounting units because there is no standalone fair value for these services. We recognize these services revenues over the anticipated term of the hosting services, currently the contract term. This accounting guidance does not change the units of accounting for the Company’s revenue transactions or the methods used to allocate consideration to the units of accounting. The revenue recognition for each of these offerings is discussed below.
For the ICS Business Unit, the Company utilized VSOE to allocate revenue to various elements in an arrangement. We determined VSOE based on our normal pricing and discounting practices for the product or service when sold separately. In determining VSOE, we required that a substantial majority of the selling prices for a product or consulting services fall within a reasonably narrow pricing range, generally evidenced by approximately 80% of such historical standalone transactions falling within plus or minus 20% of the median selling price. For the ICS Business Unit’s managed services, we established VSOE through the stated renewal approach. Previously, we were able to establish VSOE for our product and service offerings except for software. If we were not able to establish VSOE for an offering, we attempted to establish fair value by utilizing TPE. TPE is established by obtaining evidence from comparable offerings from a peer company. If the Company was unable to establish fair value using VSOE or TPE, then the Company used ESP in its allocation of revenue. To determine ESP, we applied significant judgment as we weighed a variety of factors, based on the facts and circumstances of the arrangement. These factors included internal costs, gross margin objectives, and existing portfolio pricing and discounting.
Within discontinued operations, some of our sales arrangements had multiple deliverables containing software and related software components. Such sale arrangements were subject to the accounting guidance in ASC 985-605, Software Revenue Recognition.
Stock-Based Compensation
Stock-based compensation cost is measured at the grant date based on the fair value of the award and is recognized as expense over the vesting period. Determining fair value of stock-based awards at the grant date requires certain assumptions. The Company uses historical information as the primary basis for the selection of expected life, expected volatility, expected dividend yield assumptions, and anticipated forfeiture rates. The risk-free interest rate is selected based on the yields from U.S. Treasury Strips with a remaining term equal to the expected term of the options being valued.
Goodwill
In the fourth quarter of 2011, we early adopted ASU No. 2011-08, Intangibles—Goodwill and Other (Topic 350) – Testing Goodwill for Impairment, which allows an entity to use a qualitative approach to test goodwill for impairment. As a result, in performing our annual impairment test, we first perform a qualitative assessment to determine whether it is more-likely-than-not that the fair value of a reporting unit is less than its carrying value, including goodwill. If it is concluded that this is the case, we perform a detailed quantitative assessment. Our annual impairment test of goodwill is performed in the fourth quarter of each year. In 2011, after completing our annual qualitative review, we concluded that it was not more likely than not that the carrying value of any of our reporting units exceeded its fair value. Accordingly, we concluded that further quantitative analysis and testing was not required, and no goodwill impairment charge was required.
There has been no impairment identified as a result of the annual review of goodwill as of December 31, 2011 and January 1, 2011. The carrying value of goodwill was $1.0 million as of December 31, 2011 and January 1, 2011.
Intangible Assets
Intangible assets reflect costs related to patent and trademark applications, Marketing Managed Services customer relationships acquired in 2004, and the 2003 purchase of a license for certain intellectual property. Patent and trademark applications are amortized over 120 months. The other intangible assets are fully amortized. The original cost of intangible assets as of December 31, 2011 and January 1, 2011 was $2.8 million and $2.7 million, respectively. Accumulated amortization of intangible assets as of December 31, 2011 and January 1, 2011 was $2.6 million and $2.4 million, respectively. Currently, amortization expense of intangible assets is expected to be $40 thousand annually.
Severance and Related Costs
We recorded accruals for severance and related costs associated with our cost-reduction efforts undertaken during fiscal years 2007 through 2011. The portion of the accruals relating to employee severance represents contractual severance for identified employees and generally is not subject to a significant revision. The portion of the accruals that related to office space reductions, office closures, and associated contractual lease obligations are based in part on assumptions and estimates of the timing and amount of sublease rentals, which may be affected by overall economic and local market conditions. To the extent estimates of the success of our sublease efforts changed, adjustments increasing or decreasing the related accruals have been recognized.
13
Table of Contents
Income Taxes
We have recorded income tax valuation allowances on our net deferred tax assets to account for the unpredictability surrounding the timing of realization of our U.S. and non-U.S. net deferred tax assets due to uncertain economic conditions. The valuation allowances may be reversed at a point in time when management determines realization of these tax assets has become more likely than not, based on a return to predictable levels of profitability.
The Company uses an asset and liability approach for financial accounting and reporting of income taxes. Deferred income taxes are provided when tax laws and financial accounting standards differ with respect to the amount of income for the year, the basis of assets and liabilities and for tax loss carryforwards. The Company does not provide U.S. deferred income taxes on earnings of U.S. or foreign subsidiaries, which are expected to be indefinitely reinvested.
The Company may recognize the tax benefit from an uncertain tax position only if it is more likely than not that the tax position will be sustained on examination by the taxing authorities, based on the technical merits of the position. The tax benefits recognized in the financial statements from such a position should be measured based on the largest benefit that has a greater than 50% likelihood of being realized upon ultimate settlement. Significant judgment is used to determine the likelihood of the benefit. There is additional guidance on derecognition, classification, interest and penalties on income taxes, accounting in interim periods, and disclosure requirements.
Intraperiod tax allocation requires that the provision for income taxes be allocated between continuing operations and other categories of earnings (such as discontinued operations or other comprehensive income) for each tax jurisdiction. In periods in which there is a year-to-date pre-tax loss from continuing operations and pre-tax income in other categories of earnings, the tax provision is first allocated to the other categories of earnings. A related tax benefit is then recorded in continuing operations. While intraperiod tax allocation in general does not change the overall tax provision, it may result in a gross-up of the individual components, thereby changing the amount of tax provision included in each category. Included in our continuing operations income tax provision is a tax benefit of $5.9 million for the year ended December 31, 2011 and $1.7 million for the year ended January 1, 2011. Included in our discontinued operations income tax provision is tax expense of $6.8 million for the year ended December 31, 2011 and $1.8 million for the year ended January 1, 2011.
Other Significant Accounting Policies
For a description of the Company’s other significant accounting policies, see Note Two “Summary of Significant Accounting Policies” of the “Notes to Consolidated Financial Statements” included in Part II Item 8 of this Form 10-K.
Forward-Looking Statements
Statements in this Form 10-K that are not historical facts are “forward-looking statements” that are made pursuant to the safe harbor provisions of Section 27A of the Securities Act of 1933, as amended (the “Securities Act”), and Section 21E of the Securities Exchange Act of 1934, as amended (the “Exchange Act”). These forward-looking statements, which may be identified by use of words such as “plan,” “may,” “might,” “believe,” “expect,” “intend,” “could,” “would,” “should,” and other words and terms of similar meaning, in connection with any discussion of our prospects, financial statements, business, financial condition, revenues, results of operations, or liquidity, involve risks and uncertainties that could cause actual results to differ materially from those described in the forward-looking statements. In addition to other factors and matters contained or incorporated in this document, important factors that could cause actual results or events to differ materially from those indicated by such forward-looking statements include, without limitation, those noted under “Risk Factors” included in Part I Item 1A of this Form 10-K for the year ended December 31, 2011, as well as the following:
| • | Changes by the FASB or the SEC of authoritative accounting principles generally accepted in the United States or policies or changes in the application or interpretation of those rules or regulations; |
| • | Acts of war or terrorism, including, but not limited to, actions taken or to be taken by the United States and other governments as a result of acts or threats of terrorism, and the impact of these acts on economic, financial, and social conditions in the countries where we operate; and |
| • | The timing and occurrence (or non-occurrence) of transactions and events which may be subject to circumstances beyond our control. |
We cannot guarantee any future results, levels of activity, performance, or achievements. The statements made in this Form 10-K represent our views as of the date of this Form 10-K, and it should not be assumed that the statements made in this Form 10-K remain accurate as of any future date. Moreover, we assume no obligation to update forward-looking statements, except as may be required by law.
14
Table of Contents
Business Outlook
Based upon Mattersight’s business development efforts and third-party market research, we believe there has been a fundamental shift in the way large enterprises view data. The trends suggest that large enterprises today appreciate that there is value in data that can be derived from their front and back offices, but they have not yet established efficient and effective methods to capture, analyze, and create value from this data. We seek to help large enterprises capitalize on this data with our Behavioral Analytics solutions and, as the leader in this rapidly growing market, we believe we are uniquely positioned to capitalize on this opportunity. We estimate the market potential in the United States for all of our current analytics offerings at over $10 billion per year. The market for enterprise analytics is very new and we currently estimate it to be less than 5% penetrated.
Our business strategy to increase revenue, profitability, and capture market share includes the following elements:
| • | Increase up-sell and cross-sell ratios by deepening and broadening our relationships with existing clients; |
| • | Win business with new clients, focusing on analyzing customer interactions and back office activities in targeted industries; |
| • | Continue to invest in innovative proprietary technology, new applications, and delivery methods; |
| • | Continue bookings growth and improve operating leverage; |
| • | Expand our sales and marketing efforts with seasoned enterprise sales agents and strategic marketing professionals; and |
| • | Develop partnerships and strategic alliances to expand sales leverage, improve brand awareness, and reach new industries while providing value to our mutual clients. |
Resulting from our delivery of measurable economic benefit to our clients, we have seen increasing penetration within existing accounts, due to an increase in adoption of our base Behavioral Analytics offerings across separate and distinct business units, as well as the adoption of new applications within existing business units. For this reason, we will continue to focus on further penetrating what we estimate to be a large existing base market with a less expensive cost of acquisition. In addition, our strategy to further invest in sales and marketing, coinciding with the fundamental shift in enterprise data utilization described above, has led to an increasing number of discussions with potential new clients and strategic partners.
Managed Services Backlog
As a result of the strategic and long-term nature of Managed services revenue, we believe it is appropriate to monitor the level of backlog associated with our Managed services agreements. The Behavioral Analytics Managed services backlog was $96.3 million as of December 31, 2011 and $84.5 million as of January 1, 2011. This increase in backlog is due to the value of the Managed services contracts signed in fiscal year 2011 exceeding the amount of Managed services revenue in fiscal year 2011. We expect Behavioral Analytics Managed service backlog to increase in fiscal year 2012 based on the impact of anticipated renewals of existing agreements and anticipated contract signings with clients included in our current sales pipeline.
The Company uses the term “backlog” to reflect the estimated future amount of Managed services revenue related to its Managed services contracts. The value of these contracts is based on anticipated usage volumes over the anticipated term of the agreement. The anticipated term of the agreement is based on the contractually agreed fixed term of the contract, plus agreed upon, but optional extension periods. Actual volumes may be greater or less than anticipated. In addition, actual agreement terms may vary from the anticipated terms because these contracts typically are cancellable without cause based on the customer making a substantial early termination payment or forfeiture of prepaid contract amounts. The reported Behavioral Analytics Managed service backlog is expected to be recognized as follows: $34.2 million in 2012; $28.2 million in 2013; $17.8 million in 2014; and $16.1 million in 2015 and thereafter.
Year Ended December 31, 2011 Compared with the Year Ended January 1, 2011
Services Revenue
Services revenue is total revenue excluding reimbursable expenses that are billed to our clients. Our services revenue decreased 5% to $28.8 million in fiscal year 2011 from $30.3 million in fiscal year 2010.
Behavioral Analytics revenue was $27.3 million in fiscal year 2011 and was $25.2 million in fiscal year 2010. Behavioral Analytics revenue increased $2.1 million in fiscal year 2011 due to increased subscription fees associated with the conversion of several deployments to the subscription phase of the agreement.
Other revenue decreased by $3.5 million in fiscal year 2011 to $1.5 million, from $5.0 million in fiscal year 2010, a decrease of 70%. The decrease in revenue was mainly due to the completion of several contracts for Marketing Managed Services and CRM Services performed for clients in fiscal year 2010 and lower demand for CRM Services from existing clients who utilize these services.
The Company’s top five clients accounted for 70% of total revenue in fiscal years 2011 and 2010. The top 10 clients accounted for 90% of total revenue in fiscal year 2011, compared to 86% in fiscal year 2010. In fiscal years 2011 and 2010, there were three and four clients, respectively, that accounted for 10% or more of total revenue. In fiscal year 2011, Vangent, Inc., Allstate Insurance Company, and Health Care Service Corporation accounted for 22%, 15%, and 14% of total revenue, respectively. In fiscal year 2010, Vangent, Inc., United HealthCare Services, Inc., Health Care Service Corporation, and Allstate Insurance Company accounted for 20%, 15%, 14%, and 13% of total revenue, respectively. Higher concentration of revenue with a single client or a limited group of clients creates increased revenue risk if one of these clients significantly reduces its demand for our services.
15
Table of Contents
Cost of Revenue Before Reimbursed Expenses, Exclusive of Depreciation and Amortization
Cost of Services
Cost of services primarily consists of labor costs, including salaries, fringe benefits, and incentive compensation, royalties, and other customer related third-party outside services. Cost of services excludes depreciation and amortization.
Cost of Behavioral Analytics revenue in fiscal year 2011 was $12.2 million, or 45% of Behavioral Analytics revenue, compared to $12.0 million, or 48% of Behavioral Analytics revenue, in fiscal year 2010. The increase in cost was primarily due to increased data center expenses of $0.2 million. The percentage decrease in the Cost of Behavioral Analytics revenue was primarily due to improved leverage of our cost structure resulting from higher revenue in fiscal year 2011 compared to fiscal year 2010.
Cost of Other revenue in fiscal year 2011 was $1.0 million, or 67% of Other revenue, compared to $3.5 million, or 70% of Other revenue, in fiscal year 2010. The decrease in cost was largely due to lower compensation expense of $2.4 million, driven by the lower demand for our CRM services.
Sales, Marketing and Development
Sales, marketing and development expenses consist primarily of salaries, incentive compensation, commissions, and employee benefits for business development, account management, marketing, and product development personnel. The personnel costs included here are net of any labor costs directly related to the generation of revenue, which are represented in Cost of services.
Sales, marketing and development expenses increased $1.4 million, or 8%, to $20.0 million in fiscal year 2011 from $18.6 million in fiscal year 2010. This increase is due to the investment in our sales organization. During 2011, we added 8 account executives to increase the total number of account executives to 17.
General and Administrative
General and administrative expenses consist primarily of salaries, incentive compensation, and employee benefits for administrative personnel, as well as facilities costs, a provision for uncollectible amounts, and costs for our corporate technology infrastructure and applications.
General and administrative expenses decreased $1.0 million, or 10%, to $9.1 million in fiscal year 2011 from $10.1 million in fiscal year 2010. This decrease is due to lower compensation expense of $0.9 million, primarily due to the 30% reduction in our administrative staff as a result of the sale of the ICS Business Unit.
Severance and Related Costs
In 2011 and 2010, a number of cost reduction activities were undertaken, principally consisting of personnel reductions and an office consolidation. Cash savings related to cost reduction actions for fiscal year 2011 are anticipated to be $0.1 million annually. The cost reduction actions taken in fiscal year 2010 resulted in annual cash savings of $2.8 million. Costs related to office space reductions and office closures were paid pursuant to contractual lease terms through January 2012.
Severance and related costs were $0.3 million of income in fiscal year 2011 and $0.5 million of expense in fiscal year 2010. In fiscal year 2011, the $0.3 million of income for continuing operations was related to the favorable renegotiation of an office lease, partially offset by severance and related costs for the elimination of one position and an office consolidation. In fiscal year 2010, the Company recorded $0.5 million of expense, primarily related to the elimination of 26 positions and an adjustment to sublease recoveries.
Depreciation
Depreciation decreased $0.1 million, or 3%, to $3.2 million in fiscal year 2011 compared to $3.3 million in fiscal year 2010. The decrease in depreciation is primarily related to assets becoming fully amortized.
Amortization of Intangibles
Amortization of intangibles increased $0.1 million, or 100%, to $0.2 million in fiscal year 2011 compared to $0.1 million in fiscal year 2010. The increase in amortization is primarily related to a $0.1 million charge to write off patent applications that the Company has determined it no longer wishes to pursue.
Operating Loss
Primarily as a result of the factors described above, we experienced an operating loss of $16.6 million for fiscal year 2011, compared to an operating loss of $17.9 million for fiscal year 2010.
16
Table of Contents
Interest and Other Income (Expense), Net
Non-operating interest and other income (expense) was $0.1 million of income in fiscal year 2011 and was $0.1 million of expense in fiscal year 2010. In fiscal year 2011, the $0.1 million of income was primarily related to favorable exchange rates on intercompany settlements, partially offset by interest expense on our capital lease obligation. In fiscal year 2010, the $0.1 million of expense was primarily related to interest expense for our capital lease obligations.
Income Tax Benefit
The income tax benefit was $5.9 million and $1.7 million in fiscal years 2011 and 2010, respectively. The $5.9 million tax benefit primarily related to the tax accounting treatment of the gain on the sale of the ICS Business Unit. As of December 31, 2011, total net deferred tax assets of $55.8 million were fully offset by a valuation allowance. The level of uncertainty in predicting when we will achieve profitability, sufficient to utilize our net U.S. and non-U.S. operating losses and realize our remaining deferred tax assets, requires that an income tax valuation allowance be recognized in the financial statements.
Income from Discontinued Operations
The income from discontinued operations in fiscal year 2011 was $28.9 million, net of tax of $6.8 million and the income in fiscal year 2010 was $3.0 million, net of tax of $1.8 million.
The income from discontinued operations of $28.9 million in fiscal year 2011 was due to the impact of the results of the ICS Business Unit and the transaction costs associated with the sale of the ICS Business Unit. The pretax gain from the sale of assets included in discontinued operations in fiscal year 2011 was $36.5 million. The income from discontinued operations of $3.0 million in fiscal year 2010 was due to the impact of the results of the ICS Business Unit.
Net Income (Loss) Available to Common Stockholders
We reported net income available to common stockholders of $10.6 million in fiscal year 2011 compared to a net loss available to common stockholders of $14.6 million in fiscal year 2010. In fiscal year 2011, the Company paid $6.6 million on the Series B Stock fair value over stated value. Accrued dividends to holders of our Series B Stock were $1.3 million in both fiscal years 2011 and 2010. In fiscal year 2011, there was net income of $0.74 per share on a basic and diluted basis, compared to a net loss of $1.06 per share on a basic and diluted basis in fiscal year 2010.
Year Ended January 1, 2011 Compared with the Year Ended December 26, 2009
Services Revenue
Services revenue is total revenue excluding reimbursable expenses that are billed to our clients. Our services revenue decreased 5% to $30.3 million in fiscal year 2010 from $31.8 million in fiscal year 2009.
Behavioral Analytics revenue was $25.2 million in fiscal year 2010 and was $19.6 million in fiscal year 2009. The first quarter of 2010 included the $0.7 million impact of the cancellation of a Behavioral Analytics agreement. Behavioral Analytics revenue increased $5.6 million in fiscal year 2010 due to increased subscription fees associated with the conversion of several deployments to the subscription phase of the agreement.
Other revenue decreased by $7.2 million in fiscal year 2010 to $5.0 million, from $12.2 million in fiscal year 2009, a decrease of 60%. The decrease in revenue was mainly due to the completion of several contracts for Marketing Managed Services and CRM Services performed for clients in fiscal year 2010 and lower demand for CRM Services from existing clients who utilize these services.
The Company’s top five clients accounted for 70% of total revenue in fiscal year 2010, compared to 59% in fiscal year 2009. The top 10 clients accounted for 86% of total revenue in fiscal year 2010, compared to 79% in fiscal year 2009. In fiscal year 2010, there were four clients that accounted for 10% or more of total revenue. In fiscal year 2010, Vangent, Inc., United HealthCare Services, Inc., Health Care Service Corporation, and Allstate Insurance Company accounted for 20%, 15%, 14%, and 13% of total revenue, respectively. In fiscal year 2009, Blue Shield of California, United HealthCare Services, Inc., and Health Care Service Corporation accounted for 16%, 14%, and 11% of total revenue, respectively. Higher concentration of revenue with a single client or a limited group of clients creates increased revenue risk if one of these clients significantly reduces its demand for our services.
Cost of Revenue Before Reimbursed Expenses, Exclusive of Depreciation and Amortization
Cost of Services
Cost of services primarily consists of labor costs, including salaries, fringe benefits, and incentive compensation, royalties, and other customer related third-party outside services. Cost of services excludes depreciation and amortization.
17
Table of Contents
Cost of Behavioral Analytics revenue in fiscal year 2010 was $12.0 million, or 48% of Behavioral Analytics revenue, compared to $11.9 million, or 61% of Behavioral Analytics revenue, in fiscal year 2009. The percentage decrease in the Cost of Behavioral Analytics revenue was primarily due to improved leverage of our cost structure resulting from higher revenue in fiscal year 2010 compared to fiscal year 2009.
Cost of other revenue in fiscal year 2010 was $3.5 million, or 70% of Other revenue, compared to $8.1 million, or 67% of Other revenue, in fiscal year 2009. The decrease in cost was largely due to lower compensation expense of $4.0 million and lower travel costs of $0.4 million driven by lower demand for our CRM services.
Sales, Marketing and Development
Sales, marketing and development expenses consist primarily of salaries, incentive compensation, commissions, and employee benefits for business development, account management, marketing, and product development personnel. The personnel costs included here are net of any labor costs directly related to the generation of revenue, which are represented in Cost of services.
Sales, marketing and development expenses increased $3.4 million, or 22%, to $18.6 million in fiscal year 2010 from $15.2 million in fiscal year 2009. This increase was due to higher commissions resulting from increased Behavioral Analytics revenue and the continued investment in our product development.
General and Administrative
General and administrative expenses consist primarily of salaries, incentive compensation, and employee benefits for administrative personnel, as well as facilities costs, a provision for uncollectible amounts, and costs for our corporate technology infrastructure and applications.
General and administrative expenses increased $0.3 million, or 3%, to $10.1 million in fiscal year 2010 from $9.8 million in fiscal year 2009. This increase was due to higher compensation expense of $0.7 million, partially offset by lower outside services of $0.3 million.
Severance and Related Costs
In 2010 and 2009, a number of cost reduction activities were undertaken, principally consisting of personnel reductions and an office consolidation. Cash savings related to cost reduction actions for fiscal years 2010 and 2009 resulted in annual cash savings of $2.8 million and $2.0 million, respectively. Costs related to office space reductions and office closures were paid pursuant to contractual lease terms through January 2012.
Severance and related costs were $0.5 million and $1.0 million in fiscal years 2010 and 2009, respectively. In fiscal year 2010, the $0.5 million of expense for continuing operations was related to severance and related costs for the elimination of 26 positions and an office consolidation. In fiscal year 2009, the Company recorded $1.0 million of expense, primarily related to the elimination of 19 positions and an adjustment to sublease recoveries.
Depreciation
Depreciation decreased $0.5 million, or 13%, to $3.3 million in fiscal year 2010 compared to $3.8 million in fiscal year 2009. The decrease in depreciation was primarily related to assets becoming fully amortized.
Amortization of Intangibles
Amortization of intangibles decreased $0.1 million, or 50%, to $0.1 million in fiscal year 2010 compared to $0.2 million in fiscal year 2009. The decrease in amortization was primarily due to Marketing Managed Services customer contracts becoming fully amortized.
Operating Loss
Primarily as a result of the factors described above, we experienced an operating loss of $17.9 million for fiscal year 2010, compared to an operating loss of $18.2 million for fiscal year 2009.
Interest and Other (Expense) Income, Net
Non-operating interest and other (expense) income was $0.1 million of expense in fiscal year 2010 and was $0.1 million of income in fiscal year 2009. In fiscal year 2010, the $0.1 million of expense was primarily related to interest expense for our capital lease obligations. In fiscal year 2009, the $0.1 million of income was primarily due to a gain on the sale of equity securities in a publicly-traded company for $0.3 million, partially offset by $0.2 million of interest expense for our capital lease obligations and lower average yields on our investments.
Income Tax Benefit
The income tax benefit was $1.7 million in fiscal year 2010 and was $2.8 million in fiscal year 2009. As of January 1, 2011, total net deferred tax assets of $62.7 million were fully offset by a valuation allowance. The level of uncertainty in predicting when we will achieve profitability, sufficient to utilize our net U.S. and non-U.S. operating losses and realize our remaining deferred tax assets, requires that an income tax valuation allowance be recognized in the financial statements.
18
Table of Contents
Income from Discontinued Operations
The income from discontinued operations was $3.0 million, net of tax of $1.8 million in fiscal year 2010, and was $4.7 million, net of tax of $2.9 million, in fiscal year 2009.
The income from discontinued operations of $3.0 million in fiscal year 2010 was due to the impact of the results of the ICS Business Unit. The income from discontinued operations of $4.7 million in fiscal year 2009 was due to the impact of the results of the ICS Business Unit and the sale of a subsidiary in Switzerland.
Net Loss Available to Common Stockholders
We reported a net loss available to common stockholders of $14.6 million in fiscal year 2010 compared to a net loss available to common stockholders of $11.9 million in fiscal year 2009. These losses include accrued dividends to preferred stockholders of $1.3 million in both fiscal years 2010 and 2009. The net loss was $1.06 per share on a basic and diluted basis in fiscal year 2010, compared to a net loss of $0.90 per share on a basic and diluted basis in fiscal year 2009.
Liquidity and Capital Resources
Introduction
Our principal capital requirements are to fund working capital needs, capital expenditures for Behavioral Analytics and infrastructure requirements, and other revenue generation and growth investments. As of December 31, 2011, our principal capital resources consisted of (i) our cash and cash equivalents balance of $29.4 million, which includes $0.3 million in foreign bank accounts, (ii) restricted cash of $1.5 million, and (iii) the remaining $3.5 million under the Facility, as defined below.
Our cash and cash equivalents position increased $8.5 million, or 41%, as of December 31, 2011, from $20.9 million as of January 1, 2011. Our ICS Business Unit, which was classified as discontinued operations in our consolidated financial statements, did not include any cash or cash equivalents.
The increase in cash during fiscal year 2011 was primarily due to the proceeds from the sale of the ICS Business Unit, net of transaction costs, and the purchase by IGC Fund of the Shares of Common Stock pursuant to the terms of the Purchase Agreement, which were largely offset by the Company’s repurchase from TCV of 1,872,805 shares of Series B Stock under the terms of the Settlement Agreement, the net loss before non-cash items, capital expenditures, cash dividend payments on Series B Stock, acquisition of treasury stock, capital lease principal payments, and increased working capital requirements. Restricted cash decreased by $1.0 million for fiscal year 2011 and remained constant for fiscal year 2010. The restricted cash balance was primarily used as collateral for letters of credit issued in support of future capital lease obligations. See “Bank Facility” below for a description of the contractual requirements related to restricted cash.
Cash Flows from Operating Activities
Net cash used in operating activities of continuing operations during fiscal years 2011 and 2010 was $10.5 million and $11.4 million, respectively. During fiscal year 2011, cash outflows of $10.5 million from operating activities consisted primarily of the net loss before non-cash items of $7.7 million, and an increase in prepaid costs of $2.3 million, which primarily consist of costs associated with unearned revenue.
During fiscal year 2010, cash outflows of $11.4 million from operating activities of continuing operations consisted primarily of the net loss before depreciation, amortization, stock-based compensation, and a $1.6 million decrease in unearned revenue reflecting the recognition of previously deferred revenue, partially offset by accounts receivable collections of $1.4 million.
Net cash used in operating activities of discontinued operations during fiscal year 2011 was $5.8 million. During fiscal year 2011, cash outflows of $5.8 million from discontinued operating activities consisted primarily of a $5.1 million decrease in unearned revenue reflecting the recognition of previously deferred revenue, partially offset by lower prepaid costs of $1.1 million, due primarily to the amortization of costs associated with the unearned revenue.
Net cash provided by operating activities of discontinued operations during fiscal year 2010 was $8.4 million and consisted primarily of an increase in unearned revenue of $11.8 million as a result of customer prepayments and income before non-cash items, $6.4 million, partially offset by an increase in prepaid costs of $7.3 million which primarily consist of deferred costs associated with the deployment of our Behavioral Analytics services.
Days Sales Outstanding (“DSO”) for continuing operations was 26 days at December 31, 2011 compared to 23 days at January 1, 2011, an increase of three days. This increase was primarily due to the impact of the completion of the sale of the ICS Business Unit on our customer concentration. Because a high percentage of our revenue is dependent on a relatively small number of clients, delayed payments by a few of our larger clients could result in a reduction of our available cash, which in turn may cause fluctuation in our DSO. We do not expect any significant collection issues with our clients; see “Accounts Receivable Customer Concentration” for additional information on cash collections.
19
Table of Contents
As of December 31, 2011, there remains $46 thousand of costs for an office closure for continuing operations and there were no unpaid severance and related costs for discontinued operations. See Note Four “Severance and Related Costs” of the “Notes to Consolidated Financial Statements” included in Part II Item 8 to this Form 10-K.
Cash Flows from Investing Activities
The Company used $0.8 million of cash in continuing investing activities during each of fiscal years 2011 and 2010. Capital expenditures of $0.8 million and $1.2 million were primarily used to purchase computer hardware and software during fiscal years 2011 and 2010, respectively. We currently expect capital investments to be between $4.0 million and $5.0 million for fiscal year 2012 and plan on funding approximately $3.2 million to $4.2 million of these purchases with capital leases.
Net cash provided by discontinued investing activities was $37.4 million during fiscal year 2011 and a $1.6 million use of cash during fiscal year 2010. Proceeds from sale of assets held for sale were $37.6 million during fiscal year 2011. The remaining cash usage in 2011 and 2010 is primarily due to capital expenditures for the purchase of computer hardware and software.
Cash Flows from Financing Activities
The Company used $10.6 million and $2.4 million of cash in continuing financing activities during fiscal years 2011 and 2010, respectively. Net cash outflows of $10.6 million during fiscal year 2011 were primarily attributable to: $12.5 million of cash used to repurchase 1,872,805 shares of Series B Stock under the terms of Settlement Agreement; $2.2 million for cash dividend payments on Series B Stock, which included payment of previously accrued and unpaid dividends; $1.9 million of principal payments under our capital lease obligations; and $1.0 million of cash used to acquire treasury stock, offset by proceeds of $6.0 million from the purchase by IGC Fund of the Shares pursuant to the terms of the Purchase Agreement, and a decrease in restricted cash of $1.0 million.
Net cash outflows of $2.4 million in continuing financing activities during fiscal year 2010 were primarily attributable to $1.6 million of principal payments under our capital lease obligations, $1.3 million for cash dividend payments on Series B Stock, and $1.0 million of cash used to acquire treasury stock, offset by a decrease in restricted cash of $1.3 million. The treasury stock acquired in each year reflects shares that were obtained to meet employee tax obligations associated with stock award vestings.
Net cash used in discontinued financing activities was $0.7 million and $0.3 million during fiscal years 2011 and 2010, respectively. The usage in 2011 was for $0.6 million of cash used to acquire treasury shares and in 2010 was for principal payments under our capital lease obligations.
Historically, we have not paid cash dividends on our Common Stock, and we do not expect to do so in the future. On July 1, 2011, a cash dividend of $1.9 million was paid on the Series B Stock for the dividend periods January 1, 2011 through June 30, 2011; July 1, 2010 through December 31, 2010; and July 1, 2008 through December 31, 2008. Under the terms of the Settlement Agreement, the Company paid $0.3 million to TCV, representing accrued and unpaid dividends on the Series B Stock. On January 4, 2010 and July 1, 2010, a cash dividend of $1.4 million was paid on the Series B Stock for the dividend periods July 1, 2009 through December 31, 2009 and January 1, 2010 through June 30, 2010. Under the terms of the Certificate of Designations for the Series B Stock, unpaid dividends are cumulative and accrue at the rate of 7% per annum per year, payable semi-annually in January and July. The amount of each dividend accrual will be decreased by any conversions of the Series B Stock into Common Stock, as such conversions require the Company to pay accrued but unpaid dividends at the time of conversion. Conversions of Series B Stock became permissible at the option of the holder after June 19, 2002. The Company expects to acquire between $0.5 million and $0.7 million of treasury stock during the first quarter of 2012 to meet employee tax obligations associated with the various stock-based compensation programs.
Liquidity
Our near-term capital resources consist of our current cash balance, together with anticipated future cash flows and financing from capital leases. Our balance of cash and cash equivalents was $29.4 million as of December 31, 2011. In addition, our restricted cash of $1.5 million with Bank of America (the “Bank”) at December 31, 2011 is available to support letters of credit issued under our credit facility (as described below) and collateral requirements for our capital lease agreements.
We anticipate that our current unrestricted cash resources, together with operating revenue and capital lease financing, should be sufficient to satisfy our short-term working capital and capital expenditure needs for the next twelve months. Management will continue to assess opportunities to maximize cash resources by actively managing our cost structure and closely monitoring the collection of our accounts receivable. If, however, our operating activities, capital expenditure requirements, or net cash needs differ materially from current expectations due to uncertainties surrounding the current capital market, credit and general economic conditions, competition, or the suspension or cancellation of a large project, then there is no assurance that we would have access to additional external capital resources on acceptable terms.
Bank Facility
The Company is a party to a loan agreement with the Bank, which expires on December 31, 2012. The maximum principal amount of the secured line of credit under the agreement (the “Facility”) is $5.0 million as of December 31, 2011. The Facility requires the Company to maintain a minimum cash and cash equivalent balance within a secured account at the Bank. The Facility provides that the balance in the secured account cannot be less than the outstanding balance drawn on the Facility and letter of credit obligations
20
Table of Contents
under the Facility. Available credit under the Facility has been reduced by $1.5 million due to letters of credit issued under the Facility to support our capital lease obligations. As a result, $3.5 million remains available under the Facility at December 31, 2011. Loans under the Facility bear interest at the Bank’s prime rate or, at the Company’s election, an alternate rate of LIBOR (London InterBank Offering Rate) plus 0.75%. We did not have any borrowings or interest expense under the Facility during fiscal year 2011 or 2010. See Note Eleven “Line of Credit” of the “Notes to Consolidated Financial Statements” included in Part II Item 8 of this Form 10-K.
Accounts Receivable Customer Concentration
As of December 31, 2011, three clients, United HealthCare Services, Inc., Allstate Insurance Company, CVS Caremark Corporation accounted for 25%, 22%, and 14% of total gross accounts receivable, respectively. Of these amounts, we have collected 100% from United HealthCare Services, Inc., 99% from Allstate Insurance Company, and 100% from CVS Caremark Corporation, through March 12, 2012. Of the total December 31, 2011 gross accounts receivable, we have collected 88% as of March 12, 2012. Because we have a high percentage of our revenue dependent on a relatively small number of clients, delayed payments by a few of our larger clients could result in a reduction of our available cash.
Capital Lease Obligations
Capital lease obligations as of December 31, 2011 and January 1, 2011 were $2.8 million and $2.3 million, respectively. We are a party to a capital lease agreement with a lease company to lease hardware and software. Beginning in 2010, executed leases did not require an irrevocable letter of credit. Prior to 2010, the Company was required to issue an irrevocable letter of credit for a portion of the lease amount as additional consideration for the duration of the executed lease agreement. We expect capital lease obligations to increase between $3.2 million to $4.2 million for fiscal year 2012 as we continue to expand our investment in the infrastructure for Behavioral Analytics.
Contractual Obligations
Cash will also be required for operating leases and non-cancellable purchase obligations as well as various commitments reflected as liabilities on our balance sheet as of December 31, 2011. These commitments are as follows:
Continuing Operations
| (In millions) Contractual Obligations |
Total | Less Than 1 Year |
1 – 3 Years |
3 – 5 Years |
More Than 5 Years |
|||||||||||||||
| Letters of credit |
$ | 1.5 | $ | 1.5 | $ | — | $ | — | $ | — | ||||||||||
| Operating leases |
1.7 | 0.5 | 0.6 | 0.5 | 0.1 | |||||||||||||||
| Capital leases |
3.3 | 2.0 | 1.3 | — | — | |||||||||||||||
| Severance and related costs* |
— | — | — | — | — | |||||||||||||||
| Purchase obligations |
1.6 | 1.6 | — | — | — | |||||||||||||||
|
|
|
|
|
|
|
|
|
|
|
|||||||||||
| Total |
$ | 8.1 | $ | 5.6 | $ | 1.9 | $ | 0.5 | $ | 0.1 | ||||||||||
|
|
|
|
|
|
|
|
|
|
|
|||||||||||
| * | Less than $0.1. |
Due to the existence of the Company’s net operating loss carryforward as described in Note Eight “Income Taxes” of the “Notes to Consolidated Financial Statements” included in Part II Item 8 of this Form 10-K, no net tax contractual obligations exist as of December 31, 2011.
Letters of Credit
The amounts set forth in the chart above reflect standby letters of credit issued as collateral for capital leases. The terms of the Facility require us to deposit a like amount of cash into a restricted cash account at the Bank for the duration of the letter of credit commitment period. The amounts set forth in the chart above reflect the face amount of these letters of credit that expire in each period presented. To the extent these letters of credit expire without a claim being made, the cash deposited in the restricted cash account will be transferred back to an unrestricted cash account.
Leases
The amounts set forth in the chart above reflect future principal, interest, and executory costs of the leases entered into by the Company for technology and office equipment, as well as office and data center space. Liabilities for the principal portion of the capital lease obligations are reflected on our balance sheet as of December 31, 2011 and January 1, 2011.
Severance and Related Costs
Severance and related costs reflect payments the Company is required to make in future periods for severance and other related costs due to cost reduction activities in fiscal year 2011 and prior periods. Liabilities for these required payments are reflected on our balance sheet as of December 31, 2011 and January 1, 2011.
21
Table of Contents
Purchase Obligations
Purchase obligations include $1.4 million of commitments reflected as liabilities on our balance sheet as of December 31, 2011, as well as $0.4 million of non-cancellable obligations to purchase goods or services in the future. Purchase obligations include $0.7 million of commitments reflected as liabilities on our balance sheet as of January 1, 2011, as well as $0.2 million of non-cancellable obligations to purchase goods or services in the future.
Recent Accounting Pronouncements
In October 2009, the FASB issued Accounting Standards Update (“ASU”) No. 2009-13, Revenue Recognition (ASC Topic 605) – Multiple-Deliverable Revenue Arrangements, a consensus of the FASB Emerging Issues Task Force. This guidance modifies the fair value requirements of ASC subtopic 605-25, Revenue Recognition-Multiple Element Arrangements, by allowing the use of the “best estimate of selling price” in addition to VSOE and vendor objective evidence (now referred to as TPE, standing for third-party evidence) for determining the selling price of a deliverable. A vendor is now required to use its best estimate of the selling price when VSOE or TPE of the selling price cannot be determined. In addition, the residual method of allocating arrangement consideration is no longer permitted.
In October 2009, the FASB also issued ASU No. 2009-14, Software (ASC Topic 985) – Certain Revenue Arrangements That Include Software Elements, a consensus of the FASB Emerging Issues Task Force. This guidance modifies the scope of ASC subtopic 965-605, Software-Revenue Recognition, to exclude from its requirements (i) non-software components of tangible products and (ii) software components of tangible products that are sold, licensed, or leased with tangible products when the software components and non-software components of the tangible product function together to deliver the tangible product’s essential functionality.
ASU No. 2009-13 and ASU No. 2009-14 also required expanded qualitative and quantitative disclosures and were effective for fiscal years beginning on or after June 15, 2010. We elected to adopt these updates effective for our fiscal year beginning January 2, 2011 and have applied them prospectively from that date for new or materially modified arrangements. The adoption of this guidance did not have a material effect on our consolidated financial statements.
In December 2010, the FASB issued ASU No. 2010-28, Intangibles—Goodwill and Other (ASC 350), When to Perform Step 2 of the Goodwill Impairment Test for Reporting Units with Zero or Negative Carrying Amounts ASU No. 2010-28, which modifies Step 1 of the goodwill impairment test for reporting units with zero or negative carrying amounts. For those reporting units, an entity is required to perform Step 2 of the goodwill impairment test if it is more likely than not that a goodwill impairment exists. In determining whether it is more likely than not that a goodwill impairment exists, an entity should consider whether there are any adverse qualitative factors indicating that an impairment may exist. The adoption of ASU No. 2010-28 was effective for our fiscal year beginning January 2, 2011. The adoption of this guidance did not have a material effect on our consolidated financial statements.
In June 2011, the FASB issued ASU No. 2011-05, Comprehensive Income (Topic220) – Presentation of Comprehensive Income, which requires an entity to present the total of comprehensive income, the components of net income, and the components of other comprehensive income either in a single continuous statement of comprehensive income or in two separate but consecutive statements. ASU 2011-05 eliminates the option to present the components of other comprehensive income as part of the Statement of Shareholders’ Equity. The items that must be reported in other comprehensive income or when an item of other comprehensive income must be reclassified to net income were not changed. Additionally, no changes were made to the calculation and presentation of earnings per share. In December 2011, the FASB issued ASU 2011-12, which deferred the effective date of guidance pertaining to the reporting of reclassification adjustments out of accumulated other comprehensive income in ASU 2011-05. ASU 2011-12 reinstated the requirements for the presentation of reclassifications that were in place prior to the issuance of ASU 2011-05. The Company will adopt ASU 2011-05 effective for our fiscal year ending December 29, 2012 and will retrospectively apply the new presentation of comprehensive income to prior periods presented. Other than the change in presentation and disclosure, the update will not have an impact on our consolidated financial statements.
In September 2011, the FASB issued ASU No. 2011-08, Intangibles—Goodwill and Other (Topic 350) – Testing Goodwill for Impairment, which allows an entity to use a qualitative approach to test goodwill for impairment. ASU 2011-08 permits an entity to first perform a qualitative assessment to determine whether it is more likely than not that the fair value of a reporting unit is less than its carrying value. If it is concluded that a potential exposure exists, it is necessary to perform the currently prescribed two-step goodwill impairment test. Otherwise, the two-step goodwill impairment test is not required. We adopted ASU 2011-08 in connection with our annual impairment test performed in the fourth quarter of 2011. The adoption of this update did not have a material effect on our consolidated financial statements.
22
Table of Contents
| Item 7A. | Quantitative and Qualitative Disclosures about Market Risk. |
Historically, we have not experienced material fluctuations in our results of operations due to foreign currency exchange rate changes. We do not currently engage, nor is there any plan to engage, in hedging foreign currency risk.
We also have interest rate risk with respect to changes in variable interest rates on our revolving line of credit, and our cash and cash equivalents and restricted cash. Interest on the line of credit is currently based on either the Bank’s prime rate, or LIBOR, which varies in accordance with prevailing market conditions. A change in interest rate impacts the interest expense on the line of credit and cash flows. This interest rate risk will not have a material impact on our financial position or results of operations.
23
Table of Contents
| Item 8. | Financial Statements and Supplementary Data. |
INDEX TO CONSOLIDATED FINANCIAL STATEMENTS OF MATTERSIGHT CORPORATION
| Page | ||||
| Financial Statements: |
||||
| Report of Grant Thornton LLP Independent Registered Public Accounting Firm |
25 | |||
| Consolidated Balance Sheets — as of December 31, 2011 and January 1, 2011 |
27 | |||
| 28 | ||||
| 29 | ||||
| 30 | ||||
| 32 | ||||
| Financial Statement Schedule: |
||||
| 54 | ||||
24
Table of Contents
REPORT OF INDEPENDENT REGISTERED PUBLIC ACCOUNTING FIRM
Board of Directors
Mattersight Corporation
We have audited Mattersight Corporation’s (a Delaware Corporation) internal control over financial reporting as of December 31, 2011, based on criteria established in Internal Control—Integrated Framework issued by the Committee of Sponsoring Organizations of the Treadway Commission (COSO). Mattersight Corporation’s management is responsible for maintaining effective internal control over financial reporting and for its assessment of the effectiveness of internal control over financial reporting, included in the accompanying Management’s Annual Report on Internal Control over Financial Reporting. Our responsibility is to express an opinion on Mattersight Corporation’s internal control over financial reporting based on our audit.
We conducted our audit in accordance with the standards of the Public Company Accounting Oversight Board (United States). Those standards require that we plan and perform the audit to obtain reasonable assurance about whether effective internal control over financial reporting was maintained in all material respects. Our audit included obtaining an understanding of internal control over financial reporting, assessing the risk that a material weakness exists, testing and evaluating the design and operating effectiveness of internal control based on the assessed risk, and performing such other procedures as we considered necessary in the circumstances. We believe that our audit provides a reasonable basis for our opinion.
A company’s internal control over financial reporting is a process designed to provide reasonable assurance regarding the reliability of financial reporting and the preparation of financial statements for external purposes in accordance with generally accepted accounting principles. A company’s internal control over financial reporting includes those policies and procedures that (1) pertain to the maintenance of records that, in reasonable detail, accurately and fairly reflect the transactions and dispositions of the assets of the company; (2) provide reasonable assurance that transactions are recorded as necessary to permit preparation of financial statements in accordance with generally accepted accounting principles, and that receipts and expenditures of the company are being made only in accordance with authorizations of management and directors of the company; and (3) provide reasonable assurance regarding prevention or timely detection of unauthorized acquisition, use, or disposition of the company’s assets that could have a material effect on the financial statements.
Because of its inherent limitations, internal control over financial reporting may not prevent or detect misstatements. Also, projections of any evaluation of effectiveness to future periods are subject to the risk that controls may become inadequate because of changes in conditions, or that the degree of compliance with the policies or procedures may deteriorate.
In our opinion, Mattersight Corporation maintained, in all material respects, effective internal control over financial reporting as of December 31, 2011, based on criteria established in Internal Control—Integrated Framework issued by COSO.
We also have audited, in accordance with the standards of the Public Company Accounting Oversight Board (United States), the consolidated balance sheets of Mattersight Corporation as of December 31, 2011 and January 1, 2011, and the related consolidated statements of operations, changes in stockholders’ equity (deficit) and comprehensive loss and cash flows for each of the three years in the period ended December 31, 2011, and our report dated March 15, 2012 expressed an unqualified opinion on those financial statements.
/s/ GRANT THORNTON LLP
Chicago, Illinois
March 15, 2012
25
Table of Contents
REPORT OF INDEPENDENT REGISTERED PUBLIC ACCOUNTING FIRM
Board of Directors and Shareholders
Mattersight Corporation
We have audited the accompanying consolidated balance sheets of Mattersight Corporation (a Delaware corporation) and subsidiaries as of December 31, 2011 and January 1, 2011, and the related consolidated statements of operations, changes in stockholders’ equity (deficit) and comprehensive loss and cash flows for each of the three years in the period ended December 31, 2011. Our audit of the basic consolidated financial statements included the financial statement schedules listed in the index appearing under Schedule II- Valuation and Qualifying Accounts. These financial statements and financial statement schedule are the responsibility of the Company’s management. Our responsibility is to express an opinion on these financial statements and financial statement schedules based on our audits.
We conducted our audits in accordance with the standards of the Public Company Accounting Oversight Board (United States). Those standards require that we plan and perform the audit to obtain reasonable assurance about whether the financial statements are free of material misstatement. An audit includes examining, on a test basis, evidence supporting the amounts and disclosures in the financial statements. An audit also includes assessing the accounting principles used and significant estimates made by management, as well as evaluating the overall financial statement presentation. We believe that our audits provide a reasonable basis for our opinion.
In our opinion, the consolidated financial statements referred to above present fairly, in all material respects, the financial position of Mattersight Corporation and subsidiaries as of December 31, 2011 and January 1, 2011, and the results of their operations and their cash flows for each of the three years in the period ended December 31, 2011, in conformity with accounting principles generally accepted in the United States of America. Also, in our opinion, the related financial statement schedules, when considered in relation to the basic financial statements taken as a whole, presents fairly, in all material respects, the information set forth therein.
We also audited, in accordance with the standards of the Public Company Accounting Oversight Board (United States), Mattersight Corporations’ internal control over financial reporting as of December 31, 2011, based on criteria established in Internal Control- Integrated Framework issued by the Committee of Sponsoring Organizations of the Treadway Commission (COSO), and our report dated March 15, 2012 expressed an unqualified opinion.
/s/ GRANT THORNTON LLP
Chicago, Illinois
March 15, 2012
26
Table of Contents
MATTERSIGHT CORPORATION
(In thousands, except share and per share data)
| December 31, 2011 |
January 01, 2011 |
|||||||
| ASSETS: | ||||||||
| Current Assets: |
||||||||
| Cash and cash equivalents |
$ | 29,408 | $ | 20,872 | ||||
| Restricted cash |
1,500 | 2,460 | ||||||
| Receivables, net |
2,540 | 2,041 | ||||||
| Prepaid expenses |
5,302 | 4,303 | ||||||
| Other current assets |
288 | 296 | ||||||
| Current assets held for sale |
— | 26,946 | ||||||
|
|
|
|
|
|||||
| Total current assets |
39,038 | 56,918 | ||||||
| Equipment and leasehold improvements, net |
4,271 | 4,397 | ||||||
| Goodwill |
972 | 972 | ||||||
| Intangibles, net |
238 | 323 | ||||||
| Other long-term assets |
4,746 | 3,582 | ||||||
|
|
|
|
|
|||||
| Total assets |
$ | 49,265 | $ | 66,192 | ||||
|
|
|
|
|
|||||
| LIABILITIES AND STOCKHOLDERS’ EQUITY (DEFICIT): | ||||||||
| Current Liabilities: |
||||||||
| Short-term debt |
$ | 3,567 | $ | — | ||||
| Accounts payable |
812 | 372 | ||||||
| Accrued compensation and related costs |
1,382 | 2,048 | ||||||
| Unearned revenue |
9,783 | 7,884 | ||||||
| Other current liabilities |
3,673 | 4,262 | ||||||
| Current liabilities held for sale |
— | 31,433 | ||||||
|
|
|
|
|
|||||
| Total current liabilities |
19,217 | 45,999 | ||||||
| Long-term unearned revenue |
3,036 | 4,686 | ||||||
| Other long-term liabilities |
1,401 | 1,561 | ||||||
|
|
|
|
|
|||||
| Total liabilities |
23,654 | 52,246 | ||||||
|
|
|
|
|
|||||
| Series B Stock, $0.01 par value; 5,000,000 shares authorized and designated; 1,670,696 and 3,549,078 shares issued and outstanding at December 31, 2011 and January 1, 2011, respectively, with a liquidation preference of $8,819 and $19,367 at December 31, 2011 and January 1, 2011, respectively |
8,521 | 18,100 | ||||||
| Stockholders’ Equity (Deficit): |
||||||||
| Preferred stock, $0.01 par value; 35,000,000 shares authorized; none issued and outstanding |
— | — | ||||||
| Common Stock, $0.01 par value; 50,000,000 shares authorized; 18,037,552 and 15,642,822 shares issued at December 31, 2011 and January 1, 2011, respectively; and 16,935,204 and 14,786,005 outstanding at December 31, 2011 and January 1, 2011, respectively |
180 | 156 | ||||||
| Additional paid-in capital |
212,618 | 207,985 | ||||||
| Accumulated deficit |
(185,779 | ) | (204,139 | ) | ||||
| Treasury stock, at cost, 1,102,348 and 856,817 shares at December 31, 2011 and January 1, 2011, respectively |
(5,891 | ) | (4,468 | ) | ||||
| Accumulated other comprehensive loss |
(4,038 | ) | (3,688 | ) | ||||
|
|
|
|
|
|||||
| Total stockholders’ equity (deficit) |
17,090 | (4,154 | ) | |||||
|
|
|
|
|
|||||
| Total liabilities and stockholders’ equity (deficit) |
$ | 49,265 | $ | 66,192 | ||||
|
|
|
|
|
|||||
See accompanying notes to consolidated financial statements.
27
Table of Contents
MATTERSIGHT CORPORATION
CONSOLIDATED STATEMENTS OF OPERATIONS
(In thousands, except per share data)
| For the Fiscal Years Ended | ||||||||||||
| 2011 | 2010 | 2009 | ||||||||||
| Revenue: |
||||||||||||
| Behavioral Analytics revenue |
$ | 27,257 | $ | 25,246 | $ | 19,636 | ||||||
| Other revenue |
1,519 | 5,014 | 12,189 | |||||||||
|
|
|
|
|
|
|
|||||||
| Total services revenue |
28,776 | 30,260 | 31,825 | |||||||||
| Reimbursed expenses |
319 | 625 | 738 | |||||||||
|
|
|
|
|
|
|
|||||||
| Total revenue |
29,095 | 30,885 | 32,563 | |||||||||
| Operating expenses: |
||||||||||||
| Cost of Behavioral Analytics revenue |
12,188 | 11,999 | 11,892 | |||||||||
| Cost of Other revenue |
1,000 | 3,511 | 8,127 | |||||||||
|
|
|
|
|
|
|
|||||||
| Cost of services |
13,188 | 15,510 | 20,019 | |||||||||
| Reimbursed expenses |
319 | 625 | 738 | |||||||||
|
|
|
|
|
|
|
|||||||
| Total cost of revenue, exclusive of depreciation and amortization shown below: |
13,507 | 16,135 | 20,757 | |||||||||
| Sales, marketing and development |
19,954 | 18,640 | 15,238 | |||||||||
| General and administrative |
9,144 | 10,082 | 9,838 | |||||||||
| Severance and related costs |
(336 | ) | 494 | 970 | ||||||||
| Depreciation |
3,218 | 3,291 | 3,752 | |||||||||
| Amortization of intangibles |
177 | 132 | 219 | |||||||||
|
|
|
|
|
|
|
|||||||
| Total operating expenses |
45,664 | 48,774 | 50,774 | |||||||||
|
|
|
|
|
|
|
|||||||
| Operating loss |
(16,569 | ) | (17,889 | ) | |
(18,211 |
) | |||||
| Interest and other income (expense), net |
125 | (121 | ) | 53 | ||||||||
|
|
|
|
|
|
|
|||||||
| Loss from continuing operations before income taxes |
(16,444 | ) | (18,010 | ) | (18,158 | ) | ||||||
| Income tax benefit |
5,884 | 1,706 | 2,804 | |||||||||
|
|
|
|
|
|
|
|||||||
| Loss from continuing operations |
(10,560 | ) | (16,304 | ) | (15,354 | ) | ||||||
| Income from discontinued operations, net of tax |
28,920 | 2,986 | 4,734 | |||||||||
|
|
|
|
|
|
|
|||||||
| Net income (loss) |
18,360 | (13,318 | ) | (10,620 | ) | |||||||
| Series B Stock fair value over stated value |
(6,555 | ) | — | — | ||||||||
| Dividends related to Series B Stock |
(1,252 | ) | (1,273 | ) | (1,292 | ) | ||||||
|
|
|
|
|
|
|
|||||||
| Net income (loss) available to common stockholders |
$ | 10,553 | $ | (14,591 | ) | $ | (11,912 | ) | ||||
|
|
|
|
|
|
|
|||||||
| Per common share: |
||||||||||||
| Basic loss from continuing operations |
$ | (0.74 | ) | $ | (1.19 | ) | $ | (1.16 | ) | |||
|
|
|
|
|
|
|
|||||||
| Basic income from discontinued operations |
$ | 2.03 | $ | 0.22 | $ | 0.36 | ||||||
|
|
|
|
|
|
|
|||||||
| Basic net income (loss) available to common stockholders |
$ | 0.74 | $ | (1.06 | ) | $ | (0.90 | ) | ||||
|
|
|
|
|
|
|
|||||||
| Diluted loss from continuing operations |
$ | (0.74 | ) | $ | (1.19 | ) | $ | (1.16 | ) | |||
|
|
|
|
|
|
|
|||||||
| Diluted income from discontinued operations |
$ | 2.03 | $ | 0.22 | $ | 0.36 | ||||||
|
|
|
|
|
|
|
|||||||
| Diluted net income (loss) available to common stockholders |
$ | 0.74 | $ | (1.06 | ) | $ | (0.90 | ) | ||||
|
|
|
|
|
|
|
|||||||
| Shares used to calculate basic net income (loss) per share |
14,225 | 13,701 | 13,255 | |||||||||
|
|
|
|
|
|
|
|||||||
| Shares used to calculate diluted net income (loss) per share |
14,225 | 13,701 | 13,255 | |||||||||
|
|
|
|
|
|
|
|||||||
| Stock-based compensation, primarily restricted stock, is included in individual line items above: |
||||||||||||
| Cost of Behavioral Analytics revenue |
$ | 20 | $ | 68 | $ | 225 | ||||||
| Sales, marketing and development |
3,387 | 2,484 | 2,832 | |||||||||
| General and administrative |
2,013 | 1,840 | 1,707 | |||||||||
| Discontinued operations |
1,175 | 809 | 1,533 | |||||||||
See accompanying notes to consolidated financial statements.
28
Table of Contents
MATTERSIGHT CORPORATION
CONSOLIDATED STATEMENTS OF CASH FLOWS
(In thousands)
| For the Fiscal Years Ended | ||||||||||||
| 2011 | 2010 | 2009 | ||||||||||
| Cash Flows from Operating Activities: |
||||||||||||
| Net income (loss) |
$ | 18,360 | $ | (13,318 | ) | $ | (10,620 | ) | ||||
| Less: net income from discontinued operations |
28,920 | 2,986 | 4,734 | |||||||||
|
|
|
|
|
|
|
|||||||
| Net loss from continuing operations |
(10,560 | ) | (16,304 | ) | (15,354 | ) | ||||||
| Adjustments to reconcile net loss from continuing operations to net cash (used in) provided by operating activities: |
||||||||||||
| Depreciation and amortization |
3,395 | 3,423 | 3,971 | |||||||||
| Stock-based compensation |
5,420 | 4,392 | 4,773 | |||||||||
| Other |
14 | 16 | 358 | |||||||||
| Changes in assets and liabilities: |
||||||||||||
| Receivables |
(554 | ) | 1,422 | 579 | ||||||||
| Prepaid expenses |
(2,254 | ) | 953 | (2,448 | ) | |||||||
| Other assets |
128 | (19 | ) | (251 | ) | |||||||
| Accounts payable |
445 | (575 | ) | (73 | ) | |||||||
| Accrued compensation and related costs |
(264 | ) | (1,311 | ) | 220 | |||||||
| Unearned revenue |
275 | (1,641 | ) | 6,892 | ||||||||
| Other liabilities |
(6,554 | ) | (1,798 | ) | (3,092 | ) | ||||||
|
|
|
|
|
|
|
|||||||
| Total Adjustments |
51 | 4,862 | 10,929 | |||||||||
|
|
|
|
|
|
|
|||||||
| Net cash used in continuing operations |
(10,509 | ) | (11,442 | ) | (4,425 | ) | ||||||
| Net cash (used in) provided by discontinued operations |
(5,787 | ) | 8,431 | 12,168 | ||||||||
|
|
|
|
|
|
|
|||||||
| Net cash (used in) provided by operating activities |
(16,296 | ) | (3,011 | ) | 7,743 | |||||||
|
|
|
|
|
|
|
|||||||
| Cash Flows from Investing Activities: |
||||||||||||
| Capital expenditures and other |
(833 | ) | (1,219 | ) | (2,912 | ) | ||||||
| Proceeds from sale/leaseback of assets |
— | 423 | — | |||||||||
| Sale of short-term investments |
— | — | 337 | |||||||||
|
|
|
|
|
|
|
|||||||
| Net cash used in continuing investing activities |
(833 | ) | (796 | ) | (2,575 | ) | ||||||
| Net cash provided by (used in) discontinued investing activities |
37,427 | (1,593 | ) | (415 | ) | |||||||
|
|
|
|
|
|
|
|||||||
| Net cash provided by (used in) investing activities |
36,594 | (2,389 | ) | (2,990 | ) | |||||||
|
|
|
|
|
|
|
|||||||
| Cash Flows from Financing Activities: |
||||||||||||
| Purchase of shares of Series B Stock |
(12,547 | ) | — | — | ||||||||
| Proceeds from issuance of Common Stock |
6,000 | — | — | |||||||||
| Payment of Series B Stock dividends |
(2,221 | ) | (1,297 | ) | (649 | ) | ||||||
| Principal payments under capital lease obligations |
(1,862 | ) | (1,578 | ) | (1,299 | ) | ||||||
| Acquisition of treasury stock |
(1,008 | ) | (991 | ) | (634 | ) | ||||||
| Decrease (increase) in restricted cash |
960 | 1,285 | (90 | ) | ||||||||
| Proceeds from stock compensation and employee stock purchase plans, net |
126 | 202 | 141 | |||||||||
|
|
|
|
|
|
|
|||||||
| Net cash used in continuing financing activities |
(10,552 | ) | (2,379 | ) | (2,531 | ) | ||||||
| Net cash used in discontinued financing activities |
(678 | ) | (292 | ) | (289 | ) | ||||||
|
|
|
|
|
|
|
|||||||
| Net cash used in financing activities |
(11,230 | ) | (2,671 | ) | (2,820 | ) | ||||||
|
|
|
|
|
|
|
|||||||
| Effect of exchange rate changes on cash and cash equivalents by continuing operations |
(299 | ) | (65 | ) | (34 | ) | ||||||
| Effect of exchange rate changes on cash and cash equivalents by discontinued operations |
(233 | ) | 26 | 19 | ||||||||
|
|
|
|
|
|
|
|||||||
| Effect of exchange rate changes on cash and cash equivalents |
(532 | ) | (39 | ) | (15 | ) | ||||||
|
|
|
|
|
|
|
|||||||
| Increase (decrease) in cash and cash equivalents |
8,536 | (8,110 | ) | 1,918 | ||||||||
| Cash and cash equivalents, beginning of period |
20,872 | 28,982 | 27,064 | |||||||||
|
|
|
|
|
|
|
|||||||
| Cash and cash equivalents of continuing operations, end of period |
$ | 29,408 | $ | 20,872 | $ | 28,982 | ||||||
|
|
|
|
|
|
|
|||||||
| Non-Cash Investing and Financing Transactions: |
||||||||||||
| Capital lease obligations incurred |
$ | 2,517 | $ | 1,385 | $ | 762 | ||||||
| Capital equipment purchased on credit |
2,517 | 1,385 | 762 | |||||||||
| Change in net unrealized security loss |
— | — | 108 | |||||||||
| Supplemental Disclosures of Cash Flow Information: |
||||||||||||
| Interest paid |
$ | 187 | $ | 157 | $ | 356 | ||||||
See accompanying notes to consolidated financial statements.
29
Table of Contents
MATTERSIGHT CORPORATION
CONSOLIDATED STATEMENTS OF CHANGES IN STOCKHOLDERS’ EQUITY (DEFICIT)
AND COMPREHENSIVE INCOME (LOSS)
(In thousands, except share data)
| Common Stock Issued | Additional Paid-in Capital |
(Accumulated Deficit) |
Treasury Stock |
Accumulated Other Compre- hensive Loss |
Total Stock- holders’ Equity (Deficit) |
|||||||||||||||||||||||
| Shares | Amount | |||||||||||||||||||||||||||
| Balance, December 27, 2008 |
14,152,702 | $ | 142 | $ | 198,853 | $ | (180,201 | ) | $ | (2,457 | ) | $ | (3,490 | ) | $ | 12,847 | ||||||||||||
|
|
|
|
|
|
|
|
|
|
|
|
|
|
|
|||||||||||||||
| Net loss |
(10,620 | ) | (10,620 | ) | ||||||||||||||||||||||||
| Foreign currency translation |
(31 | ) | (31 | ) | ||||||||||||||||||||||||
| Unrealized loss on marketable securities |
(108 | ) | (108 | ) | ||||||||||||||||||||||||
|
|
|
|||||||||||||||||||||||||||
| Comprehensive loss |
(10,759 | ) | ||||||||||||||||||||||||||
| Issuance of Common Stock for option awards exercised |
1,000 | 3 | 3 | |||||||||||||||||||||||||
| Issuance of Common Stock related to employee stock programs |
736,482 | 7 | 461 | 468 | ||||||||||||||||||||||||
| Amortization/forfeitures of unearned compensation |
(22,031 | ) | 5,584 | 5,584 | ||||||||||||||||||||||||
| Purchase of treasury shares |
(838 | ) | (838 | ) | ||||||||||||||||||||||||
| Series B Stock conversions |
3,368 | 18 | 18 | |||||||||||||||||||||||||
| Series B Stock dividend |
(1,292 | ) | (1,292 | ) | ||||||||||||||||||||||||
|
|
|
|
|
|
|
|
|
|
|
|
|
|
|
|||||||||||||||
| Balance, December 26, 2009 |
14,871,521 | $ | 149 | $ | 203,627 | $ | (190,821 | ) | $ | (3,295 | ) | $ | (3,629 | ) | $ | 6,031 | ||||||||||||
|
|
|
|
|
|
|
|
|
|
|
|
|
|
|
|||||||||||||||
| Net loss |
(13,318 | ) | (13,318 | ) | ||||||||||||||||||||||||
| Foreign currency translation |
(59 | ) | (59 | ) | ||||||||||||||||||||||||
|
|
|
|||||||||||||||||||||||||||
| Comprehensive loss |
(13,377 | ) | ||||||||||||||||||||||||||
| Issuance of Common Stock for option awards exercised |
895 | 2 | 2 | |||||||||||||||||||||||||
| Issuance of Common Stock related to employee stock programs |
731,010 | 6 | 325 | 331 | ||||||||||||||||||||||||
| Amortization/forfeitures of unearned compensation |
(27,695 | ) | 4,963 | 4,963 | ||||||||||||||||||||||||
| Purchase of treasury shares |
(1,173 | ) | (1,173 | ) | ||||||||||||||||||||||||
| Series B Stock conversions |
67,091 | 1 | 341 | 342 | ||||||||||||||||||||||||
| Series B Stock dividend |
(1,273 | ) | (1,273 | ) | ||||||||||||||||||||||||
|
|
|
|
|
|
|
|
|
|
|
|
|
|
|
|||||||||||||||
| Balance, January 1, 2011 |
15,642,822 | $ | 156 | $ | 207,985 | $ | (204,139 | ) | $ | (4,468 | ) | $ | (3,688 | ) | $ | (4,154 | ) | |||||||||||
|
|
|
|
|
|
|
|
|
|
|
|
|
|
|
|||||||||||||||
30
Table of Contents
MATTERSIGHT CORPORATION
CONSOLIDATED STATEMENTS OF CHANGES IN STOCKHOLDERS’ EQUITY (DEFICIT)
AND COMPREHENSIVE INCOME (LOSS) (CONTINUED)
(In thousands, except share data)
| Common Stock Issued | Additional Paid-in Capital |
(Accumulated Deficit) |
Treasury Stock |
Accumulated Other Compre- hensive Loss |
Total Stock- holders’ Equity (Deficit) |
|||||||||||||||||||||||
| Shares | Amount | |||||||||||||||||||||||||||
| Balance, January 1, 2011 |
15,642,822 | $ | 156 | $ | 207,985 | $ | (204,139 | ) | $ | (4,468 | ) | $ | (3,688 | ) | $ | (4,154 | ) | |||||||||||
|
|
|
|
|
|
|
|
|
|
|
|
|
|
|
|||||||||||||||
| Net income |
18,360 | 18,360 | ||||||||||||||||||||||||||
| Foreign currency translation |
(350 | ) | (350 | ) | ||||||||||||||||||||||||
|
|
|
|||||||||||||||||||||||||||
| Comprehensive income |
18,010 | |||||||||||||||||||||||||||
| Proceeds from issuance of Common Stock |
1,252,609 | 12 | 5,988 | 6,000 | ||||||||||||||||||||||||
| Issuance of Common Stock related to employee stock programs |
1,258,289 | 12 | 155 | 167 | ||||||||||||||||||||||||
| Amortization/forfeitures of unearned compensation |
(101,125 | ) | 6,493 | 6,493 | ||||||||||||||||||||||||
| Retire treasury shares |
(20,620 | ) | (224 | ) | 224 | — | ||||||||||||||||||||||
| Purchase of treasury shares |
(1,647 | ) | (1,647 | ) | ||||||||||||||||||||||||
| Series B Stock retired |
(6,555 | ) | (6,555 | ) | ||||||||||||||||||||||||
| Series B Stock conversions |
5,577 | 28 | 28 | |||||||||||||||||||||||||
| Series B Stock dividend |
(1,252 | ) | (1,252 | ) | ||||||||||||||||||||||||
|
|
|
|
|
|
|
|
|
|
|
|
|
|
|
|||||||||||||||
| Balance, December 31, 2011 |
18,037,552 | $ | 180 | $ | 212,618 | $ | (185,779 | ) | $ | (5,891 | ) | $ | (4,038 | ) | $ | 17,090 | ||||||||||||
|
|
|
|
|
|
|
|
|
|
|
|
|
|
|
|||||||||||||||
See accompanying notes to consolidated financial statements.
31
Table of Contents
MATTERSIGHT CORPORATION
NOTES TO CONSOLIDATED FINANCIAL STATEMENTS
(Dollars in millions, except share and per share data)
Note One — Description of Business
Mattersight is a leader in enterprise analytics focused on customer and employee interactions and behaviors. Mattersight’s Behavioral Analytics service captures and analyzes customer and employee interactions, employee desktop data, and other contextual information to improve operational performance and predict future customer and employee outcomes. Mattersight’s analytics are based on millions of proprietary algorithms and the application of unique behavioral models. The company’s SaaS+ delivery model combines analytics in the cloud with deep customer partnerships to drive significant business value. Mattersight’s applications are used by leading companies in Healthcare, Insurance, Financial Services, Telecommunications, Cable, Utilities, and Government.
Following the sale by the Company of its ICS Business Unit on May 28, 2011, the Company changed its corporate name to Mattersight Corporation and began operating in a single business segment, focused primarily on Behavioral Analytics. Through Behavioral Analytics, the Company generates two types of revenue:
| (1) | Managed services revenue, which is recurring, annuity revenue from long-term (generally three- to five-year) contracts and includes subscription and amortized deployment revenue; and |
| (2) | Consulting services revenue, which is generally project-based and sold on a time-and-materials or fixed-fee basis and includes follow-on consulting services revenue. |
Set forth below is a more detailed description of the capabilities that the Company currently offers.
Behavioral Analytics
The Company’s multi-channel technology captures the unstructured data of voice interactions (conversations), related customer and employee data, and employee desktop activity, and applies millions of proprietary algorithms against those interactions. Each interaction contains hundreds of attributes that get scored and ultimately detect patterns of behavior or business process that provide the transparency and predictability necessary to enhance revenue, improve the customer experience, improve efficiency, and predict and navigate outcomes. Adaptive across industries, programs, and industry-specific processes, the Company’s Behavioral Analytics offerings enable its customers to drive measurable economic benefit through the improvement of contact center performance, customer satisfaction and retention, fraud reduction, and streamlined back office operations. Specifically, through its Behavioral Analytics offerings, Mattersight helps its clients:
| • | Automatically measure customer satisfaction and agent performance on every analyzed call; |
| • | Identify and understand customer personality; |
| • | Improve rapport between agent and customer; |
| • | Reduce call handle times while improving customer satisfaction; |
| • | Identify opportunities to improve self-service applications; |
| • | Improve cross-sell and up-sell success rates; |
| • | Improve the efficiency and effectiveness of collection efforts; |
| • | Identify customer experience issues and score calls for retention risk; |
| • | Measure and improve supervisor effectiveness and coaching; |
| • | Improve agent effectiveness by analyzing key attributes of desktop usage; |
| • | Predict likelihood of a customer attrition; and |
| • | Identify fraud callers and improve authentication processes. |
The Company has designed a highly-scalable, flexible, and adaptive application platform to enable the Company to implement and operate its Behavioral Analytics offerings for its clients. These offerings are primarily delivered through a SaaS+ model, as a managed subscription service from which Mattersight derives Managed services revenue and Consulting services revenue. Managed services revenue consists of deployment and subscription services and Consulting services revenue consists of post-deployment follow-on services, including coaching and training and custom data analysis.
32
Table of Contents
MATTERSIGHT CORPORATION
NOTES TO CONSOLIDATED FINANCIAL STATEMENTS — (Continued)
In addition to our Behavioral Analytics offerings, Mattersight also generates revenue from the following services:
Marketing Managed Services
Marketing Managed Services revenue is derived from marketing application hosting services.
CRM Services
CRM Services revenue is derived from operational consulting services that enhance business performance through improved process efficiencies and redesign of workflows.
Types of Revenue
Managed Services Revenue
Growth in Managed services revenue is primarily driven by the execution of new Behavioral Analytics contracts, under which the Company deploys and provides the ongoing hosting of our proprietary Behavioral Analytics System. Based on each client’s business requirements, the Behavioral Analytics System is configured and integrated into the client’s environment and then deployed in either a remote-hosted or, in one case, an on-premise hosted environment. Thereafter, the client’s selection of our Behavioral Analytics offerings is provided, on a subscription basis, for a term that is generally three to five years. The fees and costs related to the initial deployment are deferred and amortized over the term of the contract.
We also generate Managed services revenue from Marketing Managed Services, specifically, from hosted customer and campaign data management. This source of Managed services revenue is likely to diminish over time as we focus on growth through Behavioral Analytics.
Consulting Services Revenue
In addition to the Consulting services revenue generated by the Consulting services provided under our Behavioral Analytics contracts, we derive a portion of this type of revenue from CRM Services for long-standing accounts. Consulting services revenue from CRM Services is anticipated to diminish over time as demand for these services continues to decline and we focus on growth through Behavioral Analytics. We bill for Consulting services on a time-and-materials or fixed-fee basis.
Note Two — Summary of Significant Accounting Policies
Fiscal Year-End
The fiscal year-end dates presented for fiscal years 2011, 2010, and 2009 are December 31, 2011, January 1, 2011, and December 26, 2009, respectively. Fiscal year 2010 consisted of fifty-three weeks instead of fifty-two weeks, which did not have a material impact on the Company’s financial position or results of operations.
Consolidation
The consolidated financial statements include the accounts of Mattersight and all of its subsidiaries. All significant intercompany transactions have been eliminated.
Use of Estimates
The preparation of the financial statements in conformity with GAAP requires management to make estimates and assumptions that affect the reported amounts of assets and liabilities and disclosure of contingent assets and liabilities at the date of the financial statements and the reported amounts of revenue and expenses during the reporting period. Actual results could differ from those amounts.
Reclassifications and Revisions
The sale by the Company of its ICS Business Unit and “eLoyalty” registered trademark / trade name to Magellan Acquisition Sub, LLC, a Colorado limited liability company and wholly-owned subsidiary of TeleTech Holdings, Inc., a Delaware corporation, closed on May 28, 2011, and the Company changed its name from eLoyalty Corporation to Mattersight Corporation effective June 1, 2011. Therefore, the results of operations of the ICS Business Unit are reported as discontinued operations for all periods presented. Additionally, certain corporate and general costs that had historically been allocated to the ICS Business Unit were reallocated to the Company and are reflected in all periods presented. Mattersight now reports financial results on a single business segment, primarily focused on Behavioral Analytics.
The Company changed the revenue classification of one contract from Other revenue to subscription revenue in the fourth quarter of 2011 to better reflect the type of services provided under this contract. Revenue for this contract has been reclassified in all historical periods. As a result, the Company reclassified $0.5 million for fiscal years 2010 and 2009, respectively, from Other revenue to Behavioral Analytics revenue. Cost of services for this contract has also been reclassified in all historical periods. As a result, the Company reclassified $0.3 million for fiscal years 2010 and 2009, respectively, from Other revenue to Behavioral Analytics.
33
Table of Contents
MATTERSIGHT CORPORATION
NOTES TO CONSOLIDATED FINANCIAL STATEMENTS — (Continued)
Certain leadership, recruiting, and facility management expenses that have been previously reported as Sales, marketing and development have been reclassified to General and administrative. As a result, the Company reclassified $1.7 million and $1.3 million for fiscal years 2010 and 2009, respectively, from Sales, marketing and development to General and administrative.
Certain data center expenses that have been previously reported as General and administrative have been reclassified as Cost of services. The Company believes this revised classification provided a clearer understanding of its key profit/loss drivers. As a result, the Company reclassified $2.1 million for fiscal year 2009 from General and administrative to Cost of services.
These changes did not have an impact on net income (loss).
Revenue Recognition
Continuing Operations
Behavioral Analytics Revenue
Behavioral Analytics revenue consists of Managed services revenue and Consulting services revenue.
Managed services revenue consists of planning, deployment, training, and subscription fees derived from Behavioral Analytics contracts. Planning, deployment, and training fees, which are considered to be installation fees related to long-term subscription contracts, are deferred until the installation is complete and are then recognized over the term of the applicable subscription contract. The terms of these subscription contracts generally range from three to five years. Installation costs incurred are deferred up to an amount not to exceed the amount of deferred installation revenue and additional amounts that are recoverable based on the contractual arrangement. These costs are included in Prepaid expenses and Other long-term assets. Such costs are amortized over the term of the subscription contract. Costs in excess of the foregoing revenue amount are expensed in the period incurred.
The amount of revenue generated from subscription fees is based on a number of factors, such as the number of users to whom the Behavioral Analytics Service is provided, and/or the number of hours of calls analyzed during the relevant month of the term of the subscription contract. This revenue is recognized as the service is performed for the client.
Consulting services revenue primarily consists of fees charged to the Company’s clients to provide post-deployment follow-on consulting services, which include custom data analysis, the implementation of enhancements, and training. These follow-on consulting services are generally performed for the Company’s clients on a fixed-fee basis. Revenue is recognized as the services are performed, with performance generally assessed on the ratio of actual hours incurred to date compared to the total estimated hours over the entire term of the contract.
Other Revenue
Other revenue consists of Marketing Managed Services revenue and CRM Services revenue.
Marketing Managed Services revenue is derived from marketing application hosting. This revenue is generally in the form of fixed monthly fees received from the Company’s clients and is recognized as the services are performed for each client. Any related setup fee would be recognized over the contract period of the hosting arrangement.
CRM Services revenue consists of fees generated from the Company’s operational consulting services, which are provided to the Company’s clients on a time-and-materials or fixed-fee basis. The Company recognizes revenue as the services are performed for time-and-materials projects. For fixed-fee projects, revenue is recognized based on the ratio of hours incurred to date compared to the total estimated hours over the entire term of the contract.
Discontinued Operations
ICS Business Unit
Managed services revenue included in the ICS Business Unit consisted of fees generated from the Company’s contact center support and monitoring services. Support and monitoring services generally were contracted for a fixed fee, and the revenue was recognized ratably over the term of the contract. Support fees that were contracted on a time-and-materials basis were recognized as the services were performed for the client.
For fixed fee Managed services contracts, where the Company provided support for third-party software and hardware, revenue was recorded at the gross amount of the sale. If the contract did not meet the requirements for gross reporting, then Managed services revenue was recorded at the net amount of the sale.
Consulting services revenue included in the ICS Business Unit consisted of the modeling, planning, configuring, or integrating of an Internet Protocol network solution within the Company’s clients’ contact center environments. These services were provided to clients on a time-and-materials or fixed-fee basis. For the integration of a system, the Company recognized revenue as the services were performed, with performance generally assessed on the ratio of hours incurred to date compared to the total estimated hours over the entire term of the contract. For all other consulting services, the Company recognized revenue as the services were performed for the client.
34
Table of Contents
MATTERSIGHT CORPORATION
NOTES TO CONSOLIDATED FINANCIAL STATEMENTS — (Continued)
Revenue from the sale of Product, which was generated primarily from the resale of third-party software and hardware by the Company, was generally recorded at the gross amount of the sale when it was delivered to the client.
In October 2009, the Financial Accounting Standards Board (“FASB”) amended the accounting standards for revenue recognition to remove tangible products containing software components and non-software components that function together to deliver the product’s essential functionality from the scope of industry-specific software revenue recognition guidance. In October 2009, the FASB also amended the accounting standards for multiple deliverable revenue arrangements to:
| (i) | provide updated guidance on whether multiple deliverables exist, how the deliverables in an arrangement should be separated, and how the consideration should be allocated; |
| (ii) | require an entity to allocate revenue in an arrangement using estimated selling prices (“ESP”) of deliverables if a vendor does not have vendor-specific objective evidence of selling price (“VSOE”) or third-party evidence of selling price (“TPE”); and |
| (iii) | eliminate the use of the residual method and require an entity to allocate revenue using the relative selling price method. |
The Company elected to adopt this accounting guidance at the beginning of its first quarter of fiscal 2011 on a prospective basis. The adoption of this guidance does not impact our revenue recognition with respect to Behavioral Analytics because the implementation services sold with our hosting service are not separated into multiple accounting units because there is no standalone fair value for these services. We recognize these services revenues over the anticipated term of the hosting services, currently the contract term. This accounting guidance does not change the units of accounting for the Company’s revenue transactions or the methods used to allocate consideration to the units of accounting. The revenue recognition for each of these offerings is discussed below.
For the ICS Business Unit, the Company utilized VSOE to allocate revenue to various elements in an arrangement. We determined VSOE based on our normal pricing and discounting practices for the product or service when sold separately. In determining VSOE, we required that a substantial majority of the selling prices for a product or consulting services fall within a reasonably narrow pricing range, generally evidenced by approximately 80% of such historical standalone transactions falling within plus or minus 20% of the median selling price. For the ICS Business Unit’s managed services, we established VSOE through the stated renewal approach. Previously, we were able to establish VSOE for our product and service offerings except for software. If we were not able to establish VSOE for an offering, we attempted to establish fair value by utilizing TPE. TPE is established by obtaining evidence from comparable offerings from a peer company. If the Company was unable to establish fair value using VSOE or TPE, then the Company used ESP in its allocation of revenue. To determine ESP, we applied significant judgment as we weighed a variety of factors, based on the facts and circumstances of the arrangement. These factors included internal costs, gross margin objectives, and existing portfolio pricing and discounting.
Within discontinued operations, some of our sales arrangements had multiple deliverables containing software and related software components. Such sale arrangements were subject to the accounting guidance in ASC 985-605, Software Revenue Recognition.
Reimbursed expenses revenue includes billable costs related to travel and other out-of-pocket expenses incurred while performing services for the Company’s clients. The cost of third-party product and support may be included within this category if the transaction does not satisfy the requirements for gross reporting. An equivalent amount of reimbursable expenses is included in Cost of revenue.
Payments received for Managed services contracts in excess of the amount of revenue recognized for these contracts are recorded as unearned revenue until revenue recognition criteria are met.
Cost of Revenue before Reimbursed Expenses, Exclusive of Depreciation and Amortization
Cost of services primarily consists of labor costs, including salaries, fringe benefits, and incentive compensation, royalties, and other customer related third-party outside services. Cost of services excludes depreciation and amortization.
Sales, Marketing and Development
Sales, marketing and development expenses consist primarily of salaries, incentive compensation, commissions, and employee benefits for business development, account management, marketing, and solution development/support personnel. The personnel costs included here are net of any labor costs directly related to the generation of revenue, which are represented in Cost of services.
35
Table of Contents
MATTERSIGHT CORPORATION
NOTES TO CONSOLIDATED FINANCIAL STATEMENTS — (Continued)
General and Administrative
General and administrative expenses consist primarily of salaries, incentive compensation, and employee benefits for administrative personnel, as well as facilities costs, a provision for uncollectible amounts, and costs for our corporate technology infrastructure and applications.
Income (Loss) Per Common Share
The per common share basic net income (loss) available to common stockholders has been computed by dividing the net income (loss) available to common stockholders for each period presented by the weighted average shares outstanding. The per common share diluted income (loss) available to common stockholders has been computed by dividing the net income (loss) available to common stockholders by the weighted average shares outstanding plus the dilutive effect of common stock equivalents, which is primarily related to Series B Stock, using the “treasury stock” method. In periods in which there was a loss, the dilutive effect of common stock equivalents is not included in the diluted loss per share calculation as it was antidilutive.
Fair Value of Financial Instruments
The carrying values of current assets and liabilities approximated their fair values as of December 31, 2011 and January 1, 2011. Fair value is an exit price and establishes a three-tier valuation hierarchy for ranking the quality and reliability of the information used to determine fair values. The first tier, Level 1, uses quoted market prices in active markets for identical assets or liabilities. Level 2 uses inputs, other than quoted market prices for identical assets or liabilities in active markets, which are observable either directly or indirectly. Level 3 uses unobservable inputs in which there are little or no market data, and requires the entity to develop its own assumptions. A financial asset or liability’s classification within the hierarchy is determined based on the lowest level input that is significant to the fair value measurement.
Cash and Cash Equivalents
The Company considers all highly liquid investments readily convertible into known amounts of cash (with original purchased maturities of three months or less) to be cash equivalents.
Restricted Cash
Restricted cash principally represents cash as security for the Company’s line of credit and letters of credit issued to support the Company’s capital lease obligations.
Concentration of Credit Risk
Financial instruments that potentially subject the Company to a concentration of credit risk consist of cash and cash equivalents, restricted cash, and receivables. Cash and cash equivalents and restricted cash consist of money market funds and deposits with high credit quality financial institutions. At times, such deposits may be in excess of the Federal Deposit Insurance Corporation insurance limit. The Company’s receivables are derived from billings to clients located primarily in the U.S. and are denominated in U.S. dollars. For fiscal year 2011, there were three clients that accounted for 10% or more of total revenue. Vangent, Inc., Allstate Insurance Company, and Health Care Service Corporation accounted for 22%, 15%, and 14% of total revenue, respectively. For fiscal year 2010, there were four clients accounting for more than 10% of the total revenue. Vangent, Inc., United HealthCare Services, Inc., Health Care Service Corporation, and Allstate Insurance Company accounted for 20%, 15%, 14%, and 13% of total revenue, respectively. For fiscal year 2009, three clients accounted for 10% of total revenue. Blue Shield of California, United HealthCare Services, Inc., and Health Care Service Corporation accounted for 16%, 14%, and 11% of total revenue, respectively. As of December 31, 2011, three clients, United HealthCare Services, Inc., Allstate Insurance Company, and CVS Caremark Corporation accounted for 25%, 22%, and 14% of total gross accounts receivable, respectively. As of January 1, 2011, three clients, United HealthCare Services, Inc., Allstate Insurance Company, and Health Care Service Corporation, accounted for 28%, 19%, and 17% of total gross accounts receivable, respectively.
Equipment and Leasehold Improvements
Computers, software, furniture, and equipment are carried at cost and depreciated on a straight-line basis over their estimated useful lives. Leasehold improvements are amortized over the lesser of the useful life or the lease term. The useful life for computers and software is three years. For enterprise software applications where a longer useful life is deemed appropriate, five years is used. For furniture and equipment, a useful life of five years is used. Maintenance and repair costs are expensed as incurred. The cost and related accumulated depreciation of assets sold or disposed of are eliminated from the respective accounts and the resulting gain or loss is included in the statements of operations. The carrying value of equipment and leasehold improvements is periodically reviewed to assess recoverability based on future undiscounted cash flows. An impairment loss, if any, would be measured as the excess of the carrying value over the fair value. There was no impairment as of December 31, 2011 and January 1, 2011.
36
Table of Contents
MATTERSIGHT CORPORATION
NOTES TO CONSOLIDATED FINANCIAL STATEMENTS — (Continued)
The Company accounts for software developed for internal use in accordance with the guidance provided under ASC Topic 350, which addresses accounting for the costs of computer software developed or obtained for internal use. As such, costs incurred that relate to the planning and post-implementation phases of development are expensed. Costs incurred during the application development stage are capitalized and amortized over the asset’s estimated useful life, which is generally three to five years.
The Company leases certain equipment using both capital leases and operating leases. Assets leased under capital leases are recorded at the present value of future lease payments and depreciated on a straight line basis. All capital leases are for terms of either thirty or thirty-six months.
Goodwill
Goodwill is tested annually for impairment or more frequently if an event or circumstance indicates that an impairment loss may have been incurred. In performing our annual impairment test, we first perform a qualitative assessment to determine whether it is more likely than not that the fair value of a reporting unit is less than its carrying value, including goodwill. If it is concluded that this is the case for one or more reporting units, we perform a detailed quantitative assessment using a two-step test approach. In the first step, the fair value of each reporting unit is compared with its carrying value. If the fair value exceeds the carrying value, then goodwill is not impaired and no further testing is performed. The second step is performed if the carrying value exceeds the fair value. The implied fair value of the reporting unit’s goodwill must be determined and compared to the carrying value of the goodwill. If the carrying value of a reporting unit’s goodwill exceeds its implied fair value, then an impairment loss equal to the difference will be recorded. In 2011, after completing our annual qualitative review, we concluded that it was not more-likely-than-not that the carrying value of any of our reporting units exceeded its fair value. Accordingly, we concluded that further quantitative analysis and testing was not required, and no goodwill impairment charge was required.
A detailed determination of the fair value of a reporting unit may be carried forward from one year to the next if specific criteria have been met.
There has been no impairment identified as a result of the annual review of goodwill as of December 31, 2011 and January 1, 2011. The carrying value of goodwill was $1.0 million as of December 31, 2011 and January 1, 2011.
Intangible Assets
Intangible assets reflect costs related to patent and trademark applications, Marketing Managed Services customer relationships acquired in 2004, and the 2003 purchase of a license for certain intellectual property. Patent and trademark applications are amortized over 120 months. The other intangible assets are fully amortized. Currently, amortization expense of intangible assets is expected to be $40 thousand annually thereafter. There was an impairment charge of $0.1 million during fiscal years 2011 and 2010.
| December 31, 2011 |
January 1, 2011 |
|||||||
| Gross intangible assets |
$ | 2.8 | $ | 2.7 | ||||
| Accumulated amortization of intangible assets |
(2.6 | ) | (2.4 | ) | ||||
|
|
|
|
|
|||||
| Total |
$ | 0.2 | $ | 0.3 | ||||
|
|
|
|
|
|||||
Other Long-Term Assets
Other long-term assets primarily consist of deferred costs and prepaid commissions related to Behavioral Analytics. These costs are recognized over the terms of the respective agreements, generally one to five years. Costs included in long-term assets will be recognized over the remaining term of the agreements beyond the first twelve months.
Income Taxes
The Company uses an asset and liability approach for financial accounting and reporting of income taxes. Deferred income taxes are provided when tax laws and financial accounting standards differ with respect to the amount of income for the year, the basis of assets and liabilities and for tax loss carryforwards. The Company does not provide U.S. deferred income taxes on earnings of U.S. or foreign subsidiaries, which are expected to be indefinitely reinvested.
The Company has recorded income tax valuation allowances on our net deferred tax assets to account for the unpredictability surrounding the timing of realization of our U.S. and non-U.S. net deferred tax assets due to uncertain economic conditions. The valuation allowances may be reversed at a point in time when management determines realization of these tax assets has become more likely than not, based on a return to predictable levels of profitability.
The Company may recognize the tax benefit from an uncertain tax position only if it is more likely than not that the tax position will be sustained on examination by the taxing authorities, based on the technical merits of the position. The tax benefits recognized in the financial statements from such a position should be measured based on the largest benefit that has a greater than 50% likelihood of being realized upon ultimate settlement. Significant judgment is used to determine the likelihood of the benefit. There is additional guidance on derecognition, classification, interest and penalties on income taxes, accounting in interim periods, and disclosure requirements.
37
Table of Contents
MATTERSIGHT CORPORATION
NOTES TO CONSOLIDATED FINANCIAL STATEMENTS — (Continued)
Intraperiod tax allocation requires that the provision for income taxes be allocated between continuing operations and other categories of earnings (such as discontinued operations or other comprehensive income) for each tax jurisdiction. In periods in which there is a year-to-date pre-tax loss from continuing operations and pre-tax income in other categories of earnings, the tax provision is first allocated to the other categories of earnings.
Short-Term Debt
Under the terms of the Settlement Agreement, the Company entered into promissory notes with TCV in the aggregate amount of $3.6 million, which accrue interest at a rate of 7% per annum and are payable December 31, 2012 (the “Notes”). Under the terms of the Notes, the Company is required to apply 50% of net proceeds from the issuance of equity or equity equivalents to pay down the Notes. As a result, in connection with the sale of Common Stock to IGC Fund under the terms of the Purchase Agreement, the Company applied $3.0 million to pay down the Notes, representing 50% of the net proceeds from such sale.
Stockholders’ Equity (Deficit)
Stockholders’ equity (deficit) includes Common Stock issued, additional paid-in capital, accumulated deficit, treasury stock, and accumulated other comprehensive loss. The 1.7 million shares of Series B Stock are not classified as permanent equity or a liability in the accompanying balance sheets. These shares of Series B Stock are conditionally redeemable and do not meet the definition of a mandatorily redeemable financial instrument. The holders of Series B Stock have the ability to initiate a redemption upon the occurrence of certain events that are considered outside the Company’s control.
Foreign Currency Translation
The functional currencies for the Company’s foreign subsidiaries are their local currencies. All assets and liabilities of foreign subsidiaries are translated to U.S. dollars at end of period exchange rates. The resulting translation adjustments are recorded as a component of stockholders’ equity (deficit) and comprehensive income (loss). Income and expense items are translated at average exchange rates prevailing during the period. Foreign currency net losses were $0.4 million for fiscal year 2011, $0.1 million for fiscal year 2010, and less than $0.1 million for fiscal year 2009. These foreign currency transactions from subsidiaries are included in interest and other income within the consolidated statements of operations.
Stock-Based Compensation
Stock-based compensation cost is measured at the grant date based on the fair value of the award and is recognized as expense over the vesting period. Determining fair value of stock-based awards at the grant date requires certain assumptions. The Company uses historical information as the primary basis for the selection of expected life, expected volatility, expected dividend yield assumptions, and anticipated forfeiture rates. The risk-free interest rate is selected based on the yields from U.S. Treasury Strips with a remaining term equal to the expected term of the options being valued.
Recent Accounting Pronouncements
In October 2009, the FASB issued Accounting Standards Update (“ASU”) No. 2009-13, Revenue Recognition (ASC Topic 605) – Multiple-Deliverable Revenue Arrangements, a consensus of the FASB Emerging Issues Task Force. This guidance modifies the fair value requirements of ASC subtopic 605-25, Revenue Recognition-Multiple Element Arrangements, by allowing the use of the “best estimate of selling price” in addition to VSOE and vendor objective evidence (now referred to as TPE, standing for third-party evidence) for determining the selling price of a deliverable. A vendor is now required to use its best estimate of the selling price when VSOE or TPE of the selling price cannot be determined. In addition, the residual method of allocating arrangement consideration is no longer permitted.
In October 2009, the FASB also issued ASU No. 2009-14, Software (ASC Topic 985) – Certain Revenue Arrangements That Include Software Elements, a consensus of the FASB Emerging Issues Task Force. This guidance modifies the scope of ASC subtopic 965-605, Software-Revenue Recognition, to exclude from its requirements (i) non-software components of tangible products and (ii) software components of tangible products that are sold, licensed, or leased with tangible products when the software components and non-software components of the tangible product function together to deliver the tangible product’s essential functionality.
ASU No. 2009-13 and ASU No. 2009-14 also required expanded qualitative and quantitative disclosures and were effective for fiscal years beginning on or after June 15, 2010. We elected to adopt these updates effective for our fiscal year beginning January 2, 2011 and have applied them prospectively from that date for new or materially modified arrangements. The adoption of this guidance did not have a material effect on the Company’s consolidated financial statements.
In December 2010, the FASB issued ASU No. 2010-28, Intangibles—Goodwill and Other (ASC 350), When to Perform Step 2 of the Goodwill Impairment Test for Reporting Units with Zero or Negative Carrying Amounts ASU No. 2010-28, which modifies Step 1 of the goodwill impairment test for reporting units with zero or negative carrying amounts. For those reporting units, an entity is required to perform Step 2 of the goodwill impairment test if it is more likely than not that a goodwill impairment exists. In determining whether it is more likely than not that a goodwill impairment exists, an entity should consider whether there are any adverse qualitative factors indicating that an impairment may exist. The adoption of ASU No. 2010-28 was effective for our fiscal year beginning January 2, 2011. The adoption of this guidance did not have a material effect on the Company’s consolidated financial statements.
38
Table of Contents
MATTERSIGHT CORPORATION
NOTES TO CONSOLIDATED FINANCIAL STATEMENTS — (Continued)
In June 2011, the FASB issued ASU 2011-05, Comprehensive Income (Topic 220) – Presentation of Comprehensive Income, which requires an entity to present the total of comprehensive income, the components of net income, and the components of other comprehensive income either in a single continuous statement of comprehensive income or in two separate but consecutive statements. ASU 2011-05 eliminates the option to present the components of other comprehensive income as part of the Statement of Shareholders’ Equity. The items that must be reported in other comprehensive income or when an item of other comprehensive income must be reclassified to net income were not changed. Additionally, no changes were made to the calculation and presentation of earnings per share. In December 2011, the FASB issued ASU 2011-12, which deferred the effective date of guidance pertaining to the reporting of reclassification adjustments out of accumulated other comprehensive income in ASU 2011-05. ASU 2011-12 reinstated the requirements for the presentation of reclassifications that were in place prior to the issuance of ASU 2011-05. The Company will adopt ASU 2011-05 effective for our fiscal year ending December 29, 2012 and will retrospectively apply the new presentation of comprehensive income to prior periods presented. Other than the change in presentation and disclosure, the update will not have an impact on the Company’s consolidated financial statements.
In September 2011, the FASB issued ASU No. 2011-08, Intangibles—Goodwill and Other (Topic 350) – Testing Goodwill for Impairment, which allows an entity to use a qualitative approach to test goodwill for impairment. ASU 2011-08 permits an entity to first perform a qualitative assessment to determine whether it is more likely than not that the fair value of a reporting unit is less than its carrying value. If it is concluded that a potential exposure exists, it is necessary to perform the currently prescribed two-step goodwill impairment test. Otherwise, the two-step goodwill impairment test is not required. We adopted ASU 2011-08 in connection with our annual impairment test performed in the fourth quarter of 2011. The adoption of this update did not have a material effect on the Company’s consolidated financial statements.
Note Three — Discontinued Operations
The following table summarizes the components included within income from discontinued operations, net of tax within the Company’s Consolidated Statements of Operations for the periods indicated.
| For the Fiscal Years Ended | ||||||||||||
| 2011 | 2010 | 2009 | ||||||||||
| Net sales |
$ | 22.9 | $ | 57.3 | $ | 69.0 | ||||||
| Total expenses |
(23.7 | ) | (52.5 | ) | (61.4 | ) | ||||||
| Gain from sale of assets |
36.5 | — | — | |||||||||
| Provision for income taxes |
(6.8 | ) | (1.8 | ) | (2.9 | ) | ||||||
| Income from discontinued operations |
28.9 | 3.0 | 4.7 | |||||||||
Intraperiod tax allocation requires that the provision for income taxes be allocated between continuing operations and other categories of earnings (such as discontinued operations or other comprehensive income) for each tax jurisdiction. In periods in which there is a year-to-date pre-tax loss from continuing operations and pre-tax income in other categories of earnings, the tax provision is first allocated to the other categories of earnings. A related tax benefit is then recorded in continuing operations. While intraperiod tax allocation in general does not change the overall tax provision, it may result in a gross-up of the individual components, thereby changing the amount of tax provision included in each category. Included in our continuing operations income tax provision is a tax benefit of $5.9 million and $1.7 million for the years ended December 31, 2011 and January 1, 2011, respectively. Included in our discontinued operations income tax provision is tax expense of $6.8 million for the year ended December 31, 2011, $1.8 million for the year ended January 1, 2011, and $2.9 million for the year ended December 26, 2009. Depending upon the level of our future earnings and losses and their impact on income from discontinued operations, it is possible that these tax adjustments may change or even reverse in future periods.
We are required to account for the income tax provision as stated in the previous paragraph, based on our 2011 results for continuing operations, our estimated 2011 tax liability was $0.5 million.
Note Four — Severance and Related Costs
Severance costs are comprised primarily of contractual salary and related fringe benefits over the severance payment period. Facility costs include losses on contractual lease commitments, net of estimated sublease recoveries, and impairment of leasehold improvements and certain office assets.
39
Table of Contents
MATTERSIGHT CORPORATION
NOTES TO CONSOLIDATED FINANCIAL STATEMENTS — (Continued)
Continuing Operations
For fiscal year 2011, the Company recorded $0.3 million of income for continuing operations related to the favorable renegotiation of an office lease, partially offset by the severance and related costs for the elimination of one position and an office consolidation. For fiscal year 2010, the Company recorded $0.5 million of expense for continuing operations related to severance and related costs for the elimination of 26 positions and an adjustment to sublease recoveries. For fiscal year 2009, the Company recorded $1.0 million of expense for continuing operations related to severance and related costs for the elimination of 19 positions.
For the fiscal year ended January 1, 2011, the Company made cash payments of $0.6 million related to cost-reduction actions for continuing operations. For the fiscal year ended December 26, 2009, the Company made cash payments of $1.1 million related to cost-reduction actions for continuing operations. The cash payments in fiscal years 2011, 2010, and 2009 were primarily related to severance and related costs, office space reductions, and office closures.
The severance and related costs and their utilization for the fiscal years ended 2009, 2010, and 2011 are as follows:
| Employee Severance |
Facilities | Total | ||||||||||
| Balance, December 27, 2008 |
$ | 0.1 | $ | 0.4 | $ | 0.5 | ||||||
|
|
|
|
|
|
|
|||||||
| Charges |
0.9 | — | 0.9 | |||||||||
| Adjustments |
— | 0.1 | 0.1 | |||||||||
|
|
|
|
|
|
|
|||||||
| Charged to severance and related costs |
0.9 | 0.1 | 1.0 | |||||||||
| Payments |
(1.0 | ) | (0.1 | ) | (1.1 | ) | ||||||
|
|
|
|
|
|
|
|||||||
| Balance, December 26, 2009 |
$ | — | $ | 0.4 | $ | 0.4 | ||||||
|
|
|
|
|
|
|
|||||||
| Charges |
0.5 | — | 0.5 | |||||||||
| Adjustments |
— | — | — | |||||||||
|
|
|
|
|
|
|
|||||||
| Charged to severance and related costs |
0.5 | — | 0.5 | |||||||||
| Payments |
(0.5 | ) | (0.1 | ) | (0.6 | ) | ||||||
|
|
|
|
|
|
|
|||||||
| Balance, January 1, 2011 |
$ | — | $ | 0.3 | $ | 0.3 | ||||||
| Charges |
— | (0.1 | ) | (0.1 | ) | |||||||
| Adjustments |
— | (0.2 | ) | (0.2 | ) | |||||||
|
|
|
|
|
|
|
|||||||
| Charged to severance and related costs |
— | (0.3 | ) | (0.3 | ) | |||||||
| Payments |
— | — | — | |||||||||
|
|
|
|
|
|
|
|||||||
| Balance, December 31, 2011 |
$ | — | $ | — | $ | — | ||||||
|
|
|
|
|
|
|
|||||||
As of December 31, 2011, $46 thousand remained reserved for continuing operations relating to an office consolidation. The $46 thousand balance is in “Other current liabilities”.
Discontinued Operations
During fiscal years 2011, 2010, and 2009, the Company recognized pre-tax charges (including adjustments) of $0.2 million, $0.7 million, and $0.4 million, respectively. For the year ended 2011, the Company recorded $0.2 million of expense related to severance and related costs of discontinued operations for the elimination of 11 positions. For the year ended 2010, the Company recorded $0.7 million of expense related to severance and related costs of discontinued operations for the elimination of 37 positions. For the year ended 2009, the Company recorded $0.4 million of expense related to severance and related costs of discontinued operations for the elimination of 15 positions.
During fiscal years 2011, 2010, and 2009, the Company made cash payments of $0.2 million, $0.7 million, and $0.4 million, respectively, related to cost-reduction actions for discontinued operations. The cash payments made during fiscal years 2011, 2010, and 2009 were related to severance and related costs.
40
Table of Contents
MATTERSIGHT CORPORATION
NOTES TO CONSOLIDATED FINANCIAL STATEMENTS — (Continued)
The severance and related costs and their utilization for the fiscal years ended 2009, 2010, and 2011 are as follows:
| Employee Severance |
Facilities | Total | ||||||||||
| Balance, December 27, 2008 |
$ | — | $ | — | $ | — | ||||||
|
|
|
|
|
|
|
|||||||
| Charges |
0.4 | — | 0.4 | |||||||||
| Adjustments |
— | — | — | |||||||||
|
|
|
|
|
|
|
|||||||
| Charged to severance and related costs |
0.4 | — | 0.4 | |||||||||
| Payments |
(0.4 | ) | — | (0.4 | ) | |||||||
|
|
|
|
|
|
|
|||||||
| Balance, December 26, 2009 |
$ | — | $ | — | $ | — | ||||||
|
|
|
|
|
|
|
|||||||
| Charges |
0.7 | — | 0.7 | |||||||||
| Adjustments |
— | — | — | |||||||||
|
|
|
|
|
|
|
|||||||
| Charged to severance and related costs |
0.7 | — | 0.7 | |||||||||
| Payments |
(0.7 | ) | — | (0.7 | ) | |||||||
|
|
|
|
|
|
|
|||||||
| Balance, January 1, 2011 |
$ | — | $ | — | $ | — | ||||||
| Charges |
0.2 | — | 0.2 | |||||||||
| Adjustments |
— | — | — | |||||||||
|
|
|
|
|
|
|
|||||||
| Charged to severance and related costs |
0.2 | — | 0.2 | |||||||||
| Payments |
(0.2 | ) | — | (0.2 | ) | |||||||
|
|
|
|
|
|
|
|||||||
| Balance, December 31, 2011 |
$ | — | $ | — | $ | — | ||||||
|
|
|
|
|
|
|
|||||||
As of December 31, 2011, all severance and related costs for discontinued operations have been paid.
Note Five — Receivables, Net
Receivables consist of the following:
| As of | ||||||||
| December 31, 2011 |
January 1, 2011 |
|||||||
| Amounts billed to clients |
$ | 1.4 | $ | 1.7 | ||||
| Unbilled revenue |
1.1 | 0.3 | ||||||
|
|
|
|
|
|||||
| 2.5 | 2.0 | |||||||
| Allowances for doubtful accounts |
— | — | ||||||
|
|
|
|
|
|||||
| Receivables, net |
$ | 2.5 | $ | 2.0 | ||||
|
|
|
|
|
|||||
Amounts billed to clients represent fees and reimbursable project-related expenses. Unbilled revenue represents fees, project-related expenses, materials, and subcontractor costs performed in advance of billings in accordance with contract terms. Unbilled revenue at December 31, 2011 and January 1, 2011 consists of amounts due from clients and is anticipated to be collected within normal terms. The Company maintains allowances for doubtful accounts for estimated losses resulting from the inability of its clients to make required payments and clients indicating their intention to dispute their obligation to pay for contractual services provided by us. If the financial condition of our clients were to deteriorate, resulting in an impairment of their ability to make payments, additional allowances may be required.
Note Six — Current Prepaid Expenses
Current prepaid expenses were $5.3 million and $4.3 million as of December 31, 2011 and January 1, 2011, respectively. Current prepaid expenses primarily consist of deferred costs and prepaid commissions related to Behavioral Analytics. These costs are recognized over the contract terms of the respective agreements, generally three to five years. Costs included in current prepaid expenses will be recognized within the next twelve months. Current prepaid expenses consisted of the following:
| As of | ||||||||
| December 31, 2011 |
January 1, 2011 |
|||||||
| Behavioral Analytics deferred costs |
$ | 2.5 | $ | 1.8 | ||||
| Prepaid commissions |
2.0 | 1.2 | ||||||
| Other |
0.8 | 1.3 | ||||||
|
|
|
|
|
|||||
| Total |
$ | 5.3 | $ | 4.3 | ||||
|
|
|
|
|
|||||
41
Table of Contents
MATTERSIGHT CORPORATION
NOTES TO CONSOLIDATED FINANCIAL STATEMENTS — (Continued)
Note Seven — Equipment and Leasehold Improvements
Equipment and leasehold improvements consist of the following:
| As of | ||||||||
| December 31, 2011 |
January 1, 2011 |
|||||||
| Computers and software |
$ | 29.2 | $ | 31.7 | ||||
| Furniture and equipment |
0.5 | 0.8 | ||||||
| Leasehold improvements |
0.5 | 1.4 | ||||||
|
|
|
|
|
|||||
| Equipment and leasehold improvements, gross |
30.2 | 33.9 | ||||||
| Accumulated depreciation and amortization |
(25.9 | ) | (29.5 | ) | ||||
|
|
|
|
|
|||||
| Equipment and leasehold improvements, net |
$ | 4.3 | $ | 4.4 | ||||
|
|
|
|
|
|||||
Depreciation expense was $3.2 million, $3.3 million, and $3.8 million, for fiscal years 2011, 2010, and 2009, respectively. Assets acquired under capital leases were $2.5 million, $1.4 million, and $0.8 million in fiscal years 2011, 2010, and 2009, respectively. Depreciation expense on capital lease assets was $1.8 million, $1.5 million, and $1.3 million in fiscal years 2011, 2010, and 2009, respectively.
Note Eight — Income Taxes
Income (loss) before income taxes consisted of the following:
| For the Fiscal Years Ended | ||||||||||||
| 2011 | 2010 | 2009 | ||||||||||
| United States |
$ | (15.8 | ) | $ | (16.6 | ) | $ | (16.9 | ) | |||
| Foreign |
(0.6 | ) | (1.4 | ) | (1.3 | ) | ||||||
|
|
|
|
|
|
|
|||||||
| Total |
$ | (16.4 | ) | $ | (18.0 | ) | $ | (18.2 | ) | |||
|
|
|
|
|
|
|
|||||||
The income tax benefit (provision) consists of the following:
| For the Fiscal Years Ended | ||||||||||||
| 2011 | 2010 | 2009 | ||||||||||
| Current: |
||||||||||||
| Federal |
$ | 5.5 | $ | 1.6 | $ | 2.6 | ||||||
| State |
0.4 | 0.1 | 0.2 | |||||||||
| Foreign |
— | — | — | |||||||||
|
|
|
|
|
|
|
|||||||
| Total current |
5.9 | 1.7 | 2.8 | |||||||||
|
|
|
|
|
|
|
|||||||
| Deferred: |
||||||||||||
| Federal |
— | — | — | |||||||||
| State |
— | — | — | |||||||||
| Foreign |
— | — | — | |||||||||
|
|
|
|
|
|
|
|||||||
| Total deferred |
— | — | — | |||||||||
|
|
|
|
|
|
|
|||||||
| Income tax benefit (provision) |
$ | 5.9 | $ | 1.7 | $ | 2.8 | ||||||
|
|
|
|
|
|
|
|||||||
The 2011 earnings and gain from discontinued operations include $6.8 million of tax expense.
Total income tax benefit (provision) differed from the amount computed by applying the federal statutory income tax rate due to the following:
| For the Fiscal Years Ended | ||||||||||||
| 2011 | 2010 | 2009 | ||||||||||
| Federal tax benefit, at statutory rate |
$ | 5.7 | $ | 6.3 | $ | 6.4 | ||||||
| State tax benefit, net of federal benefit |
0.4 | 0.1 | 0.2 | |||||||||
| Nondeductible expenses |
(0.2 | ) | — | — | ||||||||
| Valuation allowance |
— | (4.7 | ) | (3.8 | ) | |||||||
|
|
|
|
|
|
|
|||||||
| Income tax benefit (provision) |
$ | 5.9 | $ | 1.7 | $ | 2.8 | ||||||
|
|
|
|
|
|
|
|||||||
42
Table of Contents
MATTERSIGHT CORPORATION
NOTES TO CONSOLIDATED FINANCIAL STATEMENTS — (Continued)
The Company may recognize the tax benefit from an uncertain tax position only if it is more likely than not that the tax position will be sustained on examination by the taxing authorities, based on the technical merits of the position. The tax benefits recognized in the financial statements from such a position should be measured based on the largest benefit that has a greater than 50% likelihood of being realized upon ultimate settlement. Significant judgment is used to determine the likelihood of the benefit. There is also guidance on derecognition, classification, interest, and penalties on income taxes, accounting in interim periods, and income tax disclosures.
A reconciliation of the gross amounts of unrecognized tax benefits at the beginning and end of the year are as follows:
| For the Fiscal Years Ended | ||||||||||||
| 2011 | 2010 | 2009 | ||||||||||
| Balance at beginning of year |
$ | 12.8 | $ | 12.8 | $ | 12.8 | ||||||
|
|
|
|
|
|
|
|||||||
| Additions based on tax positions related to the current year |
0.3 | — | — | |||||||||
| Additions for tax positions of prior years |
— | — | — | |||||||||
| Reductions for tax positions of prior years |
(0.2 | ) | — | — | ||||||||
| Reductions for tax positions as a result of lapse of statute |
— | — | — | |||||||||
| Settlements |
— | — | — | |||||||||
|
|
|
|
|
|
|
|||||||
| Balance at end of year |
$ | 12.9 | $ | 12.8 | $ | 12.8 | ||||||
|
|
|
|
|
|
|
|||||||
Due to the Company’s worldwide net operating loss carryforward position, all but $0.3 million of these unrecognized tax benefits will not impact the Company’s effective tax rate, if recognized. Any change in the amount of unrecognized tax benefits within the next twelve months is not expected to result in a significant impact on the results of operations or the financial position of the Company.
Due to the Company’s worldwide net operating loss carryforward position, accrued interest and penalties associated with uncertain tax positions as of December 31, 2011 are not material. Interest and penalties associated with uncertain tax positions are recorded as part of income tax expense.
The statutes of limitation for the Company’s income tax returns after 2001 effectively remain open for examination by the Internal Revenue Service (“IRS”) because the net operating loss carryforward from those years can be examined by the IRS for a period of three years after filing the tax return for the year the loss is used. In 2011, an audit of fiscal years 2008 and 2009 was completed by the IRS. This audit resulted in a reduction of our net operating loss carryforward from these years and no tax liability. This reduction is reflected in this tax footnote.
Foreign and U.S. state jurisdictions have statutes of limitations generally ranging from 3 to 5 years. The state impact of any federal changes remains subject to examination by various states for a period of up to one year after formal notification to the states. The Company and its subsidiaries may have various state and foreign income tax returns for immaterial jurisdictions in the process of examination throughout the reporting period.
Deferred tax assets and liabilities were comprised of the following:
| As of | ||||||||
| December 31, 2011 |
January 1, 2011 |
|||||||
| Deferred tax assets: |
||||||||
| Net operating loss carryforwards |
$ | 52.1 | $ | 64.9 | ||||
| Receivable allowances |
— | — | ||||||
| Other accruals |
4.6 | 3.5 | ||||||
| Depreciation and amortization, including goodwill |
1.0 | 2.1 | ||||||
| Non-deductible reserves |
— | — | ||||||
| Tax credit carryforward |
0.8 | 0.5 | ||||||
| Valuation allowance |
(55.8 | ) | (62.7 | ) | ||||
|
|
|
|
|
|||||
| Total deferred tax assets |
2.7 | 8.3 | ||||||
|
|
|
|
|
|||||
| Deferred tax liabilities: |
||||||||
| Prepaid expenses |
(2.8 | ) | (8.3 | ) | ||||
|
|
|
|
|
|||||
| Total deferred tax liabilities |
(2.8 | ) | (8.3 | ) | ||||
|
|
|
|
|
|||||
| Net deferred tax asset (liability) |
$ | (0.1 | ) | $ | — | |||
|
|
|
|
|
|||||
43
Table of Contents
MATTERSIGHT CORPORATION
NOTES TO CONSOLIDATED FINANCIAL STATEMENTS — (Continued)
Deferred income taxes are not provided on certain undistributed earnings of foreign subsidiaries that are expected to be permanently reinvested in those companies. These earnings aggregated to an immaterial amount at each of December 31, 2011 and January 1, 2011.
Intraperiod tax allocation requires that the provision for income taxes be allocated between continuing operations and other categories of earnings (such as discontinued operations or other comprehensive income) for each tax jurisdiction. In periods in which there is a year-to-date pre-tax loss from continuing operations and pre-tax income in other categories of earnings, the tax provision is first allocated to the other categories of earnings. A related tax benefit is then recorded in continuing operations. While intraperiod tax allocation in general does not change the overall tax provision, it may result in a gross-up of the individual components, thereby changing the amount of tax provision included in each category. Included in our continuing operations income tax provision is a tax benefit of $5.9 million for the year ended December 31, 2011 and $1.7 million for the year ended January 1, 2011. Included in our discontinued operations income tax provision is tax expense of $6.8 million for the year ended December 31, 2011 and $1.8 million for the year ended January 1, 2011.
During fiscal year 2002, the Company established a valuation allowance related to deferred tax assets for the U.S. This is in addition to the valuation allowance established in 2001 for non-U.S. deferred tax assets. The Company continues to provide a valuation allowance on significantly all domestic and foreign deferred tax assets as the Company has determined that it is more likely than not that the deferred tax assets in these jurisdictions will not be realized. As of December 31, 2011, net deferred tax assets of $55.8 million were fully offset by a valuation allowance. The Company’s U.S. Federal net operating losses (“NOLs”) of $177.9 million and U.S. State NOLs of $101.5 million will expire beginning in 2022 and 2012, respectively. The Company’s non-U.S. NOLs of $0.6 million are subject to various expiration dates beginning in 2012. The Company also carries $0.5 million in Research and Development credit carryforwards that will expire beginning in 2021 and a U.S. Federal Alternative Minimum Tax credit carryforward of $0.3 million that does not expire.
The Company’s ability to utilize its NOLs could become subject to significant limitations under Section 382 of the Internal Revenue Code if the Company were to undergo an ownership change. An ownership change would occur if the stockholders who own or have owned, directly or indirectly, 5% or more of the Company’s Common Stock or are otherwise treated as 5% stockholders under Section 382 and the regulations promulgated thereunder increase their aggregate percentage ownership of the Company’s stock by more than 50 percentage points over the lowest percentage of the stock owned by these stockholders at any time during the testing period, which is generally the three-year period preceding the potential ownership change. In the event of an ownership change, Section 382 imposes an annual limitation on the amount of taxable income a corporation may offset with NOL carryforwards. Any unused annual limitation may be carried over to later years until the applicable expiration date for the respective NOL carryforwards. The Company has undergone a Section 382 analysis and does not believe there is a limitation on the use of NOL’s under Section 382. If a change in ownership is deemed to have occurred during the past three years, then it may be possible that the Company’s NOL carryforward could be subject to limitation under Section 382 for tax return purposes. However, since its NOL carryforward is fully reserved with a valuation allowance, there would be no impact for financial statement purposes from a Section 382 limitation.
Note Nine — Other Long-Term Assets
Other long-term assets were $4.7 million as of December 31, 2011 and $3.6 million as of January 1, 2011. Other long-term assets primarily consist of deferred costs and prepaid commissions related to Behavioral Analytics. These costs are recognized over the terms of the respective agreements, generally three to five years. Costs included in long-term assets will be recognized over the remaining term of the agreements beyond the first twelve months. Other long-term assets consisted of the following:
| As of | ||||||||
| December 31, 2011 |
January 1, 2011 |
|||||||
| Behavioral Analytics deferred costs |
$ | 2.4 | $ | 2.1 | ||||
| Prepaid commissions |
2.2 | 1.2 | ||||||
| Other |
0.1 | 0.3 | ||||||
|
|
|
|
|
|||||
| Total |
$ | 4.7 | $ | 3.6 | ||||
|
|
|
|
|
|||||
Note Ten — Short-Term Debt
Under the terms of the Settlement Agreement, the Company entered into promissory notes with TCV in the aggregate amount of $3.6 million, which accrue interest at a rate of 7% per annum and are payable December 31, 2012 (the “Notes”). Under the terms of the Notes, the Company is required to apply 50% of net proceeds from the issuance of equity or equity equivalents to pay down the Notes. As a result, in connection with the sale of Common Stock to IGC Fund under the terms of the Purchase Agreement, the Company applied $3.0 million to pay down the Notes, representing 50% of the net proceeds from such sale.
44
Table of Contents
MATTERSIGHT CORPORATION
NOTES TO CONSOLIDATED FINANCIAL STATEMENTS — (Continued)
Note Eleven — Line of Credit
The Company maintains a Loan Agreement with the Bank, which expires on December 31, 2012. The Facility, which is $5.0 million as of December 31, 2011, requires the Company to maintain a minimum cash and cash equivalent balance within a secured account at the Bank. The balance in the secured account cannot be less than the outstanding balance drawn on the Facility line of credit and letter of credit obligations under the Facility. Available credit under the Facility has been reduced by $1.5 million related to letters of credit issued under the Facility to support the Company’s capital lease obligations. As a result, $3.5 million remains available under the Facility as of December 31, 2011. Loans under the Facility bear interest at the Bank’s prime rate or, at the Company’s election, an alternate rate of LIBOR (London InterBank Offering Rate) plus 0.75%. The Company did not have any borrowings or interest expense under the Facility during fiscal years 2011 or 2010.
Note Twelve — Employee Benefit Plans
The Company’s U.S. employees are eligible to participate in the Mattersight Corporation 401(k) Plan (the “401(k) Plan”) on the first day of the month coinciding with or following their date of hire. The 401(k) Plan allows employees to contribute up to 30% of their eligible compensation and up to 100% of their bonus compensation, subject to IRS statutory limits. In order to conserve cash given the then-current macro-economic uncertainties, Mattersight suspended the employer matching contributions for both U.S. and non-U.S. plans, fully for fiscal years 2011 and 2010 and partially for fiscal year 2009. For fiscal year ended 2009, a partial year employer match contribution of $0.2 million was expensed. The Company funds non-U.S. contributory plans as required by statutory regulations. Amounts funded by the Company were immaterial for non-U.S. plans for the periods presented.
Note Thirteen — Capital Stock and Series B Stock
The Company’s authorized capital stock consists of (i) 50,000,000 shares of Common Stock, par value $0.01 per share, and (ii) 40,000,000 shares of preferred stock, par value $0.01 per share. The Company has designated 5,000,000 shares of its preferred stock as its Series B Stock, of which 1,670,696 and 3,549,078 shares were issued and outstanding as of December 31, 2011 and January 1, 2011, respectively.
On December 20, 2011, Mattersight repurchased 1,872,805 shares of Series B Stock under the terms of the Settlement Agreement with TCV, to settle arbitration relating to the parties’ dispute regarding whether the sale of the ICS Business Unit triggered immediate payment of the liquidation preference under the Certificate of Designations for the Series B Stock.
On September 12, 2008, Mattersight completed a Rights Offering, which raised $14.8 million, net of expenses. Under the terms of the Rights Offering, persons who owned shares of Common Stock or Series B Stock as of the close of business on August 13, 2008 (the record date for the Rights Offering) received the right to purchase 0.19756 shares of Common Stock. These subscription rights expired on September 12, 2008. Pursuant to the terms of the Rights Offering, the Company issued 2,645,395 shares of Common Stock at $5.67 per share.
In December 2006, the Company completed an $18.0 million Rights Offering. Under terms of the Rights Offering, persons who owned shares of Common Stock or Series B Stock as of the close of business on November 20, 2006 (the record date for the Rights Offering) received the right to purchase 0.0910 shares of Common Stock. These subscription rights expired on December 15, 2006. Pursuant to the terms of the Rights Offering, the Company issued 1,001,342 shares of Common Stock at $17.97 per share.
In December 2001, at the time of issuance of the Series B Stock, a beneficial conversion adjustment was calculated (since the fair market value of a share of Common Stock at the time exceeded the purchase price of a share of Series B Stock) aggregating $4.0 million. The Series B Stock was recorded at the date of issuance net of issuance costs and the beneficial conversion adjustment. The discount attributable to the issuance costs was fully accreted on the date of issuance by charging additional paid-in capital and increasing the recorded amount of Series B Stock. The Series B Stock was accreted to its full redemption value of $23.3 million on a straight line basis from the date of issuance to June 19, 2002 by charging additional paid-in capital $0.7 million per month and increasing the recorded amount of Series B Stock by a like amount.
The Series B Stock accrues dividends at a rate of 7% per annum, is entitled to a preference upon liquidation, and is convertible on a one-for-one basis into shares of Common Stock, subject to adjustment for stock splits, stock dividends, and similar actions. The Series B Stock generally votes on a one-for-one basis with the Common Stock, subject to adjustment for certain actions and specified matters as to which the Series B Stock is entitled to a separate class vote.
Note Fourteen — Stock-Based Compensation
Historically, the Company issued stock awards under two stock incentive plans: the Mattersight Corporation 1999 Stock Incentive Plan (the “1999 Plan”) and the Mattersight Corporation 2000 Stock Incentive Plan (the “2000 Plan”). However, the 2000 Plan expired in accordance with its terms on September 23, 2011, ten years after the effective date of the last amendment and restatement thereof, and no further awards have been issued thereunder. 20,620 treasury shares, representing all authorized and unissued treasury shares under the 2000 Plan were cancelled at that time.
Under the 1999 Plan, awards of restricted stock, installment stock, salary replacement, stock options, and stock appreciation rights may be granted to directors, officers, employees, consultants, independent contractors, and agents of the Company and its subsidiaries. Awards granted under the 1999 Plan are made at the discretion of the Compensation Committee of the Company’s Board of Directors (the “Compensation Committee”). If shares or options awarded under the 1999 Plan are not issued due to cancellation of
45
Table of Contents
MATTERSIGHT CORPORATION
NOTES TO CONSOLIDATED FINANCIAL STATEMENTS — (Continued)
unvested or unexercised options or shares, then those shares or options again become available for issuance under the plan. Under the 1999 Plan, on the first day of each fiscal year, the aggregate number of shares available for issuance under the 1999 Plan is automatically increased by an amount equal to 5% of the total number of shares of Common Stock that are outstanding. At the 2008 Annual Meeting of Stockholders, stockholders approved the amendment and restatement of the 1999 Plan to increase the number of shares available for issuance under the 1999 Plan by 1,500,000. As of December 31, 2011, there were a total of 897,513 shares available for future grants under the 1999 Plan and from treasury stock.
Stock-based compensation expense was $5.4 million, $4.4 million, and $4.8 million for fiscal years ended 2011, 2010, and 2009, respectively. The Company recognizes stock compensation expense on a straight-line basis over the vesting period. The Company has established its forfeiture rate based on historical experience. The Company does not recognize the windfall tax benefit related to the excess tax deduction because the Company currently does not anticipate realizing the tax savings associated with this deduction. The amount of this excess tax deduction was $0 for each of fiscal years ended December 31, 2011 and January 1, 2011.
Restricted Stock
Restricted stock awards are shares of Mattersight Common Stock granted to an individual. During the restriction period, the holder of granted restricted stock receives all of the benefits of ownership (right to dividends, voting rights, etc.), other than the right to sell or otherwise transfer any interest in the stock. Installment stock awards are grants to an individual of a contractual right to receive future shares of Mattersight Common Stock in specified amounts on specified vesting dates, subject to the individual remaining a Mattersight employee on the specified vesting dates. The holder has no benefits of ownership in installment stock until such time as the installment stock actually vests. The Company recognized compensation expense related to restricted stock awards of $4.8 million, $3.1 million, and $3.0 million for the fiscal years ended 2011, 2010, and 2009, respectively.
Restricted and installment stock award activity was as follows for the years ended December 26, 2009, January 1, 2011, and December 31, 2011:
| Shares | Weighted Average Price |
|||||||
| Nonvested balance at December 27, 2008 |
904,144 | $ | 11.63 | |||||
|
|
|
|||||||
| Granted |
600,000 | $ | 3.45 | |||||
| Vested |
(489,247 | ) | $ | 10.76 | ||||
| Forfeited |
(29,689 | ) | $ | 9.80 | ||||
|
|
|
|||||||
| Nonvested balance at December 26, 2009 |
985,208 | $ | 7.14 | |||||
|
|
|
|||||||
| Granted |
570,100 | $ | 6.03 | |||||
| Vested |
(624,073 | ) | $ | 7.43 | ||||
| Forfeited |
(28,195 | ) | $ | 10.89 | ||||
|
|
|
|||||||
| Nonvested balance at January 1, 2011 |
903,040 | $ | 6.12 | |||||
|
|
|
|||||||
| Granted |
1,246,955 | $ | 6.58 | |||||
| Vested |
(737,880 | ) | $ | 7.04 | ||||
| Forfeited |
(126,002 | ) | $ | 6.51 | ||||
|
|
|
|||||||
| Nonvested balance at December 31, 2011 |
1,286,113 | $ | 6.33 | |||||
|
|
|
|||||||
| For the Fiscal Years Ended | ||||||||||||
| 2011 | 2010 | 2009 | ||||||||||
| Total fair value of restricted and installment stock awards vested |
$ | 4.8 | $ | 3.6 | $ | 2.7 | ||||||
Following the completion of the sale of the ICS Business Unit on May 28, 2011, 21,278 unvested restricted stock awards and 8,750 stock options held by the employees of the ICS Business Unit were cancelled pursuant to the terms of the respective Restricted Stock Award and Stock Option Agreements.
As of December 31, 2011, there remains $5.7 million of unrecognized compensation expense related to restricted and installment stock awards. These costs are expected to be recognized over a weighted average period of 1.9 years.
Stock Options
Stock option awards may be in the form of incentive or non-qualified options. Stock options are granted with an exercise price per share equal to the fair market value of a share of the Common Stock on the date of grant, and have a maximum term of 10 years. The stock option terms are set by the Compensation Committee and generally become exercisable over a period of four years. The vesting can begin in equal monthly or quarterly increments over the vesting period. The Company recognized compensation expense related to option awards of $0.5 million, $1.1 million, and $1.1 million for the fiscal years ended 2011, 2010, and 2009, respectively.
46
Table of Contents
MATTERSIGHT CORPORATION
NOTES TO CONSOLIDATED FINANCIAL STATEMENTS — (Continued)
In addition, the 1999 Plan provides that each non-employee director, upon commencing service, shall receive a non-qualified stock option to purchase 50,000 shares of Common Stock that vests ratably over a period of 48 months. The day after the annual stockholders’ meeting, each non-employee director is granted a non-qualified stock option to purchase 5,000 shares of Common Stock. Stock options granted to non-employee directors have an exercise price per share equal to the fair market value of a share of Common Stock on the grant date, and are exercisable for up to 10 years.
During fiscal year 2011, options to purchase from the Company a total of 130,000 shares of Common Stock were granted. On May 20, 2011, each of the six then-current non-employee directors received an option to purchase from the Company 5,000 shares of Common Stock. The options will vest 25% on May 31, 2012 and the balance will vest ratably over the following 12 quarters, with a maximum term of 10 years. The exercise price per share was $6.27, the closing price of a share of Common Stock on the grant date. Then, pursuant to the terms of the Second Amended and Restated Executive Employment Agreement between Kelly D. Conway and the Company dated April 19, 2011, Mr. Conway was granted an option to purchase from the Company 50,000 shares of Common Stock on June 6, 2011, in connection with the close of the sale of the ICS Business Unit. The options will vest 25% on May 31, 2012 and the balance will vest ratably over the following 12 quarters, with a maximum term of 10 years. The exercise price per share was $6.15, the closing price of a share of Common Stock on the grant date. Lastly, on December 20, 2011, the Board of Directors increased the size of the Board by adding an additional non-employee member, Phillip R. Dur. In connection with his Board appointment, Mr. Dur received an option to purchase 50,000 shares of Common Stock, vesting ratably over 48 months, with a maximum term of 10 years. The exercise price per share was $4.89, the closing price of a share of Common Stock on the grant date.
During fiscal year 2010, a total of 30,000 options were granted to non-employee directors. Each of the six then-current non-employee directors received an option to purchase 5,000 shares of Common Stock that vested 25% on May 31, 2011; the balance vests quarterly over the following three years, with a maximum term of 10 years. The exercise price per share was $6.34, the closing price of a share of Common Stock on the grant date.
During fiscal year 2009, options to purchase a total of 326,000 shares of Common Stock were granted to non-employee directors. On February 18, 2009, each of the five then-current non-employee directors received options to purchase 50,000 shares of Common Stock, vesting in 16 equal quarterly installments, with a maximum term of 10 years. The exercise price per share was $4.25, the closing price of a share of Common Stock on February 18, 2009. Then on March 2, 2009, the Board of Directors resolved to increase the size of the Board by adding an additional non-employee member, appointing David B. Mullen. In connection with his Board appointment, Mr. Mullen received an option to purchase 50,000 shares of Common Stock, vesting ratably over 48 months, with a maximum term of 10 years. The exercise price per share was $4.88, the closing price of a share of Common Stock on March 2, 2009. Lastly, on May 15, 2009, each of the six then-current non-employee directors, with the exception of Mr. Mullen, received an option to purchase 5,000 shares of Common Stock that vested 25% on May 31, 2010; with the balance vesting quarterly over the following three years, with a maximum term of 10 years. Based on his Board appointment date, Mr. Mullen received an option to purchase 1,000 shares of Common Stock. The exercise price per share for all of these May 31, 2010 options was $6.90, the closing price of a share of Common Stock on the grant date.
47
Table of Contents
MATTERSIGHT CORPORATION
NOTES TO CONSOLIDATED FINANCIAL STATEMENTS — (Continued)
Option activity was as follows for the years ended December 26, 2009, January 1, 2011, and December 31, 2011:
| Options | Weighted Average Exercise Price |
Weighted Average Remaining Contractual Life (Years) |
Weighted Average Fair Value of Option Grants |
|||||||||||||
| Outstanding as of December 27, 2008 |
934,402 | $ | 17.45 | 6.1 | ||||||||||||
|
|
|
|||||||||||||||
| Exercisable as of December 27, 2008 |
587,527 | $ | 19.52 | |||||||||||||
|
|
|
|||||||||||||||
| Granted |
326,000 | $ | 4.56 | $ | 2.78 | |||||||||||
| Exercised |
(1,000 | ) | $ | 3.25 | ||||||||||||
| Forfeited |
(28,197 | ) | $ | 38.07 | ||||||||||||
|
|
|
|||||||||||||||
| Outstanding as of December 26, 2009 |
1,231,205 | $ | 13.57 | 6.4 | ||||||||||||
|
|
|
|||||||||||||||
| Exercisable as of December 26, 2009 |
783,542 | $ | 16.47 | |||||||||||||
|
|
|
|||||||||||||||
| Outstanding intrinsic value at December 26, 2009 |
$ | 1.4 | ||||||||||||||
|
|
|
|||||||||||||||
| Exercisable intrinsic value at December 26, 2009 |
$ | 0.8 | ||||||||||||||
|
|
|
|||||||||||||||
| Granted |
30,000 | $ | 6.34 | $ | 3.92 | |||||||||||
| Exercised |
(895 | ) | $ | 2.73 | ||||||||||||
| Forfeited |
(7,918 | ) | $ | 176.96 | ||||||||||||
|
|
|
|||||||||||||||
| Outstanding as of January 1, 2011 |
1,252,392 | $ | 12.37 | 5.5 | ||||||||||||
|
|
|
|||||||||||||||
| Exercisable as of January 1, 2011 |
976,562 | $ | 14.05 | |||||||||||||
|
|
|
|||||||||||||||
| Outstanding intrinsic value at January 1, 2011 |
$ | 1.1 | ||||||||||||||
|
|
|
|||||||||||||||
| Exercisable intrinsic value at January 1, 2011 |
$ | 0.8 | ||||||||||||||
|
|
|
|||||||||||||||
| Granted |
130,000 | $ | 5.69 | $ | 3.44 | |||||||||||
| Exercised |
— | $ | — | |||||||||||||
| Forfeited |
(154,457 | ) | $ | 18.07 | ||||||||||||
|
|
|
|||||||||||||||
| Outstanding as of December 31, 2011 |
1,227,935 | $ | 10.95 | 5.4 | ||||||||||||
|
|
|
|||||||||||||||
| Exercisable as of December 31, 2011 |
986,626 | $ | 12.30 | |||||||||||||
|
|
|
|||||||||||||||
| Outstanding intrinsic value at December 31, 2011 |
$ | 0.3 | ||||||||||||||
|
|
|
|||||||||||||||
| Exercisable intrinsic value at December 31, 2011 |
$ | 0.2 | ||||||||||||||
|
|
|
|||||||||||||||
| For the Fiscal Years Ended | ||||||||||||||
| 2011 | 2010 | 2009 | ||||||||||||
| Total fair value of stock options vested |
$ | 0.6 | $ | 1.2 | $ | 1.4 | ||||||||
| Intrinsic value of stock options exercised |
— | — | — | |||||||||||
| Proceeds received from option exercises |
— | — | — | |||||||||||
As of December 31, 2011, there remains $0.7 million of unrecognized compensation expense related to stock options. These costs are expected to be recognized over a weighted average period of 1.8 years.
48
Table of Contents
MATTERSIGHT CORPORATION
NOTES TO CONSOLIDATED FINANCIAL STATEMENTS — (Continued)
The fair value for options granted during fiscal years 2011, 2010, and 2009, was estimated on the date of grant using a Black Scholes option-pricing model. The Company used the following assumptions:
| For the Fiscal Years Ended | ||||||||||||||
| 2011 | 2010 | 2009 | ||||||||||||
| Risk-free interest rates |
0.9 | % | 1.8 | % | 1.8 | % | ||||||||
| Expected dividend yield |
— | — | — | |||||||||||
| Expected volatility |
67 | % | 68 | % | 67 | % | ||||||||
| Expected lives |
6.0 years | 6.0 years | 6.0 years | |||||||||||
Historical Company information is the primary basis for the selection of expected life, expected volatility, and expected dividend yield assumptions. The risk-free interest rate is selected based on the yields from U.S. Treasury Strips with a remaining term equal to the expected term of the options being valued.
Other Stock Compensation
ICS Performance Unit Awards
On November 3, 2009, the Compensation Committee approved the grant of performance unit awards to certain employees of the ICS Business Unit. The performance period for the awards began on October 1, 2009 and ended on the date of the sale of the ICS Business Unit, which constituted an “acceleration event” under the terms of the award agreement. As required by the award agreement, to determine the value of the performance units and the payout with respect thereto, Mattersight’s Compensation Committee evaluated the ultimate value of the ICS Business Unit arising from its sale (“Business Unit Value”) relative to the baseline value as defined in the award agreement. The Compensation Committee determined, after due consideration, that the sale did not result in Business Unit Value in excess of the baseline value and that, therefore, there will be no payout with respect to the performance units. As a result, for fiscal year 2011, the Company reversed $0.4 million of expense previously recorded for this program. During fiscal years 2010 and 2009, the Company had expensed $0.2 million and $0.2 million, respectively, for this program.
Employee Stock Purchase Plan
The Employee Stock Purchase Plan (the “ESPP”) is intended to qualify as an “employee stock purchase plan” under section 423 of the Internal Revenue Code. Under the ESPP, eligible employees are permitted to purchase shares of Mattersight Common Stock at below-market prices. The purchase period opens on the first day and ends on the last business day of each calendar quarter. A total of 29,554 shares and 39,048 shares were issued under the ESPP during fiscal years 2011 and 2010, respectively. The Company recorded $39 thousand, $41 thousand, and $65 thousand of expense for the ESPP during fiscal years 2011, 2010, and 2009, respectively.
Note Fifteen — Income (Loss) Per Share
The following table sets forth the computation of the income (loss) and shares used in the calculation of basic and diluted income (loss) per share:
| For the Fiscal Years Ended | ||||||||||||
| 2011 | 2010 | 2009 | ||||||||||
| Net income (loss) |
$ | 18.4 | $ | (13.3 | ) | $ | (10.6 | ) | ||||
| Series B Stock fair value over stated value |
(6.5 | ) | — | — | ||||||||
| Series B Stock dividends(1) |
(1.3 | ) | (1.3 | ) | (1.3 | ) | ||||||
|
|
|
|
|
|
|
|||||||
| Net income (loss) available to common stockholders |
$ | 10.6 | $ | (14.6 | ) | $ | (11.9 | ) | ||||
|
|
|
|
|
|
|
|||||||
| Per common share |
||||||||||||
| Basic income (loss) before Series B Stock dividends |
$ | 1.29 | $ | (0.97 | ) | $ | (0.80 | ) | ||||
|
|
|
|
|
|
|
|||||||
| Basic net income (loss) available to common stockholders |
$ | 0.74 | $ | (1.06 | ) | $ | (0.90 | ) | ||||
|
|
|
|
|
|
|
|||||||
| For the Fiscal Years Ended | ||||||||||||
| 2011 | 2010 | 2009 | ||||||||||
| Weighted average shares outstanding (basic and diluted) (in millions) |
14.23 | 13.70 | 13.26 | |||||||||
|
|
|
|
|
|
|
|||||||
| Currently anti-dilutive common stock equivalents(2) (in millions) |
3.25 | 4.00 | 4.23 | |||||||||
|
|
|
|
|
|
|
|||||||
| (1) | The Company’s Board of Directors declared a cash dividend of $0.1785 per share on the Series B Stock, for the dividend periods January 1, 2011 through June 30, 2011, July 1, 2010 through December 31, 2010, and July 1, 2008 through December 31, 2008. The dividend payment of $1.9 million was paid on July 1, 2011. In addition, under the terms of the Settlement Agreement, the Company paid $0.3 million to TCV, representing accrued and unpaid dividends on the Series B Stock. |
49
Table of Contents
MATTERSIGHT CORPORATION
NOTES TO CONSOLIDATED FINANCIAL STATEMENTS — (Continued)
| (2) | In periods in which there was a loss, the dilutive effect of common stock equivalents, which is primarily related to the Series B Stock, was not included in the diluted loss per share calculation as they were antidilutive. |
Note Sixteen — Segments
The Company operated in two business segments, the Behavioral Analytics Service Business Unit and the ICS Business Unit, until May 28, 2011, the date of the close of the sale of the ICS Business Unit, at which point the Company began operating in a single business segment, focused primarily on Behavioral Analytics.
Note Seventeen — Fair Value Measurements
The Company reports certain assets and liabilities at fair value. Fair value is an exit price and establishes a three-tier valuation hierarchy for ranking the quality and reliability of the information used to determine fair values. The first tier, Level 1, uses quoted market prices in active markets for identical assets or liabilities. Level 2 uses inputs, other than quoted market prices for identical assets or liabilities in active markets, which are observable either directly or indirectly. Level 3 uses unobservable inputs in which there are little or no market data, and requires the entity to develop its own assumptions. A financial asset or liability’s classification within the hierarchy is determined based on the lowest level input that is significant to the fair value measurement.
The following table provides the assets and liabilities carried at fair value measured on a recurring basis as of December 31, 2011 and January 1, 2011:
| Fair Value Measurements at December 31, 2011 Using | ||||||||||||||||
| Total carrying value at December 31, 2011 |
Quoted Prices in Active Markets (Level 1) |
Other Observable (Level 2) |
Significant Unobservable (Level 3) |
|||||||||||||
| Money market fund |
$ | 18.8 | $ | 18.8 | $ | — | $ | — | ||||||||
| Fair Value Measurements at January 1, 2011 Using | ||||||||||||||||
| Total carrying value at January 1, 2011 |
Quoted Prices in Active Markets (Level 1) |
Other Observable (Level 2) |
Significant Unobservable (Level 3) |
|||||||||||||
| Money market fund |
$ | 15.8 | $ | 15.8 | $ | — | $ | — | ||||||||
Note Eighteen – Fair Value of Financial Instruments
The carrying values of current assets and liabilities approximated their fair values as of December 31, 2011 and January 1, 2011. The Company considers all highly liquid investments readily convertible into known amounts of cash (with purchased maturities of three months or less) to be cash equivalents.
Note Nineteen — Leases
Capital Leases
The Company acquired $2.5 million and $1.4 million of computer equipment and leasehold improvements using capital leases during fiscal years 2011 and 2010, respectively. These assets were related primarily to investments in the Company’s Behavioral Analytics service. There was $1.8 million, $1.5 million, and $1.3 million of depreciation on capital leases during 2011, 2010, and 2009 respectively. All capital leases are for a term of either thirty or thirty-six months. The liabilities for these capital leases are included in “Other current liabilities” and “Other long-term liabilities” on the balance sheet. The Company expects capital investments to increase between $4.0 million to $5.0 million for fiscal year 2012 and plans on funding approximately $3.2 million to $4.2 million of these purchases with capital leases.
50
Table of Contents
MATTERSIGHT CORPORATION
NOTES TO CONSOLIDATED FINANCIAL STATEMENTS — (Continued)
The following is a schedule, by year, of future minimum lease payments under capital leases, together with the present value of the net minimum lease payments as of December 31, 2011:
| Year |
Amount | |||
| 2012 |
$ | 2.0 | ||
| 2013 |
1.2 | |||
| 2014 |
— | |||
| Thereafter |
— | |||
|
|
|
|||
| Total minimum lease payments |
$ | 3.2 | ||
| Less: estimated executory costs |
(0.2 | ) | ||
|
|
|
|||
| Net minimum lease payments |
$ | 3.0 | ||
| Less: amount representing interest |
(0.2 | ) | ||
|
|
|
|||
| Present value of minimum lease payments |
$ | 2.8 | ||
|
|
|
|||
Capital leases included in equipment and leasehold improvements (see Note Seven):
| As of | ||||||||
| December 31, 2011 |
January 1, 2011 |
|||||||
| Computers and software |
$ | 5.7 | $ | 4.9 | ||||
| Accumulated depreciation and amortization |
(2.8 | ) | (2.7 | ) | ||||
|
|
|
|
|
|||||
| Computers and software, net |
$ | 2.9 | $ | 2.2 | ||||
|
|
|
|
|
|||||
Capital leases consisted of the following:
| As of | ||||||||
| December 31, 2011 |
January 1, 2011 |
|||||||
| Other current liabilities |
$ | 1.7 | $ | 1.3 | ||||
| Other long-term liabilities |
1.1 | 0.9 | ||||||
|
|
|
|
|
|||||
| Total |
$ | 2.8 | $ | 2.2 | ||||
|
|
|
|
|
|||||
Operating Leases
The Company leases various office facilities under leases expiring at various dates through February 28, 2015. Additionally, the Company leases various property and office equipment under operating leases, generally under 3 year terms, expiring at various dates. Rental expense for all operating leases approximated $1.1 million, $1.2 million, and $1.3 million, for fiscal years ended 2011, 2010, and 2009, respectively. These amounts exclude rental payments related to office space reductions, which were $0.1 million, $0.1 million, and $0.1 million in fiscal years 2011, 2010, and 2009 respectively.
Future minimum rental commitments under non-cancelable operating leases with terms in excess of one year are as follows:
| Year |
Amount | |||
| 2012 |
$ | 0.5 | ||
| 2013 |
0.3 | |||
| 2014 |
0.3 | |||
| 2015 |
0.3 | |||
| 2016 |
0.2 | |||
| Thereafter |
0.1 | |||
|
|
|
|||
| Total minimum payments required |
$ | 1.7 | ||
|
|
|
|||
Note Twenty — Litigation and Other Contingencies
The Company is a party to various agreements, including substantially all major services agreements, under which it may be obligated to indemnify the other party with respect to certain matters, including, but not limited to, indemnification against third-party claims of infringement of intellectual property rights with respect to software and other deliverables provided by the Company in the course of providing services to its clients. These obligations may be subject to various limitations on the remedies available to the other party, including, without limitation, limits on the amounts recoverable and the time during which claims may be made, and may be supported
51
Table of Contents
MATTERSIGHT CORPORATION
NOTES TO CONSOLIDATED FINANCIAL STATEMENTS — (Continued)
by indemnities given to the Company by applicable third parties. Payment by the Company under these indemnification clauses is generally subject to the other party making a claim that is subject to challenge by the Company and dispute resolution procedures specified in the particular agreement. Historically, the Company has not been obligated to pay any claim for indemnification under its agreements and management is not aware of future indemnification payments that it would be obligated to make.
Under its By-Laws, subject to certain exceptions, the Company has agreed to indemnify its officers and directors for certain events or occurrences while the officer or director is, or was, serving at its request in such capacity or in certain related capacities. The Company has separate indemnification agreements with each of its directors and officers that requires it, subject to certain exceptions, to indemnify them to the fullest extent authorized or permitted by its By-Laws and the Delaware General Corporation Law. The maximum potential amount of future payments the Company could be required to make under these indemnification agreements is unlimited; however, the Company has a director and officer liability insurance policy that limits its exposure and enables it to recover a portion of any future amounts paid. As a result of its insurance policy coverage, the Company believes the estimated fair value of these indemnification agreements is minimal. The Company has no liabilities recorded for these agreements as of December 31, 2011.
Note Twenty-One — Quarterly Data (Unaudited)
| For the Fiscal Year Ended 2011 | ||||||||||||||||||||
| 1st | 2nd | 3rd | 4th | Year | ||||||||||||||||
| Total revenue |
$ | 6.6 | $ | 6.7 | $ | 7.1 | $ | 8.7 | $ | 29.1 | ||||||||||
| Gross margin |
$ | 3.4 | $ | 3.5 | $ | 3.8 | $ | 4.9 | $ | 15.6 | ||||||||||
| Operating loss |
$ | (4.9 | )(1) | $ | (4.3 | )(1) | $ | (4.3 | )(1) | $ | (3.1 | )(1) | $ | (16.6 | )(1) | |||||
| Loss from continuing operations |
$ | (4.7 | )(1) | $ | (0.8 | )(1) | $ | (2.5 | )(1) | $ | (2.6 | )(1) | $ | (10.6 | )(1) | |||||
| Income (loss) from discontinued operations |
$ | 0.1 | $ | 28.1 | $ | (0.5 | ) | $ | 1.2 | $ | 28.9 | |||||||||
| Net (loss) income |
$ | (4.6 | )(1) | $ | 27.3 | (1) | $ | (3.0 | )(1) | $ | (1.3 | )(1) | $ | 18.4 | (1) | |||||
| Net (loss) income available to common stockholders |
$ | (4.9 | )(1) | $ | 27.0 | (1) | $ | (3.3 | )(1) | $ | (8.2 | )(1) | $ | 10.6 | (1) | |||||
| Basic loss from continuing operations per share |
$ | (0.34 | ) | $ | (0.05 | ) | $ | (0.18 | ) | $ | (0.17 | ) | $ | (0.74 | ) | |||||
| Basic income (loss) from discontinued operations per share |
$ | 0.01 | $ | 1.99 | $ | (0.03 | ) | $ | 0.08 | $ | 2.03 | |||||||||
| Basic net (loss) income per share available to common stockholders |
$ | (0.36 | ) | $ | 1.91 | $ | (0.23 | ) | $ | (0.56 | ) | $ | 0.74 | |||||||
| Diluted loss from continuing operations per share |
$ | (0.34 | ) | $ | (0.05 | ) | $ | (0.18 | ) | $ | (0.17 | ) | $ | (0.74 | ) | |||||
| Diluted income (loss) from discontinued operations per share |
$ | 0.01 | $ | 1.99 | $ | (0.03 | ) | $ | 0.08 | $ | 2.03 | |||||||||
| Diluted net (loss) income per share available to common stockholders |
$ | (0.36 | ) | $ | 1.91 | $ | (0.23 | ) | $ | (0.56 | ) | $ | 0.74 | |||||||
| Shares used to calculate basic and diluted net (loss) income per share (in millions) |
13.95 | 14.11 | 14.30 | 14.54 | 14.23 | |||||||||||||||
| For the Fiscal Year Ended 2010 | ||||||||||||||||||||
| 1st | 2nd | 3rd | 4th | Year | ||||||||||||||||
| Total revenue |
$ | 8.2 | $ | 7.3 | $ | 7.6 | $ | 7.8 | $ | 30.9 | ||||||||||
| Gross margin |
$ | 3.6 | $ | 3.4 | $ | 3.8 | $ | 4.0 | $ | 14.8 | ||||||||||
| Operating loss |
$ | (4.7 | )(3) | $ | (4.8 | )(3) | $ | (4.4 | )(3) | $ | (4.0 | )(3) | $ | (17.9 | )(3) | |||||
| Loss from continuing operations |
$ | (4.8 | )(3) | $ | (4.5 | )(3) | $ | (3.8 | )(3) | $ | (3.2 | )(3) | $ | (16.3 | )(3) | |||||
| (Loss) income on discontinued operations |
$ | (0.3 | )(2) | $ | 0.8 | $ | 1.1 | $ | 1.4 | $ | 3.0 | (2) | ||||||||
| Net loss |
$ | (5.0 | )(3) | $ | (3.7 | )(3) | $ | (2.8 | )(3) | $ | (1.8 | )(3) | $ | (13.3 | )(3) | |||||
| Net loss available to common stockholders |
$ | (5.4 | )(3) | $ | (4.0 | )(3) | $ | (3.1 | )(3) | $ | (2.1 | )(3) | $ | (14.6 | )(3) | |||||
| Basic loss from continuing operations per share |
$ | (0.36 | ) | $ | (0.33 | ) | $ | (0.27 | ) | $ | (0.23 | ) | $ | (1.19 | ) | |||||
| Basic (loss) income from discontinued operations per share |
$ | (0.02 | ) | $ | 0.06 | $ | 0.08 | $ | 0.10 | $ | 0.22 | |||||||||
| Basic net loss per share available to common stockholders |
$ | (0.40 | ) | $ | (0.30 | ) | $ | (0.22 | ) | $ | (0.15 | ) | $ | (1.06 | ) | |||||
| Diluted loss from continuing operations per share |
$ | (0.36 | ) | $ | (0.33 | ) | $ | (0.27 | ) | $ | (0.23 | ) | $ | (1.19 | ) | |||||
| Diluted (loss) income from discontinued operations per share |
$ | (0.02 | ) | $ | 0.06 | $ | 0.08 | $ | 0.10 | $ | 0.22 | |||||||||
| Diluted net loss per share available to common stockholders |
$ | (0.40 | ) | $ | (0.30 | ) | $ | (0.22 | ) | $ | (0.15 | ) | $ | (1.06 | ) | |||||
| Shares used to calculate basic and diluted net loss per share (in millions) |
13.46 | 13.69 | 13.78 | 13.87 | 13.70 | |||||||||||||||
| (1) | Includes $4 thousand of expense, $0.4 million of income, $0.1 million of expense, $40 thousand of expense, for the first, second, third, and fourth quarters of fiscal year 2011, respectively, and $0.3 million of income for fiscal year 2011 primarily related to the favorable renegotiation of an office lease and severance and related costs associated with cost reduction plans. |
52
Table of Contents
MATTERSIGHT CORPORATION
NOTES TO CONSOLIDATED FINANCIAL STATEMENTS — (Continued)
| (2) | Includes $0.1 million for fiscal year 2010 related to the sale of a subsidiary in Switzerland. |
| (3) | Includes $0.1 million, $0.1 million, $0.1 million, $0.2 million and $0.5 million of expense related to severance and related costs for the first, second, third, and fourth quarters of fiscal year 2010, and fiscal year 2010, respectively associated with cost reduction plans and an adjustment to sublease recoveries. |
53
Table of Contents
MATTERSIGHT CORPORATION
SCHEDULE II — VALUATION AND QUALIFYING ACCOUNTS
(In millions)
| Description of Allowance and Reserves |
Balance at Beginning of Period |
Additions Charged to Costs and Expenses |
Additions Charged to Other Accounts |
Deductions | Balance at End of Period |
|||||||||||||||
| Valuation allowance for doubtful accounts: |
||||||||||||||||||||
| Fiscal year ended December 31, 2011 |
$ | — | — | — | — | $ | — | |||||||||||||
| Fiscal year ended January 1, 2011 |
$ | — | — | — | — | $ | — | |||||||||||||
| Fiscal year ended December 26, 2009 |
$ | — | — | — | — | $ | — | |||||||||||||
| Valuation allowance for deferred tax assets: |
||||||||||||||||||||
| Fiscal year ended December 31, 2011 |
$ | 62.7 | (6.9 | ) | — | — | $ | 55.8 | ||||||||||||
| Fiscal year ended January 1, 2011 |
$ | 58.4 | 4.3 | — | — | $ | 62.7 | |||||||||||||
| Fiscal year ended December 26, 2009 |
$ | 56.8 | 1.6 | — | — | $ | 58.4 | |||||||||||||
54
Table of Contents
| Item 9. | Changes in and Disagreements with Accountants on Accounting and Financial Disclosure. |
Not applicable.
| Item 9A. | Controls and Procedures. |
(a) Evaluation of Disclosure Controls and Procedures
Based on their evaluation for the period covered by this Form 10-K, Mattersight’s Chief Executive Officer and Chief Financial Officer have concluded that, as of December 31, 2011, the Company’s disclosure controls and procedures (as defined in Rule 13a-15(e) under the Securities Exchange Act of 1934, as amended) are effective.
(b) Management’s Annual Report on Internal Control over Financial Reporting
Mattersight’s management is responsible for establishing and maintaining adequate internal control over financial reporting to provide reasonable assurance regarding the reliability of our financial reporting and the preparation of financial statements for external purposes in accordance with GAAP.
Due to its inherent limitations, internal control over financial reporting may not prevent or detect misstatements. Also, projections of any evaluation of effectiveness to future periods are subject to the risk that controls may become inadequate due to changes in conditions, or that the degree of compliance with the policies or procedures may deteriorate.
The Company conducted its evaluation of the effectiveness of internal control over financial reporting using the criteria set forth by the Committee of Sponsoring Organizations of the Treadway Commission (COSO) in Internal Control – Integrated Framework. Based on its evaluation, our management concluded that our internal control over financial reporting was effective as of the end of the period covered by this Form 10-K.
(c) Attestation Report of the Registered Public Accounting Firm
Grant Thornton LLP, an independent registered public accounting firm, has audited the Consolidated Financial Statements included in this Form 10-K and, as part of their audit, has issued its report, included herein, on the effectiveness of our internal control over financial reporting. See “Report of Grant Thornton LLP Independent Registered Public Accounting Firm” on page 24, which is incorporated herein by reference.
(d) Changes in Internal Control over Financial Reporting
There has been no change in Mattersight’s internal control over financial reporting that occurred during the fourth quarter of fiscal year 2011 that has materially affected, or is reasonably likely to materially affect, Mattersight’s internal control over financial reporting.
| Item 9B. | Other Information. |
Not applicable.
| Item 10. | Directors, Executive Officers and Corporate Governance. |
For information about our corporate Directors and the committees of our Board of Directors, see the captions “Election of Directors” and “Security Ownership of Certain Beneficial Owners and Management” in the Proxy Statement to be filed by Mattersight for its 2012 Annual Meeting of Stockholders, which is incorporated herein by reference in response to this item.
The following table includes the name, age (as of March 15, 2012), current position, and term of office of each of our executive officers.
| Name |
Age | Current Position |
Executive Officer Since |
|||||
| Kelly D. Conway* |
55 | President and Chief Executive Officer | 1999 | |||||
| Christopher J. Danson |
44 | Executive Vice President of Delivery | 2011 | ** | ||||
| Karen Bolton |
47 | Executive Vice President of Client Management | 2011 | ** | ||||
| William B. Noon |
47 | Vice President and Chief Financial Officer | 2009 | |||||
| Christine R. Carsen |
41 | Vice President, General Counsel and Corporate Secretary | 2009 | |||||
| David R. Gustafson |
34 | Vice President of Marketing and Product Management | 2012 | |||||
| * | Member of the Board of Directors |
55
Table of Contents
| ** | Mr. Danson was previously a named executive officer from December 2004 through February 2008 and Ms. Bolton was previously a named executive officer from September 2003 through February 2008. In February 2008, due to changes in their respective roles in connection with Company restructuring, it was determined that they no longer met the criteria therefor. After the Company’s divestiture of the ICS Business Unit and changes in their respective roles in connection therewith, it was determined that Mr. Danson and Ms. Bolton once again qualify as named executive officers. |
Except as required by individual employment agreements between executive officers and the Company, there exists no arrangement or understanding between any executive officer and any other person pursuant to which such executive officer was elected. Each executive officer serves until his or her removal or resignation.
The principal business experience of the executive officers for at least the last five years is as follows:
Kelly D. Conway has been the President and Chief Executive Officer and a Director of Mattersight, which was spun out of Technology Solutions Company (“TSC”) in 2000, since its incorporation in May 1999. Mr. Conway joined TSC in November 1993 as Senior Vice President, assumed the position of Executive Vice President in July 1995, and became Group President in October 1998. Prior to joining TSC, Mr. Conway served as a Partner in the management consulting firm of Spencer, Shenk and Capers and also held various positions, including President and Chief Executive Officer, with Telcom Technologies, a manufacturer of automatic call distribution equipment.
Christopher J. Danson has been Vice President of Delivery since June 2011. Effective February 2012, Mr. Danson’s title changed to Executive Vice President of Delivery. Mr. Danson has spent more than 18 years with Mattersight, having spent the first 7 years of his tenure with TSC. Prior to joining Mattersight, Mr. Danson worked as a Senior Systems Analyst at AT&T and at Whirlpool Corporation.
Karen Bolton has been Vice President of Client Management since June 2011. Effective February 2012, Ms. Bolton’s title changed to Executive Vice President of Client Management. Ms. Bolton joined Mattersight in October 1998. Prior to joining Mattersight, Ms. Bolton worked for IBM Global Services. Prior to joining IBM, she had been a member of a number of financial services institutions within Australia in various information technology roles.
William B. Noon has been Vice President and Chief Financial Officer of Mattersight since February 2009. Mr. Noon held the position of Vice President and Controller of Mattersight from 2004 until his appointment as Chief Financial Officer in February 2009. Prior to that time, he was Corporate Controller of Mattersight from 2003 to 2004 and Director, Financial Planning and Treasury, from 2000 to 2003.
Christine R. Carsen has been Vice President, General Counsel and Corporate Secretary of Mattersight since May 2011. Ms. Carsen held the position of Vice President, Associate General Counsel, and Chief Privacy Officer from September 2007, when she joined the Company, and was appointed Corporate Secretary in February 2009. Prior to joining Mattersight, Ms. Carsen was a Partner at Winston & Strawn LLP from 2005 to 2007, having joined the firm as an associate in 2001. During her time at Winston & Strawn, Ms. Carsen focused on information-technology transactions, privacy matters, and general corporate and commercial transactions.
David R. Gustafson was promoted to the position of Vice President of Marketing and Product Management in 2012. In this role, Mr. Gustafson has responsibility for marketing, product management, sales support, and strategic partnerships and alliances. In his twelve years at Mattersight, Mr. Gustafson has held a number of positions, most recently Vice President of Business Delivery, responsible for the deployment and support of Mattersight’s solutions. Prior to joining Mattersight, Mr. Gustafson worked as a financial analyst at ABN AMRO North America in the office of the CFO.
Mattersight Corporation maintains a code of conduct, business principles, and ethical behavior (the “Code of Conduct”) applicable to all of our directors, officers, and other employees, including our Chief Executive Officer and Chief Financial Officer (who serves as both our principal financial officer and principal accounting officer). This Code of Conduct addresses ethical conduct, SEC disclosure, legal compliance, and other matters as contemplated by Section 406 of the Sarbanes-Oxley Act of 2002. A copy of the Code of Conduct is available on our website at www.Mattersight.com. We will make a copy of it available to any person, without charge, upon written request to Mattersight Corporation, 200 S. Wacker Drive, Suite 820, Chicago, Illinois 60606, Attn: Corporate Secretary. To the extent permitted by applicable rules of the NASDAQ Global Market, we intend to satisfy the disclosure requirement under Item 5.05 of Form 8-K regarding amendments to or waivers of the Code of Conduct for our Chief Executive Officer or Chief Financial Officer by posting such information on our website.
| Item 11. | Executive Compensation. |
The information under “Compensation Discussion and Analysis,” “Executive Compensation,” and “Director Compensation” in the Proxy Statement to be filed by the Company for its 2012 Annual Meeting of Stockholders is incorporated herein by reference in response to this item.
56
Table of Contents
| Item 12. | Security Ownership of Certain Beneficial Owners and Management and Related Stockholder Matters. |
The information under the heading “Security Ownership of Certain Beneficial Owners and Management — Beneficial Ownership Information” in the Proxy Statement to be filed by the Company for its 2012 Annual Meeting of Stockholders is incorporated herein by reference in response to this item.
The following table shows, as of December 31, 2011, information regarding outstanding awards under all compensation plans of the Company (including individual compensation arrangements) under which equity securities of the Company may be delivered:
| Plan Category |
Number of Securities to be Issued Upon Exercise of Outstanding Options, Warrants and Rights(1) |
Weighted Average Exercise Price of Outstanding Options, Warrants and Rights |
Number of Securities Remaining Available for Future Issuance(1) (2) |
|||||||||
| Equity compensation plans approved by security holders |
1,227,935 | $ | 10.95 | 897,513 | (3) | |||||||
| Equity compensation plans not approved by security holders(4) |
— | $ | — | — | ||||||||
|
|
|
|
|
|||||||||
| Total |
1,227,935 | $ | 10.95 | 897,513 | (5) | |||||||
|
|
|
|
|
|||||||||
| (1) | Reflects number of shares of the Company’s Common Stock. |
| (2) | All of the securities available for future issuance listed herein may be issued other than upon the exercise of outstanding options, warrants, or similar rights. All of these shares are available for award in the form of restricted stock, bonus stock, or similar awards under the Company’s applicable equity compensation plans. |
| (3) | The Company’s plan that has been approved by its stockholders is the Mattersight Corporation 1999 Stock Incentive Plan, which includes an “automatic increase” feature whereby, as of the first day of each fiscal year, the number of shares of Common Stock available for awards, other than incentive stock options, automatically increases by an amount equal to five percent (5%) of the number of shares of Common Stock then outstanding. |
| (4) | There are currently no equity compensation plans that have not been approved by security holders. |
| (5) | Does not include (i) shares of restricted Common Stock held by employees, of which 1,255,641 shares were issued and outstanding as of December 31, 2011, which are included in the amount of issued and outstanding shares or (ii) 30,472 shares of Common Stock issuable pursuant to installment stock awards granted to employees, which (subject to specified conditions) will be issued in the future in consideration of the employees’ services to the Company. |
| Item 13. | Certain Relationships and Related Transactions, and Director Independence. |
The information under the heading “Transactions with Related Persons” in the Proxy Statement to be filed by Mattersight for its 2012 Annual Meeting of Stockholders is incorporated herein by reference in response to this item.
| Item 14. | Principal Accounting Fees and Services. |
The information under the caption “Ratification of Selection of Independent Public Accountants—Principal Accounting Fees and Services” in the Proxy Statement to be filed by the Company for its 2012 Annual Meeting of Stockholders is incorporated herein by reference in response to this item.
57
Table of Contents
| Item 15. | Exhibits and Financial Statement Schedules. |
| (a) | Documents filed as part of this report: |
| (1) | Financial Statements. |
The consolidated financial statements filed as part of this report are listed and indexed under Item 8 of this Form 10-K and such list is incorporated herein by reference.
| (2) | Financial Statement Schedule. |
The financial statement schedule filed as part of this report is listed and indexed under Item 8 of this Form 10-K and is incorporated herein by reference. We have omitted financial statement schedules other than that listed under Item 8 because such schedules are not required or applicable.
| (3) | Exhibits. |
The list of exhibits filed with or incorporated by reference into this report is contained in the Exhibit Index to this report on Page I-1, which is incorporated herein by reference.
58
Table of Contents
Pursuant to the requirements of Section 13 or 15(d) of the Securities Exchange Act of 1934, the registrant has duly caused this Annual Report on Form 10-K to be signed on its behalf by the undersigned, thereunto duly authorized, on March 15, 2012.
| MATTERSIGHT CORPORATION | ||
| By | /S/ KELLY D. CONWAY | |
| Kelly D. Conway | ||
| President and Chief Executive Officer | ||
Pursuant to the requirements of the Securities Exchange Act of 1934, this Annual Report on Form 10-K has been signed below by the following persons on behalf of the registrant in the capacities indicated on March 15, 2012.
| Name |
Capacity | |
| /S/ KELLY D. CONWAY Kelly D. Conway |
Director, President and Chief Executive Officer (Principal Executive Officer) | |
| * Tench Coxe |
Chairman of the Board and Director | |
| * Philip R. Dur |
Director | |
| * Henry J. Feinberg |
Director | |
| * John T. Kohler |
Director | |
| * David B. Mullen |
Director | |
| * Michael J. Murray |
Director | |
| * John C. Staley |
Director | |
| /S/ WILLIAM B. NOON William B. Noon |
Vice President and Chief Financial Officer (Principal Financial and Accounting Officer) | |
| *By: | /s/ WILLIAM B. NOON | |
| William B. Noon, Attorney-in-Fact | ||
59
Table of Contents
We are including as exhibits to this Annual Report on Form 10-K certain documents that we have previously filed with the SEC as exhibits, and we are incorporating such documents as exhibits herein by reference from the respective filings identified in parentheses below. The management contracts and compensatory plans or arrangements required to be filed as exhibits to this Annual Report on Form 10-K pursuant to Item 14(c) are those listed below as Exhibits and noted by an asterisk.
| Exhibit No. |
Description of Exhibit | |
| 2.1 | Acquisition Agreement dated as of March 17, 2011 by and among Magellan Acquisition Sub, LLC, TeleTech Holdings, Inc. and Mattersight Corporation (filed on May 12, 2011 as Exhibit 10.1 to Mattersight’s Quarterly Report on Form 10-Q for the quarter ended April 2, 2011). | |
| 2.2 | Amendment No. 1 to Acquisition Agreement, dated as of May 27, 2011, by and among TeleTech Holdings, Inc., Magellan Acquisition Sub, LLC and Mattersight Corporation (filed on August 11, 2011 as Exhibit 10.2 to Mattersight’s Quarterly Report on Form 10-Q for the quarter ended June 30, 2011). | |
| 2.3 | Amendment No. 2 to Acquisition Agreement, dated as of June 20, 2011, by and among TeleTech Holdings, Inc., eLoyalty LLC (fka Magellan Acquisition Sub, LLC), and Mattersight Corporation (filed on August 11, 2011 as Exhibit 10.3 to Mattersight’s Quarterly Report on Form 10-Q for the quarter ended June 30, 2011). | |
| 2.4 | Amendment No. 3 to Acquisition Agreement, dated as of July 26, 2011, by and among TeleTech Holdings, Inc., eLoyalty LLC (fka Magellan Acquisition Sub, LLC), and Mattersight Corporation (filed on August 11, 2011 as Exhibit 10.4 to Mattersight’s Quarterly Report on Form 10-Q for the quarter ended June 30, 2011). | |
| 2.5 | Amendment No. 4 to Acquisition Agreement, dated as of September 7, 2011, by and among TeleTech Holdings, Inc., eLoyalty, LLC (f/k/a Magellan Acquisition Sub, LLC) and Mattersight Corporation (filed on November 10, 2011 as Exhibit 10.1 to Mattersight’s Quarterly Report on Form 10-Q for the quarter ended October 1, 2011). | |
| 2.6 | Amendment No. 5 to Acquisition Agreement, dated as of October 17, 2011, by and among TeleTech Holdings, Inc., eLoyalty, LLC (f/k/a Magellan Acquisition Sub, LLC) and Mattersight Corporation (filed on November 10, 2011 as Exhibit 10.2 to Mattersight’s Quarterly Report on Form 10-Q for the quarter ended October 1, 2011). | |
| 3(i).1 | Certificate of Incorporation of Mattersight Corporation, as amended (filed as Exhibit 3.1 to Mattersight’s Registration Statement on Form S-1 (Registration No. 333-94293) (the “S-1”)). | |
| 3(i).2 | Certificate of Amendment to Mattersight’s Certificate of Incorporation effective December 19, 2001 (filed as Exhibit 3.3 to Mattersight’s Annual Report on Form 10-K for the year ended December 29, 2001). | |
| 3(i).3 | Certificate of Amendment to Mattersight’s Certificate of Incorporation effective December 19, 2001 (filed as Exhibit 3.4 to Mattersight’s Annual Report on Form 10-K for the year ended December 29, 2001). | |
| 3(i).4 | Certificate of Amendment to Mattersight Corporation’s Certificate of Incorporation effective May 31, 2011 (filed on May 31, 2011 as Exhibit 3.1 to Mattersight Corporation’s Current Report on Form 8-K). | |
| 3(ii).1 | By-Laws of Mattersight Corporation (filed as Exhibit 3.2 to the S-1). | |
| 3(ii).2 | Amendment to By-Laws of Mattersight Corporation (filed on November 16, 2007 as Exhibit 3.1 to Mattersight’s Current Report on Form 8-K). | |
| 4.1 | Certificate of Designation of Series A Junior Participating Preferred Stock of the Company (included as Exhibit 4.2 to Amendment No. 1 to Mattersight’s Registration Statement on Form 8-A (File No. 0-27975) filed with the SEC on March 24, 2000). | |
| 4.2 | Certificate of Increase of Series A Junior Participating Preferred Stock of Mattersight, filed December 19, 2001 (filed as Exhibit 3.5 to Mattersight’s Annual Report on Form 10-K for the year ended December 29, 2001). | |
| 4.3 | Certificate of Designation of 7% Series B Convertible Preferred Stock of Mattersight, filed December 19, 2001 (filed as Exhibit 3.6 to Mattersight’s Annual Report on Form 10-K for the year ended December 29, 2001). | |
I-1
Table of Contents
| Exhibit No. |
Description of Exhibit | |
| 4.4 | Certificate of Adjustment dated January 10, 2002 (filed as Exhibit 4.3 to Mattersight’s Annual Report on Form 10-K for the year ended December 29, 2001). | |
| 4.5 | Form of Common Stock Certificate (incorporated by reference to Exhibit No. 4.1 to our Registration Statement on From S-1/A filed on August 8, 2006). | |
| 4.6 | Registration Rights Agreement dated December 19, 2011 by and between Mattersight Corporation and IGC Fund VI, L.P. (filed on December 22, 2011 as Exhibit 10.5 to Mattersight Corporation’s Current Report on Form 8-K). | |
| 10.1 | Purchase Agreement dated December 19, 2011 by and between Mattersight Corporation and IGC Fund VI, L.P. (filed on December 22, 2011 as Exhibit 10.4 to Mattersight Corporation’s Current Report on Form 8-K). | |
| 10.2 | Purchase and Settlement Agreement dated December 19, 2011, by and among Mattersight Corporation, TCV III (GP), TCV III (Q), L.P., TCV III, L.P., TCV III Strategic Partners, L.P., TCV IV, L.P., and TCV IV Strategic Partners, L.P. (filed on December 22, 2011 as Exhibit 10.1 to Mattersight’s Current Report on Form 8-K). | |
| 10.3 | Form of Promissory Note between applicable TCV entity and Mattersight Corporation (filed on December 22, 2011 as Exhibit 10.2 to Mattersight’s Current Report on Form 8-K). | |
| 10.4 | Form of Letter Agreement between applicable holder of Series B Stock and Mattersight Corporation (filed on December 22, 2011 as Exhibit 10.3 to Mattersight’s Current Report on Form 8-K). | |
| 10.5 | Dispute Resolution Agreement effective April 19, 2011 by and between Mattersight Corporation and TCV III, G.P., TCV III (Q), L.P., TCV III, L.P., TCV Strategic Partners, LP., TCV IV, L.P. and TCV IV Strategic Partners, L.P. (filed on May 12, 2011 as Exhibit 10.2 to Mattersight’s Quarterly Report on Form 10-Q for the quarter ended April 2, 2011). | |
| 10.6* | Mattersight Corporation 1999 Stock Incentive Plan (as Amended and Restated as of May 15, 2008) (filed as an Exhibit to Mattersight’s Definitive Proxy Statement on Schedule Def 14A). | |
| 10.7* | Form of Restricted Stock Award Agreement between applicable participant and Mattersight (filed as Exhibit 10.23 to Mattersight’s Annual Report on Form 10-K for the year ended January 1, 2005). | |
| 10.8* | Form of Installment Stock Award Agreement between applicable participant and Mattersight (filed as Exhibit 10.24 to Mattersight’s Annual Report on Form 10-K for the year ended January 1, 2005). | |
| 10.9* | Form of Option Award Agreement between applicable participant and Mattersight (filed as Exhibit 10.8 to Mattersight’s Annual Report on Form 10-K for the year ended December 30, 2006). | |
| 10.10 | Loan Agreement, dated as of December 24, 2010, between Bank of America, N.A. and Mattersight Corporation (filed as Exhibit 10.25 to Mattersight’s Annual Report on Form 10-K for the year ended January 1, 2011). | |
| 10.11+ | Amendment No. 1 to Loan Agreement, dated as of December 21, 2011, between Bank of America, N.A. and Mattersight Corporation. | |
| 10.12* | Form of Indemnification Agreement entered into between Mattersight Corporation and participant (filed as Exhibit 10.25 to Mattersight’s Annual Report on Form 10-K for the year ended December 27, 2008). | |
| 10.13* | Second Amended and Restated Employment Agreement, effective as of April 19, 2011 between Kelly D. Conway and Mattersight Corporation (filed as Exhibit 10.3 to Mattersight’s Quarterly Report on Form 10-Q for the quarter ended April 2, 2011). | |
| 10.14* | Employment Agreement, effective as of September 4, 2007 between Christine Carsen and Mattersight Corporation (filed as Exhibit 10.33 to Mattersight’s Annual Report on Form 10-K for the year ended December 26, 2009). | |
| 10.15* | Employment Agreement, effective as of April 4, 2005 between William B. Noon and Mattersight Corporation (filed as Exhibit 10.34 to Mattersight’s Annual Report on Form 10-K for the year ended December 26, 2009). | |
I-2
Table of Contents
| Exhibit No. |
Description of Exhibit | |
| 10.16* | First Amendment to Employment Agreement, effective as of August 15, 2007, between William B. Noon and Mattersight Corporation (filed as Exhibit 10.35 to Mattersight’s Annual Report on Form 10-K for the year ended December 26, 2009). | |
| 10.17* | Amended Executive Employment Agreement, effective as of January 8, 2007, between Karen Bolton and Mattersight Corporation (filed as Exhibit 10.26 to Mattersight’s Annual Report on Form 10-K for the year ended December 30, 2006). | |
| 10.18* | Amended and Restated Executive Employment Agreement, effective as of September 8, 2008, between Christopher J. Danson and Mattersight Corporation (filed as Exhibit 10.31 to Mattersight’s Annual Report on Form 10-K for the year ended December 27, 2008). | |
| 10.19* | Employment Agreement, effective as of June 6, 2011, between Tyson Marian and Mattersight Corporation (filed on August 11, 2011 as Exhibit 10.1 to Mattersight’s Quarterly Report on Form 10-Q for the quarter ended June 30, 2011). | |
| 10.20+ | Employment Agreement, effective as of April 1, 2006, and First Amendment to Employment Agreement, effective July 26, 2007, between David Gustafson and Mattersight Corporation. | |
| 10.21+ | Summary of Director Compensation. | |
| 10.22+ | Summary of 2012 Executive Officer Compensation. | |
| 21.1+ | Subsidiaries of Mattersight Corporation. | |
| 23.1+ | Consent of Grant Thornton LLP. | |
| 24.1+ | Power of Attorney from Tench Coxe, Director. | |
| 24.2+ | Power of Attorney from Philip R. Dur, Director. | |
| 24.3+ | Power of Attorney from Henry J. Feinberg, Director. | |
| 24.4+ | Power of Attorney from John T. Kohler, Director. | |
| 24.5+ | Power of Attorney from Michael J. Murray, Director. | |
| 24.6+ | Power of Attorney from John C. Staley, Director. | |
| 24.7+ | Power of Attorney from David B. Mullen, Director. | |
| 31.1+ | Certification of Kelly D. Conway under Section 302 of the Sarbanes-Oxley Act of 2002. | |
| 31.2+ | Certification of William B. Noon under Section 302 of the Sarbanes-Oxley Act of 2002. | |
| 32.1+ | Certification of Kelly D. Conway and William B. Noon under Section 906 of the Sarbanes-Oxley Act of 2002. | |
| 101+ | The following financial information from the Company’s Annual Report on Form 10-K for the year ended December 31, 2011, is formatted in eXtensible Business Reporting Language (XBRL): (i) Consolidated Balance Sheets as of December 31, 2011 and January 1, 2011; (ii) Consolidated Statements of Operations for the fiscal years ended December 31, 2011, January 1, 2011, and December 26, 2009; (iii) Consolidated Statements of Cash Flows for the fiscal years ended December 31, 2011, January 1, 2011, and December 26, 2009; (iv) Consolidated Statements of Changes in Stockholders’ Equity (Deficit) and Comprehensive Loss for the fiscal years ended December 31, 2011, January 1, 2011, and December 26, 2009; (v) notes to the Consolidated Financial Statements; and (vi) Financial Statement Schedule II. | |
| + | Filed herewith. |
I-3
Table of Contents
| * | Represents a management contract or compensatory plan or arrangement. |
| ** | The following XBRL information, is being furnished and not filed for purposes of Section 18 of the Securities Exchange Act of 1934, as amended, and is not incorporated by reference into any registration statement under the Securities Act of 1933, as amended. |
I-4