Attached files
| file | filename |
|---|---|
| EXCEL - IDEA: XBRL DOCUMENT - DATALINK CORP | Financial_Report.xls |
| EX-32.1 - EX-32.1 - DATALINK CORP | a2208070zex-32_1.htm |
| EX-23.1 - EX-23.1 - DATALINK CORP | a2208070zex-23_1.htm |
| EX-31.1 - EX-31.1 - DATALINK CORP | a2208070zex-31_1.htm |
| EX-10.18 - EX-10.18 - DATALINK CORP | a2208070zex-10_18.htm |
| EX-10.19 - EX-10.19 - DATALINK CORP | a2208070zex-10_19.htm |
QuickLinks -- Click here to rapidly navigate through this document
UNITED STATES
SECURITIES AND EXCHANGE COMMISSION
Washington, D. C. 20549
FORM 10-K
| (Mark one) | ||
ý |
ANNUAL REPORT PURSUANT TO SECTION 13 OR 15(D) OF THE SECURITIES EXCHANGE ACT OF 1934 |
|
FOR THE FISCAL YEAR ENDED DECEMBER 31, 2011 |
||
OR |
||
o |
TRANSITION REPORT PURSUANT TO SECTION 13 OR 15(D) OF THE SECURITIES EXCHANGE ACT OF 1934 |
|
For The Transition Period From To |
||
Commission file number: 000-29758
DATALINK CORPORATION
(Exact name of registrant as specified in its charter)
| MINNESOTA | 41-0856543 | |
| (State or other jurisdiction of incorporation) | (IRS Employer Identification Number) |
8170 UPLAND CIRCLE
CHANHASSEN, MINNESOTA 55317-8589
(Address of Principal Executive Offices)
(952) 944-3462
(Registrant's Telephone Number, Including Area Code)
Securities registered pursuant to Section 12(b) of the Act: None.
Securities registered pursuant to Section 12(g) of the Act: Common Stock, $0.001 par value.
Indicate by check mark if the registrant is a well known seasoned issuer as defined in Rule 405 of the Securities Act. Yes o No ý
Indicate by check mark if the registrant is not required to file reports pursuant to Section 13 or Section 15(d) of the Act. Yes o No ý
Indicate by check mark whether the registrant (1) has filed all reports required to be filed by Section 13 or 15(d) of the Securities Exchange Act of 1934 during the preceding 12 months (or for such shorter period that the registrant was required to file such reports), and (2) has been subject to such filing requirements for the past 90 days. Yes ý No o
Indicate by check mark whether the registrant has submitted electronically and posted on its corporate Web site, if any, every Interactive Data File required to be submitted and posted pursuant to Rule 405 of Regulations S-T (§232.405 of this chapter) during the preceding 12 months (or for such shorter period that the registrant was required to submit and post such files). Yes ý No o
Indicate by check mark if disclosure of delinquent filers pursuant to Item 405 of Regulation S-K (§229.405 of this chapter) is not contained herein, and will not be contained, to the best of registrant's knowledge, in definitive proxy or information statements incorporated by reference in Part III of this Form 10-K or any amendment to this Form 10-K. o
Indicate by check mark whether the registrant is a large accelerated filer, an accelerated filer, a non-accelerated filer or a smaller reporting company.
| Large Accelerated Filer o | Accelerated Filer ý | Non-Accelerated Filer o | Smaller Reporting Company ý |
Indicate by check mark whether the registrant is a shell company (as defined by Rule 12b-2 of the Exchange Act). Yes o No ý
Aggregate market value of the voting and non-voting common equity held by non-affiliates of the registrant at June 30, 2011: $91,887,646.
At March 12, 2012, the number of shares outstanding of the registrant's classes of common stock was 18,019,534.
DOCUMENTS INCORPORATED BY REFERENCE
Portions of the Registrant's Proxy Statement for its 2012 Annual Meeting of Stockholders are incorporated by reference to Part III of this Form 10-K.
NOTE REGARDING FORWARD-LOOKING STATEMENTS
The Private Securities Litigation Reform Act of 1995 provides a "safe harbor" for certain forward-looking statements. This Annual Report on Form 10-K (Annual Report) contains forward-looking statements. These forward-looking statements are subject to certain risks and uncertainties, including those identified below, which could cause actual results to differ materially from historical results or those anticipated. The words "aim," "believe," "expect," "anticipate," "intend," "estimate" and other expressions which indicate future events and trends identify forward-looking statements. Actual future results and trends may differ materially from historical results or those anticipated depending upon a variety of factors, including, but not limited to: the level of continuing demand for data center solutions and services including the effects of current economic and credit conditions and the ability of organizations to outsource data center infrastructure-related services to service providers such as us; the migration of organizations to virtualized server environments, including using a private cloud computing infrastructure; the extent to which customers deploy disk-based backup recovery solutions; the realization of the expected trends identified for advanced network infrastructures; reliance by manufacturers on their data service partners to integrate their specialized products; continued preferred status with certain principal suppliers; competition and pricing pressures and timing of our installations that may adversely affect our revenues and profits; fixed employment costs that may impact profitability if we suffer revenue shortfalls; our ability to hire and retain key technical and sales personnel; continued productivity of our sales personnel; our dependence on key suppliers; our ability to adapt to rapid technological change; risks associated with integrating current and possible futures acquisitions; fluctuations in our quarterly operating results; future changes in applicable accounting rules; and volatility in our stock price. Further, our revenues for any particular quarter are not necessarily reflected by our backlog of contracted orders, which also may fluctuate unpredictably.
These statements reflect our current views with respect to future events and are based on assumptions subject to risks and uncertainties. We do not intend to update or revise any forward-looking statements whether as a result of new information, future events or otherwise. Additional factors that may cause actual results to differ from our assumptions and expectations include those set forth in the Form 10-K. All forward-looking statements are quantified by, and should be considered in conjunction with, such cautionary statements. For additional discussion of the risks and uncertainties applicable to us, see the "Risk Factors" section of this Form 10-K.
Overview
Datalink Corporation was incorporated in Minnesota in 1987. We provide solutions and services that make data centers more efficient, manageable and responsive to changing business needs. Focused on mid and large-size companies, we assess, design, deploy, manage, and support unified infrastructures such as servers, storage and networks. We leverage hardware and software from the industry's leading original equipment manufacturers (OEMs) as part of our data center optimization offerings
Our portfolio of solutions and services spans four practices:
- •
- Consolidation and virtualization
Our consolidation and virtualization solutions and services allow data center infrastructures to be flexible, shared, and manageable. Our consolidation solutions and services enable organizations to share server and storage resources, thereby reducing the number of systems to be managed and maintained. Our virtualization portfolio supports near-term needs (for example, virtualizing server and storage environments) and enables organizations to develop and execute long-term strategies for data center efficiency (for example, "private cloud" computing and data center
1
- •
- Data storage and protection
- •
- Advanced network infrastructures
- •
- Business continuity and disaster recovery solutions
build-outs). Our virtualization infrastructure assessments provide end-to-end views of existing resources, including servers (both physical and virtual), applications and storage.
Our enhanced data protection and storage services and solutions help customers safeguard their information, as well as meet internal and external requirements for accessing, protecting, and retaining these assets. Our solutions include network-attached, direct-attached, and private cloud-based storage, local and remote backup, disaster recovery, archive, and compliance. We align each solution with customer service level agreements and business needs in mind. Our backup audits and assessments provide customers with backup operation performance metrics and recommendations for improvement. We also offer managed backup services whereby customers engage us to assume day-to-day management of their backup operations. In addition, we offer data capacity planning services that help organizations plan for data growth, as well as maximize utilization of all storage systems.
We assess, design, and deploy robust network infrastructures. We help companies consolidate, converge, and optimize their networks. Our solutions vary in scope from entire networks to enhanced router, switch, WLAN, security/VPN, and WAN optimization technologies. Our network architectural review services include an assessment of a customer's current network design, recommendations for improvement, and a roadmap for migrating to consolidated and converged network. We also provide contracts administration services as part of our SmartNet service.
By integrating our best-practice methods and business continuity expertise into an individualized process, we turn business continuity and disaster recovery into an overall change process. We believe this collaborative strategy helps organizations view their investments in enterprise technology not as individual servers or applications, but as a cohesive pool of computing resources able to rapidly adjust to new demands and reduce the risk of disruption.
We offer a full suite of practice-specific consulting, analysis, design, implementation, management, and support services. We deliver these services through our experienced team. Our team consists of approximately 165 engineering professional and support services members that are based throughout the United States.
We have a robust physical laboratory that customers can visit in Minneapolis. This lab enables customers to participate in physical demonstrations of a wide variety of technologies, including: site-to-site replication, data recovery, WAN optimization, de-duplication, and virtual data center architectures. Alternatively, customers can participate in a virtual demonstration from the convenience of their own office.
In addition to demonstrations, we leverage this lab to test, validate and compare technologies from the leading manufacturers and software developers, perform configuration services, troubleshoot support issues and train our professional and support services teams.
Industry Highlights
Mid and large size enterprises, which are typically greater than 500 employees, are increasingly focused on transforming their data centers in order to increase agility, enhance service levels, and reduce costs. Information technology (IT) departments are faced with a daunting challenge of rapidly
2
expanding amounts of data to manage. Gartner, Inc.,1 an industry analyst group ("Gartner"), expects (Source: Data Center Executives Must Address Many Issues in 2012, Mike Chuba, January 2012) that enterprise data will grow by 800% over the next five years. Coupled with this growth are increasing demands for availability of this data for day-to-day business and to meet regulatory requirements. At the same time, organizations are seeking greater operational efficiency and lower costs. As a result, we expect customers will continue to look for alternatives to simplify management of storage, network, and server infrastructures and increase productivity of existing IT teams. Transformational technologies and approaches, like virtualization and private cloud computing, help achieve each of these objectives. Virtualization and private cloud computing enable organizations to more quickly adapt to changing business requirements, improve service levels via simplified management, and reduce costs through higher utilization rates.
Gartner, reports (Source: Private Cloud Computing Ramps Up in 2011, Thomas Bittman, March 2011) that through 2014, IT organizations will spend more money on private cloud computing investments than on offerings from public cloud providers. We anticipate the virtualization of servers, storage and networks and migration to unified virtual data center architectures will primarily occur in stages, with a focus on building a foundation to support future private cloud strategies. We expect this will result in continued demand for shared storage, as well as backup and disaster recovery infrastructures tuned to virtualized server environments. We expect this will result in continued demand for shared storage, as well as backup and disaster recovery infrastructures tuned to virtualized server environments. We also expect that the increased bandwidth requirements of high density virtualized server environments will drive demand for high bandwidth integrated converged networks.
Employees, customers and suppliers demand uninterrupted access to mission-critical data 24 hours a day, 7 days a week. As a result, organizations continue to require flexible, scalable and highly available server, storage and network solutions.
In 2012, we believe that capital investment priorities of the customers in our industry will include:
- •
- Virtualization and consolidation
- •
- Enhanced data protection capabilities
Virtualization will play a key role in data center transformation strategies. Virtualization and private cloud computing enable organizations to reduce costs, increase agility, and improve management and utilization.
Our customers need a comprehensive virtualization strategy encompassing server, storage and network environments. Without this unified data center approach, companies cannot realize the full benefits of virtualization.
We expect organizations will continue to seek the professional services of a provider, like us, to assess their environment, conduct a gap analysis, and develop virtual data center migration path that will enable them to protect and leverage each investment as they migrate to a private-cloud computing infrastructure. We expect that most of our customers will continue to deploy virtual data center infrastructures in a phased-in or total build out approach. We also expect that organizations will continue to seek the services of a provider that has unified data center expertise (server, storage, networks) and provides a full life cycle of services from consulting and design to deployment and ongoing support.
Increased need for high throughput performance, greater frequency of backups, quick restoration of data and stringent data availability requirements are key drivers in data center
- 1
- The Gartner Report(s) described herein, (the "Gartner Report(s)") represent(s) data, research opinion or viewpoints published, as part of a syndicated subscription service, by Gartner, Inc. ("Gartner"), and are not representations of fact. Each Gartner Report speaks as of its original publication date (and not as of the date of this Form 10-K) and the opinions expressed in the Gartner Report(s) are subject to change without notice.
3
- •
- Advanced network infrastructures
- •
- Acceptance and growing need for data center services.
decision making. We expect these requirements will continue to drive the continued migration to disk-based protection solutions. Many of our customers have deployed disk-based backup and recovery solutions. With the convergence of key technologies, such as data de-duplication, WAN optimization, and advanced heterogeneous replication and snapshot software, we expect the benefits customers receive from disk-based backup will increase, resulting in increased demand.
We expect that two trends will continue to drive the continued evolution of data center networking. The advancement of data center virtualization increases the need to update networking infrastructure to support increased bandwidth with networking infrastructure and management that is more integrated with server virtualization and private cloud initiatives. In addition, those seeking simplified management, cost reductions, and increased flexibility will consolidate and converge disparate networks (e.g. storage and data management) and migrate to unified fabrics.
We expect IT organizations to increasingly outsource data center infrastructure-related services, including consulting, implementation, management and support to a company who can provide a holistic solution. An increased focus on technologies that provide greater efficiency and business value, the growing complexity of networked environments and flat IT department headcount growth in light of current economic conditions facilitate this trend.
The Datalink Opportunity
The movement toward computing environments that offer more adaptable and scalable IT services drives demand for data center-focused solutions and services providers, such as us. Both potential customers and data center infrastructure manufacturers are looking to providers, such as us, primarily for the following reasons:
Pressures on Customers. Migrating data centers to those that are more efficient, scalable, and flexible, is complex. Private cloud computing is transformational in nature. It impacts the relationship between the business and IT, as well as how IT organizations are structured and operate. As a result, we believe customers are looking for solution providers, to sort through their options, define migration plans, and execute accordingly. In addition, we believe organizations will increasingly look outside their in-house technical staff to leverage the expertise of companies, for strategy definition and execution.
Pressures on Manufacturers. We believe manufacturers increasingly rely on channel partners such as us for two principal reasons:
- •
- Sophisticated, virtualized storage, network, and server solutions require the integration of highly specialized products
made by a variety of manufacturers. A virtual data center, for instance, can utilize components such as software, disk systems, routers, switches, and servers, each from a different manufacturer.
Manufacturers generally focus on only a portion of the overall data center, leaving companies like us to integrate comprehensive solutions from the best available products and technologies.
- •
- Gross profit margins have been under pressure for many manufacturers. Because of the high cost of maintaining a large national sales and marketing organization, we believe manufacturers have found value in leveraging the sales and marketing functions of channel partners, such as us.
We believe we are uniquely positioned to capitalize on this significant opportunity for the following reasons:
Expertise. We have implemented data center solutions for over 20 years. This experience has given us significant expertise in understanding and applying storage, server, and networking
4
technologies either as individual technologies or in unified data center architecture. We continually invest in training to adapt to the ever-changing needs of our customers and capitalize on opportunities.
Not Tied to One Manufacturer. Unlike many of our competitors, we are not tied to one or a limited number of manufacturers or particular technologies. This gives us the flexibility to be consultative in our approach. Our customers rely on us to choose the best available hardware and software and tailor it to their individual needs.
The Datalink Solution
We combine our expertise and comprehensive services portfolio with quality products from leading manufacturers to meet each customer's specific needs. Our services include:
Consulting
Our consultants deliver highly customized research, advice, and action plans to help customers optimize their data centers. Our independent recommendations help customers respond to challenges in the following areas: data center optimization and consolidation, business continuity, disaster recovery, and IT governance.
Analysis
At the beginning of an engagement, we place considerable emphasis on formulating a needs analysis based on each customer's business initiatives, operating environment and current and anticipated unified data center requirements. While our focus is on each customer's unique situation, we bring to each engagement our extensive product knowledge and the experience we have gained from providing data center solutions for over twenty years to customers in numerous industries.
Our assessment services provide customers with objective guidance on developing virtualization and consolidation, backup and recovery, and advanced network infrastructures that optimize their resources, leverage their existing environments and facilitate cost-effective growth for the future. These services provide an independent viewpoint to align people, processes and technologies with business objectives. They also help organizations maximize current investments, outline recommendations for future purchases and provide assurance that server, storage and networking infrastructures are efficient, reliable and scalable.
Design
Once we have completed our initial analysis, we begin the design phase of the project. Our professional services teams work together to design a system that meets the customer's server, storage and networking needs and budget. Our customers are able to choose from a wide range of technologies in order to fuse together the appropriate hardware, software and services for each project.
We design data center infrastructures based on each customer's detailed business requirements. The engagement begins with a definition of the project's objectives, scope and key milestones. Our team then prepares an outline of the schedule and deliverables. Following a thorough analysis, the team prepares a comprehensive blueprint of the infrastructure, including a detailed design schematic, key implementation milestones and recommendations for handling potential configuration issues to ensure a smooth transition to new server, storage and networking environments.
Implementation
Once we design a solution, we formulate a detailed project implementation plan with our customers to meet their financial and operating objectives and minimize disruption to their operations. We oversee the timely delivery of hardware and software products to the customer's location. We then
5
coordinate the installation with our professional services teams, or personnel from equipment manufacturers, and complete the installation at the customer's site using industry best practices.
Support
We provide our customers advanced 24 × 7 technical support from a team of customer support and field engineers. Our extensive experience with data center solutions enables our staff to deliver expert configuration and usage assistance, technical advice and prompt incident detection and resolution. The support team also acts as our primary interface with manufacturers' technical support organizations.
Our support services offer additional flexible levels of service to help organizations maximize the return on their technology investments. We believe that our customer support program is one of very few customer service plans that provide support across multiple storage product lines and manufacturers.
We provide our analysis, design, implementation, management and support services to customers through either a stand-alone services engagement or as a part of an overall project that includes a server, storage and networking solutions and services.
Management
We relieve burdened internal IT teams with a growing portfolio of managed services. Our services enhance the productivity of our customer's IT teams, as well as drive greater operational efficiency. Our backup reporting service enables customers to gain visibility of key performance metrics, enabling them to quickly pinpoint and resolve issues, improve operational efficiency, and mitigate risk. Our storage capacity manager reporting service provides visibility of key storage utilization metrics, enabling customers to improve utilization rates, improve application availability, and provide chargeback reporting. Reporting services, such as these, can be coupled with our OneCall support services, thereby providing the opportunity for proactive monitor and alert service by our team of experts. We also augment the staff of our customers by offering onsite professional services resources. These resources provide services including backup and recovery administration, project management, storage administration and our managed services offerings.
Our Strategy
Our strategy is to improve our position as a data center solutions and services provider and to develop a customer-focused, high performance company with sustainable profitable growth. To achieve these objectives, we intend to build upon our record of successfully addressing the evolving needs of our customers. Key elements of our strategy include:
Increase Sales Team Productivity
Although we believe that our sales productivity is high, we believe it can be improved. We continue to accelerate the learning and productivity curve of our newer sales professionals and enhance the skills of seasoned executives through implementation of techniques and best practices learned from our top producers.
Scale Existing Locations and Expand into New Locations via Acquisitions
We continue to scale our existing geographic locations to increase market share, leverage fixed expenses and provide higher quality service levels. We expect to drive this growth by hiring experienced, quality account executives and field engineers to gain sales productivity and field engineering utilization. In the past we have made acquisitions to grow our business including our acquisition of
6
Midwave Corporation in 2011 (as discussed in more detail below). We intend to continue to grow our business via select acquisitions. We seek acquisition targets that align closely with our data center portfolio offerings.
Expand Customer Support Revenues
We significantly increased our customer support capabilities and performance over the last several years and will continue to make this a focus. We believe that our customers appreciate our quality support services, which we believe will continue to be a key differentiator and growth driver for us.
Enhance Our Consulting and Professional Services Business
Consulting services represents a sizable opportunity to drive additional professional services and follow-on hardware and software revenues in both existing and new accounts. Consulting services enable us to differentiate ourselves from our competition, as well as build executive-level relationships within the accounts we serve. In addition, by improving our assessment, audit and implementation service methodologies and sales tools, we plan to enhance our solution selling capabilities. We believe hiring additional experienced, data center consultants, and providing our sales teams with the tools they need to uncover consulting opportunities, will increase consulting services, with additional hardware and software revenues, in 2012.
Expand Managed Services Portfolio
Providing our customers with value-driven, recurring services represents a significant opportunity for differentiation and growth for us along with increasing reoccurring revenue. We will launch a suite of managed services designed to free up the IT teams of our customers so that they can focus on high-impact projects, while at the same time helping them to drive greater data center efficiencies and services levels. Our managed services will initially span backup and network operations.
Suppliers and Products
We do not manufacture server, storage, or networking products. Instead, we continually evaluate and test new and emerging technologies from leading manufacturers to ensure that our solutions incorporate state-of-the-art, high performance, cost-effective technologies. This enables us to maintain our technological leadership, identify new and innovative products and applications and objectively help our customers align their data center solutions with their business needs.
We have strong, established relationships with the major storage, server, and networking hardware and software suppliers. Our expertise in open system environments includes UNIX, Microsoft Windows, Linux, Solaris, and in-depth knowledge of all major hardware and software technologies manufactured by industry leaders. This expertise has earned us preferred status with many of our principal suppliers. Preferred status often enables us to participate in our suppliers' new product development, evaluation, introduction and marketing programs. These collaborations enable us to identify and market innovative new hardware and software products and exchange critical information in order to maximize customer satisfaction.
7
Some of our major suppliers and the products they provide are listed below:
Products
|
Suppliers | |
|---|---|---|
Disk Storage |
EMC Corporation Hitachi Data Systems Corporation NetApp Inc. Oracle Systems Quantum Corporation |
|
Tape Automation |
Oracle Systems |
|
Software |
Akorri, Inc. |
|
Servers |
Cisco Systems, Inc. |
|
Switches/Directors/Storage Networking |
Brocade Communications Systems, Inc. |
We have not had difficulty in obtaining any of the products that we use in our business from our current suppliers. In addition, we do not rely on one or a few suppliers for the products we use in our business.
Customers
Customer engagements range from specialized professional assessment and design services, to complex, virtual data center implementations. We also provide hardware and software to our customers on an as-needed basis in order to enable one of our designs or to increase the capacity of their current infrastructures. We serve customers throughout the United States in a diverse group of data intensive industries. Our broad industry experience enables us to understand application and business issues specific to each customer and to design and implement appropriate networked storage solutions.
In 2011, 2010 and 2009, we had no customers that accounted for at least 10% of our revenues. However, our top five customers collectively accounted for 11%, 12%, and 17% of our 2011, 2010 and 2009 revenues, respectively.
Sales and Marketing
We market and sell our products and services throughout the United States primarily through a direct sales force. In addition to our Minneapolis headquarters, as of December 31, 2011, we have 29 field sales offices, including home offices, in order to efficiently serve our customers' needs.
Our field account executives and account associates work closely with our technical services team in evaluating the data center project needs of existing and prospective customers and in designing high quality, cost effective solutions. To ensure quality service, we assign each customer a specific field
8
account executive and account associate. Our accounts and technical teams generated a total of 290 new customers in 2011 and sold product and services to 2,000 current customers.
In addition to the efforts of our field account executives, account associates, and technical services team we engage in a variety of other marketing activities designed to attract new business and retain customer loyalty. We regularly execute integrated, demand generation campaigns, gain exposure through online and print trade publications, hold information seminars, and use social media channels to share information about topics, such as virtual data centers, private cloud computing, storage, data protection and disaster recovery and business continuity trends and best practices.
Competition
Competition for the solutions we provide is fragmented, and we compete with numerous large and small competitors. For data center solutions we compete with other technology infrastructure solution providers and system integrators, and technology value added resellers that focus on providing data center solutions. Our competitors are primarily either resellers that provide solutions using many of the same products from the manufacturers that we represent such as Cisco, EMC, Hitachi, NetApp, Symantec, VMware or they also may provide solutions using other competing manufacturer's products such as IBM, HP and others. We may also compete directly against some of these manufacturers when they are involved in selling to the customer directly.
We believe that the principal competitive factor when marketing our solutions is our overall business model where we are focused on making data centers more efficient, manageable and responsive to our customer's business needs. Other important factors include total cost, technical competence, the strength of our relationship with the customer, the quality of our support services, and the quality of our relationship with the manufacturer of the products being supplied as part of a data center solution.
Employees
As of December 31, 2011, we had a total of 389 employees, all of which are full-time employees. We have no employment agreements with any of our employees, except for Mr. Lidsky, our President and Chief Executive Officer, Mr. Barnum, our Vice President of Finance and Chief Financial Officer and Mr. O'Grady, our Executive Vice President of Field Operations. None of our employees are unionized or subject to a collective bargaining agreement. We have experienced no work stoppages.
Backlog
Effective January 1, 2011, our revenue recognition policy requires us to recognize product revenues upon shipment as compared to upon installation under our old revenue recognition method. We configure products to customer specifications and generally ship them shortly after we receive our customer's purchase order. Customers may change their orders with little or no penalty. Customer constraints, including customer readiness, and the availability of engineering resources may impact when we can complete our installation and configuration services, which represent approximately 5% of our revenues. Therefore, we do experience a backlog of orders. Our backlog, which represents firm orders we expect to recognize as revenue within the next 90 days, was $59.4 million and $47.0 million at December 31, 2011 and 2010, respectively.
Acquisitions
Midwave Corporation. In October 2011, we entered into an asset purchase agreement with Midwave Corporation ("Midwave") and its shareholders. Under the asset purchase agreement we purchased and acquired from Midwave substantially all of the assets used in Midwave's business. Midwave is an IT consulting firm that offers both professional services and sells products to business'
9
IT organizations utilizing the product portfolios of certain information technology manufacturers, in the specific domains of data center services, networking services, managed services and advisory services. We paid a purchase price of approximately $19.1 million, comprised of a cash payment delivered at closing of approximately $16.1 million and issued 220,988 shares of our common stock with a value of approximately $1.6 million and approximately $1.4 million related to working capital adjustments subsequent to closing.
This acquisition expanded our footprint in Minnesota making us the dominant data center services and infrastructure provider in the region. The acquisition also doubled our Cisco technology and services revenues, expanded our managed services portfolio with the addition of a data center infrastructure monitoring service, added an established security practice including product, services and consulting and doubled the size of our consulting services team. We expect to experience operational synergies and efficiencies through the combined general and administrative corporate functions. Our results for 2011 reflect the addition of Midwave during the fourth quarter. Please see Note 2 to our financial statements for further information.
Reseller Business of Incentra, LLC. In December 2009, we acquired the reseller business of Incentra, LLC ("Incentra"). Under the Asset Purchase Agreement, we paid Incentra $13.8 million. We paid $8.8 million at closing in cash, of which we held back $440,000 as security for certain indemnification obligations of Incentra. In addition, we paid Incentra $5.0 million for the working capital associated with Incentra's reseller business through the delivery of $2.0 million in cash and a $3.0 million secured promissory note. The promissory note was paid on March 31, 2010. During 2010 the final working capital adjustment was agreed to and the amount held back for indemnification was released, the net effect was a decrease in the purchase price of $32,000. This acquisition doubled our presence in Chicago and the Northeast and provided us with a significant presence in the West. Our combined team now has expanded experience to design and implement complex data center solutions, which will deliver increased productivity and efficiency for our customers. This acquisition also added to our team of network engineers that are certified by Cisco, which allowed us to attain Cisco's Gold and Data Center Advanced Technology Partner certifications. We have experienced operational synergies and efficiencies through combined general and administrative corporate functions. Our results for 2009 reflect the addition of Incentra's reseller business for thirteen days. Please see Note 2 to our financial statements for further information.
Networking Solutions Division of Cross Telecom. In October 2009, we acquired the networking solutions division of Minneapolis-based Cross Telecom ("Cross"), which qualified as a business combination. We completed an asset purchase of $2.0 million paid in cash. Under the terms of the purchase agreement, Cross entered into a services agreement with us under which it agreed to purchase at least $1.8 million of Cisco networking products and services from us over the next three years. The acquisition of this team of certified Cisco networking experts who have obtained Cisco's Silver certification, has increased our expertise in designing, implementing and managing sophisticated virtualized data center, storage and backup recovery solutions.
In conjunction with our Cross acquisition, we entered into a three year products and services agreement, which required Cross to purchase at least $1.8 million of networking products and services from us over three years. The agreement was entered into outside of the acquisition and was assigned no fair value. Pursuant to the agreement, Cross agreed to pay any shortfall between customer purchases and the guaranteed annual purchase amount. In September 2010 and 2011, the first and second years of the three year agreement came to an end and there was a shortfall paid by Cross of $503,000 and $574,000, respectively, which was recorded as other income since we had assumed that the revenue targets would be met. In October 2011, we entered into an agreement with Cross to allow for an early buyout of the remaining year of the agreement for which Cross paid $553,000.
10
Available Information
Our website address is www.datalink.com. The material on our website is not part of this report. We make available at our website, free of charge, our Annual Reports on Form 10-K, Quarterly Reports on Form 10-Q, Current Reports on Form 8-K, and amendments to those reports filed or furnished pursuant to Section 13(a) or 15(d) of the Exchange Act as soon as reasonably practicable after we electronically file such material with, or furnish it to, the SEC.
The public may also read and copy any materials we file with the SEC at the SEC's Public Reference Room at 100 F Street NE, Washington, DC 20549. The public may obtain information on the operation of the Public Reference Room by calling the SEC at 1-800-SEC-0330. All SEC filings are also available at the SEC's website at www.sec.gov.
Executive Officers of the Registrant
Set forth below are the names, ages and titles of the persons serving as our executive officers:
Name
|
Age | Position | ||
|---|---|---|---|---|
| Paul F. Lidsky | 58 | President and Chief Executive Officer | ||
Gregory T. Barnum |
57 |
Vice President, Finance and Chief Financial Officer |
||
M. Shawn O'Grady |
49 |
Executive Vice President, Field Operations |
Paul F. Lidsky was elected as a director in June 1998 and became our President and Chief Executive Officer in July 2009. Mr. Lidsky was the President and Chief Executive Officer of Calabrio, Inc. from October 2007 until July 2009. From December 2005 until September 2007, Mr. Lidsky served as Chief Operating Officer for Spanlink Communications, Inc. Between 2003 and 2004, Mr. Lidsky was President and Chief Executive Officer of Computer Telephony Solutions. From 2002 to 2003, Mr. Lidsky was President and Chief Executive Officer of VigiLanz Corporation. From 1997 until 2002, Mr. Lidsky was the President and Chief Executive Officer of OneLink Communications, Inc. Between 1985 and 1997, Mr. Lidsky was employed by Norstan, Inc, most recently as Executive Vice President of Strategy and Business Development.
Gregory T. Barnum became our Vice President of Finance and Chief Financial Officer in March 2006. From January 2006 until the time he became our executive officer, he was a member of our Board of Directors. Prior to joining us, he served as Vice President of Finance, Chief Financial Officer and Corporate Secretary of Computer Network Technology Corporation from 1997 until the company's acquisition by McData Corporation in 2005. Between 1992 and 1997, Mr. Barnum served as Senior Vice President of Finance and Administration, Chief Financial Officer and Corporate Secretary of Tricord Systems, Inc., an enterprise server manufacturer. Between 1988 and 1992, he was Executive Vice President, Finance, Chief Financial Officer, Treasurer and Corporate Secretary of Cray Computer Corporation, a development stage company engaged in the design of supercomputers. Prior to that time, Mr. Barnum served in various accounting and financial management capacities for Cray Research, Inc., a manufacturer of supercomputers. Mr. Barnum is a graduate of the University of St. Thomas.
M. Shawn O'Grady became our Executive Vice President, Field Operations in December 2009, upon our Incentra acquisition. Prior to joining us, he served Incentra and its affiliates since 2005 in various executive positions, most recently, as its President and Chief Executive Officer. Incentra filed for bankruptcy protection in 2009 while Mr. O'Grady served as an officer. Prior to his employment with Incentra, Mr. O'Grady was employed by Siemens Business Services, the information technology services division of Siemens AG, since 2000 in various capacities including its Senior Vice President and Business Unit General Manager, Consulting and Integration.
11
As indicated in this Annual Report under the caption "Note Regarding Forward-Looking Statements," certain information contained in this Annual Report consists of forward-looking statements. Important factors that could cause actual results to differ materially from the forward-looking statements made in this Annual Report include the following:
Worldwide adverse economic conditions negatively impact our business.
Over the past few years, financial markets in the United States, Europe and Asia have experienced extreme disruption, including, among other things, extreme volatility in security prices, severely diminished liquidity and credit availability, rating downgrades of certain investments and declining valuations of others. We have been impacted by these economic developments in that they continue to adversely affect the ability of our customers and suppliers to obtain financing for significant purchases and operations, and have reduced orders for our products and services. These economic conditions will continue to negatively impact us to the extent our customers defer purchasing decisions, thereby lengthening our sales cycles. In addition, our customers' may have constrained budgets affecting their ability to purchase our products at the same level. Our customers' ability to pay for our products and services may also be impaired, which may lead to an increase in our allowance for doubtful accounts and write-offs of accounts receivable. We are unable to predict the likely duration and severity of the current disruption in financial markets and adverse economic conditions in the U.S. Should these economic conditions result in us not meeting our revenue objectives, our operating results, financial condition and stock price could be adversely affected.
Competition could prevent us from increasing or sustaining our revenues or profitability.
The enterprise-class information storage, server and networking market is rapidly evolving and is highly competitive. As technologies change rapidly, we expect that competition will increase in the future. Current economic conditions also place pressure on our competitors to lower their prices and seek opportunities of size and scale different than in the past. We compete with independent storage, server and networking system suppliers in the mid to large enterprise market and numerous value-added resellers, distributors and consultants. We also compete in the storage, server and networking systems market with computer platform suppliers. Many of our current and potential competitors have significantly greater financial, technical, marketing, purchasing and other resources than we do. As a result, they may respond more quickly to changes in economic conditions and customer requirements and to new or emerging technologies, devote greater resources to the development, promotion and sale of products and deliver competitive products at lower end-user prices.
Our suppliers are often our competitors. We are not the exclusive reseller of any data storage, server or networking product we offer. Instead, our suppliers market their products through other independent data storage, server and networking solution providers, OEMs, and through their own internal sales forces. We believe direct competition from our suppliers is likely to increase if, as expected, the server, storage and networking industries continues to consolidate and also converge with providers of server and networking technologies. This consolidation would likely result in fewer suppliers with greater resources to devote to internal sales and marketing efforts. In addition, our suppliers have established and will probably continue to establish cooperative relationships with other suppliers and other data storage, server and networking solution providers. These cooperative relationships are often intended to enable our suppliers to offer comprehensive storage, server and networking solutions, which compete with those we offer. If our relationships with our suppliers become adversarial, we could lose the preferred provider status we maintain with certain suppliers. If that were to occur, it would be more difficult for us to stay ahead of industry developments and provide our customers with the type of service and wide range of technology choices they expect from us.
12
Most of our customers already employ in-house technical staffs. To the extent a customer's in-house technical staff develops sophisticated server, storage and networking systems expertise, the customer may be less likely to seek our services. Further, we compete with storage service providers who manage, store and backup their customers' data at off-site, networked data storage locations.
Mergers or other strategic transactions involving our competitors could weaken our competitive position, which could harm our operating results.
Our industry is highly fragmented, and we believe it is likely that our existing competitors will continue to consolidate or will be acquired. In addition, some of our competitors may enter into new alliances with each other or may establish or strengthen cooperative relationships with systems integrators, third-party consulting firms or other parties. Any such consolidation, acquisition, alliance or cooperative relationship could lead to pricing pressure and our loss of market share and could result in a competitor with greater financial, technical, marketing, service and other resources, all of which could have a material adverse effect on our business, operating results and financial condition.
Our business is dependent on the trend toward outsourcing data center infrastructure-related services.
Our business and growth depend in large part on the industry trend toward outsourced data center infrastructure-related services. Outsourcing means that an entity contracts with a third party, such as us, to provide data center infrastructure-related services such as consulting, implementation, management and support. To the extent a customer's in-house technical staff develops sophisticated server, storage and networking systems expertise, the customer may be less likely to seek our services. Further, we compete with storage service providers who manage, store and backup their customers' data at off-site, networked data storage locations. There can be no assurance that this trend will continue, as organizations may elect to perform such services themselves. A significant change in this trend could have a material adverse effect on our business, financial condition and results of operations. Additionally, there can be no assurance that our cross-selling efforts will cause clients to purchase additional services from us or adopt a single-source outsourcing approach.
Our financial results would suffer if the market for IT services and solutions does not continue to grow.
Our services and solutions are designed to address the growing markets for data center consolidation and virtualization services (including private cloud computing), data center implementation services (including storage and data protection services and the implementation of virtualization solutions), and managed services (including operational support and client support). These markets are still evolving. A reduction in the demand for our services and solutions could be caused by, among other things, lack of client acceptance, weakening economic conditions, competing technologies and services or reductions in corporate spending. Our future financial results would suffer if the market for our data center services and solutions does not continue to grow.
With continued market demand for greater data center agility, scalability, and efficiency, we have been increasingly developing and marketing virtual data center and private cloud computing infrastructures and services. If businesses do not find our virtual data center and private cloud computing solutions compelling, our revenue growth and operating margins may decline.
Our data center optimization portfolio is based on the virtualization of storage, computing, and network platforms within on-premises data centers. Our success depends on organizations and customers perceiving technological and operational benefits and cost savings associated with services-oriented, virtual data center and private cloud computing-based infrastructures. Although the use of virtualization technologies on servers has become broadly accepted for enterprise-level applications, the extent to which organizations will adopt virtualization across the data center and migrate to private
13
cloud computing remains uncertain. Accordingly, as the market for our virtual data center and private cloud computing infrastructures mature and the scale of our business increases, the rate of growth in our infrastructure and services sales could be lower than those we have experienced in earlier periods. In addition, to the extent that our newer private cloud computing infrastructure solutions and services are adopted more slowly or less comprehensively than we expect, our revenue growth rates may slow materially or our revenue may decline substantially.
Our acquisition strategy poses substantial risks.
As part of our growth strategy, we made two acquisitions in 2009, one acquisition in October 2011 and plan to continue to pursue acquisitions in the future. We may not be able to identify suitable acquisition candidates or, if suitable candidates are identified, we may not be able to complete the acquisition on commercially acceptable terms. We may need to raise additional equity to consummate future acquisitions, which may not be feasible, could be on terms we do not consider favorable, would cause dilution to existing investors and could adversely affect our stock price. We also could incur substantial indebtedness in connection with an acquisition, which could decrease the value of our equity. The process of exploring and pursuing acquisition opportunities requires significant management and financial resources, which diverts attention from our core operations.
Integration of acquisitions is very challenging and we cannot assure you that any acquisition will increase our revenues, earnings or stock price. Even if we are able to consummate an acquisition, such as our recent acquisitions, the transaction may present many risks. These risks include, among others: failing to achieve anticipated synergies and revenue increases; difficulty incorporating and integrating the acquired technologies or products with our existing product lines; coordinating, establishing or expanding sales, distribution and marketing functions, as necessary; disruption of our ongoing business and diversion of management's attention to transition or integration issues; unanticipated and unknown liabilities; the loss of key employees, customers, partners and channel partners of our company or of the acquired company; and difficulties implementing and maintaining sufficient controls, policies and procedures over the systems, products and processes of the acquired company. If we do not achieve the anticipated benefits of our acquisitions as rapidly or to the extent anticipated by our management and financial or industry analysts or if others do not perceive the same benefits of the acquisition as we do, there could be a material, adverse effect on our business, financial condition, results of operations or stock price
Our continued growth could strain our personnel resources and infrastructure, and if we are unable to implement appropriate controls and procedures to manage our growth, we will not be able to implement our business plan successfully.
We have experienced a period of rapid growth in our headcount and operations. To the extent that we are unable to sustain such growth, it will place a significant strain on our management, administrative, operational and financial infrastructure. Our success will depend in part upon the ability of our senior management to manage this growth effectively. To do so, we must continue to hire, train and manage new employees as needed. If our new hires perform poorly, or if we are unsuccessful in hiring, training, managing and integrating these new employees, or if we are not successful in retaining our existing employees, our business would be harmed. To manage the expected growth of our operations and personnel, we will need to continue to improve our operational, financial and management controls and our reporting systems and procedures. The additional headcount we are adding will increase our cost base, which will make it more difficult for us to offset any future revenue shortfalls by reducing expenses in the short term. If we fail to successfully manage our growth, we will be unable to execute our business plan.
14
Our ability to recognize revenue can be adversely affected by product availability.
We sell complex enterprise-class data storage, server and networking solutions, which include installation and configuration services. We generally recognize revenues from our sale of hardware and software products when shipment has been completed. We rely on our vendors to supply the hardware and software products we sell. We cannot control the availability and shipment of these products. Delays due to component availability, natural disasters and other unforeseen events can prevent us from recognizing revenue on products we ship and may adversely affect our quarterly reported revenues. As a result, our stock price may decline.
Our key vendors could change or discontinue their incentive programs, which could adversely affect our business.
Several of our key vendors have offered incentive programs to us over the past several years based on our achievement of particular sales levels of their products and early pay discounts. In addition, they have offered margin enhancement programs which provide enhanced discounts for particular products or new customer orders. These programs contributed to our profitability in 2011, 2010 and 2009. We cannot assure that these programs will continue or that the sales quotas for our participation will not increase, adversely affecting our ability to take advantage of the incentives. If for any reason, we cannot obtain the same benefits from incentive programs as in the past, it may significantly impact our profitability in the future.
We derive a significant percentage of our revenues from a small number of customers.
In 2011, 2010 and 2009, we had no customers that accounted for at least 10% of our revenues. However, our top five customers collectively accounted for 11%, 12%, and 17% of our 2011, 2010 and 2009 revenues, respectively. Because we intend to continue to seek out large projects, we expect that a significant percentage of our revenues will continue to come from a small number of customers, although the composition of our key customers is likely to change from year to year. Current economic conditions likely will continue to adversely affect the number of and size of large projects available for us. If we fail to obtain a growing number of large projects each year, our revenues and profitability will likely be adversely affected. In addition, our reliance on large projects makes it more likely that our revenues and profits will fluctuate unpredictably from quarter to quarter and year to year. Unpredictable revenue and profit fluctuations may make our stock price more volatile and lead to a decline in our stock price.
Our business depends on our ability to hire and retain technical personnel and highly qualified sales people.
Our future operating results depend upon our ability to attract, retain and motivate qualified engineers and sales people with enterprise-class data storage, server and networking solutions experience. If we fail to recruit and retain additional engineering and sales personnel, or if losses require us in the future to terminate employment of some of these personnel, we will experience greater difficulty realizing our business strategy, which could negatively affect our business, financial condition and stock price.
We generally do not have employment agreements with our key employees.
Our future operating results depend in significant part upon the continued contributions of our executive officers, managers, sales people, engineers and other technical personnel, many of whom have substantial experience in our industry and would be difficult to replace. Except as to our President and Chief Executive Officer, Vice President of Finance and Chief Financial Officer, Executive Vice President of Field Operations, we do not have employment agreements with our employees.
15
Accordingly, our employees may voluntarily leave us at any time and work for our competitors. Our growth strategy depends in part on our ability to retain our current employees and hire new employees. Any failure to retain our key employees will make it much more difficult for us to maintain our operations and attain our growth objectives and could therefore be expected to adversely affect our operating results, financial condition and stock price.
Our long sales cycle may cause fluctuating operating results, which may adversely affect our stock price.
Our sales cycle is typically long and unpredictable, making it difficult to plan our business. Current economic conditions increase this uncertainty. Our long sales cycle requires us to invest resources in potential projects that may not occur. In addition, our long and unpredictable sales cycle may cause us to experience significant fluctuations in our future annual and quarterly operating results. It can also result in delayed revenues, difficulty in matching revenues with expenses and increased expenditures. Our business, operating results or financial condition and stock price may suffer as a result of any of these factors.
Our failure to raise additional capital or generate cash flows necessary to expand our operations and invest in new technologies could reduce our ability to compete successfully and adversely affect our results of operations.
We may need to raise additional funds, and we may not be able to obtain additional debt or equity financing on favorable terms, if at all. If we raise additional equity financing, our security holders may experience significant dilution of their ownership interests and the value of shares of our common stock could decline. If we engage in debt financing, we may be required to accept terms that restrict our ability to incur additional indebtedness, force us to maintain specified liquidity or other ratios or restrict our ability to pay dividends or make acquisitions. If we need additional capital and cannot raise it on acceptable terms, we may not be able to, among other things:
- •
- continue to expand our technology development, sales and marketing organizations;
- •
- hire, train and retain employees; or
- •
- respond to competitive pressures or unanticipated working capital requirements.
Our inability to do any of the foregoing could reduce our ability to compete successfully and adversely affect our results of operations.
If the storage, server and networking solutions industries fail to develop compelling new technologies, our business may suffer.
Rapid and complex technological change, frequent new product introductions and evolving industry standards increase demand for our services. Because of this, our future success depends in part on the storage, server and networking solutions industry's ability to continue to develop leading-edge storage and related server and networking technology solutions. Our customers utilize our services in part because they know that newer technologies offer them significant benefits over the older technologies they are using. If the data storage industry ceases to develop compelling new storage, server and networking solutions, or if a single data storage, server and networking standard becomes widely accepted and implemented, it will be more difficult to sell new data storage, server and networking systems to our customers. The continued tightened budgets among established data storage, server and networking technology manufacturers and the difficulty of raising new capital for innovative, start-up companies, under current economic conditions may also stifle development of new data storage, server and networking technologies.
16
Our data center services and web site may be subject to intentional disruption
Although we believe we have sufficient controls in place to prevent intentional disruptions, such as software viruses specifically designed to impede the performance of our data center services, we may be affected by such efforts in the future, Further, despite the implementation of security measures, this infrastructure or other systems that we interface with, including the Internet and related systems, may be vulnerable to physical break-ins, hackers, improper employee or contractor access, programming errors, attacks by third parties or similar disruptive problems, resulting in the potential misappropriation of our proprietary information or interruptions of our services. Any compromise of our security, whether as a result of our own systems or systems that they interface with, could substantially disrupt our operations, harm our reputation and reduce demand for our services.
Control by our existing shareholders could discourage the potential acquisition of our business.
Currently, our executive officers and directors beneficially own approximately 15.6% of our outstanding common stock. Acting together, these insiders may be able to significantly impact the election of our Board of Directors and may have a significant impact on the outcome of all other matters requiring shareholder approval. This voting concentration may also have the effect of delaying or preventing a change in our management or otherwise discourage potential acquirers from attempting to gain control of us. If potential acquirers are deterred, you may lose an opportunity to profit from a possible acquisition premium in our stock price.
Our stock price is volatile.
The market price of our common stock fluctuates significantly, and, especially in light of current stock market and worldwide economic conditions, may continue to be volatile. We cannot assure you that our stock price will increase, or even that it will not decline significantly from the price you pay. Our stock price may be adversely affected by many factors, including:
- •
- actual or anticipated fluctuations in our operating results, including those resulting from changes in accounting rules;
- •
- general market conditions, including the effects of current economic conditions;
- •
- announcements of technical innovations;
- •
- new products or services offered by us, our suppliers or our competitors;
- •
- changes in estimates by securities analysts of our future financial performance;
- •
- our compliance with SEC and NASDAQ rules and regulations, including the Sarbanes-Oxley Act of 2002;
- •
- the timing of stock sales under 10b5-1 plans or otherwise; and
- •
- war and terrorism threats.
Our quarterly results of operations may fluctuate in the future, which could result in volatility in our stock price.
Our quarterly revenues and results of operations have varied in the past and may fluctuate as a result of a variety of factors, including the success of our new offerings. If our quarterly revenues or results of operations fluctuate, the price of our common stock could decline substantially. Fluctuations in our results of operations may be due to a number of factors, including, but not limited to, those listed below and identified throughout this "Risk Factors" section:
- •
- our ability to retain and increase sales to customers and attract new customers;
17
- •
- the timing and success of introductions of new solutions or upgrades by us or our competitors;
- •
- the strength of the economy;
- •
- changes in our pricing policies or those of our competitors;
- •
- competition, including entry into the industry by new competitors and new offerings by existing competitors;
- •
- the amount and timing of our expenses, including stock-based compensation and expenditures related to expanding our
operations, supporting new customers or introducing new solutions; and
- •
- changes in the payment terms for our solutions.
We do not intend to declare dividends on our stock in the foreseeable future.
We currently intend to retain all future earnings for the operation and expansion of our business and, therefore, do not anticipate declaring or paying cash dividends on our common stock in the foreseeable future. Any payment of cash dividends on our common stock will be at the discretion of our board of directors and will depend upon our results of operations, earnings, capital requirements, financial condition, future prospects, contractual restrictions and other factors deemed relevant by our board of directors. Therefore, you should not expect to receive dividend income from shares of our common stock.
Our governing documents and Minnesota law may discourage the potential acquisitions of our business.
Our Board of Directors may issue additional shares of capital stock and establish their rights, preferences and classes, in some cases without shareholder approval. In addition, we are subject to anti-takeover provisions of Minnesota law. These provisions may deter or discourage takeover attempts and other changes in control of us not approved by our Board of Directors. If potential acquirers are deterred, you may lose an opportunity to profit from a possible acquisition premium in our stock price.
Future finite lived intangibles and goodwill impairment may unpredictably affect our financial results.
We perform analyses of impairment to our finite lived intangibles when a triggering event occurs and to our goodwill at least annually or when we believe there may be impairment. Future events could cause us to conclude that impairment indicators exist and that goodwill and/or the finite lived intangibles associated with our acquired businesses are impaired. With the overall decline in the stock market, over the past several years, future potential decline in our stock price and the continued impact of the global economic downturn, it may become more likely that we would need to write down the carrying value of our assets and incur a current period charge to our earnings. Any resulting impairment loss could have a material adverse impact on our financial condition and results of operations.
Item 1B. Unresolved Staff Comments.
None.
We lease 106,000 square feet of an office and warehouse facility in Chanhassen, Minnesota. We occupy 54,000 of the 106,000 square feet as our corporate headquarters, including our principal technical operations and our integration, assembly and support service operations. The lease for this property expires April 2012 and we have notified our landlord that we will not be renewing our lease
18
and vacating the building as of the expiration date. As of December 31, 2011, our other 21 leased locations (which house sales and technical staffs) are small-to-medium-sized offices throughout the United States with terms ending from 2016.
In December 2004, we agreed to sublease approximately 52,000 of the 106,000 square feet we then occupied as our corporate headquarters in Chanhassen, Minnesota. The initial sublease term is co-terminal with our lease and is for 85 months starting in April 2005 and ending in April 2012. The sublessee will pay us rent ranging from approximately $55,000 per month at the beginning of the term to approximately $60,000 per month by the end of the term. In conjunction with the termination of our lease in April 2012 this sublease will also terminate.
As a result of our acquisition of certain assets of Midwave in October 2011, as tenant, we are the successor interest to a lease ("Original Lease") dated August 9, 2010. The Original Lease was for 20,851 square feet of office space. In December 2011, we entered into a First Amendment to Lease (the "Amendment") to the Original Lease for approximately 32,906 additional square feet of office space ("Expansion Space"), which provides us with approximately 54,000 total square feet available for our operations. We will be moving our corporate headquarters to this new location in April 2012. Under the terms of the Amendment, the term of the Original Lease is extended for 42 months from March 1, 2016 through August 31, 2019 and the term of the lease for the Expansion Space is for seven years and six months, commencing on March 1, 2012. We have the option to extend the term of the Lease for an additional five year term as long as certain conditions are met.
In addition, under the terms of the Amendment an allowance of up to $658,120 is available from our landlord for costs related to tenant improvements. If the cost of our tenant improvement is less than the allowance, then we may receive the remaining portion of the allowance, up to a maximum of $164,530, as a credit towards our rent payments.
In addition to our 22 leased facilities, we also have 8 additional office locations. Based on our present plans, we believe our current facilities, and the facilities that we will be occupying beginning in April 2012, will be adequate to meet our anticipated needs for at least the remaining terms of our respective leases.
We are not currently involved in any material legal proceedings.
Item 4. Mine Safety Disclosures.
Not applicable.
19
Item 5. Market for Registrant's Common Equity, Related Stockholder Matters and Issuer Purchases of Equity Securities.
Our common stock is quoted on the NASDAQ Global Market under the symbol "DTLK". The table below sets forth, for the calendar quarters indicated, the high and low per share closing sale prices of our common stock as reported by the NASDAQ Global Market.
| |
High | Low | |||||
|---|---|---|---|---|---|---|---|
Year Ended December 31, 2011 |
|||||||
First Quarter |
$ | 8.76 | $ | 4.50 | |||
Second Quarter |
8.16 | 5.94 | |||||
Third Quarter |
10.79 | 6.35 | |||||
Fourth Quarter |
9.87 | 7.08 | |||||
Year Ended December 31, 2010 |
|||||||
First Quarter |
4.69 | 4.16 | |||||
Second Quarter |
4.93 | 3.79 | |||||
Third Quarter |
3.92 | 2.93 | |||||
Fourth Quarter |
4.81 | 3.00 | |||||
On March 12, 2012, the closing price per share of our common stock was $9.38. We urge potential investors to obtain current market quotations before making any decision to invest in our common stock. On March 8, 2011, there were approximately 115 holders of common stock, including record holders and shareholders whose shares are held by a bank, broker or other nominee. However, we estimate that our shares are held through a small number of record holders by over 2,100 beneficial owners.
We have paid no dividends on our common stock since our initial public offering in 1999. We intend to retain future earnings for use in our business, and we do not anticipate paying any cash dividends on our common stock in the foreseeable future.
We did not purchase any of our securities during 2011, 2010, or 2009.
In October 2011, we entered into an asset purchase agreement with Midwave and its shareholders. Under the asset purchase agreement, we acquired substantially all of the assets used in Midwave's business. We paid a purchase price of approximately $19.1 million for Midwave. This was comprised of a cash payment of approximately $16.1 million and issuance of 220,988 shares of our common stock with a value of approximately $1.6 million delivered at closing and approximately $1.4 million related to working capital adjustments subsequent to closing. We issued the common stock to Midwave on October 3, 2011. The issuance of such shares were exempt from the registration requirement of the Securities Act of 1933, as amended, pursuant to Section 4(2) thereof and Rule 506 promulgated under Regulation D because, among other things such issuance did not involve a public offering and the shares were issued solely to an accredited investor. We did not have any unregistered sales of equity securities during 2010 or 2009.
You can find additional information about our equity compensation plans in Part III, Item 11 of this Annual Report.
20
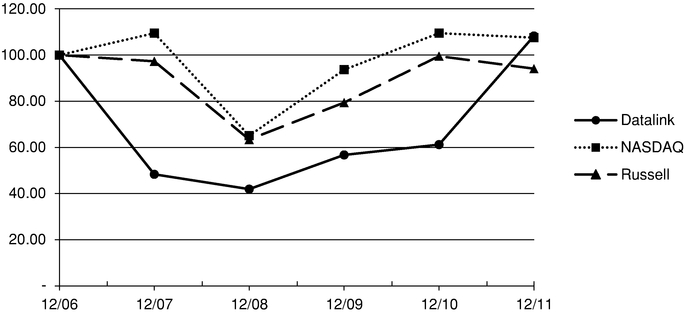
Stock Performance Graph
The graph below shows a comparison for the period commencing on December 31, 2006 and ending on December 31, 2011 of the annual percentage change in the cumulative total shareholder return for our common stock, assuming the investment of $100.00 on December 31, 2006, with the cumulative total shareholder returns for the NASDAQ Composite Index and the Russell 2000 Index, assuming the investment of $100.00 respectively on December 31, 2006. The shareholder returns over the indicated periods below are weighted based on market capitalization at the beginning of each measurement point and are not indicative of, or intended to forecast, future performance of our common stock. Data for the NASDAQ Composite Index and the Russell 2000 Index assumes reinvestment of dividends. We have never declared or paid dividends on our common stock and have no present plans to do so.
COMPARISON OF 5 YEAR CUMMULATIVE TOTAL RETURN
Among Datalink Corporation, The NASDAQ Composite Index
And The Russell 2000 Index
| |
12/31/06 | 12/31/07 | 12/31/08 | 12/31/09 | 12/31/10 | 12/31/11 | |||||||||||||
|---|---|---|---|---|---|---|---|---|---|---|---|---|---|---|---|---|---|---|---|
Datalink Corporation |
100.00 | 48.36 | 41.94 | 56.75 | 61.21 | 108.26 | |||||||||||||
NASDAQ Composite |
100.00 | 109.45 | 65.08 | 93.64 | 109.48 | 107.51 | |||||||||||||
Russell 2000 Index |
100.00 | 97.28 | 63.43 | 79.42 | 99.52 | 94.09 | |||||||||||||
21
Item 6. Selected Financial Data.
You should read the information below with our "Management's Discussion and Analysis of Financial Condition and Results of Operations" and our financial statements. The statement of operations data for the years ended December 31, 2011 and 2010, and 2009 and the balance sheet data as of December 31, 2011 and 2010 are derived from our audited financial statements included in this Annual Report. The statement of operations data for the years ended December 31, 2008 and 2007 and the balance sheet data as of December 31, 2009, 2008 and 2007 are derived from our audited financial statements not included in this Annual Report. We acquired Midwave in October 2011, Incentra in December 2009, the networking division of Cross in October 2009 and MCSI in January 2007. They are included in our financial statements beginning on those dates.
| |
Year ended December 31, | |||||||||||||||
|---|---|---|---|---|---|---|---|---|---|---|---|---|---|---|---|---|
| |
2011 | 2010 | 2009 | 2008 | 2007 | |||||||||||
| |
(in thousands, except per share data) |
|||||||||||||||
Statement of Operations Data: |
||||||||||||||||
Net sales: |
||||||||||||||||
Product sales |
$ | 245,743 | $ | 180,424 | $ | 94,788 | $ | 113,493 | $ | 111,201 | ||||||
Service sales |
134,284 | 113,255 | 83,294 | 82,104 | 66,571 | |||||||||||
Total net sales |
380,027 | 293,679 | 178,082 | 195,597 | 177,772 | |||||||||||
Cost of sales: |
||||||||||||||||
Cost of product sales |
188,384 | 140,984 | 71,303 | 84,980 | 84,369 | |||||||||||
Cost of services |
100,978 | 83,951 | 60,343 | 57,966 | 48,111 | |||||||||||
Amortization of intangibles |
1,053 | 1,108 | — | — | — | |||||||||||
Total cost of sales |
290,415 | 226,043 | 131,646 | 142,946 | 132,480 | |||||||||||
Gross profit |
89,612 | 67,636 | 46,436 | 52,651 | 45,292 | |||||||||||
Operating expenses: |
||||||||||||||||
Sales and marketing |
38,723 | 32,353 | 21,408 | 23,368 | 22,067 | |||||||||||
General and administrative |
15,468 | 14,092 | 11,943 | 11,902 | 11,720 | |||||||||||
Engineering |
17,535 | 15,652 | 11,650 | 11,590 | 9,181 | |||||||||||
Other income(5) |
(1,127 | ) | (503 | ) | — | — | — | |||||||||
Integration and transaction costs |
454 | 581 | 1,043 | — | 442 | |||||||||||
Amortization of finite-lived intangibles(1)(2)(3)(4) |
1,766 | 1,483 | 843 | 711 | 727 | |||||||||||
Total operating expenses |
72,819 | 63,658 | 46,887 | 47,571 | 44,137 | |||||||||||
Earnings (loss) from operations |
16,793 | 3,978 | (451 | ) | 5,080 | 1,155 | ||||||||||
Interest income, net |
50 | 14 | 94 | 589 | 983 | |||||||||||
Interest/other expense |
(40 | ) | — | (1 | ) | (37 | ) | (75 | ) | |||||||
Earnings (loss) before income taxes |
16,803 | 3,992 | (358 | ) | 5,632 | 2,063 | ||||||||||
Income tax expense |
6,958 | 1,690 | 197 | 2,236 | 864 | |||||||||||
Net earnings (loss) |
$ | 9,845 | $ | 2,302 | $ | (555 | ) | $ | 3,396 | $ | 1,199 | |||||
Net earnings (loss) per common share: |
||||||||||||||||
Basic |
$ | 0.62 | $ | 0.18 | $ | (0.04 | ) | $ | 0.27 | $ | 0.10 | |||||
Diluted |
$ | 0.61 | $ | 0.18 | $ | (0.04 | ) | $ | 0.27 | $ | 0.10 | |||||
Weighted average shares outstanding: |
||||||||||||||||
Basic |
15,803 | 12,801 | 12,550 | 12,370 | 12,156 | |||||||||||
Diluted |
16,213 | 12,981 | 12,550 | 12,495 | 12,392 | |||||||||||
22
| |
As of December 31, | |||||||||||||||
|---|---|---|---|---|---|---|---|---|---|---|---|---|---|---|---|---|
| |
2011 | 2010 | 2009 | 2008 | 2007 | |||||||||||
| |
(In thousands) |
|||||||||||||||
Selected Balance Sheet Data: |
||||||||||||||||
Cash and investments |
$ | 22,433 | $ | 8,988 | $ | 15,631 | $ | 27,730 | $ | 25,164 | ||||||
Working capital |
37,881 | 21,636 | 14,702 | 23,735 | 15,992 | |||||||||||
Total assets |
277,951 | 176,072 | 153,978 | 135,892 | 131,469 | |||||||||||
Stockholders' equity |
80,185 | 47,455 | 43,415 | 42,519 | 38,244 | |||||||||||
- (1)
- In
January 2007, we acquired MCSI. Therefore its results of operations are only included from the acquisition date forward. We recorded finite lived
intangibles, consisting of $4.3 million of customer relationships and $76,000 of backlog, which are amortized over their estimated lives of six years and two months, respectively. We incurred
integration costs of $442,000 in conjunction with the acquisition of MCSI.
- (2)
- In
October 2009, we completed our acquisition of Cross. We have included its results of operations beginning on the acquisition date. We recorded finite
lived intangibles, consisting of $67,000 for services agreement and $467,000 for certifications, which are amortized over their estimated lives of four years and two years, respectively.
- (3)
- In
December 2009, we acquired the reseller business of Incentra. Therefore its results of operations are only included from the acquisition date forward. We
recorded finite lived intangibles, consisting of $263,000 of trademarks, $1.1 million of backlog and $3.8 million of customer relationships, which are amortized over their estimated
lives of three years, 1 year and 8 years, respectively. In 2009 and 2010, we incurred integration costs of $1.0 million and $581,000, respectively, in conjunction with the
acquisition of Incentra's reseller business.
- (4)
- In
October 2011, we acquired Midwave. Therefore its results of operations are only included from the acquisition date forward. We recorded finite lived
intangibles consisting of $478,000 of covenants not to compete, $1.1 million of order backlog and $5.1 million of customer relationships, which are amortized over their estimates lives
of 3 years, 3 months and 5 years, respectively. In 2011, we incurred integration costs of $454,000 in conjunction with the acquisition of Midwave Corporation.
- (5)
- In conjunction with our Cross acquisition, we entered into an agreement, which required Cross to purchase at least $1.8 million of networking products and services from us over three years. The agreement was entered into outside of the acquisition and was assigned no fair value. Cross agreed to pay any shortfall between customer purchases and the guaranteed annual purchase amount. In September 2010 and 2011, the first and second years of the three year agreement came to an end and there was a shortfall paid by Cross of $503,000 and $574,000,respectively, which was recorded as other income since we had assumed that the revenue targets would be met. In October 2011, we entered into an agreement with Cross to allow for an early buyout of the remaining year of the agreement for which Cross paid $553,000.
23
Item 7. Management's Discussion and Analysis of Financial Condition and Results of Operations.
You should read the following discussion in conjunction with our financial statements and the related notes included in Item 8. The following information includes forward-looking statements, the realization of which may be affected by certain important factors discussed under "Risk Factors."
Overview
We provide solutions and services that make data centers more efficient, manageable and responsive to changing business needs. Focused on mid and large-size companies, we assess, design, deploy, and support infrastructures such as servers, storage and networks. We also resell hardware and software from the industry's leading OEMs as part of our customer offerings. Our portfolio of solutions and services spans four practices: consolidation and virtualization, data storage protection, advanced network infrastructures and business continuity and disaster recovery solutions. We offer a full suite of practice-specific consulting, analysis, design, implementation, management, and support services.
Our solutions can include hardware products, such as servers, disk arrays, tape systems, networking and interconnection components and software products. Our data center strategy is supported through multiple trends in the market and involves supporting the market and our customers with a single vendor to provide their data center infrastructure needs. As of December 31, 2011, we have 30 locations, including both leased facilities and home offices, throughout the United States. We historically have derived our greatest percentage of net sales from customers located in the central part of the United States.
We sell support service contracts to most of our customers. In about half of the support service contracts that we sell, our customers purchase support services through us, resulting in customers receiving the benefit of integrated system wide support. We have a qualified, independent support desk that takes calls from customers, diagnoses the issues they are facing and either solves the problem or coordinates with our and/or vendor technical staff to meet the customer's needs. Our support service agreements with our customers include an underlying agreement with the product manufacturer. The manufacturer provides on-site support assistance if necessary. The other half of the support service contracts that we sell to our customers are direct with the product manufacturers. For all support service contracts we sell, we defer revenues and direct costs resulting from these contracts, and amortize these revenues and expenses into operations, over the term of the contracts, which are generally twelve months.
The data center infrastructure solutions and services market is rapidly evolving and highly competitive. Our competition includes other independent storage, server and networking system integrators, high end value-added resellers, distributors, consultants and the internal sales force of our suppliers. Our ability to hire and retain qualified outside sales representatives and engineers with enterprise-class information storage, server and networking experience is critical to effectively competing in the marketplace and achieving our growth strategies.
In the past, we have experienced fluctuations in the timing of orders from our customers, and we expect to continue to experience these fluctuations in the future. These fluctuations have resulted from, among other things, the time required to design, test and evaluate our data center infrastructure solutions before customers deploy them, the size of customer orders, the complexity of our customers' network environments, necessary system configuration to deploy our solutions and new product introductions by suppliers. Current economic conditions and competition also affect our customers' decisions and timing to place orders with us and the size of those orders. As a result, our net sales may fluctuate from quarter to quarter.
We view the current data center infrastructure market as providing significant opportunity for growth. Currently, our market share is a small part of the overall market. However, the providers of
24
the data center infrastructure industry's products and technologies are increasing their utilization of indirect sales approaches to broaden their reach and optimize their margins. Increasingly, they are turning to companies such as us to sell their products. While these trends provide opportunity for us, we must improve our business model to generate sustainable, profitable growth. Our model requires highly skilled sales and technical staff which results in substantial fixed costs for us. We believe the best way to improve our company and create long-term shareholder value is to focus on building scaleable capabilities and a leverageable cost structure. Our current strategies are focused on:
- •
- Increasing our sales team productivity.
- •
- Scaling our existing geographic locations and expanding into new locations.
- •
- Expanding our customer support revenues.
- •
- Enhancing our consulting and professional services business.
- •
- Expanding our managed services portfolios.
To pursue these strategies, we are:
- •
- Improving our training, tools and recruiting efforts for sales and technical teams to increase productivity.
- •
- Investing in customer-facing teams to acquire top tier sales and technical talent which we believe will increase our
market share in key locations.
- •
- Deepening our presence in existing enterprise accounts and penetrating new enterprise accounts.
- •
- Exploring potential acquisitions that we believe can strengthen our resources and capabilities in key geographic
locations.
- •
- Targeting high growth market segments and deploying new technologies which focus on cost saving technologies for our
customers.
- •
- Driving high levels of efficiency by streamlining our supply chain and expanding our professional services tools.
- •
- Expanding our customer support capabilities and tools-based professional services offerings that we believe will provide more value to our customers.
All of these plans have various challenges and risks associated with them, including those described under "Risk Factors" in this Annual Report.
Acquisitions
Midwave Corporation. In October 2011, we entered into an asset purchase agreement with Midwave Corporation ("Midwave") and its shareholders. Under the asset purchase agreement we purchased and acquired from Midwave substantially all of the assets used in Midwave's business. Midwave is an information technology consulting firm that offers both professional services and sells products to business' information technology organizations utilizing the product portfolios of certain information technology manufacturers, in the specific domains of data center services, networking services, managed services and advisory services. We paid a purchase price of approximately $19.1 million, comprised of a cash payment of approximately $16.1 million delivered at closing and issued 220,988 shares of our common stock with a value of approximately $1.6 million and approximately $1.4 million related to working capital adjustments subsequent to closing.
This acquisition expanded our footprint in Minnesota making us the dominant data center services and infrastructure provider in the region. The acquisition also doubled our Cisco technology and services revenues, expanded our managed services portfolio with the addition of a data center
25
infrastructure monitoring service, added an established security practice including product, services and consulting and doubled the size of our consulting services team. We expect to experience operational synergies and efficiencies through combined general and administrative corporate functions. Our results for 2011 reflect the addition of Midwave for the fourth quarter. Please see Note 2 to our financial statements for further information.
Reseller Business of Incentra, LLC. In December 2009, we acquired the reseller business of Incentra, LLC ("Incentra") which designs, procures, implements and supports data center solutions with storage, networking, security and servers from leading manufacturers. We did not acquire Incentra's managed services portfolio and related operations. We accomplished the acquisition through the purchase of substantially all of the assets of Incentra's reseller business pursuant to an asset purchase agreement.
Under the asset purchase agreement, we paid Incentra $13.8 million. We paid $8.8 million at closing in cash, of which we held back $440,000 as security for certain indemnification obligations of Incentra. In addition, we paid Incentra $5.0 million for the working capital associated with Incentra's reseller business through the delivery of $2.0 million in cash and a $3.0 million secured promissory note. We paid the promissory note on March 31, 2010. During 2010 the final working capital adjustment was agreed to and the amount held back for indemnification was released, the net effect of which was a decrease in the purchase price of $32,000.
This acquisition doubled our presence in Chicago and the Northeast and provided us with a significant presence in the West. Our combined team now has expanded experience to design and implement complex data center solutions, which will deliver increased productivity and efficiency for our customers. We have experienced operational synergies and efficiencies through combined general and administrative corporate functions. Our results for 2009 reflect the addition of Incentra's reseller business for thirteen days. Please see Note 2 to our financial statements for further information.
Networking Solutions Division of Cross Telecom. In October 2009, we acquired the networking solutions division of Minneapolis-based Cross Telecom ("Cross"), which qualified as a business combination. We completed an asset purchase of $2.0 million, which was paid in cash. Simultaneously, Cross entered into a products and services agreement with us to purchase at least $1.8 million of Cisco networking products and services from us over the next three years. We believe the acquisition of this team of certified Cisco networking experts will be additive to our expertise in designing, implementing and managing sophisticated virtualized data center, storage and backup recovery solutions. In addition, we obtained Cross' Cisco Silver certification.
Cross has agreed to pay any shortfall between customer purchases and the guaranteed annual purchase amount. The agreement was entered into outside of the acquisition and was assigned no fair value. We estimated the fair values of the assets acquired to goodwill and finite lived intangibles, which consisted of the services agreement and certifications. They have estimated lives of four and two years, respectively, and we are amortizing them using the straight line method.
The first and second years of the three year products and services agreement came to an end at September 30, 2010 and 2011, respectively. Per the services agreement any shortfall between customer purchases and the guaranteed annual purchase amount would be payable by Cross at that time. At September 30, 2010 and 2011, there was a shortfall between customer purchases and the guaranteed annual purchase amount of $503,000 and $574,000, respectively. As discussed above, on October 1, 2009 we determined that the revenue targets would be met and the products and services agreement had no fair value. Therefore, the shortfall amount of $503,000 and $574,000, for years one and two respectively, represented a change in fair value of the acquisition date products and services agreement and in accordance with ASC 805-30-35 was classified as other income within operating expenses on our statement of operations. In October 2011, we entered into an agreement with Cross to allow for an early buyout of the third year products and services agreement for which Cross paid $553,000. This
26
early buyout also represented a change in fair value of the acquisition date and in accordance with ASC 805-30-35 was classified as other income within operating expenses on our statement of operations. Please see note 2 to our financial statements for further information.
Critical Accounting Policies and Estimates
Our discussion and analysis of our financial condition and results of operations are based upon our financial statements, which we have prepared in accordance with generally accepted accounting principles (GAAP) in the United States of America. The preparation of these financial statements required us to make estimates and judgments that affect the reported amounts of assets, liabilities, revenues and expenses and the related disclosure of contingent assets and liabilities.
Note 1 of the Notes to our Financial Statements describes the significant accounting policies we used in the preparation of our financial statements. We consider some of these significant accounting policies as "critical accounting policies". A "critical accounting policy" is both material to the presentation of our financial statements and requires our management to make difficult, subjective or complex judgments that could have a material effect on our financial condition or results of operations. More specifically, critical accounting policies require us to make assumptions about highly uncertain matters at the time of the estimate. They also require us to consider different estimates we could reasonably have used, or changes in our estimate that are reasonably likely to occur, which would have a material effect on our financial condition or results of operations.
We cannot determine estimates and assumptions about future events and their effects with certainty. On an on-going basis, we evaluate our estimates against historical experience and various other assumptions we believe applicable and reasonable under the circumstances. Our estimates may change as new events occur, as we obtain additional information and as our operating environment changes. These changes have historically been minor and we have included them in our financial statements as soon as we learned of them. Our management reviews the development and selection of our critical accounting policies and estimates with our Audit Committee. We have consistently applied our critical accounting policies throughout our accompanying financial statements.
Recent Accounting Policy Change
In October 2009, the FASB amended the Accounting Standards Codification ("ASC") as summarized in Accounting Standards Update ("ASU") No. 2009-14, Software (Topic 985): Certain Revenue Arrangements That Include Software Elements, and ASU No. 2009-13, Revenue Recognition (Topic 605): Multiple-Deliverable Revenue Arrangements. ASU 2009-14 amends industry specific revenue accounting guidance for software and software related transactions to exclude from its scope tangible products containing software components and non-software components that function together to deliver the product's essential functionality, or what we refer to as essential software. We also sell non-essential software, which continues to be in the scope of ASC 985-605. ASU 2009-13 amends the accounting for multiple-element arrangements to provide guidance on how the deliverables in an arrangement should be separated and eliminates the use of the residual method. ASU 2009-13 also requires an entity to allocate revenue using the relative selling price method.
Effective January 1, 2011, we adopted the provisions of ASU 2009-13 and ASU 2009-14 for new and materially modified arrangements originating on or after January 1, 2011. The adoption of ASU 2009-13 and ASU 2009-14 had a material impact on our financial results.
27
The following table shows total net revenues as reported as a result of the adoption of ASU 2009-13 and ASU 2009-14 and unaudited total net revenues that would have been reported during the year ended December 31, 2011 had we not adopted ASU 2009-13 and ASU 2009-14:
| |
As Reported | As if the Previous Accounting Guidance Was in Effect |
|||||
|---|---|---|---|---|---|---|---|
| |
(in thousands) |
||||||
Total net revenue for the year ended December 31, 2011 |
$ | 380,027 | $ | 345,772 | |||
The above table represents an increase in total net revenues of $34.3 million for the year ended December 31, 2011. The increase in total net revenues was due to the recognition of revenue that would have been previously deferred for multiple-element arrangements, which include professional services and hardware, software, post contract customer support ("PCS") or other deliverables, where the final undelivered element for which we were unable to establish vender-specific objective evidence ("VSOE") (as discussed in more detail below) of fair value was professional services. Under the previous accounting guidance, since we could only establish VSOE for PCS, all revenue in these multiple-element arrangements was deferred until the only remaining undelivered element was PCS. At that point, revenue was recognized for the delivered elements in an amount based on the residual method of allocation using VSOE for PCS. The new standard allows for deliverables for which revenue would have been previously deferred to be separated into units of accounting with amounts allocated based on stand-alone selling price if the delivered elements have stand-alone value. As a result, revenue is now recognized as each element is delivered, rather than deferred until the only remaining undelivered element is PCS.
For sales prior to 2011, we recognize revenue based on software revenue recognition guidance. Under the software revenue recognition guidance, we use the residual method to recognize revenue when a multiple element arrangement includes one or more elements to be delivered at a future date and VSOE of fair value of all undelivered elements exists. In the majority of our contracts, the only element that remains undelivered at the time of delivery of the product is PCS and/or service. Under the residual method, the fair value of the undelivered elements is deferred and the remaining portion of the contract is recognized as product revenues. If evidence of the fair value of one or more undelivered elements does not exist, all revenue is generally deferred until the earlier of when delivery of those elements occurs or when fair value can be established.
We expect the adoptions of ASU 2009-13 and ASU 2009-14 to have a material impact on future periods, however we cannot reasonably estimate the effect of adopting these standards on future financial periods as the impact will vary depending on the nature and volume of new or materially modified arrangements in any given period.
Refer to the "Change in Accounting Policy" located in Footnote 1. Basis of Presentation, above for more details regarding the change in accounting principle.
28
Results of Operations
Our sales increased $86.3 million or 29.4% to $380.0 million for 2011 as compared to 2010. Our gross profit increased $22.0 million or 32.5% to $89.6 million for 2011 as compared to 2010. Our earnings from operations increased $12.8 million or 322% to $16.8 million for 2011 as compared to 2010. The following table shows, for the periods indicated, certain selected financial data expressed as a percentage of net sales.
| |
Year Ended December 31, |
|||||||||
|---|---|---|---|---|---|---|---|---|---|---|
| |
2011 | 2010 | 2009 | |||||||
Net sales |
100.0 | % | 100.0 | % | 100.0 | % | ||||
Cost of sales |
76.4 | 77.0 | 73.9 | |||||||
Gross profit |
23.6 | 23.0 | 26.1 | |||||||
Operating expenses: |
||||||||||
Sales and marketing |
10.2 | 11.0 | 12.0 | |||||||
General and administrative |
4.1 | 4.8 | 6.7 | |||||||
Engineering |
4.6 | 5.3 | 6.5 | |||||||
Other income |
(0.3 | ) | (0.2 | ) | — | |||||
Integration costs |
0.1 | 0.2 | 0.6 | |||||||
Amortization of intangibles |
0.5 | 0.5 | 0.5 | |||||||
Total operating expenses |
19.2 | 21.6 | 26.3 | |||||||
Operating earnings (loss) |
4.4 | % | 1.4 | % | (0.3 | )% | ||||
Comparison of 2011, 2010 and 2009
Sales, Gross Profit and Gross Profit Percentage:
The following table shows, for the periods indicated, sales and gross profit information for our product and service sales.
| |
Year Ended December 31, |
|||||||||
|---|---|---|---|---|---|---|---|---|---|---|
| |
2011 | 2010 | 2009 | |||||||
| |
(in thousands) |
|||||||||
Product sales |
$ | 245,743 | $ | 180,424 | $ | 94,788 | ||||
Service sales |
134,284 | 113,255 | 83,294 | |||||||
Product gross profit |
$ |
56,306 |
$ |
38,332 |
$ |
23,485 |
||||
Service gross profit |
33,306 | 29,304 | 22,951 | |||||||
Product gross profit as a percentage of product sales |
22.9 |
% |
21.2 |
% |
24.8 |
% |
||||
Service gross profit as a percentage of service sales |
24.8 | % | 25.9 | % | 27.6 | % | ||||
Sales. Our product sales increased 36.2% in 2011 from 2010 up to $245.7 million and increased 90.3% in 2010 from 2009 up to $180.4 million. Our service sales, which includes customer support, consulting and installation services, increased 18.6% in 2011 over 2010 to $134.3 million and increased 36.0% in 2010 over 2009 to $113.3 million. Our 2011 results for both product sale and service sales include revenues of approximately $13.0 million from the acquisition of Midwave.
The increase in our products sales in 2011 as compared to 2010, reflect the impact of our Midwave acquisition in October 2011, the change in our revenue recognition policy and the increase in product offerings due to our transition to servicing the complete data center. In addition to storage, our server
29
and network sales have increased as part of our strategy to deliver data center hardware, software and services. The increase in our products sales in 2010 as compared to 2009, reflect the impact of our acquisition of Incentra in December 2009, a general increase in IT spending in 2010, and the impact of our diversification in the mix of product offerings due to our transition to servicing the complete data center. Our more recent product sales continue to reflect our customers' closer scrutiny of expenditures as they focus more attention on the actual or anticipated impact that current economic conditions may have on the growth and profitability of their businesses. We cannot assure that changes in customer spending or economic conditions will positively impact our future product revenues in 2012.
Our services sales increased in 2011 over 2010. The increase in services sales included an increase in customer support contract sales of $18.1 million of 18.9% over 2010 and an increase in installation and configuration services of $2.8 million or 22.5% over 2010. With the growth in our product sales, we continue to successfully sell our installation and configuration services and customer support contracts. The increase in our services sales for 2010 over 2009 included an increase in customer support contract sales of $22.8 million or 31.1% over 2009 and an increase in installation and configuration services of $7.6 million or 77.8% over 2009. The increase in service sales in 2010 reflects the impact of our acquisition of Incentra in December 2009. Without sustainable growth in our product sales going forward, we expect that our customer support contracts sales may suffer and we cannot assure that our future customer support contract sales will not decline.
We had no single customer account for 10% or greater of either our product or service sales for the years 2011, 2010 or 2009.
Gross Profit. Our total gross profit as a percentage of net sales was 23.6% in 2011, increasing from 23.0% in 2010 and decreasing from 26.1% in 2009. Our total gross profit for 2011 and 2010 includes amortization of intangibles of $1.1 million and $1.1 million, respectively, related to order backlog acquired in connection with our Midwave acquisition in 2011 and our Incentra acquisition in 2009. These finite lived intangible assets each have an estimated life of three months and one year and were each fully amortized in 2011 and 2010, respectively.
Product gross profit as a percentage of product sales was 22.9% in 2011 as compared to 21.2% in 2010 and 24.8% in 2009. Our product gross profit as a percentage of product sales is impacted by the mix and type of projects we complete for our customers. Our product gross profit as a percentage of product sales for 2011 over 2010 has improved as our strategy of selling total solutions into the data center has matured. Our product gross profit as a percentage of product sales for 2010 over 2009 was lower than prior years as we implemented our strategy of selling total solutions into the data center, which includes lower margin servers and networking solutions. We expect that as we continue implementing our strategy to sell comprehensive data center solutions with servers and networking products that our product gross margins for 2012 will be between 21% and 23%.
Our product gross profit is also impacted by the various programs we have in place with our vendors that provide economic incentives for achieving various sales performance targets and early payment of invoices. Achieving these targets contributed favorably to our product gross profit by $5.8 million (3% of product cost of sales), $4.1 million (3% of product cost of sales) and $2.0 million (3% of product cost of sales) in 2011, 2010 and 2009, respectively. These vendor programs constantly change and we negotiate them separately with each vendor. While we expect the incentive and early pay programs to continue, the vendors could modify or discontinue them, particularly in light of current economic conditions, which would unfavorably impact our product gross profit margins.
30
Service gross profit as a percentage of service sales was 24.8% in 2011 as compared to 25.9% in 2010 and 27.6% in 2009. In 2011, our decrease in service gross profit is due to an increase in the sales of products on which we are not able to sell first call support and Datalink professional services, which carry lower gross margins. In 2010, our decrease in service gross profit was in part due to $853,000 of Incentra-related acquisition accounting adjustments to reduce acquired maintenance contracts to fair value. Excluding these adjustments, service gross profit margin would have been 26.6% for 2010. In addition, we have experienced a decrease in the mix of products we can provide first call maintenance support for which generally have higher margins. We estimate that our service gross margins for 2012 will be between 24% and 26%.
Operating Expenses:
| |
Year Ended December 31, |
|||||||||
|---|---|---|---|---|---|---|---|---|---|---|
| |
2011 | 2010 | 2009 | |||||||
| |
(in thousands) |
|||||||||
Sales and marketing |
$ | 38,723 | $ | 32,353 | $ | 21,408 | ||||
General and administrative |
15,468 | 14,092 | 11,943 | |||||||
Engineering |
17,535 | 15,652 | 11,650 | |||||||
Other income |
(1,127 | ) | (503 | ) | — | |||||
Integration and transaction costs |
454 | 581 | 1,043 | |||||||
Amortization of intangibles |
1,766 | 1,483 | 843 | |||||||
Total operating expenses |
$ | 72,819 | $ | 63,658 | $ | 46,887 | ||||
Sales and Marketing. Sales and marketing expenses include wages and commissions paid to sales and marketing personnel, travel costs and advertising, promotion and hiring expenses. Sales and marketing expenses totaled $38.7 million, or 10.2% of net sales for 2011 as compared to $32.4 million, or 11.0% of net sales for 2010 and $21.4 million, or 12.0% of net sales for 2009. The increase in sales and marketing expenses in absolute dollars for 2011 over 2010 is due to increase in our sales and marketing headcount from the Midwave acquisition and higher variable compensation and commissions as related to our increase in sales for 2011. The increase in sales and marketing expenses in absolute dollars for 2010 over 2009 was due to an increase in compensation expenses in connection with our Incentra acquisition, which increased our sales and marketing headcount by approximately 73%. The decrease in sales and marketing expenses as a percentage of sales from 2011 to 2010 and 2010 to 2009, respectively, reflects the improvement in revenues per employee we have realized as part of our growth strategy. As we continue to selectively hire additional outside sales representatives, our sales and marketing expenses may increase without a commensurate increase in sales.
General and Administrative. General and administrative expenses include wages for administrative personnel, professional fees, depreciation, communication expenses and rent and related facility expenses. General and administrative expenses increased to $ 15.5 million or 4.1% of net sales as compared to $14.1 million or 4.8% of net sales for 2010 and $11.9 million, or 6.7% of net sales for 2009. Our general and administrative expenses increased $1.4 million in 2011 as compared to 2010, but as a percentage of net sales it decreased to 4.1% from 4.8% in 2010. Our general and administrative expenses increased $2.1 million in 2010 as compared to 2009, but as a percentage of net sales it decreased to 4.8% from 6.7% in 2009. The increase in general and administrative expenses for 2011 was due to a combination of an increase in bonus variable compensation of $416,000 commensurate with the increase in sales and gross margins for 2011 and an increase in stock compensation expense of $399,000 due to additional grants issued in 2011. The increase in general and administrative expenses for 2010 was due to increased rent and facility charges of $1.3 million for the addition of Incentra offices we acquired and expenses of $536,000 for our 2010 national sales meeting. The decrease in general and administrative expenses as a percentage of net sales, in 2010 as compared to 2009, reflects
31
the impact of a modest increase in expenses related to the Incentra acquisition to support a significant increase in revenues. General and administrative expenses in 2009 included $558,000 of severance agreement payments for several of our former executives.
Engineering. Engineering expenses include employee wages and travel, hiring and training expenses for our field and customer support engineers and technicians. We allocate engineering costs associated with installation and configuration services and with consulting services to our cost of service sales. Engineering expenses increased to $17.5 million, or 4.6% of net sales in 2011 compared to $15.7 million, or 5.3% of net sales in 2010 and $11.7 million, or 6.5% of net sales in 2009. The increase in engineering expenses in absolute dollars for 2011 over 2010 is primarily due to the Midwave acquisition, which increased engineering headcount by approximately 82% in the fourth quarter of 2011. The increase in engineering expenses in absolute dollars for 2010 over 2009 is primarily due to an increase in compensation expense in connection with our Incentra acquisition, which increased our engineering headcount by approximately 31%. The decreases in engineering expenses as a percentage of sales, for 2011 as compared to 2010, and 2010 as compared to 2009, respectively, is primarily a result of a greater percentage of our engineering costs being allocated to our cost of service sales since a greater percentage of our installation and configuration services were performed by our engineering personnel.
Other Income. For 2011, 2010 and 2009 we had other income of $1.1 million, $503,000 and $0, respectively. Our Cross acquisition included a reverse earn-out agreement, which required Cross to purchase at least $1.8 million of networking products and services from us over three years. Cross agreed to pay any shortfall between customer purchases and the guaranteed annual purchase amount. We believed that we would meet the revenue targets and accordingly, we determined that the reverse earn-out had no fair value at the date of this business combination or in any subsequent periods prior to the settlement date. At September 30, 2010 and 2011, as the first and second years of the three year reverse earn-out agreement came to an end, there was a shortfall between customer purchases and the guaranteed annual purchase of $574,000 and $503,000, respectively. Per the services agreement any shortfall between customer purchases and the guaranteed annual purchase amount would be payable by Cross at that time. Since we had assumed that the revenue targets would be met and the reverse earn-out had no fair value, the shortfall amounts of $574,000 and $503,000 represented a change in fair value of the acquisition date reverse earn-out and, in accordance with ASC 805-30-35 was classified as other income within operation expenses on our statement of operations. In addition, in October 2011, we entered into an agreement with Cross to allow for an early buyout of the third year reverse earn-out agreement for which Cross paid $553,000. This early buyout also represented a change in fair value of the acquisition date and in accordance with ASC 805-30-35 was classified as other income within operating expenses on our statement of operations.
Integration and Transaction Costs. We had integration expenses of $454,000, $ 581,000 and $1.0 million in 2011, 2010 and 2009, respectively. In 2011, we incurred the majority of these expenses for the acquisition of Midwave in October 2011. Integration and transaction expenses in 2011 for the Midwave acquisition included audit, legal and other outside consulting fees and expenses for our transition services agreements with former Midwave employees. In 2010 and 2009, we incurred the majority of these expenses for the acquisition of the reseller business of Incentra in December 2009. Integration expenses in 2010 for the Incentra acquisition are related to facility abandonment costs and our transition services agreement which consists of transition benefits, retention bonuses and severances of terminated employees, some of whom assisted with the initial integration of Incentra. Integration and transaction expenses in 2009 for the Incentra acquisition included audit, legal and other outside consulting fees, expenses for our transition services agreement with Incentra and severance payments.
Intangible Amortization. We had expenses related to the amortization of finite-lived intangible assets of $1.8 million, $1.5 million and $843,000 in 2011, 2010 and 2009, respectively. Amortization of
32
intangible assets increased in 2011 and 2010 from 2009 due to the acquisition of Midwave, the networking solutions division of Cross and the Incentra reseller business. The finite-lived intangibles we acquired in our acquisition of Midwave consisted of covenants not to compete, order backlog and customer relationships having estimated lives of 3 years, 3 months and 5 years, respectively. The finite-lived intangibles we acquired in our acquisition of the networking solutions division of Cross consisted of a services agreement and certifications having estimated lives of four years and two years, respectively. The finite-lived intangibles we acquired in our Incentra reseller business acquisition consisted of trademarks, order backlog and customer relationships having estimated lives of three years, one year and eight years, respectively. Our amortization expenses also include the finite lived intangibles we acquired in our 2007 MCSI acquisition consisting of customer relationships having an estimated life of six years. We are amortizing all of these finite-lived intangible assets using the straight line method. We expect amortization expense to be approximately $2.5 million in 2012.
We perform an impairment test for finite-lived intangible assets and other long-lived assets, such as fixed assets, whenever events or changes in circumstances indicate that we may not recover the carrying value of such assets. We recognize impairment based on the difference between the fair value of the asset and its carrying value. We generally measure fair value based on discounted cash flow analyses. For 2011, 2010 and 2009, we identified no triggering events that required us to evaluate the impairment of our long-lived assets.
Operating Earnings:
| |
Years Ended December 31, | |||||||||
|---|---|---|---|---|---|---|---|---|---|---|
| |
2011 | 2010 | 2009 | |||||||
| |
(in thousands) |
|||||||||
Earnings (loss) from operations |
$ | 16,793 | $ | 3,978 | $ | (451 | ) | |||
We realized earnings from operations of $16.8 million and $4.0 million in 2011 and 2010, respectively. We realized a loss from operations of $451,000 in 2009. Our earnings from operations in 2011 and 2010 are a result of our higher revenues and gross margins as we realized the benefits of our Midwave and Incentra acquisitions and the implementation of our strategy to sell products and services to support the entire data center. Our loss from operations in 2009 is a result of a decrease in our revenues and margins due to the current economic downturn and integration and transaction costs we incurred in conjunction with our acquisition of Incentra's reseller business.
Income Taxes:
| |
Year Ended December 31, | |||||||||
|---|---|---|---|---|---|---|---|---|---|---|
| |
2011 | 2010 | 2009 | |||||||
| |
(in thousands) |
|||||||||
Income tax expense |
$ | 6,958 | $ | 1,690 | $ | 197 | ||||
We had income tax expense of $7.0 million in 2011 which resulted in our estimated effective tax rate of 41%. We had income tax expense of $1.7 million in 2010 which resulted in our estimated effective tax rate of 42%. We had income tax expense of $197,000 in 2009 which resulted in our estimated effective tax rate of (55%). For 2009, we had income tax expense despite our loss position due to certain permanent differences, including those for meals and entertainment and incentive stock compensation expense. As of December 31, 2011 and 2010, we had $0 and $4.6 million, respectively, of federal net operating carryforwards that will expire in 2028. Also as of those dates, we had $1.7 million and $6.9 million, respectively, of state net operating loss carryforwards to offset future state taxable income. These state tax carryforwards expire between 2013 and 2028. For 2011 we recorded approximately $449,500 of tax benefits to equity associated with the exercise of stock options. For 2010 and 2009, respectively, we recorded approximately $15,800 and $1,300 to equity for tax expenses
33
associated with the exercise of stock options. In future periods of taxable earnings, we expect to report an income tax provision using an effective tax rate of approximately 40% to 44%.
Quarterly Results and Seasonality
The following table sets forth our unaudited quarterly financial data for each quarter of 2011 and 2010. We have prepared this unaudited information on the same basis as our audited information. In our opinion, we have made all adjustments (including all normal recurring adjustments) necessary to present fairly the information set forth below. The operating results for any quarter are not necessarily indicative of results for any future period.
| |
Quarter Ended | ||||||||||||||||||||||||
|---|---|---|---|---|---|---|---|---|---|---|---|---|---|---|---|---|---|---|---|---|---|---|---|---|---|
| |
2011 | 2010 | |||||||||||||||||||||||
| |
Mar. 31 | Jun. 30 | Sep. 30 | Dec. 31 | Mar. 31 | Jun. 30 | Sep. 30 | Dec. 31 | |||||||||||||||||
| |
(in thousands) |
||||||||||||||||||||||||
Net sales |
$ | 85,694 | $ | 89,481 | $ | 90,140 | $ | 114,712 | $ | 62,544 | $ | 70,875 | $ | 69,220 | $ | 91,040 | |||||||||
Gross profit |
20,755 | 21,679 | 21,240 | 25,938 | 14,332 | 16,760 | 16,665 | 19,879 | |||||||||||||||||
Operating earnings (loss) |
3,000 | 4,379 | 4,859 | 4,555 | (1,535 | ) | (65 | ) | 1,425 | 4,153 | |||||||||||||||
Net earnings (loss) |
1,748 | 2,697 | 2,793 | 2,607 | (891 | ) | 5 | 771 | 2,417 | ||||||||||||||||
We have experienced, and expect to continue to experience, quarterly variations in our net sales as a result of a number of factors, including the length of the sales cycle with customers for large data center evaluations and purchases, delays in data center installations or configurations, new product introductions by suppliers and their market acceptance, delays in product shipments or other quality control difficulties, and trends in the data center industry in general or the geographic and industry specific markets in which we operate now or in the future. In addition, current economic conditions and competition also affect our customers' decisions to place or delay orders with us, and the size and scale of their orders. Further, our success in integrating any acquired business or in opening any new field offices could impact our operating results.
Liquidity and Capital Resources
| |
Year ended December 31, | |||||||||
|---|---|---|---|---|---|---|---|---|---|---|
| |
2011 | 2010 | 2009 | |||||||
| |
(in thousands) |
|||||||||
Total cash provided by (used in): |
||||||||||
Operating activities |
$ | 13,325 | $ | (2,525 | ) | $ | 686 | |||
Investing activities |
(22,130 | ) | 1,467 | (14,008 | ) | |||||
Financing activities |
18,764 | (2,855 | ) | (34 | ) | |||||
Increase (decrease) in cash and cash equivalents |
$ | 9,959 | $ | (3,913 | ) | $ | (13,356 | ) | ||
We finance our operations and capital requirements through cash flows generated from operations. Our working capital was $37.9 million at December 31, 2011 as compared to $21.6 million at December 31, 2010. At December 31, 2011, our cash and cash equivalents balance was $18.9 million as compared to cash and cash equivalents of $8.9 million at December 31, 2010.
Cash provided by operating activities for 2011 was $13.3 million. Cash provided by operating activities for 2011 was primarily impacted by:
- •
- Our net earnings for the year of $9.8 million.
- •
- Non-cash charges of $2.8 million, $2.6 million and $1.0 million for amortization of intangibles, stock compensation expense and depreciation, respectively.
34
- •
- A net increase in certain working capital items (accounts receivable, inventories, accounts payable and accrued expenses)
of $5.9 million reflecting our increase in revenues for the year
- •
- A net $2.5 million increase in deferred customer support contracts. While we amortize the revenues from these contracts over the life of the contract, the customer typically pays for the contracts at the beginning of the contract period which favorably impacts our cash flows.
Cash used in operating activities for 2010 was $2.5 million. Cash used in operating activities for 2010 was primarily impacted by:
- •
- Our net earnings for the year of $2.3 million.
- •
- Non-cash charges of $2.6 million, $1.6 million and $945,000 for amortization of intangibles,
stock compensation expense and depreciation, respectively.
- •
- A net increase in certain working capital items (accounts receivable, inventories, accounts payable and accrued expenses)
of $13.5 million reflecting our increase in revenues for the year
- •
- A net $2.2 million increase in deferred customer support contracts. While we amortize the revenues from these contracts over the life of the contract, the customer typically pays for the contracts at the beginning of the contract period which favorably impacts our cash flows.
Cash provided by operating activities for 2009 was $686,000. Cash provided by operating activities for 2009 was primarily impacted by:
- •
- A net loss for the year of $555,000.
- •
- An increase in deferred income taxes of $2.9 million primarily related to an accounting method change with the IRS
for income tax purposes.
- •
- A net decrease in certain working capital items (accounts receivable, inventories and accounts payable) of
$4.5 million reflecting our overall lower revenues for the year.
- •
- A non-cash charge of $1.5 million for stock compensation expense.
- •
- A non-cash charge of $1.7 million for depreciation and amortization of intangibles.
Cash used in investing activities was $22.1 million in 2011. In 2011, our primary use of cash for investing activities was to complete our October 2011 acquisition of Midwave. In addition, we invested a net amount of $3.5 million in short-term investments. Cash provided by investing activities was $1.5 million in 2010 primarily from proceeds from short-term investments of $2.7 million, which was offset by purchases of $1.3 million for upgraded computer equipment and leasehold improvements. Cash used in investing activities was $14.0 million in 2009. In 2009, our primary use of cash for investing activities was to complete our October 2009 acquisition for the networking solutions division of Cross and our December 2009 acquisition for the Incentra reseller business. In addition, we invested an additional $1.3 million in short-term investments.
We are planning for $1.5 million to $2.0 million of capital expenditures during 2012 primarily related to enhancements to our management information systems and upgraded computer equipment.
Cash provided by financing activities was $18.8 million in 2011. Cash used in financing activities in 2010 and 2009 was $2.8 million and $34,000, respectively. In March 2011, we completed a public offering of 4,266,500 shares of common stock with a price to the public of $5.75 per share. We issued and sold 3,306,500 shares in the offering which resulted in approximately $17.5 million in cash received by us. A selling shareholder also sold 960,000 shares in the offering, but we did not receive any proceeds from the shares sold by the selling shareholder. In 2010, we used $3.0 million of cash to repay our Incentra acquisition promissory note. In 2009, we used cash primarily for the redemption of restricted shares for tax withholding payments.
35
We have an eleven year non-cancelable operating lease for our corporate headquarters in Chanhassen, Minnesota which expires in 2012. The lease requires annual base rental payments for approximately $1.3 million. In December 2004, we agreed to sublease approximately $2,000 of the 106,000 square feet we then occupied. The initial term of the sublease is co-terminal with our lease and is for 85 months starting in April 2005 and ending in April 2012. The sublease requires rent payments ranging from $55,000 per month at the beginning of the term to approximately $60,000 per month by the end of the term. For more information, see Note 6 of the Notes to our Financial Statements.
Pursuant to our acquisition of Midwave in October 2011, we paid a purchase price of approximately $19.1 million, comprised of a cash payment of approximately $16.1 million and issued 220,988 shares of our common stock with a value of approximately $1.6 million delivered at closing and approximately $1.4 million related to working capital adjustments subsequent to closing.
In December 2009, pursuant to our Incentra acquisition, we paid Incentra $13.8 million. We paid $8.8 million at closing in cash, of which we held back $440,000 as security for certain indemnification obligations of Incentra. In addition, we paid Incentra $5.0 million for the working capital associated with Incentra's reseller business through the delivery of $2.0 million in cash and a $3.0 million secured promissory note. The promissory note was paid on March 31, 2010. During 2010 the final working capital adjustment was agreed to and the amount held back for indemnification was released, the net effect was a decrease in the purchase price of $32,000.
In October 2009, we purchased the assets of Cross for $2.0 million in cash. In connection with the acquisition, we entered into a three year products and services agreement with Cross where they agreed to pay any shortfall between customer purchases and the guaranteed annual purchase amount. At September 30, 3010 and 2011, there was a shortfall between customer purchases and the guaranteed annual purchase amount of $503,000 and $574,000, respectively. In October 2011, we entered into an agreement with Cross to allow for an early buyout of the remaining year of the agreement for which Cross paid $553,000.
In March 2011, we entered into a Credit Agreement with Wells Fargo Bank, N.A. The Credit Agreement provides for a line of credit not to exceed $10.0 million for general working capital purposes. The line of credit is secured by substantially all of our personal property and expires on July 31, 2012. Borrowings under the line of credit are limited to three times the aggregate of our EBITDA (as defined in the Credit Agreement) for the trailing two fiscal quarters. The Credit Agreement also requires that we have working capital of not less than $15.0 million at each fiscal quarter-end, and certain levels of net income after taxes. As of December 31, 2011, we had no borrowings outstanding on the line of credit and, based on the borrowing base requirements, could borrow the full $10.0 million available.
Off-Balance Sheet Arrangements
We do not have any special purpose entities or off-balance sheet financing.
36
Contractual Obligations and Commitments
As of December 31, 2011, our contractual cash obligations consist of future minimum lease payments due by period under non-cancelable operating leases as follows:
| |
Total | Less than 1 year |
1-3 years | 3-5 years | More than 5 years |
|||||||||||
|---|---|---|---|---|---|---|---|---|---|---|---|---|---|---|---|---|
| |
(in thousands) |
|||||||||||||||
Operating lease obligations |
$ | 7,162 | $ | 1,479 | $ | 3,032 | $ | 2,159 | $ | 492 | ||||||
Sublease obligations |
(341 | ) | (273 | ) | (68 | ) | — | — | ||||||||
Net operating lease obligations |
$ | 6,821 | $ | 1,206 | $ | 2,964 | $ | 2,159 | $ | 492 | ||||||
We have an eleven-year non-cancelable operating lease for our corporate headquarters in Chanhassen, Minnesota which expires in April 2012. The lease requires annual base rental payments of approximately $1.3 million. In December 2004, we agreed to sublease approximately 52,000 of the 106,000 square feet we then occupied. The initial term of the sublease is co-terminal with our lease and is for 85 months starting in April 2005 and ending in April 2012. The sublease requires rent payments ranging from $55,000 per month at the beginning of the term to approximately $60,000 per month by the end of the term. For more information, see Note 6 of the Notes to our Financial Statements.
As a result of our acquisition of certain assets of Midwave in October 2011, as tenant, we are the successor interest to the Original Lease. The Original Lease was for 20,851 square feet of office space. In December 2011, we entered into the Amendment to the Original Lease for the Expansion Space, which provides us with approximately 54,000 total square feet available for our operations. We will be moving our corporate headquarters to this new location in April 2012. Under the terms of the Amendment, the term of the Original Lease is extended for 42 months from March 1, 2016 through August 31, 2019 and the term of the lease for the Expansion Space is for seven years and six months, commencing on March 1, 2012. We have the option to extend the term of the Lease for an additional five year term as long as certain conditions are met.
In addition, under the terms of the Amendment an allowance of up to $658,120 is available from our landlord for costs related to tenant improvements. If the cost of our tenant improvement is less than the allowance, then we may receive the remaining portion of the allowance, up to a maximum of $164,530, as a credit towards our rent payments.
We periodically enter into purchase commitments with our suppliers under customary purchase order terms. We would recognize any significant losses implicit in these contracts in accordance with generally accepted accounting principles. At December 31, 2011, we were not obligated to purchase any goods or services from our suppliers and no such losses existed.
Critical Accounting Estimates
The preparation of financial statements requires us to make estimates and assumptions that affect reported earnings. We evaluate these estimates and assumptions on an on-going basis based on historical experience and on other factors that we believe are reasonable. Estimates and assumptions include, but are not limited to, the areas of customer receivables, inventories, investments, income taxes, self-insurance reserves and commitments and contingencies. We believe that the following represent the areas where we use more critical estimates and assumptions in the preparation of our financial statements:
Revenue Recognition. Effective January 2011, we recognize revenue in accordance with FASB amended ASC as summarized in ASU No. 2009-14, Software (Topic 985): Certain Revenue Arrangements That Include Software Elements, and ASU No. 2009-13, Revenue Recognition (Topic 605): Multiple-Deliverable Revenue Arrangements. We generally recognize software and hardware revenue upon
37
shipment, installation and configuration services upon completion and customer support contracts ratably over the term of the contract. Please see Note 1 for a more detailed description of our revenue recognition policy.
For sales prior to 2011, we recognize revenue based on software revenue recognition guidance. Under the software revenue recognition guidance, we use the residual method to recognize revenue when a multiple element arrangement includes one or more elements to be delivered at a future date and VSOE of fair value of all undelivered elements exists. In the majority of our contracts, the only element that remains undelivered at the time of delivery of the product is PCS and/or service. Under the residual method, the fair value of the undelivered elements is deferred and the remaining portion of the contract is recognized as product revenues. If evidence of the fair value of one or more undelivered elements does not exist, all revenue is generally deferred until the earlier of when delivery of those elements occurs or when fair value can be established.
Inventory Valuation. We periodically review, estimate and adjust our reserves for obsolete or unmarketable inventory equal to the difference between the inventory cost and the estimated market value based upon assumptions about future demand and market conditions. Results could be materially different if demand for our products decreased because of economic or competitive conditions, length of industry downturn, or if products become obsolete because of technical advancements in the industry.
Business Combinations. We have acquired a number of businesses during the last several years, and we expect to acquire additional businesses in the future. In a business combination, we determine the fair value of all acquired assets, including identifiable intangible assets, and all assumed liabilities. We allocate the fair value of the acquisition to the acquired assets and assumed liabilities in amounts equal to the fair value of each asset and liability. We classify any remaining fair value of the acquisition as goodwill. This allocation process requires extensive use of estimates and assumptions, including estimates of future cash flows we expect to generate with the acquired assets. We amortize certain identifiable, finite-life intangible assets, such as service agreements, certifications, trademarks, order backlog and customer relationships, on a straight-line basis over the intangible asset's estimated useful life. The estimated useful life of amortizable identifiable intangible assets ranges from three months to eight years. We do not amortize goodwill or other intangible assets we determine to have indefinite lives. Accordingly, the accounting for acquisitions has had, and will continue to have, a significant impact on our operating results.
During 2011 and 2009, we applied business combination accounting to our acquisitions of Midwave, the networking solutions division of Cross Telecom, and to our acquisition of the Incentra reseller business. See Note 2 to our financial statements included in this annual report on Form 10-K for more information about the application of business combination accounting to these acquisitions.
Valuation of Goodwill. In accordance with FASB ASC Topic 350, Intangibles—Goodwill and Other, we assess the carrying amount of our goodwill for potential impairment annually or more frequently if events or a change in circumstances indicate that impairment may have occurred. We have only one operating and reporting unit that earns revenues, incurs expenses and makes available discrete financial information for review by our chief operations decision maker. Accordingly, we complete our goodwill impairment testing on this single reporting unit.
Testing for goodwill impairment is a two step process. The first step screens for potential impairment. If there is an indication of possible impairment, we must complete the second step to measure the amount of impairment loss, if any. The first step of the goodwill impairment test, used to identify potential impairment, compares the fair value of our market capitalization with the carrying value of our net assets. If our total market capitalization is at or below the carrying value of our net assets, we perform the second step of the goodwill impairment test to measure the amount of
38
impairment loss we record, if any. We consider goodwill impairment test estimates critical due to the amount of goodwill recorded on our balance sheet and the judgment required in determining fair value amounts.
Valuation of Long-Lived Assets, Including Finite-Lived Intangibles. In accordance with FASB ASC Topic 360, Property, Plant, and Equipment, we perform an impairment test for finite-lived intangible assets and other long-lived assets, such as property and equipment, whenever events or changes in circumstances indicate that we may not recover the carrying value of such assets.
Stock-Based Compensation. We utilize the fair value method of accounting to account for share-based compensation awards. This requires us to measure and recognize in our statements of operations the expense associated with all share-based payment awards made to employees and directors based on estimated fair values. We use the Black-Scholes model to determine the fair value of share-based payment awards. Our stock price, as well as assumptions regarding a number of highly complex and subjective variables, will affect our determination of fair value. We determine the fair value of restricted stock grants based upon the closing price of our stock on the grant date. We base recognition of compensation expense for our performance-based, non-vested shares on management's estimate of the probable outcome of the performance condition. Management reassesses the probability of meeting these performance conditions on a quarterly basis. Changes in management's estimate of meeting these performance conditions may result in significant fluctuations in compensation expense from period to period.
Recent Accounting Pronouncements
See Note 1 to our Consolidated Financial Statements in Part II, Item 8 of this Report for a description of recent accounting pronouncements, including our expected adoption dates and estimated effects on our results of operations, financial condition, and cash flows.
Inflation
We do not believe that inflation has had a material effect on our results of operations in recent years. We cannot assure you that inflation will not adversely affect our business in the future.
Item 7A. Quantitative and Qualitative Disclosures about Market Risk
Our interest income is sensitive to changes in the general level of U.S. interest rates, particularly since the majority of our investments are in short-term instruments. We do not undertake any specific actions to cover our exposure to interest rate risk and we are not party to any interest rate risk management transactions.
The following discusses our exposure to market risk related to changes in interest rates, foreign exchange rates and equity prices.
Interest rate risk. As of December 31, 2011, we had $18.9 million of cash and money market accounts. The impact on the income before income taxes of a 1% change in short-term interest rates would be approximately $35,000 based on our cash and cash equivalents and short-term investment balances as of December 31, 2011. We have no short or long-term debt.
Foreign currency exchange rate risk. We market and sell all of our products and services in the United States. Therefore, we are not currently exposed to any direct foreign currency exchange rate risk.
Equity price risk. We do not own any equity investments. Therefore, we are not currently exposed to any direct equity price risk.
39
Item 8. Financial Statements and Supplementary Data.
Report of Independent Registered Public Accounting Firm
To
the Board of Directors and Shareholders
Datalink Corporation
We have audited the accompanying balance sheets of Datalink Corporation (the "Company") as of December 31, 2011 and 2010, and the related statements of operations, stockholders' equity, and cash flows for each of the three years in the period ended December 31, 2011. Our audits also included the financial statement schedule of the Company listed in Item 15(a). These financial statements and financial statement schedule are the responsibility of the Company's management. Our responsibility is to express an opinion on these financial statements based on our audits.
We conducted our audits in accordance with the standards of the Public Company Accounting Oversight Board (United States). Those standards require that we plan and perform the audit to obtain reasonable assurance about whether the financial statements are free of material misstatement. An audit includes examining, on a test basis, evidence supporting the amounts and disclosures in the financial statements. An audit also includes assessing the accounting principles used and significant estimates made by management, as well as evaluating the overall financial statement presentation. We believe that our audits provide a reasonable basis for our opinion.
In our opinion, the financial statements referred to above present fairly, in all material respects, the financial position of Datalink Corporation as of December 31, 2011 and 2010, and the results of its operations and its cash flows for each of the three years in the period ended December 31, 2011, in conformity with U.S. generally accepted accounting principles. Also, in our opinion, the related financial statement schedule, when considered in relation to the basic financial statements taken as a whole, presents fairly in all material respects the information set forth therein.
We have also audited, in accordance with the standards of the Public Company Accounting Oversight Board (United States), Datalink Corporation's internal control over financial reporting as of December 31, 2011, based on criteria established in Internal Control—Integrated Framework issued by the Committee of Sponsoring Organizations of the Treadway Commission, and our report dated March 15, 2012 expressed an unqualified opinion on the effectiveness of the Company's internal control over financial reporting.
/s/ McGladrey & Pullen, LLP
Minneapolis,
Minnesota
March 15, 2012
40
DATALINK CORPORATION
BALANCE SHEETS
(in thousands, except share data)
| |
December 31, | ||||||
|---|---|---|---|---|---|---|---|
| |
2011 | 2010 | |||||
Assets |
|||||||
Current assets: |
|||||||
Cash and cash equivalents |
$ | 18,947 | $ | 8,988 | |||
Short term investments |
3,486 | — | |||||
Accounts receivable, net |
102,289 | 57,779 | |||||
Inventories, net |
1,736 | 2,210 | |||||
Current deferred customer support contract costs |
62,901 | 48,715 | |||||
Inventories shipped but not installed |
9,779 | 7,191 | |||||
Income tax receivable |
405 | 1,064 | |||||
Other current assets |
1,169 | 607 | |||||
Total current assets |
200,712 | 126,554 | |||||
Property and equipment, net |
3,453 | 2,126 | |||||
Goodwill |
32,446 | 23,146 | |||||
Finite-lived intangibles, net |
9,035 | 5,219 | |||||
Deferred customer support contract costs non-current |
28,785 | 18,742 | |||||
Deferred tax asset |
3,159 | — | |||||
Other assets |
361 | 285 | |||||
Total assets |
$ | 277,951 | $ | 176,072 | |||
|
|||||||
Liabilities and Stockholders' Equity |
|||||||
Current liabilities: |
|||||||
Accounts payable |
$ | 63,292 | $ | 28,749 | |||
Accrued commissions |
5,069 | 3,546 | |||||
Accrued sales and use taxes |
2,574 | 1,414 | |||||
Accrued expenses, other |
5,209 | 3,427 | |||||
Current deferred taxes |
7,459 | 3,723 | |||||
Customer deposits |
2,145 | 2,209 | |||||
Current deferred revenue from customer support contracts |
76,998 | 61,571 | |||||
Other current liabilities |
85 | 279 | |||||
Total current liabilities |
162,831 | 104,918 | |||||
Deferred income taxes |
— | 203 | |||||
Deferred revenue from customer support contracts non-current |
34,740 | 23,284 | |||||
Other liabilities non-current |
195 | 212 | |||||
Total liabilities |
197,766 | 128,617 | |||||
Commitments and contingencies (Notes 6, 7, and 8) |
|||||||
Stockholders' equity: |
|||||||
Common stock, $0.001 par value, 50,000,000 shares authorized, 17,899,171 and 13,569,533 shares issued and outstanding as of December 31, 2011 and 2010, respectively |
18 | 14 | |||||
Additional paid-in capital |
66,213 | 43,332 | |||||
Retained earnings |
13,954 | 4,109 | |||||
Total stockholders' equity |
80,185 | 47,455 | |||||
Total liabilities and stockholders' equity |
$ | 277,951 | $ | 176,072 | |||
The accompanying notes are an integral part of these financial statements.
41
DATALINK CORPORATION
STATEMENTS OF OPERATIONS
(in thousands, except per share data)
| |
Year Ended December 31, | |||||||||
|---|---|---|---|---|---|---|---|---|---|---|
| |
2011 | 2010 | 2009 | |||||||
Net sales: |
||||||||||
Product sales |
$ | 245,743 | $ | 180,424 | $ | 94,788 | ||||
Service sales |
134,284 | 113,255 | 83,294 | |||||||
Total net sales |
380,027 | 293,679 | 178,082 | |||||||
Cost of sales: |
||||||||||
Cost of product sales |
188,384 | 140,984 | 71,303 | |||||||
Cost of services |
100,978 | 83,951 | 60,343 | |||||||
Amortization of intangibles |
1,053 | 1,108 | — | |||||||
Total cost of sales |
290,415 | 226,043 | 131,646 | |||||||
Gross profit |
89,612 | 67,636 | 46,436 | |||||||
Operating expenses: |
||||||||||
Sales and marketing |
38,723 | 32,353 | 21,408 | |||||||
General and administrative |
15,468 | 14,092 | 11,943 | |||||||
Engineering |
17,535 | 15,652 | 11,650 | |||||||
Other income |
(1,127 | ) | (503 | ) | — | |||||
Integration and transaction costs |
454 | 581 | 1,043 | |||||||
Amortization of intangibles |
1,766 | 1,483 | 843 | |||||||
Total operating expenses |
72,819 | 63,658 | 46,887 | |||||||
Earnings (loss) from operations |
16,793 | 3,978 | (451 | ) | ||||||
Interest income |
50 | 14 | 94 | |||||||
Interest/other expense, net |
(40 | ) | — | (1 | ) | |||||
Net earnings (loss) before income taxes |
16,803 | 3,992 | (358 | ) | ||||||
Income tax expense |
6,958 | 1,690 | 197 | |||||||
Net earnings (loss) |
$ | 9,845 | $ | 2,302 | $ | (555 | ) | |||
Net earnings (loss) per common share: |
||||||||||
Basic |
$ | 0.62 | $ | 0.18 | $ | (0.04 | ) | |||
Diluted |
$ | 0.61 | $ | 0.18 | $ | (0.04 | ) | |||
Weighted average common shares outstanding: |
||||||||||
Basic |
15,803 | 12,801 | 12,550 | |||||||
Diluted |
16,213 | 12,981 | 12,550 | |||||||
The accompanying notes are an integral part of these financial statements.
42
DATALINK CORPORATION
STATEMENTS OF STOCKHOLDERS' EQUITY
(in thousands)
| |
Common Stock | |
|
|
||||||||||||
|---|---|---|---|---|---|---|---|---|---|---|---|---|---|---|---|---|
| |
Additional Paid-in Capital |
Retained Earnings (Deficit) |
|
|||||||||||||
| |
Shares | Amount | Total | |||||||||||||
Balances, December 31, 2008 |
12,930 | $ | 13 | $ | 40,144 | $ | 2,362 | $ | 42,519 | |||||||
Net loss |
— | — | — | (555 | ) | (555 | ) | |||||||||
Stock option and restricted stock expense |
345 | — | 1,485 | — | 1,485 | |||||||||||
Redemption of restricted shares for tax withholding payments |
(64 | ) | — | (208 | ) | — | (208 | ) | ||||||||
Common shares issued under exercise of stock options |
50 | — | 174 | — | 174 | |||||||||||
Balances, December 31, 2009 |
13,261 | 13 | 41,595 | 1,807 | 43,415 | |||||||||||
Net earnings |
— | — | — | 2,302 | 2,302 | |||||||||||
Stock option and restricted stock expense |
232 | 1 | 1,592 | — | 1,593 | |||||||||||
Excess tax expense from stock compensation |
— | — | (16 | ) | — | (16 | ) | |||||||||
Tax withholding payments reimbursed by restricted stock |
(32 | ) | — | (203 | ) | — | (203 | ) | ||||||||
Common shares issued under exercise of stock options |
109 | — | 364 | — | 364 | |||||||||||
Balances, December 31, 2010 |
13,570 | 14 | 43,332 | 4,109 | 47,455 | |||||||||||
Net earnings |
— | — | — | 9,845 | 9,845 | |||||||||||
Stock option and restricted stock expense |
573 | 1 | 2,556 | — | 2,557 | |||||||||||
Excess tax benefit from stock compensation |
— | — | 450 | — | 450 | |||||||||||
Tax withholding payments reimbursed by restricted stock |
(24 | ) | — | (174 | ) | — | (174 | ) | ||||||||
Common shares issued under exercise of stock options |
264 | — | 1,034 | — | 1,034 | |||||||||||
Issuance of common stock for Midwave acquisition |
221 | — | 1,564 | — | 1,564 | |||||||||||
Issuance of common stock for secondary offering |
3,307 | 3 | 17,451 | — | 17,454 | |||||||||||
Balances, December 31, 2011 |
17,911 | 18 | 66,213 | 13,954 | 80,185 | |||||||||||
The accompanying notes are an integral part of these financial statements.
43
DATALINK CORPORATION
STATEMENTS OF CASH FLOWS
(In thousands)
| |
Year Ended December 31, | |||||||||
|---|---|---|---|---|---|---|---|---|---|---|
| |
2011 | 2010 | 2009 | |||||||
Cash flows from operating activities: |
||||||||||
Net earnings (loss) |
$ | 9,845 | $ | 2,302 | $ | (555 | ) | |||
Adjustments to reconcile net earnings to net cash provided by (used in) operating activities: |
||||||||||
Provision for bad debts |
84 | 73 | 57 | |||||||
Depreciation |
1,045 | 945 | 838 | |||||||
Amortization of finite lived intangibles |
2,819 | 2,591 | 843 | |||||||
Amortization of discount on short term investments |
— | — | (15 | ) | ||||||
Deferred income taxes |
374 | 1,755 | 2,866 | |||||||
Stock based compensation expense |
2,557 | 1,592 | 1,485 | |||||||
Changes in operating assets and liabilities, net of effects of acquisition: |
||||||||||
Accounts receivable, net |
(33,019 | ) | (13,742 | ) | (8,226 | ) | ||||
Inventories |
(2,114 | ) | 1,133 | 1,098 | ||||||
Deferred customer support contract costs/revenues, net |
2,485 | 2,234 | (567 | ) | ||||||
Accounts payable |
25,610 | (2,276 | ) | 2,606 | ||||||
Accrued expenses |
3,605 | 1,387 | 460 | |||||||
Income tax receivable |
659 | 9 | — | |||||||
Other |
(625 | ) | (528 | ) | (204 | ) | ||||
Net cash provided by (used in) operating activities |
13,325 | (2,525 | ) | 686 | ||||||
Cash flows from investing activities: |
||||||||||
Proceeds from short term investments |
6,492 | 2,730 | — | |||||||
Purchase of short term investments |
(9,978 | ) | — | (1,257 | ) | |||||
Purchases of property and equipment |
(1,102 | ) | (1,263 | ) | (391 | ) | ||||
Payment for acquisitions, net of cash acquired |
(17,542 | ) | — | (12,360 | ) | |||||
Net cash provided by (used in) investing activities |
(22,130 | ) | 1,467 | (14,008 | ) | |||||
Cash flows from financing activities: |
||||||||||
Proceeds from stock offering, net of offering costs |
17,454 | — | — | |||||||
Payment of note payable due to seller of acquired business |
— | (3,000 | ) | — | ||||||
Excess tax benefit (expense) from stock compensation |
450 | (16 | ) | — | ||||||
Tax withholding payments reimbursed by restricted stock |
(174 | ) | (203 | ) | (208 | ) | ||||
Proceeds from issuance of common stock from option exercise |
1,034 | 364 | 174 | |||||||
Net cash provided by (used in) financing activities |
18,764 | (2,855 | ) | (34 | ) | |||||
Increase (decrease) in cash and cash equivalents |
9,959 | (3,913 | ) | (13,356 | ) | |||||
Cash and cash equivalents, beginning of year |
8,988 | 12,901 | 26,257 | |||||||
Cash and cash equivalents, end of year |
$ | 18,947 | $ | 8,988 | $ | 12,901 | ||||
Supplementary cash flow information: |
||||||||||
Cash paid for income taxes |
$ |
5,934 |
$ |
509 |
$ |
278 |
||||
Cash received for income tax refunds |
$ | 469 | $ | 568 | $ | 1,888 | ||||
Supplementary non-cash investing and financing activities: |
||||||||||
Non-cash stock issued as consideration for acquisition |
$ |
1,564 |
$ |
— |
$ |
— |
||||
See Note 2 for non-cash information on our acquisitions |
||||||||||
The accompanying notes are an integral part of these financial statements.
44
DATALINK CORPORATION
NOTES TO FINANCIAL STATEMENTS
1. Summary of Significant Accounting Policies:
Description of Business:
Datalink Corporation provides solutions and services that help make data centers more efficient, manageable and responsive to changing business needs. Focused on mid and large-size companies, we help companies migrate from physical to virtual data centers, ensure data protection and optimize enterprise networks. We derive our revenues principally from designing, installing and supporting data center solutions. Our solutions and services span four practices: consolidation and virtualization of data center infrastructures; enhanced data protection; advanced network infrastructures; and business continuity and disaster recovery solutions. We are frequently engaged to provide assistance in the installation of data center solutions and to provide support services subsequent to the installation. Occasionally, we are engaged for consulting services.
Change in Accounting Policy:
In October 2009, the FASB amended the Accounting Standards Codification ("ASC") as summarized in Accounting Standards Update ("ASU") No. 2009-14, Software (Topic 985): Certain Revenue Arrangements That Include Software Elements, and ASU No. 2009-13, Revenue Recognition (Topic 605): Multiple-Deliverable Revenue Arrangements. ASU 2009-14 amends industry specific revenue accounting guidance for software and software related transactions to exclude from its scope tangible products containing software components and non-software components that function together to deliver the product's essential functionality, or what we refer to as essential software. We also sell non-essential software, which continues to be in the scope of ASC 985-605. ASU 2009-13 amends the accounting for multiple-element arrangements to provide guidance on how the deliverables in an arrangement should be separated and eliminates the use of the residual method. ASU 2009-13 also requires an entity to allocate revenue using the relative selling price method.
Effective January 1, 2011, we adopted the provisions of ASU 2009-13 and ASU 2009-14 for new and materially modified arrangements originating on or after January 1, 2011. The adoption of ASU 2009-13 and ASU 2009-14 had a material impact on our financial results.
The following table shows total net revenues as reported as a result of the adoption of ASU 2009-13 and ASU 2009-14 and unaudited total net revenues that would have been reported during the year ended December 31, 2011 had we not adopted ASU 2009-13 and ASU 2009-14:
| |
As Reported | As if the Previous Accounting Guidance Was in Effect |
|||||
|---|---|---|---|---|---|---|---|
| |
(in thousands) |
||||||
Total net revenue for the year ended December 31, 2011 |
$ | 380,027 | $ | 345,772 | |||
The above table represents an increase in total net revenues of $34.3 million for the year ended December 31, 2011. The increase in total net revenues was due to the recognition of revenue that would have been previously deferred for multiple-element arrangements, which include professional services and hardware, software, post contract customer support ("PCS") or other deliverables, where the final undelivered element for which we were unable to establish vender-specific objective evidence ("VSOE") (as discussed in more detail below) of fair value was professional services. Under the previous accounting guidance, since we could only establish VSOE for PCS, all revenue in these multiple-element arrangements was deferred until the only remaining undelivered element was PCS. At that point, revenue was recognized for the delivered elements in an amount based on the residual
45
method of allocation using VSOE for PCS. The new standard allows for deliverables for which revenue would have been previously deferred to be separated into units of accounting with amounts allocated based on stand-alone selling price if the delivered elements have stand-alone value. As a result, revenue is now recognized as each element is delivered, rather than deferred until the only remaining undelivered element is PCS.
ASU 2009-13 establishes a hierarchy of evidence to determine the stand-alone selling price of a deliverable based on VSOE, third-party evidence ("TPE"), and the best estimate of selling price ("BESP"). If VSOE is available, it would be used to determine the selling price of a deliverable. If VSOE is not available, the entity would determine whether TPE is available. If so, TPE must be used to determine the selling price. If TPE is not available, then the BESP would be used.
In certain instances, we are not able to establish VSOE for all deliverables in an arrangement with multiple elements. This may be due to infrequent sales of each element separately, not pricing products within a narrow range, or only having a limited sales history. We have not consistently established VSOE for any of our products or services, except for PCS.
When VSOE cannot be established, we attempt to determine the standalone selling price for each element based on TPE. TPE is determined based on competitor prices for similar deliverables when sold separately. Generally, our strategy differs from that of our peers and our offerings contain a significant level of customization and differentiation such that the comparable pricing of products with similar functionality cannot be obtained. Furthermore, we are unable to reliably determine what similar competitor products' selling prices are on a stand-alone basis. Therefore, we are typically not able to determine TPE.
Since we are typically unable to determine VSOE or TPE, we use BESP in our allocation of the arrangement consideration where VSOE or TPE do not exist. Therefore, revenue from these multiple-element arrangements is allocated based on BESP, except for PCS which is allocated based on VSOE. The objective of BESP is to determine the price at which we would transact a sale if the product or service were sold on a stand-alone basis. BESP is generally used for offerings that are not typically sold on a stand-alone basis or for new or highly customized offerings. We determine BESP for product or service using a cost-plus margin approach. When establishing the methodology used to calculate BESP we also considered multiple factors, including, but not limited to, geographies, market conditions, competitive landscape, internal costs, gross margin objectives and pricing practices. The determination of BESP is made through consultation with and formal approval by management.
We regularly review VSOE, TPE and BESP and maintain internal controls over the establishment and updates of these estimates. We limit the amount of revenue recognized for delivered elements to the amount that is not contingent on the future delivery of products or services, future performance obligations or subject to customer-specified return or refund privileges.
We evaluate each deliverable in an arrangement to determine whether they represent a single unit of accounting. The delivered item constitutes a separate unit of accounting when it has stand-alone value and there are no customer-negotiated refunds or return rights for the delivered elements. If the arrangement includes a customer-negotiated refund or return right relative to the delivered item and the delivery and performance of the undelivered item is considered probable and substantially in our control, the delivered element would also constitute a separate unit of accounting. In instances when the aforementioned criteria are not met, the deliverable is combined with the undelivered elements and revenue recognition is determined for the combined unit as a single unit of accounting. Allocation of the consideration is determined at arrangement inception on the basis of each unit's relative selling price.
Our multiple-element product offerings include networking hardware with embedded software products, professional services, and PCS, which are considered separate units of accounting. For fiscal
46
year 2011 and future periods, pursuant to the guidance in ASU 2009-13, when a sales arrangement contains multiple elements, such as products, essential software, PCS and/or professional services, we will allocate revenues to each element based on the aforementioned selling price hierarchy.
In multiple-element arrangements that include software that is not essential to the functionality of the products, revenue is initially allocated to each separate unit of accounting using the relative selling prices of each of the deliverables in the arrangement based on the aforementioned selling price hierarchy. Since non-essential software deliverables are in the scope of ASC 985-605, VSOE must exist to account for the non-essential software deliverables as separate units of accounting from one another and further allocate the originally allocated non-essential software fee among the individual non-essential software deliverables. Since we were only able to establish VSOE for PCS, the amount allocated to the other non-essential software deliverables would be based on the residual method of allocation using VSOE for PCS. This allocated revenue is recognized once all non-essential software deliverables other than PCS are delivered.
For sales prior to 2011, we recognize revenue based on software revenue recognition guidance. Under the software revenue recognition guidance, we use the residual method to recognize revenue when a multiple element arrangement includes one or more elements to be delivered at a future date and VSOE of fair value of all undelivered elements exists. In the majority of our contracts, the only element that remains undelivered at the time of delivery of the product is PCS and/or service. Under the residual method, the fair value of the undelivered elements is deferred and the remaining portion of the contract is recognized as product revenues. If evidence of the fair value of one or more undelivered elements does not exist, all revenue is generally deferred until the earlier of when delivery of those elements occurs or when fair value can be established.
The adoption of ASU 2009-13 and ASU 2009-14 has had a material impact on us and we expect the adoption of ASU 2009-13 and ASU 2009-14 to have a material impact on future periods, however we cannot reasonably estimate the effect of adopting these standards on future financial periods as the impact will vary depending on the nature and volume of new or materially modified arrangements in any given period.
In addition to selling multiple-element arrangements, which were materially impacted by the accounting change summarized above, we also sell certain products and services on a stand-alone basis that were not specifically affected by the adoption of ASU No. 2009-14 and ASU No. 2009-13.
Product Sales. We sell software and hardware products on both a "free-standing" basis without any services and as data center solutions bundled with its installation and configuration services ("bundled arrangements"). Under either arrangement, we recognize revenue from the sales of products, primarily hardware and essential software, when persuasive evidence of an arrangement exists, shipment has occurred and title has transferred, the sales price is fixed or determinable, and collection of the resulting receivable is reasonably assured. In customer arrangements where a formal acceptance of products is required by the customer, revenue is recognized upon meeting such acceptance criteria.
Service Sales. In addition to installation and configuration services provided by us or third party vendors as part of our bundled arrangements, our service sales include PCS and consulting services. On our balance sheet, deferred revenue relates to service sales for which our customer has paid us or has been invoiced but for which we have not yet performed the applicable services. Revenue from extended service contracts is recognized ratably over the contract term, generally one to three years. Professional services are offered under time and material or fixed fee-based contracts or as part of multiple-element arrangements. Professional services revenue is recognized as services are performed when sold on a stand-alone basis. Our service sales include customer support contracts and consulting services.
Postcontract Customer Support Contracts. When we sell hardware and/or software products to our customers, we enter into service contracts with them. These contracts are support service
47
agreements. A majority of the time, our internal support desk first assists the customer by performing an initial technical triage to determine the source of the problem and whether we can direct the customer on how to fix the problem. If we cannot solve the problem, we transfer the customer to the manufacturer or its designated service organization.
When we do not provide "first call" assistance, usually because the manufacturer has not authorized us to do so, our customers call the manufacturer or its designated service organization directly for both the initial technical triage and any follow-up assistance. If the customer calls us first, we transfer the customer to the third party.
In both scenarios above, we purchase third party support contracts from the manufacturers for their services. In accordance with our agreements, and consistent with standard industry practice, we prepay the third party based on its "list price" for maintenance on the specific hardware or software products we have sold, less our negotiated discounts with the third party. Terms are generally net 30 days. If we provide the initial "first call" services our discounts off of list price are more substantial. In all cases, we are the primary obligor in the transaction. The customer ultimately holds us responsible for fulfillment of the third party support contracts and we bear credit risk in the event of nonpayment by the customer.
We report customer support contract revenue on a gross basis as there are sufficient indicators in accumulation that we should be reporting these revenues on a gross basis in accordance with ASC Topic 605-45, Reporting Revenue Gross as a Principle versus Net as an Agent. We usually present quotations for maintenance arrangements to our customers without differentiating as to whether we, or a third party, are providing the service. Accordingly, we are, from our customers' perspectives, the primary obligor on our maintenance arrangements. We directly enter into the agreements with our customers to provide maintenance services. In all cases, we set the price to our customer for the maintenance arrangements, whether or not we provide our first call services, and bill our customers for the maintenance arrangement. We owe various third parties regardless of whether we collect from our customer. We are also contractually obligated to provide or arrange to provide these underlying support services to our customers in the unlikely event that the manufacturer or its designated service organization, fails to perform according to the terms of our contract.
When we sell a service contract as part of a bundled arrangement, we use vendor specific objective evidence to allocate revenue to the service contract element. In all cases, we defer revenues and incremental direct costs resulting from obtaining our service contracts and amortize them into operations over the term of the contracts, which are generally twelve months. We defer customer support costs as allowed under ASC Topic 605-10-S99 based on the guidance in ASC Topic 605-20. The deferred costs we capitalize consist of direct and incremental costs we prepay to third parties for direct support to our customers under our contract terms. We defer our customer support contract revenues and their related costs because significant obligations remain after contract execution. For example, we provide routine help desk assistance to our customers and assist them in contacting our vendors for additional support services.
Consulting Services. Some of our customers engage us to analyze their existing data center architectures and offer our recommendations. Other customers engage us to assist them on-site with extended data center infrastructure projects, to support their data center environments and to help with long-term data center design challenges. For these types of consulting services that do not include the sale of hardware or software products, we recognize revenues as we perform these services.
48
Recently Issued and Adopted Accounting Standard:
In May 2011, the FASB issued an update to ASC 820 Fair Value Measurement ("ASC 820"): Amendments to Achieve Common Fair Value Measurement and Disclosure Requirements in U.S. GAAP and International Financial Reporting Standards (IFRS). The update requires an entity with fair value measurement disclosures to provide a consistent definition of fair value and ensure that the fair value measurement and disclosure requirements are similar between U.S. GAAP and IFRS. The guidance changes certain fair value measurement principles and enhances the disclosure requirements, particularly for level 3 fair value measurements. The update to ASC 820 is effective for fiscal years, and interim periods within those years, beginning after December 15, 2011. We do not expect the adoption to have a material impact on our financial statements.
In June 2011, the FASB issued an update to ASC 220 Fair Comprehensive Income ("ASC 220"): Presentation of Comprehensive Income. The update eliminates the option to present components of other comprehensive income in the statement of stockholders' equity. Instead, the new guidance now requires an entity to present all non-owner changes in stockholders' equity either as a single continuous statement of comprehensive income or as two separate but consecutive statements. The update to ASC 220 is effective for fiscal years, and interim periods within those years beginning, after December 15, 2011. We do not expect the adoption to have a material impact on our financial statements.
In September 2011, the FASB issued an update to ASC 350 Intangibles—Goodwill and Other ("ASC 350"): Testing Goodwill for Impairment. The update allows an entity to first assess qualitative factors to determine whether it is necessary to perform the two-step quantitative goodwill impairment test. Under these amendments, an entity would not be required to calculate the fair value of a reporting unit unless the entity determines, based on a qualitative assessment, that it is more likely than not that its fair value is less than its carrying amount. The amendments include a number of events and circumstances for an entity to consider in conducting the qualitative assessment. The update to ASC 350 is effective for fiscal years, and interim periods within those years beginning, after December 15, 2011. We do not expect the adoption to have a material impact on our financial statements.
Cash and Cash Equivalents:
Cash equivalents consist principally of money market funds with original maturities of three months or less, are readily convertible to cash and are stated at cost, which approximates fair value. We maintain our cash in bank deposit and money market accounts which, at times, may exceed federally insured limits. We have not experienced any losses in such accounts.
Short-Term Investments:
Our short term investments consist principally of certificates of deposits and variable rate demand notes. We categorize these investments as trading securities and record them at fair value. We classify investments with maturities of 90 days or less from the date of purchase as cash equivalents; investments with maturities of greater than 90 days from the date of purchase but less than one year generally as short-term investments; and investments with maturities of greater than one year from the date of purchase generally as long-term investments.
Accounts Receivable, net:
We carry trade receivables at original invoice amount less an estimate made for doubtful receivables based on a review of all outstanding amounts on a monthly basis. Management determines the allowance for doubtful accounts by regularly evaluating individual customer receivables and considering a customer's financial condition and credit history and current economic conditions. We write off trade receivables when deemed uncollectible, which is generally in excess of a year past due
49
provided we have no additional information to suggest we continue to expect customer payment. We record recoveries of trade receivables previously written off when received.
We recorded accounts receivable net of the reserve for doubtful accounts of $282,000 and $204,000 at December 31, 2011 and 2010, respectively.
Concentration of Credit Risk:
We had no customers that comprised more than 10% of our sales in 2011, 2010 or 2009.
Inventories:
Inventories, including inventories shipped but not installed, principally consist of data storage products and components, valued at the lower of cost or market with cost determined on a first-in, first-out (FIFO) method. We reduced inventories for obsolete and slow moving reserves by $416,000 and $105,000 at December 31, 2011 and 2010, respectively.
Property and Equipment:
We state property and equipment, including purchased software, at cost. We provide for depreciation and amortization by charges to operations using the straight-line method over the estimated useful lives of the assets (ranging from 2 to 10 years). We amortize leasehold improvements on a straight-line basis over the shorter of their estimated useful lives or the underlying lease term. We remove the costs and related accumulated depreciation and amortization on asset disposals from the accounts and include any gain or loss in operating expenses. We capitalize major renewals and betterments, but charge maintenance and repairs to current operations when incurred.
| |
December 31, | ||||||
|---|---|---|---|---|---|---|---|
| |
2011 | 2010 | |||||
| |
(in thousands) |
||||||
Property and equipment: |
|||||||
Construction in process |
$ | 805 | $ | 304 | |||
Leasehold improvements |
1,890 | 1,704 | |||||
Furniture and fixtures |
2,395 | 2,180 | |||||
Equipment |
4,712 | 3,484 | |||||
Computers and software |
2,631 | 2,442 | |||||
|
12,433 | 10,114 | |||||
Less accumulated depreciation and amortization |
8,980 | 7,988 | |||||
|
$ | 3,453 | $ | 2,126 | |||
Goodwill:
We assess the carrying amount of our goodwill for potential impairment annually or more frequently if events or a change in circumstances indicate that impairment may have occurred. We have only one operating and reporting unit that earns revenues, incurs expenses and makes available discrete financial information for review by our chief operations decision maker. Accordingly, we complete our goodwill impairment testing on this single reporting unit. Our measurement date is December 31, 2011.
Testing for goodwill impairment is a two step process. The first step screens for potential impairment. If there is an indication of possible impairment, we must complete the second step to measure the amount of impairment loss, if any. The first step of the goodwill impairment test, used to identify potential impairment, compares the fair value of our market capitalization with the carrying value of our net assets. If our total market capitalization is at or below the carrying value of our net assets, we perform the second step of the goodwill impairment test to measure the amount of impairment loss we record, if any. We consider goodwill impairment test estimates critical due to the amount of goodwill recorded on our balance sheet and the judgment required in determining fair value amounts.
50
Valuation of Long-Lived Assets:
We perform an impairment test for finite-lived assets and other long-lived assets, such as property and equipment and finite-lived intangible assets, whenever events or changes in circumstances indicate that we may not recover the carrying value of such assets. We recognize impairment based on the difference between the fair value of the asset and its carrying value. We generally measure fair value based on discounted cash flow analyses. For 2011, 2010 and 2009, we identified no triggering events that required us to evaluate the impairment of our long-lived assets.
Stock Compensation Plans:
We utilize the fair value method of accounting to account for share-based compensation awards. This requires us to measure and recognize in our statements of operations the expense associated with all share-based payment awards made to employees and directors based on estimated fair values. We use the Black-Scholes model to determine the fair value of share-based payment awards. Stock-based compensation expense was $2.6 million, $1.6 million and $1.5 million for 2011, 2010 and 2009, respectively.
Income Taxes:
We calculate income taxes using the asset and liability method of accounting for income taxes. Under the liability method, we record deferred income taxes to reflect the tax consequences in future years of temporary differences between the tax bases of assets and liabilities and their financial reporting amounts using enacted tax rates for the years in which we expect these items to affect taxable income. We establish valuation allowances when necessary to reduce deferred tax assets to the amount we expect more likely than not to realize. Income tax expense (benefit) is the tax payable (receivable) for the period and the change during the period in deferred tax assets and liabilities.
Uncertain Tax Positions:
We utilize a two-step approach to recognizing and measuring uncertain tax positions (tax contingencies). The first step evaluates the tax position for recognition by determining if the weight of available evidence indicates it is more likely than not that we will sustain the position on audit, including resolution of related appeals or litigation processes. The second step measures the tax benefit as the largest amount more than 50% likely of being realized upon ultimate settlement. We include interest and penalties for our tax contingencies in income tax expense. At December 31, 2011 and 2010, we had no unrecognized tax benefits which would affect our effective tax rate if recognized.
Sales Taxes:
Sales and other taxes collected from customers and subsequently remitted to government authorities are recorded as cash or accounts receivable with a corresponding offset recorded to sales taxes payable. These balances are removed from the balance sheet as cash is collected from the customers and remitted to the tax authority.
Use of Estimates:
The preparation of financial statements in conformity with accounting principles generally accepted in the United States of America requires our management to make estimates and assumptions that affect the reported amounts of assets and liabilities and disclosure of contingent assets and liabilities at the date of the financial statements and the reported amounts of revenues and expenses during the reporting period. Significant items subject to estimates and assumptions include the reserve for doubtful accounts, reserve for obsolete and slow moving (excess) inventory and impairment analysis of goodwill and long-lived assets. Actual results could differ from those estimates.
51
Revenue Recognition:
See summary of Revenue Recognition policy in Note 1. Change in Accounting Policy above.
Net Earnings (Loss) Per Share:
We compute basic net earnings per share using the weighted average number of shares outstanding. Diluted net earnings per share include the effect of common stock equivalents, if any, for each period. Diluted per share amounts assume the conversion, exercise or issuance of all potential common stock instruments unless their effect is anti-dilutive. The following table computes basic and diluted net earnings (loss) per share:
| |
Year Ended December 31, | |||||||||
|---|---|---|---|---|---|---|---|---|---|---|
| |
2011 | 2010 | 2009 | |||||||
| |
(in thousands, except per share data) |
|||||||||
Net earnings (loss) |
$ | 9,845 | $ | 2,302 | $ | (555 | ) | |||
Basic: |
||||||||||
Weighted average common shares outstanding |
17,899 | 13,570 | 13,261 | |||||||
Weighted average common shares of non-vested stock |
(2,096 | ) | (769 | ) | (711 | ) | ||||
Shares used in the computation of basic net earnings per share |
15,803 | 12,801 | 12,550 | |||||||
Net earnings (loss) per share—basic |
$ | 0.62 | $ | 0.18 | $ | (0.04 | ) | |||
Diluted: |
||||||||||
Shares used in the computation of basic net earnings (loss) per share |
15,803 | 12,801 | 12,550 | |||||||
Employee and non-employee director stock options |
87 | 51 | — | |||||||
Restricted stock that has not vested |
323 | 129 | — | |||||||
Shares used in the computation of diluted net earnings (loss) per share |
16,213 | 12,981 | 12,550 | |||||||
Net earnings (loss) per share—diluted |
$ | 0.61 | $ | 0.18 | $ | (0.04 | ) | |||
We excluded the following restricted stock grants that have not vested and options to purchase shares of common stock from the computation of diluted earnings per share as their effect would have been anti-dilutive:
| |
Year Ended December 31, | |||||||||
|---|---|---|---|---|---|---|---|---|---|---|
| |
2011 | 2010 | 2009 | |||||||
Restricted common stock |
128,000 | 249,001 | 507,924 | |||||||
Options to purchase shares of common stock |
— | 140,202 | 327,687 | |||||||
Fair Value of Financial Instruments:
Fair value is the price that would be received from selling an asset or paid to transfer a liability in an orderly transaction between market participants at the measurement date. In determining fair value for assets and liabilities required or permitted to be recorded at fair value, we consider the principal or most advantageous market in which it would transact and the assumptions that market participates would use when pricing the asset or liability. We apply fair value measurements for both financial and nonfinancial assets and liabilities. We have no nonfinancial assets or liabilities that require measurement at fair value on a recurring basis as of December 31, 2011.
52
The fair value of our financial instruments, including accounts receivable, accounts payable and accrued expenses, approximate cost because of their short maturities.
We use the three-level fair value hierarchy that prioritizes the inputs to valuation techniques used to measure fair values. The hierarchy gives the highest priority to unadjusted quoted prices in active markets for identical assets or liabilities (Level 1 measurements) and the lowest priority to unobservable inputs (Level 3 measurements). The three levels of the fair value hierarchy are described below:
- •
- Level 1—Unadjusted quoted prices available in active markets for the identical assets or liabilities at
the measurement date.
- •
- Level 2—Significant other observable inputs available at the measurement date, other than quoted prices
included in Level 1, either directly or indirectly.
- •
- Level 3—Significant unobservable inputs that we cannot corroborate by observable market data and thus reflect the use of significant management judgment. We generally determine these values using pricing models based on assumptions our management believes other market participants would make.
The fair value hierarchy requires the use of observable market data when available. In instances in which the inputs used to measure fair value fall into different levels of the fair value hierarchy, we determine the fair value measurement based on the lowest level input that is significant to the fair value measurement in its entirety. Our assessment of the significance of a particular item to the fair value measurement in its entirety requires judgment, including the consideration of inputs specific to the asset or liability. The following table sets forth, by level within the fair value hierarchy, the accounting of our financial assets and/or liabilities at fair value on a recurring basis as of December 31, 2011 according to the valuation techniques we used to determine their fair value(s).
| |
Fair Value Measurements as of December 31, 2011 (in thousands) |
||||||||||||
|---|---|---|---|---|---|---|---|---|---|---|---|---|---|
| |
12/31/2011 | Quoted Prices in Active Markets for Identical Assets (Level 1) |
Significant Other Observable Inputs (Level 2) |
Significant Unobservable Inputs (Level 3) |
|||||||||
Cash and cash equivalents |
$ | 18,947 | $ | 18,947 | $ | — | $ | — | |||||
Certificates of Deposit |
1,486 | 1,486 | — | — | |||||||||
Variable Rate Demand Notes |
2,000 | 2,000 | — | — | |||||||||
Total assets measured at fair value |
$ | 22,433 | $ | 22,433 | $ | — | $ | — | |||||
2. Acquisitions
Midwave Corporation
In October 2011, we entered into an asset purchase agreement with Midwave Corporation ("Midwave") and its shareholders. Under the asset purchase agreement we purchased and acquired from Midwave substantially all of the assets used in Midwave's business. Midwave is an information technology consulting firm that offers both professional services and sells products to business' information technology organizations utilizing the product portfolios of certain information technology manufacturers, in the specific domains of data center services, networking services, managed services and advisory services. We paid a purchase price of approximately $19.1 million, comprised of a cash payment of approximately $16.1 million and issued 220,988 shares of our common stock with a value of approximately $1.6 million delivered at closing and approximately $1.4 million related to working capital adjustments subsequent to closing.
53
We estimated the fair value of the assets acquired and liabilities assumed of Midwave primarily using a discounted cash flow approach with respect to identified intangible assets and goodwill. We based this approach upon our estimates of future cash flows from the acquired assets and liabilities and utilized a discount rate consistent with the inherent risk associated with the acquired assets and liabilities assumed.
The fair value of the assets acquired included finite lived intangible assets, which consisted of covenants not to compete, order backlog and customer relationships having estimated lives of 3 years, 3 months and 5 years, respectively, and goodwill of approximately $9.3 million which will be deductible for tax purposes over a 15 year period. We paid a premium over the fair value of the net tangible and identified intangible assets acquired (i.e. goodwill), because we believe this acquisition makes us the dominant data center services and infrastructure provider in Minnesota. We also believe this acquisition doubles our Cisco technology and services revenue, expands our managed services portfolio, adds an established security practice and doubles the size of our consulting services team. We anticipate operational synergies and efficiencies through combined general and administrative and corporate functions.
As of December 31, 2011, we allocated the total purchase consideration to the net assets and liabilities acquired, including finite lived intangible assets, based on their respective fair values at the acquisition date. The following table summarizes the allocation of the purchase price to the fair value of the assets and liabilities acquired:
| |
(in thousands) | |||
|---|---|---|---|---|
Assets acquired at their fair value: |
||||
Accounts receivable, net |
$ | 11,575 | ||
Deferred revenue costs |
33 | |||
Equipment |
1,270 | |||
Finite-lived intangibles |
6,635 | |||
Goodwill |
9,300 | |||
Other assets |
224 | |||
Total assets acquired |
29,037 | |||
Liabilities assumed at their fair value: |
||||
Accounts payable |
8,933 | |||
Customer deposits |
122 | |||
Deferred revenue |
16 | |||
Accrued expenses |
860 | |||
Total liabilities assumed |
9,931 | |||
Net purchase price |
$ | 19,106 | ||
The following table provides a reconciliation of the net purchase price for Midwave as compared to the cash payment for purchase:
| |
(in thousands) | |||
|---|---|---|---|---|
Net purchase price |
$ | 19,106 | ||
Less value of shares issued |
1,564 | |||
Payment in cash for purchase |
$ | 17,542 | ||
54
The pro forma consolidated unaudited results of operations as of December 31, 2011 and 2010, assuming consummation of the acquisition of Midwave as of January 1, 2010, are as follows:
| |
Years Ended December 31, | ||||||
|---|---|---|---|---|---|---|---|
| |
2011 | 2010 | |||||
| |
(in thousands, except per share data) |
||||||
Net sales |
435,405 | $ | 356,058 | ||||
Net earnings |
10,989 | 3,090 | |||||
Per share data: |
|||||||
Basic earnings |
0.70 | $ | 0.24 | ||||
Diluted earnings |
0.68 | $ | 0.24 | ||||
Integration costs for 2011 include salaries, benefits and retention bonuses of exiting employees, some of whom assisted with the initial integration of Midwave. In addition, transaction costs for 2011 include legal, audit and other outside service fees necessary to complete our acquisition of Midwave, which were expensed. Total integration and transaction costs were $454,000 during 2011.
Reseller Business of Incentra, LLC
On December 17, 2009, we acquired the reseller business of Incentra, which designs, procures, implements and supports data center solutions composed of technologies including storage, networking, security and servers from leading manufacturers. We did not acquire Incentra's managed services portfolio and related operations. We accomplished the acquisition through the purchase of substantially all of the assets of Incentra's reseller business pursuant to an Asset Purchase Agreement.
Under the Asset Purchase Agreement, we paid Incentra $13.8 million. We paid $8.8 million at closing in cash, of which we held back $440,000 as security for certain indemnification obligations of Incentra. In addition, we paid Incentra $5.0 million for the working capital associated with Incentra's reseller business through the delivery of $2.0 million in cash and a $3.0 million secured promissory note. The promissory note was paid on March 31, 2010. During 2010 the final working capital adjustment was agreed to and the amount held back for indemnification was released, the net effect was a decrease in the purchase price of $32,000.
We estimated the fair value of the assets acquired and liabilities assumed of Incentra' primarily using a discounted cash flow approach with respect to identified intangible assets and goodwill. We based this approach upon our estimates of future cash flows from the acquired assets and liabilities and utilized a discount rate consistent with the inherent risk associated with the acquired assets and liabilities assumed.
The fair value of the assets acquired included finite lived intangible assets, which consisted of trademarks, order backlog and customer relationships having estimated lives of three years, one year and eight years, respectively, and goodwill of approximately $4.0 million which will be deductible for tax purposes over a 15 year period. We paid a premium over the fair value of the net tangible and identified intangible assets acquired (i.e. goodwill), because we believe this acquisition expands our regional presence and customer portfolio and enables us to provide our customers with complete data center solutions. We anticipate operational synergies and efficiencies through combined general and administrative and corporate functions.
55
The following table summarizes the final allocation of the purchase price including measurement period adjustments:
| |
(in thousands) | |||
|---|---|---|---|---|
Assets acquired at their fair value: |
||||
Accounts receivable, net |
$ | 10,699 | ||
Inventory |
167 | |||
Fixed assets |
119 | |||
Finite-lived intangibles |
5,219 | |||
Goodwill |
4,012 | |||
Other assets |
250 | |||
Total assets acquired |
20,466 | |||
Liabilities assumed at their fair value: |
||||
Accounts payable |
4,603 | |||
Deferred maintenance contracts, net |
705 | |||
Accrued liabilities |
1,358 | |||
Total liabilities assumed |
6,666 | |||
Net purchase price |
$ | 13,800 | ||
The finite lived intangibles which consisted of trademarks, order backlog and customer relationships have estimated lives of three years, one year and eight years, respectively, and we are amortizing them using the straight line method (see Note 4).
Integration costs for 2010 and 2009 include salaries, benefits, retention bonuses and severances of exiting employees, some of whom assisted with the initial integration of Incentra. In addition, transaction costs for 2009 include legal, audit and other outside service fees necessary to complete our acquisition of Incentra, which were expensed. Total integration and transaction costs were $581,000 and $1.0 million during 2010 and 2009, respectively.
Networking Solutions Division of Cross Telecom
On October 1, 2009, we acquired the networking solutions division of Minneapolis-based Cross Telecom's ("Cross"), which qualified as a business combination. We completed an asset purchase of $2.0 million paid in cash. Simultaneously, Cross entered into an agreement with us to purchase at least $1.8 million of networking products and services from us over the next three years. Cross has agreed to pay any shortfall between customer purchases and the guaranteed annual purchase amount. The agreement was entered into outside of the acquisition and was assigned no fair value.
In September 2010 and 2011, the first and second years of the three year agreement came to an end and there was a shortfall paid by Cross of $503,000 and $574,000, respectively, which was recorded as other income since we had assumed that the revenue targets. In October 2011, we entered into an agreement with Cross to allow for an early buyout of the remaining year of the agreement for which Cross paid $553,000.
In connection with this acquisition, we allocated the total purchase consideration to the net assets acquired, including finite lived intangible assets, based on their respective fair values at the acquisition date.
We paid a premium for the net tangible and identified intangible assets (i.e. goodwill) acquired in the acquisition over their fair value because we believe this acquisition will add to our expertise in designing, implementing and managing sophisticated storage, backup and recovery infrastructures.
56
The following table summarizes the allocation of the purchase price to the fair value of the assets acquired:
| |
(in thousands) | |||
|---|---|---|---|---|
Assets acquired and their fair values: |
||||
Property & equipment |
$ | 47 | ||
Finite-lived intangibles |
534 | |||
Goodwill |
1,419 | |||
Net purchase price |
$ | 2,000 | ||
We allocated the purchase price for the Cross acquisition primarily by comparing our estimated cost to build the assets acquired against purchasing them. This enabled us to determine the allocation between finite lived intangibles and goodwill. The finite lived intangibles, which consisted of the services agreement and certifications have estimated lives of four and two years, respectively, and we are amortizing them using the straight line method (see Note 4). The goodwill we may deduct for tax purposes over a 15 year period.
The pro forma unaudited results of operations assuming consummation of our Incentra acquisition as of January 1, 2009 and excluding any pro forma information for the Cross acquisition as that pro forma impact was not significant, are as follows:
| |
Years Ended December 31, | ||||||
|---|---|---|---|---|---|---|---|
| |
2009 | 2008 | |||||
| |
(in thousands, except per share data) |
||||||
Net sales |
268,470 | $ | 397,253 | ||||
Net earnings (loss) |
(6,942 | ) | 2,414 | ||||
Per share data: |
|||||||
Basic earnings (loss) |
(0.55 | ) | $ | 0.20 | |||
Diluted earnings (loss) |
(0.55 | ) | $ | 0.19 | |||
The pro forma unaudited results do not purport to be indicative of the results which we would have obtained had we completed the acquisition as of the pro forma date.
57
3. Short Term Investments
The following table summarizes our short term investments (in thousands):
| |
Amortized Cost |
Gross Unrealized Gains |
Gross Unrealized Losses |
Fair Value |
|||||||||
|---|---|---|---|---|---|---|---|---|---|---|---|---|---|
December 31, 2011 |
|||||||||||||
Certificates of Deposit |
$ | 1,486 | — | — | $ | 1,486 | |||||||
Variable Rate Demand Notes |
$ | 2,000 | — | — | $ | 2,000 | |||||||
December 31, 2010 |
|||||||||||||
None |
— | — | — | — | |||||||||
As of December 31, 2011 and December 31, 2010, we had no unrealized holding gains/losses on investments.
As of December 31, 2011, we have $2.0 million in variable rate demand notes ("VRDN"). The underlying securities of these notes have contractual maturities which generally range from 13 to 37 years. Although our investments in VRDN's have underlying securities with contractual maturities longer than one year, the VRDN's themselves have interest rate resets of seven days and are considered short term investments. We can redeem these investments at cost at any time with seven days notice. Therefore, the investments are held at cost, which approximates fair value and are within Level 1 of the fair value hierarchy.
4. Intangibles:
We had goodwill assets with a recorded value of $32.4 million and $23.1 million as of December 31, 2011 and 2010, respectively. Goodwill activity is summarized as follows:
| |
(in thousands) | |||
|---|---|---|---|---|
January 1, 2010 |
$ | 23,178 | ||
Adjustments |
(32 | ) | ||
December 31, 2010 |
$ | 23,146 | ||
Additions |
9,300 | |||
December 31, 2011 |
$ | 32,446 | ||
We had finite-lived intangible assets with a net book value of $9.0 million and $5.2 million as of December 31, 2011 and 2010, respectively. The change in the net carrying amount of intangibles during 2011 and 2010 is as follows:
| |
Year Ended December 31, |
||||||
|---|---|---|---|---|---|---|---|
| |
2011 | 2010 | |||||
| |
(in thousands) |
||||||
Beginning Balance |
$ | 5,219 | $ | 7,810 | |||
Recognized in connection with acquisitions |
6,635 | — | |||||
Amortization |
(2,819 | ) | (2,591 | ) | |||
Ending Balance |
$ | 9,035 | $ | 5,219 | |||
58
Identified finite-lived intangible asset balances are summarized as follows:
| |
|
As of December 31, 2011 | As of December 31, 2010 | ||||||||||||||||||
|---|---|---|---|---|---|---|---|---|---|---|---|---|---|---|---|---|---|---|---|---|---|
| |
Amortizable Period (years) |
Gross Assets |
Accumulated Amortization |
Net Assets |
Gross Assets |
Accumulated Amortization |
Net Assets |
||||||||||||||
Customer relationships |
5-8 | $ | 13,213 | (4,729 | ) | $ | 8,484 | 8,110 | (3,283 | ) | $ | 4,827 | |||||||||
Services agreement |
4 | 67 | (38 | ) | 29 | 67 | (21 | ) | 46 | ||||||||||||
Certification |
2 | 467 | (467 | ) | — | 467 | (292 | ) | 175 | ||||||||||||
Covenant not to compete |
3 | 478 | (40 | ) | 438 | ||||||||||||||||
Trademarks |
3 | 263 | (179 | ) | 84 | 263 | (92 | ) | 171 | ||||||||||||
Order backlog |
3 months- 1 year |
2,162 | (2,162 | ) | — | 1,108 | (1,108 | ) | — | ||||||||||||
Total identified intangible assets |
$ | 16,650 | (7,615 | ) | $ | 9,035 | $ | 10,015 | (4,796 | ) | $ | 5,219 | |||||||||
Amortization expense related to finite-lived intangible assets for 2011, 2010 and 2009 was $2.8 million, $2.6 million and $843,000, respectively. In 2011, amortization expense increased due to the acquisition of Midwave. The finite-lived intangibles we acquired in our acquisition of Midwave consisted of covenants not to compete, order backlog and customer relationships having estimated lives of 3 years, 3 months and 5 years, respectively. Amortization expense in 2010 and 2009 relates primarily to our acquisitions of MCSI in January 2007, the networking solutions division of Cross in October 2009 and the reseller business of Incentra in December 2009. The finite lived intangibles we acquired related to the reseller business of Incentra consisted of trademarks, order backlog and customer relationships and have estimated lives of three years, one year and 8 years, respectively. The finite lived intangibles we acquired related to the networking solutions division of Cross consisted of the services agreement and certifications and have estimated lives of four years and 2 years, respectively. Our amortization expenses also include the finite lived intangibles we acquired in our 2007 MCSI acquisition consisting of customer relationships having an estimated life of six years. We are amortizing all of these finite-lived intangible assets using the straight line method. Expected amortization in each of the next five years is as follows:
| |
(in thousands) | |||
|---|---|---|---|---|
2012 |
2,472 | |||
2013 |
1,732 | |||
2014 |
1,621 | |||
2015 |
1,502 | |||
2016 |
1,247 | |||
2017 |
461 | |||
|
$ | 9,035 | ||
59
5. Income Taxes:
The reconciliation of the U.S. federal statutory tax rate to our effective income tax rate is as follows:
| |
2011 | 2010 | 2009 | |||||||
|---|---|---|---|---|---|---|---|---|---|---|
Tax expense (benefit) at U.S. statutory rates |
35.0 | % | 34.0 | % | 34.0 | % | ||||
State tax expense, net of federal tax effect |
5.2 | 4.7 | (11.9 | ) | ||||||
Nondeductible expenses and other |
0.2 | (0.6 | ) | (0.4 | ) | |||||
Meals and entertainment |
1.0 | 3.6 | (22.5 | ) | ||||||
Incentive stock options |
— | 0.6 | (54.1 | ) | ||||||
Effective tax rate |
41.4 | % | 42.3 | % | (54.9 | )% | ||||
Net deferred tax liabilities consist of the following components as of December 31, 2011 and 2010:
| |
Year Ended December 31, |
||||||
|---|---|---|---|---|---|---|---|
| |
2011 | 2010 | |||||
| |
(in thousands) |
||||||
Deferred income tax assets: |
|||||||
Allowance for doubtful accounts |
$ | 126 | $ | 91 | |||
Compensation accrual |
1,423 | 526 | |||||
Inventories |
172 | 47 | |||||
Deferred revenue |
8,828 | 6,119 | |||||
Net operating loss carryovers |
135 | 1,896 | |||||
Sublease reserves |
32 | 133 | |||||
Intangibles |
159 | — | |||||
Other |
74 | 108 | |||||
Total deferred income tax assets |
10,949 | 8,920 | |||||
Deferred income tax liabilities: |
|||||||
Prepaids |
(380 | ) | (219 | ) | |||
Deferred costs |
(12,872 | ) | (10,627 | ) | |||
Deferred commission |
(1,688 | ) | — | ||||
Section 481(a) adjustment |
— | (1,203 | ) | ||||
Intangibles |
(4 | ) | (760 | ) | |||
Property and equipment |
(203 | ) | (9 | ) | |||
Other |
— | (28 | ) | ||||
Total deferred income tax liabilities |
(15,249 | ) | (12,846 | ) | |||
Net deferred tax liabilities |
$ | (4,300 | ) | $ | (3,926 | ) | |
The deferred tax amounts above have been classified in the accompanying balance sheets as follows for 2011 and 2010:
| |
Year Ended December 31, |
||||||
|---|---|---|---|---|---|---|---|
| |
2011 | 2010 | |||||
| |
(in thousands) |
||||||
Current deferred tax liability |
$ | (7,459 | ) | (3,723 | ) | ||
Noncurrent deferred tax asset (liability) |
3,159 | (203 | ) | ||||
Net deferred tax liability |
$ | (4,300 | ) | (3,926 | ) | ||
60
The tax expense for 2011 and 2010 consists of the following:
| |
Year Ended December 31, |
||||||
|---|---|---|---|---|---|---|---|
| |
2011 | 2010 | |||||
| |
(in thousands) |
||||||
Current income tax expense |
$ | 6,584 | 13 | ||||
Deferred tax expense |
374 | 1,677 | |||||
Income tax expense |
$ | 6,958 | 1,690 | ||||
In assessing the recoverability of deferred tax assets, management considers whether it is more likely than not that we will realize some portion or all of the deferred tax assets. The ultimate realization of deferred tax assets is dependent upon the generation of future taxable income during the periods in which those temporary differences become deductible. As of December 31, 2011, we have state net operating loss carryforwards of approximately $1.7 million, which are available to offset future state taxable income. If not used, the state net operating loss carryforwards will expire between 2013 and 2028. For 2011we recorded approximately $449,500 to equity for excess tax benefits with the exercise of stock options. For 2010 we recorded approximately $15,800 to equity for tax shortfalls associated with the exercise of stock options. In future periods of taxable earnings, we expect to report an income tax provision using an effective tax rate of approximately 40% to 42%.
6. Lease Commitments:
Our corporate headquarters including our principal technical and support services operations, are located in an office and warehouse facility in Chanhassen, Minnesota. As of December 31, 2011, our other 21 leased locations, housing sales and technical staff, are small to medium sized offices. We have regional hubs located in the Northeast, South, Mid Central, North Central and West.
As of December 31, 2011, future minimum lease payments due under non-cancelable operating leases are as follows:
| |
Lease Obligations |
Sublease Agreements |
Net Lease Obligations |
|||||||
|---|---|---|---|---|---|---|---|---|---|---|
| |
(in thousands) |
|||||||||
2012 |
$ | 1,479 | $ | (273 | ) | $ | 1,205 | |||
2013 |
1,164 | (34 | ) | 1,130 | ||||||
2014 |
1,097 | (34 | ) | 1,064 | ||||||
2015 |
771 | — | 771 | |||||||
Thereafter |
2,651 | — | 2,651 | |||||||
|
$ | 7,162 | $ | (341 | ) | $ | 6,821 | |||
In December 2004, we agreed to sublease approximately 52,000 of the 106,000 square feet we then occupied as our corporate headquarters in Chanhassen, Minnesota. The initial sublease term is co-terminal with the original lease ending in April 2012. The sublessee pays us rent ranging from approximately $55,000 per month at the beginning of the term to approximately $60,000 per month by the end of the term. The rent includes the costs of common area management, common systems repairs, real estate taxes and standard utilities.
As a result of our acquisition of certain assets of Midwave in October 2011, as tenant, we are the successor interest to a lease ("Original Lease") dated August 9, 2010. The Original Lease was for 20,851 square feet of office space. In December 2011, we entered into a First Amendment to Lease (the "Amendment") to the Original Lease for approximately 32,906 additional square feet of office space ("Expansion Space"), which provides us with approximately 54,000 total square feet available for
61
our operations. We will be moving our corporate headquarters to this new location in April 2012. Under the terms of the Amendment, the term of the Original Lease is extended for 42 months from March 1, 2016 through August 31, 2019 and the term of the lease for the Expansion Space is for seven years and six months, commencing on March 1, 2012. We have the option to extend the term of the Original Lease for an additional five year term as long as certain conditions are met.
In addition, under the terms of the Amendment an allowance of up to $658,120 is available from our landlord for costs related to tenant improvements. If the cost of our tenant improvement is less than the allowance, then we may receive the remaining portion of the allowance, up to a maximum of $164,530, as a credit towards our rent payments.
Total rent expense, net of sublease income of $663,000, $663,000 and $663,000 in 2011, 2010 and 2009, respectively, is as follows:
| |
Year Ended December 31, | |||||||||
|---|---|---|---|---|---|---|---|---|---|---|
| |
2011 | 2010 | 2009 | |||||||
| |
(in thousands) |
|||||||||
Rent expense |
$ | 2,601 | $ | 2,386 | $ | 1,354 | ||||
7. Employee Benefit Plan:
We have a defined contribution retirement plan for eligible employees. Employees may contribute up to 15% of their pretax compensation to the 401(k) portion of the plan. Since April 2006, we have matched 50% of an employee's contribution up to the first 6% of an employee's eligible compensation. The cost of our contributions to the 401(k) portion of the plan for 2011, 2010 and 2009 was $857,000, $762,000 and $640,000, respectively.
8. Line of Credit:
We have available for use a line of credit not to exceed $10.0 million with Wells Fargo Bank, N.A. which expires on July 31, 2012. The line of credit is secured by all of our personal property. As of December 31, 2011, we had no borrowings outstanding on the line of credit. The credit line bears interest at 2.0% above the bank's three month LIBOR rate and requires us to meet certain financial covenants. At December 31, 2011, we were in compliance with the covenants.
9. Stockholders' Equity:
Common Stock Offering:
On March 14, 2011, we completed a public offering of 4,266,500 shares of common stock with a price to the public of $5.75 per share. We issued and sold 3,306,500 shares in the offering and the selling shareholder sold 960,000 shares in the offering. We received proceeds from the common stock sold by us, net of offering costs of approximately $17.5 million. We did not receive any proceeds from the shares sold by the selling shareholder.
62
Stock Compensation Plans:
In May 2011, our shareholders approved our 2011 Incentive Compensation Plan ("2011 Plan"). The 2011 plan replaced our existing 2009 Incentive Compensation Plan ("2009 Plan"), which terminated upon approval of the 2011 Plan on May 12, 2011. We reserved up to 750,000 initial shares of our common stock for possible issuance under the 2011 Plan and 303,943 shares remaining available for future grants under the 2009 Plan. Awards under the 2011 Plan may consist of options (non-qualified and incentive stock options), stock appreciation rights, or SARs, restricted stock units, performance units, dividend equivalents, annual incentive awards and other share-based awards as determined by our Compensation Committee. The terms and conditions of each award are set in an award agreement as determined by the Compensation Committee. As of December 31, 2011, there were 689,727 shares available for grant under the 2011 Plan.
In May 2009, our shareholders approved our 2009 Plan. The 2009 Plan replaced our existing 1999 Incentive Compensation Plan ("1999 Plan"), which terminated according to its terms on June 11, 2009. We reserved up to 1,000,000 initial shares of our common stock for possible issuance under the 2009 Plan. In May 2010, our shareholders approved an increase in the number of shares for possible issuance under the 2009 Plan from 1,000,000 shares to 1,500,000 shares. Awards under the 2009 Plan may consist of options (non-qualified and incentive stock options), stock appreciation rights, or SARs, restricted stock units, performance units, dividend equivalents, annual incentive awards and other share-based awards as determined by our Compensation Committee. The terms and conditions of each award are set in an award agreement as determined by the Compensation Committee. As of December 31, 2011, due to the adoption of the 2011 Plan, this plan has terminated so there are no shares available for grant under the 2009 Plan.
In August 2000, we adopted our 2000 Director Stock Option Plan (the "Director Plan"). The terms of the Director Plan as most recently amended in May 2007, allow for stock option grants to non-employee members of the Board of Directors. This plan also terminated when the 2011 Plan was approved, therefore, as of December 31, 2011 there are no shares available for grant under the Director Plan.
Restricted Stock Grants under our 2011 Plan, 2009 Plan and Director Plan:
On October 11, 2011, we awarded 140,000 shares of restricted stock pursuant to our 2011 Plan to senior management and managers that we hired in conjunction with our acquisition of Midwave. The grant vests over four years with fifty percent after year two and twenty five percent after years three and four if the individual is still employed by us on those vesting dates. During the vesting period, the individual has voting rights and the right to receive dividends. However, we will retain the dividends until the shares have vested. The shares may not be sold, assigned, transferred, pledged or otherwise encumbered until they have vested. We are amortizing the $1.2 million fair value of the shares that have not vested on the date of grant ratably over the four year vesting period. Unrecognized compensation expense related to the restricted stock grants was $972,000 at December 31, 2011. For 2011, compensation expense related to these restricted stock grants was $60,000.
On July 17, 2011, we awarded 215,000 shares of restricted stock pursuant to our 2011 Plan to certain managers. The restricted stock vests as follows: (1) 39,000 upon the achievement of our income or gross profit objectives for 2011, (2) 88,000 upon the second grant anniversary date and (3) 88,000 upon the third grant anniversary date. We are amortizing the $1.6 million fair value of the restricted shares that have not vested as follows: (1) $292,000 over a 6 month vesting period for the achievement of the performance objectives, (2) $658,000 over the two year vesting period and (3) $658,000 over the three year vesting period. Unrecognized compensation expense related to the restricted stock grants was $1.0 million at December 31, 2011. For 2011, compensation expense related to these restricted stock grants was $566,000.
63
On January 17, 2011, we awarded 209,000 shares of restricted stock pursuant to our 2011 Plan to executive management. The restricted stock vests as follows: (1) 104,500 shares upon the achievement of our predetermined earnings from operations objective for 2011 as approved by our Board of Directors and the individual employee remains employed by us through December 31, 2013, (2) 52,250 upon the second grant anniversary date and (3) 52,250 upon the third grant anniversary date. We are amortizing the $1.2 million fair value of the restricted stock as follows: (1) $612,000 over a 12 month vesting period for the achievement of the performance objectives, (2) $306,000 over the two year vesting period and (3) $306,000 over the three year vesting period. Unrecognized compensation expense related to the non-vested stock grants was $785,000 at December 31, 2011. For 2011, compensation expense related to these restricted stock grants was $440,000.
On December 15, 2010, we awarded 229,000 shares of restricted stock pursuant to our 2009 Plan to certain employees. The restricted stock vests fifty percent after year two and fifty percent after year three if the individual is still employed by us. During the vesting period, the individual has voting rights and the right to receive dividends. However, we will retain the dividends until the shares have vested. The shares may not be sold, assigned, transferred, pledged or otherwise encumbered until they have vested. We are amortizing the $999,000 fair value of the restricted stock on the date of grant ratably fifty percent over the two-year vesting period and fifty percent over the three year vesting period. Unrecognized compensation expense related to the restricted stock grants was $503,000 and $985,000 at December 31, 2011 and 2010, respectively. For 2011 and 2010, compensation expense related to these restricted stock grants was $372,000 and $14,000, respectively.
On August 17, 2010, we awarded 25,000 shares of restricted stock pursuant to our 2009 Plan to managers and certain employees. The grants vest upon the achievement of an on-time and on-budget implementation of the new Enterprise Resource Planning system. In addition, the individual employee must remain employed by us through February 1, 2012. We are amortizing the $85,000 fair value of the restricted stock on the date of grant over the eighteen-month vesting period in accordance with specific vesting terms. Unrecognized compensation expense related to the restricted stock grants was $3,300 and $57,000 at December 31, 2011 and 2010, respectively. For 2011 and 2010, compensation expense related to these restricted stock grants was $53,000 and $28,000, respectively.
On August 17, 2010, we awarded 42,307 shares of restricted stock pursuant to our 2009 Plan to executive management. The grants vested upon our achievement of the predetermined earnings from operations objective for the second-half of 2010 as approved by our Board of Directors. In addition, the individual must have remained employed by us through December 31, 2011. As of December 31, 2011, all of these awards are fully vested. We amortized the $144,000 fair value of the restricted stock over the eighteen-month vesting period in accordance with specified vesting terms. Unrecognized compensation expense related to the restricted stock grants was $0 and $102,000 at December 31, 2011 and 2010, respectively. For 2011 and 2010, compensation expense related to these restricted stock grants was $102,000 and $42,000, respectively.
On February 2, 2010, we awarded 25,000 shares of restricted stock pursuant to our 2009 Plan to senior management and managers. The grants vested upon our achievement of the predetermined earnings from operations objective for 2010 as approved by our Board of Directors. In addition, the individual employee must remain employed by us through December 31, 2011. As of December 31, 2011, all of these awards are fully vested. We amortized the $112,000 fair value of the restricted stock over a two-year period that began on January 1, 2010. Unrecognized compensation expense related to the restricted stock grants was $0 and $56,000 at December 31, 2011 and 2010, respectively. For 2011 and 2010, compensation expense related to these restricted stock grants was $(34,000) and $56,000, respectively.
On February 2, 2010, we awarded 25,000 shares of restricted stock pursuant to our 2009 Plan to an executive manager. The grant vests on February 2, 2013 dependent upon the individual employee
64
remaining employed by us through the vesting date. We are amortizing the $112,000 fair value of the restricted stock over a three-year period that began on January 1, 2010. Unrecognized compensation expense related to the restricted stock grant was $78,000 and $40,000 at December 31, 2011 and 2010, respectively. For 2011 and 2010, compensation expense related to these restricted stock grants was $16,000 and $56,000, respectively.
On December 14, 2009, we awarded 201,250 shares of restricted stock pursuant to our 2009 Plan to senior management and managers. The grants vested upon our achievement of the predetermined earnings from operations objective for 2010 as approved by our Board of Directors. In addition, the individual employee must have remained employed by us through December 31, 2011. As of December 31, 2011, all of these awards are fully vested. We amortized the $767,000 fair value of the restricted stock over a two-year period that began on January 1, 2010. Unrecognized compensation expense related to the restricted stock grants was $0 and $316,000 at December 31, 2011 and 2010, respectively. For 2011, 2010 and 2009, compensation expense related to these restricted stock grants was $316,000, $316,000 and $0, respectively.
On December 17, 2009, we awarded 132,500 shares of restricted stock pursuant to our 2009 Plan to senior management and managers that we hired in conjunction with our acquisition of the Incentra reseller business. The grant vests over four years with fifty percent after year two and twenty five percent after years three and four if the individual is still employed by us. During the vesting period, the individual has voting rights and the right to receive dividends. However, we will retain the dividends until the shares have vested. The shares may not be sold, assigned, transferred, pledged or otherwise encumbered until they have vested. We are amortizing the $521,000 fair value of the restricted stock on the date of grant ratably over the four-year vesting period. Unrecognized compensation expense related to the restricted stock grants was $221,000 and $344,000 at December 31, 2011 and December 31, 2010, respectively. For 2011, 2010 and 2009, compensation expense related to these restricted stock grants was $103,000, $122,000 and $5,200, respectively.
On December 17, 2009, we awarded 30,000 shares on restricted stock pursuant to our 2009 Plan to certain employees. The grant vests over three years with one-third vesting each year if the individual is still employed by us. During the vesting period, the individual has voting rights and the right to receive dividends. However, we will retain the dividends until the shares have vested. The shares may not be sold, assigned, transferred, pledged or otherwise encumbered until they have vested. We are amortizing the $118,000 fair value of the restricted stock on the date of grant ratably over the three-year vesting period. Unrecognized compensation expense related to the restricted stock grants was $38,000 and $77,000 at December 31, 2011 and December 31, 2010, respectively. For 2011, 2010 and 2009, compensation expense related to this restricted stock grant was $39,000, $39,000 and $1,600, respectively.
In 2011, 2010 and 2009, we issued 36,607, 37,030 and 41,922 shares of common stock to members of the Board of Directors, respectively. Our non-employee directors receive 6,000 shares of restricted stock for their Board service. We issue the annual restricted stock grants on June 30 of each year and they vest one-quarter upon issuance and one-quarter on the following September 30, December 31, and March 31, respectively, provided that the director is still a member of the Board on that date. As of December 31, 2011, 9,000 shares of the 2011 restricted stock grant were not vested. The 2010 and 2009 awards to our directors have all vested. The 2011 grants were issued pursuant to our 2011 Plan and the 2010 and 2009 grants were issued pursuant to the Director Plan. For 2011, 2010 and 2009, total compensation expense for these awards was approximately $260,000, $153,000 and $155,000, respectively.
65
The following table summarizes our restricted stock activity as of December 31, 2011:
| |
Number of Shares | Weighted Average Grant-Date Fair Value |
|||||
|---|---|---|---|---|---|---|---|
Restricted stock at January 1, 2009 |
477,758 | $ | 5.66 | ||||
Granted |
358,750 | $ | 3.86 | ||||
Shares vested |
(206,625 | ) | $ | 4.20 | |||
Shares cancelled |
(54,084 | ) | $ | 4.95 | |||
Restricted stock at January 1, 2010 |
575,799 | $ | 4.65 | ||||
Granted |
351,307 | $ | 4.19 | ||||
Shares vested |
(147,880 | ) | $ | 5.10 | |||
Shares cancelled |
(132,169 | ) | $ | 5.75 | |||
Restricted stock at January 1, 2011 |
647,058 | $ | 4.04 | ||||
Granted |
564,000 | $ | 7.12 | ||||
Shares vested |
(75,000 | ) | $ | 3.88 | |||
Shares cancelled |
(57,000 | ) | $ | 5.26 | |||
Restricted stock at December 31, 2011 |
1,079,058 | $ | 5.60 | ||||
Stock Options:
We had no stock option grants in 2011 or 2010.
In December 2009, we awarded 25,000 stock options to one of our managers. The stock options vest over three years with one-third vesting each year if the individual is still employed by us. We use the Black-Scholes option pricing model to estimate the fair value of stock options. The weighted-average fair value per option at the date of grant was $2.35. We estimated the fair value for the stock option grant with the following average assumptions:
| |
2009 | |
|---|---|---|
Risk-free interest rates |
2.7% | |
Expected dividend yield |
0 | |
Expected volatility factor |
67% | |
Expected option holding period |
6 years |
In July 2009, we awarded 450,000 stock options to our president and chief executive officer. The stock options vest 25% per year over a term of four years, provided he continues employment with us through each relevant vesting date. Unvested stock options will immediately vest upon a change of control of us (as defined in his employment agreement) but only if he (i) is continuously employed to the date of the change of control, (ii) the change of control price (as defined in the employment agreement) exceeds $3.50 per share, and (iii) such acceleration and vesting will not cause the option to be subject to the adverse consequences described in Section 409A of the Internal Revenue Code. We use the Black-Scholes option pricing model to estimate the fair value of stock options. The weighted-average fair value per option at the date of grant was $2.15. We estimated the fair value for the stock option grant with the following weighted average assumptions:
| |
2009 | |
|---|---|---|
Risk-free interest rates |
2.8% | |
Expected dividend yield |
0 | |
Expected volatility factor |
66% | |
Expected option holding period |
6 years |
66
The risk-free rate is based on a treasury instrument whose term is consistent with the expected life of our stock options. Expected volatility is based on the historical volatility of our share price for the period prior to the option grant equivalent to the expected holding period of the options. The expected holding period and dividend yield are based on historical experience. Total stock-based compensation expense related to stock options was $264,000 at December 31, 2011. Unrecognized stock-based compensation expense related to stock options was $376,000 at December 31, 2011.
The following table summarizes activity under our stock option plans:
| |
Outstanding Options | ||||||||
|---|---|---|---|---|---|---|---|---|---|
| |
Number of Shares | Range of Exercise Prices |
Weighted Average Exercise Price |
||||||
Balance, December 31, 2008 |
1,391,793 | $1.44 - $18.13 | $ | 5.29 | |||||
Options granted |
475,000 | $3.50 | $ | 3.50 | |||||
Options exercised |
(57,475 | ) | $3.32 - $4.01 | $ | 3.48 | ||||
Options cancelled |
(569,398 | ) | $3.16 - $18.13 | $ | 5.57 | ||||
Balance, December 31, 2009 |
1,239,920 | $1.44 - $18.13 | $ | 4.57 | |||||
Options granted |
— | — | $ | — | |||||
Options exercised |
(91,620 | ) | $3.32 - $4.36 | $ | 3.68 | ||||
Options cancelled |
(110,589 | ) | $3.16 - $18.13 | $ | 9.78 | ||||
Balance, December 31, 2010 |
1,037,711 | $1.44 - $9,81 | $ | 4.10 | |||||
Options granted |
— | — | $ | — | |||||
Options exercised |
(263,564 | ) | $1.44 - 8.44 | $ | 3.88 | ||||
Options cancelled |
(106,765 | ) | $3.46 - 9.81 | $ | 8.09 | ||||
Balance, December 31, 2011 |
667,382 | $1.44 - $5.21 | $ | 3.52 | |||||
Options exercisable as of December 31, 2009 |
641,587 | $1.44 - $18.13 | $ | 5.11 | |||||
Options exercisable as of December 31, 2010 |
627,878 | $1.44 - $9.81 | $ | 3.80 | |||||
Options exercisable as of December 31, 2011 |
436,827 | $1.44 - $5.21 | $ | 3.58 | |||||
The following is a summary of options outstanding at December 31, 2011:
| Stock Options |
Range of Exercise Price Per Share |
Weighted Average Exercise Price Per Share |
Weighted Average Remaining Contractual Life (Years) |
|||||||
|---|---|---|---|---|---|---|---|---|---|---|
| 667,382 | $1.44 - $5.21 | $ | 3.52 | 6.12 | ||||||
At December 31, 2011, 2010 and 2009, respectively, the aggregate intrinsic value of options outstanding and exercisable was $2,692,302, $580,122 and $361,178. Total intrinsic value of options exercised was $988,986, $337,496 and $199,768 for 2011, 2010 and 2009, respectively.
10. Commitments and Contingencies
We have change of control severance agreements and employment agreements in place with certain executive employees. Under the agreements, an executive is entitled to a severance payment in the event the executive (a) is terminated without cause by us in anticipation of, in connection with, at the time of or within two years after a change of control, or (b) resigns for good reasons arising in anticipation of, in connection with, at the time of or within two years after a change of control.
67
11. Quarterly Financial Information (unaudited)
| |
March 31 | June 30 | Sept 30 | Dec 31 | |||||||||
|---|---|---|---|---|---|---|---|---|---|---|---|---|---|
| |
(in thousands, except per share data) |
||||||||||||
2011 |
|||||||||||||
Net sales |
$ | 85,694 | $ | 89,481 | $ | 90,140 | $ | 114,712 | |||||
Gross profit |
20,755 | 21,679 | 21,240 | 25,938 | |||||||||
Operating earnings |
3,000 | 4,379 | 4,859 | 4,555 | |||||||||
Net earnings |
1,748 | 2,697 | 2,793 | 2,607 | |||||||||
Net earnings per share—basic |
0.13 | 0.16 | 0.17 | 0.16 | |||||||||
Net earnings per share—diluted |
0.12 | 0.16 | 0.16 | 0.15 | |||||||||
| |
March 31 | June 30 | Sept 30 | Dec 31 | |||||||||
|---|---|---|---|---|---|---|---|---|---|---|---|---|---|
| |
(in thousands, except per share data) |
||||||||||||
2010 |
|||||||||||||
Net sales |
$ | 62,544 | $ | 70,875 | $ | 69,220 | $ | 91,040 | |||||
Gross profit |
14,332 | 16,760 | 16,665 | 19,879 | |||||||||
Operating earnings (loss) |
(1,535 | ) | (65 | ) | 1,425 | 4,153 | |||||||
Net earnings (loss) |
(891 | ) | 5 | 771 | 2,417 | ||||||||
Net earnings (loss) per share—basic |
(0.07 | ) | 0.00 | 0.06 | 0.19 | ||||||||
Net earnings (loss) per share—diluted |
(0.07 | ) | 0.00 | 0.06 | 0.19 | ||||||||
12. Subsequent Events
None.
68
Item 9. Changes in and Disagreements with Accountants on Accounting and Financial Disclosure.
None.
Item 9A. Controls and Procedures
- (a)
- Evaluation of Disclosure Controls and Procedures
Under the supervision and with the participation of our management, including our Chief Executive Officer (principal executive officer) and our Chief Financial Officer (principal financial officer), we have evaluated the effectiveness of the design and operation of our disclosure controls and procedures pursuant to Rule 13a-15(b) under the Securities Exchange Act of 1934. Based on their review of our disclosure controls and procedures, the Chief Executive Officer and the Chief Financial Officer have concluded that our disclosure controls and procedures were effective at December 31, 2011 to ensure that information we are required to disclose in reports that we file or submit is accumulated and communicated to our management, including our principal executive and principal financial officer, as appropriate to allow timely decisions regarding required disclosures, and that such information is recorded, processed, summarized and reported within the time periods specific in the Securities and Exchange Commission rules and forms.
- (b)
- Management's Report on Internal Control over Financial Reporting
Our management is responsible for establishing and maintaining adequate internal control over financial reporting. Our internal controls are designed to provide reasonable assurance regarding the reliability of financial reporting and the preparation of financial statements for external purposes in accordance with generally accepted accounting principles. Because of its inherent limitations, internal control over financial reporting may not prevent or detect misstatements. Also, projections of any evaluation of effectiveness to future periods are subject to the risk that controls may become inadequate because of changes in conditions, or that the degree of compliance with the policies or procedures may deteriorate.
Under the supervision and with the participation of our management, including our Chief Executive Officer and our Chief Financial Officer, we assessed the effectiveness of our internal control over financial reporting as of December 31, 2011. In making this assessment, our management used the criteria set forth by the Committee of Sponsoring Organizations of the Treadway Commission (COSO) in Internal Control—Integrated Framework.
Based on our evaluation under the framework in Internal Control—Integrated Framework, our management concluded that our internal control over financial reporting was effective as of December 31, 2011.
McGladrey & Pullen, LLP, the independent registered accounting firm who audited our financial statements, has also audited the effectiveness of our internal control over financial reporting as of December 31, 2011 as described in their report on the next page.
- (c)
- Changes in Internal Control
There has been no change in our internal controls over financial reporting during our most recent fiscal quarter that has materially affected, or is reasonably likely to materially affect, our internal controls over financial reporting.
69
Report of Independent Registered Public Accounting Firm
To
the Board of Directors and Shareholders
Datalink Corporation
We have audited Datalink Corporation's (the "Company") internal control over financial reporting as of December 31, 2011, based on criteria established in Internal Control—Integrated Framework issued by the Committee of Sponsoring Organizations of the Treadway Commission. Datalink Corporation's management is responsible for maintaining effective internal control over financial reporting and for its assessment of the effectiveness of internal control over financial reporting included in the accompanying Management's Report on Internal Control over Financial Reporting. Our responsibility is to express an opinion on the Company's internal control over financial reporting based on our audit.
We conducted our audit in accordance with the standards of the Public Company Accounting Oversight Board (United States). Those standards require that we plan and perform the audit to obtain reasonable assurance about whether effective internal control over financial reporting was maintained in all material respects. Our audit included obtaining an understanding of internal control over financial reporting, assessing the risk that a material weakness exists, and testing and evaluating the design and operating effectiveness of internal control based on the assessed risk. Our audit also included performing such other procedures as we considered necessary in the circumstances. We believe that our audit provides a reasonable basis for our opinion.
A company's internal control over financial reporting is a process designed to provide reasonable assurance regarding the reliability of financial reporting and the preparation of financial statements for external purposes in accordance with generally accepted accounting principles. A company's internal control over financial reporting includes those policies and procedures that (a) pertain to the maintenance of records that, in reasonable detail, accurately and fairly reflect the transactions and dispositions of the assets of the company; (b) provide reasonable assurance that transactions are recorded as necessary to permit preparation of financial statements in accordance with generally accepted accounting principles, and that receipts and expenditures of the company are being made only in accordance with authorizations of management and directors of the company; and (c) provide reasonable assurance regarding prevention or timely detection of unauthorized acquisition, use, or disposition of the company's assets that could have a material effect on the financial statements.
Because of its inherent limitations, internal control over financial reporting may not prevent or detect misstatements. Also, projections of any evaluation of effectiveness to future periods are subject to the risk that controls may become inadequate because of changes in conditions, or that the degree of compliance with the policies or procedures may deteriorate.
In our opinion, Datalink Corporation maintained, in all material respects, effective internal control over financial reporting as of December 31, 2011, based on criteria established in Internal Control—Integrated Framework issued by the Committee of Sponsoring Organizations of the Treadway Commission.
We have also audited, in accordance with the standards of the Public Company Accounting Oversight Board (United States), the financial statements of Datalink Corporation as of December 31, 2011 and 2010 and for each of the three years ended December 31, 2011, and our report dated March 15, 2012, expressed an unqualified opinion.
/s/ McGladrey & Pullen, LLP
Minneapolis,
Minnesota
March 15, 2012
70
Not Applicable.
Item 10. Directors, Executive Officers and Corporate Governance of the Registrant.
Information contained in Item 1 under the heading "Executive Officers," as well as under "Election of Directors," "Executive Compensation—Executive Officers" and "Section 16(a) Beneficial Ownership Reporting Compliance" in our proxy statement for our 2012 annual meeting of shareholders, to be filed pursuant to Regulation 14A within 120 days after the end of the fiscal year covered by this Form 10-K (the "2012 Proxy Statement") is incorporated herein by reference.
We have adopted a code of ethics that applies to our officers, including our principal executive, financial and accounting officers, and our directors and employees. We intend to make all required disclosures concerning any amendments to, or waivers from, our code of ethics by the filing current reports on Form 8-K.
Item 11. Executive Compensation.
We incorporate the information set forth under "Executive Compensation" and "Director Compensation" in our 2012 Proxy Statement herein by reference.
Item 12. Security Ownership of Certain Beneficial Owners and Management and Related Stockholder Matters.
We incorporate the information set forth under "Outstanding Voting Securities and Voting Rights" and "Equity Compensation Plan Information at Fiscal Year Ended December 31, 2011" in our 2012 Proxy Statement herein by reference.
Item 13. Certain Relationships and Related Transactions.
We incorporate the information required by this section by reference from the information set forth under "Certain Relationships and Related Transactions" and "Corporate Governance" in our 2012 Proxy Statement.
Item 14. Principal Accountant Fees and Services.
We incorporate the information required by this section by reference from the information set forth under "Auditing Matters" in our 2012 Proxy Statement.
Item 15. Exhibits, Financial Statement Schedules, and Reports on Form 8-K.
- (a)
- We
are filing the following documents as part of this Form 10-K report:
- 1.
- Financial Statements
- 2.
- Financial Statement Schedules.
Reference is made to the Financial Statements of Datalink Corporation, under Item 8 in Part II of this Form 10-K.
The following financial statement schedule of Datalink Corporation for 2011, 2010 and 2009 is filed as part of this Annual Report and should be read in conjunction with the Financial Statements of Datalink Corporation.
71
DATALINK CORPORATION
SCHEDULE II VALUATION AND QUALIFYING ACCOUNTS
FOR THE YEARS ENDED DECEMBER 31, 2011, 2010 AND 2009
Description
|
Period | Balance at Beginning of Period |
Additions | Deductions(1) | Balance at End of Period |
|||||||||||
|---|---|---|---|---|---|---|---|---|---|---|---|---|---|---|---|---|
Allowance for Doubtful Accounts |
2011 | $ | 203,526 | $ | 84,515 | $ | 5,845 | $ | 282,196 | |||||||
|
2010 | 628,974 | 72,668 | 498,117 | 203,526 | |||||||||||
|
2009 | 198,688 | 459,447 | 29,161 | 628,974 | |||||||||||
Allowance for Inventory Obsolescence |
2011 |
$ |
105,191 |
$ |
374,264 |
$ |
63,085 |
$ |
416,307 |
|||||||
|
2010 | 122,193 | 132,390 | 149,392 | 105,191 | |||||||||||
|
2009 | 100,163 | 191,417 | 169,387 | 122,193 | |||||||||||
- (1)
- Deductions reflect write-offs of customer accounts receivables, net of recoveries.
- 3.
- Exhibits.
The exhibits filed with this report are set forth on the exhibit index filed as a part of this report immediately following the signatures to this report.
72
Pursuant to the requirements of Section 13 or 15(d) of the Securities Exchange Act of 1934, the registrant has duly caused this Annual Report on Form 10-K to be signed on its behalf by the undersigned, thereunto duly authorized.
| DATALINK CORPORATION | ||||
| Date: March 15, 2012 | ||||
| By: | /s/ PAUL F. LIDSKY Paul F. Lidsky, President and Chief Executive Officer |
|||
By: |
/s/ GREGORY T. BARNUM Gregory T. Barnum, Vice President of Finance and Chief Financial Officer |
|||
Pursuant to the requirements of the Securities Act of 1934, this report has been signed below by the following persons on behalf of the registrant and in the capacities and on the dates indicated.
Signature
|
Title
|
Date
|
||
|---|---|---|---|---|
| /s/ PAUL F. LIDSKY |
President, Chief Executive Officer and Director (Principal Executive Officer) | March 15, 2012 | ||
/s/ GREGORY T. BARNUM |
Vice President of Finance and Chief Financial Officer (Principal Financial Officer and Principal Accounting Officer) |
March 15, 2012 |
||
/s/ GREG R. MELAND |
Chairman of the Board and Director |
March 15, 2012 |
||
/s/ BRENT G. BLACKEY |
Director |
March 15, 2012 |
||
/s/ MARGARET A. LOFTUS |
Director |
March 15, 2012 |
||
/s/ J. PATRICK O'HALLORAN |
Director |
March 15, 2012 |
||
/s/ JAMES E. OUSLEY |
Director |
March 15, 2012 |
||
/s/ ROBERT M. PRICE |
Director |
March 15, 2012 |
73
| Exhibit Number |
Title | Method of Filing | ||
|---|---|---|---|---|
| 2.1 | Agreement and Plan of Merger dated January 30, 2007, by and among Datalink Corporation, Datalink Acquisition, LLC, Midrange Computer Solutions, Inc., Dan Kalin, Michael Spindler, Wayne Szczepanski and Lodi Vercelli | 7 | ||
| 2.2 | Asset Purchase Agreement dated December 17, 2009, by and between Datalink Corporation and Incentra, LLC | 10 | ||
| 2.3 | Asset Purchase Agreement dated October 3, 2011, by and among Datalink Corporation, MV Sub, Inc., Midwave Corporation, James D. Leslie, individually and in his capacity as sellers agent, and Robert S. Krocak | 24 | ||
| 3.1 | Amended and Restated Articles of Incorporation of the Company | 13 | ||
| 3.2 | Amended and Restated Bylaws of the Company | 15 | ||
| 4.1 | Form of Common Stock Certificate | 12 | ||
| 10.1 | Credit Agreement dated March 31, 2011, by and between Datalink Corporation and Wells Fargo Bank, National Association | 16 | ||
| 10.2 | Form of Indemnification Agreement | 1 | ||
| 10.3 | * | 2009 Incentive Compensation Plan, as amended May 13, 2010 | 11 | |
| 10.4 | Building Lease dated April 27, 2001, with Hoyt/DTLK LLC | 14 | ||
| 10.5 | Sublease Agreement dated December 9, 2004, with Checkpoint Security, Inc. | 3 | ||
| 10.6 | Vacant Land Purchase Agreement | 4 | ||
| 10.7 | * | Correction to Restricted Stock Award Agreements dated August 13, 2004 | 5 | |
| 10.8 | * | Employment Agreement dated March 14, 2006, with Gregory T. Barnum | 6 | |
| 10.9 | * | Employment Agreement dated July 20, 2009, as amended, with Paul F. Lidsky | 8 | |
| 10.10 | * | Employment Agreement dated December 17, 2009, with M. Shawn O'Grady | 9 | |
| 10.11 | * | 2011 Incentive Compensation Plan | 17 | |
| 10.12 | * | Form of Restricted Stock Award Agreement for Directors | 18 | |
| 10.13 | * | Form of Restricted Stock Award Agreement for Employees | 19 | |
| 10.14 | * | Form of Incentive Stock Option Agreement | 20 | |
| 10.15 | * | Form of Non-Qualified Stock Option Agreement | 21 | |
| 10.16 | Standard Form Industrial Building Lease dated June 24, 2011, with Golden Triangle Tech Center Investors, LLC | 22 | ||
| 10.17 | Lease Termination Agreement dated October 4, 2011, with Golden Triangle Tech Center Investors, LLC | 23 | ||
| 10.18 | Lease dated August 9, 2010, with IRET Properties | Filed herewith | ||
| 10.19 | First Amendment to Lease dated December 20, 2010, with IRET Properties | Filed herewith | ||
| 14.1 | Code of Ethics | 2 | ||
| 23.1 | Consent of McGladrey & Pullen, LLP | Filed herewith | ||
| 31.1 | Certifications by the Chief Executive Officer and Chief Financial Officer pursuant to Section 302 of the Sarbanes-Oxley Act of 2002 | Filed herewith | ||
| 32.1 | Certifications by the Chief Executive Officer and Chief Financial Officer pursuant to Section 906 of the Sarbanes-Oxley Act of 2002 | Filed herewith | ||
| 101.INS | * | XBRL Instance Document | Filed herewith | |
| 101.SCH | * | XBRL Taxonomy Extension Schema Document | Filed herewith |
74
| Exhibit Number |
Title | Method of Filing | ||
|---|---|---|---|---|
| 101.CAL | * | XBRL Taxonomy Extension Calculation Linkbase Document | Filed herewith | |
| 101.DEF | * | XBRL Taxonomy Extension Definition Linkbase Document | Filed herewith | |
| 101.LAB | * | XBRL Taxonomy Extension Label Linkbase Document | Filed herewith | |
| 101.PRE | * | XBRL Taxonomy Extension Presentation Linkbase Document | Filed herewith |
- *
- Management
contract or compensatory plan or arrangement.
- 1)
- Incorporated
by reference to exhibit 10.4 in our registration statement on Form S-1, Reg. No. 333-55935, filed
on June 3, 1998.
- 2)
- Incorporated
by reference to exhibit 14.1 in our Form 10-K for the period ended December 31, 2003, filed on March 24,
2004 (File No. 0-29758).
- 3)
- Incorporated
by reference to exhibit 10.25 in our Form 10-K for the period ended December 31, 2004, filed on
March 31, 2005 (File No. 0-29758).
- 4)
- Incorporated
by reference to exhibit 10.26 in our Form 10-K for the period ended December 31, 2004, filed on
March 31, 2005 (File No. 0-29758).
- 5)
- Incorporated
by reference to exhibit 10.25 in our Form 10-Q for the period ending September 30, 2005, filed on
November 14, 2005 (File No. 0-29758).
- 6)
- Incorporated
by reference to exhibit 10.28 in our Form 8-K filed on March 17, 2006 (File No. 0-29758).
- 7)
- Incorporated
by reference to exhibit 2.1 in our Form 8-K filed on February 5, 2007 (File No. 0-29758).
- 8)
- Incorporated
by reference to exhibit 10.1 in our Form 8-K filed on January 21, 2011 (File No. 0-29758).
- 9)
- Incorporated
by reference to exhibit 10.1 in our Form 8-K filed on December 22, 2009 (File No. 0-29758).
- 10)
- Incorporated
by reference to exhibit 2.1 in our Form 8-K filed on December 22, 2009 (File No. 0-29758).
- 11)
- Incorporated
by reference to exhibit 10.1 in our Form 8-K filed on May 17, 2010 (File No. 0-29758).
- 12)
- Incorporated
by reference to exhibit 4.1 in our amended registration statement on Form S-1/A, Reg.
No. 333-55935, filed on July 16, 1998.
- 13)
- Incorporated
by reference to the exhibit of the same number in our Registration Statement on Form S-1, filed on June 3, 1998 (File
No. 333-55935).
- 14)
- Incorporated
by reference to exhibit 10.13 in our Form 10-Q for the period ending March 31, 2001, filed on May 15,
2001 (File No. 0-29758).
- 15)
- Incorporated
by reference to exhibit 3.2 in our Form 8-K filed on February 18, 2011 (File No. 0-29758).
- 16)
- Incorporated
by reference to the exhibit of the same number in our Form 8-K filed on April 1, 2011 (File
No. 0-29758).
- 17)
- Incorporated by reference to Appendix A in our proxy statement for our 2011 annual meeting, filed on March 31, 2011 (File No. 0-29758).
75
- 18)
- Incorporated
by reference to exhibit 10.3 in our Form 10-Q for the period ended June 30, 2011, filed on August 11,
2011 (File No. 0-29758).
- 19)
- Incorporated
by reference to exhibit 10.4 in our Form 10-Q for the period ended June 30, 2011, filed on August 11,
2011 (File No. 0-29758).
- 20)
- Incorporated
by reference to exhibit 10.5 in our Form 10-Q for the period ended June 30, 2011, filed on August 11,
2011 (File No. 0-29758).
- 21)
- Incorporated
by reference to exhibit 10.6 in our Form 10-Q for the period ended June 30, 2011, filed on August 11,
2011 (File No. 0-29758).
- 22)
- Incorporated
by reference to exhibit 10.1 in our Form 10-Q for the period ended September 30, 2011, filed
November 10, 2011 (File No. 0-29758).
- 23)
- Incorporated
by reference to exhibit 10.2 in our Form 10-Q for the period ended September 30, 2011, filed
November 10, 2011 (File No. 0-29758).
- 24)
- Incorporated by reference to exhibit 2.1 in our Form 8-K, filed on October 3, 2011 (File No. 0-29758).
76
NOTE REGARDING FORWARD-LOOKING STATEMENTS
PART I
-
Item 1A. Risk Factors.
Item 1B. Unresolved Staff Comments.
Item 2. Properties.
Item 3. Legal Proceedings.
Item 4. Mine Safety Disclosures.
COMPARISON OF 5 YEAR CUMMULATIVE TOTAL RETURN Among Datalink Corporation, The NASDAQ Composite Index And The Russell 2000 Index
Report of Independent Registered Public Accounting Firm
DATALINK CORPORATION BALANCE SHEETS (in thousands, except share data)
DATALINK CORPORATION STATEMENTS OF OPERATIONS (in thousands, except per share data)
DATALINK CORPORATION STATEMENTS OF STOCKHOLDERS' EQUITY (in thousands)
DATALINK CORPORATION STATEMENTS OF CASH FLOWS (In thousands)
DATALINK CORPORATION NOTES TO FINANCIAL STATEMENTS
-
Item 9. Changes in and Disagreements with Accountants on Accounting and Financial Disclosure.
Item 9A. Controls and Procedures
-
Item 10. Directors, Executive Officers and Corporate Governance of the Registrant.
Item 11. Executive Compensation.
Item 12. Security Ownership of Certain Beneficial Owners and Management and Related Stockholder Matters.
Item 13. Certain Relationships and Related Transactions.
Item 14. Principal Accountant Fees and Services.
DATALINK CORPORATION SCHEDULE II VALUATION AND QUALIFYING ACCOUNTS FOR THE YEARS ENDED DECEMBER 31, 2011, 2010 AND 2009
SIGNATURES
EXHIBIT INDEX