Attached files
| file | filename |
|---|---|
| EX-3.1 - EX-3.1 - BODY CENTRAL CORP | a2208126zex-3_1.htm |
| EX-31.2 - EX-31.2 - BODY CENTRAL CORP | a2208126zex-31_2.htm |
| EX-31.1 - EX-31.1 - BODY CENTRAL CORP | a2208126zex-31_1.htm |
| EX-21.1 - EX-21.1 - BODY CENTRAL CORP | a2208126zex-21_1.htm |
| EX-23.1 - EX-23.1 - BODY CENTRAL CORP | a2208126zex-23_1.htm |
| EX-32.2 - EX-32.2 - BODY CENTRAL CORP | a2208126zex-32_2.htm |
| EX-10.13 - EX-10.13 - BODY CENTRAL CORP | a2208126zex-10_13.htm |
| EX-10.18 - EX-10.18 - BODY CENTRAL CORP | a2208126zex-10_18.htm |
| EXCEL - IDEA: XBRL DOCUMENT - BODY CENTRAL CORP | Financial_Report.xls |
| EX-32.1 - EX-32.1 - BODY CENTRAL CORP | a2208126zex-32_1.htm |
Use these links to rapidly review the document
TABLE OF CONTENTS
ITEM 8. FINANCIAL STATEMENTS AND SUPPLEMENTARY DATA
UNITED STATES
SECURITIES AND EXCHANGE COMMISSION
WASHINGTON, D.C. 20549
FORM 10-K
ý |
ANNUAL REPORT PURSUANT TO SECTION 13 OR 15(d) OF THE SECURITIES EXCHANGE ACT OF 1934 |
|
For the fiscal year ended December 31, 2011 |
||
or |
||
o |
TRANSITION REPORT PURSUANT TO SECTION 13 OR 15(d) OF THE SECURITIES EXCHANGE ACT OF 1934 |
|
For the transition period from to |
||
Commission file number 001-34906
BODY CENTRAL CORP.
(Exact name of registrant as specified in its charter)
| Delaware (State or other jurisdiction of incorporation or organization) |
14-1972231 (I.R.S. Employer Identification No.) |
Securities Registered Pursuant to Section 12(b) of the Act:
| Common Stock, par value $0.001 per share | The NASDAQ Stock Market LLC | |
| (Title of Class) | (Name of each exchange where registered) |
Securities Registered Pursuant to Section 12(g) of the Act: None
Indicate by check mark if the registrant is a well-known seasoned issuer, as defined in Rule 405 of the Securities Act. Yes o No ý
Indicate by check mark if the registrant is not required to file reports pursuant to Section 13 or Section 15(d) of the Act. Yes o No ý
Indicate by check mark whether the registrant (1) has filed all reports required to be filed by Section 13 or 15(d) of the Securities Exchange Act of 1934 during the preceding 12 months (or for such shorter period that the registrant was required to file such reports), and (2) has been subject to such filing requirements for the past 90 days. Yes ý No o
Indicate by check mark whether the registrant has submitted electronically and posted on its corporate Web site, if any, every Interactive Data File required to be submitted and posted pursuant to Rule 405 of Regulation S-T during the preceding 12 months (or for such shorter period that the registrant was required to submit and post such files). Yes ý No o
Indicate by check mark if disclosure of delinquent filers pursuant to Item 405 of Regulation S-K is not contained herein, and will not be contained, to the best of registrant's knowledge, in definitive proxy or information statements incorporated by reference in Part III of this Form 10-K or any amendment to this Form 10-K. o
Indicate by check mark whether the Registrant is a large accelerated filer, an accelerated filer, a non-accelerated filer, or a smaller reporting company. See definitions of "large accelerated filer," "accelerated filer" and "smaller reporting company" in Rule 12b-2 of the Exchange Act. (Check one):
| Large accelerated filer o | Accelerated filer ý | Non-accelerated filer o (Do not check if a smaller reporting company) |
Smaller reporting company o |
Indicate by check mark whether the registrant is a shell company (as defined in Rule 12b-2 of the Exchange Act.) Yes o No ý
As of July 1, 2011, the last business day of the registrant's most recently completed second fiscal quarter, the aggregate value of the registrant's common stock, par value $0.001 per share, was $379,755,149.
The number of shares outstanding of the registrant's common stock as of March 6, 2012 was 16,124,101 shares.
Documents Incorporated by Reference
Portions of the registrant's Proxy Statement for the Annual Meeting of Stockholders to be held on May 24, 2012 (hereinafter referred to as the 2012 Proxy Statement) are incorporated by reference into Part III.
This Annual Report on Form 10-K contains forward-looking statements concerning our business, operations and financial performance and condition as well as our plans, objectives and expectations for our business operations and financial performance and condition that are subject to risks and uncertainties. All statements other than statements of historical fact included in this Annual Report on Form 10-K are forward-looking statements. You can identify these statements by words such as "aim," "anticipate," "assume," "believe," "could," "due," "estimate," "expect," "goal," "intend," "may," "objective," "plan," "potential," "positioned," "predict," "should," "target," "will," "would" and other similar expressions that are predictions of or indicate future events and future trends. These forward-looking statements are based on current expectations, estimates, forecasts and projections about our business and the industry in which we operate and our management's beliefs and assumptions. These statements are not guarantees of future performance or development and involve known and unknown risks, uncertainties and other factors that are in some cases beyond our control. All forward-looking statements are subject to risks and uncertainties that may cause actual results to differ materially from those that we expected, including:
- •
- our ability to identify and respond to new and changing fashion trends, customer preferences and other related factors;
- •
- failure to execute successfully our growth strategy;
- •
- changes in consumer spending and general economic conditions;
- •
- changes in the competitive environment in our industry and the markets we serve, including increased competition from
other retailers;
- •
- failure of our new stores or existing stores to achieve sales and operating levels consistent with our expectations;
- •
- our dependence on a strong brand image;
- •
- failure of our information technology systems to support our business;
- •
- our dependence upon key executive management or our inability to hire or retain additional personnel;
- •
- disruptions in our supply chain and distribution facility;
- •
- our reliance upon independent third-party transportation providers for all of our product shipments;
- •
- hurricanes, natural disasters, unusually adverse weather conditions, boycotts and unanticipated events;
- •
- the seasonality of our business;
- •
- increases in costs of fuel, or other energy, transportation or utilities costs as well as in the costs of raw materials,
labor and employment;
- •
- the impact of governmental laws and regulations and the outcomes of legal proceedings;
- •
- restrictions imposed by lease obligations on our current and future operations;
- •
- our failure to maintain effective internal controls; and
- •
- our inability to protect our trademarks or other intellectual property rights.
Body Central Corp. (herein "we", "our", "us" or the "Company") derives many of its forward-looking statements from its operating budgets and forecasts, which are based upon many detailed assumptions. While we believe that our assumptions are reasonable, we caution that it is very difficult to predict the impact of known factors, and, it is impossible for us to anticipate all factors that could affect our actual results. For the discussion of these risks and uncertainties that could cause actual results to differ materially from those contained in our forward-looking statements, please refer to "Risk Factors" in this Annual Report on Form 10-K. The forward-looking statements included in this Annual Report on Form 10-K are made only as of the date hereof. We undertake no obligation to publicly update or revise any forward-looking statement as a result of new information, future events or otherwise, except as otherwise required by law.
Our Company
Founded in 1972, Body Central Corp., a Delaware corporation, is a multi-channel specialty retailer offering on-trend, quality apparel and accessories at value prices. We operate over 240 specialty apparel stores in fashion retail venues primarily located in the South, Mid-Atlantic and Midwest under the Body Central and Body Shop banners, as well as a direct business comprised of our Body Central catalog and our e-commerce website at www.bodyc.com. We target women in their late teens and twenties from diverse cultural backgrounds, who seek the latest fashions and a flattering fit. Our stores feature an assortment of tops, dresses, bottoms, jewelry, accessories and shoes sold primarily under our exclusive Body Central® and Lipstick® labels. We continually update our merchandise and floor sets with an emphasis on coordinated outfits presented by lifestyle to give our customers a reason to shop our stores frequently. We believe our multi-channel strategy supports our brand building efforts and provides us with synergistic growth opportunities across all of our sales channels.
Growth Strategy
Our growth strategy to increase revenues, capture market share and drive net income growth is as follows:
- •
- Expand Our Store Base. We believe our concept has broad
appeal and significant expansion opportunity. With only 241 stores in 24 states as of December 31, 2011, we have considerable opportunity to expand in existing and adjacent markets. We opened
33 stores and closed one store in fiscal year 2011. We expect to open at least 35 new stores in fiscal year 2012. We believe we can continue to open new stores at an annual unit rate of 15% for the
next several years.
- •
- Increase Comparable Store Sales and Enhance Brand
Awareness. We plan to grow our comparable store sales by merchandising our stores with the latest fashion trends and maintaining focus
on store level execution. We believe our ability to test products quickly and to rapidly replenish the best selling items keeps our shopping experience exciting and drives repeat customer visits and
purchases. We believe we will be able to enhance our brand awareness through our continued marketing efforts and in-store experience. In addition, we believe our catalog distribution helps
to build awareness of the Body Central brand.
- •
- Expand Operating Margin. As we grow, we believe we can
improve our operating margin. We expect to leverage our infrastructure and buying power and streamline processes through recent upgrades of our point-of-sale system, payroll
management system, catalog and warehouse management systems. In addition, we will continue to refine our inventory disciplines and upgrade information technology to enhance our productivity.
- •
- Grow Our Direct Business. We continue to identify and deploy initiatives that we believe will contribute to the growth of our direct business. These efforts include improving our list management, actively growing our customer database, simplifying our online shopping experience and increasing relevant communication with our key customers.
Products
We offer a broad selection of apparel and accessories targeted to young women who seek the latest fashion styles at value prices. The majority of our products are sold under our exclusive Body Central® and Lipstick® labels. We also sell a select assortment of branded merchandise, primarily denim, to complement our private label merchandise.
1
Our products are presented to emphasize coordinated outfits. Our assortment of tops, dresses, bottoms, jewelry, accessories and shoes fits the many lifestyles of our customers—casual, club, dressy and active. The majority of our products are priced under $20 and we believe represent significant values. We strategically price some of our best selling tops and our jewelry to drive customer traffic. The table below indicates our product mix as a percentage of net sales in our stores derived from our two major product categories, as of the fiscal year end for each of the years indicated below:
| |
Fiscal Year Ended | |||||||||
|---|---|---|---|---|---|---|---|---|---|---|
| |
December 31, 2011 |
January 1, 2011 |
January 2, 2010 |
|||||||
Apparel |
75.7 | % | 75.9 | % | 76.6 | % | ||||
Accessories |
24.3 | 24.1 | 23.4 | |||||||
Total |
100.0 | % | 100.0 | % | 100.0 | % | ||||
Typically, our direct business features a smaller selection of our best selling store merchandise targeted to a slightly broader customer base. We monitor trends in our stores in order to optimize our direct merchandise offerings.
Merchandising
Our merchandising team seeks to identify current fashion trends and merchandise consistent with our brand image. We do not dictate fashion trends; rather we focus on quickly adapting to the latest trends to provide the right merchandise at value prices every day. Our merchandising team consists of our Chief Merchandising Officer, buyers and assistant buyers organized by product category as well as a team focused on our direct business. Our merchandising team is responsible for selecting and sourcing our product assortments, managing inventory levels and allocating merchandise to stores. We build our product assortments after careful review and consideration and select products that can be displayed in our stores in a coordinated manner to encourage our customers to purchase complete outfits.
We have access to the design expertise of numerous designers through our broad vendor base who provide us with hundreds of new styles each week to review. The merchandising team selects new style items from the styles presented to us and makes necessary changes based on current fashion trends and preferences of our customer. Before placing an order, every item is evaluated for style, quality and fit to ensure standards consistent with our Body Central brand. Our vendor relationships provide us with the ability to introduce these fashion-right products to our stores quickly. Once in the stores, our buyers use an array of retail intelligence tools to track the performance of each item and class, and then take appropriate action.
Sourcing
Our test-and-reorder strategy enables us to respond rapidly to changing trends. This strategy allows us to minimize our inventory risk by testing small quantities in our stores before placing larger purchase orders for a broader roll out, which minimizes fashion risk and inventory markdowns.
We do not own or operate any manufacturing facilities and buy our merchandise from third-party vendors on an order-by-order basis. We have relationships with approximately 220 U.S. vendors. Our top 10 vendors sourced approximately 50.3% of our merchandise in fiscal year 2011, with our two largest vendors collectively representing approximately 27.3%. We maintain a large vendor network, which gives us access to a broad variety of merchandise from a multitude of designers and vendors at competitive prices. We believe our vendors view us as an important retail partner given our scale and market position.
2
We believe our sourcing strategy has been successful because we have a balance of domestic and import production from which our U.S. vendors place orders and supply merchandise from both U.S. manufacturers and foreign manufacturers that are located in such countries as China. This strategy provides us with lead times as short as four to six weeks for domestic purchases and eight to twelve weeks for imports.
Every vendor that supplies our merchandise is required to adhere to our vendor manual, which is designed to ensure that our vendor's business is conducted in a legal, ethical and responsible manner. Our vendor manual requires that each of our suppliers operates in compliance with applicable local wage, benefit, working hours and other local laws, and forbids the use of practices such as child labor or forced labor.
Sales Channels
We conduct our business through two primary sales channels: retail stores and direct, which consists of the Body Central catalog and our website, www.bodyc.com. We do not incorporate the information contained on, or accessible through, our website into this Annual Report on Form 10-K, and you should not consider it part of this Annual Report on Form 10-K.
Stores
For fiscal year 2011, our stores generated net sales of $261.8 million, which represented 88.3% of our total net revenues.
As of December 31, 2011, we had 241 retail stores operating under the names Body Central and Body Shop in 24 states, located primarily in the South, Mid-Atlantic and Midwest. The majority of our stores range in size from 3,200 to 5,200 square feet, with an average of approximately 4,300 square feet. The stores we opened during fiscal year 2011 achieved annualized sales per store and sales per gross square foot in excess of our average store sales. Our stores have historically been located in regional malls and lifestyle centers in small, medium and large markets. The nature of our fashion merchandise enables us to be successful in markets across hot, warm and cold climates.
The following store list shows the number of stores we operated in each state as of December 31, 2011:
State
|
Number of Stores |
State
|
Number of Stores |
||||||
|---|---|---|---|---|---|---|---|---|---|
| Alabama | 13 | Maryland | 8 | ||||||
| Arizona | 1 | Mississippi | 5 | ||||||
| Arkansas | 5 | Missouri | 7 | ||||||
| Delaware | 3 | North Carolina | 13 | ||||||
| Florida | 33 | Ohio | 12 | ||||||
| Georgia | 20 | Oklahoma | 4 | ||||||
| Illinois | 9 | Pennsylvania | 18 | ||||||
| Indiana | 11 | South Carolina | 8 | ||||||
| Iowa | 1 | Tennessee | 10 | ||||||
| Kansas | 3 | Texas | 31 | ||||||
| Kentucky | 5 | Virginia | 11 | ||||||
| Louisiana | 9 | West Virginia | 1 | ||||||
| Total | 241 | ||||||||
3
Store Design and Environment
Our stores are designed to effectively present our merchandise and create an exciting atmosphere to draw customers into our stores, similar to fashion boutiques. The stores feature a vibrant look with colorful displays, popular music and aspirational lifestyle photos. Our stores are constructed to allow us to efficiently shift merchandise displays for each season. Our open floor design enables customers to easily view most of our merchandise. We use a large number of body forms to provide customers with full outfit ideas. We believe by often changing our products and floor sets with new merchandise, we give our customers a reason to shop our stores frequently.
We maintain a consistent look in our stores, including signature blue lighted storefront signs, blue mosaic tiles on the storefront columns and a well-lit selling area. High ceilings and slat walls allow us to stock and display our merchandise effectively. We seek site locations that have a store front of at least 30 feet wide to create an inviting open floor feel, complete with visually appealing glass line presentations.
Site Selection and Store Growth
In selecting a location for a new store, we target malls as well as lifestyle, power and outlet centers in areas with suitable demographics and where similar fashion retailers have performed well. We have a real estate committee that utilizes a disciplined approach to analyze factors that include mall productivity, mall-specific competitive environment, average sales of junior retailers and configuration of available space for potential new store locations. We seek prominent locations in high-traffic areas of the mall and in close proximity to other retailers targeting juniors and young women as we have found that when we have locations in malls with certain key competitors our net sales in those stores typically exceed the net sales of stores that are not located in proximity to those key competitors. Our flexible store format allows us to utilize both new and second-generation retail locations. We also evaluate new store locations based on projected sales, anticipated capital investment and estimated store level contribution which satisfies our targeted return threshold. We negotiate leases with a variety of term lengths, most of which have early termination rights held by us if certain sales goals are not achieved.
We enhance our existing store base by relocating or closing stores that we believe are not profitable or located in underperforming markets as well as remodeling our older stores. In fiscal year 2011, we closed one store and relocated three stores. We have currently identified a number of potential sites for new stores with appropriate market characteristics. In fiscal year 2012, we anticipate opening approximately at least 35 stores. Our new store model assumes average unit revenue of $850,000 to $1,100,000 in the first 12 months and an average net out-of-pocket initial cash investment of approximately $145,000, which includes $105,000 of average build-out costs, including equipment and fixtures (net of landlord contributions) and $40,000 of initial inventory (net of payables).
The table below highlights certain information regarding our new store openings, store closings and relocations as of the fiscal year end for each of the years indicated below:
| |
December 31, 2011 |
January 1, 2011 |
January 2, 2010 |
|||||||
|---|---|---|---|---|---|---|---|---|---|---|
Stores at beginning of period |
209 | 185 | 180 | |||||||
Stores opened during period |
33 | 27 | 15 | |||||||
Stores closed during period |
(1 | ) | (3 | ) | (10 | ) | ||||
Stores at end of period |
241 | 209 | 185 | |||||||
Relocated stores |
3 | 3 | 4 | |||||||
4
Direct
Our direct business consists of Body Central catalogs and our www.bodyc.com website and enables us to reach customers by phone, mail or the Internet in all states and further build our Body Central brand. For fiscal year 2011, our direct business generated revenues of $34.7 million, or 11.7% of our net revenues.
We currently obtain customer information from both catalog and Internet customers as well as mail and email customer lists that we purchase. We currently have a database containing approximately 950,000 mailing addresses and approximately 1.7 million email addresses.
We continue to enhance our direct business technology platform to increase our conversion and support future growth.
Catalog
Since many of our competitors do not offer a catalog, we believe our Body Central catalog differentiates us from them. We believe our catalog reinforces the Body Central brand image and drives sales across all of our sales channels. For example, following the delivery of our catalogs, we have historically experienced an increase in orders on our website. In fiscal year 2011, we distributed twelve catalog editions and approximately 22.9 million catalogs.
All creative work on the Body Central catalog is developed in-house, which we believe allows us to consistently reinforce our brand image. Photography is shot both on location and in studio. Page layout and copywriting are executed by us. Digital images are transmitted directly to outside printers, thereby reducing lead times and improving reproduction quality.
Internet
Our customers are able to purchase our merchandise through our website as well as obtain current information on our store locations. Most of our direct business purchases are made online although often are tied to a catalog distribution. As with our catalog, we believe our website reinforces our Body Central brand.
Marketing and Advertising
While our products appeal to women of varying ages and diverse backgrounds, our core customer is a young woman in her late teens or twenties who enjoys shopping for the latest fashions. According to the U.S. Census Bureau, there were estimated to be approximately 25.0 million women as of July 2010 between the ages of 18 to 29. Our target customer represents a growing segment of the U.S. population and we believe that she spends a higher proportion of her income on fashion than the general population.
Our marketing approach aims to increase customer traffic and build our brand image. We believe one of our strongest marketing pieces is our Body Central catalog. We use catalog distribution, email communications, in-store graphics, our website and social networking sites, such as Facebook and Twitter, to achieve our marketing goals. We often coordinate marketing efforts with the malls and shopping centers in which our stores are located.
We believe that the look and feel of our stores, our in-store graphics, product labeling, customer service and overall shopping experience are critical to building our brand image. Merchandise is presented with a cohesive marketing theme, often around seasons and holidays, which unifies the store presentation and emphasizes both on-trend fashions and fashion basics. For example, we display large posters throughout each store that feature aspirational photos of our models wearing complete Body Central outfits, as well as a large number of body forms featuring current merchandise.
5
Distribution
We distribute all of our merchandise from our corporate headquarters in Jacksonville, Florida, which occupies approximately 179,000 square feet, consisting of approximately 146,000 square feet of warehouse space and approximately 33,000 square feet of office space. All of our merchandise is received, inspected, managed, stored and distributed through our warehouse. Most of our merchandise is currently pre-ticketed and pre-assorted by our vendors, which allows us to distribute the merchandise quickly and reduce labor costs. Merchandise is shipped up to five times per week to our stores to ensure a steady flow of new inventory. We believe that the capacity of our distribution center is sufficient to support our expected growth plans through 2013.
Information Technology Systems
Our information technology systems provide support and information to our management team. We believe our systems provide us with improved operational efficiencies, scalability, increased management control and timely reporting that allows us to identify and respond to trends in our business. We use a combination of customized and industry-standard software systems to support the following functions:
- •
- store point-of-sale;
- •
- e-commerce and catalog;
- •
- inventory management; and
- •
- financial reporting.
In fiscal year 2011, we installed several new systems to enhance our store labor scheduling and loss prevention systems. Our labor scheduling system improves the efficiency of our labor scheduling and the new loss prevention system broadens the scope of our loss prevention capabilities. In 2011 we also expanded our information technology staffing infrastructure to support our growth and profit objectives for both our store and online businesses. We believe the key opportunities around our direct business will be driven by our ability to connect with our customers through relevant and timely communication that will build brand awareness and increase shopping frequency.
Competition
The specialty apparel retail market is highly competitive. We compete primarily with other specialty retailers and Internet and catalog businesses that specialize in women's apparel and accessories targeting customers in their late teens and twenties. We believe the principal basis upon which we compete is by offering quality, current fashions at value prices. We believe that our success is dependent on our in-store experience, our Body Central brand, our current fashions and desirable store locations.
Our success also depends in part on our ability to respond quickly to fashion trends so that we can meet the changing demands of our customers. We believe our competitors include other specialty retailers such as Forever 21, Wet Seal, rue21 and Charlotte Russe. Our market is highly competitive and many of these retailers have substantially greater name recognition, as well as financial, marketing, and other resources, and devote greater resources to the sale of their products than we do. We may face new competitors and increased competition from existing competitors as we expand into new markets and increase our presence in existing markets.
Intellectual Property
We have registered numerous trademarks with the U.S. Patent and Trademark Office, including Body Central® and Lipstick®. In addition, we own domain names, including www.bodyc.com, and we
6
own unregistered copyright rights in our website content. We believe our material trademarks have value, and we protect them against infringement. We will also continue to file new applications as appropriate to protect our intellectual property rights.
In some regions of the U.S., our stores are located in the same malls and shopping centers as stores operated by a company doing business under the name The Body Shop®, which is a cosmetics and beauty store. We are not affiliated with this company. In 1991, we granted this company a license to use our Body Shop trademark which is held by us in connection with retail store services for the sale of women's apparel and apparel accessories. Under the terms of this license agreement, we granted an exclusive, royalty-free license to the cosmetics and beauty store company to use our "Body Shop" mark for its business as follows: as a service mark for mail order retail sales of t-shirts and sweatshirts in 49 states and territories and of other apparel in 38 states and territories; as a service mark for retail store sales of apparel in 38 states and territories; and as a trademark for apparel in 38 states and territories. This license was non-exclusive as to certain uses and our agreements with this company permit us to continue to use our "Body Shop" mark in our stores located in Alabama, Arkansas, Florida, Georgia, Kentucky, Louisiana, Mississippi, North Carolina, South Carolina, Tennessee and Texas. We currently operate under the Body Central banner and, in a minority of stores in certain states, we operate under the Body Shop banner. Our current business is focused on developing the Body Central® and Lipstick® brands and we are moving away from the use of the Body Shop name in our stores. We currently operate 35 stores under the Body Shop banner, and we expect that this number will decline as we remodel or update older stores and transition to Body Central signs and banners.
Regulation and Legislation
We are subject to labor and employment laws, laws governing advertising and promotions, privacy laws, safety regulations, consumer protection regulations and other laws that regulate retailers and govern the promotion and sale of merchandise and the operation of stores and warehouse facilities. We monitor changes in these laws and believe that we are in material compliance with applicable laws.
Employees
As of March 6, 2012, we had approximately 2,869 total employees. Out of our total employees, approximately 142 were based at our corporate headquarters in Jacksonville, Florida, and approximately 2,727 were store employees. We had approximately 846 full-time employees and approximately 2,023 part-time employees, who are primarily store employees. None of our employees are represented by a labor union, and we have had no labor-related work stoppages as of March 6, 2012. Our relationship with our employees is a key to our success, and we believe that relationship is strong.
Seasonality
Due to the seasonal nature of the retail industry, we have historically experienced and expect to continue to experience some fluctuations in our revenues and net income reflecting increased demand during the year-end holiday season, other holidays, such as Easter, the beginning of spring and peak shopping periods, such as the back-to-school season. Revenues generated during the holiday selling season generally contribute to our relatively higher fourth quarter net income. Revenues generated around Easter and the beginning of spring generally contribute to the relatively higher second quarter net income. If for any reason our revenues were below seasonal norms or expectations during these quarters, our annual results of operations could be adversely affected. The level of our working capital reflects the seasonality of our business. We expect inventory levels, along with an increase in accounts payable and accrued expenses, generally to reach their highest levels in anticipation of the increased revenues during these periods.
7
Privacy Policy
In the course of our business, we collect information about our customers, including customer data submitted to us in connection with purchases of our products at stores as well as from our direct business. We respect the privacy of our customers and take steps to safeguard the confidentiality of the information that they provide to us.
Available Information
We make available free of charge on our Internet website, www.bodyc.com, copies of our Annual Reports on Form 10-K, Quarterly Reports on Form 10-Q, Current Reports on Form 8-K and all amendments to these reports as soon as reasonably practicable after filing such material electronically with, or otherwise furnishing it to, the Securities and Exchange Commission (the "SEC"). These materials may also be obtained free of charge at the web site maintained by the SEC at www.sec.gov.
The reference to our website address does not constitute incorporation by reference of the information contained on the website, and the information contained on the website is not part of this document.
Risks Related to Our Business
Our success depends on our ability to anticipate, identify and respond quickly to changing fashion trends.
Our core market, apparel and accessories for women in their late teens and twenties, is subject to rapidly shifting fashion trends, customer tastes and demands. Accordingly, our success is heavily dependent on our ability to anticipate, identify and capitalize on the latest fashion trends and customer demands, including merchandise, styles and materials that will appeal and be saleable to our customers. A small number of our employees, including our Chief Merchandising Officer and our team of buyers, are primarily responsible for performing this analysis and making product purchase decisions. Our failure to anticipate, identify or react swiftly to changes in styles, trends or desired image preferences or to anticipate demand is likely to lead to lower demand for our merchandise, which could cause, among other things, sales declines, excess inventories and a greater number of markdowns. If we do not accurately forecast fashion trends and sales levels, our business, financial condition and results of operations will be adversely affected.
Our growth strategy depends upon our ability to successfully open and operate new stores each year in a timely and cost-effective manner without affecting the success of our existing store base.
Our strategy to grow our business depends partly on continuing to open new stores. Our future operating results will depend largely upon our ability to find a sufficient number of suitable locations that will allow us to successfully open and operate new stores each year in a timely and cost-effective manner. We believe there are many opportunities to expand our store base from our 241 locations as of December 31, 2011. In fiscal year 2012, we plan to open at least 35 new stores. Our expansion plans are only targets, and the actual number of new stores we open could differ significantly from these estimates.
Our ability to successfully open and operate new stores depends on many factors including, among others, our ability to:
- •
- identify desirable store locations, primarily in regional malls as well as outlet, lifestyle and power centers;
- •
- negotiate acceptable lease terms, including desirable tenant allowances;
8
- •
- maintain out-of-pocket, build-out costs in line with our store economic model,
including through leveraging landlords' reimbursements for a portion of our construction expenses, as well as managing these costs at reasonable levels;
- •
- hire, train and retain a growing workforce of store managers, sales associates and other personnel;
- •
- successfully integrate new stores into our existing control structure and operations, including our information technology
systems; and
- •
- efficiently expand the operations of our distribution facility to meet the needs of a growing store network.
Our near-term expansion plans have us opening new stores in or near the areas where we already have existing stores. As a result, we may face risks associated with market saturation of our merchandise. Also, if we expand into new geographic areas, we will need to successfully identify and satisfy the fashion preferences of our target customers in these areas. In addition, we will need to address competitive, merchandising, marketing, distribution and other challenges encountered in connection with any expansion into new geographic areas.
We cannot be assured that any newly opened stores will be received as well as, or achieve net sales or profitability levels comparable to those of, our existing stores in our estimated time periods, or at all. If our stores fail to achieve, or are unable to sustain, acceptable net sales and profitability levels, our business may be materially harmed and we may incur significant costs associated with closing or relocating stores. If we fail to successfully open and operate new stores and execute our growth plans, the price of our common stock could decline.
Our business is sensitive to consumer spending and economic conditions.
Consumer purchases of apparel, accessories and particularly discretionary retail items, including our fashion merchandise, may be adversely affected by economic conditions such as employment levels, salary and wage levels, the availability of consumer credit, inflation, high interest rates, high tax rates, high fuel prices and consumer confidence with respect to current and future economic conditions. Consumer purchases may decline during recessionary periods or at other times when unemployment is higher or disposable income is lower. These risks may be exacerbated for retailers like us that focus significantly on selling discretionary fashion merchandise. Consumer willingness to make discretionary purchases may decline, may stall, or may be slow to increase due to national and regional economic conditions. Our financial performance is particularly susceptible to economic and other conditions in regions or states where we have a significant number of stores, such as Florida, Texas, Pennsylvania and Georgia. Future slowdowns or disruptions in the economy could adversely affect mall traffic and new mall and shopping center development and could materially and adversely affect us and our growth plans. We may not be able to maintain our recent rate of growth in net revenues if there is a decline in consumer spending patterns.
We operate in the highly competitive specialty retail apparel industry and the size and resources of some of our competitors may allow them to compete more effectively than we can.
We face intense competition in the specialty retail apparel industry. We compete on the basis of a combination of factors, including price, breadth, quality and style of merchandise, as well as our brand image and ability to respond to fashion trends. While we believe that we compete primarily with specialty retailers, catalog retailers and Internet businesses that specialize in women's apparel and accessories, we also face competition from department stores and value retailers. We believe our primary competitors are specialty apparel retailers that offer their own private labels, such as Forever 21, Wet Seal, rue21 and Charlotte Russe. We also compete with a wide variety of large and small
9
retailers for customers, vendors, suitable store locations and personnel. The competitive landscape we face, particularly among specialty retailers, is subject to rapid change as new competitors emerge and existing competitors change their offerings. We cannot be assured that we will be able to compete successfully and navigate the shifts in our market.
Many of our competitors are, and many of our potential competitors may be, larger and have greater name recognition and access to greater financial, marketing and other resources. Therefore, these competitors may be able to adapt to changes in trends and customer desires more quickly, devote greater resources to the marketing and sale of their products, generate greater brand recognition or adopt more aggressive pricing policies than we can. In addition, catalog mailings by our competitors may adversely affect response rates to our own catalog mailings. As a result, we may lose market share, which would reduce our sales and revenues and adversely affect our results of operations.
Our inability to maintain or improve levels of comparable store sales could negatively impact our profitability and financial operations.
Our recent comparable store sales have been higher than our historical comparable store sales, and we may not be able to sustain or improve these levels. If our future comparable store sales decline or fail to meet market expectations, our profitability could be harmed and the price of our common stock could decline. In addition, the aggregate results of our store operations have fluctuated in the past and can be expected to fluctuate in the future. A variety of factors affect comparable store sales, including fashion trends, competition, current national and regional economic conditions, pricing, changes in our merchandise mix, inventory shrinkage, the success of our marketing programs, holiday timing and weather conditions. In addition, it may be more challenging for us to sustain high levels of comparable store sales growth during and after the planned expansion of our store base. These factors may cause our comparable store sales results to be materially lower than in recent periods and lower than market expectations, which could harm our business and our earnings and result in a decline in the price of our common stock.
Our ability to attract customers to our stores that are located in regional malls and other shopping centers and venues depends heavily on the success of the malls and centers in which our stores are located.
Our stores are principally located in regional malls, with some in outlet, lifestyle and power centers, and we would expect this to continue as we grow. Net sales at our stores are derived, to a significant degree, from the volume of traffic in those malls and centers and the surrounding areas. Our stores benefit from the ability of adjacent tenants to generate consumer traffic near our stores and the continuing popularity of the regional malls and outlet, lifestyle and power centers as shopping destinations. Our sales volume and traffic may be adversely affected by, among other things, economic downturns nationally or regionally, high fuel prices, increased competition, unfavorable weather conditions, changes in consumer demographics, a decrease in popularity of malls generally or of particular malls in which our stores are located. A reduction in customer traffic as a result of these or any other factors, or our inability to obtain or maintain desirable store locations within malls, could have a material adverse effect on our business. In addition, store closings in malls, particularly stores that attract similar customers, or deteriorations in the financial condition of mall operators could limit their ability to finance our tenant improvements, which would have an adverse impact on our ability to open profitable stores.
Our business largely depends on a strong brand image.
We believe that our brand image and brand awareness has contributed significantly to the success of our business. We also believe that maintaining and enhancing our brand image particularly in new markets where we have limited brand recognition is important to maintaining and expanding our customer base. Maintaining and enhancing our brand image may require us to make substantial
10
investments in areas such as merchandising, marketing, store operations, community relations, store graphics, catalog distribution and employee training. These investments may be substantial and may not ultimately be successful.
We rely on word-of-mouth, foot traffic, catalogs and email blasts to capture the interest of our customers and drive them to our stores and website. We do not use traditional advertising channels, such as newspapers, magazines, billboards, television and radio, which are used by some of our competitors. We expect to increase our use of social media, such as Facebook and Twitter, in the future. If our marketing efforts are not successful, there may be no immediately available alternative marketing channel for us to build or maintain brand awareness.
As we execute our growth strategy, our ability to successfully integrate new stores into their surrounding communities, to expand into new markets or to maintain the strength or distinctiveness of our brand image in our existing markets will be adversely impacted if we fail to connect with our target customer. Failure to successfully market our brand in new and existing markets could harm our business, results of operations and financial condition.
We are planning to replace several core information technology systems, which might disrupt our operations and cause us to incur significant unexpected expenses.
We are evaluating replacing several significant systems relating to inventory management, customer relationship management and our web site functionality. When implementing new technology systems, even an off-the-shelf solution, there is always risk that the system does not function properly or that other challenges arise that we did not anticipate. The risks associated with these systems changes could disrupt and adversely impact the promptness and accuracy of our merchandise distribution, transaction processing, financial accounting and reporting, including the implementation of our internal controls over financial reporting. Any resulting disruptions could harm our business, prospects, financial condition and results of operations.
A failure in our e-commerce operations could significantly disrupt our business and lead to reduced sales and reputational damage.
Our direct business operations are growing and represent an important part of our business, accounting for approximately 11.7% of our net revenues in fiscal year 2011. Expanding our direct business is an important part of our growth strategy. In addition to changing consumer preferences and buying trends in e-commerce, we are vulnerable to certain additional risks and uncertainties associated with Internet sales, including changes in required technology interfaces, website downtime and other technical failures, security breaches and consumer privacy concerns. During fiscal year 2009, our e-commerce system suffered a system wide shutdown for a period of approximately six days, resulting in losses to our net revenues. Our failure to successfully respond to these risks and uncertainties could reduce Internet sales and damage our brand's reputation.
System security breaches could disrupt or damage our internal operations, information technology systems or reputation.
Computer programmers and hackers, or even internal users, may be able to penetrate, create systems disruptions or cause shutdowns of our network security or that of third-party companies with which we have contracted to provide payment processing services. As a result, we could incur significant expenses addressing problems created by these breaches. This risk is heightened because we collect and store customer information for marketing purposes. Any compromise of customer information could subject us to customer or government litigation and harm our reputation, which could adversely affect our business and growth. Moreover, we could incur significant expenses or disruptions of our operations in connection with system disruptions or data breaches.
11
Many states have adopted breach of data security statutes or regulations that require notification to consumers if the security of their personal information is breached, and at least one state has adopted regulations requiring every company that maintains or stores personal information to adopt a comprehensive written information security program. Governmental focus on data security may lead to additional legislative action, and the increased emphasis on information security may lead customers to request that we take additional measures to enhance security. As a result, we may have to modify our business with the goal of further improving data security, which would result in increased expenses and operating complexity. Lastly, our reputation may be damaged by any compromise of security, accidental loss or theft of customer data in our possession, which would negatively impact our business, financial condition or results of operations.
To support our current growth strategy, we will need to place increasing reliance on our information technology and distribution systems. Any failure, inadequacy or interruption of our systems could harm our ability to effectively operate our business.
As our operations grow, greater demands will be placed on our information technology, distribution, sales order and inventory management systems. Our ability to effectively manage and maintain controls and procedures related to financial reporting, to manage and maintain our inventory and to ship products to our stores and our customers on a timely basis depends to a significant extent on our in-store systems, including our point-of-sale software and inventory management systems, as well as our systems that enable our direct business through our catalog and website. To manage the growth of our operations, personnel and real estate portfolio, we will need to continually improve and expand our operational resources, including our operational and financial systems, transaction processing and internal controls and business processes. In doing so, we would expect to encounter transitional issues that could cause us to incur substantial additional expenses. The failure of our information systems to operate effectively, problems with transitioning to upgraded or replacement systems or expanding them into new stores or a breach in security of these systems, could adversely impact the promptness and accuracy of our merchandise distribution, transaction processing, financial accounting and reporting, the efficiency of our operations and our ability to properly forecast earnings and cash requirements. We cannot anticipate all the demands that will be placed on our systems and we could be required to make significant additional expenditures to remediate any failure to upgrade, problems or breaches of our information technology systems, which could have a material adverse effect on our results of operations and business.
Our current growth plans will place a strain on our existing resources and could cause us to encounter challenges we have not faced before.
As our number of stores and our direct sales grow, our operations will become more complex. While we have grown substantially as a company since inception, this growth has been over a period of decades. As we move forward, we expect our growth to bring new challenges that we have not faced before. Among other strains, this growth may make it more difficult for us to adequately predict expenditures, such as real estate and construction expenses, budgeting will become more complex, and we also may place increased burdens on our vendors, as we will likely increase the size of our merchandise orders. As a result, if new order delivery times lengthen, we could see more fashions arrive after trends have passed, resulting in excess inventory and greater markdowns.
In addition, our planned expansion is expected to place increased demands on our existing operational, managerial, administrative and other resources. Specifically, our inventory management systems and personnel processes are being upgraded to keep pace with our current growth strategy. We cannot anticipate all of the demands that our expanding operations will impose on our business, and our failure to appropriately address these demands could have a material adverse effect on our business.
12
We depend on key personnel and may not be able to retain or replace these individuals or recruit additional personnel, which could harm our business.
We believe that we have benefited substantially from the leadership and experience of our key personnel, including our President and Chief Executive Officer, Allen Weinstein, our Chief Merchandising Officer, Beth Angelo, our Chief Financial Officer, Tom Stoltz, and Senior Vice President of Stores, Matt Swartwood. Our employees may terminate their employment with us at any time. The loss of any of our key personnel could have a material adverse effect on our business, as we may not be able to find suitable individuals to replace them on a timely basis. In addition, any departures of key management could be viewed in a negative light by investors and analysts, which could cause our common stock price to decline.
As our business expands, our future success will depend greatly on our continued ability to attract and retain highly skilled and qualified personnel. Attracting and retaining experienced and successful personnel in the retail industry is competitive. If we are not able to meet, hire and retain key members of senior management, our growth strategy and business generally could be impaired.
Our business will suffer and our growth strategy may not be successful if we are unable to find and retain store employees that reflect our brand image and embody our culture.
Like most retailers, we experience significant employee turnover rates, particularly among store employees. Our planned growth will require us to hire and train even more personnel to manage our expected growth. Our success depends in part upon our ability to continually attract, motivate and retain a sufficient number of store employees who understand and can represent and appreciate our brand and customers. We compete for qualified personnel with a variety of companies looking to hire for retail positions. Historically, we have prided ourselves on our commitment to employee growth and development and we focus on promoting from within our team. Our growth plans will strain our ability to staff our new stores, particularly at the store manager level, which could have an adverse effect on our ability to maintain a cohesive and consistently strong team, which in turn could have an adverse impact on our business. If we are unable to attract, train, assimilate or retain employees in the future, we may not be able to service our customers effectively, thus reducing our ability to continue our growth and to operate our existing stores as profitably as we have in the past.
We are subject to risks associated with leasing substantial amounts of space, including future increases in occupancy costs.
We do not own any real estate. Instead, we lease all of our store locations, as well as our corporate headquarters and distribution facility in Jacksonville, Florida. Although our leases range from month-to-month to approximately ten years, we typically occupy our stores under operating leases with terms of six to ten years. Most of our leases have early termination provisions if we do not achieve specified sales targets after an initial term, which is typically four years. We believe that we have been able to negotiate favorable rental rates over the last few years due in part to the state of the economy and higher than usual vacancy rates in a number of regional malls. These trends may not continue and there is no guarantee that we will be able to continue to negotiate such favorable terms. As we expand our store base, our lease expense and our cash outlays for rent and other related charges will increase. In addition to future minimum lease payments, most of our leases provide for additional rental payments based upon our achieving specified net sales, and many provide for additional payments associated with common area maintenance, real estate taxes and insurance. In addition, many of our lease agreements have escalating rent provisions over the initial term. Our substantial occupancy costs could have significant negative consequences, which include:
- •
- requiring that a substantial portion of our available cash be applied to pay our rental obligations, thus reducing cash available for other purposes;
13
- •
- increasing our vulnerability to general adverse economic and industry conditions; and
- •
- limiting our flexibility in planning for, or reacting to changes in, our business or in the industry in which we compete.
We depend on cash flow from operations to pay our lease expenses and to fulfill our other cash needs. If our business does not generate sufficient cash flow from operating activities to fund these expenses and needs and sufficient funds are not otherwise available to us, we may not be able to service our lease expenses, grow our business, respond to competitive challenges or fund our other liquidity and capital needs, which would harm our business. If an existing or future store is not profitable, and we decide to close it, we may nonetheless be committed to perform our obligations under the applicable lease including, among other things, paying rent for the balance of the lease term. In addition, if we are not able to enter into new leases or renew existing leases on terms acceptable to us, this could have an adverse effect on our results of operations.
Our ability to obtain merchandise quickly and at competitive prices could suffer as a result of any deterioration or change in our vendor relationships or their businesses.
We do not own or operate any manufacturing facilities. Instead, we purchase all of our merchandise from third-party vendors. Two of our vendors collectively accounted for approximately 27.3% of our purchases in fiscal year 2011. Our business and financial performance depend in large part on our ability to quickly evaluate merchandise for style and fit and also to test and purchase a wide array of desired merchandise from our vendors at competitive prices and in the quantities we require. We generally operate without long-term purchase contracts or other contractual guarantees. Rather, we receive and review samples almost daily for fit and fashion evaluation.
The benefits we currently experience from our vendor relationships could be adversely affected if a sufficient number of our vendors:
- •
- choose to stop providing merchandise samples to us or otherwise discontinue selling products to us;
- •
- raise the prices they charge us to a level such that we are unable to sell merchandise at prices that make sense for us
and our customers;
- •
- change pricing terms to require us to pay on delivery or upfront;
- •
- reduce our access to styles, brands and products by entering into broad exclusivity arrangements with our competitors or
otherwise in the marketplace;
- •
- sell similar products to our competitors with similar or better pricing; or
- •
- initiate or expand sales of apparel and accessories to retail customers directly through their own stores, catalogs or on the Internet and compete with us directly.
Market and economic events that adversely impact our vendors could impair our ability to obtain merchandise in sufficient quantities and at competitive prices. For instance, the cost of cotton may increase. An increase could cause our vendors to increase their prices, which could impact the prices we charge and our results of operations. We historically have established good working relationships with many small- to mid-size vendors that often have more limited resources, production capacities and operating histories. Many of these vendors rely on credit from third parties such as factoring companies. If the credit relationships of our vendors should change, we may be required to pay for merchandise from our vendors earlier than our historical practice. As we grow and need greater amounts of inventory, we may need to develop new relationships with larger vendors as our current vendors may be unable to supply us with needed quantities. We may not be able to find similar products on the same terms from larger vendors. If we are unable to acquire suitable merchandise in
14
sufficient quantities and at acceptable prices due to the loss of, or a deterioration or change in our relationship with, our vendors or events harmful to our vendors occur, it may adversely affect our business and results of operations.
We only have one facility which is both our corporate headquarters and distribution facility and have only partially implemented a new disaster recovery plan. If we encounter difficulties associated with this facility, we could face inventory shortages that would have a material adverse effect on our business operations.
Both our corporate headquarters and our only distribution facility are located in the same facility in Jacksonville, Florida. Our distribution facility supports both our retail stores and our direct business. All of our merchandise is shipped from our vendors to the distribution facility and then packaged and shipped from our distribution facility to our stores and our direct customers. Our stores and our direct customers must receive merchandise in a timely manner in order to stay current with the fashion preferences of our customers. While we believe the size and scale of our distribution center is sufficient to service our growth plans for the foreseeable future, the efficient flow of our merchandise requires that we have adequate capacity in our distribution facility to support our current level of operations and our growth plans. If we encounter difficulties associated with our distribution facility or if it were to shut down for any reason, including by fire or other natural disaster, we could face inventory shortages resulting in "out-of-stock" conditions in our stores, and delays in shipments to our direct customers, resulting in significantly higher costs and longer lead times associated with distributing our merchandise. In addition, most of our computer equipment and senior management, including critical resources dedicated to merchandising, financial and administrative functions, are located at our corporate headquarters. Our management and our operations and distribution staff would need to find an alternative location, causing further disruption and expense to our business and operations.
We recognize the need for, and are in the early stages of, implementing disaster recovery, business continuity and document retention plans that would allow us to be operational despite casualties or unforeseen events impacting our corporate headquarters or distribution center. Without disaster recovery, business continuity and document retention plans, if we encounter difficulties or disasters with our distribution facility or at our corporate headquarters, our critical systems, operations and information may not be restored in a timely manner, or at all, and this would have a material adverse effect on our business.
Hurricanes or other unanticipated catastrophes that result in a disruption of our operations could negatively impact our business.
A substantial number of our stores are located in the southeastern U.S. which is prone to severe weather conditions. For example, hurricanes have passed through Florida and other states along the Gulf Coast causing extensive damage to the region. In addition, to the extent that the predictions of some climate change models prove accurate, there may be significant national and regional physical effects from climate change such as increases in storm intensity and frequency, including hurricanes. An increase in adverse weather conditions impacting the southeastern U.S. generally, could harm our business, results of operations and financial condition. In fact, all of our locations expose us to diverse risks, given that natural disasters or other unanticipated catastrophes, such as telecommunications failures, cyber-attacks, fires or terrorist attacks, can occur anywhere and could cause disruptions in our operations. Extensive or multiple disruptions in our operations, whether at our stores or our corporate headquarters and distribution center, due to natural disasters or other unanticipated catastrophes could have a material adverse effect on our results of operations.
15
Our net revenues and merchandise fluctuate on a seasonal basis, leaving our operating results particularly susceptible to changes in seasonal shopping patterns, weather and related risks.
Due to the seasonal nature of the retail industry, we have historically experienced and expect to continue to experience some fluctuations in our net revenues and net income. Our net revenues are typically higher in the second and fourth quarters. Net revenues generated during the second quarter and the holiday selling season generally contribute to the relatively higher second quarter and fourth quarter net income. Net revenues during these periods cannot be used as an accurate indicator of annual results. In addition, net revenues in a period can fluctuate due to shifts in the timing of the holidays. For instance, the Easter holiday will occur during different fiscal quarters from year to year. If for any reason our net revenues were below seasonal norms or expectations during these quarters, our annual results of operations could be adversely affected. In addition, in order to prepare for the second and fourth quarters, we must order and keep in stock more merchandise than we carry at other times during the year. This inventory build-up may require us to expend cash faster than is generated by our operations during this period.
Our net revenues also fluctuate based on weather patterns. Any unanticipated decrease in demand for our products during these peak shopping periods could require us to sell excess inventory at a substantial markdown, which could have a material adverse effect on our business, profitability and brand image. In addition, we may experience variability in net revenues as a result of a variety of other factors, including the timing of new store openings and catalog mailings, store events, other marketing activities, sales tax holidays and the back-to-school selling season and other holidays, which may cause our results of operations to fluctuate on a quarterly basis and relative to corresponding periods in prior years.
Increases in costs of catalog mailing, paper and printing will affect the cost of our direct business, which will reduce our profitability.
Postal rate increases and paper and printing costs increase our catalog distribution costs and affect the financial results of our direct business. We rely on discounts from the basic postal rate structure, such as discounts for bulk mailings and sorting by zip code and carrier routes. We are not a party to any long-term contracts for the supply of paper. Our cost of paper has fluctuated significantly, and our future paper costs are subject to supply and demand forces that we cannot control. Future additional increases in postal rates or in paper or printing costs could reduce our profitability to the extent that we are unable to pass those increases directly to customers or offset those increases by raising selling prices.
We may suffer risks if our vendors fail to comply with applicable laws, including a failure to use acceptable labor practices, or if our vendors suffer disruptions in their businesses.
Our vendors source the merchandise sold in our stores from manufacturers both inside and outside of the U.S. Although each of our purchase orders is subject to our vendor manual and requires adherence to accepted labor practices and compliance with labor, immigration, manufacturing safety and other laws, we do not supervise, control or audit our vendors or the manufacturers that produce the merchandise we sell. The violation of any labor, immigration, manufacturing safety or other laws by any of our vendors or their U.S. and non-U.S. manufacturers, such as use of child labor, could damage our brand image or subject us to boycotts by our customers or activist groups.
Any event causing a sudden disruption of manufacturing or imports, including the imposition of additional import restrictions, could interrupt, or otherwise disrupt, the shipment of finished products to us by our vendors and materially harm our operations. Political and financial instability outside the U.S., strikes, adverse weather conditions or natural disasters that may occur or acts of war or terrorism in the U.S. or worldwide, may affect the production, shipment or receipt of merchandise. These factors,
16
which are beyond our control, could materially hurt our business, financial condition and results of operations or may require us to modify our current business practices or incur increased costs.
Changes in laws, including employment laws and laws related to our merchandise, could make conducting our business more expensive or otherwise cause us to change the way we do business.
We are subject to numerous regulations, including labor and employment, truth-in-advertising, consumer protection and ordinances that regulate retailers generally or govern the promotion and sale of merchandise and the operation of stores and warehouse facilities. If these regulations were to change or were violated by our management, employees or vendors, the costs of certain goods could increase, or we could experience delays in shipments of our goods, be subject to fines or penalties or suffer reputational harm, which could reduce demand for our merchandise and hurt our business and results of operations.
In addition to increased regulatory compliance requirements, changes in laws could make the ordinary conduct of our business more expensive or require us to change the way we do business. Laws related to employee benefits and treatment of employees, including laws related to limitations on employee hours, immigration laws, child labor laws, minimum wage laws, supervisory status, leaves of absence, mandated health benefits or overtime pay, could also negatively impact us, such as by increasing compensation and benefits costs for overtime and medical expenses. Moreover, changes in product safety or other consumer protection laws could lead to increased costs to us for some merchandise, or additional labor costs associated with readying merchandise for sale. It is often difficult for us to plan and prepare for potential changes to applicable laws, and future actions or payments related to these changes could be material to us.
We plan to use cash from operations to fund our operations and execute our growth strategy. We may, however, require additional financing and any indebtedness could adversely affect our financial health and impose covenants that limit our business activities.
We plan to open a number of new stores and remodel existing stores as opportunities arise. As we work to grow our business and store base, we will require cash from operations to pay our lease obligations, build out new store spaces, purchase inventory, pay personnel and further invest in our systems and infrastructure. While we expect a larger store base to increase net sales, we may not achieve an increase. Payments under our store leases and the lease of our corporate headquarters and distribution center account for a significant portion of our operating expenses.
If our business does not generate sufficient cash flow from operations to fund our business and growth plans, we may need to incur indebtedness under our line of credit or may need to find additional equity or debt financing. If additional equity or debt financing is not available to us on satisfactory terms, our ability to run and expand our business would be curtailed and we may need to delay, limit or eliminate store openings. Also, we may not have enough cash on hand to fund any operating shortfalls.
Any borrowings under our line of credit or any future debt financing will require interest payments and need to be repaid or refinanced, and would create additional cash demands and financial risk for us. If we cannot generate sufficient cash flow from operations to service our debt, we may need to refinance our debt, dispose of assets or issue equity to obtain necessary funds. We do not know whether we would be able to take any of these actions on a timely basis, on terms satisfactory to us, or at all. Any indebtedness we might incur in the future may contain covenants that restrict our ability to incur additional debt, pay dividends, make acquisitions or investments or do certain other things that may impact the value of our common stock.
17
There are claims made against us from time to time that can result in litigation that could distract management from our business activities and result in significant liability or damage to our brand.
As a growing company with expanding operations, we increasingly face the risk of litigation and other claims against us. Litigation and other claims may arise in the ordinary course of our business and include employee claims, commercial disputes, intellectual property issues, product-oriented allegations and slip and fall claims. These claims can raise complex factual and legal issues that are subject to risks and uncertainties and could require significant management time. Litigation and other claims against us could result in unexpected expenses and liabilities, which could materially adversely affect our operations and our reputation.
We may be unable to protect our trademarks or other intellectual property rights.
We believe that our trademarks are integral to our store design, our direct business and our success in building brand image and loyalty. We have registered those trademarks that we believe are important to our business with the U.S. Patent and Trademark Office. We cannot be assured that these registrations will prevent imitation of our name, merchandising concept, store design or private label merchandise or the infringement of our other intellectual property rights by others. In most cases, the apparel and accessories we sell are purchased on a non-exclusive basis from vendors that also sell to our competitors. Our competitors may seek to replicate aspects of our business strategy and in-store experience, thereby diluting our experience and adversely affecting our brand and competitive position. Imitation of our name, concept, store design or merchandise in a manner that projects lesser quality or carries a negative connotation of our brand image could have a material adverse effect on our business, financial condition and results of operations.
In some regions of the U.S., our stores are located in the same malls and shopping centers as stores operated by a company doing business under the name The Body Shop®, which operates cosmetics and beauty stores. While we are not affiliated with this company, in 1991, we granted this company a license to use our Body Shop trademark which is held by us in connection with retail store services for the sale of women's apparel and apparel accessories. This license was non-exclusive as to certain uses and our agreements with this company permit us to continue to use our "Body Shop' mark in our stores located in Alabama, Arkansas, Florida, Georgia, Kentucky, Louisiana, Mississippi, North Carolina, South Carolina, Tennessee and Texas. While we currently operate under the Body Central banner, we operate under the Body Shop banner in 35 stores in certain states. The use by the cosmetic and beauty store of the Body Shop trademark may create confusion between our business and their business and this could affect our brand.
We are not aware of any claims of infringement upon or challenges to our right to use any of our brand names or trademarks in the U.S. Nevertheless, we cannot be certain that the actions we have taken to establish and protect our trademarks will be adequate to prevent imitation of our products by others or to prevent others from seeking to block sales of our products as a violation of the trademarks or proprietary rights of others. Although we cannot currently estimate the likelihood of success of any such lawsuit or ultimate resolution of such a conflict, such a controversy could have a material adverse effect on our business, financial condition and results of operations. If disputes arise in the future, we may not be able to successfully resolve these types of conflicts to our satisfaction.
Because we have not registered our trademarks in any foreign countries, international protection of our brand image and the use of these marks could be limited. For instance, we are aware of a company outside the U.S. that has used our brand name and has a similar logo, image and website for its business. Also, other entities may have rights to trademarks that contain portions of our marks or may have registered similar or competing marks for apparel or accessories in foreign countries in which our vendors source our merchandise. Our inability to register our trademarks or purchase or license the right to use our trademarks or logos in these jurisdictions could limit our ability to obtain supplies from
18
less costly markets or penetrate new markets should our business plan change to include selling our merchandise in those foreign jurisdictions.
We may be subject to liability if we or our vendors infringe upon the trademarks or other intellectual property rights of third parties, including the risk that we could acquire merchandise from our vendors without the full right to sell it.
While we do not manufacture and produce apparel and accessories, we may be subject to liability if our vendors infringe upon the trademarks or other intellectual property rights of third parties. We do not independently investigate whether our vendors legally hold intellectual property rights to the merchandise they manufacture and distribute. Third parties may bring legal claims, or threaten to bring legal claims, against us that their intellectual property rights are being infringed or violated by our use of intellectual property. Litigation or threatened litigation could be costly and distract our senior management from operating our business. If we were to be found liable for any such infringement, we could be required to pay substantial damages and could be subject to injunctions preventing further infringement. In addition, any payments we are required to make and any injunctions with which we are required to comply as a result of infringement claims could be costly and thereby adversely affect our financial results.
If a third party claims to have licensing rights with respect to merchandise we purchased from a vendor, or if we acquire unlicensed merchandise, we may be obligated to remove this merchandise from our stores, incur costs associated with this removal if the distributor or vendor is unwilling or unable to reimburse us and be subject to liability under various civil and criminal causes of action, including actions to recover unpaid royalties and other damages and injunctions. Additionally, we will be required to purchase new merchandise to replace any we remove.
We rely upon independent third-party transportation providers for substantially all of our merchandise shipments.
We currently rely upon independent third-party transportation providers for substantially all of our merchandise shipments, including shipments to all of our stores and our direct customers. Our use of outside delivery services for shipments is subject to risks, including increases in fuel prices, which would increase our shipping costs, and employee strikes and inclement weather, which may impact a shipper's ability to provide delivery services that adequately meet our shipping needs. If we change shipping companies, we could face logistical difficulties that could adversely impact deliveries and we would incur costs and expend resources in connection with such change. Moreover, we may not be able to obtain terms as favorable as those received from the independent third-party transportation providers we currently use, which would increase our costs.
Our ability to source our merchandise profitably could be hurt if new trade restrictions are imposed or existing trade restrictions become more burdensome.
We currently purchase all of our inventory from domestic, third-party vendors, who source our merchandise both domestically and internationally. These vendors, to the extent they obtain apparel and accessories from outside of the U.S., are subject to trade restrictions, including increased tariffs, safeguards or quotas, which could increase the cost or reduce the supply of merchandise available to us. Under the World Trade Organization Agreement, effective January 1, 2005, the U.S. and other World Trade Organization member countries removed quotas on goods from World Trade Organization members, which in certain instances we believe affords our vendors greater flexibility in importing textile and apparel products from World Trade Organization countries from which they source our merchandise. However, as the removal of quotas resulted in an import surge from China, the U.S. imposed safeguard quotas on a number of categories of goods and apparel from China and may impose additional quotas in the future. These and other trade restrictions could have a significant impact on
19
our vendor's sourcing patterns in the future. The extent of this impact, if any, and the possible effect on our purchasing patterns and costs, cannot be determined at this time. We cannot predict whether any of the countries in which our vendors' merchandise is currently manufactured or may be manufactured in the future will be subject to additional trade restrictions imposed by the U.S. and foreign governments, nor can we predict the likelihood, type or effect of any restrictions. Trade restrictions, including increased tariffs or quotas, embargoes, safeguards and customs restrictions against apparel items, as well as U.S. or foreign labor strikes, work stoppages or boycotts, could increase the cost or reduce the supply of apparel to our vendors, and we would expect the costs to be passed along in increased prices to us, which could hurt our profitability.
We may be subject to sales tax in states where we operate our direct business, which could have a material adverse effect on our business, financial condition and results of operations.
Under current state and federal laws, we are not required to collect and remit sales tax in states where we sell through our Internet or catalog channels. Legislation is pending in some states that may require us to collect and remit sales tax on direct sales or institute use tax reporting. If states pass sales or use tax laws, we may need to collect and remit current and past sales tax and could face greater exposure to income tax and franchise taxes in these states. Any increase in sales tax or use tax reporting on our Internet sales could discourage customers from purchasing through our catalog or Internet channels, which could have a material adverse effect on our results of operations.
Increases in the minimum wage could have a material adverse effect on our business, financial condition, results of operations and cash flows.
From time to time, legislative proposals are made to increase the minimum wage in the U.S., as well as a number of individual states. Wage rates for many of our employees are at or slightly above the minimum wage. As federal or state minimum wage rates increase, we may need to increase not only the wage rates of our minimum wage employees, but also the wages paid to our other hourly employees as well. Any increase in the cost of our labor could have a material adverse effect on our operating costs, financial condition and results of operations.
Risks Related to Ownership of Our Common Stock
Anti-takeover provisions in our charter documents and Delaware law might discourage or delay acquisition attempts for us that might be considered favorable.
Our certificate of incorporation and by-laws contain provisions that may make the acquisition of our company more difficult without the approval of our board of directors. These provisions, among other things:
- •
- establish a classified board of directors so that not all members of our board of directors are elected at one time;
- •
- authorize the issuance of undesignated preferred stock, the terms of which may be established and the shares of which may
be issued without stockholder approval, and which may include super-majority voting, special approval, dividend or other rights or preferences superior to the rights of the holders of common stock;
- •
- prohibit stockholder action by written consent, which requires all stockholder actions to be taken at a meeting of our
stockholders;
- •
- provide that our board of directors is expressly authorized to make, alter or repeal our bylaws; and
20
- •
- establish advance notice requirements for nominations for elections to our board of directors or for proposing matters that can be acted upon by stockholders at stockholder meetings.
These anti-takeover provisions and other provisions under Delaware law could discourage, delay or prevent a transaction involving a change-in-control, even if doing so would benefit our stockholders. These provisions could also discourage proxy contests and make it more difficult for stockholders to elect directors of their choosing and to cause us to take other corporate actions.
If securities or industry analysts do not publish research or publish inaccurate or unfavorable research about our business, our stock price and trading volume could decline.
The trading market for our common stock depends in part on the research and reports that securities or industry analysts publish about us or our business. If one or more of the analysts who cover us downgrades our common stock or publishes inaccurate or unfavorable research about our business, our stock price would likely decline. If one or more of these analysts cease coverage of us or fail to publish reports on us regularly, demand for our common stock could decrease, which could cause our stock price and trading volume to decline.
Our actual operating results may differ significantly from our guidance.
From time to time, we release guidance regarding our future performance that represents our management's estimates as of the date of release. This guidance, which consists of forward-looking statements, is prepared by our management and is qualified by, and subject to, the assumptions and the other information contained or referred to in the release. Our guidance is not prepared with a view toward compliance with published guidelines of the American Institute of Certified Public Accountants, and neither our independent registered certified public accounting firm nor any other independent expert or outside party compiles or examines the guidance and, accordingly, no such person expresses any opinion or any other form of assurance with respect thereto.
Guidance is based upon a number of assumptions and estimates that, while presented with numerical specificity, is inherently subject to significant business, economic and competitive uncertainties and contingencies, many of which are beyond our control and are based upon specific assumptions with respect to future business decisions, some of which will change. We generally state possible outcomes as high and low ranges which are intended to provide a sensitivity analysis as variables are changed. There can be no assurance that our results will not fall outside of the suggested ranges. The principal reason that we release this data is to provide a basis for our management to discuss our business outlook with analysts and investors. We do not accept any responsibility for any projections or reports published by any such outside analysts or investors.
Guidance is necessarily speculative in nature, and it can be expected that some or all of the assumptions of the guidance furnished by us will not materialize or will vary significantly from actual results. Accordingly, our guidance is only an estimate of what management believes is realizable as of the date of release. Actual results will vary from the guidance and the variations may be material. Investors should also recognize that the reliability of any forecasted financial data diminishes the farther in the future that the data is forecast. In light of the foregoing, investors are urged to put the guidance in context and not to place undue reliance on it.
Any failure to successfully implement our operating strategy or the occurrence of any of the events or circumstances set forth in this Annual Report on Form 10-K could result in the actual operating results being different than the guidance, and such differences may be materially adverse.
ITEM 1B. UNRESOLVED STAFF COMMENTS
None.
21
We do not own any real property. All of our properties are leased. Our executive offices, warehouse and distribution center are located in an approximately 179,000 square foot facility in Jacksonville, Florida. This facility is leased under a lease agreement expiring in 2016. Of the approximately 179,000 square feet in the facility, approximately 146,000 square feet are dedicated to warehouse space and distribution. We believe that our Jacksonville facility will be able to meet our growth plans through 2013, although we may from time to time lease new facilities or vacate existing facilities as our operations require.
As of December 31, 2011, we had 241 retail stores in 24 states, located primarily in the South, Mid-Atlantic and Midwest. All of our stores are leased from third parties, and the leases typically have terms of six to ten years. Most of our leases have early termination clauses, which permit the lease to be terminated by us if certain sales levels are not met in specific periods or if a shopping center does not meet specified occupancy standards. In addition to future minimum lease payments, most of our store leases provide for additional rental payments based on our achieving specified net sales and many provide for additional payments associated with common area maintenance, real estate, taxes and insurance. In addition, many of our lease agreements have defined escalating rent provisions over the initial term and extensions.
We are subject to various legal proceedings and claims, including employment claims, wage and hour claims, intellectual property claims, contractual and commercial disputes and other matters that arise in the ordinary course of our business. While the outcome of these and other claims cannot be predicted with certainty, we do not believe that the outcome of these matters will have a material adverse effect on our business, financial statements or disclosures.
ITEM 4. MINE SAFETY DISCLOSURES
None.
22
ITEM 5. MARKET FOR REGISTRANT'S COMMON EQUITY, RELATED STOCKHOLDER
MATTERS AND ISSUER PURCHASES OF EQUITY SECURITIES
Market Information
Our common stock has been listed on the NASDAQ Global Market under the symbol "BODY" since our initial public offering on October 14, 2010. Prior to that time there was no public market for our common stock. The following table sets forth the high and low bid prices of our common stock as reported on the NASDAQ Global Market:
| |
High | Low | |||||
|---|---|---|---|---|---|---|---|
Fiscal year 2011 |
|||||||
First Quarter |
$ | 24.48 | $ | 14.11 | |||
Second Quarter |
$ | 26.98 | $ | 19.77 | |||
Third Quarter |
$ | 26.20 | $ | 14.61 | |||
Fourth Quarter |
$ | 25.06 | $ | 17.09 | |||
Fiscal year 2010 |
|||||||
Fourth Quarter (beginning October 14, 2010) |
$ | 15.75 | $ | 11.98 | |||
Holders
As of March 6, 2012, there were approximately 8 shareholders of record of our common stock.
Dividends
We did not declare or pay dividends on our common stock for our fiscal years 2011, 2010 or 2009. We do not expect to pay dividends on our common stock for the foreseeable future. Instead, we anticipate that all of our earnings in the foreseeable future will be retained and used in the operation and growth of our business. Any future determination to pay dividends will be at the discretion of our board of directors, subject to compliance with applicable law and any contractual provisions, including under agreements for indebtedness that we may incur, that restrict or limit our ability to pay dividends, and will depend upon, among other factors, our results of operations, financial condition, capital requirements and other factors that our board of directors deems relevant. Because we are a holding company, our ability to pay dividends depends on our receipt of cash dividends from our operating subsidiaries, which may further restrict our ability to pay dividends as a result of the laws of their jurisdiction of organization, agreements of our subsidiaries or covenants under future indebtedness we may incur.
23
Stock Price Performance Graph
The following graph compares the cumulative stockholder return on our common stock with the cumulative total return to the NASDAQ Composite Index and the Dow Jones US Apparel Retailers Index. The graph assumes $100 invested on October 14, 2010, in the common stock of Body Central Corp., the NASDAQ Composite Index, and the Dow Jones US Apparel Retailers Index. It also assumes that all dividends are reinvested. The stock performance graph should not be deemed filed or incorporated by reference into any other filing made by us under the Securities Act of 1933 or the Securities Exchange Act of 1934, except to the extent that we specifically incorporate the stock performance graph by reference in another filing.
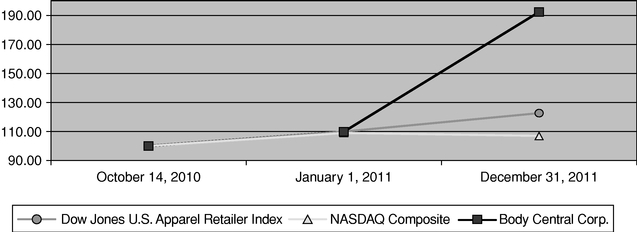
| |
October 14, 2010 |
January 1, 2011 |
December 31, 2011 |
|||||||
|---|---|---|---|---|---|---|---|---|---|---|
Body Central Corp. |
100.00 | 109.77 | 192.00 | |||||||
NASDAQ Composite |
100.00 | 108.93 | 106.97 | |||||||
Dow Jones U.S. Apparel Retailer Index |
100.00 | 109.87 | 122.55 | |||||||
Unregistered Sales of Equity Securities
None.
24
ITEM 6. SELECTED CONSOLIDATED FINANCIAL AND OPERATING DATA
The following selected consolidated financial data has been derived from our consolidated financial statements. We have also included certain non-financial operating data to enhance your understanding of our business. We operate on a fiscal calendar that results in a given fiscal year consisting of a 52- or 53-week period ending on the Saturday closest to December 31st. The reporting periods contained in our audited financial statements included in this Annual Report on Form 10-K contain 52 weeks of operations in fiscal year 2011, which ended December 31, 2011, 52 weeks of operations in fiscal year 2010, which ended January 1, 2011, 52 weeks of operations in fiscal year 2009, which ended January 2, 2010, 53 weeks of operations in fiscal year 2008, which ended January 3, 2009, and 52 weeks of operations in fiscal year 2007, which ended December 29, 2007.
The consolidated selected financial data set forth below should be read in conjunction with our consolidated financial statements, the related notes and "Management's Discussion and Analysis of Financial Condition and Results of Operations" included elsewhere in this Annual Report on Form 10-K. The historical results presented below are not necessarily indicative of the results to be expected for any future period.
25
| |
Fiscal Year Ended | |||||||||||||||
|---|---|---|---|---|---|---|---|---|---|---|---|---|---|---|---|---|
| |
December 31, 2011 |
January 1, 2011 |
January 2, 2010 |
January 3, 2009 |
December 29, 2007 |
|||||||||||
| |
(in thousands, except per share data) |
|||||||||||||||
Statement of Income Data: |
||||||||||||||||
Net revenues |
$ | 296,500 | $ | 243,364 | $ | 198,834 | $ | 191,824 | $ | 195,911 | ||||||
Cost of goods sold |
193,101 | 161,802 | 139,352 | 137,363 | 139,726 | |||||||||||
Gross profit |
103,399 | 81,562 | 59,482 | 54,461 | 56,185 | |||||||||||
Selling, general and administrative expenses |
66,803 | 56,920 | 46,360 | 46,174 | 52,440 | |||||||||||
Depreciation and amortization expense |
5,204 | 4,773 | 4,678 | 5,357 | 5,469 | |||||||||||
Impairment of long-lived assets |
— | — | 196 | 936 | 2,428 | |||||||||||
Goodwill impairment |
— | — | — | — | 33,962 | |||||||||||
Income (loss) from operations |
31,392 | 19,869 | 8,248 | 1,994 | (38,114 | ) | ||||||||||
Interest expense (income), net |
(16 | ) | 3,292 | 3,956 | 4,329 | 4,215 | ||||||||||
Other expense (income), net |
(237 | ) | 308 | (128 | ) | (493 | ) | 238 | ||||||||
Income (loss) before income taxes |
31,645 | 16,269 | 4,420 | (1,842 | ) | (42,567 | ) | |||||||||
Provision for (benefit from) income taxes |
11,925 | 6,458 | 1,640 | (890 | ) | (3,237 | ) | |||||||||
Net income (loss) |
$ | 19,720 | $ | 9,811 | $ | 2,780 | $ | (952 | ) | $ | (39,330 | ) | ||||
Net income (loss) per common share |
||||||||||||||||
Basic |
$ | 1.25 | $ | 2.77 | $ | 12.94 | $ | (5.42 | ) | $ | (194.10 | ) | ||||
Diluted |
$ | 1.22 | $ | 0.73 | $ | 0.23 | $ | (5.42 | ) | $ | (194.10 | ) | ||||
Weighted average common shares outstanding |
||||||||||||||||
Basic |
15,780,908 | 3,502,657 | 203,235 | 203,235 | 203,235 | |||||||||||
Diluted |
16,218,382 | 13,383,642 | 12,173,978 | 203,235 | 203,235 | |||||||||||
Operating Data: |
||||||||||||||||
Revenues: |
||||||||||||||||
Stores |
$ | 261,842 | $ | 209,413 | $ | 165,331 | $ | 156,924 | $ | 164,411 | ||||||
Direct |
34,658 | 33,951 | 33,503 | 34,900 | 31,500 | |||||||||||
Net revenues |
$ | 296,500 | $ | 243,364 | $ | 198,834 | $ | 191,824 | $ | 195,911 | ||||||
Stores: |
||||||||||||||||
Comparable store sales change |
11.3 | % | 14.8 | % | 4.9 | % | (8.0 | %) | (4.6 | %) | ||||||
Number of stores open at end of period |
241 | 209 | 185 | 180 | 188 | |||||||||||
Sales per gross square foot (in whole dollars) |
$ | 253 | $ | 233 | $ | 207 | $ | 204 | $ | 206 | ||||||
Average square feet per store |
4,287 | 4,300 | 4,312 | 4,283 | 4,246 | |||||||||||
Total gross square feet at end of period (in thousands) |
1,033 | 899 | 798 | 771 | 798 | |||||||||||
Direct: |
||||||||||||||||
Number of catalogs circulated (in thousands) |
22,900 | 21,900 | 20,300 | 20,300 | 16,000 | |||||||||||
Revenue per catalog (in whole dollars) |
$ | 1.51 | $ | 1.55 | $ | 1.65 | $ | 1.72 | $ | 1.97 | ||||||
Capital expenditures (in thousands) |
$ | 9,806 | $ | 6,804 | $ | 4,809 | $ | 2,640 | $ | 9,656 | ||||||
Balance Sheet Data: |
||||||||||||||||
Cash and cash equivalents |
$ | 41,993 | $ | 16,202 | $ | 7,226 | $ | 4,002 | $ | 5,372 | ||||||
Working capital |
36,881 | 11,702 | (1,967 | ) | (2,698 | ) | 192 | |||||||||
Total assets |
132,302 | 96,996 | 79,209 | 77,727 | 87,390 | |||||||||||
Long-term debt, less current portion |
— | — | 33,000 | 38,250 | 43,250 | |||||||||||
Redeemable preferred stock |
— | — | 50,038 | 49,888 | 49,738 | |||||||||||
Stockholders' equity (deficit) |
85,072 | 58,142 | (36,891 | ) | (39,689 | ) | (38,701 | ) | ||||||||
Cash Flow Data: |
||||||||||||||||
Net cash provided by operating activities |
$ | 29,448 | $ | 19,409 | $ | 13,018 | $ | 4,220 | $ | 7,175 | ||||||
26
ITEM 7. MANAGEMENT'S DISCUSSION AND ANALYSIS OF FINANCIAL CONDITION AND RESULTS OF OPERATIONS
The following discussion summarizes the significant factors affecting the consolidated operating results, financial condition, liquidity, and cash flows of our Company as of and for the periods presented below. This discussion contains forward-looking statements that are based on the beliefs of our management, as well as assumptions made by, and information currently available to, our management. Actual results could differ materially from those discussed in or implied by forward-looking statements as a result of various factors. See "Forward-Looking Statements."
Overview
Founded in 1972, Body Central Corp. is a multi-channel specialty retailer offering on-trend, quality apparel and accessories at value prices. We operate specialty apparel stores under the Body Central and Body Shop banners, as well as a direct business comprised of our Body Central catalog and our e-commerce website at www.bodyc.com. We target women in their late teens and twenties from diverse cultural backgrounds, who seek the latest fashions and a flattering fit. Our stores feature an assortment of tops, dresses, bottoms, jewelry, accessories and shoes sold primarily under our exclusive Body Central® and Lipstick® labels. We continually update our merchandise and floor sets with an emphasis on coordinated outfits presented by lifestyle to give our customers a reason to shop our stores frequently. We believe our multi-channel strategy supports our brand building efforts and provides us with synergistic growth opportunities across all of our sales channels.
As of December 31, 2011, we had 241 stores with an average size of approximately 4,300 square feet. Our stores are located in fashion retail venues in the South, Mid-Atlantic and Midwest. We opened 33 new stores and closed one store in fiscal year 2011.
How We Assess the Performance of Our Business
In assessing the performance of our business, we consider a variety of operational and financial measures. The key measures for determining how our business is performing are net revenues, comparable store and non-comparable store sales, direct sales through our catalog and e-commerce channels, gross profit margin and selling, general and administrative expenses.
Net Revenues
Net revenues consist of sales of our merchandise from comparable stores and non-comparable stores, and direct sales through our catalog and e-commerce channels, including shipping and handling fees charged to our customers. Net revenues from our stores and direct business reflect sales of our merchandise less estimated returns and merchandise discounts.
Store Sales
There may be variations in the way in which other retailers calculate "comparable" or "same store" sales. We include a store in comparable store sales on the first day of the fourteenth month after a store opens. Non-comparable store sales include sales not included in comparable store sales (for example, the first two months of a new store's sales) and sales from closed stores. Measuring the change in year-over-year comparable store sales allows us to evaluate how our store base is performing. Various factors affect comparable store sales, including:
- •
- consumer preferences, buying trends and overall economic trends;
- •
- our ability to identify and respond effectively to fashion trends and customer preferences;
- •
- changes in competition;
27
- •
- changes in our merchandise mix;
- •
- changes in pricing levels and average unit price;
- •
- the timing of our releases of new merchandise;
- •
- the level of customer service that we provide in our stores;
- •
- our ability to source and distribute products efficiently; and
- •
- the number of stores we open and close in any period.
Opening new stores is an important part of our growth strategy. We expect a significant percentage of our net revenues to come from non-comparable store sales. Accordingly, comparable store sales is only one element we use to assess the success of our growth strategy. Purchases of apparel and accessories are sensitive to a number of factors that influence the levels of consumer spending, including economic conditions and the level of disposable consumer income, consumer debt, interest rates and consumer confidence. Our business is somewhat seasonal and as a result, our revenues fluctuate. In addition, our revenues in any given quarter can be affected by timing of holidays, the weather and other factors beyond our control.
Direct Sales
We offer direct sales through our catalogs and through our e-commerce website, www.bodyc.com, which accepts orders directly from our customers. We believe the circulation of our catalogs and access to our website increases our reputation and brand recognition with our target customers and helps support the strength of our store operations. Direct sales are not included in our comparable store sales.
Gross Profit
Gross profit is equal to our net revenues minus our cost of goods sold. Gross profit margin measures gross profit as a percentage of our net revenues. Cost of goods sold includes the direct cost of purchased merchandise, distribution costs, all freight costs incurred to ship merchandise to our stores and our direct customers, costs incurred to produce and distribute our catalogs, store occupancy costs, buying costs and inventory shrinkage. The components of our cost of goods sold may not be comparable to those of other retailers.
Our cost of goods sold is greater in higher volume periods because cost of goods sold generally increases as net revenues increase. Changes in the mix of our products, such as changes in the proportion of accessories, may also impact our cost of goods sold. We review our inventory levels on an ongoing basis in order to identify slow-moving merchandise and take appropriate markdowns to clear these goods. The timing and level of markdowns are not seasonal in nature, but are driven by customer acceptance of our merchandise. If we misjudge sales levels and/or trends, we may be faced with excess inventories and be required to mark down our prices for those products in order to sell them. Significant markdowns have reduced our gross profit in some prior periods and may do so in future periods.
Selling, General and Administrative Expenses
Selling, general and administrative expenses include all operating costs not included in cost of goods sold. These expenses include payroll and other expenses related to operations at our corporate headquarters and store operations. These expenses do not generally vary proportionally with net revenues. As a result, selling, general and administrative expenses as a percentage of net revenues are usually higher in lower volume periods and usually lower in higher volume periods. The components of our selling, general and administrative expenses may not be comparable to those of other retailers. We
28
expect that our selling, general and administrative expenses will increase in future periods due to our continuing store growth and continuing growth in our direct business.
Results of Operations
The following tables summarize key components of our results of operations for the periods indicated as a percentage of net revenues as well as selected non-financial operating data:
| |
Fiscal Year Ended | |||||||||
|---|---|---|---|---|---|---|---|---|---|---|
| |
December 31, 2011 |
January 1, 2011 |
January 2, 2010 |
|||||||
Percentage of Net Revenues: |
||||||||||
Net revenues |
100.0 | % | 100.0 | % | 100.0 | % | ||||
Cost of goods sold |
65.1 | 66.5 | 70.1 | |||||||
Gross profit |
34.9 | 33.5 | 29.9 | |||||||
Selling, general and administrative expenses |
22.5 | 23.4 | 23.3 | |||||||
Depreciation and amortization |
1.8 | 2.0 | 2.4 | |||||||
Impairment of long-lived assets |
— | — | 0.1 | |||||||
Income from operations |
10.6 | 8.1 | 4.1 | |||||||
Interest expense, net of interest income |
— | 1.4 | 2.0 | |||||||
Other expense (income), net |
(0.1 | ) | 0.1 | (0.1 | ) | |||||
Income before income taxes |
10.7 | 6.6 | 2.2 | |||||||
Provision for income taxes |
4.0 | 2.7 | 0.8 | |||||||
Net income |
6.7 | % | 3.9 | % | 1.4 | % | ||||
Operating Data: |
||||||||||
Stores: |
||||||||||
Comparable store sales change |
11.3 | % | 14.8 | % | 4.9 | % | ||||
Number of stores open at end of period |
241 | 209 | 185 | |||||||
Sales per gross square foot (in whole dollars) |
$ | 253 | $ | 233 | $ | 207 | ||||
Average square feet per store |
4,287 | 4,300 | 4,312 | |||||||
Total gross square feet at end of period (in thousands) |
1,033 | 899 | 798 | |||||||
Direct: |
||||||||||
Number of catalogs circulated (in thousands) |
22,900 | 21,900 | 20,300 | |||||||
Revenue per catalog (in whole dollars) |
$ | 1.51 | $ | 1.55 | $ | 1.65 | ||||
We have determined our operating segments on the same basis that we use internally to evaluate performance. Our operating segments are our stores and our direct business, which have been aggregated into one reportable segment. We aggregate our operating segments because they have a similar class of customer, nature of products, nature of production process and distribution methods, as well as similar economic characteristics.
29
The following table summarizes the number of stores open at the beginning of the period and at the end of the period:
| |
December 31, 2011 |
January 1, 2011 |
January 2, 2010 |
|||||||
|---|---|---|---|---|---|---|---|---|---|---|
Stores at beginning of period |
209 | 185 | 180 | |||||||
Stores opened during period |
33 | 27 | 15 | |||||||
Stores closed during period |
(1 | ) | (3 | ) | (10 | ) | ||||
Stores at end of period |
241 | 209 | 185 | |||||||
Comparison of Fiscal Year 2011 to Fiscal Year 2010
| |
Fiscal Year Ended | |
|
||||||||||||||||
|---|---|---|---|---|---|---|---|---|---|---|---|---|---|---|---|---|---|---|---|
| |
December 31, 2011 | January 1, 2011 | Variance | ||||||||||||||||
| |
Amount | Percentage of Net Revenues |
Amount | Percentage of Net Revenues |
Dollars | Percentages | |||||||||||||
| |
(dollars in thousands) |
|
|
||||||||||||||||
Net revenues |
$ | 296,500 | 100.0 | % | $ | 243,364 | 100.0 | % | $ | 53,136 | 21.8 | % | |||||||
Cost of goods sold |
193,101 | 65.1 | 161,802 | 66.5 | 31,299 | 19.3 | |||||||||||||
Gross profit |
103,399 | 34.9 | 81,562 | 33.5 | 21,837 | 26.8 | |||||||||||||
Selling, general and administrative expenses |
66,803 | 22.5 | 56,920 | 23.4 | 9,883 | 17.4 | |||||||||||||
Depreciation and amortization |
5,204 | 1.8 | 4,773 | 2.0 | 431 | 9.0 | |||||||||||||
Income from operations |
31,392 | 10.6 | 19,869 | 8.1 | 11,523 | 58.0 | |||||||||||||
Interest expense, net of interest income |
(16 | ) | — | 3,292 | 1.4 | (3,308 | ) | (100.5 | ) | ||||||||||
Other expense (income), net |
(237 | ) | (0.1 | ) | 308 | 0.1 | (545 | ) | (176.9 | ) | |||||||||
Income before income taxes |
31,645 | 10.7 | 16,269 | 6.6 | 15,376 | 94.5 | |||||||||||||
Provision for income taxes |
11,925 | 4.0 | 6,458 | 2.7 | 5,467 | 84.7 | |||||||||||||
Net income |
$ | 19,720 | 6.7 | % | $ | 9,811 | 3.9 | % | $ | 9,909 | 101.0 | % | |||||||
Operating Data: |
|||||||||||||||||||
Revenues: |
|||||||||||||||||||
Stores |
$ | 261,842 | 88.3 | % | $ | 209,413 | 86.0 | % | $ | 52,429 | 25.0 | % | |||||||
Direct |
34,658 | 11.7 | 33,951 | 14.0 | 707 | 2.1 | |||||||||||||
Net revenues |
$ | 296,500 | 100.0 | % | $ | 243,364 | 100.0 | % | $ | 53,136 | 21.8 | % | |||||||
Net Revenues
Net revenues increased by $53.1 million, or 21.8%, for fiscal year 2011 from fiscal year 2010. This increase resulted from an increase in non-comparable store sales and comparable store sales in addition to a slight increase in our direct sales as further described below.
Store sales increased $52.4 million, or 25.0%, for fiscal year 2011 from fiscal year 2010. Comparable store sales increased by 11.3%, or $21.9, million in fiscal 2011 compared to an increase of 14.8% in fiscal year 2010. The 11.3% increase in comparable store sales was primarily driven by an increase in the number of transactions per store. Non-comparable store sales increased by $30.5 million in fiscal year 2011 compared to fiscal year 2010.
30
Direct sales, including shipping and handling fees, increased $707,000, or 2.1%, for fiscal year 2011 from fiscal year 2010, due to an increase in the number of catalogs circulated offset by a decrease in average revenue per catalog.
Gross Profit
Gross profit increased $21.8 million, or 26.8%, for fiscal year 2011 from fiscal year 2010. As a percentage of net revenues, gross profit margin increased by 140 basis points for fiscal year 2011 from fiscal year 2010. This increase was attributable to a 20 basis point decrease in merchandise margin, and a 160 basis point decrease in freight costs, store occupancy, distribution and buying costs as a percentage of net revenues, due primarily to an increase in comparable store sales and a favorable change in per store occupancy costs.
Selling, General and Administrative Expense
Selling, general and administrative expenses increased by $9.9 million, or 17.4%, for fiscal year 2011 from fiscal year 2010. This increase resulted in part from a $6.4 million increase in store operating expenses due primarily to our store growth. As a percentage of net revenues, store operating expenses decreased to 16.3% for fiscal year 2011 from 17.3% for fiscal year 2010, primarily as a result of leveraging store payroll related expenses. General and administrative expenses increased $3.5 million primarily due to increased compensation expense needed to support store growth and profit objectives. As a percentage of net revenues, general and administrative expenses increased to 6.2% for fiscal year 2011 from 6.1% for fiscal year 2010.
As a percentage of net revenues, selling, general and administrative expenses were 22.5% for fiscal year 2011 and 23.4% for fiscal year 2010 due to reasons discussed above.
Depreciation and Amortization Expense
Depreciation and amortization increased $431,000, or 9.0%, for fiscal year 2011 from fiscal year 2010. As a percentage of net revenues, depreciation and amortization decreased 20 basis points for fiscal year 2011 from fiscal year 2010 primarily as a result of an increase of our comparable store sales.
Interest Expense, Net of Interest Income
Interest expense, net of interest income, decreased by $3.3 million, or 100.5%, for fiscal year 2011 from fiscal year 2010, which primarily reflects the repayment and termination of our senior credit facility on October 20, 2010 using net proceeds from our initial public offering. The early repayment triggered a charge of $793,000 for interest and related fees. The senior credit facility was subsequently terminated.
Provision for Income Taxes
Provision for income taxes increased $5.5 million, or 84.7%, for fiscal year 2011 from fiscal year 2010, which was attributable to a $15.4 million increase in income before income taxes partially offset by a rate decrease of 200 basis points in the effective tax rate to 37.7% in fiscal year 2011, from 39.7% in fiscal year 2010. The decrease in the effective rate was due primarily to converting incentive stock options to non-qualified option during fiscal 2011.
31
Net Income
Net income increased $9.9 million for fiscal year 2011 from fiscal year 2010 due to the factors discussed above.
Comparison of Fiscal Year 2010 to Fiscal Year 2009
| |
Fiscal Year Ended | |
|
||||||||||||||||
|---|---|---|---|---|---|---|---|---|---|---|---|---|---|---|---|---|---|---|---|
| |
January 1, 2011 |
January 2, 2010 |
Variance | ||||||||||||||||
| |
Amount | Percentage of Net Revenues |
Amount | Percentage of Net Revenues |
Dollars | Percentages | |||||||||||||
| |
(dollars in thousands) |
|
|
||||||||||||||||
Net revenues |
$ | 243,364 | 100.0 | % | $ | 198,834 | 100.0 | % | $ | 44,530 | 22.4 | % | |||||||
Cost of goods sold |
161,802 | 66.5 | 139,352 | 70.1 | 22,450 | 16.1 | |||||||||||||
Gross profit |
81,562 | 33.5 | 59,482 | 29.9 | 22,080 | 37.1 | |||||||||||||
Selling, general and administrative expenses |
56,920 | 23.4 | 46,360 | 23.3 | 10,560 | 22.8 | |||||||||||||
Depreciation and amortization |
4,773 | 2.0 | 4,678 | 2.4 | 95 | 2.0 | |||||||||||||
Impairment of long-lived assets |
— | — | 196 | 0.1 | (196 | ) | (100.0 | ) | |||||||||||
Income from operations |
19,869 | 8.1 | 8,248 | 4.1 | 11,621 | 140.9 | |||||||||||||
Interest expense, net of interest income |
3,292 | 1.4 | 3,956 | 2.0 | (664 | ) | (16.8 | ) | |||||||||||
Other income, net of other expense |
308 | 0.1 | (128 | ) | (0.1 | ) | 436 | (340.6 | ) | ||||||||||
Income before income taxes |
16,269 | 6.6 | 4,420 | 2.2 | 11,849 | 268.1 | |||||||||||||
Provision for income taxes |
6,458 | 2.7 | 1,640 | 0.8 | 4,818 | 293.8 | |||||||||||||
Net income |
$ | 9,811 | 3.9 | % | $ | 2,780 | 1.4 | % | $ | 7,031 | 252.9 | % | |||||||
Operating Data : |
|||||||||||||||||||
Revenues: |
|||||||||||||||||||
Stores |
$ | 209,413 | 86.0 | % | $ | 165,331 | 83.2 | % | $ | 44,082 | 26.7 | % | |||||||
Direct |
33,951 | 14.0 | 33,503 | 16.8 | 448 | 1.3 | |||||||||||||
Net revenues |
$ | 243,364 | 100.0 | % | $ | 198,834 | 100.0 | % | $ | 44,530 | 22.4 | % | |||||||
Net Revenues
Net revenues increased $44.5 million, or 22.4%, in fiscal year 2010 from fiscal year 2009. This increase resulted from an increase in non-comparable store sales and comparable store sales in addition to a slight increase in our direct sales as further described below.
Store sales increased $44.1 million, or 26.7%, in fiscal year 2010 from fiscal year 2009. Comparable store sales increased $23.0 million, or 14.8%, in fiscal year 2010 compared to an increase of 4.9% in fiscal year 2009. Non-comparable store sales increased $21.1 million in fiscal year 2010 compared to fiscal year 2009.
Direct sales, including shipping and handling fees, from our direct business increased $448,000, or 1.3%, in fiscal year 2010 from fiscal year 2009, due to an increase in the number of catalogs circulated offset by a decrease in average revenue per catalog. The decrease in average revenue per catalog was partially attributable the delayed distribution of our August 2011 catalog by a former third party vendor.
32
Gross Profit
Gross profit increased $22.1 million, or 37.1%, in fiscal year 2010 from fiscal year 2009. As a percentage of revenues, gross profit margin increased by 360 basis points in fiscal year 2010 from fiscal year 2009. This increase was attributable to a 90 basis point increase in merchandise margin, due primarily to stronger regular price sales which required fewer markdowns, and a 270 basis point decrease in freight costs, store occupancy, distribution and buying costs as a percentage of net revenues, due primarily to an increase in comparable store sales and a favorable change in per store occupancy costs.
Selling, General and Administrative Expenses
Selling, general and administrative expenses increased $10.6 million, or 22.8%, in fiscal year 2010 from fiscal year 2009. Store operating expenses increased by $5.5 million increase in store operating expenses primarily due to our store growth. As a percentage of revenues, store operating expenses decreased to 17.3% for fiscal year 2010 from 18.4% in fiscal year 2009. General and administrative expenses increased $5.1 million due in part to $1.2 million of costs related to our initial public offering, including the payment by us of an aggregate $1.0 million under a success bonus plan triggered by the completion of our initial public offering. The remaining increase is primarily related to higher compensation expenses and professional fees associated with the implementation of certain information technology systems, including a new point-of-sale software system. As a percentage of net revenues, general and administrative expenses increased to 6.1% for fiscal year 2010 from 4.9% for fiscal year 2009.
As a percentage of revenues, selling, general and administrative expenses increased 10 basis points for fiscal year 2010 from fiscal year 2009.
Depreciation and Amortization
Depreciation and amortization increased $95,000, or 2.0%, in fiscal year 2010 from fiscal year 2009. As a percentage of revenues, depreciation and amortization decreased 40 basis points in fiscal year 2010 from fiscal year 2009 primarily as a result of an increase is our comparable store sales.
Impairment of Long-Lived Assets
Impairment of long-lived assets was related to fair value adjustments on the carrying value of store assets.
Interest Expense, Net of Interest Income
Interest expense, net of interest income, decreased by $664,000, or 16.8%, in fiscal year 2010 from fiscal year 2009. This decrease reflects our lower average borrowings under our senior credit facility for fiscal year 2010. On October 20, 2010, we repaid all amounts owed under the term loan facilities of our senior credit facility using net proceeds from our initial public offering. The early repayment triggered a charge of $793,000 for interest and related fees. The senior credit facility was subsequently terminated.
Provision for Income Taxes
Provision for income tax increased $4.8 million in fiscal year 2010 from fiscal year 2009. This increase was attributable to an $11.8 million increase in income before income taxes in addition to the effective tax rate increase of 260 basis points to 39.7% for fiscal year 2009 from 37.1% in fiscal year 2009. The basis point increase was due primarily to the elimination of certain deferred tax assets no
33
longer expected to be utilized and reduced tax credits expected to be utilized to reduce our fiscal year 2010 income tax liability.
Net Income
Net income increased $7.0 million in fiscal year 2010 from fiscal year 2009 due to the factors discussed above.
Liquidity and Capital Resources
Our primary sources of liquidity are currently cash flows from operations. Our primary cash needs are capital expenditures in connection with opening new stores, remodeling or relocating existing stores, distributing our catalogs, operating our website and the additional working capital required for running our operations. Cash is also required for investment in our information technology systems, maintenance of existing facilities and distribution facility enhancements, when required. The most significant components of our working capital are cash and cash equivalents, merchandise inventories, trade payables and other current liabilities. Our working capital position benefits from the fact that we generally collect cash from sales to customers the same day or, in the case of credit or debit card transactions, within several days of the related sale, and we typically have up to 30 days to pay our merchandise vendors, depending on the applicable vendor terms.
Our ability to fund such cash flow needs depends largely on our future operating performance. We assess future operating performance by looking at a number of metrics, primarily our net revenues, comparable store and non-comparable store sales, direct sales through our catalog and e-commerce channels, gross profit margin, and selling, general and administrative expenses. Our liquidity position is directly affected by these performance metrics.
On October 14, 2010, we completed our initial public offering of our common stock which included 3,333,333 new shares sold by us and 1,666,667 shares sold by our existing stockholders, raising net proceeds of $38.2 million for us, after deducting the underwriting discount and offering expenses payable by us. On October 20, 2010, we used net proceeds of $32.2 million from our initial public offering to repay all amounts owed under our senior credit facility, including $31.5 million for outstanding principal, and $3.5 million to redeem all outstanding shares of our non-convertible, non-voting Series C preferred stock. There were no amounts outstanding under our revolving credit facility of our senior credit facility at the time of repayment. Subsequently, the senior credit facility was terminated.
On February 16, 2011, we closed a secondary offering of 5,703,764 shares of our common stock priced at $16.50 per share. We sold 100,000 new shares of common stock in the offering, and the selling shareholders sold 5,603,764 shares in the offering, including 743,969 shares sold pursuant to the underwriter's over-allotment option. The offering raised net proceeds of $1.1 million for the Company, after deducting the underwriting discount and offering expenses payable by us.
Subsequent to our December 31, 2011 fiscal year-end, on January 20, 2012, we entered into a Line of Credit Agreement with Branch Banking and Trust Company that provides for a revolving line of credit facility in the amount of $5.0 million with an accordion feature that allows Branch Banking and Trust Company to increase the facility up to $20 million at its sole discretion. The facility has a maturity date of May 5, 2013 and bears interest at the one month LIBOR rate plus 1.35% per annum, as adjusted monthly on the first day of each month, with an all-in floor rate of 2.0%. The facility is secured by all the assets of the company. The Line of Credit Agreement includes a financial covenant requiring the Company to have a Tangible Net Worth (as defined in the Line of Credit Agreement) of $30.0 million quarterly, and other customary covenants.
34
Our cash and cash equivalents balance increased $25.8 million to $42.0 million as of December 31, 2011, from $16.2 million as of January 1, 2011. Components of this change in cash in fiscal year 2011, as well as the change in fiscal years 2010 and 2009, are shown in the following table:
| |
Fiscal Year Ended | |||||||||
|---|---|---|---|---|---|---|---|---|---|---|
| |
December 31, 2011 |
January 1, 2011 |
January 2, 2010 |
|||||||
| |
(in thousands) |
|||||||||
Provided by operating activities |
$ | 29,448 | $ | 19,409 | $ | 13,018 | ||||
Used in investing activities |
(9,806 | ) | (6,804 | ) | (4,794 | ) | ||||
Provided by (used in) financing activities |
6,149 | (3,629 | ) | (5,000 | ) | |||||
Net increase in cash / cash equivalents |
$ | 25,791 | $ | 8,976 | $ | 3,224 | ||||
Operating Activities
Operating activities consist of net income adjusted for non-cash items, including depreciation and amortization, deferred income taxes and the effect of other working capital requirements, as summarized in following table:
| |
Fiscal Year Ended | |||||||||
|---|---|---|---|---|---|---|---|---|---|---|
| |
December 31, 2011 |
January 1, 2011 |
January 2, 2010 |
|||||||
| |
(in thousands) |
|||||||||
Net income |
$ | 19,720 | $ | 9,811 | $ | 2,780 | ||||
Adjustments to reconcile net income to net cash provided by operating activities: |
||||||||||
Depreciation and amortization |
5,204 | 4,773 | 4,678 | |||||||
Non-cash impairment charges |
— | — | 196 | |||||||
Deferred income taxes |
(523 | ) | 2,076 | 1,561 | ||||||
Inventories |
(2,772 | ) | (5,471 | ) | 1,714 | |||||
Merchandise accounts payable |
1,618 | 5,802 | (174 | ) | ||||||
Other working capital components |
6,201 | 2,418 | 2,263 | |||||||
Net cash provided by operating activities |
$ | 29,448 | $ | 19,409 | $ | 13,018 | ||||
Net cash provided by operating activities increased $10.0 million to $29.4 million during fiscal year 2011 compared to $19.4 million for fiscal year 2010. This increase was attributable to a $9.9 million increase in net income, a $3.8 million favorable increase in other working capital requirements and a $431,000 increase in depreciation and amortization, offset by a $2.6 million unfavorable change in deferred income taxes and a $1.5 million unfavorable change in our requirements for inventory, net of merchandise accounts payable.
Net cash provided by operating activities increased $6.4 million to $19.4 million during fiscal year 2010 compared to $13.0 million for fiscal year 2009. This increase was attributable to a $7.0 million increase in net income, a $515,000 favorable change in deferred income taxes and a $54,000 increase in our other working capital requirements offset by a $1.2 million unfavorable change in our requirements for inventory, net of merchandise accounts payable. The unfavorable change in our cash requirements for inventory, net of merchandise accounts payable, was principally due to the increase in the number of stores and earlier shipments of spring merchandise for fiscal year 2011 offset by more favorable terms with our trade vendors.
35
Investing Activities
Investing activities consist primarily of capital expenditures for new and existing stores, as well as our investment in information technology:
| |
Fiscal Year Ended | |||||||||
|---|---|---|---|---|---|---|---|---|---|---|
| |
December 31, 2011 |
January 1, 2011 |
January 2, 2010 |
|||||||
| |
(in thousands) |
|||||||||
Capital expenditures (net of tenant allowances) |
$ | (5,741 | ) | $ | (3,844 | ) | $ | (3,044 | ) | |
Tenant allowances |
(4,065 | ) | (2,960 | ) | (1,765 | ) | ||||
Proceeds from sale of assets |
— | — | 15 | |||||||
Net cash used in investing activities |
$ | (9,806 | ) | $ | (6,804 | ) | $ | (4,794 | ) | |
For fiscal year 2011, capital expenditures, net of tenant allowances, increased $1.9 million compared to fiscal year 2010. This increase was primarily attributable to capital expenditures for new store construction.
For fiscal year 2010, capital expenditures, net of tenant allowances, increased $800,000 compared to fiscal year 2009. This increase was attributable to capital expenditures for our new point-of-sale software system, an upgrade to our software systems that support our direct business, new store construction and maintenance of existing stores.
Financing Activities
Prior to our initial public offering in October 2010, our financing activities historically consisted of borrowings and payments on our outstanding senior credit facility. In fiscal year 2011, our financing activities include the receipt of net proceeds from our secondary offering and the proceeds from the issuance of stock options:
| |
Fiscal Year Ended | |||||||||
|---|---|---|---|---|---|---|---|---|---|---|
| |
December 31, 2011 |
January 1, 2011 |
January 2, 2010 |
|||||||
| |
(in thousands) |
|||||||||
Principal payments on long-term debt |
$ | — | $ | (38,250 | ) | $ | (5,000 | ) | ||
Proceeds from public offering, net of issuance costs |
1,143 | 38,152 | — | |||||||
Proceeds from the issuance of stock options |
1,553 | |||||||||
Redemption of Series C preferred stock |
— | (3,531 | ) | — | ||||||
Excess tax benefits from stock-based compensation |
3,453 | |||||||||
Net cash provided by (used in) financing activities |
$ | 6,149 | $ | (3,629 | ) | $ | (5,000 | ) | ||
On February 16, 2011, the Company completed a secondary offering of 5,703,764 shares of common stock priced at $16.50 per share. The Company sold 100,000 new shares of its common stock in the offering, and selling shareholders sold 5,603,764 shares of common stock in the offering which included all of the 743,969 shares sold pursuant to the underwriters' over-allotment option. The offering raised net proceeds of $1.1 million for the Company, after deducting the underwriting discount and offering expenses paid by the Company. The Company did not receive any proceeds from the sale of the over-allotment shares by the selling stockholders.
36
On October 14, 2010, we completed our initial public offering of our common stock which included 3,333,333 new shares sold by us and 1,666,667 shares sold by our existing stockholders, raising net proceeds of $38.2 million for us, after deducting the underwriting discount and offering expenses payable by us. On October 20, 2010, we used net proceeds of $31.5 million from our initial public offering to repay the outstanding principal amount owed under our prior senior credit facility and $3.5 million to redeem all outstanding shares of our non-convertible, non-voting Series C preferred stock. In addition, we paid $3.8 million in scheduled quarterly principal repayments plus an additional $3.0 million on our prior senior credit facility in fiscal year 2010, based on our operating results for fiscal year 2009. The $5.0 million use of net cash in fiscal year 2009 resulted from the scheduled quarterly principal repayments due under our prior senior credit facility.
Line of Credit
Subsequent to our December 31, 2011 fiscal year-end, on January 20, 2012, we entered into a Line of Credit Agreement with Branch Banking and Trust Company that provides for a revolving line of credit facility in the amount of $5.0 million with an accordion feature that allows Branch Banking and Trust Company to increase the facility up to $20 million at its sole discretion. The facility has maturity date of May 5, 2013 and bears interest at the one month LIBOR rate plus 1.35% per annum, as adjusted monthly on the first day of each month, with an all-in floor rate of 2.0%. The facility is secured by all the assets of the company. The Line of Credit Agreement includes a financial covenant requiring the Company to have a Tangible Net Worth (as defined in the Line of Credit Agreement) of $30.0 million quarterly, and other customary covenants.
Outlook
Our short-term and long-term liquidity needs arise primarily from capital expenditures associated with our growth strategy and working capital requirements. We believe that our cash position, net cash provided by operating activities, availability under the Line of Credit Agreement as well as net proceeds from our secondary common stock offering in February 2011 will be adequate to finance our working capital needs and planned capital expenditures for at least the next 12 months. Planned capital expenditures for fiscal year 2012 include expenditures for at least 35 new stores, relocation of and maintenance of existing stores, maintenance of corporate facilities, and investments in information technology systems, which includes investing in and upgrading several of our systems to provide improved support of our current operations and position us for future growth.
Off Balance Sheet Arrangements
We are not a party to any off balance sheet arrangements.
37
Contractual Obligations
We enter into long-term contractual obligations and commitments in the normal course of business, primarily operating leases. The following table summarizes our contractual obligations as of December 31, 2011 over the periods specified.
| |
Payments Due by Period | |||||||||||||||
|---|---|---|---|---|---|---|---|---|---|---|---|---|---|---|---|---|
| |
Total | Less Than 1 Year |
1 - 3 Years | 3 - 5 Years | More Than 5 Years |
|||||||||||
| |
(in thousands) |
|||||||||||||||
Operating lease obligations(1) |
$ | 91,424 | $ | 19,115 | $ | 16,976 | $ | 15,463 | $ | 39,870 | ||||||
Purchase obligations(2) |
16,498 | 16,498 | — | — | — | |||||||||||
Total |
$ | 107,922 | $ | 35,613 | $ | 16,976 | $ | 15,463 | $ | 39,870 | ||||||
- (1)
- Represents
future minimum rental commitments under non-cancelable operating leases and does not include incremental rents which are computed as
a percentage of net sales.
- (2)
- Represents outstanding obligations to purchase merchandise inventory.
Impact of Inflation
Our results of operations and financial condition are presented based on historical cost. While it is difficult to accurately measure the impact of inflation due to the imprecise nature of the estimates required, we believe the effects of inflation, if any, on our results of operations and financial condition have been immaterial.
Recent Accounting Pronouncements
In June 2011, the FASB issued ASU No. 2011-05, Presentation of Comprehensive Income, which amends ASC 220, Comprehensive Income. The amended guidance requires most entities present changes in net income and other comprehensive income in either a single statement of comprehensive income or two separate, but consecutive, statements. The objective of these amendments is to improve the comparability, consistency, and transparency of financial reporting and to increase the prominence of items reported in other comprehensive income. This guidance is effective for fiscal years beginning after December 15, 2011. The adoption of this guidance will not have a material impact on the Company's financial statements or disclosures.
In September 2011, the FASB issued ASU No. 2011-08, Intangibles—Goodwill and Other. This guidance is intended to simplify how entities test goodwill for impairment. This update permits an entity to first assess qualitative factors to determine whether it is necessary to perform the two-step quantitative goodwill impairment test. This ASU becomes effective for fiscal years beginning after December 15, 2011. The adoption of this guidance will not have a material impact on the Company's financial statements or disclosures. The Company has opted for early adoption of this ASU as noted in Footnote 1. Nature of Business and Summary of Significant Accounting Policies in the Notes to the Consolidated Financial Statements.
Critical Accounting Policies
This Management's Discussion and Analysis of Financial Condition and Results of Operations has been derived from our consolidated financial statements that were prepared in accordance with accounting principles generally accepted in the United States of America (GAAP). GAAP requires management to make estimates and assumptions that affect the reported amounts of our assets and liabilities and disclosure of contingent assets and liabilities at the date of the financial statements and
38
the reported amounts of revenues and expenses during the reporting period. On an ongoing basis, our management evaluates its estimates and judgments, including those related to inventory valuation, property and equipment, recoverability of long-lived assets, including intangible assets, income taxes and stock-based compensation.
Our management bases its estimates and judgments on its historical experience and other relevant factors and assumptions it believes to be reasonable to form the basis for making judgments about the carrying values of assets and liabilities that are not readily apparent from other sources and evaluates these estimates on an ongoing basis. While we believe that the historical experience and other factors considered provide a meaningful basis for the accounting policies applied in the preparation of the consolidated financial statements, we cannot guarantee that our estimates and assumptions will be accurate. Actual results could differ from these estimates under different assumptions or conditions which would require us to make adjustments to these estimates in future periods.
Our management has reviewed critical accounting policies and estimates with our audit committee. The following reflect the most critical accounting policies and significant estimates and judgments used in the preparation of our consolidated financial statements. For a complete discussion of our significant accounting policies, refer to Note 1 of our consolidated financial statements "Nature of Business and Summary of Significant Accounting Policies" appearing elsewhere in this Annual Report on Form 10-K.
Revenue Recognition
We recognize revenue at the point-of-sale or upon shipment to customers. Shipping and handling fees billed to customers for direct sales are included in net revenues. Based on historical sales returns, an allowance for sales returns is recorded as a reduction of net revenues in the periods in which the sales are recognized. Sales tax collected from customers is excluded from net revenues and is included as part of accrued expenses and other current liabilities on our consolidated balance sheets appearing elsewhere in this Annual Report on Form 10-K .
Beginning in March 2011, we began selling gift cards in our stores, which do not expire or lose value over periods of inactivity. We account for gift cards by recognizing a liability at the time a gift card is sold. Through June 2010, we sold gift certificates in our stores, which also do not expire or lose value over periods of inactivity. We recognize revenue from gift cards and gift certificates when they are redeemed by the customer.
Inventory Valuation
Inventories are comprised primarily of women's apparel and accessories and are stated at the lower of cost or market, on a first-in, first-out basis, using the retail inventory method. We record merchandise receipts at the time they are delivered to our merchandise consolidator as this is the point at which title and risk of loss transfer to us. We do not directly import any merchandise at this time.
We review our inventory levels to identify slow-moving merchandise and generally use markdowns to clear this merchandise. We record a markdown reserve based on estimated future markdowns related to current inventory to clear slow-moving inventory. Markdowns may occur when inventory exceeds customer demand for reasons of style, seasonal adaptation, changes in customer preference, lack of consumer acceptance of fashion items, competition or if it is determined that the inventory in stock will not sell at its currently ticketed price. These markdowns may have an adverse impact on earnings, depending on the extent and amount of inventory affected. The markdown reserve is recorded as an increase to cost of goods sold in the consolidated statements of operations appearing elsewhere in this Annual Report on Form 10-K.
We perform physical inventory counts on most stores semi-annually. Included in the carrying value of merchandise inventories is a reserve for shrinkage. Shrinkage is estimated based on historical
39
physical inventory results as a percentage of sales. The estimate for shrinkage reserve can be affected by changes in merchandise mix and changes in actual shrinkage trends.
Property and Equipment, Net
Property and equipment are stated at cost less accumulated depreciation. Depreciation of property and equipment is computed for financial reporting purposes on the straight-line method using service lives ranging principally from three to fifteen years. Furniture and fixtures are typically depreciated over three to five years. Amortization of leasehold improvements is provided on the straight-line method over the length of the lease or over the estimated useful life of the improvement, whichever is shorter. The cost of assets sold or retired and the related accumulated depreciation or amortization is removed from the accounts with any resulting gain or loss included in net income. Major renewals and betterments which extend service lives are capitalized, while expenditures for repairs and maintenance that do not significantly extend the life of the asset are expensed as incurred.
Impairment of Long-Lived Assets
We are exposed to potential impairment if the book value of our assets exceeds their expected future cash flows. The major components of our long-lived assets are store fixtures, equipment and leasehold improvements. We follow FASB ASC 360, Property, Plant and Equipment, which requires impairment losses to be recorded on long-lived assets used in operations whenever events or changes in circumstances indicate that the net carrying amounts may not be recoverable. Our evaluation is performed based on estimated undiscounted future cash flows from operating activities compared with the carrying value of related assets for the individual stores. If the undiscounted future cash flows are less than the carrying value, an impairment loss is recognized as the difference between the carrying value and the estimated fair value of the assets based on the discounted future cash flows of the assets using a rate that approximates our weighted average cost of capital.
Goodwill
Goodwill of $55.5 million was recognized on the acquisition of Body Shop of America, Inc. and Catalogue Ventures, Inc. on October 1, 2006. We follow FASB ASC 350, Intangibles—Goodwill and Other, which requires that goodwill and indefinite life intangibles are subject to an assessment of impairment at least annually. Under this guidance, we are required to compare the fair value of each reporting unit with its carrying amount to determine if there is a potential impairment of goodwill. If the fair value of the reporting unit is less than its carrying value, an impairment loss is recorded to the extent that the fair value of the goodwill within the reporting unit is less than its carrying value. In fiscal year 2007, we recorded a $34.0 million impairment of goodwill related to our store operations as a result of the slowing economy, repositioning of our merchandise strategy, competition with retailers and operating performance of our stores.
In the fourth quarter of 2011 we early adopted the new guidance under Accounting Standards Update 2011-08, Intangibles—Goodwill and Other, which simplifies how entities test goodwill for impairment. This new guidance provides an option to first assess qualitative factors to determine whether it is more likely than not that a reporting unit's fair value is less than its carrying amount. The Company performed this qualitative analysis as of December 31, 2011. The analysis considered factors such as the year over year change in our competitive retail sector, comparable store sales, catalog sales, the Company's stock price, the Company's debt levels and the Company's cash balances. The qualitative analysis further evaluated changes in the Company's infrastructure including the replacement or addition to several key functions and individuals. The Company concluded that it is more likely than not that a reporting unit's fair value was greater than its carrying amount and therefore did not proceed to step one of the goodwill impairment test.
40
Income Taxes
Income taxes are accounted for pursuant to FASB ASC 740, Income Taxes, which requires that we recognize deferred income taxes, which include net operating loss carry forwards and tax credits among other items. Deferred income taxes are determined based on the difference between the financial reporting and tax bases of assets and liabilities using enacted tax rates in effect for the year in which the differences are expected to reverse. Deferred tax assets are offset by deferred tax liabilities relating to nondeductible temporary differences. Recognition of deferred tax assets is based on management's belief that it is more likely than not that the tax benefit associated with temporary differences will be utilized. The FASB issued guidance requires that deferred tax assets be reduced by a valuation allowance if it is more likely than not that some portion or all of the net deferred tax assets will not be realized. We have determined that valuation allowances against the deferred tax assets are not currently necessary.
We follow FASB ASC 740, Income Taxes, guidance on accounting for uncertainty in income taxes. The standard prescribes a recognition threshold and measurement attribute for financial statement recognition and measurement of tax positions taken or expected to be taken in tax returns. In addition, the standard provides guidance on the de-recognition, classification and disclosure of tax positions, as well as the accounting for related interest and penalties. In May 2007, the FASB amended the guidance associated with the criteria that must be evaluated in determining if a tax position has been effectively settled and should be recognized as a tax benefit. We did not have any uncertain tax provisions recorded in our consolidated financial statements appearing elsewhere in this Annual Report on Form 10-K.
Stock-Based Compensation
We account for stock-based compensation in accordance with FASB ASC 718, Compensation-Stock Compensation, which establishes accounting for equity instruments exchanged for employee services. Under the provisions of this statement, stock-based compensation cost is measured at the grant date fair value and is recognized as an expense by the graded-vested method over the employee's requisite service period (generally the vesting period of the equity grant). As required under this guidance, we estimate forfeitures for options granted which are not expected to vest. Changes in these inputs and assumptions can materially affect the measurement of the estimated fair value of our stock-based compensation expense. We estimate the grant date fair value of stock option awards using the Black-Scholes option pricing model. For fiscal years 2011, 2010 and 2009, the fair value of stock options was estimated at the grant date using the following weighted-average assumptions:
| |
Fiscal Year Ended | |||||||||
|---|---|---|---|---|---|---|---|---|---|---|
| |
December 31, 2011 |
January 1, 2011 |
January 2, 2010 |
|||||||
Expected option term |
6.25 years | 6.19 years | 6.25 years | |||||||
Expected volatility factor |
65.8 | % | 73.7 | % | 71.0 | % | ||||
Risk-free interest rate |
1.4 | % | 1.5 | % | 3.1 | % | ||||
Expected annual dividend yield |
0 | % | 0 | % | 0 | % | ||||
The risk-free interest rate was determined based on the rate of U.S. Treasury instruments whose maturities are similar to those of the expected term of the award being valued. The expected dividend yield was based on our expectations of not paying dividends on our common stock for the foreseeable future. The expected volatility incorporates historical volatility of similar entities whose shares prices are publicly available. The expected term is based on the simplified method of estimating the option life.
On March 22, 2011, the Company's Board of Directors approved, subject to stockholder approval, an amendment and restatement of the Company's Amended and Restated 2006 Equity Plan (the
41
"Plan"). On May 25, 2011, the Company's stockholders approved the amendment and restatement to the Plan. The amended and restated Plan permits up to 250,000 of the remaining shares of common stock reserved for future issuance as of March 21, 2011 under the Plan to be issued in the form of restricted stock awards and allows certain awards under the Plan to qualify as performance-based compensation under Section 162(m) of the Internal Revenue Code of 1986, if the compensation committee of the Company's board of directors chooses to qualify the awards in other respects.
For long-term incentives, the Company's Board of Directors established an annual equity grant protocol that resulted in an initial grant effective as of September 16, 2011. The Committee's initial long-term incentive awards granted to certain executives were roughly two-thirds stock options and one-third time-vested restricted stock. The stock options and restricted stock vest over a four-year period.
Stock-based compensation expense related to stock options was $1.1 million, $563,000 and $168,000 for fiscal years 2011, 2010 and 2009, respectively, and is included in selling, general and administrative expenses and cost of goods sold on the Company's Consolidated Statements of Operations. The Company did not capitalize any expense related to stock-based compensation. We granted options to purchase an aggregate of 193,266, 130,000 and 586,842 shares of common stock in fiscal years 2011, 2010 and 2009, respectively. We granted 30,704 shares of restricted stock in 2011 and none in 2010 or 2009. We have granted 5,000 options to purchase shares of our common stock in fiscal year 2012 through March 6, 2012. Any future equity grants will increase our stock-based compensation expense in fiscal year 2012 and in future fiscal years compared to fiscal year 2011.
ITEM 7A. QUANTITATIVE AND QUALITATIVE DISCLOSURES ABOUT MARKET RISK
Interest Rate Risk
The Company is exposed to market risk from fluctuations in interest rates with respect to its Line of Credit Agreement. For variable rate debt, including any future borrowings under the Company's Line of Credit Agreement, interest rate changes generally do not affect the fair market value of such debt, but do impact future earnings and cash flows, assuming other factors are held constant.
Effects of Inflation
Components of the Company's operations subject to inflation include lease and labor costs. The Company's leases require it to pay taxes, maintenance, repairs, insurance and utilities, all of which are subject to inflationary increases. The Company believes inflation has not had a material impact on its results of operations in recent years.
42
ITEM 8. FINANCIAL STATEMENTS AND SUPPLEMENTARY DATA
Body Central Corp.
Index to Consolidated Financial Statements
43
Report of Independent Registered Certified Public Accounting Firm
To
the Board of Directors and
Stockholders of Body Central Corp.
In our opinion, the consolidated financial statements listed in the accompanying index present fairly, in all material respects, the financial position of Body Central Corp. and its subsidiaries at December 31, 2011 and January 1, 2011, and the results of their operations and their cash flows for each of the three years in the period ended December 31, 2011 in conformity with accounting principles generally accepted in the United States of America. Also in our opinion, the Company maintained, in all material respects, effective internal control over financial reporting as of December 31, 2011, based on criteria established in Internal Control—Integrated Framework issued by the Committee of Sponsoring Organizations of the Treadway Commission (COSO). The Company's management is responsible for these financial statements, for maintaining effective internal control over financial reporting and for its assessment of the effectiveness of internal control over financial reporting, included in Management's Report on Internal Control over Financial Reporting appearing under Item 9A. Our responsibility is to express opinions on these financial statements and on the Company's internal control over financial reporting based on our audits (which was an integrated audit in 2011). We conducted our audits in accordance with the standards of the Public Company Accounting Oversight Board (United States). Those standards require that we plan and perform the audits to obtain reasonable assurance about whether the financial statements are free of material misstatement and whether effective internal control over financial reporting was maintained in all material respects. Our audits of the financial statements included examining, on a test basis, evidence supporting the amounts and disclosures in the financial statements, assessing the accounting principles used and significant estimates made by management, and evaluating the overall financial statement presentation. Our audit of internal control over financial reporting included obtaining an understanding of internal control over financial reporting, assessing the risk that a material weakness exists, and testing and evaluating the design and operating effectiveness of internal control based on the assessed risk. Our audits also included performing such other procedures as we considered necessary in the circumstances. We believe that our audits provide a reasonable basis for our opinions.
A company's internal control over financial reporting is a process designed to provide reasonable assurance regarding the reliability of financial reporting and the preparation of financial statements for external purposes in accordance with generally accepted accounting principles. A company's internal control over financial reporting includes those policies and procedures that (i) pertain to the maintenance of records that, in reasonable detail, accurately and fairly reflect the transactions and dispositions of the assets of the company; (ii) provide reasonable assurance that transactions are recorded as necessary to permit preparation of financial statements in accordance with generally accepted accounting principles, and that receipts and expenditures of the company are being made only in accordance with authorizations of management and directors of the company; and (iii) provide reasonable assurance regarding prevention or timely detection of unauthorized acquisition, use, or disposition of the company's assets that could have a material effect on the financial statements.
Because of its inherent limitations, internal control over financial reporting may not prevent or detect misstatements. Also, projections of any evaluation of effectiveness to future periods are subject to the risk that controls may become inadequate because of changes in conditions, or that the degree of compliance with the policies or procedures may deteriorate.
/s/
PricewaterhouseCoopers LLP
Jacksonville, Florida
March 15, 2012
44
BODY CENTRAL CORP.
CONSOLIDATED BALANCE SHEETS
| |
December 31, 2011 |
January 1, 2011 |
|||||
|---|---|---|---|---|---|---|---|
| |
(in thousands, except share data) |
||||||
Assets |
|||||||
Current assets |
|||||||
Cash and cash equivalents |
$ | 41,993 | $ | 16,202 | |||
Accounts receivable |
2,607 | 1,258 | |||||
Inventories |
21,141 | 18,369 | |||||
Prepaid expenses and other current assets |
4,293 | 3,933 | |||||
Deferred tax asset, current |
1,953 | 1,425 | |||||
Total current assets |
71,987 | 41,187 | |||||
Property and equipment, net of accumulated depreciation of $19,892 and $15,627 |
22,159 | 17,071 | |||||
Goodwill |
21,508 | 21,508 | |||||
Intangible assets, net of accumulated amortization of $3,633 and $3,077 |
16,542 | 17,128 | |||||
Other assets |
106 | 102 | |||||
Total assets |
$ | 132,302 | $ | 96,996 | |||
Liabilities and Stockholders' Equity |
|||||||
Current liabilities |
|||||||
Accounts payable |
$ | 16,498 | $ | 14,880 | |||
Accrued expenses and other current liabilities |
18,608 | 14,605 | |||||
Total current liabilities |
35,106 | 29,485 | |||||
Other liabilities |
7,899 | 5,149 | |||||
Deferred tax liability, long-term |
4,225 | 4,220 | |||||
Total liabilities |
47,230 | 38,854 | |||||
Commitments and contingencies |
|||||||
Stockholders' equity |
|||||||
Common stock, $0.001 par value, 45,000,000 shares authorized, 16,095,377 shares issued and outstanding as of December 31, 2011 and 15,405,677 shares issued and outstanding as of January 1, 2011 |
16 | 15 | |||||
Additional paid-in capital |
92,705 | 85,496 | |||||
Accumulated deficit |
(7,649 | ) | (27,369 | ) | |||
Total stockholders' equity |
85,072 | 58,142 | |||||
Total liabilities and stockholders' equity |
$ | 132,302 | $ | 96,996 | |||
The accompanying notes are an integral part of these consolidated financial statements.
45
BODY CENTRAL CORP.
CONSOLIDATED STATEMENTS OF OPERATIONS
| |
Fiscal Year Ended | |||||||||
|---|---|---|---|---|---|---|---|---|---|---|
| |
December 31, 2011 |
January 1, 2011 |
January 2, 2010 |
|||||||
| |
(in thousands, except share and per share data) |
|||||||||
Net revenues |
$ | 296,500 | $ | 243,364 | $ | 198,834 | ||||
Cost of goods sold, including occupancy, buying, distribution center and catalog costs |
193,101 | 161,802 | 139,352 | |||||||
Gross profit |
103,399 | 81,562 | 59,482 | |||||||
Selling, general and administrative expenses |
66,803 | 56,920 | 46,360 | |||||||
Depreciation and amortization |
5,204 | 4,773 | 4,678 | |||||||
Impairment of long-lived assets |
— | — | 196 | |||||||
Income from operations |
31,392 | 19,869 | 8,248 | |||||||
Interest expense (income), net of interest income of $16, $31 and $21 |
(16 | ) | 3,292 | 3,956 | ||||||
Other expense (income), net |
(237 | ) | 308 | (128 | ) | |||||
Income before income taxes |
31,645 | 16,269 | 4,420 | |||||||
Provision for income taxes |
11,925 | 6,458 | 1,640 | |||||||
Net income |
$ | 19,720 | $ | 9,811 | $ | 2,780 | ||||
Net income per common share: |
||||||||||
Basic |
$ | 1.25 | $ | 2.77 | $ | 12.94 | ||||
Diluted |
$ | 1.22 | $ | 0.73 | $ | 0.23 | ||||
Weighted-average common shares outstanding: |
||||||||||
Basic |
15,780,908 | 3,502,657 | 203,235 | |||||||
Diluted |
16,218,382 | 13,383,642 | 12,173,972 | |||||||
The accompanying notes are an integral part of these consolidated financial statements.
46
BODY CENTRAL CORP.
CONSOLIDATED STATEMENTS OF STOCKHOLDERS' EQUITY (DEFICIT)
| |
Common Stock Shares |
Common Stock |
Additional Paid-In Capital |
Accumulated Deficit |
Total Stockholders' Equity (Deficit) |
|||||||||||
|---|---|---|---|---|---|---|---|---|---|---|---|---|---|---|---|---|
| |
(in thousands, except share data) |
|||||||||||||||
Balance as of January 3, 2009 |
203,235 | — | 271 | (39,960 | ) | (39,689 | ) | |||||||||
Stock-based compensation |
— | — | 168 | — | 168 | |||||||||||
Dividends payable on Series C preferred stock |
— | — | (150 | ) | — | (150 | ) | |||||||||
Net income |
— | — | — | 2,780 | 2,780 | |||||||||||
Balance as of January 2, 2010 |
203,235 | — | 289 | (37,180 | ) | (36,891 | ) | |||||||||
Stock-based compensation |
— | — | 563 | — | 563 | |||||||||||
Dividends payable on Series C preferred stock |
— | — | (113 | ) | — | (113 | ) | |||||||||
Convert Series A preferred stock to common stock |
7,795,401 | 8 | 31,072 | — | 31,080 | |||||||||||
Convert Series B preferred stock to common stock |
4,073,708 | 4 | 15,536 | — | 15,540 | |||||||||||
Issuance of common stock in initial public offering (net of issuance costs) |
3,333,333 | 3 | 38,149 | — | 38,152 | |||||||||||
Net income |
— | — | — | 9,811 | 9,811 | |||||||||||
Balance as of January 1, 2011 |
15,405,677 | 15 | 85,496 | (27,369 | ) | 58,142 | ||||||||||
Stock-based compensation |
1,060 | — | 1,060 | |||||||||||||
Stock options exercised |
439,420 | 1 | 1,553 | 1,554 | ||||||||||||
Issuance of common stock in secondary offering (net of issuance costs) |
250,280 | 1,143 | — | 1,143 | ||||||||||||
Tax benefits from stock-based compensation |
3,453 | 3,453 | ||||||||||||||
Net income |
— | — | 19,720 | 19,720 | ||||||||||||
Balance as of December 31, 2011 |
16,095,377 | $ | 16 | $ | 92,705 | $ | (7,649 | ) | $ | 85,072 | ||||||
The accompanying notes are an integral part of these consolidated financial statements.
47
BODY CENTRAL CORP.
CONSOLIDATED STATEMENTS OF CASH FLOWS
| |
December 31, 2011 |
January 1, 2011 |
January 2, 2010 |
|||||||
|---|---|---|---|---|---|---|---|---|---|---|
| |
(in thousands) |
|||||||||
Cash flows from operating activities |
||||||||||
Net income |
$ | 19,720 | $ | 9,811 | $ | 2,780 | ||||
Adjustments to reconcile net income to net cash provided by operating activities |
||||||||||
Depreciation and amortization |
5,204 | 4,773 | 4,678 | |||||||
Deferred income taxes |
(523 | ) | 2,076 | 1,561 | ||||||
Tax benefits from stock-based compensation |
(3,453 | ) | — | — | ||||||
Stock-based compensation |
1,060 | 563 | 168 | |||||||
Impairment of long-lived assets |
— | — | 196 | |||||||
Loss on disposal of property and equipment |
29 | 534 | 100 | |||||||
Changes in assets and liabilities: |
||||||||||
Accounts receivable |
(1,349 | ) | (350 | ) | (82 | ) | ||||
Inventories |
(2,772 | ) | (5,471 | ) | 1,714 | |||||
Prepaid expenses and other current assets |
(360 | ) | (1,285 | ) | (256 | ) | ||||
Other assets |
(4 | ) | 19 | (15 | ) | |||||
Accounts payable |
1,618 | 5,802 | (174 | ) | ||||||
Accrued expenses and other current liabilities |
4,238 | 1,963 | 871 | |||||||
Income taxes |
3,218 | 156 | 421 | |||||||
Other liabilities |
2,822 | 818 | 1,056 | |||||||
Net cash provided by operating activities |
29,448 | 19,409 | 13,018 | |||||||
Cash flows from investing activities |
||||||||||
Purchases of property and equipment |
(9,806 | ) | (6,804 | ) | (4,809 | ) | ||||
Proceeds from sales of assets |
— | — | 15 | |||||||
Net cash used in investing activities |
(9,806 | ) | (6,804 | ) | (4,794 | ) | ||||
Cash flows from financing activities |
||||||||||
Principal payments on long-term debt |
— | (38,250 | ) | (5,000 | ) | |||||
Proceeds from common stock offering, net of issuance costs |
1,143 | 38,152 | — | |||||||
Proceeds from the issuance of stock options |
1,553 | — | — | |||||||
Redemption of Series C preferred stock |
— | (3,531 | ) | — | ||||||
Tax benefits from stock-based compensation |
3,453 | — | — | |||||||
Net cash provided by (used in) financing activities |
6,149 | (3,629 | ) | (5,000 | ) | |||||
Net increase in cash and cash equivalents |
25,791 | 8,976 | 3,224 | |||||||
Cash and cash equivalents |
||||||||||
Beginning of year |
16,202 | 7,226 | 4,002 | |||||||
End of year |
$ | 41,993 | $ | 16,202 | $ | 7,226 | ||||
Supplemental disclosures |
||||||||||
Cash paid for interest |
$ | — | $ | 3,261 | $ | 3,887 | ||||
Cash paid for income taxes |
9,625 | 4,223 | 51 | |||||||
Noncash financing activities |
||||||||||
Dividends payable |
$ | — | $ | — | $ | 150 | ||||
Convert of Series A preferred stock to common stock |
— | 31,080 | — | |||||||
Convert of Series B preferred stock to common stock |
— | 15,540 | — | |||||||
The accompanying notes are an integral part of these consolidated financial statements.
48
BODY CENTRAL CORP.
NOTES TO THE CONSOLIDATED FINANCIAL STATEMENTS
1. Nature of Business and Summary of Significant Accounting Policies
Nature of Business and Organization
Body Central Corp. (the "Company"), formerly known as Body Central Acquisition Corp., is a specialty retailer of young women's apparel and accessories operating retail stores in the South, Mid-Atlantic and Midwest regions of the United States. The Company operates specialty apparel stores under the Body Central and Body Shop banners as well as a direct business comprised of our Body Central catalog and our e-commerce website at www.bodyc.com.
On October 13, 2010, a 25.40446-for-1 stock split of the Company's outstanding common stock was implemented in conjunction with the Company's initial public offering. All common stock shares, per share data, and option exercise prices in the accompanying consolidated financial statements and notes to the consolidated financial statements have been retroactively adjusted for all periods presented to give effect to the stock split.
On October 14, 2010, the Company completed the initial public offering of its common stock which included 3,333,333 new shares sold by the Company and 1,666,667 shares sold by the Company's existing stockholders, raising net proceeds of $38.2 million for the Company, after deducting the underwriting discount and offering expenses paid by the Company.
In conjunction with the initial public offering, the Company amended its authorized capital stock to 150,000,000 shares of common stock, par value $0.001 per share, and 5,000,000 shares of undesignated preferred stock, par value $0.001 per share.
On February 16, 2011, the Company completed a secondary offering of 5,703,764 shares of common stock priced at $16.50 per share. The Company sold 100,000 new shares of its common stock in the offering, and selling shareholders sold 5,603,764 shares of common stock in the offering which included all of the 743,969 shares sold pursuant to the underwriters' over-allotment option. The offering raised net proceeds of $1.1 million for the Company, after deducting the underwriting discount and offering expenses paid by the Company. The Company did not receive any proceeds from the sale of the over-allotment shares by the selling stockholders.
On May 25, 2011, the Company amended and restated the Company's Third Amended and Restated Certificate of Incorporation to reduce its total number of authorized shares of common stock to 45,000,000 shares, par value $0.001 per share.
Principles of Consolidation
The accompanying Consolidated Financial Statements, prepared in accordance principles generally accepted in the United States of America ("GAAP"), include the assets, liabilities, stockholders' equity (deficit), revenues and expenses of the Company and its wholly-owned subsidiaries, Body Shop of America, Inc., a Florida corporation, and Catalogue Ventures, Inc., also a Florida corporation. All intercompany accounts and transactions have been eliminated in consolidation.
Fiscal Year
The Company's fiscal year ends on the Saturday closest to December 31. Fiscal years 2011, 2010 and 2009 ended on December 31, 2011, January 1, 2011 and January 2, 2010, respectively. Fiscal years 2011, 2010 and 2009 included 52 weeks. References to years in the Consolidated Financial Statements relate to fiscal years rather than calendar years.
49
BODY CENTRAL CORP.
NOTES TO THE CONSOLIDATED FINANCIAL STATEMENTS (Continued)
1. Nature of Business and Summary of Significant Accounting Policies (Continued)
Use of Estimates
The preparation of financial statements in conformity with GAAP requires management to make estimates and assumptions that affect the reported amounts of assets and liabilities and disclosure of contingent assets and liabilities at the date of the financial statements and the reported amounts of revenues and expenses during the reporting period. Actual results could differ from those estimates. On an ongoing basis, management evaluates its estimates and judgments, including those related to inventory valuation, property and equipment, recoverability of long-lived assets, including intangible assets, income taxes and stock-based compensation.
Segment Reporting
GAAP has established guidance for reporting information about a company's operating segments, including disclosures related to a company's products and services, geographic areas and major customers. The Company has aggregated its net revenues generated from its retail stores and its direct business into one reportable segment. The Company aggregates its operating segments because they have a similar class of customer, nature of products, nature of production process and distribution methods as well as similar economic characteristics. The Company has no international sales. All of the Company's identifiable assets are in the United States.
Revenue Recognition
The Company recognizes revenue, and the related cost of goods sold is expensed, at point-of-sale or upon shipment to customers. Shipping and handling fees billed to customers for online and catalog sales are included in net revenues, and the related shipping and handling costs are included in cost of goods sold. Based on historical sales returns, an allowance for sales returns is recorded as a reduction of net revenues in the periods in which the sales are recognized. Sales tax collected from customers is excluded from net revenues and is included as part of accrued expenses and other current liabilities on the Consolidated Balance Sheets.
Beginning in March 2011, we began selling gift cards in our stores, which do not expire or lose value over periods of inactivity. We account for gift cards by recognizing a liability at the time a gift card is sold. Through June 2010, the Company sold gift certificates in its retail stores, which do not expire or lose value over periods of inactivity. The Company accounted for gift certificates by recognizing a liability at the time a gift certificate was sold. The Company recognizes income from gift cards and gift certificates when they are redeemed by the customer.
Revenue from unredeemed gift certificates is recognized when it is determined that the likelihood of the gift certificate being redeemed is remote and that there is no legal obligation to remit unredeemed gift certificates to relevant jurisdictions. No revenue from gift certificate breakage was recognized in fiscal years 2011, 2010, and 2009.
Cash and Cash Equivalents
The Company considers all short-term investments with an initial maturity of three months or less when purchased to be cash equivalents.
50
BODY CENTRAL CORP.
NOTES TO THE CONSOLIDATED FINANCIAL STATEMENTS (Continued)
1. Nature of Business and Summary of Significant Accounting Policies (Continued)
Inventories
Inventories are comprised principally of women's apparel and accessories and are stated at the lower of cost or market, on a first-in-first out basis, using the retail inventory method. The Company determines market value as the anticipated future selling price of the merchandise less a normal margin. An initial markup is applied to inventory at cost in order to establish a cost-to-retail ratio. Permanent markdowns, when taken, reduce both the retail and cost components of inventory on-hand so as to maintain the already established cost-to-retail relationship. Shipping and handling costs of $2.9 million, $3.6 million and $3.4 million for fiscal years 2011, 2010, and 2009, respectively, are included in cost of goods sold in the Consolidated Statements of Operations.
The Company reviews its inventory levels to identify slow-moving merchandise and generally uses markdowns to clear this merchandise. The Company records a markdown reserve based on estimated future markdowns related to current inventory to clear slow-moving inventory. These markdowns may have an adverse impact on earnings, depending on the extent and amount of inventory affected. The markdown reserve is recorded as an increase to cost of goods sold in the Consolidated Statements of Operations. The markdown reserve was $1.7 million and $1.6 million as of December 31, 2011 and January 1, 2011, respectively.
Included in the carrying value of merchandise inventories is a reserve for shrinkage. Shrinkage is estimated based on historical physical inventory results as a percentage of sales. The estimate for shrinkage reserve can be affected by changes in merchandise mix and changes in actual shrinkage trends. The shrink reserve was $714,000 and $401,000 as of December 31, 2011 and January 1, 2011, respectively.
Property and Equipment
Property and equipment are stated at cost less accumulated depreciation and amortization. Depreciation of property and equipment is computed for financial reporting purposes on the straight-line method using service lives ranging principally from three to fifteen years. Furniture and fixtures are typically depreciated over three to five years. Amortization of leasehold improvements is provided on the straight-line method over the length of the lease or over the estimated useful life of the improvement, whichever is shorter. The cost of assets sold or retired and the related accumulated depreciation or amortization is removed from the accounts with any resulting gain or loss included in net income. Major renewals and betterments which extend service lives are capitalized, while expenditures for repairs and maintenance that do not significantly extend the life of the asset are expensed as incurred.
Impairment of Long-Lived Assets
The Company follows Financial Accounting Standards Board ("FASB") Accounting Standards Codification ("ASC") 360, Property, Plant and Equipment, which requires impairment losses to be recorded on long-lived assets used in operations whenever events or changes in circumstances indicate that the net carrying amounts may not be recoverable. The evaluation is performed based on estimated undiscounted future cash flows from operating activities compared with the carrying value of related assets for the individual stores. If the undiscounted future cash flows are less than the carrying value, an impairment loss is recognized as the difference between the carrying value and the estimated fair
51
BODY CENTRAL CORP.
NOTES TO THE CONSOLIDATED FINANCIAL STATEMENTS (Continued)
1. Nature of Business and Summary of Significant Accounting Policies (Continued)
value of the assets based on the discounted future cash flows of the assets using a rate that approximates the Company's weighted average cost of capital.
Goodwill and Intangible Assets
The Company follows FASB ASC 350, Intangibles—Goodwill and Other, regarding goodwill and other intangible assets. Goodwill is subject to an assessment of impairment at least annually. The guidance under this statement requires the Company to compare the fair value of each reporting unit with its carrying amount to determine if there is a potential impairment of goodwill. If the fair value of the reporting unit is less than its carrying value, an impairment loss is recorded to the extent that the fair value of the goodwill within the reporting unit is less than its carrying value. The Company performed this annual impairment analysis as January 1, 2011 using the discounted cash flow and guideline public company methods to determine the fair value of the reporting units. During the fourth quarter of 2011 the Company adopted ASU No. 2011-08, Intangibles—Goodwill and Other. This update permits an entity to first assess qualitative factors to determine whether it is necessary to perform the two-step quantitative goodwill test. The Company performed the qualitative analysis for the year ended December 31, 2011. The Company's analysis indicated no impairment of goodwill had occurred or was at-risk as of December 31, 2011 and January 1, 2011.
Favorable and unfavorable retail leases and customer relationships are amortized using the straight-line method over their estimated period of benefit, ranging from four to seven years. Trade names and trademarks are deemed to be indefinite life intangibles and are thus not subject to amortization. Management of the Company evaluates the recoverability of intangible assets annually using the relief-from-royalty method, and takes into account events or circumstances that warrant revised estimates of useful lives or that indicate impairment exists. The Company's evaluation indicated no impairment of intangible assets in fiscal years 2011, 2010 or 2009.
Accounting for Stock Based Compensation
The Company has adopted the provisions of FASB ASC 718, Compensation—Stock Compensation, which establishes accounting for equity instruments exchanged for employee services. Under the provisions of this statement, stock-based compensation expense is measured at the grant date, based on the calculated fair value of the award, and is recognized as an expense by the graded-vested method over the employee's requisite service period (generally the vesting period of the equity grant). As required under this guidance, the Company estimates forfeitures for options granted which are not expected to vest based on future expectations. Changes in these inputs and assumptions can materially affect the measurement of the estimated fair value of the Company's stock-based compensation expense. Stock-based compensation expense is included in selling, general and administrative expenses and cost of goods sold in the accompanying Consolidated Statements of Operations.
Operating Leases
The Company leases retail stores and office space under noncancelable operating leases. Most store leases contain construction allowance reimbursements by landlords, rent escalation clauses and/or contingent rent provisions. Except for contingent rent, the Company recognizes rent expense on a straight-line basis over the lease term and records the difference between the amount charged to expense and the rent paid as a deferred rent liability. Contingent rent, determined based on a
52
BODY CENTRAL CORP.
NOTES TO THE CONSOLIDATED FINANCIAL STATEMENTS (Continued)
1. Nature of Business and Summary of Significant Accounting Policies (Continued)
percentage of sales in excess of specified levels, is recognized as rent expense when achievement of the specified sales that triggers the contingent rent is probable. Cash reimbursements received from landlords for leasehold improvements as lease incentives are also recorded as deferred rent and are amortized using the straight-line method over the lease term as an offset to rent expense.
Deferred Rent and Tenant Allowances
Deferred rent is recognized when a lease contains a predetermined fixed escalation of minimum rent. The Company recognizes the related rent expense on a straight-line basis from possession date and records the differences between the recognized rental expense and the amounts payable under the lease as deferred rent. Also included in deferred rent are tenant allowances received from landlords in accordance with negotiated lease terms. The tenant allowances are amortized as a reduction to rent expense on a straight-line basis over the term of the lease. Deferred rent is included in other liabilities in the accompanying Consolidated Balance Sheets.
Advertising
The Company expenses advertising costs in the period in which they occurred. Advertising expense, which is classified in selling, general and administrative expenses in the accompanying Consolidated Statements of Operations, was $1.1 million, $983,000, and $869,000 for fiscal year 2011, fiscal year 2010 and fiscal year 2009, respectively.
Income Taxes
Income taxes are accounted for pursuant to FASB ASC 740, Income Taxes, which requires that the Company recognize deferred income taxes, which include net operating loss carry forwards and tax credits among other items. Deferred income taxes are determined based on the difference between the financial reporting and tax bases of assets and liabilities using enacted tax rates in effect for the year in which the differences are expected to reverse. Deferred tax assets are offset by deferred tax liabilities relating to nondeductible temporary differences. Recognition of deferred tax assets is based on management's belief that it is more likely than not that the tax benefit associated with temporary differences will be utilized. The FASB issued guidance requires that deferred tax assets be reduced by a valuation allowance if it is more likely than not that some portion or all of the net deferred tax assets will not be realized. It has been determined that valuation allowances against the deferred tax assets are not currently necessary.
The Company follows FASB ASC 740, Income Taxes, guidance on accounting for uncertainty in income taxes. The standard prescribes a recognition threshold and measurement attributable for financial statement recognition and measurement of tax positions taken or expected to be taken in tax returns. In addition, the standard provides guidance on the de-recognition, classification and disclosure of tax positions, as well as the accounting for related interest and penalties. The Company does not have any uncertain tax provisions recorded in its Consolidated Financial Statements.
Interest and penalties, if any, are recognized in the provision for income taxes in the Consolidated Statements of Operations. Accrued interest and penalties, if applicable, are included within the related tax liability line on the Consolidated Balance Sheets.
53
BODY CENTRAL CORP.
NOTES TO THE CONSOLIDATED FINANCIAL STATEMENTS (Continued)
1. Nature of Business and Summary of Significant Accounting Policies (Continued)
Cost of Goods Sold
Cost of goods sold includes the direct cost of purchased merchandise, distribution costs, all freight costs incurred to get merchandise to our stores and our direct customers, costs incurred to produce and distribute our catalogs, store occupancy costs and buying costs. In addition, markdowns taken, markdown reserves for slow moving items and inventory reserves are included in cost of goods sold.
Selling, General and Administrative Expenses
Selling, general and administrative expenses include operating expenses not in cost of goods sold, primarily administration, marketing, stock-based compensation and store operating expenses, excluding store occupancy costs. Store opening costs are expensed as incurred and are included in selling, general and administrative expense in the Consolidated Statements of Operations.
Insurance and Self-Insurance
The Company uses a combination of insurance and self-insurance for a number of risk management activities including workers' compensation, general liability, automobile liability and employee-related health care benefits, a portion of which is paid by the employees. Costs related to claims are accrued based on known claims and historical experiences of incurred but not reported claims received from our insurers. The Company believes that it has adequately reserved for its self-insurance liability, which is capped through the use of stop-loss contracts and specified retentions with insurance companies. However, any significant variation of future claims from historical trends could cause actual results to differ from the accrued liability.
Concentration of Credit Risk
Financial instruments subject to concentrations of credit risk consist primarily of cash. The Company places its cash with what it believes to be high credit quality institutions. At times such instruments may be in excess of the FDIC insurance limit.
New Accounting Standards
In June 2011, the FASB issued ASU No. 2011-05, Presentation of Comprehensive Income, which amends ASC 220, Comprehensive Income. The amended guidance requires most entities present changes in net income and other comprehensive income in either a single statement of comprehensive income or two separate, but consecutive, statements. The objective of these amendments is to improve the comparability, consistency, and transparency of financial reporting and to increase the prominence of items reported in other comprehensive income. This guidance is effective for fiscal years beginning after December 15, 2011. The adoption of this guidance will not have a material impact on the Company's financial statements or disclosures.
In September 2011, the FASB issued ASU No. 2011-08, Intangibles—Goodwill and Other. This guidance is intended to simplify how entities test goodwill for impairment. This update permits an entity to first assess qualitative factors to determine whether it is necessary to perform the two-step quantitative goodwill impairment test. This ASU becomes effective for fiscal years beginning after December 15, 2011. The Company has opted for an early adoption of this ASU. The adoption of this guidance did not have a material impact on the Company's financial statements or disclosures.
54
BODY CENTRAL CORP.
NOTES TO THE CONSOLIDATED FINANCIAL STATEMENTS (Continued)
1. Nature of Business and Summary of Significant Accounting Policies (Continued)
Reclassifications
Certain reclassifications have been made to the fiscal years 2010 and 2009 consolidated financial statements in order to conform to the presentation for fiscal year 2011.
2. Financial Instruments
The FASB-issued guidance establishes a framework for measuring fair value that is based on the inputs market participants use to determine fair value of an asset or liability and establishes a fair value hierarchy to prioritize those inputs. The guidance under this statement describes a hierarchy of three levels of input that may be used to measure fair value:
- •
- Level 1—Inputs based on quoted prices in active markets for identical assets and liabilities.
- •
- Level 2—Inputs other than Level 1 quoted prices, such as quoted prices for similar assets and
liabilities; quoted prices in markets that are not active; or other inputs that are observable or can be corroborated by observable market data for substantially the full term of the asset or
liability.
- •
- Level 3—Unobservable inputs based on little market or no market activity and which are significant to the fair value of the assets and liabilities.
The Company's material financial instruments consist primarily of cash and cash equivalents, accounts receivable, accounts payable, and accrued expenses. The fair values of cash, accounts receivable, accounts payable and accrued expenses are equal to their carrying values based on their liquidity.
Considerable judgment is required in interpreting market data to develop estimates of fair value. The fair value estimate presented herein is not necessarily indicative of the amount that the Company or the debt holders could realize in a current market exchange. The use of different assumptions and/or estimation methodologies may have a material effect on the estimated fair value.
The Company repaid all amounts owed under the term loan facilities of its senior credit facility on October 20, 2010, using proceeds from the Company's initial public offering. The term loans were repaid at carrying value.
The Company has determined the estimated fair value amounts of its financial instruments using available market information. The assets that are measured at fair value on a recurring basis include the following:
| |
|
Fair Value Measurements Using | |||||||||||
|---|---|---|---|---|---|---|---|---|---|---|---|---|---|
| |
Total | Quoted Prices in Active Markets (Level 1) |
Significant Other Observable Inputs (Level 2) |
Significant Unobservable Inputs (Level 3) |
|||||||||
| |
(in thousands) |
||||||||||||
Money market securities: |
|||||||||||||
December 31, 2011 |
$ | — | $ | — | $ | — | $ | — | |||||
January 1, 2011 |
$ | 11,084 | $ | 11,084 | $ | — | $ | — | |||||
55
BODY CENTRAL CORP.
NOTES TO THE CONSOLIDATED FINANCIAL STATEMENTS (Continued)
2. Financial Instruments (Continued)
Money market securities, which are short-term investments of excess cash, are classified as cash and cash equivalents on the Consolidated Balance Sheets.
3. Property and Equipment
Property and equipment as of December 31, 2011 and January 1, 2011 consist of the following:
| |
December 31, 2011 |
January 1, 2011 |
|||||
|---|---|---|---|---|---|---|---|
| |
(in thousands) |
||||||
Furniture and fixtures |
$ | 14,359 | $ | 10,628 | |||
Leasehold improvements |
27,692 | 22,070 | |||||
|
42,051 | 32,698 | |||||
Accumulated depreciation and amortization |
(19,892 | ) | (15,627 | ) | |||
Property and equipment, net |
$ | 22,159 | $ | 17,071 | |||
Depreciation and amortization expense related to property and equipment was $4.6 million, $4.1 million and $4.0 million for fiscal years 2011, 2010 and 2009, respectively.
The Company incurred costs of $5.7 million, $3.8 million and $3.0 million for capital expenditures, excluding tenant allowances of $4.1 million, $3.0 million and $1.8 million for fiscal years 2011, 2010 and 2009, respectively.
4. Goodwill and Intangible Assets
The changes in the carrying amount of goodwill for the years ended December 31, 2011 and January 1, 2011 are as follows:
| |
Goodwill | |||
|---|---|---|---|---|
| |
(in thousands) |
|||
Net Balance as of January 2, 2010 |
$ | 21,508 | ||
New acquisitions |
$ | — | ||
Goodwill, gross |
$ | 55,470 | ||
Accumulated impairment losses |
$ | (33,962 | ) | |
Net Balance as of January 1, 2011 |
$ |
21,508 |
||
New acquisitions |
$ | — | ||
Goodwill, gross |
$ | 55,470 | ||
Accumulated impairment losses |
$ | (33,962 | ) | |
Net Balance as of December 31, 2011 |
$ |
21,508 |
||
56
BODY CENTRAL CORP.
NOTES TO THE CONSOLIDATED FINANCIAL STATEMENTS (Continued)
4. Goodwill and Intangible Assets (Continued)
Intangible assets consist of the following:
| |
Favorable Retail Leases |
Unfavorable Retail Leases |
Customer Relationships |
Trade names and trademarks |
|||||||||
|---|---|---|---|---|---|---|---|---|---|---|---|---|---|
| |
(in thousands) |
||||||||||||
Gross amount as of December 31, 2011 |
$ | 3,225 | $ | (190 | ) | $ | 585 | $ | 16,395 | ||||
Accumulated amortization |
(3,078 | ) | 160 | (585 | ) | — | |||||||
Net amount as of December 31, 2011 |
$ | 147 | $ | (30 | ) | $ | — | $ | 16,395 | ||||
Gross amount as of January 1, 2011 |
$ | 3,225 | $ | (190 | ) | $ | 585 | $ | 16,395 | ||||
Accumulated amortization |
(2,492 | ) | 130 | (585 | ) | — | |||||||
Net amount as of January 1, 2011 |
$ | 733 | $ | (60 | ) | $ | — | $ | 16,395 | ||||
Trade names and trademarks are deemed to be indefinite life intangibles and are thus not subject to amortization. Unfavorable retail leases are included in other liabilities in the Consolidated Balance Sheets.
Aggregate amortization expense related to intangible assets was $556,000, $666,000 and $702,000 for fiscal years 2011, 2010 and 2009, respectively. Estimated aggregate amortization expense for the next fiscal year is shown below:
Fiscal Year
|
(in thousands) | |||
|---|---|---|---|---|
2012 |
$ | 117 | ||
5. Accrued Expenses and Other Current Liabilities
The major components of accrued expenses and other current liabilities are as follows:
| |
December 31, 2011 |
January 1, 2011 |
|||||
|---|---|---|---|---|---|---|---|
| |
(in thousands) |
||||||
Accrued payroll and related taxes |
$ | 6,317 | $ | 4,581 | |||
Accrued occupancy |
2,919 | 2,124 | |||||
Taxes, other than income taxes |
2,004 | 1,944 | |||||
Gift certificates and store merchandise credits |
2,114 | 1,165 | |||||
Income taxes payable |
— | 237 | |||||
Other |
5,254 | 4,554 | |||||
Total accrued expenses and other current liabilities |
$ | 18,608 | $ | 14,605 | |||
6. Long-Term Debt
On October 20, 2010, using net proceeds from its initial public offering, the Company repaid all amounts owing under its term loan facilities of its senior credit facility. There were no amounts outstanding under the revolving credit facility of the Company's senior credit facility at the time of repayment. Subsequently, the senior credit facility was terminated.
57
BODY CENTRAL CORP.
NOTES TO THE CONSOLIDATED FINANCIAL STATEMENTS (Continued)
7. Commitments and Contingencies
Leases
The Company conducts all of its retail sales and corporate operations in leased facilities. Lease terms generally range up to ten years and provide for escalations in base rents. The Company does not have obligations to renew the leases. Certain leases provide for contingent rentals based upon sales. Most leases also require additional payments covering real estate taxes, common area costs and insurance.
Future minimum rental commitments, by year and in the aggregate, under non-cancelable operating leases as of December 31, 2011, are as follows:
Fiscal Year
|
(in thousands) | |||
|---|---|---|---|---|
2012 |
$ | 19,115 | ||
2013 |
16,976 | |||
2014 |
15,463 | |||
2015 |
13,884 | |||
2016 |
11,470 | |||
Thereafter |
14,516 | |||
Total |
$ | 91,424 | ||
Rent expense under non-cancelable operating leases was as follows:
| |
Fiscal Year Ended | |||||||||
|---|---|---|---|---|---|---|---|---|---|---|
| |
December 31, 2011 |
January 1, 2011 |
January 2, 2010 |
|||||||
| |
(in thousands) |
|||||||||
Minimum rentals |
$ | 20,957 | $ | 17,511 | $ | 15,199 | ||||
Contingent rentals |
3,055 | 2,048 | 1,273 | |||||||
Total rent expense |
$ | 24,012 | $ | 19,559 | $ | 16,472 | ||||
Employment Contracts
The Company is subject to employment agreements with certain executives, which provide for compensation and other certain benefits. The agreements also provide for severance payments under certain circumstances.
Litigation
The Company is involved in various routine legal proceedings incidental to the conduct of its business. In the opinion of management, based on the advice of in-house and external legal counsel, the lawsuits and claims pending are not likely to have a material adverse effect on the Company's financial condition, results of operations or cash flows.
58
BODY CENTRAL CORP.
NOTES TO THE CONSOLIDATED FINANCIAL STATEMENTS (Continued)
8. Income Taxes
The components of the income tax provision (benefit) for the fiscal years ended December 31, 2011, January 1, 2011 and January 2, 2010 are as follows:
| |
Fiscal Year Ended | |||||||||
|---|---|---|---|---|---|---|---|---|---|---|
| |
December 31, 2011 |
January 1, 2011 |
January 2, 2010 |
|||||||
| |
(in thousands) |
|||||||||
Current |
||||||||||
Federal |
$ | 10,928 | $ | 4,074 | $ | 79 | ||||
State |
1,520 | 308 | — | |||||||
|
12,448 | 4,382 | 79 | |||||||
Deferred |
||||||||||
Federal |
(280 | ) | 1,617 | 1,435 | ||||||
State |
(243 | ) | 459 | 126 | ||||||
|
(523 | ) | 2,076 | 1,561 | ||||||
Total provision |
$ | 11,925 | $ | 6,458 | $ | 1,640 | ||||
Deferred income taxes reflect the net tax effects of temporary differences between the carrying amount of assets and liabilities for financial reporting purposes and the amounts used for income tax purposes. Significant components of the Company's net deferred tax liability related to operations as of December 31, 2011 and January 1, 2011 are as follows:
| |
December 31, 2011 |
January 1, 2011 |
|||||
|---|---|---|---|---|---|---|---|
| |
(in thousands) |
||||||
Gross deferred tax assets: |
|||||||
Reserves |
$ | 83 | $ | 68 | |||
Property and equipment |
772 | 2,016 | |||||
Accrued expenses |
1,331 | 817 | |||||
Inventory |
537 | 480 | |||||
Stock-based compensation |
380 | 151 | |||||
Restricted Stock |
64 | — | |||||
Net operating losses |
1 | 60 | |||||
Other |
974 | 730 | |||||
Gross deferred tax assets |
4,142 | 4,322 | |||||
Gross deferred tax liabilities: |
|||||||
Intangibles |
(6,414 | ) | (6,561 | ) | |||
Tenant allowances |
— | (556 | ) | ||||
Gross deferred tax liabilities |
(6,414 | ) | (7,117 | ) | |||
Net deferred tax liability |
$ | (2,272 | ) | $ | (2,795 | ) | |
Recognition of deferred tax assets is based upon management's belief that it is more likely than not that a tax benefit associated with temporary differences will be utilized. A valuation allowance has not been recorded as it is more likely than not that all deferred tax assets will be realized. As of the
59
BODY CENTRAL CORP.
NOTES TO THE CONSOLIDATED FINANCIAL STATEMENTS (Continued)
8. Income Taxes (Continued)
date of the audit, the Company is currently not under any examination by any significant taxing authorities and the tax years that remain subject to examination by major tax jurisdictions under the statute of limitations are our fiscal years ended January 3, 2009 and forward. The effective rate differs from the statutory rate due to the following items:
| |
Fiscal Year Ended | |||||||||
|---|---|---|---|---|---|---|---|---|---|---|
| |
December 31, 2011 |
January 1, 2011 |
January 2, 2010 |
|||||||
| |
(in thousands) |
|||||||||
Amount computed using statutory rates |
35.0 | % | 34.0 | % | 34.0 | % | ||||
State and local income taxes, net of federal benefit |
4.0 | 4.4 | 4.5 | |||||||
State income tax true-up |
— | — | — | |||||||
Other |
(1.3 | ) | 1.3 | (1.4 | ) | |||||
Provision for income tax rate |
37.7 | % | 39.7 | % | 37.1 | % | ||||
9. Redeemable Preferred Stock
On October 14, 2010, the Company completed its initial public offering. Net proceeds from the initial public offering were used, in part, to redeem all of the outstanding shares of the Company's non-convertible, non-voting Series C preferred stock. Also as part of its initial public offering, all of the Company's convertible Series A and Series B preferred stock were converted to 11,869,109 shares of the Company's common stock. Prior to the completion of the initial public offering, the Company had four classes of redeemable preferred stock. The order of liquidation preference was Series D, C, A and B. The following is a summary of changes in each issue of redeemable preferred stock:
| |
Redeemable Preferred Stock | ||||||||||||
|---|---|---|---|---|---|---|---|---|---|---|---|---|---|
| |
Series D | Series C | Series A | Series B | |||||||||
| |
(in thousands) |
||||||||||||
Balance as of January 3, 2009 |
— | 3,268 | 31,080 | 15,540 | |||||||||
Dividends payable |
— | 150 | — | — | |||||||||
Balance as of January 2, 2010 |
— | 3,418 | 31,080 | 15,540 | |||||||||
Dividends payable |
— | 113 | — | — | |||||||||
Redemption |
— | (3,531 | ) | — | — | ||||||||
Convert to common stock |
— | — | (31,080 | ) | (15,540 | ) | |||||||
Balance as of January 1, 2011 |
$ | — | $ | — | $ | — | $ | — | |||||
Upon completion of the initial public offering, the Company adopted a new certificate of incorporation which granted the Company's board of directors authority, without further action by its stockholders, to issue up to 5,000,000 shares of preferred stock in one or more series and to fix the rights, preferences, privileges and restrictions thereof, including voting rights, dividend rights, conversion rights, redemption privileges and liquidation preferences. As of December 31, 2011, there were no shares of undesignated preferred stock issued or outstanding.
60
BODY CENTRAL CORP.
NOTES TO THE CONSOLIDATED FINANCIAL STATEMENTS (Continued)
10. Stockholders' Equity (Deficit)
Common Stock
On May 25, 2011, the Company amended and restated the Company's Third Amended and Restated Certificate of Incorporation to reduce its total number of authorized shares of common stock to 45 million shares, par value $0.001 per share.
On February 16, 2011, the Company completed a secondary offering of 5,703,764 shares of common stock priced at $16.50 per share. The Company sold 100,000 new shares of its common stock in the offering, and selling shareholders sold 5,603,764 shares of common stock in the offering which included all of the 743,969 shares sold pursuant to the underwriters' over-allotment option. The offering raised net proceeds of $1.1 million for the Company, after deducting the underwriting discount and offering expenses paid by the Company. The Company did not receive any proceeds from the sale of the over-allotment shares by the selling stockholders.
On October 14, 2010, the Company completed the initial public offering of its common stock which included 3,333,333 new shares sold by the Company and 1,666,667 shares sold by the Company's existing stockholders, raising net proceeds of $38.2 million for the Company, after deducting the underwriting discount and offering expenses paid by the Company. On November 2, 2010, the underwriters of the Company's initial public offering exercised their full over-allotment option to purchase an additional 750,000 shares of the Company's common stock from the Company's selling stockholders. The Company did not receive any proceeds from the sale of the over-allotment shares by the selling stockholders.
The net proceeds of the initial public offering were used to: (a) repay all amounts owing under its term loan facilities of its senior credit facility; (b) redeem all of the outstanding shares of the Company's non-convertible, non-voting Series C preferred stock; (c) pay an aggregate $1.0 million to specified employees, including certain named executive officers, under a success bonus plan triggered upon completion of the initial public offering; and (d) provide funds for working capital and other general corporate purposes.
Stock-Based Compensation Plans
On March 22, 2011, the Company's Board of Directors approved, subject to stockholder approval, an amendment and restatement of the Company's Amended and Restated 2006 Equity Plan (the "Plan"). On May 25, 2011, the Company's stockholders approved the amendment and restatement to the Plan. The amended and restated Plan permits up to 250,000 of the remaining 1,056,509 shares of common stock reserved for future issuance as of December 31, 2011 under the Plan to be issued in the form of restricted stock awards and will allow certain awards under the Plan to qualify as performance-based compensation under Section 162(m) of the Internal Revenue Code of 1986, if the compensation committee of the Company's board of directors chooses to qualify the awards in other respects.
The Company estimates the fair value of each option award on the date of the grant using the Black-Scholes option valuation model. Estimates of fair value are not intended to predict actual future events or the value ultimately realized by persons who receive equity awards. Key input assumptions used to estimate the fair value of stock options include the exercise price of the award, the expected option term, expected volatility of the Company's stock over the option's expected term, the risk-free interest rate over the option's expected term and the Company's expected annual dividend yield. The Company issues new shares with the exercise of options.
61
BODY CENTRAL CORP.
NOTES TO THE CONSOLIDATED FINANCIAL STATEMENTS (Continued)
10. Stockholders' Equity (Deficit) (Continued)
The fair value of each option grant for the fiscal years ended December 31, 2011, January 1, 2011 and January 2, 2010 was estimated on the grant date using the Black-Scholes option-pricing model with the following weighted-average assumptions:
| |
Fiscal Year Ended | |||||||||
|---|---|---|---|---|---|---|---|---|---|---|
| |
December 31, 2011 |
January 1, 2011 |
January 2, 2010 |
|||||||
Expected option term(1) |
6.25 years | 6.19 years | 6.25 years | |||||||
Expected volatility factor(2) |
65.8 | % | 73.7 | % | 71.0 | % | ||||
Risk-free interest rate(3) |
1.4 | % | 1.5 | % | 3.1 | % | ||||
Expected annual dividend yield |
0 | % | 0 | % | 0 | % | ||||
- (1)
- Since
there was not sufficient historical information for grants with similar terms, the simplified or "plain-vanilla" method of estimating option life was
utilized.
- (2)
- The
stock volatility for each grant is measured using the weighted average of historical weekly price changes of certain peer companys' common stock over
the most recent period equal to the expected option life of the grant. The Company uses peer company volatility because we have been public less than two years and our expected term is over six years.
These peer companies represent other publicly traded retailers in the female fashion segment.
- (3)
- The
risk-free interest rate for periods equal to the expected term of the share option is based on the rate of U.S. Treasury securities with the
same term as the option as of the grant date.
A summary of stock option information for the fiscal year ended December 31, 2011 is as follows:
| |
Shares | Weighted- Average Exercise Price |
Weighted- Average Remaining Contractual Term |
|||||
|---|---|---|---|---|---|---|---|---|
Outstanding as of January 1, 2011 |
1,094,094 | $ | 4.45 | |||||
Granted |
193,266 | 19.67 | ||||||
Exercised |
(623,024 | ) | 3.39 | |||||
Forfeited |
(30,280 | ) | 14.77 | |||||
Outstanding as of December 31, 2011 |
634,056 | $ | 9.72 | |||||
Exercisable as of December 31, 2011 |
106,339 | $ | 5.12 | 7.6 years | ||||
The
aggregate intrinsic value of outstanding and exercisable stock options, representing the excess of the average market price of the Company's stock on
December 31, 2011 over the exercise price, multiplied by the applicable number of in-the-money options, was
$2.1 million, at December 31, 2011. There were 106,339 in-the-money options outstanding and exercisable at December 31, 2011. The total intrinsic value of
stock options exercised was $9.6 million during 2011. No stock options were exercised in 2009 or 2010.
62
BODY CENTRAL CORP.
NOTES TO THE CONSOLIDATED FINANCIAL STATEMENTS (Continued)
10. Stockholders' Equity (Deficit) (Continued)
A summary of the status of nonvested stock options as of December 31, 2011 and changes during the fiscal years 2011, 2010 and 2009, are presented below:
| |
Shares | Weighted- Average Grant-Date Fair Value |
|||||
|---|---|---|---|---|---|---|---|
Nonvested as of January 3, 2009 |
293,421 | 0.67 | |||||
Granted |
586,842 | 1.27 | |||||
Vested |
(133,610 | ) | 0.66 | ||||
Forfeited |
— | — | |||||
Nonvested as of January 2, 2010 |
746,653 | 1.14 | |||||
Granted |
130,000 | 8.54 | |||||
Vested |
(269,318 | ) | 1.06 | ||||
Forfeited |
— | — | |||||
Nonvested as of January 1, 2011 |
607,335 | 2.76 | |||||
Granted |
193,266 | 11.93 | |||||
Vested |
(242,604 | ) | 2.29 | ||||
Forfeited |
(30,280 | ) | 9.47 | ||||
Nonvested as of December 31, 2011 |
527,717 | $ | 5.96 | ||||
A summary of the status of nonvested restricted stock as of December 31, 2011 and changes during the fiscal years 2011, 2010 and 2009, are presented below:
| |
Restricted Stock Awards |
||||||
|---|---|---|---|---|---|---|---|
| |
Shares | Weighted Average Grant Date Fair Value |
|||||
Nonvested as of January 3, 2009 |
— | — | |||||
Granted |
— | — | |||||
Vested |
— | — | |||||
Forfeited |
— | — | |||||
Nonvested as of January 2, 2010 |
— | — | |||||
Granted |
— | — | |||||
Vested |
— | — | |||||
Forfeited |
— | — | |||||
Nonvested as of January 1, 2011 |
— | ||||||
Granted |
30,704 | $ | 20.68 | ||||
Vested |
— | — | |||||
Forfeited |
— | — | |||||
Nonvested as of December 31, 2011 |
30,704 | $ | 20.68 | ||||
Stock-based compensation expense of $1.1 million, $563,000 and $168,000 for the fiscal years 2011, 2010 and 2009, respectively, is included in selling, general and administrative expenses and cost of goods sold on the Company's Consolidated Statements of Operations. The Company did not capitalize any expense related to stock-based compensation. Total compensation cost related to nonvested awards
63
BODY CENTRAL CORP.
NOTES TO THE CONSOLIDATED FINANCIAL STATEMENTS (Continued)
10. Stockholders' Equity (Deficit) (Continued)
not yet recognized was $2.2 million as of December 31, 2011, and is expected to be recognized over a weighted average remaining period of 1.5 years. The weighted-average grant-date fair value of options was $11.93, $8.54 and $1.27 in fiscal years 2011, 2010 and 2009, respectively.
11. Savings Plan
The Company provides a savings plan (the "Savings Plan") under Section 401(k) of the Internal Revenue Code. The Savings Plan covers all employees who have attained age 21 and completed at least 1,000 hours of service in a twelve consecutive month period. The Savings Plan requires specified contributions by the employees and allows discretionary contributions by the Company. Total employer contribution expense was approximately $217,000, $158,000 and $153,000 for the fiscal years ended December 31, 2011, January 1, 2011 and January 2, 2010, respectively.
12. Related Parties
The Company leases office and warehouse space under a noncancelable lease agreement dated October 1, 2006 with a company that is owned by certain members of management who are also stockholders of the Company. The lease expires on October 1, 2016. The Company incurred rent expense of $467,000, $474,000 and $468,000 for the fiscal years ended December 31, 2011, January 1, 2011 and January 2, 2010, respectively, related to this lease.
13. Fair Value Measurements
Assets and liabilities measured at fair value on a non-recurring basis consist of the following:
| |
|
Basis of Fair Value Measurements | |||||||||||
|---|---|---|---|---|---|---|---|---|---|---|---|---|---|
| |
Fair Value of Assets (Liabilities) |
Quoted Prices in Active Markets for Idential Items (Level 1) |
Significant Other Observable Inputs (Level 2) |
Significant Unobservable Inputs (Level 3) |
|||||||||
| |
(in thousands) |
||||||||||||
Long-lived assets held and used: |
|||||||||||||
December 31, 2011 |
$ | 8,757 | $ | — | $ | — | $ | 8,757 | |||||
January 1, 2011 |
$ | 7,718 | $ | — | $ | — | $ | 7,718 | |||||
64
BODY CENTRAL CORP.
NOTES TO THE CONSOLIDATED FINANCIAL STATEMENTS (Continued)
14. Quarterly Results (Unaudited)
The following table presents summarized unaudited quarterly financial results of operations for the Company for fiscal years 2011 and 2010. We believe all necessary adjustments have been included in the amounts stated below to present fairly the following selected information when read in conjunction with the Consolidated Financial Statements and Notes thereto included elsewhere herein. Future quarterly operating results may fluctuate depending on a number of factors. Results for any particular quarter are not necessarily indicative of results of operations a full fiscal year or any other quarter.
| |
Fiscal Year 2011 | ||||||||||||
|---|---|---|---|---|---|---|---|---|---|---|---|---|---|
| |
First Quarter |
Second Quarter |
Third Quarter |
Fourth Quarter |
|||||||||
| |
(in thousands, except per share data) |
||||||||||||
Net revenues |
$ | 73,984 | $ | 74,670 | $ | 67,110 | $ | 80,736 | |||||
Gross profit |
26,733 | 26,051 | 22,579 | 28,036 | |||||||||
Net income |
5,415 | 5,318 | 2,848 | 6,139 | |||||||||
Net income per common share—basic |
$ | 0.35 | $ | 0.34 | $ | 0.18 | $ | 0.38 | |||||
Net income per common share—dilutive |
$ | 0.34 | $ | 0.33 | $ | 0.18 | $ | 0.38 | |||||
| |
Fiscal Year 2010 | ||||||||||||
|---|---|---|---|---|---|---|---|---|---|---|---|---|---|
| |
First Quarter |
Second Quarter |
Third Quarter |
Fourth Quarter |
|||||||||
| |
(in thousands, except per share data) |
||||||||||||
Net revenues |
$ | 58,173 | $ | 61,172 | $ | 56,943 | $ | 67,076 | |||||
Gross profit |
19,770 | 19,981 | 18,221 | 23,590 | |||||||||
Net income |
3,389 | 2,331 | 1,343 | 2,748 | |||||||||
Net income per common share—basic |
$ | 16.49 | $ | 11.28 | $ | 6.43 | $ | 0.21 | |||||
Net income per common share—dilutive |
$ | 0.28 | $ | 0.19 | $ | 0.11 | $ | 0.18 | |||||
The sum of the quarterly income per common share may not equal the full year amount as the computations of the weighted average common shares outstanding for basic and diluted shares outstanding for each quarter and the full year are performed independently.
15. Earnings per Share
Net income per common share—basic is calculated by dividing net income available to common stockholders by the weighted average number of common shares outstanding for the period. Net income per common share—dilutive includes the determinants of basic earnings per common share plus the additional dilution for all potentially dilutive stock options and convertible preferred stock utilizing the treasury stock method and if-converted method, respectively.
65
BODY CENTRAL CORP.
NOTES TO THE CONSOLIDATED FINANCIAL STATEMENTS (Continued)
15. Earnings per Share (Continued)
The following table shows the amounts used in computing earnings per share and the effect on net income and the weighted average number of shares potentially dilutive to common stock:
| |
Fiscal Year Ended | |||||||||
|---|---|---|---|---|---|---|---|---|---|---|
| |
December 31, 2011 |
January 1, 2011 |
January 2, 2010 |
|||||||
| |
(in thousands, except share and per share data) |
|||||||||
Net income as reported |
$ | 19,720 | $ | 9,811 | $ | 2,780 | ||||
Less: Preferred stock dividends declared |
— | (113 | ) | (150 | ) | |||||
Net income attributable to common shareholders |
$ | 19,720 | $ | 9,698 | $ | 2,630 | ||||
Weighted average basic common shares |
15,780,908 | 3,502,657 | 203,235 | |||||||
Impact of dilutive securities: |
||||||||||
Stock options |
437,474 | 587,855 | 101,628 | |||||||
Convertible preferred stock |
— | 9,293,130 | 11,869,109 | |||||||
Weighted average dilutive common shares |
16,218,382 | 13,383,642 | 12,173,972 | |||||||
Per common share: |
||||||||||
Net income per common share—basic |
$ | 1.25 | $ | 2.77 | $ | 12.94 | ||||
Net income per common share—dilutive |
$ | 1.22 | $ | 0.73 | $ | 0.23 | ||||
Equity awards to purchase 37,500 shares of common stock were outstanding as of December 31, 2011 and not included in the computation of diluted common shares as the exercise price of these options were greater than the average market price of the common shares. There were no outstanding options excluded from the computation of diluted common shares as of January 1, 2011 and January 2, 2010, as all of these outstanding options had exercise prices less than the average market price for the common shares.
16. Subsequent Event
On January 20, 2012, we entered into a new Line of Credit Agreement with Branch Banking and Trust Company. This agreement provides for a revolving line of credit facility in the amount of $5.0 million with an accordion feature that allows Branch Banking and Trust Company to increase the facility up to $20 million at its sole discretion. The facility has maturity date of May 5, 2013 and bears interest at the one month LIBOR rate plus 1.35% per annum, as adjusted monthly on the first day of each month, with an all-in floor rate of 2.0%. The facility is secured by all the assets of the company. The Line of Credit Agreement includes a financial covenant requiring the Company to have a Tangible Net Worth (as defined in the Line of Credit Agreement) of $30.0 million quarterly, and other customary covenants. Consequently, our principal market risk relates to interest rate sensitivity, which is the risk that future changes in interest rates will reduce our net income or net assets. As of March 6, 2012, there was no outstanding debt under the Line of Credit with Branch Banking and Trust Company.
66
ITEM 9. CHANGES IN AND DISAGREEMENTS WITH ACCOUNTANTS ON ACCOUNTING AND FINANCIAL DISCLOSURE
None.
ITEM 9A. CONTROLS AND PROCEDURES
Evaluation of Disclosure Controls and Procedure
Our management, with the participation of our principal executive officer and principal financial officer, has evaluated the effectiveness of the design and operation of our disclosure controls and procedures (as such term is defined in Rules 13a-15(e) and 15d-15(e) under the Securities Exchange Act of 1934) as of December 31, 2011, the end of the period covered by this report and has concluded that, as of the end of such period, our disclosure controls and procedures were effective.
Management's Report on Internal Control over Financial Reporting
Management is responsible for establishing and maintaining adequate internal control over financial reporting (as defined in Rule 13a-15(f) under the Exchange Act).
Management, including the Chief Executive Officer and Chief Financial Officer, assessed the effectiveness of the Company's internal control over financial reporting as of December 31, 2011. In making this assessment, management applied the criteria based on the "Internal Control—Integrated Framework" set forth by the Committee of Sponsoring Organizations of the Treadway Commission (COSO). Based upon this evaluation, management concluded that the Company's internal control over financial reporting was effective as of December 31, 2011.
PricewaterhouseCoopers LLP, the Company's independent registered certified public accounting firm, has audited the financial statements and the effectiveness of the Company's internal control over financial reporting as of December 31, 2011, as stated in their report which is included herein.
Our system of internal control over financial reporting was designed to provide reasonable assurance regarding the preparation and fair presentation of published financial statements in accordance with accounting principles generally accepted in the United States. Because of its inherent limitations, internal control over financial reporting may not prevent or detect misstatements. Also, projections of any evaluation of effectiveness to future periods are subject to the risk that controls may become inadequate because of changes in conditions, or that the degree of compliance with the policies or procedures may deteriorate.
Changes in Internal Control over Financial Reporting
There have been no changes in our internal control over financial reporting that occurred during the fourth quarter of fiscal 2011 that have materially affected, or are reasonably likely to materially affect, our internal control over financial reporting.
None.
67
ITEM 10. DIRECTORS, EXECUTIVE OFFICERS AND CORPORATE GOVERNANCE
The information required by this item is incorporated herein by reference to our definitive proxy statement to be filed with the Securities and Exchange Commission within 120 days after the end of the fiscal year covered by this Form 10-K.
The Company has adopted a Code of Business Conduct and Ethics (the "Code") that applies to all employees including our principal executive officer, principal financial officer, controller and persons performing similar functions. Our Code of Business Conduct and Ethics is available on our website, www.bodyc.com, under "Investor Relations, Corporate Governance" and in print to any person who requests it. Any amendments to, or waivers from, a provision of our Code that applies to our principal executive officer, principal financial officer or persons performing similar functions and that relates to any element of the Code enumerated in paragraph (b) of Item 406 of Regulation S-K shall be disclosed by posting such information on our website.
ITEM 11. EXECUTIVE COMPENSATION
The information required by this item is incorporated herein by reference to our definitive proxy statement to be filed with the Securities and Exchange Commission within 120 days after the end of the fiscal year covered by this Form 10-K.
ITEM 12. SECURITY OWNERSHIP OF CERTAIN BENEFICIAL OWNERS AND MANAGEMENT AND RELATED STOCKHOLDER MATTERS
The information required by this item is incorporated herein by reference to our definitive proxy statement to be filed with the Securities and Exchange Commission within 120 days after the end of the fiscal year covered by this Form 10-K.
The following table summarizes the number of stock options issued and shares of restricted stock granted, net of forfeitures and sales, the weighted-average exercise price of such stock options and the number of securities remaining to be issued under all outstanding equity compensation plans as of December 31, 2011:
| |
Number of securities to be issued upon exercise of outstanding options, warrants and rights (a) |
Weighted-average exercise price of outstanding options, warrants and rights (b) |
Number of securities remaining available for issuance under equity compensation plans (excluding securities reflected in column (a)) (c) |
|||||||
|---|---|---|---|---|---|---|---|---|---|---|
Equity compensation plans approved by security holders |
664,760 | $ | 9.72 | 358,425 | ||||||
Equity compensation plans not approved by security holders |
— | — | — | |||||||
Total |
664,760 | $ | 9.72 | 358,425 | ||||||
68
ITEM 13. CERTAIN RELATIONSHIPS AND RELATED TRANSACTIONS, AND DIRECTOR INDEPENDENCE
The information required by this item is incorporated herein by reference to our definitive proxy statement to be filed with the Securities and Exchange Commission within 120 days after the end of the fiscal year covered by this Form 10-K.
ITEM 14. PRINCIPAL ACCOUNTANT FEES AND SERVICES
The information required by this item is incorporated herein by reference to our definitive proxy statement to be filed with the Securities and Exchange Commission within 120 days after the end of the fiscal year covered by this Form 10-K.
69
ITEM 15. EXHIBITS AND FINANCIAL STATEMENT SCHEDULES
Financial Statements and Financial Statement Schedules
See "Index to Consolidated Financial Statements" in Part II, Item 8 of this Annual Report on Form 10-K.
Exhibits
The exhibits listed in the accompanying index to exhibits are filed or incorporated by reference as part of this Annual Report on Form 10-K.
70
Pursuant to the requirements of Section 13 or 15(d) of the Securities Exchange Act of 1934, the registrant has duly caused this report to be signed on its behalf by the undersigned, thereunto duly authorized.
Date:
March 15, 2012
| BODY CENTRAL CORP. | ||||
By: |
/s/ B. ALLEN WEINSTEIN B. Allen Weinstein President, Chief Executive Officer and Director (Principal Executive Officer) |
|||
By: |
/s/ TOM STOLTZ Tom Stoltz Executive Vice President, Chief Financial Officer and Treasurer (Principal Financial Officer) |
|||
Pursuant to the requirements of the Securities Exchange Act of 1934, this report has been signed below by the following persons on behalf of the registrant and in the capacities and on the dates indicated.
Signature
|
Title
|
Date
|
||
|---|---|---|---|---|
| /s/ B. ALLEN WEINSTEIN B. Allen Weinstein |
President, Chief Executive Officer and Director (Principal Executive Officer) | March 15, 2012 | ||
/s/ BETH R. ANGELO Beth R. Angelo |
Chief Merchandise Officer, Executive Vice President, President of Direct Sales and Director |
March 15, 2012 |
||
/s/ TOM STOLTZ Tom Stoltz |
Executive Vice President, Chief Financial Officer and Treasurer (Principal Financial Officer) |
March 15, 2012 |
||
/s/ SUZANNE K. HOSCH Suzanne K. Hosch |
Vice President and Controller (Principal Accounting Officer) |
March 15, 2012 |
||
/s/ MARTIN P. DOOLAN Martin P. Doolan |
Chairman of the Board of Directors |
March 15, 2012 |
||
/s/ DONNA R. ECTON Donna R. Ecton |
Director |
March 15, 2012 |
Signature
|
Title
|
Date
|
||
|---|---|---|---|---|
| /s/ SCOTT M. GALLIN Scott M. Gallin |
Director | March 15, 2012 | ||
/s/ JOHN K. HALEY John K. Haley |
Director |
March 15, 2012 |
||
/s/ DAVID A. KATZ David A. Katz |
Director |
March 15, 2012 |
||
Jerrold S. Rosenbaum |
Director |
March , 2012 |
In reviewing the agreements included as exhibits to this report, please remember they are included to provide you with information regarding their terms and are not intended to provide any other factual or disclosure information about the Company, its subsidiaries or other parties to the agreements. The Agreements contain representations and warranties by each of the parties to the applicable agreement. These representations and warranties have been made solely for the benefit of the other parties to the applicable agreement and:
- •
- should not in all instances be treated as categorical statements of fact, but rather as a way of
allocating the risk to one of the parties if those statements prove to be inaccurate;
- •
- have been qualified by disclosures that were made to the other party in connection with the
negotiation of the applicable agreement, which disclosures are not necessarily reflected in the agreement;
- •
- may apply standards of materiality in a way that is different from what may be viewed as material
to you or other investors; and
- •
- were made only as of the date of the applicable agreement or such other date or dates as may be specified in the agreement and are subject to more recent developments.
Accordingly, these representations and warranties may not describe the actual state of affairs as of the date they were made or at any other time. We acknowledge that, notwithstanding the inclusion of the foregoing cautionary statements, we are responsible for considering whether additional specific disclosures of material information regarding material contractual provisions are required to make the statements in this report not misleading. Additional information about the Company may be found elsewhere in this report and the Company's other public files, which are available without charge through the SEC's website at http://www.sec.gov.
| Exhibit No. | Description | ||
|---|---|---|---|
| 3.1 | Third Amended and Restated Certificate of Incorporation of Body Central Corp. as amended May 25, 2011. | ||
3.2 |
Amended and Restated By-Laws of Body Central Corp. (incorporated by reference from Amendment No. 3 to the Registration Statement (Registration No. 333-168014) on Form S-1 filed on September 30, 2010) |
||
4.1 |
Form of Registrant's Common Stock Certificate (incorporated by reference from Amendment No. 3 to the Registration Statement (Registration No. 333-168014) on Form S-1 filed on September 30, 2010) |
||
4.2 |
Registration Rights Agreement, dated October 1, 2006, between Body Central Acquisition Corp. and certain investors named therein (incorporated by reference from Registration Statement (Registration No. 333-168014) on Form S-1 filed on July 7, 2010). |
||
10.1† |
Amended and Restated 2006 Equity Incentive Plan (incorporated by reference from Appendix B to the Company's definitive proxy statement filed April 11, 2011). |
||
10.2† |
Form of Incentive Stock Option Agreement under the Amended and Restated 2006 Equity Incentive Plan (incorporated by reference from Amendment No. 3 to the Registration Statement (Registration No. 333-168014) on Form S-1 filed on September 30, 2010). |
||
10.3† |
Form of Non-Qualified Stock Option Agreement under the Amended and Restated 2006 Equity Incentive Plan (incorporated by reference from Amendment No. 3 to the Registration Statement (Registration No. 333-168014) on Form S-1 filed on September 30, 2010). |
||
| Exhibit No. | Description | ||
|---|---|---|---|
| 10.4 | Form of Indemnification Agreement made by and between Body Central Corp. and each of its directors and executive officers (incorporated by reference from Amendment No. 3 to the Registration Statement (Registration No. 333-168014) on Form S-1 filed on September 30, 2010). | ||
10.5 |
Lease Agreement, dated as of October 1, 2006, between Powers Avenue Joint Venture and Body Shop of America, Inc. (incorporated by reference from Amendment No. 1 to the Registration Statement (Registration No. 333-168014) on Form S-1 filed on August 17, 2010) |
||
10.6† |
Incentive Stock Option Agreement, dated October 12, 2009, between Body Central Acquisition Corp. and B. Allen Weinstein (incorporated by reference from Amendment No. 1 to the Registration Statement (Registration No. 333-168014) on Form S-1 filed on August 17, 2010). |
||
10.7† |
Incentive Stock Option Agreement, dated February 7, 2008, between Body Central Acquisition Corp. and Beth Angelo (incorporated by reference from Amendment No. 1 to the Registration Statement (Registration No. 333-168014) on Form S-1 filed on August 17, 2010). |
||
10.8† |
Incentive Stock Option Agreement, dated October 12, 2009, between Body Central Acquisition Corp. and Beth Angelo (incorporated by reference from Amendment No. 1 to the Registration Statement (Registration No. 333-168014) on Form S-1 filed on August 17, 2010). |
||
10.9† |
Employment Agreement dated November 27, 2007, among Body Shop of America, Inc., Catalogue Ventures, Inc. and Richard L. Walters (incorporated by reference from Amendment No. 3 to the Registration Statement (Registration No. 333-168014) on Form S-1 filed on September 30, 2010). |
||
10.10† |
Amendment No. 1 to Employment Agreement dated November 27, 2007, among Body Shop of America, Inc., Catalogue Ventures, Inc. and Richard L. Walters (incorporated by reference from Registration Statement on Form S-1 (Registration No. 333-171898) filed on January 27, 2011). |
||
10.11† |
Form of Employment Agreement between Body Central Acquisition Corp. and Beth Angelo (incorporated by reference from Amendment No. 3 to the Registration Statement (Registration No. 333-168014) on Form S-1 filed on September 30, 2010). |
||
10.12† |
Employment Agreement, dated July 8, 2009, among Body Central Acquisition Corp., Body Shop of America, Inc., Catalogue Ventures, Inc. and B. Allen Weinstein (incorporated by reference from Amendment No. 3 to the Registration Statement (Registration No. 333-168014) on Form S-1 filed on September 30, 2010). |
||
10.13† |
Employment Term Sheet dated June 1, 2011 between Body Central Corp. and Matthew Swartwood. |
||
10.14† |
Employment Agreement dated September 7, 2011 between Body Central Corp. and Thomas W. Stoltz (incorporated by reference to Exhibit 10.1 to Form 10-Q filed November 15, 2011). |
||
10.15† |
Amended and Restated Employment Agreement among Body Shop of America, Inc., Catalogue Ventures, Inc. and Curtis Hill, dated December 1, 2007, and Amendment No. 1 to Amended and Restated Employment Agreement, dated February 23, 2009 (incorporated by reference from Amendment No. 3 to the Registration Statement (Registration No. 333-168014) on Form S-1 filed on September 30, 2010). |
||
| Exhibit No. | Description | ||
|---|---|---|---|
| 10.16† | Form of Letter Agreement between Body Central Acquisition Corp. and Martin Doolan (incorporated by reference from Amendment No. 5 to the Registration Statement (Registration No. 333-168014) on Form S-1 filed on October 13, 2010). | ||
10.17† |
Form of Letter Agreement between Body Central Acquisition Corp. and Jerrold Rosenbaum (incorporated by reference from Amendment No. 3 to the Registration Statement (Registration No. 333-168014) on Form S-1 filed on September 30, 2010). |
||
10.18† |
Form of Restricted Stock Award Agreement under the Amended and Restated 2006 Equity Incentive Plan |
||
14.1 |
Code of Business Conduct and Ethics (incorporated by reference from Amendment No. 3 to the Registration Statement (Registration No. 333-168014) on Form S-1 filed on September 30, 2010). |
||
21.1 |
List of Subsidiaries. |
||
23.1 |
Consent of PricewaterhouseCoopers LLP, independent registered certified public accounting firm |
||
31.1 |
Certification of Chief Executive Officer pursuant to Section 302 of the Sarbanes-Oxley Act of 2002. |
||
31.2 |
Certification of Chief Financial Officer pursuant to Section 302 of the Sarbanes-Oxley Act of 2002. |
||
32.1 |
Certification of Chief Executive Officer pursuant to Section 906 of the Sarbanes-Oxley Act of 2002. |
||
32.2 |
Certification of Chief Financial Officer pursuant to Section 906 of the Sarbanes-Oxley Act of 2002. |
||
101* |
Interactive Data Files* |
||
101.INS* XBRL Instance Document |
|||
101.SCH* XBRL Taxonomy Extension Schema Document |
|||
101.CAL* XBRL Taxonomy Extension Calculation Linkbase Document |
|||
101.DEF* XBRL Taxonomy Definition Linkbase Document |
|||
101.LAB* XBRL Taxonomy Extension Label Linkbase Document |
|||
101.PRE* XBRL Taxonomy Extension Presentation Linkbase Document. |
|||
- †
- Indicates
a management contract or compensatory plan or arrangement.
- *
- Pursuant to Rule 406T of Regulation S-T, these interactive data files are deemed not filed or part of a registration statement or prospectus for purposes of Sections 11 or 12 of the Securities Act of 1933 or Section 18 of the Securities Exchange Act of 1934 and otherwise are not subject to liability.