Attached files
| file | filename |
|---|---|
| EX-31.1 - EX-31.1 - MOCON INC | a2208100zex-31_1.htm |
| EX-23.1 - EX-23.1 - MOCON INC | a2208100zex-23_1.htm |
| EX-10.9 - EX-10.9 - MOCON INC | a2208100zex-10_9.htm |
| EX-21.1 - EX-21.1 - MOCON INC | a2208100zex-21_1.htm |
| EX-10.13 - EX-10.13 - MOCON INC | a2208100zex-10_13.htm |
| EX-10.14 - EX-10.14 - MOCON INC | a2208100zex-10_14.htm |
| EXCEL - IDEA: XBRL DOCUMENT - MOCON INC | Financial_Report.xls |
| EX-32.2 - EX-32.2 - MOCON INC | a2208100zex-32_2.htm |
| EX-31.2 - EX-31.2 - MOCON INC | a2208100zex-31_2.htm |
| EX-32.1 - EX-32.1 - MOCON INC | a2208100zex-32_1.htm |
Use these links to rapidly review the document
Table of Contents
UNITED STATES
SECURITIES AND EXCHANGE COMMISSION
Washington, D.C. 20549
FORM 10-K
| (Mark one) | ||
ý |
ANNUAL REPORT UNDER SECTION 13 OR 15(d) OF THE SECURITIES EXCHANGE ACT OF 1934 |
|
For the fiscal year ended December 31, 2011 |
||
o |
TRANSITION REPORT UNDER SECTION 13 OR 15(d) OF THE SECURITIES EXCHANGE ACT OF 1934 |
|
For the transition period from to .
Commission File No.: 000-09273
MOCON, Inc.
(Exact name of registrant as specified in its charter)
| Minnesota (State or other jurisdiction of incorporation or organization) |
41-0903312 (I.R.S. Employer Identification No.) |
|
7500 Mendelssohn Avenue North Minneapolis, Minnesota (Address of principal executive offices) |
55428 (Zip Code) |
Registrant's telephone number, including area code: (763) 493-6370
Securities registered under Section 12(b) of the Act:
| Title of each class | Name of each exchange on which registered | |
|---|---|---|
| Common Stock, par value $0.10 per share | The NASDAQ Stock Market LLC (NASDAQ Global Market) |
Securities registered under Section 12(g) of the Act: None
Indicate by check mark if the registrant is a well-known seasoned issuer, as defined in Rule 405 of the Securities Act. YES o NO ý
Indicate by check mark if the registrant is not required to file reports pursuant to Section 13 or Section 15(d) of the Act. YES o NO ý
Indicate by check mark whether the registrant (1) has filed all reports required to be filed by Section 13 or 15(d) of the Securities Exchange Act of 1934 during the preceding 12 months (or for such shorter period that the registrant was required to file such reports), and (2) has been subject to such filing requirements for the past 90 days. YES ý NO o
Indicate by check mark whether the Registrant has submitted electronically and posted on its corporate Web site, if any, every Interactive Data File required to be submitted and posted pursuant to Rule 405 of Regulation S-T (§232.405 of this chapter) during the preceding 12 months (or for such shorter period that the Registrant was required to submit and post such files). Yes ý No o
Indicate by check mark if disclosure of delinquent filers pursuant to Item 405 of Regulation S-K (§229.405 of this chapter) is not contained herein, and will not be contained, to the best of registrant's knowledge, in definitive proxy or information statements incorporated by reference in Part III of this Form 10-K or any amendment to this Form 10-K. ý
Indicate by check mark whether the registrant is a large accelerated filer, an accelerated filer, a non-accelerated filer, or a smaller reporting company. See the definitions of "large accelerated filer," "accelerated filer," and "smaller reporting company" in Rule 12b-2 of the Exchange Act.
| Large accelerated filer o | Accelerated filer ý | Non-accelerated filer o (do not check if a smaller reporting company) |
Smaller reporting company o |
Indicate by check mark whether registrant is a shell company (as defined in Rule 12b-2 of the Act). YES o NO ý
The aggregate market value of the registrant's common stock, excluding outstanding shares beneficially owned by directors and executive officers, computed by reference to the price at which the common stock was last sold as of June 30, 2011 (the last business day of the registrant's second quarter) as reported by the Nasdaq Global Market System, was $77,049,164.
As of March 12, 2012, 5,470,898 shares of common stock of the registrant were deemed outstanding.
DOCUMENTS INCORPORATED BY REFERENCE
Part III of this annual report on Form 10-K incorporates by reference information (to the extent specific sections are referred to herein) from the registrant's Proxy Statement for its 2012 Annual Meeting of Shareholders to be held May 24, 2012.
This annual report on Form 10-K contains or incorporates by reference not only historical information, but also forward-looking statements within the meaning of Section 27A of the Securities Act of 1933, as amended, and Section 21E of the Securities Exchange Act of 1934, as amended, and are subject to the safe harbor created by those sections. We refer you to the information under the heading "Part I. Item 1. Business—Forward-Looking Statements."
As used in this annual report on Form 10-K, references to "MOCON," the "Company," "we," "our" or "us," unless the context otherwise requires, refer to MOCON, Inc. and our subsidiaries.
All trademarks or trade names referred to in this report are the property of their respective owners.
MOCON, Inc. designs, manufactures, markets and services products, and provides consulting services, primarily in the test and measurement, analytical instrument and services markets. Our products include instruments that detect, measure and monitor gases and other chemical compounds which help our customers improve the quality of their products, as well as develop new products.
Our gas and vapor permeation instruments were first used in the food packaging industry, starting in the 1970s, to measure small amounts of moisture which can adversely affect dry cereals and other food packaging. Today our core business, the detection, measurement and analysis of vapors and gases, serves industries far beyond food packaging. Our products serve markets such as foods, beverages, pharmaceuticals and consumer products, oil and gas exploration and industrial and environmental safety. For example, our newest analyzers measure the parameters necessary to predict the safe shelf life of packaged foods. This effort, together with others, has allowed us to enter the food and beverage safety markets worldwide.
Our principal business strategy is to employ our product development and technological capabilities, manufacturing processes and sales and marketing skills where we can successfully penetrate the market and become a leader in the segment. Our management team continually emphasizes product innovation, product performance, quality improvements, cost reductions and other value-adding activities. We seek growth opportunities through technological and product improvement, by acquiring and developing new products, by acquiring companies or new product lines, or purchasing the rights to existing technologies.
MOCON, Inc. was incorporated as a Minnesota corporation in February 1966, and was initially involved in the commercialization of technology developed for the measurement of water vapor permeating through food packaging materials. Today, the key drivers in the industries we serve are food and beverage product safety and quality, improving workplace safety, supplying testing equipment for oil and gas exploration, and analyzing the quality of air both indoors and outdoors.
Historically, a significant portion of our sales has come from international customers. In recognition of the importance of our international customers, we maintain a physical presence in Europe through our wholly-owned subsidiary, Paul Lippke Handels-GmbH, located in Neuwied, Germany, and in Asia through a sales, service and laboratory facility in Shanghai, China.
Our current plans for growth include continued substantial funding for research and development to foster new product development and to pursue strategic acquisitions and investments where appropriate. In this regard, on March 9, 2012, we entered into an agreement to acquire PBI-Dansensor A/S (Dansensor) for approximately $20,000,000. Dansensor is a manufacturer of specialized instrumentation for Modified Atmosphere Packaging (MAP) of foods, beverages, pharmaceuticals and other perishable items. We currently expect to complete this acquisition on April 2, 2012.
2
Our principal executive offices and worldwide headquarters are located at 7500 Mendelssohn Avenue North, Minneapolis, Minnesota 55428 USA, and our telephone number is (763) 493-6370. Our website address is www.mocon.com. The information contained on our website or connected to our website is not incorporated by reference into this annual report on Form 10-K and should not be considered part of this report.
We make available, free of charge on our website, our annual reports on Form 10-K, quarterly reports on Form 10-Q, current reports on Form 8-K, and amendments to those reports filed or furnished pursuant to Section 13(a) or 15(d) of the Securities Exchange Act of 1934, as amended, as soon as reasonably practicable after we electronically file such material with, or furnish it to, the Securities and Exchange Commission. We also make available, free of charge and through our website, to any shareholder who requests, the charters of our board committees and our Code of Ethics. Requests for copies can be directed to our Chief Financial Officer at the address and phone number above.
Products and Services
We develop, manufacture, market and service test and measurement, analytical and monitoring instruments and systems used to detect, measure and analyze gases and other chemical compounds, as well as providing related consulting services. Please see our consolidated financial statements beginning on page F-1 for financial information concerning our business, including our sales, net income and net assets. Our sales are grouped into four major categories as discussed below.
Permeation Products and Services
Our permeation products consist of systems and services that measure the rate at which various gases and vapors transmit through a variety of materials. These products perform measurements under precise temperature, pressure and relative humidity conditions. The principal market for these products consists of manufacturers of packaging materials, including manufacturers of papers, plastic films, coatings and containers and the users of such packaging materials, such as companies in the food, beverage, pharmaceutical and consumer product industries. Other customers include manufacturers of displays, solar panels, fuel cells, and many other sophisticated materials.
We also provide certain laboratory testing services to companies that have a need for permeation data. These services consist primarily of testing film and package permeation for companies that:
- •
- wish to outsource their testing needs to us;
- •
- are interested in evaluating our instrumentation prior to purchase; or
- •
- have purchased our products but have a need for additional capacity.
Our permeation products and services accounted for approximately 59%, 57% and 57% of our consolidated sales in 2011, 2010 and 2009, respectively. Permeation instruments that we currently manufacture include OX-TRAN® systems for oxygen transmission rates, PERMATRAN-W® systems for water vapor transmission rates, and PERMATRAN-C® systems for carbon dioxide transmission rates. Our AQUATRAN® ultra-high sensitivity, trace moisture permeation analyzer has been increasingly accepted as the standard test instrument of choice in the flat panel, solar cell and electronics industries. Our systems are available in a wide range of options for our customers, including high or low throughput, price, sensitivity and ease of use. They are primarily marketed to research and development departments, as well as production and quality assurance groups.
3
Gas Analyzer Instruments, Sensors and Detectors
Our Baseline-MOCON, Inc. subsidiary located near Boulder, Colorado offers advanced gas analysis and monitoring instrumentation used in applications such as oil and gas exploration, process gas analysis, industrial hygiene and safety, environmental air monitoring and indoor air quality.
In this group, we manufacture and sell two types of gas analyzer instruments: gas chromatographs (GCs) and total hydrocarbon analyzers (THA's). These instruments are typically installed in fixed locations at the monitoring sites and perform their functions of detecting and measuring various hydrocarbons continually or at regular intervals. We also make gas sensors and detectors which are sold to original equipment manufacturers (OEMs) of mobile gas safety equipment.
Our gas analyzer instruments, sensors and detectors are for use in industrial hygiene (detection of hazardous gases in the workplace), hydrocarbon gas analysis for oil and gas exploration, contaminant detection in the manufacture of specialty gases, and environmental monitoring (tracking the release, or the presence, of toxic substances). These substances can include the intentional release of toxic gases by terrorists which would be a homeland security application. Our newest GC offering measures trace levels of contaminants in beverage grade carbon dioxide which is used to carbonate soft drinks, beer and water.
Our gas analyzer instruments, sensors and detectors accounted for approximately 18% of our consolidated sales in each of the years 2011, 2010 and 2009, respectively. We market some of these products under the names BEVALERT®, PETROALERT®, and piD-TECH®.
Package Testing Products and Services
We manufacture and sell two primary products in this group—headspace analyzers and leak detection equipment. Our headspace analyzer products are used to analyze the amount and type of gas present in the headspace of flexible and rigid packages, as applied to gas flushing in modified or controlled atmosphere packaging. The principal market for these products consists of packagers of foods, beverages and pharmaceuticals. Our headspace analyzer products include the PAC CHECK® series of off-line headspace analyzers and the GSA™ series of on-line gas stream analyzers for continuous and intermittent monitoring of modified atmosphere packaging (MAP) and other gas flushing operations.
Our leak detection products detect leaks in sterile medical trays, food pouches, blister packs and a wide range of other sealed packages. We currently manufacture three types of leak detection instruments. The first type is a non-destructive leak detector that senses small amounts of carbon dioxide escaping from a package or tray. The second type of instrument detects leaks and checks for seal integrity by applying and measuring pressure within a package. The third type pulls a vacuum on a package and looks for vacuum or gas flow changes. The principal markets for these products are packagers of sterile medical items, pharmaceuticals and food products.
Our packaging products and services group accounted for 16%, 16% and 18% of our consolidated sales in 2011, 2010 and 2009, respectively. We market these products under the names PAC CHECK®, LIPPKE®, SKYE® and PAC GUARD®.
Other Instruments and Services
Consulting and Analytical Services
We provide consulting and analytical services, on a special project basis, for customers that require custom solutions to unique problems. Services that we typically provide relate to:
- •
- absorption or diffusion of various compounds;
4
- •
- shelf-life concerns;
- •
- flavor or odor identification; or
- •
- other special permeation applications.
The principal markets for our consulting and analytical services consist of manufacturers of foods, beverages, pharmaceuticals, plastics, chemicals, electronics and personal care products.
Gas Chromatography Analyzer Products and Services
We sell various gas chromatographic (GC) instruments and provide services with an emphasis on multidimensional gas chromatography through our Microanalytics Instrumentation Corp. (Microanalytics) subsidiary, which is located near Austin, Texas. A variety of GC specific applications have been developed by Microanalytics, ranging from petroleum and petrochemical purity assay to aroma and off-odor analysis for the food, beverage, packaging and other industries. We integrate GCs and components that we purchase from third parties to form multidimensional GC analyzer systems. These GC analyzers represent state-of-the-art technology in gas chromatographic separations and are used in identifying compounds causing off-odors in various products, in identifying critical aroma compounds, and in high purity analysis of single component matrixes. Our GC analyzer products include the AROMATRAX® systems for odor and aroma analysis and profiling. The principal markets for our GC analyzer products consist of food, beverage, pharmaceutical, petroleum, chemical and petrochemical manufacturers.
Weighing and Pharmaceutical Products and Services
Our weighing products automatically determine the weight of pharmaceutical capsules and tablets and reject those that are out of acceptable limits. Our VERICAP™ high-speed capsule weighing system runs at rates up to 2,000 capsules per minute and can be integrated into a capsule production line in pharmaceutical factories. Our AB™ automatic balance weighing systems are designed for off-line use for both tablets and capsules, and we market these products primarily to the pharmaceutical industry. In addition, we sell tablet inspection systems and blister packaging-related equipment through our Lippke subsidiary, which also sells products of other manufacturers.
Food Safety Products
Our food safety products are designed to automatically detect microbial contamination in food and beverage samples. Using the total viable count (TVC) method, our GreenLight series of instruments perform rapid and precise measurements of bacterial load in raw meats, poultry, seafood, dairy and produce samples. There are three models of the GreenLight instrument available with the Model 930 being released in July 2011.
Our other instruments and services groups accounted for an aggregate of approximately 7%, 9% and 7% of our consolidated sales in each of the years 2011, 2010 and 2009.
Competition
We have several competitors for all of our products and services in both foreign and domestic markets. The principal competitive factors for our products and services are:
- •
- product quality and performance;
- •
- product reliability;
- •
- product support; and
- •
- price.
5
We compete with a variety of companies in each market in which we sell our products. Some of our competitors have greater assets and resources than we do, and some are smaller than we are. To remain competitive, we must continue to invest in research and development, marketing, customer service and support, and manage our operating expenses. We believe that we have strategies in place to develop technological and other advantages that will give us a competitive advantage over our competitors. However, there can be no assurance that we will have sufficient resources to execute these strategies, or that our competitors will not develop new technologies or other advantages which would require us to reduce our prices, result in lost orders or otherwise adversely affect our financial results.
Manufacturing and Supplies
We manufacture products at our locations in Minnesota, Texas, Colorado and Germany. Our manufacturing capabilities include electro-mechanical assembly, testing, integration of components and systems, calibration and validation of systems. Certain components that we use in our products are currently purchased from single source suppliers. Although we maintain an inventory of these components, an interruption or delay in supply from one of these sources could result in delays in our production while we locate an alternative supplier, which in turn could result in a loss of sales and income.
Patents, Trademarks and Other Intellectual Property Rights
We believe that the protection afforded us by our patent rights is important to our business, and we will continue to seek patent protection for our technology and products. We require all of our employees and consultants to assign to us all inventions that are conceived and developed during their employment, except to the extent prohibited by applicable law. To protect our proprietary information, we have entered into confidentiality and non-compete agreements with those of our employees and consultants who have access to sensitive information. We hold both United States and international patents and have U.S. and international patents pending. We currently hold 40 active U.S. patents and 34 foreign patents which will expire during the period from 2012 through 2029, and have another 55 patents pending. We do not believe that the expiration of our patents on their scheduled expiration dates will have a material adverse effect on our business.
We own, have the right to use, or have applied for certain trademarks which protect and identify our products. Our trademarks and service marks include the following registered marks: MOCON®, APCHECK®, AQUATRACE®, AQUATRAN®, AROMATRAN®, AROMATRAX®, BASELINE®, BEVALERT®, CALCARD®, CAL-SMART®, COULOX®, FLO SMART®, GREENLIGHT®, HERSCH®, LIPPKE®, LIQUI-BLOK®, MICROANALYTICS®, MULTICHECK®, OPTECH®, OX-TRAN®, PAC CHECK®, PAC GUARD®, PERMATRAN-C®, PERMATRAN-W®, PETROALERT®, piD-TECH®, QUICK START®, SKYE® and VOC-TRAQ®. Our trademarks and service marks have a life of 5 to 20 years, and are subject to periodic maintenance which may be extended in accordance with applicable law.
Marketing and Customers; Distribution Methods
We market our products and services throughout the United States and in over 60 foreign markets. We use a direct sales force of approximately 25 employees and approximately 20 independent sales representatives to market and sell our products and services to end users in the United States, Canada, Germany and China, and use a network of approximately 50 independent sales representatives to market, service and sell our products and services in other foreign countries. To our knowledge, none of our independent sales representatives sell a material amount of product manufactured by any of our competitors.
6
For information concerning our export sales by geographic area, see Note 13 of the notes to consolidated financial statements. We market products and services to research laboratories, production departments and quality control groups in the life science, medical, food, pharmaceutical, plastics, paper, electronics, oil and gas and other industries. One independent representative accounted for approximately 10% of our consolidated sales in 2010, and another independent representative accounted for 6% in 2009. We do not believe that the loss of any single customer would have a material adverse effect on our business or financial performance.
Backlog
As of December 31, 2011, our total backlog was $4,685,976 for all of our products as compared to $6,055,065 and $2,440,794 as of December 31, 2010 and 2009, respectively. The decrease in backlog at the end of 2011 was due primarily to an unprecedented order volume received in the last quarter of 2010, which did not repeat in 2011. We anticipate shipping the majority of the current backlog in 2012.
Research and Development
We are committed to an ongoing engineering program dedicated to innovating new products and improving the quality and performance of our existing products. Our engineering expenses are primarily incurred in connection with the improvement of existing products, cost reduction efforts, and the development of new products that may have additional applications or represent extensions of existing product lines. None of these costs are borne directly by our customers.
We incurred expenses of $2,402,566, $2,135,365 and $1,847,993 during the fiscal years ended December 31, 2011, 2010 and 2009, respectively, for research and development (R&D) of our products. These amounts were approximately 6% to 7% of our consolidated sales for each of those three fiscal years. On an annual basis, we currently intend to spend approximately 6% to 8% of our consolidated sales on R&D in the future.
Working Capital Practices
We strive to maintain a level of inventory that is appropriate given our projected sales. Our standard domestic payment terms are net 30 days and our international payment terms vary but generally range between 30 and 90 days. International sales are, in some cases, transacted pursuant to letters of credit.
Seasonality
Our business is not seasonal in nature.
Employees
As of December 31, 2011, we had approximately 150 full-time employees. Included in this total are approximately 20 scientists and engineers who research and develop potential new products. None of our employees are represented by a labor union, and we consider our employee relations to be satisfactory.
7
Executive Officers of the Registrant
Our executive officers, their ages and their offices held, as of March 12, 2012 are as follows:
| Name | Age | Title | |||
|---|---|---|---|---|---|
Robert L. Demorest |
66 | Chairman of the Board, President and Chief Executive Officer, MOCON, Inc. | |||
Daniel W. Mayer |
61 |
Executive Vice President, MOCON, Inc. |
|||
Darrell B. Lee |
63 |
Vice President, Chief Financial Officer, Treasurer and Secretary, MOCON, Inc. |
|||
Douglas J. Lindemann |
54 |
Vice President and General Manager, MOCON, Inc. |
|||
Robert E. Forsberg |
56 |
President, Baseline-MOCON, Inc. |
|||
There are no family relationships among any of our directors and executive officers. Information regarding the business experience of our executive officers is set forth below.
Mr. Robert L. Demorest has been our President, Chief Executive Officer, and Chairman of the Board since April 2000. Mr. Demorest is also a director of Marten Transport, Ltd., a publicly traded company.
Mr. Daniel W. Mayer has been an Executive Vice President for us since January 1995.
Mr. Darrell B. Lee has been our Chief Financial Officer, Vice President, Treasurer and Secretary for more than five years.
Mr. Douglas J. Lindemann has been a Vice President and General Manager for more than five years.
Mr. Robert E. Forsberg has been the President of Baseline-MOCON, Inc. for more than five years.
Forward-Looking Statements
This Annual Report on Form 10-K contains or incorporates by reference not only historical information, but also forward-looking statements within the meaning of Section 27A of the Securities Act of 1933, as amended, and Section 21E of the Securities Exchange Act of 1934, as amended, and are subject to the safe harbor created by those sections. In addition, we or others on our behalf may make forward-looking statements from time to time in oral presentations, including telephone conferences and/or web casts open to the public, in press releases or reports, on our website or otherwise. All statements other than statements of historical facts included in this Annual Report on Form 10-K that address activities, events or developments that we expect, believe or anticipate will or may occur in the future are forward-looking statements including, in particular, the statements about our plans, objectives, strategies and prospects regarding, among other things, our financial condition, results of operations, addressable market size estimates and business. We have identified some of these forward-looking statements with words like "believe," "may," "could," "might," "forecast," "possible," "potential," "project," "will," "should," "expect," "intend," "plan," "predict," "anticipate," "estimate," "approximate" or "continue" and other words and terms of similar meaning. These forward-looking statements may be contained in the notes to our consolidated financial statements and elsewhere in this
8
Annual Report on Form 10-K, including under the heading "Management's Discussion and Analysis of Financial Condition and Results of Operations."
Forward-looking statements involve risks and uncertainties. These uncertainties include factors that affect all businesses as well as matters specific to us. The following are some of the uncertainties and factors known to us that could cause our actual results to differ materially from what we have anticipated in our forward-looking statements: successfully competing against our competitors; acceptance, endorsement, and use of our products; technological changes and product obsolescence; our ability to identify acquisition candidates and successfully integrate the operations of those acquisitions into our existing operations; the impact of worldwide economic conditions on our operations; the disruption in global financial markets and the potential impact on the ability of our counterparties to perform their obligations and our ability to obtain future financing; factors impacting the stock market and share price; ability of our manufacturing facilities to meet customer demand; reliance on single source suppliers; loss or impairment of a principal manufacturing facility; regulatory matters; timing and success of new product introductions; adequate protection of our intellectual property rights; product liability claims; and currency and other economic risks inherent in selling our products internationally.
For more information regarding these and other uncertainties and factors that could cause our actual results to differ materially from what we have anticipated in our forward-looking statements or otherwise could materially adversely affect our business, financial condition or operating results, refer to this Annual Report on Form 10-K under Part I, Item 1A, "Risk Factors."
All forward-looking statements included in this Annual Report on Form 10-K are expressly qualified in their entirety by the foregoing cautionary statements. We wish to caution readers not to place undue reliance on any forward-looking statement that speaks only as of the date made and to recognize that forward-looking statements are predictions of future results, which may not occur as anticipated. Actual results could differ materially from those anticipated in the forward-looking statements and from historical results, due to the risks and uncertainties described in this Annual Report on Form 10-K under the heading "Item 1A. Risk Factors" below, as well as others that we may consider immaterial or do not anticipate at this time. Although we believe that the expectations reflected in our forward-looking statements are reasonable, we do not know whether our expectations will prove correct. The expectations reflected in our forward-looking statements can be affected by inaccurate assumptions we might make or by known or unknown risks and uncertainties, including those described below under the heading "Item 1A. Risk Factors." The risks and uncertainties described under the heading "Item 1A. Risk Factors" below are not exclusive and further information concerning us and our business, including factors that potentially could materially affect our financial results or condition, may emerge from time to time. We assume no obligation to update forward-looking statements to reflect actual results or changes in factors or assumptions affecting such forward-looking statements. We advise you, however, to consult any further disclosures we make on related subjects in our quarterly reports on Form 10-Q and current reports on Form 8-K we file with or furnish to the Securities and Exchange Commission.
9
The following are significant factors known to us that could have material adverse effects on our business, financial condition or operating results and should be considered carefully in connection with any evaluation of an investment in our common stock. Additionally, the following risk factors could cause our actual results to materially differ from those reflected in any forward-looking statements.
If economic conditions decline, companies may reduce their capital spending which could adversely affect our business, operating results and financial condition.
The Company's operations and performance depend significantly on worldwide economic conditions. Uncertainty about global economic conditions poses a risk as consumers and businesses postpone spending in response to tighter credit, unemployment, negative financial news and/or declines in income or asset values, which could have a material negative effect on demand for the Company's products and services. Our customers include pharmaceutical, food, medical and chemical companies, laboratories, government agencies and public and private research institutions. The capital spending of these entities can have a significant effect on the demand for our products. Decreases in capital spending by any of these customer groups could have a material adverse effect on our sales, business and results of operations.
Further, our customers' and independent representatives' ability to borrow money from their existing lenders or to obtain credit from other sources to purchase our products may be impaired. Although we maintain allowances for doubtful accounts for estimated losses resulting from the inability of our customers to make required payments and such losses have historically been within our expectations and the provisions established, we cannot guarantee that we will continue to experience the same loss rates that we have in the past, especially given the current turmoil in the worldwide economy. A significant change in the liquidity or financial condition of our customers could cause unfavorable trends in our receivable collections and additional allowances may be required, which could adversely affect our operating results. If investors have concerns that our business, operating results and financial condition will be negatively impacted by a worldwide economic downturn, our stock price could decrease.
If we fail to complete the acquisition of PBI-Dansensor (Dansensor), if we complete our planned acquisition of Dansensor and the financial performance of this company falls below expectations or if we fail to effectively integrate Dansensor with the rest of our organization, our operating results could be negatively impacted.
On March 9, 2012, we signed an acquisition agreement to acquire Dansensor for approximately $20,000,000. Dansensor is a manufacturer of specialized instrumentation for Modified Atmosphere Packaging (MAP) of foods, beverages, pharmaceuticals, and other perishable items. While we expect to complete this acquisition on or about April 2, 2012, the closing is subject to various conditions and if the conditions are not met, then we may not complete this acquisition and we will have spent substantial funds on pursuing this acquisition for which we will not receive any benefit.
If we do complete this acquisition, it will be the largest acquisition we have completed in our history. We made this acquisition based on the financial and strategic benefits of the acquisition that we expect to realize. Realizing these benefits could come with risks, which may include:
- •
- diversion of our management's attention from our core businesses;
- •
- difficulties in assimilating the operations and products of Dansensor and difficulties in realizing projected
efficiencies, cost savings and revenue synergies;
- •
- potential loss of key employees or customers of Dansensor or adverse effects on existing business relationships with suppliers and customers;
10
- •
- the indebtedness we will incur in connection with the indebtedness could in turn restrict our ability to access additional
capital when needed or to pursue other important elements of our business strategy; and
- •
- unexpected and undisclosed, contingent or other liabilities or problems.
If we fail to successfully integrate Dansensor, if the acquisition fails to meet our expectations or if there are events or changes in circumstances that adversely affect the value of this acquisition, then any intangibles or long-lived assets resulting from the acquisition of Dansensor may be deemed "impaired". If there are events or changes in circumstances that might adversely affect the value of Dansensor, we must assess whether the amount of this acquisition reflected on the balance sheet exceeds its fair value. Any write-down will reduce our reported net income and could possibly have a negative effect on our stock price.
In connection with the expected acquisition of Dansensor, we intend to enter into a credit agreement with Wells Fargo Bank. We expect the credit agreement will contain certain financial covenants, including financial covenants that require us to maintain a financial ratio that is impacted by the dividends we pay. We also expect that the credit agreement will contain certain operating covenants, including operating covenants that restrict future acquisitions that we can complete. If we are unable to meet the financial, operating or other covenants under the loan agreement and cannot negotiate waivers or amendments of the covenants, we may not be able to pay dividends or could be in default under the loan agreement, which would give Wells Fargo Bank a range of remedies, including declaring all outstanding debt to be due and payable and foreclosing on the assets securing the loan agreement.
At the same time we entered into the acquisition agreement to acquire Dansensor, we executed a commitment letter with Wells Fargo Bank. This commitment letter contemplates we will enter into a credit agreement that provides for a combination of a secured revolving credit line for $5.0 million and secured term debt for $3.5 million, each with a maturity of four years. The loan agreement will require us to maintain certain financial ratios, one of which is affected by the amount of dividends we pay. We may be required to reduce, or eliminate, the amount of dividends we pay to maintain this ratio. Although we currently believe that we will be able to pay dividends consistent with past practice without falling below the applicable ratio, there can be no guarantee that this will be the case. We believe that the price of our common stock would be negatively impacted if we reduced or eliminated our dividend payments.
In addition, we expect to be subject to certain operating covenants in the loan agreement which could limit our ability to conduct our business and respond to changing economic and business conditions and may place us at a competitive disadvantage relative to other companies that are subject to fewer restrictions. For example, pursuing acquisitions has been a part of our growth strategy. Under the loan agreement, we are restricted from doing certain acquisitions. Therefore, transactions that we may view as important opportunities such as acquisitions, will be subject to the consent of Wells Fargo Bank, which consent may be withheld or granted subject to conditions specified at the time. We also expect to be prohibited from repurchasing shares of our common stock without the consent of Wells Fargo Bank.
Under the loan agreement, we will grant to Wells Fargo a lien on all of our assets other than the shares of Dansensor we expect to acquire. We expect that the loan agreement will contain customary events of default, including, among others, the failure to comply with certain covenants or other agreements. We expect that upon the occurrence and during the continuation of an event of default, amounts due under the loan agreement could be accelerated by Wells Fargo Bank and Wells Fargo Bank could foreclose on our assets, which could have a material adverse effect on us.
11
In connection with the expected acquisition of Dansensor, we will enter into a financing agreement with the seller, PBI Holding A/S. Our obligations under the seller financing agreement will be secured by the shares of Dansensor that we acquire. If we fail to pay amounts due under the seller financing agreement on time or violate any of the provisions of this seller financing agreement, PBI Holding will have a range of remedies, including declaring all outstanding debt to be due and payable under the seller financing agreement and foreclosing on the shares of Dansensor.
If we close on the acquisition of Dansensor, we will enter into a loan agreement with PBI Holding, the seller of Dansensor, that will require us to pay approximately $6,600,000, plus interest, to PBI Holding over a four year period. To secure the performance of our obligations under this seller financing agreement, we will pledge the shares of Dansensor to PBI Holding. The seller financing agreement will prevent us from taking certain restructuring activities with respect to Dansensor until the loan to the seller is paid off, which could delay our ability to realize some expected synergies with Dansensor. If we default on our obligations under the seller financing agreement and are unable to obtain a waiver from PBI Holding, amounts due under the seller financing agreement could be accelerated by PBI Holding and they could foreclose on our shares of Dansensor, which could have a material adverse effect on us.
Some of the markets in which we operate have experienced minimal growth in recent years, and our ability to increase our sales will depend in part on our ability to develop new products, develop new applications for our existing products or acquire complementary businesses and product lines.
We have identified a number of strategies that we believe will allow us to grow our business and increase our sales in markets experiencing minimal growth, including developing new products and technologies, entering new markets such as food safety, capitalizing on our relationship with Luxcel Biosciences Limited, developing new applications for our technologies, acquiring complementary businesses and product lines, and strengthening our sales force. However, we can make no assurance that we will be able to successfully implement these strategies, or that these strategies will result in the growth of our business or an increase in our sales. Acquisitions that we may find attractive may be subject to the consent of Wells Fargo Bank under the loan agreement we intend to execute with them.
If we fail to attract and retain qualified managerial and technical personnel, we may fail to remain competitive.
Our future success depends, in significant part, upon the continued service and performance of our senior management and other key personnel. We rely on knowledgeable, experienced and skilled technical personnel, particularly engineers, scientists and service personnel, to design, assemble, sell and service our products. The loss of the services of our management team, some of whom have significant experience in our industry, and other key personnel could impair our ability to effectively manage our company and to carry out our business plan. Our inability to attract or retain qualified personnel could have a significant negative effect and thereby materially harm our business and financial condition.
If future operating results of Luxcel Biosciences Limited (Luxcel) do not meet our expectations, there is the possibility that our investment in this affiliated company could be deemed to be impaired, and thus a potential write-down may be warranted.
In January 2010, we acquired a minority equity interest in Luxcel for €2,500,000 (approximately $3,625,000). This investment is carried on our consolidated balance sheet at historical cost, adjusted only for currency fluctuations. We periodically assess this equity investment for impairment. If there are events or changes in circumstances that might adversely affect the value of this investment, we must assess whether the amount of this investment reflected on the balance sheet exceeds its fair value. Any write-down will reduce our reported net income and could possibly have a negative effect on our stock price.
12
We face risks of technological changes that may render our products obsolete.
The markets for our products and services are characterized by technological change and evolving industry standards. As a result of such changes and evolving standards, our products may become noncompetitive or obsolete and we may have to develop new products in order to maintain or increase our sales. New product introductions that are responsive to these factors require significant planning, design, development and testing at the technological, product and manufacturing process levels, and we may not be able to timely develop new products. In addition, industry acceptance of new technologies that we may develop may be slow due to, among other things, existing regulations or standards written specifically for older technologies and general unfamiliarity of users with new technologies. As a result, any new products that we may develop may not generate any meaningful sales or profits for us for a number of years, if at all.
A significant portion of our sales are generated from foreign countries and selling in foreign countries entails a number of risks which could result in a decrease in our sales or an increase in our operating expenses.
Sales outside the United States accounted for approximately 56% of our sales in each of the three years 2011, 2010, and 2009. We expect that foreign sales will continue to account for a significant portion of our revenues in the future, and the percentage of sales outside the United States will increase following our planned acquisition of Dansensor. Sales to customers in foreign countries are subject to a number of risks including, among others:
- •
- agreements may be difficult to enforce;
- •
- receivables may be difficult to collect;
- •
- certain regions may experience political unrest and conflict and economic instability;
- •
- foreign customers may have longer payment cycles;
- •
- the countries into which we sell may impose tariffs or adopt other restrictions on foreign trade;
- •
- currency fluctuations could reduce reported profitability in future periods;
- •
- fluctuations in exchange rates may affect product demand;
- •
- legal and regulatory requirements may be difficult to monitor and comply with, especially if inconsistent with U.S. laws
and regulations;
- •
- customizing products for foreign countries and managing and staffing international operations may lead to increased costs;
and
- •
- protection of intellectual property in foreign countries may be more difficult to enforce.
If any of these risks were to materialize, our sales into foreign countries could decline, or our operating costs could increase, which would adversely affect our financial results.
Fluctuations in foreign currency exchange rates could result in declines in our reported net sales and net earnings.
Because the functional currency of our foreign operations is the applicable local currency, we are exposed to foreign currency exchange rate risk arising from transactions in the normal course of business, such as sales to third party customers and purchases from suppliers denominated in foreign currencies. Our reported net sales and net earnings are subject to fluctuations in foreign exchange rates. Because our products are manufactured or sourced primarily from the United States, a stronger U.S. dollar generally has a negative impact on results from operations outside the United States while a weaker dollar generally has a positive effect. Our primary exchange rate exposure is with the euro. We generally do not use hedging activities to minimize the volatility associated with foreign currency exchange rate changes. If we do use such activities in the future, they also involve some risk.
13
Some of our competitors have greater resources than we do, which may provide our competitors with an advantage in the development and marketing of new products.
We currently encounter, and expect to continue to encounter, competition in the sale of our products. We believe that the principal competitive factors affecting the market for our products include product quality and performance, price, reliability and customer service. Our competitors include large multinational corporations. Some of our competitors have substantially greater financial, marketing and other resources than we do. As a result, they may be able to adapt more quickly to new or emerging technologies and changes in customer requirements, or to devote greater resources to the promotion and sale of their products than we can. In addition, competition could increase if new companies enter the market or if existing competitors expand their product lines or intensify efforts within existing product lines. Our current products, products under development and our ability to discover new technologies may be insufficient to enable us to compete effectively with our competitors.
Our reliance upon patents, domestic trademark laws, trade secrets and contractual provisions to protect our proprietary rights may not be sufficient to protect our intellectual property from others who may sell similar products.
We hold patents relating to various aspects of our products and believe that proprietary technical know-how is critical to many of our products. Proprietary rights relating to our products are protected from unauthorized use by third parties only to the extent that they are covered by valid and enforceable patents or are maintained in confidence as trade secrets. We cannot be certain that we will be issued any patents from any pending or future patent applications owned by or licensed to us or that the claims allowed under any issued patents will be sufficiently broad to protect our technology. In the absence of patent protection, we may be vulnerable to competitors who attempt to copy our products or gain access to our trade secrets and proprietary know-how. Our competitors may initiate litigation to challenge the validity of our patents, or they may use their resources to design comparable products that do not infringe our patents. We may incur substantial costs if our competitors initiate litigation to challenge the validity of our patents or if we initiate any proceedings to protect our proprietary rights. If the outcome of any such litigation is unfavorable to us, it could have a material adverse effect on our business and results of operations. There may also be pending or issued patents held by parties not affiliated with us that relate to our products or technologies and we may need to acquire licenses to any such patents to continue selling some or all of our products. If we are required to obtain any such license in order to be able to continue to sell some or all of our products, we may not be able to do so on terms that are favorable to us, if at all.
In addition, we rely on trade secrets and proprietary know-how that we seek to protect, in part, by confidentiality agreements with our collaborators, employees and consultants. These agreements may be breached and we may not have adequate remedies for any such breach. Even if these confidentiality agreements are not breached, our trade secrets may otherwise become known or be independently developed by competitors.
We rely on our management information systems for inventory management, distribution, accounting, and other functions. If our information systems fail to adequately perform these functions or if we experience an interruption in their operation, our business and results of operations could be adversely affected.
The efficient operation of our business depends on our management information systems. We rely on our management information systems to effectively manage accounting and financial functions, order entry, order fulfillment and inventory replenishment. The failure of our management information systems to perform could disrupt our business and could result in decreased sales, increased overhead costs, excess inventory and product shortages, causing our business and results of operations to suffer. In addition, our management information systems are vulnerable to damage or interruption from natural or man-made disasters, terrorist attacks, computer viruses or hackers, power loss, or other
14
computer systems, internet, telecommunications or data network failures. Any such interruption could adversely affect our business and results of operations.
We may encounter difficulties as we upgrade and evolve the capabilities of our computer systems, which could adversely impact our abilities to accomplish anticipated future cost savings and better serve our customers.
We are currently in the process of implementing a new enterprise resource planning (ERP) system which includes a major upgrade of the software used to run a number of the key processes critical to our business. If the new system does not function according to our expectations, it could adversely impact our results of operations and hinder our ability to adequately serve our customers.
The market price of our common stock has fluctuated significantly in the past and will likely continue to do so in the future and any broad market fluctuations may materially adversely affect the market price of our common stock.
The market price of our common stock has been volatile in the past, ranging from a high sales price of $17.67 and a low sales price of $11.97 during 2011, and several factors could cause the price to fluctuate substantially in the future. These factors include:
- •
- announcements of new products by us or our competitors;
- •
- quarterly fluctuations in our financial results;
- •
- merger and acquisition activity in our industry segment;
- •
- customer contract awards;
- •
- a change to the rates at which we have historically paid dividends, which could be impacted by our loan agreement with
Wells Fargo Bank;
- •
- developments in regulation; and
- •
- general economic and political conditions in the various markets where our products are sold.
In addition, the stock prices of instrumentation companies have experienced significant price and volume fluctuations that often have been unrelated to the operating performance of such companies. This market volatility may adversely affect the market price of our common stock.
Complying with securities laws and regulations is costly for us.
Changing laws, regulations and standards relating to corporate governance and public disclosure, including regulations promulgated by the SEC and Nasdaq, are creating particular challenges for smaller publicly-held companies like us. We are committed to maintaining high standards of corporate governance and public disclosure. As a result, our efforts to comply with evolving laws, regulations and standards have resulted in, and are likely to continue to result in, increased general and administrative expenses and a diversion of management time and attention from revenue-generating activities to compliance activities.
If we experience any increase in the cost of raw materials or supplies, we may experience a decrease in profit margins.
In the past, the overall cost of the materials that we purchase has not risen much more than the rate of inflation. We believe that the price of our products and the prices of our competitors' products is a significant factor affecting our customers' buying decisions and consequently, we may not be able to pass along any cost increases in raw materials and supplies in the form of price increases or sustain profit margins that we have achieved in prior years.
15
We have spent significant resources to develop new products in the food and beverage safety and packaging industries, and we have thus far only realized minimal revenues from these products.
Over the past two years we began to market our newest BevAlert system and OpTech-O2 analyzer. We believe that there are significant addressable markets for both of these products and while we believe both of these products are superior in many respects to other similar products being sold by our competitors, each one is new to the marketplace and may not gain the market acceptance necessary to allow us to capitalize on what we believe will be an increasing demand in the food and beverage industries for safety testing and monitoring products. While we have realized increasing sales of our BevAlert system and modest sales to date of our OpTech-O2 analyzer, there can be no assurance that sales of these products will continue. In August 2010, we introduced the GreenLight food safety test instrument which determines the presence or absence of bacteria in food products or ingredients. While we believe this product represents a dramatic improvement over existing technology being used in the food industry, we have not realized significant revenues to date.
If we are not able to successfully market these products, we will not recover the significant research and development and other expenses we have incurred to bring these products to market.
ITEM 1B. UNRESOLVED STAFF COMMENTS
Not applicable.
We lease an aggregate of 74,175 square feet of office, engineering, laboratory and production space in Minnesota, Texas, Germany and China. We believe that all of our facilities are generally adequate for their present operations and that suitable space is readily available if any of our leases are not extended.
In March 2010, we signed a 15-year lease for a property which replaced our former Minneapolis headquarters and operations center. The new lease commenced July 1, 2010 and is for a location consisting of approximately 60,000 square feet of space, also in Minneapolis, Minnesota. This space is leased until October 2025.
Microanalytics' operations occupy approximately 5,100 square feet of space in the metropolitan area of Austin, Texas. This space is leased until February 2013.
Lippke's operations are located in Neuwied, Germany, and occupy approximately 8,075 square feet. This space is leased until July 2018.
The MOCON (Shanghai) Trading Co., Ltd. operations are located in Shanghai, China, and occupy approximately 1,000 square feet. This space is leased until December 2012.
In addition to our leased facilities described above, we own approximately two acres of land and a building located near Boulder, Colorado that consists of approximately 9,300 square feet of office and production space in which our Baseline-MOCON, Inc. subsidiary conducts its operations.
There are no material pending legal, governmental, administrative or other proceedings to which we are a party or of which any of our property is the subject.
ITEM 4. MINE SAFETY DISCLOSURES
Not applicable.
16
ITEM 5. MARKET FOR REGISTRANT'S COMMON EQUITY, RELATED STOCKHOLDER MATTERS AND ISSUER PURCHASES OF EQUITY SECURITIES
Market Information and Dividends
Our common stock is quoted on the Nasdaq Global Market System under the symbol MOCO. The following table sets forth, for the fiscal periods indicated, the high and low sales prices for our common stock as reported by the Nasdaq Global Market System. These quotations reflect inter-dealer prices, without retail mark-up, mark-down or commission and may not necessarily represent actual transactions. The following table also sets forth, for the fiscal periods indicated, the amount of cash dividends declared on our common stock:
| |
2011 | 2010 | |||||||||||||||||
|---|---|---|---|---|---|---|---|---|---|---|---|---|---|---|---|---|---|---|---|
Fiscal Period
|
High | Low | Dividend | High | Low | Dividend | |||||||||||||
1st Quarter |
$ | 14.77 | $ | 11.97 | $ | 0.100 | $ | 11.10 | $ | 9.00 | $ | 0.095 | |||||||
2nd Quarter |
$ | 15.49 | $ | 13.91 | $ | 0.100 | 12.60 | 10.00 | 0.095 | ||||||||||
3rd Quarter |
$ | 17.67 | $ | 12.20 | $ | 0.100 | 12.90 | 10.02 | 0.095 | ||||||||||
4th Quarter |
$ | 17.00 | $ | 13.76 | $ | 0.100 | 13.85 | 11.85 | 0.095 | ||||||||||
We have paid quarterly cash dividends without interruption or decline since 1988. Cash dividends paid in 2011, 2010 and 2009 totaled $2,104,739, $1,952,872 and $1,958,750, respectively. Our Board of Directors monitors and evaluates our dividend practice quarterly, and the Board may elect at any time to increase, decrease or not pay a dividend on our common stock based upon our financial condition, results of operations, cash requirements and future prospects and other factors deemed relevant by the Board. Under the loan agreement we expect to sign with Wells Fargo Bank, we will be required to maintain certain financial ratios. One of these ratios will be impacted by the amount of dividends we pay. If paying dividends at our historical rate were to cause us to be out of compliance with this ratio, or otherwise cause us to be in breach of our covenants under our loan agreement with Wells Fargo Bank, we may be required to reduce or eliminate dividends until such time as we are able to repay our loan, regain compliance with the financial ratios and other covenants in the loan agreement, or negotiate a waiver or amendment with Wells Fargo Bank.
For information concerning securities authorized for issuance under equity compensation plans, please see Part III—Item 12.
Holders
As of March 12, 2012, there were approximately 250 holders of record and approximately 3,600 beneficial holders of our common stock.
Issuer Repurchases of Equity Securities
Other than the withholding of 2,327 shares of our common stock in connection with the cashless net exercise of stock options to pay the exercise price of such options, we did not repurchase any shares of our common stock or other equity securities of MOCON registered pursuant to Section 12 of the Securities Exchange Act of 1934, as amended, during the fourth quarter ended December 31, 2011. We currently are not authorized by our Board of Directors to make repurchases of our common stock.
Recent Sales of Unregistered Securities
During the fourth quarter and year ended December 31, 2011, we did not issue or sell any shares of our common stock or other equity securities of MOCON without registration under the Securities Act of 1933, as amended.
17
Stock Performance Graph
The following graph compares the cumulative shareholder return on MOCON's common stock to the S&P 500 Index and a peer group consisting of five companies with a market capitalization similar to MOCON. The peer companies were selected from the scientific and technical instruments industry within the technology sector. The graph compares the performance for the last five fiscal years, assuming an investment of $100 on December 31, 2006, including the reinvestment of all dividends. The peer group consists of the following companies: eMagin Corp., Transcat, Inc., Sypris Solutions, Inc., Dynasil Corporation of America and CyberOptics Corp. We picked these five companies because they operate in the same technology sector that we do and have a market capitalization similar to ours.
COMPARISON OF 5 YEAR CUMULATIVE TOTAL RETURN*
Among MOCON, Inc., the S&P 500 Index, and a Peer Group
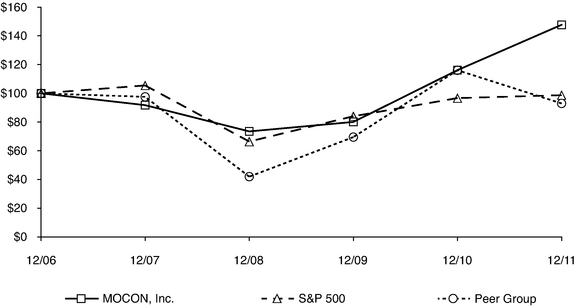
*$100 invested on 12/31/06 in stock or index, included reinvestment of dividends.
Fiscal year ending December 31.
| |
12/06 | 12/07 | 12/08 | 12/09 | 12/10 | 12/11 | |||||||||||||
|---|---|---|---|---|---|---|---|---|---|---|---|---|---|---|---|---|---|---|---|
MOCON, Inc. |
100.00 | 91.78 | 73.50 | 80.09 | 116.15 | 147.71 | |||||||||||||
S&P 500 |
100.00 | 105.49 | 66.46 | 84.05 | 96.71 | 98.75 | |||||||||||||
Peer Group |
100.00 | 97.56 | 42.00 | 69.54 | 116.09 | 92.97 | |||||||||||||
18
ITEM 6. SELECTED FINANCIAL DATA
| |
Years Ended December 31, | |||||||||||||||
|---|---|---|---|---|---|---|---|---|---|---|---|---|---|---|---|---|
| |
2011 | 2010 | 2009 | 2008 | 2007 | |||||||||||
| |
(in thousands, except per share data) |
|||||||||||||||
CONSOLIDATED STATEMENT OF INCOME DATA: |
||||||||||||||||
Sales |
$ | 37,361 | $ | 31,549 | $ | 26,638 | $ | 29,696 | $ | 27,397 | ||||||
Net income |
5,451 | 4,518 | 2,910 | 4,059 | 3,805 | |||||||||||
Net income per common share: |
||||||||||||||||
Basic |
1.02 | 0.87 | 0.54 | 0.73 | 0.69 | |||||||||||
Diluted |
0.98 | 0.84 | 0.53 | 0.72 | 0.67 | |||||||||||
Cash dividends declared per share |
0.40 | 0.38 | 0.36 | 0.34 | 0.315 | |||||||||||
| |
As of December 31, | |||||||||||||||
|---|---|---|---|---|---|---|---|---|---|---|---|---|---|---|---|---|
| |
2011 | 2010 | 2009 | 2008 | 2007 | |||||||||||
| |
(in thousands) |
|||||||||||||||
CONSOLIDATED BALANCE SHEET DATA: |
||||||||||||||||
Current assets |
$ | 23,357 | $ | 19,399 | $ | 23,706 | $ | 22,357 | $ | 21,306 | ||||||
Total assets |
39,705 | 34,339 | 30,327 | 32,953 | 29,673 | |||||||||||
Current liabilities |
6,140 | 5,632 | 4,088 | 4,464 | 3,949 | |||||||||||
Noncurrent liabilities |
325 | 298 | 257 | 271 | 339 | |||||||||||
Stockholders' equity |
33,240 | 28,409 | 25,982 | 28,218 | 25,385 | |||||||||||
19
ITEM 7. MANAGEMENT'S DISCUSSION AND ANALYSIS OF FINANCIAL CONDITION AND RESULTS OF OPERATIONS
This Management's Discussion and Analysis provides material historical and prospective disclosures intended to enable investors and other users to assess our financial condition and results of operations. Statements that are not historical are forward-looking and involve risks and uncertainties including those discussed under the heading "Item 1A. Risk Factors" and elsewhere in this Annual Report on Form 10-K. For more information, see "Part I Item 1 Business—Forward-Looking Statements" of this Annual Report on Form 10-K. The following discussion of the results of the operations and financial condition of MOCON should be read in conjunction with our consolidated financial statements and the related notes thereto included elsewhere in this Annual Report on Form 10-K.
Overview
MOCON, Inc. designs, manufactures, markets and services products and provides consulting services primarily in the measurement and analytical instrument and services markets. Our products include instruments that detect, measure and monitor gases and chemical compounds. We continually seek growth opportunities through technological and product improvement, by acquiring and developing new products, and by acquiring synergistic companies or rights to technologies.
We have three primary operating locations in the United States—Minnesota, Colorado and Texas—and foreign operations in Germany and China. We use a mix of direct sales force and independent sales representatives to market our products and services in the United States, Canada, Germany and China and use a network of independent sales representatives to market and service our products and services in other foreign countries.
Historically, a significant portion of our sales has come from international customers. In recognition of the importance of our international business, we maintain a physical presence in Europe through our wholly-owned subsidiary located in Neuwied, Germany, and in Asia through a sales, service, and laboratory facility in Shanghai, China.
Our current plans for growth include substantial funding for research and development to foster new product development together with strategic acquisitions where appropriate. To that end, on March 9, 2012, we signed an agreement to acquire PBI-Dansensor, as more fully described earlier in this report.
Significant Transactions and Financial Trends
Throughout these financial sections, you will read about significant transactions or events that materially contribute to, or reduce our earnings, and materially affect our financial results and financial position. In 2011, we experienced a significant increase in sales and net income as all three major product categories recognized higher revenues. The largest increase came in our permeation products and services group due to the emphasis being placed on sustainable packaging materials as the marketplace becomes increasingly sensitive to environmental impact issues. In 2010, we experienced a significant increase in sales and net income as global economic conditions improved. We believe that the increase in 2010 was primarily due to pent-up demand, a large order from the Chinese government and the extension of Federal tax incentives for domestic purchases of capital equipment.
Our international sales have historically accounted for a significant portion of our revenues, and we expect our international sales, as a percentage of total sales, to increase as a result of our planned acquisition of PBI-Dansensor.
20
Our research and development costs were approximately 6% of our consolidated sales in 2011, and 7% of our consolidated sales in both 2010 and 2009. On an annual basis, we intend to spend approximately 6% to 8% of our sales on research and development in the future.
While these items are important in understanding and evaluating our financial results, certain trends, such as our international sales accounting for a significant portion of our revenues, and other transactions or events such as those discussed later in this Management's Discussion and Analysis, may also have a material impact on our financial results.
Critical Accounting Policies
Our significant accounting policies are described in Note 1 to our consolidated financial statements included in Item 8 of this Annual Report on Form 10-K. This Management's Discussion and Analysis of Financial Condition and Results of Operations is based upon our consolidated financial statements, which have been prepared in accordance with accounting principles generally accepted in the United States of America. The preparation of these consolidated financial statements requires management to make estimates and judgments that affect the reported amount of assets, liabilities, revenues and expenses, and related disclosure of contingent assets and liabilities. The Securities and Exchange Commission has defined a company's most critical accounting policies as those that are most important to the portrayal of its financial condition and results of operations, and which require the company to make its most difficult and subjective judgments, often as a result of the need to make estimates of matters that are inherently uncertain. Based on this definition, we have identified the following critical accounting policies. Although we believe that our estimates and assumptions are reasonable, they are based upon information available when they are made. Actual results may differ significantly from these estimates under different assumptions or conditions.
Revenue Recognition
We recognize revenue when it is realized or realizable and earned. We consider revenue realized or realizable when persuasive evidence of an arrangement exists, the product has been shipped or the services have been provided to the customer, title and risk of loss of products has passed to the customer, the sales price is fixed or determinable, and collectability is reasonably assured. Our terms are FOB shipping point with no right of return, except in rare cases, and customer acceptance of our products is not required. The revenue recognition policy does not differ among the various product lines, the marketing venues, or various geographic destinations. We do not have distributors who stock our equipment. We do not offer rebates, price protection, or other similar incentives, and discounts when offered are recorded as a reduction in revenue. We record revenue net of sales tax charged to the customer.
Revenue for preventive maintenance agreements is recognized on a per visit basis and extended warranties on a straight-line basis over the life of the contracts.
In the first quarter 2010, we adopted ASC Topic 605 related to recognizing revenue from shipments with multiple element arrangements. This guidance provides that the overall arrangement fee will be allocated to each element (both delivered and undelivered items) based on their relative selling price, as demonstrated by vendor-specific objective evidence (VSOE) or third-party evidence (TPE). Where VSOE or TPE is not available, revenue will be allocated using an estimated selling price. This adoption did not have a material impact on our consolidated financial statements.
Allowance for Doubtful Accounts and Sales Returns
Our allowance for doubtful accounts and sales returns is for accounts receivable balances that are estimated to be uncollectible as well as anticipated sales returns. The reserve is based on a number of factors, including: (1) an analysis of customer accounts and (2) our historical experience with accounts
21
receivable write-offs and sales returns. The analysis includes the age of the receivable, the financial condition of a customer or industry and general economic conditions. We believe our financial results could be materially different if historical trends are not predictive of future results or if economic conditions worsened for our customers. In the event we determined that a smaller or larger allowance for doubtful accounts is appropriate, we would record a credit or charge to selling, general and administrative expense in the period that we made such a determination. As of December 31, 2011 and 2010, we had $150,921 and $183,291, respectively, reserved against our accounts receivable for doubtful accounts and sales returns.
Accrual for Excess and Obsolete Inventories
We perform an analysis to identify excess and obsolete inventory. We record a charge to cost of sales for amounts identified. Our analysis includes inventory levels, the nature of the components and their inherent risk of obsolescence, and the on-hand quantities relative to the sales history of that component. We believe that our financial results could be materially different if historical trends are not predictive of future results or if demand for our products decreased because of economic or competitive conditions or otherwise. As of December 31, 2011 and 2010, we had $364,591 and $320,195, respectively, accrued for excess and obsolete inventories.
Recoverability of Long-Lived Assets
We assess the recoverability of intangibles and other long-lived assets periodically whenever events or changes in circumstances indicate that expected future undiscounted cash flows might not be sufficient to support the carrying amount of an asset. We deem an asset to be impaired if a forecast of undiscounted future operating cash flows is less than an asset's carrying amount. If an asset is determined to be impaired, the loss is measured as the amount by which the carrying value of the asset exceeds its fair value. Changes in our business strategies, changes in the economic environment in which we operate, competitive conditions, and other factors could result in future impairment charges. We did not record any long-lived asset impairment charges in 2011 or 2010.
Goodwill
We assess the recoverability of goodwill on our annual measurement date or whenever events or changes in circumstances indicate that expected future undiscounted cash flows might not be sufficient to support the carrying amount of an asset. Goodwill is considered to be impaired if it is determined that the carrying amount of the reporting unit exceeds its fair value. Assessing the impairment of goodwill requires us to make judgments regarding the fair value of the net assets of our reporting units and the allocation of the carrying amount of shared assets to the reporting units. Our annual assessment included comparison of the carrying amount of the net assets of a reporting unit, including goodwill, to the fair value of the reporting unit. A significant change in our market capitalization or in the carrying amount of net assets of a reporting unit could result in an impairment charge in future periods. We did not record any goodwill impairment as the fair values of our reporting units substantially exceeded their carrying values.
Accrued Product Warranties
Our products are generally covered by a warranty, with warranty periods ranging from ninety days to one year from the date of sale. Estimated warranty costs are accrued in the same period in which the related revenue is recognized, based on anticipated parts and labor costs, utilizing historical experience. Additional warranty reserves are also accrued for major rework campaigns. We periodically assess the adequacy of our warranty reserves based on changes in these factors and record any necessary adjustments if actual claim experience indicates that adjustments are necessary. Although we believe the likelihood to be relatively low, warranty claims experience could be materially different
22
from actual results due to manufacturing changes that could impact product quality, a change in our warranty policy in response to industry trends, as yet unrecognized defects in products sold, or other factors. As of December 31, 2011 and 2010, we had $205,506 and $217,819, respectively, accrued for future estimated warranty claims.
Income Taxes
In the preparation of our consolidated financial statements, management is required to estimate income taxes in each of the jurisdictions in which we operate. This process involves estimating actual current tax exposures together with assessing temporary differences resulting from differing treatment of items for tax and accounting purposes. These differences result in deferred tax assets and liabilities, which are included in our Consolidated Balance Sheets.
Management reviews the deferred tax assets for recoverability on a quarterly basis and assesses the need for valuation allowances. These deferred tax assets are evaluated by considering historical levels of income, estimates of future taxable income streams and the impact of tax planning strategies. A valuation allowance is recorded to reduce deferred tax assets when it is determined that it is more likely than not that we would not be able to realize all or part of our deferred tax assets. At December 31, 2011 and 2010, we provided a valuation allowance in the amounts of $51,000 and $318,000, respectively, against our net deferred tax assets.
ASC 740 requires application of a more-likely-than-not threshold to the recognition and derecognition of uncertain tax positions. Under ASC 740, once the more-likely-than-not threshold is met, the amount of benefit to be recognized is the largest amount of tax benefit that is greater than 50% likely of being ultimately realized upon settlement. It further requires that a change in judgment related to the expected ultimate resolution of uncertain tax positions be recognized in earnings in the period of such a change. We have unrecognized tax benefits in the amount of $278,000 and $248,000 in 2011 and 2010, respectively, for estimated exposures associated with uncertain tax positions. However, due to the complexity of some of these uncertainties, the ultimate settlement may result in payments that are different from our current estimate of tax liabilities, resulting in the recognition of additional charges or benefits to income tax expense.
Results of Operations
The following table sets forth the relationship between various components of our results of operations, stated as a percent of sales, for fiscal years ended December 31, 2011, 2010 and 2009. Our historical financial data were derived from our consolidated financial statements and related notes included in Item 8 of this Annual Report on Form 10-K.
| |
Percent of Sales | |||||||||
|---|---|---|---|---|---|---|---|---|---|---|
| |
2011 | 2010 | 2009 | |||||||
Sales |
100.0 | 100.0 | 100.0 | |||||||
Cost of sales |
37.2 | 39.3 | 41.6 | |||||||
Gross profit |
62.8 | 60.7 | 58.4 | |||||||
Selling, general and administrative expenses |
34.6 | 35.4 | 37.0 | |||||||
Research and development expenses |
6.4 | 6.8 | 6.9 | |||||||
Operating income |
21.8 | 18.5 | 14.5 | |||||||
Other income, net |
0.2 | 2.0 | 1.4 | |||||||
Income before income taxes |
22.0 | 20.5 | 15.9 | |||||||
Income taxes |
7.4 | 6.2 | 5.0 | |||||||
Net income |
14.6 | 14.3 | 10.9 | |||||||
23
The following table summarizes total sales by product line for 2011, 2010 and 2009:
| |
Years Ended December 31, | |||||||||
|---|---|---|---|---|---|---|---|---|---|---|
| |
2011 | 2010 | 2009 | |||||||
Permeation testing products and services |
$ | 22,160,447 | $ | 18,077,953 | $ | 15,126,259 | ||||
Gas analyzers, sensors and detectors |
6,802,153 | 5,738,948 | 4,933,256 | |||||||
Package testing products and services |
5,951,112 | 5,062,414 | 4,701,279 | |||||||
Other products and services |
2,447,155 | 2,669,314 | 1,877,304 | |||||||
Total sales |
$ | 37,360,867 | $ | 31,548,629 | $ | 26,638,098 | ||||
The following table sets forth the relationship between various components of domestic and foreign sales for 2011, 2010 and 2009:
| |
Years Ended December 31, | |||||||||
|---|---|---|---|---|---|---|---|---|---|---|
| |
2011 | 2010 | 2009 | |||||||
Domestic sales |
$ | 16,297,487 | $ | 13,806,660 | $ | 11,790,911 | ||||
Foreign sales: |
||||||||||
Europe |
8,654,088 | 7,148,879 | 6,591,749 | |||||||
Asia |
8,237,348 | 8,482,788 | 5,996,005 | |||||||
Other |
4,171,944 | 2,110,302 | 2,259,433 | |||||||
Total foreign sales |
21,063,380 | 17,741,969 | 14,847,187 | |||||||
Total sales |
$ | 37,360,867 | $ | 31,548,629 | $ | 26,638,098 | ||||
Sales
Fiscal 2011 vs. Fiscal 2010
Sales for 2011 were $37,361,000, an increase of 18% compared to $31,549,000 for 2010. We experienced double-digit sales growth in our three major product categories, and our domestic and international sales volume increased 18% and 19%, respectively. Despite the ongoing concerns over the economic situation in Europe, we experienced a 21% increase in sales to that region, particularly in Germany and Italy. Sales in Asia were slightly lower in 2011 compared to 2010 primarily due to a large order placed by the Chinese government in 2010 that did not repeat in 2011. We experienced significant growth in newer markets such as South America and Australia. The impact of price increases was not significant in 2011.
Permeation Testing Products and Services
Sales of our permeation testing products and services, which accounted for 59% and 57% of our consolidated sales in 2011 and 2010, respectively, increased $4,082,000, or 23% in 2011 compared to 2010. This increase in permeation sales was evident in both our domestic and foreign markets, and reflected increasing sales for newer applications in the sustainable packaging materials market, as well as the electronics industry for measurement of water vapor permeation in flexible displays, solar panels and organic light-emitting diodes (OLEDs). In total, domestic sales of permeation equipment and services increased 29%, while foreign sales showed a 20% increase. Our AQUATRAN instrument, which measures ultra-low levels of water vapor permeation, continues to be a significant contributor in this product group.
24
Gas Analyzers, Sensors and Detectors
Sales of our gas analyzers, sensors and detector products, which accounted for 18% of our consolidated sales in both 2011 and 2010, increased $1,063,000, or 19% in 2011 compared to 2010. This increase was due primarily to higher sales of gas chromatographs and total hydrocarbon analyzers. These instruments were purchased primarily for use in the oil and gas exploration, environmental air quality monitoring, and CO2 purity for carbonated beverages markets. Sales of OEM sensors and detectors were stable between the two years.
Package Testing Products and Services
Sales of our package testing products (headspace analyzers and leak detectors), which accounted for 16% of our consolidated sales in both 2011 and 2010 increased $889,000, or 18% in 2011 compared to 2010. We experienced growth both domestically and internationally, as we continued to focus on strengthening our offerings in the MAP (modified atmospheric packaging) area. A major contributor to the domestic growth this year was the shipment to one customer in the coffee industry of 25 newly-designed test systems for package integrity, which equated to approximately $527,000.
Other Products and Services
Sales of our other products and services group, which accounted for 7% and 9% of our consolidated sales in 2011 and 2010, respectively, decreased 8% in 2011 compared to 2010. This group consists of our weighing and pharmaceutical products, food safety instruments, our consulting and testing services, and non-MOCON products sold by our German subsidiary. The decrease in 2011 compared to 2010 was due primarily to lower shipments of weighing equipment, partially offset by increases in food safety products and an increase in our consulting and testing services.
Fiscal 2010 vs. Fiscal 2009
Sales for 2010 were $31,549,000, an increase of 18% compared to $26,638,000 for 2009. We experienced increased sales in all of our major product lines in 2010 as compared to 2009. These increases, we believe, were due primarily to global pent-up demand from a soft 2009 as well as the extension of Federal tax incentives for domestic purchases of capital equipment. Sales of permeation instruments accounted for a significant portion of the dollar increase due primarily to strong demand in the Asian markets. Our consolidated domestic sales, which accounted for 44% of total sales in both 2010 and 2009, increased 17% in 2010. Our consolidated foreign sales, which accounted for 56% of total sales in both 2010 and 2009, increased 20% in 2010 over 2009. The impact of any price increases was not significant in 2010.
Permeation Testing Products and Services
Sales of our permeation products and services, which accounted for 57% of our consolidated sales in both 2010 and 2009, increased $2,952,000, or 20% in 2010 compared to 2009. This increase in permeation sales came primarily in our foreign markets, and reflected increasing sales of the AQUATRAN, as well as strong sales of the OX-TRAN and PERMATRAN-W instruments. One large order from the Chinese government supplied OX-TRAN and PERMATRAN-W instruments to numerous research laboratories throughout the country. In total, foreign sales of permeation equipment and services increased 22%, while domestic sales showed a 15% increase. We believe the domestic increase was due to pent-up demand from a soft 2009 as well as the extension of Federal tax incentives for purchases of capital equipment.
25
Gas Analyzers, Sensors and Detectors
Sales of our gas analyzers, sensors and detector products, which accounted for 18% of our consolidated sales in both 2010 and 2009, increased $806,000, or 16% in 2010 compared to 2009. This increase was due primarily to higher sales of sensors and detectors to the OEM portable sensor market. In addition, we experienced increased shipments of gas chromatograph and hydrocarbon analyzer instruments for environmental monitoring and industrial hygiene applications. We continue to experience increased market acceptance of our BevAlert instrument which is used in the carbonated beverage industry for measuring purity of carbon dioxide.
Package Testing Products and Services
Sales of our package testing products (headspace analyzers and leak detectors), which accounted for 16% and 18% of our consolidated sales in 2010 and 2009, respectively, increased $361,000, or 8% in 2010 compared to 2009. We have experienced growth both domestically and internationally, as we have continued to focus on strengthening our offerings in the MAP (modified atmospheric packaging) area. We see potential growth in MAP as our food manufacturing customers continue to evaluate ways to safely extend the shelf life of their perishable products.
Other Products and Services
Sales of our other instruments and services group, which accounted for 9% and 7% of our consolidated sales in 2010 and 2009, respectively, increased $792,000, or 42% in 2010 compared to 2009. This group consists of our weighing and pharmaceutical products, our consulting and testing services, our contract manufacturing and non-MOCON products sold by our German subsidiary. The increase in 2010 compared to 2009 was due primarily to an increase in our consulting and testing services. We continue to see growth in this area as we increase our offerings and services.
Gross Profit
Fiscal 2011 vs. Fiscal 2010
Our overall gross profit percentages were 62.8% and 60.7% during 2011 and 2010, respectively. In the products area, a 2.4 percentage point margin increase was attributable to a favorable sales mix, higher production volume, and improved cost of sales on certain gas analyzer instruments. In the consulting services area, a slightly lower margin was primarily the result of expanding our laboratory services business model into several new international markets.
Fiscal 2010 vs. Fiscal 2009
Our overall gross profit percentages were 60.7% and 58.4% during 2010 and 2009, respectively. In the products area, a 2.3 percentage point margin increase was attributable to a favorable sales mix and improved cost of sales of our gas analyzer instruments and sensors. In the consulting area, a 5.9 percentage point margin increase was primarily the result of significantly higher volume over which to spread the fixed costs.
Selling, General and Administrative Expenses
Fiscal 2011 vs. Fiscal 2010
Selling, general and administrative expenses were $12,941,000 and $11,195,000, or 34.6% and 35.4% of sales in 2011 and 2010, respectively. The increase of $1,746,000 was due primarily to increased headcount which resulted in higher salaries and benefits, increased incentive compensation due to higher profitability, and higher sales commissions, marketing and travel expenses. In addition,
26
consulting fees incurred in the fourth quarter 2011 related to the implementation of our new ERP system contributed to the increase.
Fiscal 2010 vs. Fiscal 2009
Selling, general and administrative expenses were $11,195,000 and $9,858,000, or 35.4% and 37.0% of sales in 2010 and 2009, respectively. The increase of $1,337,000 was due primarily to increased headcount which resulted in higher salaries and benefits, and increased incentive compensation due to higher profitability. In addition, higher domestic sales commissions, travel and entertainment, and marketing expense contributed to the increase.
Research and Development Expenses
Fiscal 2011 vs. Fiscal 2010
Research and development (R&D) expenses were $2,403,000 and $2,135,000 in 2011 and 2010, or 6.4% and 6.8% of sales, respectively. The increased expense in 2011 is primarily related to the continued development of the GreenLight product line for the food safety market, and is net of approximately $175,000 received from Luxcel for collaborative research efforts. For the foreseeable future, we intend to continue to allocate on an annual basis approximately 6% to 8% of sales to research and development. We believe continued R&D expenditures are necessary as we develop new products to expand revenue opportunities in our niche markets and remain competitive.
Fiscal 2010 vs. Fiscal 2009
R&D expenses were $2,135,000 and $1,848,000 in 2010 and 2009, or 6.8% and 6.9% of sales, respectively. The increased expense in 2010 is primarily related to the development of new products for the food safety market, and is net of approximately $165,000 received from Luxcel for collaborative research efforts. For the foreseeable future, we intend to continue to allocate on an annual basis approximately 6% to 8% of sales to research and development.
Other Income, Net
Other income, net for 2011, 2010 and 2009 was as follows:
| |
Years Ended December 31, | |||||||||
|---|---|---|---|---|---|---|---|---|---|---|
| |
2011 | 2010 | 2009 | |||||||
Interest income on investments |
$ | 117,680 | $ | 84,199 | $ | 369,176 | ||||
Foreign currency exchange gain (loss) |
(37,276 | ) | 542,108 | (2,956 | ) | |||||
Other |
(805 | ) | 2,605 | (168 | ) | |||||
Total other income |
$ | 79,599 | $ | 628,912 | $ | 366,052 | ||||
Interest income increased in 2011, as compared to 2010, due to higher average invested balances of cash and marketable securities. Total cash and marketable securities increased approximately $6,129,000 from December 31, 2010 to December 31, 2011, due primarily to cash flow generated from operations and proceeds from exercise of stock options, partially offset by dividends paid and fixed asset additions.
Interest income decreased in 2010, as compared to 2009, due to both lower average invested balances of cash and marketable securities and lower average yields. Total cash and marketable securities decreased approximately $1,930,000 from December 31, 2009 to December 31, 2010, which decline is attributable to a $3,625,000 (€2,500,000) investment we made in January 2010 to acquire a
27
minority interest in Luxcel Biosciences Limited. This decrease was partially offset by an increase in cash flow from operations.
Included in the foreign currency exchange gain for 2010 is $562,000 relating to the re-measurement of a euro-based intercompany loan obligation to market value. The loan was settled in January 2011.
Income Tax Expense
Our provision for income taxes for 2011 was $2,753,000, or 33.6% of income before income taxes, compared to $1,945,000, or 30.1% of income before income taxes for 2010. This year over year increase in the effective tax rate was due primarily to the use of foreign tax credits in 2010 which were not available in 2011.
Our provision for income taxes for 2010 was $1,945,000, or 30.1% of income before income taxes, compared to $1,319,000, or 31.2% of income before income taxes for 2009. This year over year decrease in the effective tax rate was due primarily to foreign tax credits generated by the repatriation of funds from our German subsidiary, and an increase in the allowable deduction for domestic production activity for federal income tax purposes.
Inflation
We do not believe that inflation has had a material effect on our results of operations in recent years; however, there can be no assurance that our business will not be adversely affected by inflation in the future.
Liquidity and Capital Resources
Total cash, cash equivalents and marketable securities increased $6,129,000 during 2011 to $18,530,000 as of December 31, 2011, compared to $12,401,000 at December 31, 2010. We describe the reasons for this increase in the "Cash Flow" section below. Our working capital as of December 31, 2011 increased $3,451,000 to $17,217,000, compared to $13,767,000 at December 31, 2010.
We invest a large portion of our available cash in highly liquid certificates of deposit, municipal bonds and money market funds. Our investment policy is to manage these assets to preserve principal, maintain adequate liquidity at all times, and maximize returns subject to investment guidelines we maintain. We do not have any investments in auction rate or hard-to-value securities.
We have historically financed our operations, capital equipment and other cash requirements through cash flows generated from operations. If we complete the acquisition of PBI-Dansensor, we expect to incur indebtedness of up to $8.5 million with Wells Fargo Bank and approximately $6.6 million to PBI Holding A/S, the seller of PBI-Dansensor. We believe that a combination of our existing cash, cash equivalents and marketable securities, plus an expected continuation of cash flow from operations, will continue to be adequate to fund operations and working capital, make the required payments on the indebtedness we expect to incur, fund capital expenditures and pay dividends that our Board of Directors may declare in the future. Our belief is based on current business operations and economic conditions and assumes that we continue to operate our business in the ordinary course.
One of our strategic objectives is, as market and business conditions warrant, to consider acquisitions of, or investments in, businesses, products and/or technologies. In this regard, in January 2010, we made the investment in Luxcel noted above, to help us establish a stronger presence in the food safety market, and on March 9, 2012, we signed an agreement to acquire PBI-Dansensor, as noted above. If we consummate one or more additional acquisition opportunities which require the consent of Wells Fargo Bank under the loan agreement we expect to execute, we may need to fund such activities with a portion of our cash balances and debt or equity financing. If we need to raise additional capital,
28
an equity-based or equity-linked financing may be used which could be dilutive to existing shareholders. If we raise additional funds by issuing debt, we may be subject to restrictive covenants that could limit our operational flexibility and higher interest expense could dilute earnings per share.
Cash Flow
Cash Flows from Operating Activities
Our primary source of funds is cash provided by operating activities. Cash flow from operating activities totaled $8,105,000, $5,226,000 and $4,153,000 in 2011, 2010 and 2009, respectively. In 2011, cash provided by operating activities increased by $2,879,000 compared to 2010. This increase was due primarily to higher net income, reduced trade accounts receivable and other receivables, and an increase in accrued income taxes and compensation and related expenses. In 2010, cash provided by operating activities increased by $1,073,000 compared to 2009. This increase was due primarily to higher net income, together with year-over-year increases in accounts payable and accrued compensation and related expenses, partially offset by an increase in trade accounts receivable. Working capital requirements typically will increase or decrease with changes in the level of sales. In addition, the timing of certain accrued payments will affect the annual cash flow. Income tax payments and any employee incentive payments affect the timing of our operating cash flow as they are accrued throughout the year but paid on a quarterly, semi-annual or annual basis.
Cash Flows from Investing Activities
Cash used in investing activities totaled $5,773,000 in 2011 as compared to cash used of $5,904,000 in 2010 and cash provided of $6,161,000 in 2009. The primary reasons for cash used in 2011 were the net purchases of marketable securities and purchases of property, plant and equipment. The primary reasons for cash used in 2010 were the investment of approximately $3,625,000 (€2,500,000) to acquire a minority equity ownership interest in Luxcel Biosciences Limited in Ireland, and capital expenditures of $1,646,000, the majority of which relates to our move to new offices in Minnesota. The primary reason for the cash provided in 2009 was the net proceeds from the maturities of marketable securities. Except for the expected investment of approximately $400,000 related to the implementation of our new ERP system, we do not believe that any major property, plant and equipment expenditures are required to accommodate our current level of operations.
Cash Flows from Financing Activities
Cash used in financing activities totaled $636,000 in 2011 as compared to $1,397,000 in 2010 and $5,551,000 in 2009. In 2011, 2010 and 2009 we used $2,105,000, $1,953,000 and $1,959,000, respectively, for payment of dividends to our shareholders. The primary use of cash for financing activities in 2009 was the repurchase of an aggregate of 424,000 shares of common stock for a total amount of $3,602,000. In connection with our planned acquisition of PBI-Dansensor, we expect to incur indebtedness of up to $8.5 million with Wells Fargo Bank and approximately $6.6 million to PBI Holding A/S.
Cash flow from the exercise of stock options generated $1,261,000, $454,000 and $10,000, for the years 2011, 2010 and 2009, respectively.
29
Contractual Obligations
The following table summarizes our future contractual cash obligations as of December 31, 2011 (in thousands):
| |
Payments Due By Period | |||||||||||||||
|---|---|---|---|---|---|---|---|---|---|---|---|---|---|---|---|---|
| |
Total | Less than 1 year |
1-3 years | 4-5 years | After 5 years |
|||||||||||
Operating leases |
$ | 6,981 | 567 | 1,537 | 1,067 | 3,810 | ||||||||||
Purchase obligations |
2,850 | 2,850 | — | — | — | |||||||||||
Total contractual cash obligations |
$ | 9,831 | 3,417 | 1,537 | 1,067 | 3,810 | ||||||||||
In March 2010, we signed a 15-year lease for a property which replaced our former Minneapolis headquarters and operations center. The new lease commenced on June 1, 2010. The required future minimum lease payments, starting at $367,000 per year and subject to annual increases, have been included in the above table.
In May 2010, we entered into a foreign currency forward exchange contract to act as a hedge against fluctuations in a euro-denominated intercompany note. This contract had a notional amount totaling approximately $3,089,000, bearing an exchange rate of 1.2358 U.S. dollars per euro, and matured in January 2011. At December 31, 2010, the contract had a fair value of $3,340,000.
In relation to our accrual for uncertain tax positions, we had $289,000 of gross unrecognized tax benefits as of the date of adoption and $278,000 and $248,000 at December 31, 2011 and 2010, respectively. The timing of any payments which could result from these unrecognized tax benefits will depend on a number of factors. Accordingly, we cannot make reasonably reliable estimates of the period of potential cash settlement, if any, with taxing authorities. Due to the uncertainty regarding the timing of these liabilities, we have excluded these amounts from the contractual obligations table.
We have a severance agreement with five of our executive officers which provides for the payment to the executive of a lump sum amount upon the occurrence of certain termination events. The payment could amount to one or two times the executive's current annual salary depending on the reason for termination. These amounts are not included in the contractual obligations table.
Off-Balance Sheet Arrangements
We do not have any off-balance sheet arrangements, as defined by the rules and regulations of the SEC, that have or are reasonably likely to have a material effect on our financial condition, changes in financial condition, revenues or expenses, results of operations, liquidity, capital expenditures or capital resources. As a result, we are not materially exposed to any financing, liquidity, market or credit risk that could arise if we had engaged in these arrangements.
Recently Issued Accounting Guidance
Comprehensive Income
In June 2011, the FASB issued guidance on the presentation of comprehensive income, which requires entities to present reclassification adjustments included in other comprehensive income on the face of the financial statements and allows entities to present the total of comprehensive income, the components of net income and the components of other comprehensive income either in a single continuous statement of comprehensive income or in two separate but consecutive statements. It also eliminates the option for entities to present the components of other comprehensive income as part of the statement of changes in stockholders' equity. In December 2011, the FASB issued an amendment to this standard which defers the requirement that companies present reclassification adjustments for each
30
component of accumulated other comprehensive income in both net income and other comprehensive income on the face of the financial statements. This guidance requires retrospective application and is effective for fiscal years, and interim periods within those years, beginning after December 15, 2011. Adoption of this guidance is not expected to have a material effect on our consolidated financial statements.
Testing Goodwill for Impairment
In September 2011, the FASB issued updated accounting guidance on the periodic testing of goodwill for impairment. This guidance allows entities the option to first assess qualitative factors to determine whether the existence of events or circumstances leads to a determination that it is more likely than not that the fair value of a reporting unit is less than its carrying amount. If the entity concludes the fair value is higher than the carrying value, then no further testing is necessary. However, if impairment is likely, the first step, which is to calculate the fair value of the reporting unit, is necessary. Additionally, the entity is required to then perform step two in measuring the impairment loss for the period. For public companies, this guidance is effective for fiscal years (and interim periods within those years) beginning after December 15, 2011, with earlier adoption permitted. Adoption of this guidance is not expected to have a material effect on our consolidated financial statements.
Offsetting Assets and Liabilities Disclosures
In December 2011, the FASB issued updated accounting guidance on disclosures about offsetting assets and liabilities. This update adds certain additional disclosure requirements about financial instruments and derivative instruments that are subject to netting arrangements. The new disclosures are required for interim and annual reporting periods beginning on or after January 1, 2013. We do not expect this guidance to have a material impact on our consolidated financial statements.
ITEM 7A. QUANTITATIVE AND QUALITATIVE DISCLOSURES ABOUT MARKET RISK
Interest Rate Risk
Substantially all of our marketable securities, some of which are insured by the FDIC, are at fixed interest rates and mature within two and one-half years; therefore, we believe that the market risk arising from the holding of these financial instruments is minimal. Based on our average invested cash balances during 2011, a 1% (100 basis points) decrease in the interest rate on such balances would result in a reduction in interest income of approximately $155,000 on an annual basis.
Foreign Currency Exchange Risk
Historically, in excess of 50% of our consolidated sales have been to international destinations. Since we invoice most of these customers in U.S. dollars, we do not have significant exposure to foreign currency transaction risk. We invoice a small amount to our international customers in their local currency which exposes us to some transaction gain or loss when converting their payments into U.S. dollars. We also pay a small number of our international suppliers in their local currency which exposes us to transaction gain or loss. However, these have not resulted in material amounts in the past.
Our foreign operations expose us to foreign currency exchange risk when the euro and yuan currency results of operations are translated to U.S. dollars. We historically have not experienced any material foreign currency translation gains or losses, however, we realized a foreign currency transaction gain in the first half of 2010 relating to the valuation of a euro-denominated intercompany loan which originated in the first quarter 2010. To mitigate the effect of any further currency fluctuations, we purchased a foreign currency forward contract which acted as a hedge against any additional gains or losses.
31
Our investments in foreign subsidiaries translated into U.S. dollars are not hedged. Any changes in foreign currency exchange rates would be reflected as a foreign currency translation adjustment, a component of accumulated other comprehensive income in stockholders' equity, and would not impact our net income.
ITEM 8. FINANCIAL STATEMENTS AND SUPPLEMENTARY DATA
Our consolidated financial statements and Report of Independent Registered Public Accounting Firm are included beginning on page F-1 of this Annual Report on Form 10-K and are incorporated herein by reference.
SELECTED QUARTERLY FINANCIAL DATA (UNAUDITED)
(in thousands, except per share data)
| |
Quarter | ||||||||||||
|---|---|---|---|---|---|---|---|---|---|---|---|---|---|
| |
1st | 2nd | 3rd | 4th | |||||||||
2011: |
|||||||||||||
Sales |
$ | 9,075 | $ | 9,082 | $ | 9,463 | $ | 9,741 | |||||
Gross profit |
5,815 | 5,580 | 5,977 | 6,096 | |||||||||
Net income |
1,317 | 1,224 | 1,517 | 1,393 | |||||||||
Net income per common share: |
|||||||||||||
Basic |
$ | 0.25 | $ | 0.23 | $ | 0.28 | $ | 0.26 | |||||
Diluted |
0.24 | 0.22 | 0.27 | 0.25 | |||||||||
2010: |
|||||||||||||
Sales |
$ | 7,093 | $ | 7,351 | $ | 7,749 | $ | 9,355 | |||||
Gross profit |
4,326 | 4,494 | 4,641 | 5,703 | |||||||||
Net income |
922 | 1,092 | 1,029 | 1,476 | |||||||||
Net income per common share: |
|||||||||||||
Basic |
$ | 0.18 | $ | 0.21 | $ | 0.20 | $ | 0.28 | |||||
Diluted |
0.17 | 0.20 | 0.19 | 0.27 | |||||||||
Note: The sum of the quarterly amounts above may not agree with annual amounts due to rounding.
ITEM 9. CHANGES IN AND DISAGREEMENTS WITH ACCOUNTANTS ON ACCOUNTING AND FINANCIAL DISCLOSURE
Not applicable.
ITEM 9A. CONTROLS AND PROCEDURES
Evaluation of Disclosure Controls and Procedures
We maintain disclosure controls and procedures (as defined in Rules 13a-15(e) and 15d-15(e) under the Securities Exchange Act of 1934, as amended) that are designed to reasonably ensure that information required to be disclosed by us in the reports we file or submit under the Securities Exchange Act of 1934, as amended, is recorded, processed, summarized and reported within the time periods specified in the Securities and Exchange Commission's rules and forms and that such information is accumulated and communicated to our management, including our principal executive and principal financial officers, or persons performing similar functions, as appropriate to allow timely decisions regarding required disclosure.
32
Our management evaluated, with the participation of our Chief Executive Officer and Chief Financial Officer, the effectiveness of the design and operation of our disclosure controls and procedures as of the end of the period covered in this Annual Report on Form 10-K. Based on that evaluation, our Chief Executive Officer and Chief Financial Officer concluded that our disclosure controls and procedures were effective as of the end of such period to provide reasonable assurance that information required to be disclosed in our Exchange Act reports is recorded, processed, summarized and reported within the time periods specified in the SEC's rules and forms, and that material information relating to our company is made known to management, including our Chief Executive Officer and Chief Financial Officer, particularly during the period when our periodic reports are being prepared.
Management's Report on Internal Control over Financial Reporting
MOCON's management is responsible for establishing and maintaining adequate internal control over financial reporting, as such term is defined in Exchange Act Rules 13a-15(f) and 15d-15(f). Under the supervision and with the participation of our Chief Executive Officer and Chief Financial Officer, our management conducted an evaluation of the effectiveness of our internal control over financial reporting based on the framework in Internal Control—Integrated Framework issued by the Committee of Sponsoring Organizations of the Treadway Commission. Based on that evaluation, our management concluded that our internal control over financial reporting was effective as of December 31, 2011.
KPMG LLP, an independent registered public accounting firm, has audited the consolidated financial statements included in this annual report on Form 10-K and, as a part of this audit, has issued their report included in Item 8, on the effectiveness of our internal control over financial reporting.
Inherent Limitations of Disclosure Controls and Procedures and Internal Control over Financial Reporting
It should be noted that any system of controls, however well designed and operated, can provide only reasonable, and not absolute, assurance that the objectives of the system will be met. In designing and operating a control system, one must consider the potential benefits of controls relative to their costs and the reality of limited resources available to allocate to control activities, particularly in smaller companies. In addition, the design of any control system is based in part upon certain assumptions about the likelihood of future events and there can be no assurance that any control will meet its objectives under all potential future conditions. Because of such inherent limitations in any control system, there can be no absolute assurance that control issues, misstatements, and/or fraud will be prevented or detected.
Changes in Internal Control Over Financial Reporting
There was no change in our internal control over financial reporting that occurred during our fourth quarter of the year ended December 31, 2011 that has materially affected, or is reasonably likely to materially affect our internal control over financial reporting.
None.
33
ITEM 10. DIRECTORS AND EXECUTIVE OFFICERS AND CORPORATE GOVERNANCE
The information required under Item 10 of this Annual Report on Form 10-K is to be contained under the headings "Proposal One—Election of Directors—Information About Board Nominees," "Proposal One—Election of Directors—Additional Information About Board Nominees," "Corporate Governance—Information About our Board and its Committees" and "Section 16(a) Beneficial Ownership Reporting Compliance" in our definitive proxy statement to be filed with the SEC with respect to our next annual meeting of shareholders, which involves the election of directors and is incorporated herein by reference, or, if such proxy statement is not filed with the SEC within 120 days after the end of the fiscal year covered by this report, such information will be filed as part of an amendment to this report not later than the end of the 120-day period.
The information concerning our executive officers is included in this Annual Report under Item 1, "Executive Officers" and is incorporated herein by reference.
During the fourth quarter 2011, we made no material changes to the procedures by which shareholders may recommend nominees to the board of directors, as described in our most recent proxy statement.
Our Code of Ethics applies to all of our officers, directors and employees, including our principal executive officer and principal financial officer, and meets the requirements of the rules and regulations of the Securities and Exchange Commission. We will disclose any amendments to, and any waivers from a provision of, our Code of Ethics on a Form 8-K filed with the Securities and Exchange Commission. We make available, free of charge and through our website, to any shareholder who requests, the charters of our board committees and our Code of Ethics. Our website is www.mocon.com.
To request a copy of the charters of our board committees or our Code of Ethics, write to us at:
MOCON, Inc.
7500 Mendelssohn Avenue North
Minneapolis, Minnesota 55428
Attention: Chief Financial Officer
ITEM 11. EXECUTIVE COMPENSATION
The information required under Item 11 of this Annual Report on Form 10-K is to be contained under the headings "Director Compensation," "Executive Compensation," "Compensation Committee Interlocks and Insider Participation" and "Compensation Committee Report" in our definitive proxy statement to be filed with the SEC with respect to our next annual meeting of shareholders, which involves the election of directors and is incorporated herein by reference, or, if such proxy statement is not filed with the SEC within 120 days after the end of the fiscal year covered by this report, such information will be filed as part of an amendment to this report not later than the end of the 120-day period.
34
ITEM 12. SECURITY OWNERSHIP OF CERTAIN BENEFICIAL OWNERS AND MANAGEMENT AND RELATED STOCKHOLDER MATTERS
The information required under Item 12 of this Annual Report on Form 10-K is to be contained under the headings "Principal Shareholders and Beneficial Ownership of Management" in our definitive proxy statement to be filed with the SEC with respect to our next annual meeting of shareholders, which involves the election of directors and is incorporated herein by reference, or, if such proxy statement is not filed with the SEC within 120 days after the end of the fiscal year covered by this report, such information will be filed as part of an amendment to this report not later than the end of the 120-day period.
The following table summarizes outstanding options under our equity compensation plans as of December 31, 2011. Our only equity compensation plans as of December 31, 2011 were the MOCON, Inc. 2006 Stock Incentive Plan, as amended, and the MOCON, Inc. 1998 Stock Option Plan. The MOCON, Inc. 1998 Stock Option Plan has terminated with respect to future grants. Options and other stock incentive awards to be granted in the future under the MOCON, Inc. 2006 Stock Incentive Plan are within the discretion of our Board of Directors and the Compensation Committee of our Board of Directors and therefore cannot be ascertained at this time.
Plan Category
|
Number of Securities to be Issued upon Exercise of Outstanding Options, Warrants and Rights |
Weighted Average Exercise Price of Outstanding Options, Warrants and Rights |
Number of Securities Remaining Available for Future Issuance Under Equity Compensation Plans (Excluding Securities Reflected in First Column) |
|||||||
|---|---|---|---|---|---|---|---|---|---|---|
Equity compensation plans approved by security holders |
829,786 | $ | 11.05 | 391,900 | ||||||
Equity compensation plans not approved by security holders |
— | — | — | |||||||
Total |
829,786 | 391,900 | ||||||||
ITEM 13. CERTAIN RELATIONSHIPS AND RELATED TRANSACTIONS AND DIRECTOR INDEPENDENCE
The information required under Item 13 of this Annual Report on Form 10-K is to be contained under the heading "Related Party Relationships and Transactions" and "Corporate Governance—Director Independence" in our definitive proxy statement to be filed with the SEC with respect to our next annual meeting of shareholders, which involves the election of directors and is incorporated herein by reference, or, if such proxy statement is not filed with the SEC within 120 days after the end of the fiscal year covered by this report, such information will be filed as part of an amendment to this report not later than the end of the 120-day period.
ITEM 14. PRINCIPAL ACCOUNTANT FEES AND SERVICES
The information required under Item 14 of this Annual Report on Form 10-K is to be contained under the headings "Proposal Two—Ratification of Selection of Independent Registered Public Accounting Firm—Audit, Audit-Related, Tax and Other Fees" and "Proposal Two—Ratification of Selection of Independent Registered Public Accounting Firm—Pre-Approval Policies and Procedures" in our definitive proxy statement to be filed with the SEC with respect to our next annual meeting of shareholders, which involves the election of directors and is incorporated herein by reference, or, if such proxy statement is not filed with the SEC within 120 days after the end of the fiscal year covered by this report, such information will be filed as part of an amendment to this report not later than the end of the 120-day period.
35
ITEM 15. EXHIBITS AND FINANCIAL STATEMENT SCHEDULES
- (a)
- 1. Financial Statements
The following consolidated financial statements of MOCON, Inc. and its subsidiaries are included herein:
| |
Page | |
|---|---|---|
Report of Independent Registered Public Accounting Firm |
F-1 | |
Consolidated Balance Sheets as of December 31, 2011 and 2010 |
F-2 |
|
Consolidated Statements of Income for the years ended December 31, 2011, 2010 and 2009 |
F-3 |
|
Consolidated Statements of Stockholders' Equity and Comprehensive Income for the years ended December 31, 2011, 2010 and 2009 |
F-4 |
|
Consolidated Statements of Cash Flows for the years ended December 31, 2011, 2010 and 2009 |
F-5 |
|
Notes to Consolidated Financial Statements |
F-6 |
- 2.
- Financial Statement Schedule
The following financial statement schedule is included herein and should be read in conjunction with the consolidated financial statements referred to above:
Schedule II: Valuation and Qualifying Accounts |
S-1 |
- 3.
- Exhibits
The exhibits to this Annual Report on Form 10-K are listed in the Exhibit Index.
A copy of any of the exhibits listed or referred to above will be furnished at a reasonable cost to any person who was a shareholder of MOCON as of March 30, 2012, upon receipt from any such person of a written request for any such exhibit. Such request should be sent to MOCON, Inc., 7500 Mendelssohn Avenue North, Minneapolis, Minnesota 55428; Attn: Shareholder Information.
The following is a list of each management contract or compensatory plan or arrangement required to be filed as an exhibit to this Annual Report on Form 10-K pursuant to Item 15(a):
- A.
- MOCON, Inc.
1998 Stock Option Plan, as amended, (incorporated by reference to our Definitive Proxy Statement on Form DEF-14A filed on
April 9, 2002 (File No. 000-09273)).
- B.
- Form
of Incentive Stock Option Agreement between MOCON, Inc. and its Executive Officers under the MOCON, Inc. 1998 Stock Option Plan, as
amended (incorporated by reference to Exhibit 99.1 to our Current Report on Form 8-K filed on December 29, 2004 (File No. 000-09273)).
- C.
- Form
of Non-Statutory Stock Option Agreement between MOCON, Inc. and its Non-Employee Directors and Executive Officers under
the MOCON, Inc. 1998 Stock Option Plan, as amended (incorporated by reference to Exhibit 99.2 to our Current Report on Form 8-K filed on December 29, 2004 (File
No. 000-09273)).
- D.
- MOCON, Inc. 2006 Stock Incentive Plan, as amended and restated (incorporated by reference to Exhibit 10.1 to our Current Report on Form 8-K filed on June 1, 2011 (File No. 000-09273)).
36
- E.
- Form
of Incentive Stock Option Agreement between MOCON, Inc. and its Executive Officers under the MOCON, Inc. 2006 Stock Incentive Plan
(incorporated by reference to Exhibit 10.2 to our Current Report on Form 8-K filed on May 23, 2006 (File No. 000-09273)).
- F.
- Form
of Non-Statutory Stock Option Agreement between MOCON, Inc. and its Non-Employee Directors and Executive Officers under
the MOCON, Inc. 2006 Stock Incentive Plan (incorporated by reference to Exhibit 10.3 to our Current Report on Form 8-K filed on May 23, 2006 (File
No. 000-09273)).
- G.
- Form
of Executive Severance Agreement (incorporated by reference to Exhibit 10.11 to our Annual Report on Form 10-K for the fiscal
year ended December 31, 2007 (File No. 000-09273)).
- H.
- MOCON
Incentive Pay Plan for periods starting after June 30, 2010, as amended (filed herewith).
- I.
- Description
of Non-Employee Director Retirement Plan (incorporated by reference to Exhibit 10.20 to our Annual Report on
Form 10-K for the fiscal year ended December 31, 2004 (File No. 000-09273)).
- J.
- Description
of Non-Employee Director Compensation Arrangements (filed herewith).
- K.
- Description
of Executive Officer Compensation Arrangements (filed herewith).
- (b)
- Exhibits
The exhibits to this Annual Report on Form 10-K are listed in the Exhibit Index.
- (c)
- Financial Statement Schedule
See Item 15(a)(2) above for the financial statement schedule filed herewith.
37
Pursuant to the requirements of Section 13 or 15(d) of the Securities Exchange Act of 1934, the Registrant has duly caused this report to be signed on its behalf by the undersigned, thereunto duly authorized.
| Date: March 14, 2012 | MOCON, Inc. | |||
By: |
/s/ ROBERT L. DEMOREST Robert L. Demorest, Chairman of the Board, President and Chief Executive Officer (principal executive officer) |
|||
By: |
/s/ DARRELL B. LEE Darrell B. Lee, Vice President, Chief Financial Officer, Treasurer and Secretary (principal financial and accounting officer) |
|||
Pursuant to the requirements of the Securities Exchange Act of 1934, this report has been signed below by the following persons on behalf of the Registrant and in the capacities indicated and on March 14, 2012.
| |
Signature and Title
|
|
|---|---|---|
/s/ ROBERT L. DEMOREST Robert L. Demorest, Chairman of the Board, President and Chief Executive Officer |
||
/s/ DEAN B. CHENOWETH Dean B. Chenoweth, Director |
||
/s/ DONALD N. DEMORETT Donald N. DeMorett, Director |
||
/s/ J. LEONARD FRAME J. Leonard Frame, Director |
||
/s/ ROBERT F. GALLAGHER Robert F. Gallagher, Director |
||
/s/ DANIEL W. MAYER Daniel W. Mayer, Director |
||
/s/ RICHARD A. PROULX Richard A. Proulx, Director |
||
/s/ TOM C. THOMAS Tom C. Thomas, Director |
38
MOCON, INC. AND SUBSIDIARIES
Consolidated Financial Statements
December 31, 2011, 2010 and 2009
39
Report of Independent Registered Public Accounting Firm
The
Board of Directors and Stockholders
MOCON, Inc.:
We have audited the accompanying consolidated balance sheets of MOCON, Inc. and subsidiaries as of December 31, 2011 and 2010, and the related consolidated statements of income, stockholders' equity and comprehensive income, and cash flows for each of the years in the three-year period ended December 31, 2011. In connection with our audits of the consolidated statements, we also have audited the accompanying financial statement schedule. We also have audited MOCON, Inc.'s internal control over financial reporting as of December 31, 2011, based on criteria established in Internal Control—Integrated Framework issued by the Committee of Sponsoring Organizations of the Treadway Commission (COSO). MOCON, Inc.'s management is responsible for these consolidated financial statements and financial statement schedule, for maintaining effective internal control over financial reporting, and for its assessment of the effectiveness of internal control over financial reporting, included in the accompanying Management's Annual Report on Internal Controls Over Financial Reporting. Our responsibility is to express an opinion on these consolidated financial statements and financial statement schedule and an opinion on the Company's internal control over financial reporting based on our audits.
We conducted our audits in accordance with the standards of the Public Company Accounting Oversight Board (United States). Those standards require that we plan and perform the audits to obtain reasonable assurance about whether the financial statements are free of material misstatement and whether effective internal control over financial reporting was maintained in all material respects. Our audits of the consolidated financial statements included examining, on a test basis, evidence supporting the amounts and disclosures in the financial statements, assessing the accounting principles used and significant estimates made by management, and evaluating the overall financial statement presentation. Our audit of internal control over financial reporting included obtaining an understanding of internal control over financial reporting, assessing the risk that a material weakness exists, and testing and evaluating the design and operating effectiveness of internal control based on the assessed risk. Our audits also included performing such other procedures as we considered necessary in the circumstances. We believe that our audits provide a reasonable basis for our opinions.
A company's internal control over financial reporting is a process designed to provide reasonable assurance regarding the reliability of financial reporting and the preparation of financial statements for external purposes in accordance with generally accepted accounting principles. A company's internal control over financial reporting includes those policies and procedures that (1) pertain to the maintenance of records that, in reasonable detail, accurately and fairly reflect the transactions and dispositions of the assets of the company; (2) provide reasonable assurance that transactions are recorded as necessary to permit preparation of financial statements in accordance with generally accepted accounting principles, and that receipts and expenditures of the company are being made only in accordance with authorizations of management and directors of the company; and (3) provide reasonable assurance regarding prevention or timely detection of unauthorized acquisition, use, or disposition of the company's assets that could have a material effect on the financial statements.
Because of its inherent limitations, internal control over financial reporting may not prevent or detect misstatements. Also, projections of any evaluation of effectiveness to future periods are subject to the risk that controls may become inadequate because of changes in conditions, or that the degree of compliance with the policies or procedures may deteriorate.
In our opinion, the consolidated financial statements referred to above present fairly, in all material respects, the financial position of MOCON, Inc. and subsidiaries as of December 31, 2011 and 2010, and the results of its operations and its cash flows for each of the years in the three-year period ended December 31, 2011, in conformity with U.S. generally accepted accounting principles. Also in our opinion, the accompanying financial statement schedule, when considered in relation to the basic consolidated financial statements taken as a whole, presents fairly, in all material respects, the information set forth therein. Also in our opinion, MOCON, Inc. maintained, in all material respects, effective internal control over financial reporting as of December 31, 2011, based on criteria established in Internal Control—Integrated Framework issued by the Committee of Sponsoring Organizations of the Treadway Commission.
| /s/ KPMG LLP | ||
| Minneapolis, Minnesota March 14, 2012 |
F-1
MOCON, INC. AND SUBSIDIARIES
Consolidated Balance Sheets
December 31, 2011 and 2010
| |
2011 | 2010 | |||||
|---|---|---|---|---|---|---|---|
Assets |
|||||||
Current assets: |
|||||||
Cash and cash equivalents |
$ | 8,425,846 | $ | 6,955,248 | |||
Marketable securities, current |
4,304,912 | 1,058,275 | |||||
Trade accounts receivable, less allowance for doubtful accounts of $150,921 in 2011 and $183,291 in 2010 |
4,675,464 | 5,646,501 | |||||
Other receivables |
101,951 | 449,464 | |||||
Inventories |
4,479,929 | 4,141,496 | |||||
Prepaid income taxes |
9,239 | 392,436 | |||||
Prepaid expenses, other |
511,299 | 415,981 | |||||
Deferred income taxes |
848,597 | 339,526 | |||||
Total current assets |
23,357,237 | 19,398,927 | |||||
Marketable securities, noncurrent |
5,799,417 | 4,387,449 | |||||
Property, plant, and equipment, net |
3,174,748 | 2,842,955 | |||||
Goodwill |
3,119,246 | 3,160,858 | |||||
Investment in affiliated company |
3,237,250 | 3,313,250 | |||||
Technology rights and other intangibles, net |
909,536 | 765,896 | |||||
Deferred income taxes |
20,360 | 385,227 | |||||
Other assets |
86,717 | 83,948 | |||||
Total assets |
$ | 39,704,511 | $ | 34,338,510 | |||
Liabilities and Stockholders' Equity |
|||||||
Current liabilities: |
|||||||
Accounts payable |
$ | 1,812,779 | $ | 1,926,982 | |||
Compensation and related expenses |
2,313,553 | 2,093,085 | |||||
Other accrued expenses |
406,378 | 329,304 | |||||
Accrued product warranties |
205,506 | 217,819 | |||||
Dividends payable |
543,881 | 500,235 | |||||
Deferred revenue |
857,906 | 564,790 | |||||
Total current liabilities |
6,140,003 | 5,632,215 | |||||
Obligations to former employees |
46,751 | 50,055 | |||||
Accrued income taxes |
277,978 | 247,629 | |||||
Total noncurrent liabilities |
324,729 | 297,684 | |||||
Total liabilities |
6,464,732 | 5,929,899 | |||||
Commitments and contingencies (Note 7) |
|||||||
Stockholders' equity: |
|||||||
Capital stock—undesignated. Authorized 3,000,000 shares; none issued and outstanding in 2011 and 2010 |
— | — | |||||
Common stock—$0.10 par value. Authorized 22,000,000 shares; issued and outstanding 5,438,810 shares in 2011 and 5,265,636 shares in 2010 |
543,881 | 526,564 | |||||
Additional paid-in capital |
2,762,524 | 922,272 | |||||
Retained earnings |
30,523,405 | 27,220,871 | |||||
Accumulated other comprehensive loss |
(590,031 | ) | (261,096 | ) | |||
Total stockholders' equity |
33,239,779 | 28,408,611 | |||||
Total liabilities and stockholders' equity |
$ | 39,704,511 | $ | 34,338,510 | |||
See accompanying notes to consolidated financial statements.
F-2
MOCON, INC. AND SUBSIDIARIES
Consolidated Statements of Income
Years ended December 31, 2011, 2010 and 2009
| |
2011 | 2010 | 2009 | |||||||
|---|---|---|---|---|---|---|---|---|---|---|
Sales: |
||||||||||
Products |
$ | 34,383,432 | $ | 28,858,044 | $ | 24,791,998 | ||||
Consulting services |
2,977,435 | 2,690,585 | 1,846,100 | |||||||
Total sales |
37,360,867 | 31,548,629 | 26,638,098 | |||||||
Cost of sales: |
||||||||||
Products |
12,284,206 | 11,001,813 | 10,011,394 | |||||||
Consulting services |
1,608,364 | 1,382,196 | 1,056,916 | |||||||
Total cost of sales |
13,892,570 | 12,384,009 | 11,068,310 | |||||||
Gross profit |
23,468,297 | 19,164,620 | 15,569,788 | |||||||
Selling, general and administrative expenses |
12,941,350 | 11,194,797 | 9,858,493 | |||||||
Research and development expenses |
2,402,566 | 2,135,365 | 1,847,993 | |||||||
Operating income |
8,124,381 | 5,834,458 | 3,863,302 | |||||||
Other income, net |
79,599 | 628,912 | 366,052 | |||||||
Income before income taxes |
8,203,980 | 6,463,370 | 4,229,354 | |||||||
Income taxes |
2,753,062 | 1,944,986 | 1,318,867 | |||||||
Net income |
$ | 5,450,918 | $ | 4,518,384 | $ | 2,910,487 | ||||
Net income per common share: |
||||||||||
Basic |
$ | 1.02 | $ | 0.87 | $ | 0.54 | ||||
Diluted |
$ | 0.98 | $ | 0.84 | $ | 0.53 | ||||
Weighted average common shares outstanding: |
||||||||||
Basic |
5,342,900 | 5,208,873 | 5,393,066 | |||||||
Diluted |
5,572,646 | 5,364,253 | 5,457,964 | |||||||
Cash dividends declared per common share |
$ | 0.40 | $ | 0.38 | $ | 0.36 | ||||
See accompanying notes to consolidated financial statements.
F-3
MOCON, INC. AND SUBSIDIARIES
Consolidated Statements of Stockholders' Equity and Comprehensive Income
Years ended December 31, 2011, 2010 and
2009
| |
Common stock | |
|
|
|
||||||||||||||
|---|---|---|---|---|---|---|---|---|---|---|---|---|---|---|---|---|---|---|---|
| |
|
|
Accumulated other comprehensive income (loss) |
|
|||||||||||||||
| |
Number of shares |
Amount | Additional paid-in capital |
Retained earnings |
Total | ||||||||||||||
Balance, January 1, 2009 |
5,592,314 | $ | 559,231 | $ | 2,868,669 | $ | 24,268,266 | $ | 521,827 | $ | 28,217,993 | ||||||||
Stock options exercised |
1,275 | 128 | 9,903 | — | — | 10,031 | |||||||||||||
Purchase and retirement of common stock |
(423,571 | ) | (42,357 | ) | (2,992,010 | ) | (567,716 | ) | — | (3,602,083 | ) | ||||||||
Dividends declared ($0.36 per share) |
— | — | — | (1,920,744 | ) | — | (1,920,744 | ) | |||||||||||
Stock-based compensation expense |
— | — | 227,434 | — | — | 227,434 | |||||||||||||
Tax benefit on stock plans |
— | — | 25 | — | — | 25 | |||||||||||||
Net income |
— | — | — | 2,910,487 | — | 2,910,487 | |||||||||||||
Cumulative translation adjustment |
— | — | — | — | 141,767 | 141,767 | |||||||||||||
Amortization of cumulative unrealized gain on marketable securities |
— | — | — | — | (2,527 | ) | (2,527 | ) | |||||||||||
Comprehensive income |
3,049,727 | ||||||||||||||||||
Balance, December 31, 2009 |
5,170,018 | 517,002 | 114,021 | 24,690,293 | 661,067 | 25,982,383 | |||||||||||||
Stock options exercised, net of surrendered shares |
95,618 | 9,562 | 444,562 | — | — | 454,124 | |||||||||||||
Dividends declared ($0.38 per share) |
— | — | — | (1,987,806 | ) | — | (1,987,806 | ) | |||||||||||
Stock-based compensation expense |
— | — | 261,859 | — | — | 261,859 | |||||||||||||
Tax benefit on stock plans |
— | — | 101,830 | — | — | 101,830 | |||||||||||||
Net income |
— | — | — | 4,518,384 | — | 4,518,384 | |||||||||||||
Cumulative translation adjustment |
— | — | — | — | (922,163 | ) | (922,163 | ) | |||||||||||
Comprehensive income |
3,596,221 | ||||||||||||||||||
Balance, December 31, 2010 |
5,265,636 | 526,564 | 922,272 | 27,220,871 | (261,096 | ) | 28,408,611 | ||||||||||||
Stock options exercised, net of surrendered shares |
173,174 | 17,317 | 1,243,281 | — | — | 1,260,598 | |||||||||||||
Dividends declared ($0.40 per share) |
— | — | — | (2,148,384 | ) | — | (2,148,384 | ) | |||||||||||
Stock-based compensation expense |
— | — | 388,904 | — | — | 388,904 | |||||||||||||
Tax benefit on stock plans |
— | — | 208,067 | — | — | 208,067 | |||||||||||||
Net income |
— | — | — | 5,450,918 | — | 5,450,918 | |||||||||||||
Cumulative translation adjustment |
— | — | — | — | (328,935 | ) | (328,935 | ) | |||||||||||
Comprehensive income |
5,121,983 | ||||||||||||||||||
Balance, December 31, 2011 |
5,438,810 | $ | 543,881 | $ | 2,762,524 | $ | 30,523,405 | $ | (590,031 | ) | $ | 33,239,779 | |||||||
See accompanying notes to consolidated financial statements.
F-4
MOCON, INC. AND SUBSIDIARIES
Consolidated Statements of Cash Flows
Years ended December 31, 2011, 2010 and 2009
| |
2011 | 2010 | 2009 | |||||||
|---|---|---|---|---|---|---|---|---|---|---|
Cash flows from operating activities: |
||||||||||
Net income |
$ | 5,450,918 | $ | 4,518,384 | $ | 2,910,487 | ||||
Adjustments to reconcile net income to net cash provided by operating activities: |
||||||||||
Stock-based compensation expense |
388,904 | 261,859 | 227,434 | |||||||
Loss on disposition of long-term assets |
7,029 | 11,627 | 9,459 | |||||||
Depreciation and amortization |
616,451 | 544,341 | 577,530 | |||||||
Deferred income taxes |
(173,311 | ) | (234,390 | ) | (31,230 | ) | ||||
Excess tax benefit from employee stock plans |
(208,067 | ) | (101,830 | ) | (25 | ) | ||||
Changes in operating assets and liabilities: |
||||||||||
Trade accounts receivable |
967,666 | (1,158,951 | ) | (506,210 | ) | |||||
Other receivables |
349,008 | (356,793 | ) | 163,047 | ||||||
Inventories |
(356,138 | ) | 72,314 | 477,724 | ||||||
Prepaid income taxes |
159,341 | 22,680 | 243,058 | |||||||
Prepaid expenses, other |
(97,577 | ) | (61,135 | ) | 27,777 | |||||
Accounts payable |
63,000 | 609,985 | 84,797 | |||||||
Compensation and related expenses |
226,124 | 632,832 | (25,295 | ) | ||||||
Other accrued expenses |
74,854 | 167,022 | (147,548 | ) | ||||||
Accrued product warranties |
(10,000 | ) | 12,207 | (20,228 | ) | |||||
Accrued income taxes |
513,614 | 147,113 | (18,095 | ) | ||||||
Deferred revenue |
133,372 | 138,506 | 180,484 | |||||||
Net cash provided by operating activities |
8,105,188 | 5,225,771 | 4,153,166 | |||||||
Cash flows from investing activities: |
||||||||||
Purchases of marketable securities |
(5,841,312 | ) | (4,897,036 | ) | (979,101 | ) | ||||
Proceeds from maturities of marketable securities |
1,182,707 | 4,389,594 | 7,593,729 | |||||||
Purchases of property, plant and equipment |
(882,061 | ) | (1,645,628 | ) | (306,572 | ) | ||||
Cash paid for investment in affiliated company |
— | (3,633,909 | ) | — | ||||||
Proceeds from sale of property and equipment |
713 | 7,590 | 4,491 | |||||||
Cash paid for patent and trademark registrations |
(230,163 | ) | (120,659 | ) | (148,064 | ) | ||||
Other |
(2,769 | ) | (3,521 | ) | (3,522 | ) | ||||
Net cash (used in) provided by investing activities |
(5,772,885 | ) | (5,903,569 | ) | 6,160,961 | |||||
Cash flows from financing activities: |
||||||||||
Proceeds from the exercise of stock options |
1,260,598 | 454,124 | 10,031 | |||||||
Purchases and retirement of common stock |
— | — | (3,602,083 | ) | ||||||
Excess tax benefit from employee stock plans |
208,067 | 101,830 | 25 | |||||||
Dividends paid |
(2,104,739 | ) | (1,952,872 | ) | (1,958,750 | ) | ||||
Net cash used in financing activities |
(636,074 | ) | (1,396,918 | ) | (5,550,777 | ) | ||||
Effect of exchange rate changes on cash and cash equivalents |
(225,631 | ) | (363,163 | ) | 76,298 | |||||
Net increase (decrease) in cash and cash equivalents |
1,470,598 | (2,437,879 | ) | 4,839,648 | ||||||
Cash and cash equivalents: |
||||||||||
Beginning of year |
6,955,248 | 9,393,127 | 4,553,479 | |||||||
End of year |
$ | 8,425,846 | $ | 6,955,248 | $ | 9,393,127 | ||||
Supplemental disclosures of cash flow information: |
||||||||||
Cash paid during the year for income taxes |
$ | 2,371,164 | $ | 2,009,582 | $ | 1,367,575 | ||||
Cash paid during the year for interest |
7,191 | — | 4,046 | |||||||
Supplemental schedule of noncash investing and financing activities: |
||||||||||
Dividends accrued |
$ | 543,881 | $ | 500,235 | $ | 465,302 | ||||
Amortization of cumulative unrealized gain on marketable securities |
— | — | (2,527 | ) | ||||||
Purchases of fixed assets and intangibles in accounts payable |
923 | 28,162 | 25,626 | |||||||
See accompanying notes to consolidated financial statements.
F-5
MOCON, INC. AND SUBSIDIARIES
Notes to Consolidated Financial Statements
December 31, 2011, 2010 and 2009
(1) Summary of Significant Accounting Policies
MOCON, Inc. (the Company) is involved with the developing, manufacturing and marketing of measurement, analytical, monitoring and consulting products for customers in the barrier packaging, food, pharmaceutical, consumer products, industrial hygiene, air quality monitoring, oil and gas exploration and other industries throughout the world. The Company reports its operating segments in accordance with accounting standards codified in ASC 280, Segment Reporting, with three operating segments (Lab Instruments, Field Instruments and Food Safety Products) that have been aggregated into one reporting segment for financial reporting purposes.
The following is a summary of the significant accounting policies used in the preparation of the Company's consolidated financial statements.
- (a)
- Principles of Consolidation
- (b)
- Foreign Currency Translation
The consolidated financial statements include the accounts of the Company and its wholly-owned subsidiaries. All material intercompany balances and transactions have been eliminated in consolidation.
- (c)
- Cash and Cash Equivalents
The financial statements for operations outside the United States are maintained in their local currencies. All assets and liabilities of the Company's foreign subsidiaries are translated to United States dollars at period-end exchange rates, while revenue and expense accounts are translated at the average exchange rates during the period transactions occurred. Translation adjustments arising from the use of differing exchange rates are included in accumulated other comprehensive income or loss in stockholders' equity. Gains and losses on foreign currency transactions are included in other income or loss.
- (d)
- Marketable Securities
- (e)
- Accounts Receivable
The Company considers all highly liquid investments purchased with an original maturity of three months or less to be cash equivalents.
Cash equivalents consist of short-term investments which are readily convertible to cash.
Marketable securities at December 31, 2011 and 2010 consist of municipal bonds and certificates of deposit. The Company classifies its marketable securities as held-to-maturity due to its ability and intent to hold these securities until maturity or the call date as the case may be. Held-to-maturity securities are recorded at amortized cost, adjusted for the amortization or accretion of premiums or discounts. A decline in the market value of any held-to-maturity security below cost, that is deemed other than temporary, is charged to income, resulting in the establishment of a new cost basis for the security.
Credit is granted to customers in the normal course of business. Receivables are recorded at original carrying value, which approximates fair value, less reserves for estimated uncollectible amounts and sales returns. The Company evaluates its estimates and assumptions on an ongoing basis using historical experience and other factors that management believes to be reasonable
F-6
MOCON, INC. AND SUBSIDIARIES
Notes to Consolidated Financial Statements (Continued)
December 31, 2011, 2010 and 2009
(1) Summary of Significant Accounting Policies (Continued)
- (f)
- Inventories
under the circumstances, including the current economic environment. When facts and circumstances dictate, the Company may need to adjust its estimates and assumptions.
- (g)
- Property, Plant and Equipment
Inventories are stated at the lower of cost or market. Cost is determined by the first-in, first-out (FIFO) method, and market represents the lower of replacement cost or estimated net realizable value. The Company records an estimate for excess and obsolete inventory which is based on historical usage and sales history.
- (h)
- Goodwill, Other Intangible Assets and Software Development Costs
Property, plant and equipment are carried at cost. Depreciation and amortization are typically computed using the straight-line method. When assets are retired or otherwise disposed of, the cost and related accumulated depreciation are removed from the accounts, and any resulting gain or loss is recognized in income for the period. The cost of maintenance and repairs is charged to income as incurred and significant renewals and betterments are capitalized.
- (i)
- Impairment of Long-Lived Assets and Long-Lived Assets to be Disposed Of
Goodwill represents the excess of the purchase price over the fair value of assets acquired. Pursuant to the provisions of ASC 350, goodwill and intangible assets acquired in a purchase business combination and determined to have an indefinite useful life are not amortized, but instead tested for impairment at least annually in accordance with the provisions of ASC 350. ASC 350 also requires that intangible assets with estimable useful lives be amortized over their respective estimated useful lives to their estimated residual values, and reviewed for impairment in accordance with ASC 360.
Intangible assets consist of technology rights, patents, trademarks and other intangibles. Technology rights, patents, trademarks and other intangibles are carried at cost less accumulated amortization. Costs incurred in connection with applications for new patents are deferred until a final determination, with respect to the application, is made by appropriate regulatory agencies. Costs of patents abandoned are charged to income in the period of abandonment. Patent costs are amortized over the lesser of 17 years or their estimated useful lives using the straight-line method. Trademarks, trade names and other intangibles are amortized over three to five years.
The costs of software development, including significant product enhancements, incurred subsequent to establishing technological feasibility are capitalized in accordance with ASC 985. Costs incurred prior to establishment of technological feasibility are charged to research and development expense.
The Company reviews its long-lived assets and certain identifiable intangibles for impairment annually or whenever events or changes in circumstances indicate that the carrying amount of an asset may not be recoverable. Recoverability of assets to be held and used is measured by a comparison of the carrying amount of an asset to future undiscounted net cash flows expected to be generated by the asset. If such assets are considered to be impaired, the impairment to be recognized is measured by the amount by which the carrying amount of the assets exceeds the fair
F-7
MOCON, INC. AND SUBSIDIARIES
Notes to Consolidated Financial Statements (Continued)
December 31, 2011, 2010 and 2009
(1) Summary of Significant Accounting Policies (Continued)
- (j)
- Investment in Affiliated Company
value of the assets. Assets to be disposed of are reported at the lower of the carrying amount or fair value less costs to sell.
- (k)
- Derivative Financial Instruments
The Company has an equity investment in Luxcel Biosciences Limited, an early stage development company. The determination to account for this investment under the cost method was dependent upon a number of factors, including, but not limited to, the Company's share in the equity of the investee and the Company's ability to exercise significant influence over the operating and financial policies of the investee.
- (l)
- Warranty
During 2010, the Company entered into a foreign currency contract to mitigate the currency risk on an intercompany loan; this contract matured in January 2011. The Company has not historically entered into foreign currency exchange contracts. Because the market value of this hedging contract was derived from current market rates it was classified as a derivative financial instrument. The derivative contract contained credit risk to the extent that the Company's bank counterparty may have been unable to meet the terms of the agreements. The amount of such credit risk is generally limited to the unrealized gains, if any, in the contracts.
The Company does not use derivatives for speculative or trading purposes. The Company has elected not to apply the hedge accounting guidance under the Derivatives and Hedging Topic of the Codification. As a result, gains or losses related to mark-to-market adjustments on the foreign currency forward exchange contract are recognized as other income or expense in the income statement during the period in which the instrument is outstanding. The fair value of the foreign currency forward exchange contract represented the amount we would have received or paid to terminate the contract at the reporting date and was recorded in other current assets or liabilities depending on whether the net amount was a gain or a loss.
- (m)
- Use of Estimates
The Company records a liability for estimated warranty claims at the time of sale. The amount of the liability is based on the trend in the historical ratio of claims to sales, the historical length of time between the sale and resulting claim, new product introductions and other factors. In the event the Company determines that its current or future product repair and replacement costs exceed the Company estimates, an adjustment to these reserves would be charged to earnings in the period such determination is made.
The preparation of consolidated financial statements in conformity with accounting principles generally accepted in the United States of America requires management to make estimates and assumptions that affect the reported amounts of assets and liabilities and disclosure of contingent assets and liabilities at the date of the consolidated financial statements and the reported amounts of revenues and expenses during the reporting period. Such decisions include the selection of the appropriate accounting principles to be applied and the assumptions on which to base accounting estimates. Estimates are used in determining the allowance for doubtful accounts, inventory
F-8
MOCON, INC. AND SUBSIDIARIES
Notes to Consolidated Financial Statements (Continued)
December 31, 2011, 2010 and 2009
(1) Summary of Significant Accounting Policies (Continued)
- (n)
- Income Taxes
reserves, useful lives for intangible assets, warranty reserves and uncertain tax positions. These estimates and assumptions are based on management's best estimates and judgments. Management evaluates its estimates and assumptions on an ongoing basis using historical experience and other factors that management believes to be reasonable under the circumstances. We adjust such estimates and assumptions when facts and circumstances dictate. As future events and their effects cannot be determined with precision, actual results could differ significantly from those estimated at the time the consolidated financial statements are prepared.
- (o)
- Fair Value of Financial Instruments
- (p)
- Revenue Recognition
Deferred tax assets and liabilities are recognized for the estimated future tax consequences attributable to differences between the financial statement carrying amounts of existing assets and liabilities and their respective tax bases. Deferred tax assets and liabilities are measured using enacted tax rates in effect for the year in which those temporary differences are expected to be recovered or settled. The effect on deferred tax assets and liabilities of a change in tax rates is recognized in income in the period that includes the enactment date. A valuation allowance is provided to offset deferred tax assets if, based on the available evidence, it is more likely than not that some or all of the deferred tax asset will not be realized.
In the ordinary course of business there is inherent uncertainty in quantifying our income tax positions. We assess our income tax positions and record tax benefits for all years subject to examination based upon management's evaluation of the facts, circumstances, and information available at the reporting dates. For those tax positions where it is more likely than not that a tax benefit will be sustained, we have recorded the largest amount of tax benefit with a greater than 50% likelihood of being realized upon ultimate settlement with a taxing authority that has full knowledge of all relevant information. For those income tax positions where it is not more likely than not that a tax benefit will be sustained, no tax benefit has been recognized in the financial statements. Potential accrued interest and penalties related to unrecognized tax benefits are recognized as a component of income tax expense.
The Company's financial instruments are recorded in its consolidated balance sheets. The carrying amount for cash and cash equivalents, accounts receivable, accounts payable and accrued liabilities approximates fair value due to the immediate or short-term maturity of these financial instruments. The fair values of investments in marketable securities are based on quoted market prices and are summarized in Note 2. See Note 15 for fair value disclosure of the investment in Luxcel and Note 17 for fair value disclosure of derivative instruments.
The Company recognizes revenue when it is realized or realizable and earned. The Company considers revenue realized or realizable when persuasive evidence of an arrangement exists, the product has been shipped or the services have been provided to the customer, title and risk of loss of products has passed to the customer, the sales price is fixed or determinable, and collectability is reasonably assured. The Company's terms are FOB shipping point with no right of return, except in rare cases, and customer acceptance of its products is not required. The revenue
F-9
MOCON, INC. AND SUBSIDIARIES
Notes to Consolidated Financial Statements (Continued)
December 31, 2011, 2010 and 2009
(1) Summary of Significant Accounting Policies (Continued)
- (q)
- Advertising Costs
recognition policy does not differ among the various product lines, the marketing venues, or various geographic destinations. The Company does not have distributors who stock its equipment. The Company does not offer rebates, price protection, or other similar incentives, and discounts when offered are recorded as a reduction in revenue.
Revenue for preventive maintenance agreements is recognized on a per visit basis and extended warranties on a straight-line basis over the life of the contracts. Unearned revenue related to these contracts is recorded in current liabilities in the consolidated balance sheets.
In the first quarter 2010, the Company adopted ASC Topic 605 related to recognizing revenue from shipments with multiple element arrangements. This guidance provides that the overall arrangement fee will be allocated to each element (both delivered and undelivered items) based on their relative selling price, as demonstrated by vendor-specific objective evidence (VSOE) or third-party evidence (TPE). Where VSOE or TPE is not available, revenue will be allocated using an estimated selling price. This adoption did not have a material impact on the Company's consolidated financial statements.
Shipping and handling fees billed to customers are reported within sales in the consolidated statements of income, and the related costs are included in cost of sales in the consolidated statements of income.
- (r)
- Research and Development Costs
The Company incurs advertising costs associated with trade shows, print advertising and brochures. Such costs are charged to expense as incurred. Advertising expense was approximately $567,000, $450,000 and $490,000 in 2011, 2010 and 2009, respectively.
- (s)
- Net Income Per Common Share
Research and development expenditures relate to the development of new product hardware and software and enhancements to existing products. All such costs are expensed as incurred.
- (t)
- Stock-Based Compensation
Basic net income per common share is computed by dividing net income by the weighted average of common shares outstanding during the year. Diluted net income per share is computed by dividing net income by the weighted average of common and potential dilutive common shares outstanding during the year.
Under ASC 718, the Company recognizes compensation expense on a straight-line basis over the vesting period for all stock-based awards granted on or after January 1, 2006. Under the provisions of ASC 718, the Company recognizes stock-based compensation net of an estimated forfeiture rate, resulting in the recognition of compensation cost for only those shares expected to vest. See Note 9 for additional information on stock-based compensation.
F-10
MOCON, INC. AND SUBSIDIARIES
Notes to Consolidated Financial Statements (Continued)
December 31, 2011, 2010 and 2009
(1) Summary of Significant Accounting Policies (Continued)
- (u)
- Recently Adopted Accounting Guidance
In January 2010, the FASB updated the disclosure requirements for fair value measurements. The updated guidance requires companies to disclose separately the investments that transfer in and out of Levels 1 and 2 and the reasons for those transfers. Additionally, in the reconciliation for fair value measurement using significant unobservable inputs (Level 3), companies should present separately information about purchases, sales, issuances and settlements. We adopted the updated guidance on January 1, 2010, except for the disclosures about purchases, sales, issuances and settlements in the Level 3 reconciliation, which were effective for fiscal years beginning after December 15, 2010, and adopted on January 1, 2011. The adoption of the required guidance did not have an impact on our consolidated financial statements.
In December 2010, the FASB issued amended guidance to modify Step 1 of the goodwill impairment test for reporting units with zero or negative carrying amounts. For those reporting units, an entity is required to perform Step 2 of the goodwill impairment test if it is more likely than not that a goodwill impairment exists. In determining whether it is more likely than not that a goodwill impairment exists, an entity should consider whether there are any adverse qualitative factors indicating that an impairment may exist. We adopted the modified guidance on January 1, 2011. The adoption of the modified guidance did not have an impact on our consolidated financial statements.
In June 2011, the FASB issued guidance on the presentation of comprehensive income, which requires entities to present reclassification adjustments included in other comprehensive income on the face of the financial statements and allows entities to present the total of comprehensive income, the components of net income and the components of other comprehensive income either in a single continuous statement of comprehensive income or in two separate but consecutive statements. It also eliminates the option for entities to present the components of other comprehensive income as part of the statement of changes in stockholders' equity. In December 2011, the FASB issued an amendment to this standard which defers the requirement that companies present reclassification adjustments for each component of accumulated other comprehensive income in both net income and other comprehensive income on the face of the financial statements. This guidance requires retrospective application and is effective for fiscal years, and interim periods within those years, beginning after December 15, 2011. Adoption of this guidance is not expected to have a material effect on our consolidated financial statements.
F-11
MOCON, INC. AND SUBSIDIARIES
Notes to Consolidated Financial Statements (Continued)
December 31, 2011, 2010 and 2009
(2) Marketable Securities
The amortized cost and fair value for held-to-maturity securities by major security type at December 31, 2011 and 2010 were as follows:
| |
2011 | 2010 | |||||||||||
|---|---|---|---|---|---|---|---|---|---|---|---|---|---|
| |
Amortized Cost |
Fair Value |
Amortized Cost |
Fair Value |
|||||||||
Held-to-maturity: |
|||||||||||||
Municipal bonds |
$ | 4,911,346 | $ | 4,921,201 | $ | 2,220,724 | $ | 2,215,167 | |||||
Certificates of deposit |
5,192,983 | 5,206,119 | 3,225,000 | 3,225,000 | |||||||||
|
$ | 10,104,329 | $ | 10,127,320 | $ | 5,445,724 | $ | 5,440,167 | |||||
There were no gross realized gains or losses for the years ended December 31, 2011, 2010 and 2009.
Maturities of investment securities at December 31, 2011 and 2010 were as follows:
| |
2011 | 2010 | |||||||||||
|---|---|---|---|---|---|---|---|---|---|---|---|---|---|
| |
Amortized Cost |
Fair Value |
Amortized Cost |
Fair Value |
|||||||||
Due within one year |
$ | 4,304,912 | $ | 4,316,235 | $ | 1,058,275 | $ | 1,059,981 | |||||
Due after one year |
5,799,417 | 5,811,085 | 4,387,449 | 4,380,186 | |||||||||
|
$ | 10,104,329 | $ | 10,127,320 | $ | 5,445,724 | $ | 5,440,167 | |||||
(3) Inventories
The major components of inventories at December 31, 2011 and 2010 were as follows:
| |
2011 | 2010 | |||||
|---|---|---|---|---|---|---|---|
Finished products |
$ | 804,049 | $ | 727,718 | |||
Work-in-process |
1,652,708 | 1,652,605 | |||||
Raw materials |
2,023,172 | 1,761,173 | |||||
|
$ | 4,479,929 | $ | 4,141,496 | |||
F-12
MOCON, INC. AND SUBSIDIARIES
Notes to Consolidated Financial Statements (Continued)
December 31, 2011, 2010 and 2009
(4) Property, Plant and Equipment
Property, plant and equipment at December 31, 2011 and 2010 consisted of the following:
| |
2011 | 2010 | Estimated useful lives |
|||||
|---|---|---|---|---|---|---|---|---|
Land |
$ | 200,000 | $ | 200,000 | — | |||
Buildings |
759,281 | 759,281 | 27 years | |||||
Machinery and equipment |
3,552,316 | 3,285,424 | 3 to 10 years | |||||
Office equipment |
1,278,375 | 1,190,443 | 2 to 15 years | |||||
Leasehold improvements |
1,242,996 | 1,214,932 | 1 to 15 years | |||||
Vehicles |
288,909 | 285,453 | 3 to 5 years | |||||
Total property, plant and equipment |
7,321,877 | 6,935,533 | ||||||
Less accumulated depreciation |
(4,147,129 | ) | (4,092,578 | ) | ||||
Net property, plant and equipment |
$ | 3,174,748 | $ | 2,842,955 | ||||
Depreciation of property, plant and equipment was $530,326, $453,810 and $475,673 for the years ended December 31, 2011, 2010 and 2009, respectively.
(5) Goodwill and Other Intangible Assets
Goodwill
As of December 31, 2011 and 2010, goodwill amounted to $3,119,246 and $3,160,858, respectively. The decrease was due to foreign currency translation. The Company completed its annual impairment tests during the fourth quarters of 2011 and 2010 and determined there was no impairment.
Other Intangible Assets
Other intangible assets (all of which are being amortized except projects in process) are as follows:
| |
As of December 31, 2011 | |||||||||
|---|---|---|---|---|---|---|---|---|---|---|
| |
Cost | Accumulated Amortization |
Net | |||||||
Patents |
$ | 1,283,761 | $ | (447,158 | ) | $ | 836,603 | |||
Trademarks and trade names |
516,069 | (443,136 | ) | 72,933 | ||||||
Other intangibles |
80,000 | (80,000 | ) | — | ||||||
|
$ | 1,879,830 | $ | (970,294 | ) | $ | 909,536 | |||
F-13
MOCON, INC. AND SUBSIDIARIES
Notes to Consolidated Financial Statements (Continued)
December 31, 2011, 2010 and 2009
(5) Goodwill and Other Intangible Assets (Continued)
| |
As of December 31, 2010 | |||||||||
|---|---|---|---|---|---|---|---|---|---|---|
| |
Cost | Accumulated Amortization |
Net | |||||||
Patents |
$ | 1,075,437 | $ | (412,678 | ) | $ | 662,759 | |||
Trademarks and trade names |
495,850 | (419,380 | ) | 76,470 | ||||||
Other intangibles |
778,596 | (751,929 | ) | 26,667 | ||||||
|
$ | 2,349,883 | $ | (1,583,987 | ) | $ | 765,896 | |||
Amortization expense was $86,125, $90,531 and $101,857 in 2011, 2010 and 2009, respectively.
Estimated amortization expense for the fiscal years 2012 to 2016 and thereafter is $58,408, $54,093, $43,669, $39,017 and $229,808, respectively.
(6) Warranty
The Company provides a warranty for most of its products. Warranties are for periods ranging from ninety days to one year, and cover parts and labor for non-maintenance repairs, at the Company location. Operator abuse, improper use, alteration, damage resulting from accident, or failure to follow manufacturer's directions are excluded from warranty coverage.
Warranty expense is accrued at the time of sale based on historical claims experience. Warranty reserves are also accrued for special rework campaigns for known major product modifications. The Company also offers extended warranty service contracts for select products when the factory warranty period expires.
F-14
MOCON, INC. AND SUBSIDIARIES
Notes to Consolidated Financial Statements (Continued)
December 31, 2011, 2010 and 2009
(6) Warranty (Continued)
Warranty provisions and claims for the years ended December 31, 2011, 2010 and 2009 were as follows:
Description
|
Balance at Beginning of Year |
Warranty Provisions |
Warranty Claims |
Balance at End of Year |
|||||||||
|---|---|---|---|---|---|---|---|---|---|---|---|---|---|
Year ended December 31, 2011: |
|||||||||||||
Allowance for product warranties |
$ | 217,819 | 227,112 | 239,425 | 205,506 | ||||||||
Year ended December 31, 2010: |
|||||||||||||
Allowance for product warranties |
$ | 209,710 | 305,167 | 297,058 | 217,819 | ||||||||
Year ended December 31, 2009: |
|||||||||||||
Allowance for product warranties |
$ | 229,087 | 294,579 | 313,956 | 209,710 | ||||||||
(7) Commitments and Contingencies
- (a)
- Leases
The Company leases its facilities and certain equipment pursuant to operating leases. The facility leases expire at various times through October 2025 and require the Company to pay operating costs, including real estate taxes.
Rental expense, including charges for operating costs, was $629,405, $533,828 and $462,131 in 2011, 2010 and 2009, respectively.
The following is a schedule of future minimum lease payments, excluding charges for operating costs, for operating leases as of December 31, 2011:
Year Ending December 31
|
|
|||
|---|---|---|---|---|
2012 |
$ | 566,615 | ||
2013 |
510,485 | |||
2014 |
508,182 | |||
2015 |
518,397 | |||
2016 |
528,612 | |||
2017 and thereafter |
4,348,802 | |||
|
$ | 6,981,093 | ||
(b) Executive Severance Agreements
The Company has a severance agreement with five of its executive officers which provides for the payment to the executive of a lump sum amount upon the occurrence of certain termination events. The payment could amount to one or two times the executive's current annual salary depending on the reason for termination.
F-15
MOCON, INC. AND SUBSIDIARIES
Notes to Consolidated Financial Statements (Continued)
December 31, 2011, 2010 and 2009
(7) Commitments and Contingencies (Continued)
(c) Inventory Purchase Obligations
At December 31, 2011, the Company had approximately $2.45 million of purchase order commitments to suppliers of the Company for delivery of inventory primarily during 2012.
(d) Internal Use Software
During 2011, the Company entered into an agreement with a third party for consulting and training services related to an upgrade and implementation of an enterprise resource planning (ERP) system. Per the terms of the contract, payment is due upon reaching defined project milestones. The Company will be obligated to pay the remaining amount of approximately $400,000 upon reaching certain milestones, which are expected to be achieved during 2012.
(8) Income Taxes
Income before income taxes was as follows:
| |
2011 | 2010 | 2009 | |||||||
|---|---|---|---|---|---|---|---|---|---|---|
Income before income taxes: |
||||||||||
Domestic |
$ | 6,405,112 | $ | 5,060,452 | $ | 2,824,230 | ||||
Foreign |
1,798,868 | 1,402,918 | 1,405,124 | |||||||
Total |
$ | 8,203,980 | $ | 6,463,370 | $ | 4,229,354 | ||||
The provision (benefit) for income taxes consists of the following:
| |
2011 | 2010 | 2009 | |||||||
|---|---|---|---|---|---|---|---|---|---|---|
Current tax expense: |
||||||||||
Federal |
$ | 1,934,352 | $ | 1,549,506 | $ | 892,905 | ||||
State |
173,360 | 175,814 | 106,816 | |||||||
Foreign |
552,292 | 443,908 | 352,512 | |||||||
Total current expense |
2,660,004 | 2,169,228 | 1,352,233 | |||||||
Deferred tax expense (benefit): |
||||||||||
Federal |
97,588 | (223,484 | ) | (42,277 | ) | |||||
State |
4,580 | (1,124 | ) | (4,727 | ) | |||||
Foreign |
(9,110 | ) | 366 | 13,638 | ||||||
Total deferred expense (benefit) |
93,058 | (224,242 | ) | (33,366 | ) | |||||
Provision for income taxes |
$ | 2,753,062 | $ | 1,944,986 | $ | 1,318,867 | ||||
F-16
MOCON, INC. AND SUBSIDIARIES
Notes to Consolidated Financial Statements (Continued)
December 31, 2011, 2010 and 2009
(8) Income Taxes (Continued)
The effective income tax rate varies from the federal statutory tax rate for the following reasons:
| |
Percentage of pretax income for years ended December 31, |
|||||||||
|---|---|---|---|---|---|---|---|---|---|---|
| |
2011 | 2010 | 2009 | |||||||
Tax at statutory federal income tax rate |
34.0 | % | 34.0 | % | 34.0 | % | ||||
Increases (reductions) in taxes resulting from: |
||||||||||
State income taxes, net of federal benefit |
1.5 | 1.8 | 1.6 | |||||||
Change in valuation allowance |
0.6 | — | (1.0 | ) | ||||||
Domestic manufacturing deduction |
(2.1 | ) | (2.5 | ) | (1.5 | ) | ||||
Effect of foreign operations |
(0.7 | ) | (0.5 | ) | (1.6 | ) | ||||
Foreign dividend income |
— | (2.9 | ) | — | ||||||
Tax-exempt interest |
(0.2 | ) | (0.2 | ) | (0.9 | ) | ||||
Changes in unrecognized tax benefits |
0.3 | 0.6 | (0.3 | ) | ||||||
Stock option compensation |
0.3 | 0.7 | 1.6 | |||||||
Research credit |
(1.0 | ) | (1.1 | ) | (1.2 | ) | ||||
Other |
0.9 | 0.2 | 0.5 | |||||||
Effective income tax rate |
33.6 | % | 30.1 | % | 31.2 | % | ||||
The tax effect of significant temporary differences representing deferred tax assets and liabilities at December 31, 2011 and 2010 were as follows:
| |
2011 | 2010 | |||||
|---|---|---|---|---|---|---|---|
Deferred tax assets: |
|||||||
Allowance for doubtful accounts |
$ | 40,155 | $ | 53,708 | |||
Inventory items |
159,547 | 129,073 | |||||
Reserves and accruals |
542,095 | 445,905 | |||||
Capital loss carryforward |
— | 317,691 | |||||
Compensation expense—stock options |
128,045 | 101,170 | |||||
Foreign tax credit carryover |
279,366 | 184,672 | |||||
Intangibles |
33,371 | 54,332 | |||||
Other |
205,769 | 132,569 | |||||
Subtotal |
1,388,348 | 1,419,120 | |||||
Less: Valuation allowance |
(50,504 | ) | (317,691 | ) | |||
Total deferred tax assets |
1,337,844 | 1,101,429 | |||||
Deferred tax liabilities: |
|||||||
Fixed assets |
(468,887 | ) | (174,942 | ) | |||
Unrealized currency gain |
— | (201,734 | ) | ||||
Total deferred tax liabilities |
(468,887 | ) | (376,676 | ) | |||
Net deferred tax asset |
$ | 868,957 | $ | 724,753 | |||
F-17
MOCON, INC. AND SUBSIDIARIES
Notes to Consolidated Financial Statements (Continued)
December 31, 2011, 2010 and 2009
(8) Income Taxes (Continued)
As of December 31, 2011, the Company has determined that establishing a valuation allowance against the deferred tax assets is required since it is more likely than not that the tax benefits of $50,504 from the carry-forward of foreign tax credits will not be realized through generating future foreign source income. However, the Company believes it is more likely than not that the remainder of its deferred tax assets at December 31, 2011 will be realized primarily through generation of future taxable income. During 2011, a capital loss carryforward for which a full valuation allowance was carried, expired. Accordingly, both the deferred tax asset and the related valuation allowance were removed.
In January 2011, the Company's German subsidiary repatriated to the Company 2.5 million euros (approximately $3.3 million) in the form of a dividend distribution. As of December 31, 2011, there was approximately $4,500,000 of accumulated undistributed earnings remaining at the subsidiary. No deferred tax liability has been provided on the remaining foreign earnings. If they were remitted to the Company, applicable U.S. Federal and foreign withholding taxes would be offset by available foreign tax credits.
A reconciliation of the beginning and ending amount of gross unrecognized tax benefits is as follows:
Balance at January 1, 2011 |
$ | 217,000 | ||
Additions based on tax positions related to the current year |
77,000 | |||
Additions based on tax positions related to the prior year |
— | |||
Reductions due to closing of statute of limitations |
(9,000 | ) | ||
Reductions based on tax positions related to the prior year |
(41,000 | ) | ||
Balance at December 31, 2011 |
$ | 244,000 | ||
Included in the balance of total unrecognized tax benefits at December 31, 2011 are potential benefits of $183,000 that if recognized would affect the effective tax rate on income before income taxes. The difference between this amount and the corresponding amount of gross unrecognized tax benefits related primarily to the deferred federal benefit for state income tax related amounts.
The Company does not anticipate that the total amount of unrecognized tax benefits will change significantly in the next twelve months.
The Company recognizes accrued interest and penalties related to unrecognized tax benefits as a component of income tax expense. Total accrued interest and penalties amounted to $34,000 and $31,000 on a gross basis at December 31, 2011 and 2010, respectively, and are excluded from the reconciliation of unrecognized tax benefits presented above.
The Company or one of its subsidiaries files income tax returns in the U.S. federal jurisdiction, several state jurisdictions, China, Germany and the Netherlands. With limited exceptions, the Company is no longer subject to income tax examinations by taxing authorities for taxable years before 2008. In July 2011, the Internal Revenue Service completed its examination of our 2009 Federal income tax return. The audit was completed without having a material impact on our provision for income taxes.
F-18
MOCON, INC. AND SUBSIDIARIES
Notes to Consolidated Financial Statements (Continued)
December 31, 2011, 2010 and 2009
(9) Stock-Based Compensation
As of December 31, 2011, the Company has reserved 391,900 shares of common stock for options and other stock-based incentive awards that are still available for grant under the Company's 2006 stock incentive plan, and 829,786 shares for options that have been granted under either the Company's 2006 stock incentive plan or 1998 stock option plan but have not yet been exercised. The Company issues new shares of common stock upon exercise of stock options.
Under the Company's stock-based incentive plans, option exercise prices are 100% of the market value of the common stock at the date of grant, except if incentive options granted under the 1998 and 2006 plans were granted to persons owning more than 10% of the Company's stock, in which case the option price would be 110% of the market value. Exercise periods are generally for seven to ten years. Certain of the plans allow for the granting of nonqualified stock options. Upon the exercise of these nonqualified options, the Company may realize a compensation deduction allowable for income tax purposes. The after-tax effect of these tax deductions is included in the accompanying consolidated financial statements as an addition to additional paid-in capital.
Stock-based compensation expense is calculated and recognized primarily on a straight-line basis over the vesting periods of the related stock-based reward. The Company generally provides for the vesting of stock options in equal annual installments over a four-year period commencing on the one-year anniversary of the date of grant, or over a one-year period with one-fourth of the underlying shares vesting at the end of each three-month period following the grant date. Stock-based compensation expense recognized in the consolidated financial statements for 2011, 2010 and 2009 was as shown below:
| |
Years Ended December 31, | |||||||||
|---|---|---|---|---|---|---|---|---|---|---|
| |
2011 | 2010 | 2009 | |||||||
Total cost of stock-based compensation |
$ | 388,904 | $ | 261,859 | $ | 227,434 | ||||
Amount of income tax benefit recognized in earnings |
(111,882 | ) | (28,646 | ) | (10,964 | ) | ||||
Amount charged against net income |
$ | 277,022 | $ | 233,213 | $ | 216,470 | ||||
The fair value of each option grant is estimated on the date of grant using the Black-Scholes option-pricing model (Black-Scholes). The Company uses historical data to estimate the expected price volatility, expected option life and expected forfeiture rate. The Company based its estimate of expected volatility for awards granted in 2011, 2010 and 2009 on daily historical trading data of its common stock for a period equivalent to the expected term of the award. The risk-free interest rate is based on the U.S. Treasury yield curve in effect at the time of grant for the estimated life of the option. The Company estimated the expected term consistent with historical exercise and cancellation activity of its previous share-based grants with a seven-year contractual term. Forfeitures were based on historical experience. The dividend yield is calculated based upon the dividend payments made during the prior four quarters as a percent of the average stock price for that period. The following
F-19
MOCON, INC. AND SUBSIDIARIES
Notes to Consolidated Financial Statements (Continued)
December 31, 2011, 2010 and 2009
(9) Stock-Based Compensation (Continued)
assumptions were used to estimate the fair value of options granted during 2011, 2010 and 2009 using the Black-Scholes model:
| |
2011 | 2010 | 2009 | |||||||
|---|---|---|---|---|---|---|---|---|---|---|
Dividend yield |
2.7 | % | 3.3 | % | 4.1 | % | ||||
Expected volatility |
42 | % | 41 | % | 41 | % | ||||
Risk-free interest rate |
1.1 | % | 2.0 | % | 3.0 | % | ||||
Expected lives (in years) |
5.6 | 5.7 | 5.5 | |||||||
Information regarding the Company's stock option plans for 2009, 2010 and 2011 was as follows:
| |
Shares | Weighted Average Exercise Price |
Weighted Average Remaining Contractual Term |
Aggregate Intrinsic Value |
|||||||||
|---|---|---|---|---|---|---|---|---|---|---|---|---|---|
Options outstanding, December 31, 2008 |
848,562 | $ | 8.81 | 4.9 | $ | 567,879 | |||||||
Granted |
96,500 | 9.21 | |||||||||||
Exercised |
(1,275 | ) | 7.87 | ||||||||||
Cancelled or expired |
(6,537 | ) | 10.37 | ||||||||||
Options outstanding, December 31, 2009 |
937,250 | 8.84 | 4.2 | 881,656 | |||||||||
Granted |
123,600 | 12.96 | |||||||||||
Exercised |
(134,865 | ) | 6.76 | ||||||||||
Cancelled or expired |
(13,423 | ) | 8.41 | ||||||||||
Options outstanding, December 31, 2010 |
912,562 | 9.71 | 4.1 | 2,962,426 | |||||||||
Granted |
132,900 | 16.00 | 7.0 | ||||||||||
Exercised |
(203,801 | ) | 8.41 | ||||||||||
Cancelled or expired |
(11,875 | ) | 9.08 | ||||||||||
Options outstanding, December 31, 2011 |
829,786 | $ | 11.05 | 4.1 | $ | 4,108,291 | |||||||
Options exercisable, December 31, 2011 |
625,561 | $ | 9.98 | 3.3 | $ | 3,766,279 | |||||||
The weighted average grant date fair value based on the Black-Scholes model for options granted in 2011, 2010 and 2009 was $4.60, $3.73 and $2.53, respectively. The total intrinsic value of options exercised was $1,341,057, $674,963 and $1,151 during the years ended December 31, 2011, 2010 and 2009, respectively. The aggregate intrinsic values are based upon the closing price of our common stock on the last day of the respective fiscal year.
F-20
MOCON, INC. AND SUBSIDIARIES
Notes to Consolidated Financial Statements (Continued)
December 31, 2011, 2010 and 2009
(9) Stock-Based Compensation (Continued)
A summary of the status of the Company's unvested option shares as of December 31, 2011 is as follows:
| |
Number of Shares |
Weighted Average Grant Date Fair Value |
|||||
|---|---|---|---|---|---|---|---|
Unvested at December 31, 2010 |
185,812 | $ | 3.23 | ||||
Options granted |
132,900 | 4.60 | |||||
Options cancelled |
(1,950 | ) | 2.92 | ||||
Options vested |
(112,537 | ) | 3.46 | ||||
Unvested at December 31, 2011 |
204,225 | $ | 4.00 | ||||
As of December 31, 2011, there was $816,788 of total unrecognized compensation cost related to unvested stock-based compensation granted under the Company's plans. That cost is expected to be recognized over a weighted-average period of 1.7 years. The total fair value of option shares vested during the years 2011, 2010 and 2009 was $388,904, $261,860 and $230,365, respectively.
(10) Other Income
Other income, net for 2011, 2010 and 2009 was as follows:
| |
Years Ended December 31, | |||||||||
|---|---|---|---|---|---|---|---|---|---|---|
| |
2011 | 2010 | 2009 | |||||||
Interest income on investments |
$ | 117,680 | $ | 84,199 | $ | 369,176 | ||||
Foreign currency exchange gain (loss) |
(37,276 | ) | 542,108 | (2,956 | ) | |||||
Other |
(805 | ) | 2,605 | (168 | ) | |||||
Total other income |
$ | 79,599 | $ | 628,912 | $ | 366,052 | ||||
(11) Stockholders' Equity
In the period from March through June 2009, the Company repurchased 181,171 shares of its outstanding common stock. These purchases exhausted the authorization which had been in place since November, 2005. On June 23, 2009, the Board of Directors authorized the repurchase of up to an additional $2,000,000 of its common stock. In August 2009, the Company repurchased a total of 242,400 shares of the Company's common stock which exhausted the 2009 authorization. Currently, there is no authorization in place to repurchase any of the Company's common stock.
F-21
MOCON, INC. AND SUBSIDIARIES
Notes to Consolidated Financial Statements (Continued)
December 31, 2011, 2010 and 2009
(12) Net Income per Common Share
The following table presents a reconciliation of the denominators used in the computation of net income per common share—basic and net income per common share—diluted for the years ended December 31, 2011, 2010 and 2009:
| |
Years Ended December 31, | |||||||||
|---|---|---|---|---|---|---|---|---|---|---|
| |
2011 | 2010 | 2009 | |||||||
Weighted shares of common stock outstanding—basic |
5,342,900 | 5,208,873 | 5,393,066 | |||||||
Weighted shares of common stock assumed upon exercise of stock options |
229,746 | 155,380 | 64,898 | |||||||
Weighted shares of common stock outstanding—diluted |
5,572,646 | 5,364,253 | 5,457,964 | |||||||
Outstanding stock options of 251,687 and 574,387 at December 31, 2010 and 2009 have been excluded from the net income per common share calculations because the effect on net income per common share would have been anti-dilutive. At December 31, 2011, there were no outstanding stock options that were deemed to be anti-dilutive because the market value of the Company's common stock was equal to, or greater than, the exercise price of the currently outstanding options.
(13) Product Line, Geographical and Significant Customer Information
The following table summarizes total sales by product line for 2011, 2010 and 2009 respectively:
| |
Years Ended December 31, | |||||||||
|---|---|---|---|---|---|---|---|---|---|---|
| |
2011 | 2010 | 2009 | |||||||
Permeation testing products and services |
$ | 22,160,447 | $ | 18,077,953 | $ | 15,126,259 | ||||
Gas analyzers, sensors and detectors |
6,802,153 | 5,738,948 | 4,933,256 | |||||||
Package testing products and services |
5,951,112 | 5,062,414 | 4,701,279 | |||||||
Other products and services |
2,447,155 | 2,669,314 | 1,877,304 | |||||||
Total sales |
$ | 37,360,867 | $ | 31,548,629 | $ | 26,638,098 | ||||
F-22
MOCON, INC. AND SUBSIDIARIES
Notes to Consolidated Financial Statements (Continued)
December 31, 2011, 2010 and 2009
(13) Product Line, Geographical and Significant Customer Information (Continued)
The following table summarizes total sales, based upon the country to which sales to external customers were made for fiscal years 2011, 2010 and 2009. All of the Company's tangible assets are located in the United States, except for an insignificant amount of property and equipment in Germany and China.
| |
Years Ended December 31, | |||||||||
|---|---|---|---|---|---|---|---|---|---|---|
| |
2011 | 2010 | 2009 | |||||||
Domestic sales |
$ | 16,297,487 | $ | 13,806,660 | $ | 11,790,911 | ||||
Foreign sales: |
||||||||||
Europe |
8,654,088 | 7,148,879 | 6,591,749 | |||||||
Asia |
8,237,348 | 8,482,788 | 5,996,005 | |||||||
Other |
4,171,944 | 2,110,302 | 2,259,433 | |||||||
Total foreign sales |
21,063,380 | 17,741,969 | 14,847,187 | |||||||
Total sales |
$ | 37,360,867 | $ | 31,548,629 | $ | 26,638,098 | ||||
The Company's products are marketed outside of North America through various independent representatives. One independent representative accounted for approximately 10% of the consolidated sales in 2010, and 15% of the consolidated trade accounts receivable balance at December 31, 2010.
(14) Savings and Retirement Plan
The Company has a 401(k) Savings and Retirement Plan covering substantially all of its employees. The Company provides matching contributions in accordance with the plan. The Company's contributions to this plan in 2011, 2010 and 2009 were $218,319, $196,993 and $193,115, respectively.
(15) Investment in Affiliated Company
In January 2010, the Company acquired a minority equity ownership interest in Luxcel Biosciences Limited (Luxcel) based in Cork, Ireland. The investment of €2,500,000 (approximately $3,625,000) amounted to a 16.9% equity interest in Luxcel. The Company has evaluated the cost versus equity method of accounting for its investment in Luxcel and determined that it does not have the ability to exercise significant influence over the operating and financial policies of Luxcel and, therefore, accounts for its investment on a cost basis. In addition, the Company acquired warrants to purchase an additional 375,000 shares at €2.24 per share at any time within three years from the date of the initial investment.
Luxcel has developed phosphorescence-based sensors that enable rapid, high-throughput screening and detection of bacterial contamination of food samples, non-invasive analysis of gas in food, beverage and pharmaceutical packaging, and one of the most specific measures of drug toxicity and metabolism within pharmaceutical research and development.
The investment in Luxcel is carried on our balance sheet at the original purchase price, adjusted for currency fluctuations. The Company believes that it is not feasible to readily estimate the fair value of its investment in Luxcel. Information related to future cash flows of Luxcel is not readily available as the entity is a start-up research and development company and future cash flows are highly dependent
F-23
MOCON, INC. AND SUBSIDIARIES
Notes to Consolidated Financial Statements (Continued)
December 31, 2011, 2010 and 2009
(15) Investment in Affiliated Company (Continued)
on their ability to obtain additional funding, gain acceptance of its products in the marketplace, and obtain regulatory approvals. Luxcel has provided reimbursement for certain research and development costs incurred by the Company in the amounts of approximately $175,000 and $165,000 in 2011 and 2010, respectively, which have been reflected in the Consolidated Statements of Income as a reduction of research and development expenses.
As part of the relationship with Luxcel, we purchase sensors which accompany our instruments for sale to an end user and are required to pay a royalty to Luxcel on the sale of such instruments.
(16) Derivatives
At December 31, 2010, we had one outstanding foreign currency forward contract with a notional amount totaling approximately $3,089,000. The contract matured in January 2011 which coincided with the settlement of the intercompany loan. As of December 31, 2010, the fair value of this contract resulted in a receivable of approximately $250,000 and was recorded in other income and other current receivables. There are no outstanding foreign currency contracts as of December 31, 2011.
(17) Fair Value Measurements
A hierarchy for inputs used in measuring fair value is in place that distinguishes market data between observable independent market inputs and unobservable market assumptions by the reporting entity. The hierarchy is intended to maximize the use of observable inputs and minimize the use of unobservable inputs by requiring that the most observable inputs be used when available. Level 1 provides the most reliable measure of fair value, while Level 3 generally requires significant management judgment. The three levels are defined as follows:
Level 1—Inputs are unadjusted quoted prices in active markets for identical assets and liabilities.
Level 2—Observable inputs other than quoted prices for the asset or liability, either directly or indirectly. These include quoted prices for similar assets or liabilities in active markets and quoted prices for identical or similar assets or liabilities in markets that are not active.
Level 3—Unobservable inputs that reflect the reporting entity's own assumptions.
As of December 31, 2011, there are no assets or liabilities subject to fair value measurement. The population of financial assets and liabilities subject to fair value measurement at December 31, 2010 was as follows:
| |
Fair Value | Level 2 | |||||
|---|---|---|---|---|---|---|---|
Assets: |
|||||||
Foreign currency forward exchange contract |
$ | 250,000 | $ | 250,000 | |||
Foreign currency forward exchange contracts are carried at fair value based on significant other observable market inputs, in this case, quoted foreign currency exchange rates. Such valuation represents the amount we would receive or pay to terminate the forward exchange contract at the reporting date.
F-24
MOCON, INC. AND SUBSIDIARIES
Notes to Consolidated Financial Statements (Continued)
December 31, 2011, 2010 and 2009
(18) Subsequent Event
On March 9, 2012, the Company entered into a share purchase agreement with PBI Holding A/S (PBI Holding), a Danish company based in Ringsted, Denmark, that provides for the acquisition by our Company of the outstanding shares of PBI-Dansensor A/S (Dansensor), a subsidiary of PBI Holding. Under the terms of the agreement, the Company will purchase the issued and outstanding shares of Dansensor for an aggregate of DKK 112,000,000 (approximately $20,000,000), two-thirds of which will be paid at closing and the remainder of which will be paid over four years pursuant to a secured note issued to the seller.
In connection with entering into this acquisition, the Company entered into a commitment letter with Wells Fargo Bank, N.A. to secure financing necessary to fund a portion of the cash consideration required to effect the transaction. The committed debt financing includes a combination of a $5.0 million secured revolving credit line that has a four year maturity date and a $3.5 million term loan that amortizes over four years.
The Company anticipates that the closing of the acquisition transaction will occur on or about April 2, 2012.
F-25
MOCON, INC.
EXHIBIT INDEX TO ANNUAL REPORT ON FORM 10-K
FOR THE YEAR ENDED DECEMBER 31, 2011
| |
Exhibit No.
|
Exhibit | Method of Filing | ||||
|---|---|---|---|---|---|---|---|
| 3.1 | Restated Articles of Incorporation of MOCON, Inc. | Incorporated by reference to Exhibit 3.1 to our Annual Report on Form 10-K for the fiscal year ended December 31, 2006 (File No. 000-09273) | |||||
3.2 |
Third Restated Bylaws of MOCON, Inc. |
Incorporated by reference to Exhibit 3.2 to our Current Report on Form 10-Q filed on August 12, 2011 (File No. 000-09273) |
|||||
10.1 |
Office/Warehouse Lease, dated March 9, 2010, by and between MOCON, Inc. and Minnesota Industrial Properties Limited Partnership |
Incorporated by reference to Exhibit 10.4 to our Annual Report on Form 10-K for the fiscal year ended December 31, 2009 (File No. 000-09273) |
|||||
10.2 |
MOCON, Inc. 1998 Stock Option Plan, as amended |
Incorporated by reference to Appendix A to our Definitive Proxy Statement on Form DEF-14A filed on April 9, 2002 (File No. 000-09273) |
|||||
10.3 |
Form of Incentive Stock Option Agreement between MOCON, Inc. and its Executive Officers under the MOCON, Inc. 1998 Stock Option Plan, as amended |
Incorporated by reference to Exhibit 99.1 to our Current Report on Form 8-K filed on December 29, 2004 (File No. 000-09273) |
|||||
10.4 |
Form of Non-Statutory Stock Option Agreement between MOCON, Inc. and its Non-Employee Directors and Executive Officers under the MOCON, Inc. 1998 Stock Option Plan, as amended |
Incorporated by reference to Exhibit 99.2 to our Current Report on Form 8-K filed on December 29, 2004 (File No. 000-09273) |
|||||
10.5 |
MOCON, Inc. 2006 Stock Incentive Plan |
Incorporated by reference to Exhibit 10.1 to our Current Report on Form 8-K filed on June 1, 2011 (File No. 000-09273) |
|||||
10.6 |
Form of Incentive Stock Option Agreement between MOCON, Inc. and its Executive Officers under the MOCON, Inc. 2006 Stock Incentive Plan |
Incorporated by reference to Exhibit 10.2 to our Current Report on Form 8-K filed on May 23, 2006 (File No. 000-09273) |
|||||
10.7 |
Form of Non-Statutory Stock Option Agreement between MOCON, Inc. and its Non-Employee Directors and Executive Officers under the MOCON, Inc. 2006 Stock Incentive Plan |
Incorporated by reference to Exhibit 10.3 to our Current Report on Form 8-K filed on May 23, 2006 (File No. 000-09273) |
|||||
10.8 |
Form of Executive Severance Agreement |
Incorporated by reference to Exhibit 10.11 to our Annual Report on Form 10-K for the fiscal year ended December 31, 2007 (File No. 000-09273) |
|||||
| |
Exhibit No.
|
Exhibit | Method of Filing | ||||
|---|---|---|---|---|---|---|---|
| 10.9 | 2003 Compensation Committee resolution setting forth the MOCON Incentive Pay Plan, as amended | Filed herewith | |||||
10.10 |
Description of Non-Employee Director Retirement Plan |
Incorporated by reference to Exhibit 10.20 to our Annual Report on Form 10-K for the fiscal year ended December 31, 2004 (File No. 000-09273) |
|||||
10.11 |
Subscription and Shareholders Agreement dated December 21, 2009 among MOCON, Inc., Luxcel Biosciences, Enterprise Ireland, Glanbia Enterprise Fund, and certain other parties named therein |
Incorporated by reference to Exhibit 10.1 to our Current Report on Form 8-K filed December 23, 2009 (File No. 000-09273) |
|||||
10.12 |
Share Purchase Agreement dated March 9, 2012, by and between MOCON, Inc. and PBI Holding A/S |
Incorporated by reference to Exhibit 10.1 to our Current Report on Form 8-K filed on March 12, 2012 (File No. 000-09273) |
|||||
10.13 |
Description of Non-Employee Director Compensation Arrangements |
Filed herewith |
|||||
10.14 |
Description of Executive Officer Compensation Arrangements |
Filed herewith |
|||||
21.1 |
Subsidiaries of MOCON, Inc. |
Filed herewith |
|||||
23.1 |
Consent of Independent Registered Public Accounting Firm |
Filed herewith |
|||||
31.1 |
Principal Executive Officer Certification Pursuant to Section 302 of the Sarbanes-Oxley Act of 2002 |
Filed herewith |
|||||
31.2 |
Principal Financial Officer Certification Pursuant to Section 302 of the Sarbanes-Oxley Act of 2002 |
Filed herewith |
|||||
32.1 |
Certification Pursuant to Section 906 of the Sarbanes-Oxley Act of 2002 (Chief Executive Officer) |
Furnished herewith |
|||||
32.2 |
Certification Pursuant to Section 906 of the Sarbanes-Oxley Act of 2002 (Chief Financial Officer) |
Furnished herewith |
|||||
101.INS |
XBRL Instance Document |
Furnished herewith |
|||||
101.SCH |
XBRL Taxonomy Extension Schema Document |
Furnished herewith |
|||||
101.CAL |
XBRL Taxonomy Extension Calculation Linkbase Document |
Furnished herewith |
|||||
101.DEF |
XBRL Taxonomy Extension Definition Linkbase Document |
Furnished herewith |
|||||
101.LAB |
XBRL Taxonomy Extension Label Linkbase Document |
Furnished herewith |
|||||
101.PRE |
XBRL Taxonomy Extension Presentation Linkbase Document |
Furnished herewith |
|||||
Financial Statement Schedule:
II—Valuation and Qualifying Accounts
All other schedules are omitted as the required information is inapplicable or the information is presented in our consolidated financial statements or related notes.
Description
|
Balance at Beginning of Year |
Charged to Costs and Expenses |
Deductions | Balance at End of Year |
|||||||||
|---|---|---|---|---|---|---|---|---|---|---|---|---|---|
Year ended December 31, 2011: |
|||||||||||||
Allowance for doubtful accounts and sales returns |
$ | 183,291 | 16,653 | 49,023 | 150,921 | ||||||||
Year ended December 31, 2010: |
|||||||||||||
Allowance for doubtful accounts and sales returns |
$ | 162,315 | 102,860 | 81,884 | 183,291 | ||||||||
Year ended December 31, 2009: |
|||||||||||||
Allowance for doubtful accounts and sales returns |
$ | 137,182 | 113,521 | 88,388 | 162,315 | ||||||||
S-1