Attached files
| file | filename |
|---|---|
| EX-99.1 - REGISTRANT'S PRESS RELEASE - MOBILE MINI INC | d306363dex991.htm |
| 8-K - FORM 8-K - MOBILE MINI INC | d306363d8k.htm |
Exhibit 99.2

| Quarterly Investor Presentation Fourth Quarter 2011 |
| 2 This presentation contains statements about future events and expectations that constitute forward-looking statements. These statements can be identified by our use of the words "believes", "expects", "projects", "should" or similar words. The forward- looking statements herein include statements regarding the Company's future financial performance, business strategy, budgets, projected cost savings and plans and objectives of management for future operations. These forward-looking statements are based on current expectations and assumptions and are not guarantees of future performance and are subject to risks and uncertainties that are difficult to predict and which may cause actual results to vary materially because of factors in this presentation, the Company's most recent earnings press release, the Company's Annual Report on Form 10-K and Quarterly Reports on Form 10-Q and other filings with the Securities and Exchange Commission. We undertake no obligation to update or revise any forward-looking statements, whether as a result of new information, future events or otherwise. In addition to disclosing financial results that are determined in accordance with U.S. generally accepted accounting principles ("GAAP"), the Company also discloses in this presentation certain non-GAAP financial information including adjusted EBITDA, adjusted EBITDA margin, adjusted SG&A, adjusted diluted EPS and free cash flow. These financial measures are not recognized measures under GAAP and are not intended to be and should not be considered in isolation or as a substitute for, or superior to, the financial information prepared and presented in accordance with GAAP. |

| 3 Financial Highlights Q4 2011 Results Well Positioned for Future Growth Free Cash Flow EPS EBITDA Growth Revenue Growth Total revenues for Q4 11 increased 9.7% from Q4 10 Leasing revenues for Q4 11 increased 11.5% from Q4 10 Comparable quarter increase in lease revenue and growth rates for fourth sequential quarter Q4 11 yield was 5.7% higher than Q4 10 Entered twelve new markets in 2011 Adjusted EBITDA margin for Q4 11 remained strong at 38.8%; 2011 37.4% Adjusted EBITDA increased 6.6% from Q4 10 to Q4 11 2011 adjusted EBITDA of $136.1 million Adjusted diluted EPS of $0.24 for Q4 11 is up 33% from $0.18 for Q4 10 Adjusted diluted EPS of $0.76 for 2011 Sixteen consecutive quarters of free cash flow $16.4 million in Q4 11; 2011 $80.0 million Net CAPEX of $5.0 million for 2011 FCF used to paydown debt of $12.0 million in Q4 11; 2011 $75.3 million |

| 4 Diverse End Markets and Customer Base MINI is the Leader in Expanding Market Awareness Beyond Traditional Portable Storage Customer Segments Customer Breakdown (December 31, 2011) Retail / Consumer Services Increased activity Construction Increased activity Diverse customer base 20 largest customers for 2011 represented 8.7% of leasing revenues |

| 5 Lease Fleet Management Average Utilization Average utilization increased 5.5 percentage points in Q4 11 to 61.0% from Q4 10 of 55.5% Redeploying fleet to existing and new markets to improve utilization: Entered three in 2010 Entered twelve in 2011 Our average lease fleet size has declined for fourteen consecutive quarters as we have cut fleet CAPEX and continue our disciplined practice of selling units out of the fleet to our customers Substantial embedded growth opportunity in existing lease fleet without additional CAPEX spending: High incremental EBITDA margins generated with utilization improvement Note: Average Utilization defined as average units on rent divided by average lease fleet size. Average Lease Fleet Size (# of units) |

| 6 Compelling Core Asset Economics Long-lived assets Minimal maintenance CAPEX requirements No model year Rapid payback period Average cost of remanufactured steel storage unit: ~$3,500 Average rent per unit: ~$100/month 35 month payback on assets that last 30+ years High incremental EBITDA leasing margins Long contract periods Average existing lease duration for units beyond initial contract signing: 35 months Lease Fleet Breakdown (units) Total - 237,600 units As of December 31, 2011 |

| 7 Market leadership, sales discipline and differentiated product offering have provided rental rate stability Implemented revised sales commission incentives that support rental rate retention and more profitable transportation rates Q4 11 yield was 5.7% higher than Q4 10 primarily due to increased units on rent and ancillary revenues with rates increasing 2.2% Q4 11 yield decreased 2.2% from Q3 11 primarily due to ancillary revenues Fleet Leasing Yield Quarterly Leasing Yield Yield Bridge Q4 10 to Q4 11 Yield Bridge Q3 11 to Q4 11 Note: Fleet Leasing Yield defined as leasing revenue divided by average units on rent. |

| 8 North American Market Strong market leadership in virtually all markets served Growth potential continues to be attractive Significant opportunity to increase penetration within existing markets Maximize fleet utilization and EBITDA margin Converted numerous branches to operating yards High incremental EBITDA margins from leasing of approximately 68% Existing Markets Growth Initiatives Strategy to reposition existing idle fleet for utilization enhancement and growth We have identified more than 50 potential new markets Entered twelve new markets in 2011 Plan to enter at least 8 new markets in 2012 Repositioning allows for cost effective new branch openings with minimal CAPEX & start-up cost Additional focus on consumer market by expanding product offering including providing warehouse storage Add offering to seven existing markets Leverage existing cost structure, advertising & idle fleet Stronger brand awareness will benefit core business (68) Operational Yards (30) Corporate Headquarters Branch Offices (69) Operational Yards (44) |
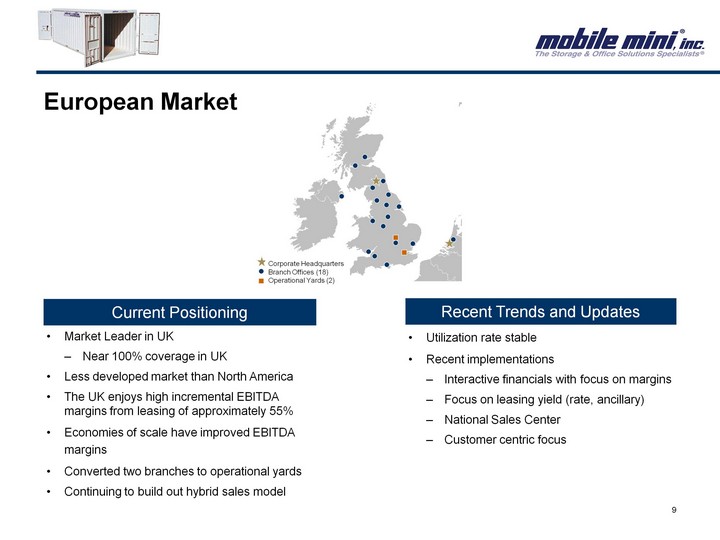
| 9 Market Leader in UK Near 100% coverage in UK Less developed market than North America The UK enjoys high incremental EBITDA margins from leasing of approximately 55% Economies of scale have improved EBITDA margins Converted two branches to operational yards Continuing to build out hybrid sales model European Market Current Positioning Recent Trends and Updates Utilization rate stable Recent implementations Interactive financials with focus on margins Focus on leasing yield (rate, ancillary) National Sales Center Customer centric focus Corporate Headquarters Branch Offices (18) Operational Yards (2) |

| 10 Financial Review |

| 11 Summary Revenue Highlights Total Revenue Lease Revenue Lease Revenue as % of Total Revenue Total revenue for Q4 11 increased 9.7% from Q4 10 Lease revenue increased 11.5% from Q4 10 levels due to increased deliveries and higher fleet utilization Q4 11 sales revenues were $10.2 million and sales margins were 37.9% Lease revenues for Q4 11 increased 3.0% from Q3 11 levels driven by higher fleet utilization |

| 12 # of Employees Adjusted SG&A Expense SG&A and Performance Update Q4 11 adjusted SG&A decreased $0.1 million or 0.2% from Q3 11 levels Q4 11 adjusted SG&A increased $6.6 million over Q4 10 primarily driven by: Fleet transportation, repair and maintenance and payroll costs related to higher utilization Costs related to geographic expansion including new hires at these locations Fleet repositioning to new and existing markets Insurance (healthcare claims and premiums) (1) (1) Excludes $0.3 in fiscal 2010 and $2.0 million 2011 YTD related to one-time events. |

| 13 Adjusted EBITDA EBITDA for Q4 11 increased 6.6% from Q4 10 Q4 11 is the third year-over-year quarterly increase to EBITDA since Q2 2009 Maintaining strong EBITDA margins Q4 11 adjusted EBITDA margin of 38.8%; 2011 37.4% 2011 adjusted EBITDA of $136.1 million Adjusted EBITDA Bridge Adjusted EBITDA Adjusted EBITDA Margin % |

| 14 Significant Operating Leverage in Business Model Note: Data reflects adjusted 12-31-11 results. |

| 15 Performance (North America & Europe) Total Revenue Adjusted EBITDA Margin Lease Fleet NBV Lease Revenue |

| 16 Effective CAPEX Management Significant Free Cash Flow Before Historical Growth Oriented Fleet Capital Expenditures Note: Excludes acquisition related capital expenditures. (1) Excludes fleet maintenance costs which are expensed on the income statement. CAPEX levels are driven by rental fleet expansion Net CAPEX is $5 million for 2011 (1) |

| 17 FCF Utilized for Debt Repayment Free Cash Flow Generation and Successful Debt Reduction Measures Sixteen consecutive quarters of positive free cash flow Significant increase in FCF since Q2 08 Q4 11 FCF of $16.4 million; 2011 $80.0 million FCF fluctuations in Q4 11 and Q2 11 are due to the timing of our interest payments on our two senior unsecured notes as a result of our Q4 10 refinancing. Interest now paid in the same quarters (Q2 and Q4) in 2011 versus having one payment in each quarter in 2010. Net debt paydown of $12.0 million in Q4 11, 2011 $75.3 million after payment of $1.1 million call premium related to a $22.3 million senior note redemption We have generated free cash flow of $258.5 million and reduced debt by $235.3 million since the acquisition of Mobile Storage Group in June 2008 Free Cash Flow Total Debt |

| 18 High Level of Liquidity with Attractive Debt Maturity Profile High level of availability with over $455 million in excess ABL borrowing availability as of 12/31/11 Financial covenants triggered only if liquidity falls below $100 million Assets with strong value retention characteristics ABL refinanced February 22, 2012 and maturity extended to February 2017 Note: Data as of December 31, 2011 |

| 19 Current Positioning Financial Growth Opportunities Sales & Marketing Products Sales and marketing focused Best in class customer loyalty Net Promoter Scores Hybrid sales model Expanding focus on consumer market Differentiated fleet with minimal holding costs Long lived assets with rapid payback period Idle fleet offers significant growth potential without CAPEX spending Existing markets still have more growth opportunities Market leadership should provide pricing opportunities going forward New market opportunities in North America Entered twelve new markets in North America in 2011 Well Positioned for Growth, Margin Expansion and Strong Free Cash Flow Revenue and adjusted EBITDA growth Strong FCF Strong liquidity exceeding $455 million Excess unutilized fleet (utilization of 59.5% at December 31, 2011) |
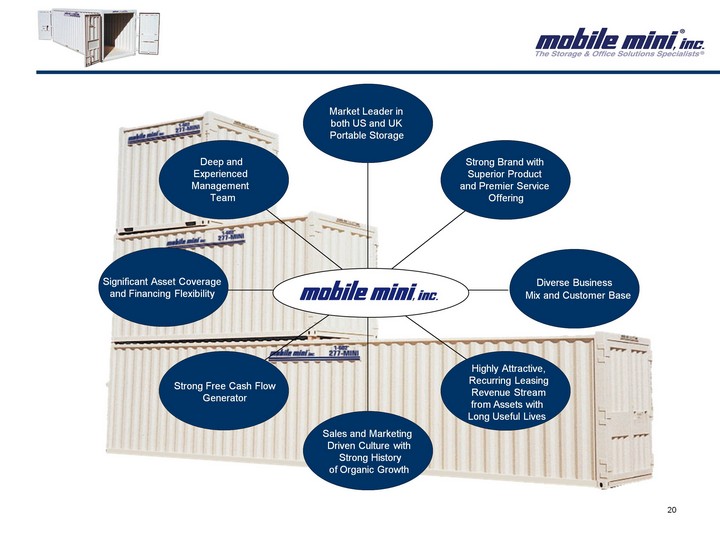
| 20 Predictable, Recurring Rental Stream Cash Flow Positive Following MSG Acquisition Demonstrated Resistance During Economic Downturns Leading Market Position in Portable Storage Diverse Business Mix Significant Asset Coverage Strong Brand with Premier Service Offering Deep and Experienced Management Team Market Leader in both US and UK Portable Storage Diverse Business Mix and Customer Base Deep and Experienced Management Team Strong Brand with Superior Product and Premier Service Offering Highly Attractive, Recurring Leasing Revenue Stream from Assets with Long Useful Lives Sales and Marketing Driven Culture with Strong History of Organic Growth Strong Free Cash Flow Generator Significant Asset Coverage and Financing Flexibility |

GAAP to Non-GAAP Reconciliations
Fourth Quarter 2011
Investor Presentation
(in millions)
(includes effects of rounding)
| Reconciliation of EBITDA to | 2010 | 2011 | ||||||||||||||||||||||||||||||||||||||
| net cash provided by operating activities: |
Q1 | Q2 | Q3 | Q4 | YTD | Q1 | Q2 | Q3 | Q4 | YTD | ||||||||||||||||||||||||||||||
| EBITDA |
$ | 27.7 | $ | 30.9 | $ | 32.5 | $ | 34.5 | $ | 125.6 | $ | 29.5 | $ | 33.6 | $ | 33.6 | $ | 36.0 | $ | 132.7 | ||||||||||||||||||||
| Interest paid |
(15.0 | ) | (10.9 | ) | (15.1 | ) | (15.6 | ) | (56.6 | ) | (5.4 | ) | (18.0 | ) | (9.7 | ) | (9.6 | ) | (42.7 | ) | ||||||||||||||||||||
| Income and franchise taxes paid |
(0.1 | ) | (0.5 | ) | (0.1 | ) | (0.1 | ) | (0.8 | ) | — | (0.5 | ) | (0.2 | ) | (0.1 | ) | (0.8 | ) | |||||||||||||||||||||
| Share-based compensation expense |
1.4 | 1.6 | 1.9 | 1.4 | 6.3 | 1.3 | 1.4 | 1.9 | 1.9 | 6.5 | ||||||||||||||||||||||||||||||
| Gain on sale of lease fleet units |
(2.0 | ) | (2.5 | ) | (2.7 | ) | (2.8 | ) | (10.0 | ) | (3.1 | ) | (4.0 | ) | (3.6 | ) | (3.1 | ) | (13.8 | ) | ||||||||||||||||||||
| (Gain) loss on disposal of property, plant and equipment |
— | (0.1 | ) | — | (0.1 | ) | — | — | — | — | 0.1 | 0.1 | ||||||||||||||||||||||||||||
| Changes in certain assets and liabilities, net of effect of businesses acquired: |
||||||||||||||||||||||||||||||||||||||||
| Receivables |
3.7 | (3.7 | ) | (3.0 | ) | 0.9 | (2.1 | ) | 1.8 | (4.2 | ) | (3.7 | ) | 2.0 | (4.1 | ) | ||||||||||||||||||||||||
| Inventories |
0.7 | 0.2 | 0.7 | 0.9 | 2.5 | (0.9 | ) | 0.5 | 0.8 | (1.6 | ) | (1.2 | ) | |||||||||||||||||||||||||||
| Deposits and prepaid expenses |
1.0 | 1.2 | 0.6 | (1.3 | ) | 1.5 | (0.3 | ) | 1.2 | — | 0.1 | 1.0 | ||||||||||||||||||||||||||||
| Other assets and intangibles |
— | (0.2 | ) | (0.2 | ) | 0.2 | (0.2 | ) | (0.1 | ) | — | — | 0.1 | — | ||||||||||||||||||||||||||
| Accounts payable and accrued liabilities |
(7.1 | ) | 1.8 | (0.5 | ) | 0.4 | (5.4 | ) | (2.0 | ) | 2.6 | 11.3 | (4.6 | ) | 7.3 | |||||||||||||||||||||||||
|
|
|
|
|
|
|
|
|
|
|
|
|
|
|
|
|
|
|
|
|
|||||||||||||||||||||
| Net cash provided by operating activities |
$ | 10.3 | $ | 17.8 | $ | 14.1 | $ | 18.6 | $ | 60.8 | $ | 20.8 | $ | 12.6 | $ | 30.4 | $ | 21.2 | $ | 85.0 | ||||||||||||||||||||
|
|
|
|
|
|
|
|
|
|
|
|
|
|
|
|
|
|
|
|
|
|||||||||||||||||||||
| Reconciliation of net income to | 2010 | 2011 | ||||||||||||||||||||||||||||||||||||||
| EBITDA and adjusted EBITDA: |
Q1 | Q2 | Q3 | Q4 | YTD | Q1 | Q2 | Q3 | Q4 | YTD | ||||||||||||||||||||||||||||||
| Net income |
$ | 2.4 | $ | 4.8 | $ | 5.5 | $ | 0.8 | $ | 13.5 | $ | 4.1 | $ | 8.0 | $ | 9.7 | $ | 10.1 | $ | 31.9 | ||||||||||||||||||||
| Interest expense |
14.7 | 14.3 | 14.2 | 13.2 | 56.4 | 12.7 | 11.8 | 11.0 | 10.8 | 46.3 | ||||||||||||||||||||||||||||||
| Provision for income taxes |
1.5 | 2.7 | 3.6 | 0.7 | 8.5 | 2.6 | 4.8 | 4.0 | 6.1 | 17.5 | ||||||||||||||||||||||||||||||
| Depreciation and amortization |
9.1 | 9.1 | 8.7 | 8.8 | 35.7 | 8.8 | 9.0 | 8.9 | 9.0 | 35.7 | ||||||||||||||||||||||||||||||
| Debt restructuring expense |
— | — | — | 11.0 | 11.0 | 1.3 | — | — | — | 1.3 | ||||||||||||||||||||||||||||||
| Deferred financing costs write-off |
— | — | 0.5 | — | 0.5 | — | — | — | — | — | ||||||||||||||||||||||||||||||
|
|
|
|
|
|
|
|
|
|
|
|
|
|
|
|
|
|
|
|
|
|||||||||||||||||||||
| EBITDA |
27.7 | 30.9 | 32.5 | 34.5 | 125.6 | 29.5 | 33.6 | 33.6 | 36.0 | 132.7 | ||||||||||||||||||||||||||||||
| New location start-up costs, asset relocation expenses and other |
— | 0.2 | — | — | 0.2 | — | 0.3 | 1.1 | — | 1.4 | ||||||||||||||||||||||||||||||
| Acquisition expenses |
— | — | — | — | — | — | — | — | 0.6 | 0.6 | ||||||||||||||||||||||||||||||
| Integration, merger and restructuring expenses |
2.3 | 0.9 | 0.5 | 0.4 | 4.1 | 0.3 | 0.2 | 0.3 | 0.6 | 1.4 | ||||||||||||||||||||||||||||||
|
|
|
|
|
|
|
|
|
|
|
|
|
|
|
|
|
|
|
|
|
|||||||||||||||||||||
| Adjusted EBITDA |
$ | 30.0 | $ | 32.0 | $ | 33.0 | $ | 34.9 | $ | 129.9 | $ | 29.8 | $ | 34.1 | $ | 35.0 | $ | 37.2 | $ | 136.1 | ||||||||||||||||||||
|
|
|
|
|
|
|
|
|
|
|
|
|
|
|
|
|
|
|
|
|
|||||||||||||||||||||
| Revenues |
$ | 76.9 | $ | 81.8 | $ | 84.6 | $ | 87.4 | $ | 330.7 | $ | 82.9 | $ | 90.5 | $ | 95.1 | $ | 95.9 | 364.4 | |||||||||||||||||||||
|
|
|
|
|
|
|
|
|
|
|
|
|
|
|
|
|
|
|
|
|
|||||||||||||||||||||
| Adjusted EBITDA margin |
39.0 | % | 39.1 | % | 39.0 | % | 40.0 | % | 39.3 | % | 36.0 | % | 37.7 | % | 36.8 | % | 38.8 | % | 37.4 | % | ||||||||||||||||||||
|
|
|
|
|
|
|
|
|
|
|
|
|
|
|
|
|
|
|
|
|
|||||||||||||||||||||
| Reconciliation of SG&A | 2010 | 2011 | ||||||||||||||||||||||||||||||||||||||
| expenses to adjusted SG&A expenses: |
Q1 | Q2 | Q3 | Q4 | YTD | Q1 | Q2 | Q3 | Q4 | YTD | ||||||||||||||||||||||||||||||
| Leasing, selling and general expenses |
$ | 42.8 | $ | 44.3 | $ | 46.2 | $ | 45.8 | $ | 179.1 | $ | 47.1 | $ | 49.5 | $ | 53.6 | $ | 53.0 | $ | 203.2 | ||||||||||||||||||||
| New location start-up costs, asset relocation expenses and other |
— | (0.3 | ) | — | — | (0.3 | ) | (0.1 | ) | (0.2 | ) | (1.1 | ) | — | (1.4 | ) | ||||||||||||||||||||||||
| Acquisition expenses |
— | — | — | — | — | — | — | — | (0.6 | ) | (0.6 | ) | ||||||||||||||||||||||||||||
|
|
|
|
|
|
|
|
|
|
|
|
|
|
|
|
|
|
|
|
|
|||||||||||||||||||||
| Adjusted SG&A expenses |
$ | 42.8 | $ | 44.0 | $ | 46.2 | $ | 45.8 | $ | 178.8 | $ | 47.0 | $ | 49.3 | $ | 52.5 | $ | 52.4 | $ | 201.2 | ||||||||||||||||||||
|
|
|
|
|
|
|
|
|
|
|
|
|
|
|
|
|
|
|
|
|
|||||||||||||||||||||
GAAP to Non-GAAP Reconciliations
Fourth Quarter 2011
Investor Presentation
(in millions except earnings per share)
(includes effects of rounding)
| Reconciliation of net cash provided | 2010 | 2011 | ||||||||||||||||||||||||||||||||||||||
| by operating activities to free cash flow: |
Q1 | Q2 | Q3 | Q4 | YTD | Q1 | Q2 | Q3 | Q4 | YTD | ||||||||||||||||||||||||||||||
| Net cash provided by operating activities |
$ | 10.3 | $ | 17.8 | $ | 14.1 | $ | 18.6 | $ | 60.8 | $ | 20.8 | $ | 12.6 | $ | 30.4 | $ | 21.2 | $ | 85.0 | ||||||||||||||||||||
| Additions to lease fleet |
(3.8 | ) | (3.4 | ) | (4.0 | ) | (3.9 | ) | (15.1 | ) | (3.5 | ) | (7.6 | ) | (8.4 | ) | (10.3 | ) | (29.8 | ) | ||||||||||||||||||||
| Proceeds from sale of lease fleet units |
5.4 | 7.4 | 7.5 | 8.6 | 28.9 | 8.2 | 9.8 | 9.8 | 8.4 | 36.2 | ||||||||||||||||||||||||||||||
| Additions to property, plant and equipment |
(0.5 | ) | (1.6 | ) | (1.6 | ) | (4.8 | ) | (8.5 | ) | (3.2 | ) | (3.6 | ) | (1.8 | ) | (2.9 | ) | (11.5 | ) | ||||||||||||||||||||
| Proceeds from sale of property, plant and equipment |
— | — | — | 0.1 | 0.1 | — | — | 0.1 | — | 0.1 | ||||||||||||||||||||||||||||||
|
|
|
|
|
|
|
|
|
|
|
|
|
|
|
|
|
|
|
|
|
|||||||||||||||||||||
| Net capital proceeds (expenditures) |
1.1 | 2.4 | 1.9 | (0.0 | ) | 5.4 | 1.5 | (1.4 | ) | (0.3 | ) | (4.8 | ) | (5.0 | ) | |||||||||||||||||||||||||
|
|
|
|
|
|
|
|
|
|
|
|
|
|
|
|
|
|
|
|
|
|||||||||||||||||||||
| Free cash flow |
$ | 11.4 | $ | 20.2 | $ | 16.0 | $ | 18.6 | $ | 66.2 | $ | 22.3 | $ | 11.2 | $ | 30.1 | $ | 16.4 | $ | 80.0 | ||||||||||||||||||||
|
|
|
|
|
|
|
|
|
|
|
|
|
|
|
|
|
|
|
|
|
|||||||||||||||||||||
| 2010 | 2011 | |||||||||||
| Reconciliation of Net income to adjusted Net income: |
Q4 | Q4 | YTD | |||||||||
| Net income |
$ | 0.8 | $ | 10.1 | $ | 31.9 | ||||||
| New location start-up costs, asset relocation expenses and other |
— | — | 1.4 | |||||||||
| Acquisition expenses |
— | 0.6 | 0.6 | |||||||||
| Integration, merger and restructuring expenses |
0.4 | 0.6 | 1.4 | |||||||||
| Debt restructuring expense |
11.0 | — | 1.3 | |||||||||
| Tax provision |
(4.3 | ) | (0.4 | ) | (2.8 | ) | ||||||
|
|
|
|
|
|
|
|||||||
| Adjusted net income |
$ | 7.9 | $ | 10.9 | $ | 33.8 | ||||||
|
|
|
|
|
|
|
|||||||
| Diluted shares outstanding |
44.1 | 44.6 | 44.6 | |||||||||
|
|
|
|
|
|
|
|||||||
| Adjusted diluted earnings per share |
$ | 0.18 | $ | 0.24 | $ | 0.76 | ||||||
|
|
|
|
|
|
|
|||||||
GAAP to Non-GAAP Reconciliations
Fourth Quarter 2011 Investor Presentation
(in millions)
(includes effects of rounding)
| Reconciliation of net income to | 2010 North America | 2011 North America | ||||||||||||||||||||||||||||||
| EBITDA and adjusted EBITDA: |
Q1 | Q2 | Q3 | Q4 | Q1 | Q2 | Q3 | Q4 | ||||||||||||||||||||||||
| Net income |
$ | 2.1 | $ | 3.9 | $ | 4.5 | $ | (0.6 | ) | $ | 3.3 | $ | 6.7 | $ | 6.8 | $ | 8.4 | |||||||||||||||
| Interest expense |
14.0 | 13.9 | 13.7 | 12.7 | 12.2 | 11.3 | 10.5 | 10.3 | ||||||||||||||||||||||||
| Provision for income taxes |
1.4 | 2.5 | 3.0 | 0.2 | 2.3 | 4.3 | 4.5 | 5.5 | ||||||||||||||||||||||||
| Depreciation and amortization |
7.4 | 7.4 | 7.1 | 7.2 | 7.2 | 7.2 | 7.1 | 7.1 | ||||||||||||||||||||||||
| Debt restructuring expense |
— | — | — | 11.0 | 1.3 | — | — | — | ||||||||||||||||||||||||
| Deferred financing costs write-off |
— | — | 0.5 | — | — | — | — | — | ||||||||||||||||||||||||
|
|
|
|
|
|
|
|
|
|
|
|
|
|
|
|
|
|||||||||||||||||
| EBITDA |
24.9 | 27.7 | 28.8 | 30.5 | 26.3 | 29.5 | 28.9 | 31.3 | ||||||||||||||||||||||||
| New location start-up costs, asset relocation expenses and other |
— | 0.2 | — | — | — | 0.3 | 1.1 | — | ||||||||||||||||||||||||
| Acquisition expenses |
— | — | — | — | — | — | — | 0.6 | ||||||||||||||||||||||||
| Integration, merger and restructuring expenses |
2.3 | 0.9 | 0.5 | 0.4 | 0.3 | 0.2 | 0.3 | 0.3 | ||||||||||||||||||||||||
|
|
|
|
|
|
|
|
|
|
|
|
|
|
|
|
|
|||||||||||||||||
| Adjusted EBITDA |
$ | 27.2 | $ | 28.8 | $ | 29.3 | $ | 30.9 | $ | 26.6 | $ | 30.0 | $ | 30.3 | $ | 32.2 | ||||||||||||||||
|
|
|
|
|
|
|
|
|
|
|
|
|
|
|
|
|
|||||||||||||||||
| Revenues |
$ | 64.4 | $ | 68.9 | $ | 70.1 | $ | 73.7 | $ | 68.4 | $ | 75.1 | $ | 78.7 | $ | 80.5 | ||||||||||||||||
|
|
|
|
|
|
|
|
|
|
|
|
|
|
|
|
|
|||||||||||||||||
| Adjusted EBITDA margin |
42.2 | % | 41.8 | % | 41.8 | % | 41.9 | % | 38.8 | % | 40.1 | % | 38.4 | % | 40.0 | % | ||||||||||||||||
|
|
|
|
|
|
|
|
|
|
|
|
|
|
|
|
|
|||||||||||||||||
| Reconciliation of net income to | 2010 Europe | 2011 Europe | ||||||||||||||||||||||||||||||
| EBITDA and adjusted EBITDA: |
Q1 | Q2 | Q3 | Q4 | Q1 | Q2 | Q3 | Q4 | ||||||||||||||||||||||||
| Net income |
$ | 0.3 | $ | 0.9 | $ | 1.0 | $ | 1.4 | $ | 0.8 | $ | 1.3 | $ | 2.9 | $ | 1.7 | ||||||||||||||||
| Interest expense |
0.7 | 0.4 | 0.5 | 0.5 | 0.5 | 0.5 | 0.5 | 0.5 | ||||||||||||||||||||||||
| Provision for income taxes |
0.1 | 0.2 | 0.6 | 0.5 | 0.3 | 0.5 | (0.5 | ) | 0.6 | |||||||||||||||||||||||
| Depreciation and amortization |
1.7 | 1.7 | 1.6 | 1.6 | 1.6 | 1.8 | 1.8 | 1.9 | ||||||||||||||||||||||||
|
|
|
|
|
|
|
|
|
|
|
|
|
|
|
|
|
|||||||||||||||||
| EBITDA |
2.8 | 3.2 | 3.7 | 4.0 | 3.2 | 4.1 | 4.7 | 4.7 | ||||||||||||||||||||||||
| Integration, merger and restructuring expenses |
— | — | — | — | — | — | — | 0.3 | ||||||||||||||||||||||||
|
|
|
|
|
|
|
|
|
|
|
|
|
|
|
|
|
|||||||||||||||||
| Adjusted EBITDA |
$ | 2.8 | $ | 3.2 | $ | 3.7 | $ | 4.0 | $ | 3.2 | $ | 4.1 | $ | 4.7 | $ | 5.0 | ||||||||||||||||
|
|
|
|
|
|
|
|
|
|
|
|
|
|
|
|
|
|||||||||||||||||
| Revenues |
$ | 12.5 | $ | 12.9 | $ | 14.5 | $ | 13.7 | $ | 14.5 | $ | 15.4 | $ | 16.4 | $ | 15.4 | ||||||||||||||||
|
|
|
|
|
|
|
|
|
|
|
|
|
|
|
|
|
|||||||||||||||||
| Adjusted EBITDA margin |
22.5 | % | 24.8 | % | 25.3 | % | 29.4 | % | 22.3 | % | 25.9 | % | 29.1 | % | 32.7 | % | ||||||||||||||||
|
|
|
|
|
|
|
|
|
|
|
|
|
|
|
|
|
|||||||||||||||||