Attached files
| file | filename |
|---|---|
| 8-K - FORM 8-K - EXXON MOBIL CORP | d307721d8k.htm |
| EX-99.3 - FREQUENTLY USED TERMS AND ADDITIONAL INFORMATION. - EXXON MOBIL CORP | d307721dex993.htm |
| EX-99.1 - TRANSCRIPT - EXXON MOBIL CORP | d307721dex991.htm |
 2012 Analyst Meeting
March 8, 2012
New York Stock Exchange
Exhibit 99.2 |
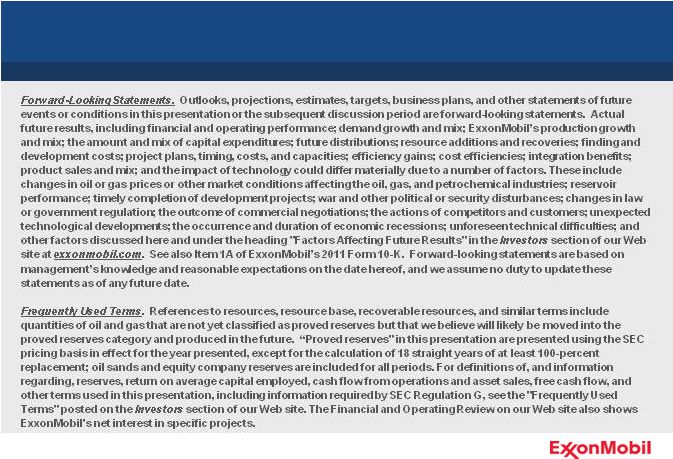 Cautionary Statement
2 |
 3
Agenda
9 AM
Welcome
David
Rosenthal,
Vice
President,
Investor
Relations
Business Overview
Financial & Operating Results
Rex
Tillerson,
Chairman
and
CEO
Competitive Advantages
BREAK
Mark
Albers,
Senior
Vice
President
Andy
Swiger,
Senior
Vice
President
Outlook
Summary
Q&A
12 PM
Meeting Concludes
Rex
Tillerson,
Chairman
and
CEO
Unlocking Greater Value in the
Upstream |
 4
Chairman and CEO
Rex Tillerson
Business Overview |
 5
Business Environment
Global environment offers a broad mix of challenges and opportunities
Near-term slowdown in global recovery with rising economic risks
Developing economies show signs of slowing but still outpace OECD economies
Significant regulatory initiatives continue while climate policies remain
uncertain Long-term outlook for energy and petrochemical demand remains
robust |
 6
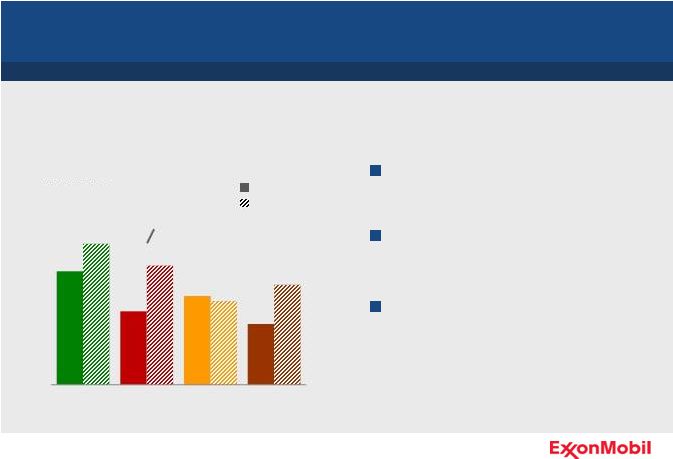
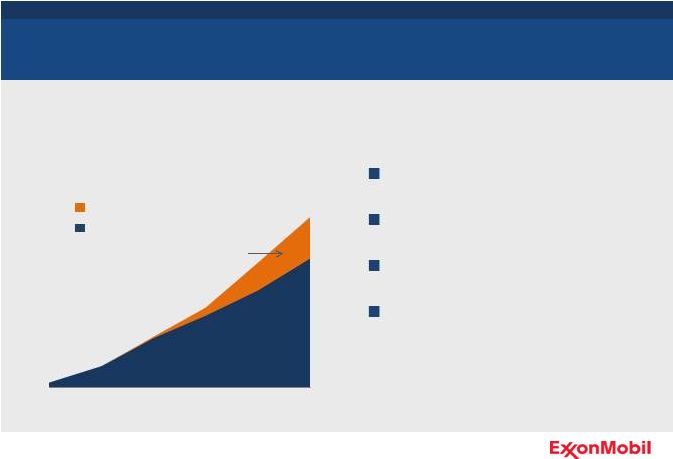
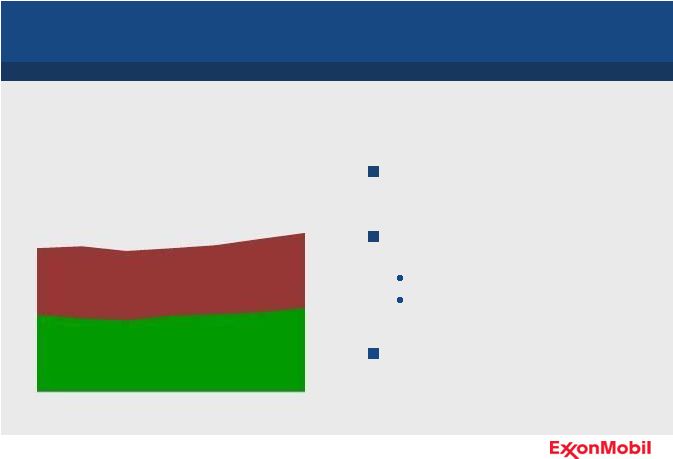
Energy Demand to 2040
Global energy demand likely to grow approximately 30% by 2040
Energy Demand
Quadrillion BTUs
Oil
Gas
Coal
Other*
Annual Growth
Rate to 2040
1.6%
-0.2%
1.7%
0.7%
Pace of demand growth moderated
by efficiency gains across the world
Mix gradually shifts with oil and
natural gas remaining prominent
Strong growth in natural gas driven
by power generation needs
Source: ExxonMobil 2012 Outlook for Energy
* Other includes nuclear, hydro, geothermal, biomass, wind, solar, and
biofuels. 2040
2010
0
100
200
300 |
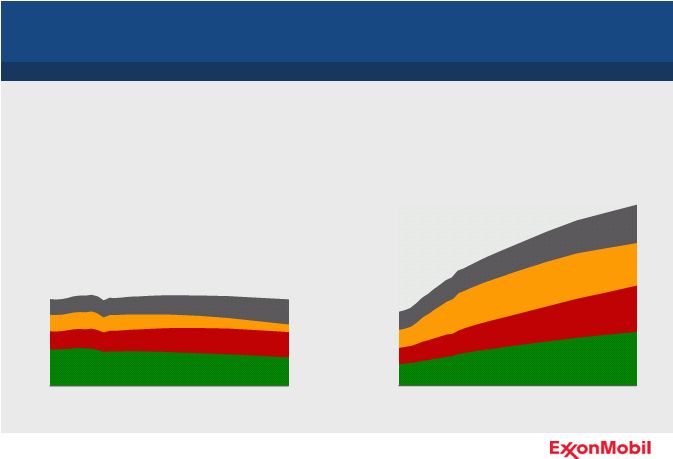 7
Developing Economies Lead Growth
Energy Demand: OECD Countries*
Quadrillion BTUs
Non-OECD Countries
Oil
Gas
Other
Coal
Asia Pacific demand growth accounts for nearly 60% of global increase
Source: ExxonMobil 2012 Outlook for Energy
* OECD: Organization for Economic Co-operation and Development
0
100
200
300
400
500
2000
2020
2040
0
100
200
300
400
500
2000
2020
2040 |
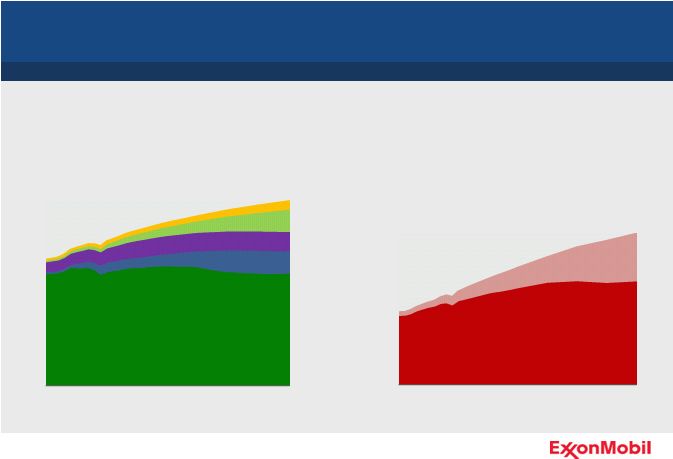 8
Liquids and Gas Supplies Expand and Diversify
Technology continues to expand economic supplies
Natural Gas
GCFD
Conventional
Unconventional
Liquids
MOEBD
Conventional Crude & Condensate
Deepwater
Natural Gas Liquids
Biofuels
Unconventional
Source: ExxonMobil 2012 Outlook for Energy
0
20
40
60
80
100
120
2000
2020
2040
0
100
200
300
400
500
600
700
2000
2020
2040 |
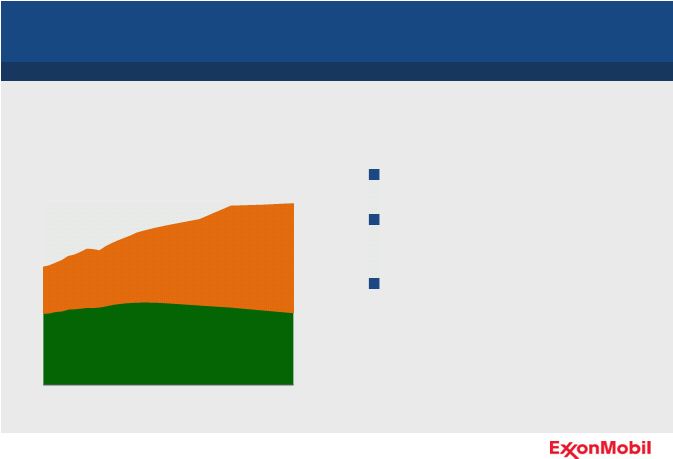
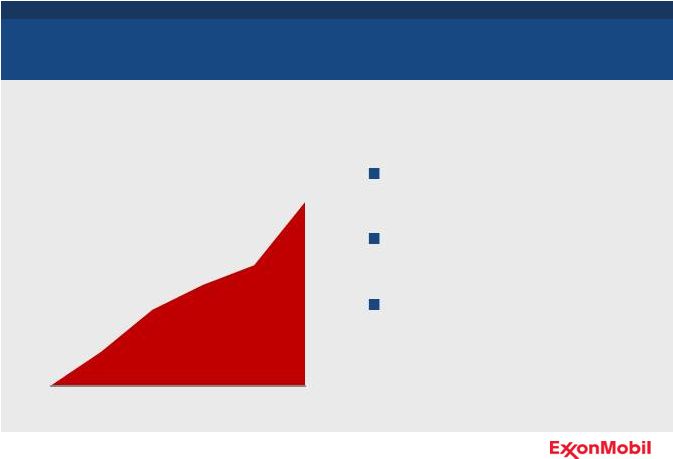
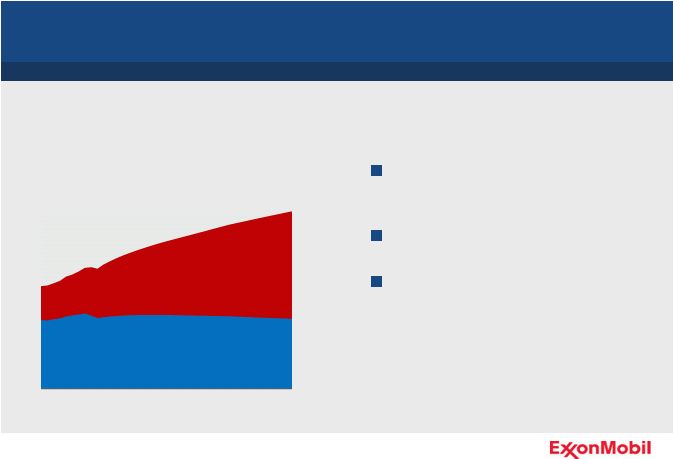 9
Global Downstream Demand
Transportation energy demand increases nearly 45% percent by 2040
Developing countries driving growth,
especially Asia Pacific
OECD demand is flat
New capacity, alternative fuels, and
efficiency gains required
Transportation Energy Demand
MOEBD
OECD Countries
Non-OECD Countries
Source: ExxonMobil 2012 Outlook for Energy
0
25
50
75
2000
2020
2040 |
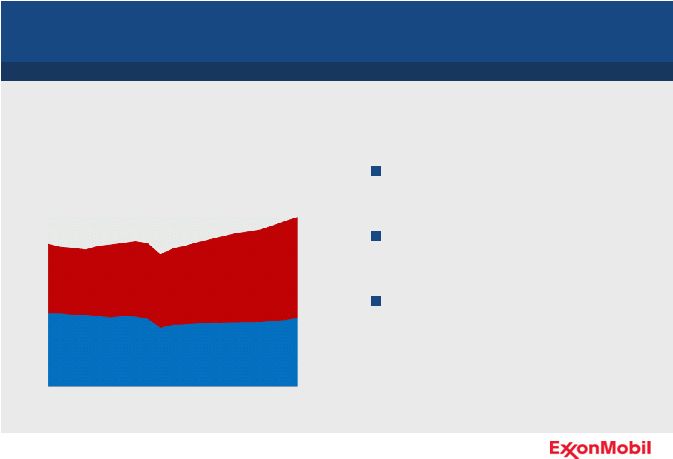
 10
Transportation Product Mix
Heavy duty transportation leads demand growth
Source: ExxonMobil 2012 Outlook for Energy
* Excludes other petroleum products (e.g., heating oil, fuel oil, LPG, kerosene, jet
fuel, naphtha). Petroleum Product Demand*
MOEBD
Gasoline
Diesel
0
25
50
2000
2020
2040
Significant shift in product mix
Diesel
growing
in
all
regions,
driven by economic activity
Gasoline flat to down, reflecting
efficiencies |
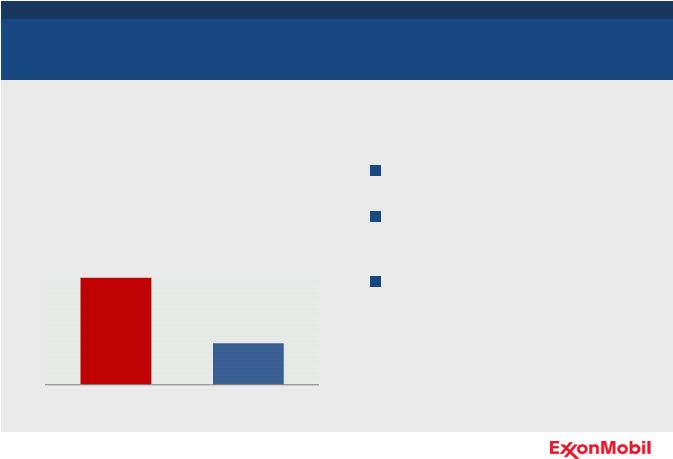
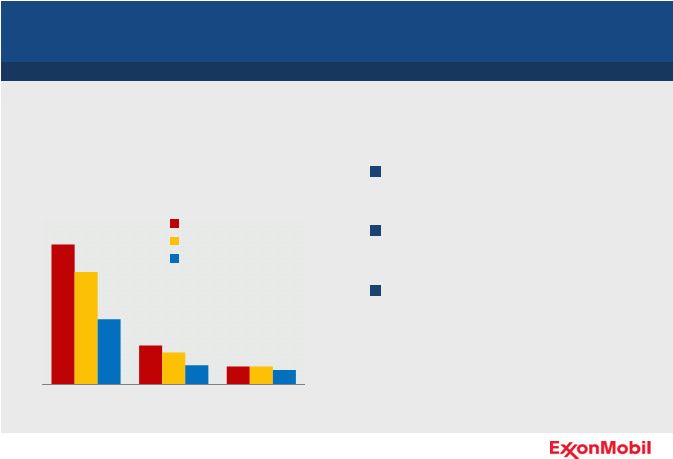
 11
Global Lubricants Demand
Demand expected to be nearly 20 percent higher in 2020 versus 2000
Demand growth of 1 percent per
year, driven by Asia Pacific
Global synthetics demand growing
6 percent per year
OECD demand flat but significant
growth within synthetics sector
* ExxonMobil assessment of industry demand
Lubricants Demand*
MB per Year
300
200
100
0
’00
’20
’15
’10
’05
OECD Countries
Non-OECD Countries |
 12
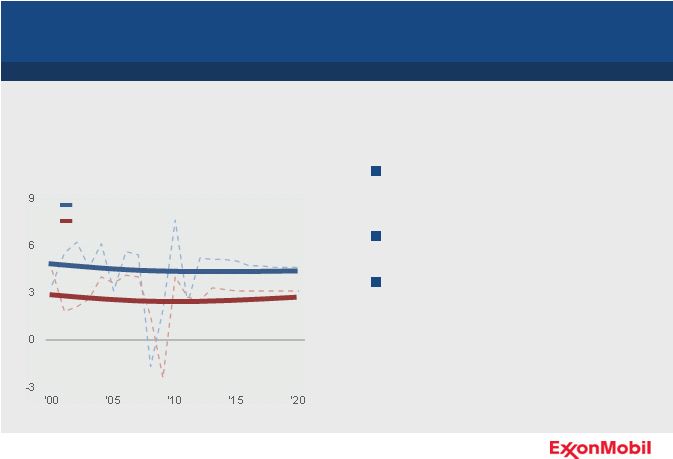
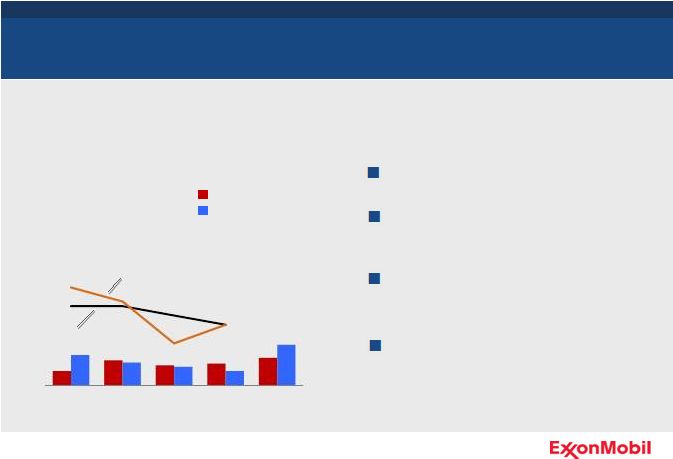
Global Chemical Demand
Chemical demand growth driven by Asia Pacific
Demand growth above GDP as
standards of living improve
Two-thirds of growth in Asia Pacific
Growth driven by preferred material
attributes
Demand and Global GDP*
Year-on-Year Percent Change
Demand Growth
Global GDP
Sources: ExxonMobil estimates and third-party GDP consensus opinions
* Chemical demand shown is polyethylene, polypropylene, and paraxylene. Bold
lines are trend lines. |
 13
The Energy Challenge
Meeting the world’s growing energy needs safely and responsibly
Requires broad-based economic solutions
Demands a commitment to innovation and technology
Calls for unprecedented levels of investment and diversity of supply
Requires sound, stable government policies
Demands effective risk management and operational excellence
|
 14
Risk Management
Risk management is fundamental to our business
Well-developed and clearly-defined
policies and procedures
Management accountability
High standards of design
Employee and contractor training
Rigorously applied management
systems |
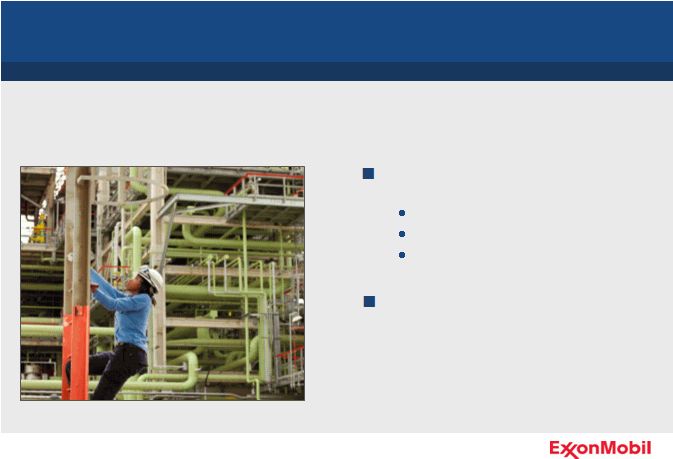
 15
Operations Integrity Management System
Disciplined framework for the management of risk
Common global expectations
Integrated into daily operations -
it’s how we operate
Provides framework to meet or
exceed regulations
Ongoing assessments and
incorporation of learnings |
 Chairman and CEO
Rex Tillerson
Financial and Operating Results
16 |
 17
2011 Financial and Operating Results
Strong results across all key measures and business lines
Relentless Focus on Operational Excellence
Strong Financial and Operating Results
Disciplined Investments Focused on Long-Term Value
Unmatched Shareholder Distributions |
 18
Safety
Safety performance remains strong in industry
Relentless Focus on Operational Excellence
Our vision: Nobody Gets Hurt
Focus
on
operational
excellence
and
risk management
XTO implementing proven safety
management systems
Committed to continuously improving
safety performance
* 2011 industry data not available.
** XTO included beginning 2011.
Lost Time Incident Rate
Incidents per 200K hours
U.S. petroleum industry
contractor benchmark*
U.S. petroleum
industry employee benchmark*
Employee
Contractor
0.0
0.1
0.2
0.3
0.4
'07
'08
'09
'10
'11** |
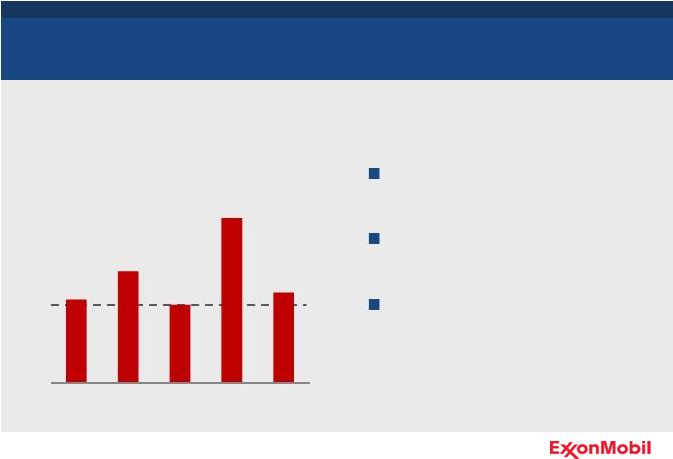
 19
Environmental Performance
Committed to reducing environmental impact
Relentless Focus on Operational Excellence
* XTO included beginning 2011.
Hydrocarbon Flaring from
Upstream Oil & Gas Production
Million Metric Tons
0
2
4
6
8
'07
'08
'09
'10
'11*
Strong environmental
management
Improving energy efficiency
Reducing flaring, emissions,
releases
Protect Tomorrow. Today. |
 20
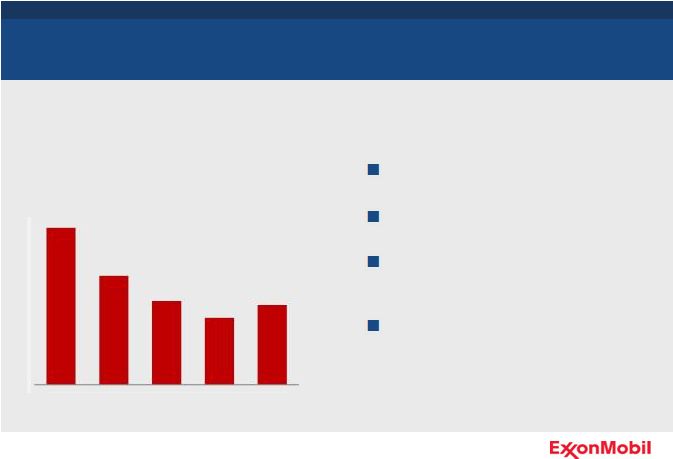
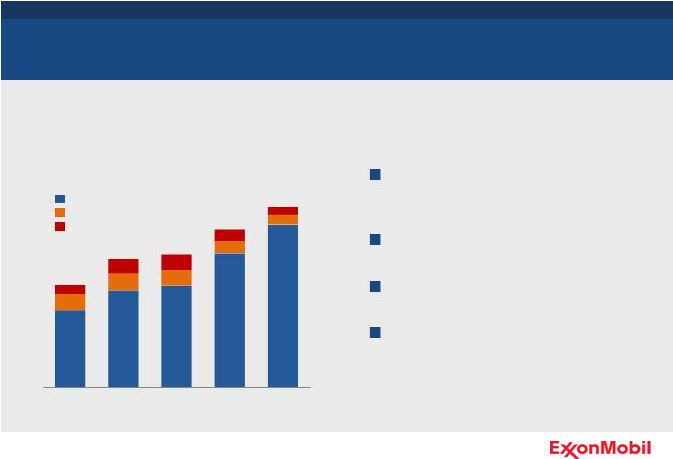
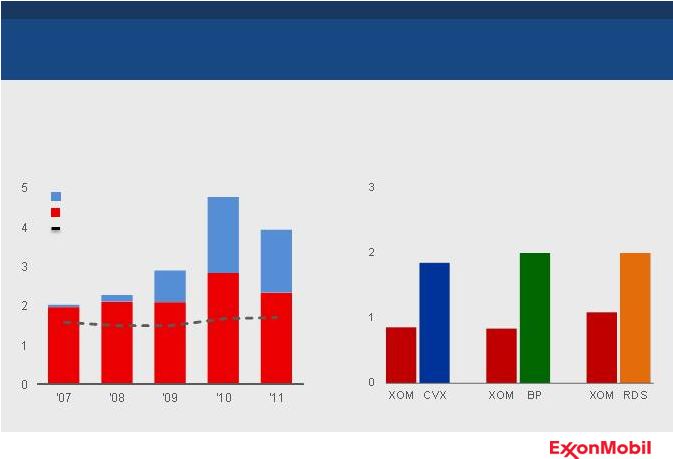
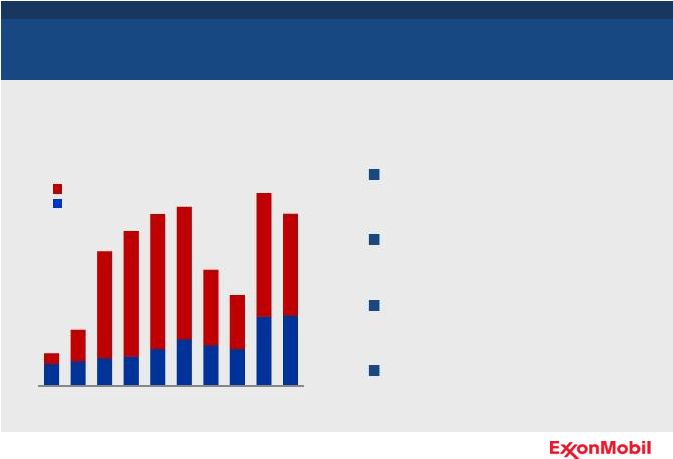
Earnings
Earnings of $41B in 2011, an increase of 35 percent over 2010
Strong Financial and Operating Results
Strong performance across all
business lines
Leveraging integration advantages
Maximizing value of asset base
Upstream
Downstream
Chemical
Total Earnings
0
10
20
30
40
50
'07
'08
'09
'10
'11
$B
Earnings Excluding Special Items |
 21
Upstream portfolio continues to deliver strong earnings per barrel
Upstream Earnings per Barrel
Balanced portfolio well-positioned
throughout business cycle
Disciplined approach to cost
management
Relentless focus on maximizing value
of each asset
Strong Financial and Operating Results
0
5
10
15
20
25
'07
'08
'09
'10
'11
Earnings per Barrel
$ per OEB |
 22
Upstream Volumes Growth
Project ramp-ups and strong unconventional performance drive growth
Strong Financial and Operating Results
-12
-10
-8
-6
-4
-2
0
2
2011 Volume Growth
Percent
XOM
CVX
RDS
BP
1 percent growth from 2010
Supported by risk management
and operational excellence
Largest
non
-government-owned
producer
of
oil and gas
at
4.5
MOEBD |
 Reserves Replacement
Strong Financial and Operating Results
Replaced 116 percent of 2011
production
Additions exceeded production for
the 18
th
consecutive year
Proved reserves increased to 24.9
BOEB
Proved Reserves Replacement*
Percent
* Reserves replacement based on SEC pricing bases and excluding
asset sales, except as noted in the Cautionary Statement.
0
50
100
150
200
250
'07
'08
'09
'10
'11
Consistently replaced more reserves than produced
23 |
 Return on Capital Employed
Return on Average Capital Employed*
Percent
2011
’07 –
’11, average
* Competitor data estimated on a consistent basis with ExxonMobil
and based on public information.
Strong Financial and Operating Results
0
5
10
15
20
25
30
XOM
CVX
BP
RDS
ROCE leadership supported by consistent business model
ROCE of 24 percent in 2011
Investments position long-term
performance
Disciplined investment through the
business cycle
Strength of integrated portfolio,
project management, and
technology application
24 |
 Cumulative
Proceeds
Associated
with
Asset
Sales;
2007
–
2011
$B
Capital Management
Strong Financial and Operating Results
Ongoing portfolio management
fundamental to business model
Targeted divestments across all
business lines
Retained assets which hold longer-
term shareholder value
Active asset divestments enhance shareholder value
0
10
20
30
'07
'08
'09
'10
'11
25 |
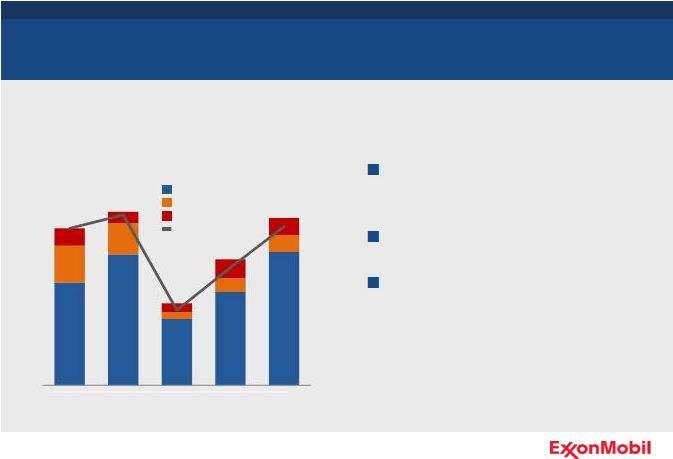
 2011 Cash Flow
Strong Financial and Operating Results
Strong cash flow, up nearly 30
percent from 2010
Year-end cash balance over $13B
Funded all attractive investment
opportunities
Continued to pay growing dividend
* Represents cash flow from operations and asset sales of $66.5 billion, including
$11.1 billion from asset sales. ** PP&E Adds / Investment &
Advances: Property, Plant, and Equipment ($31.0 billion) and Investments & Advances ($2.4 billion)
2011 Cash Flow
$B
YE’10
Cash
Cash
Flow*
PP&E
Adds/
Investment
&
Advances**
Share-
holder
Distri-
butions
Financing /
Other
YE’11
Cash
Share Purchases
Dividends
8
66
33
29
1
13
26
Superior cash generation provides investment and distribution flexibility
0
20
40
60
80 |
 Free Cash Flow Generation
Cash generation unmatched among peers
Total free cash flow generation of
$146B since beginning of 2007
Higher than competitors combined
Strong cash generation provides
capacity for shareholder distributions
* Competitor data estimated on a consistent basis with ExxonMobil and
based on public information.
Total
Free
Cash
Flow
(’07
–
’11)*
$B
Strong Financial and Operating Results
0
25
50
75
100
125
150
XOM
CVX
RDS
BP
27 |
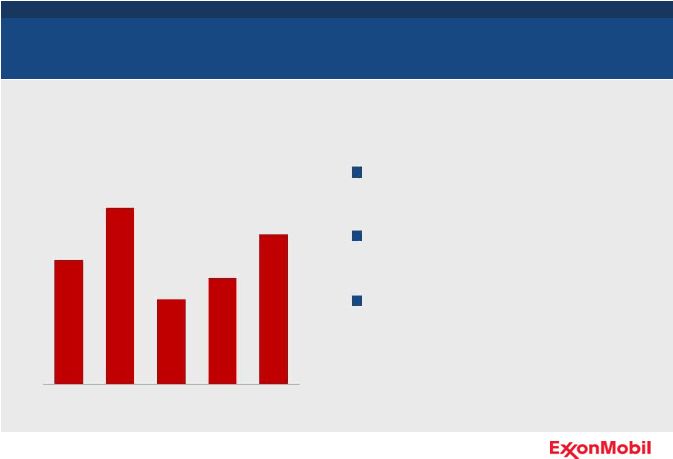
 Capex
Disciplined Investments Focused on Long-Term Value
Capex by Business Line
$B
Invested $143B during the past five
years
Executed strategic acquisitions
Progressing major projects
Maintained capital efficiency and
discipline
Maintained focus on selective investments to deliver superior returns
0
10
20
30
40
'07
'08
'09
'10
'11
Upstream
Downstream
Chemical / Other
28 |
 Distribution Yield
Unmatched Shareholder Distributions
Total distribution yield of 34 percent
since beginning of 2007
Average distribution yield of 7.3
percent versus competitor average
of 5.1 percent
* Yield based on 2006 year-end market capitalization.
** RDS, BP, and CVX.
Total
Distribution
Yield
(’07
–
’11)*
Dividends
&
Share
Repurchases
Percent
0
5
10
15
20
25
30
35
ExxonMobil
Competitor Average**
29
Industry-leading shareholder distributions |
 Dividends
* S&P and CPI indexed to 1983 Exxon dividend.
** CPI based on historical yearly average from Bureau of Labor Statistics.
Dividend Growth since 1983*
$ per share
XOM
S&P 500
CPI**
Unmatched Shareholder Distributions
’83
’11
’01
’91
0.00
0.50
1.00
1.50
2.00
2.50
Reliable and growing dividends; $9 billion distributed in 2011
30
Over $40B distributed to
shareholders over past five years
Dividend has grown every year since
1983
Annualized growth rate
of
5.7 percent
Almost two times inflation |
 Share Reductions
Share purchases efficiently return cash to shareholders
$20B in shares purchases in 2011
Over 30 percent reduction in shares
outstanding since Exxon and Mobil
merger
Expect number of shares issued for
XTO to be repurchased by end of
1Q12
Shares Outstanding
Millions of Shares
* XTO acquisition occurred 2Q10.
Unmatched Shareholder Distributions
31
0
1,000
2,000
3,000
4,000
5,000
6,000
7,000
'00
'02
'04
'06
'08
2Q10*
'11 |
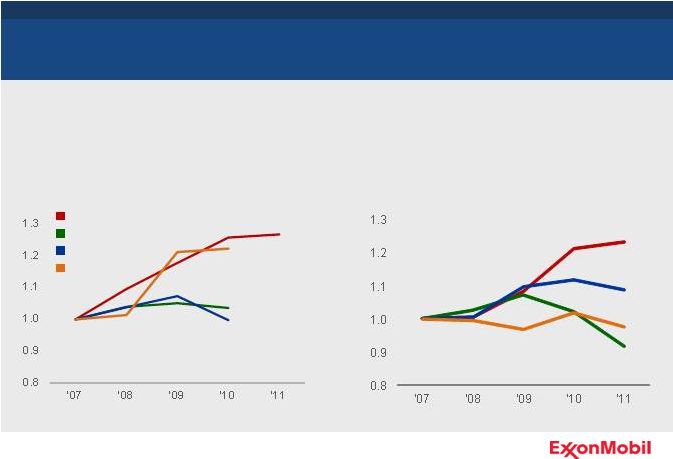 Increasing Ownership
* Competitor data estimated on a consistent basis with ExxonMobil and based on
public information. ** Reserves
based
on
SEC
pricing
bases,
including
oil
sands
and
equity
companies.
2011
competitor
data
not
yet
available.
Production Growth per Share since 2007*
Indexed; 2007 = 100
Indexed Growth
Reserves Growth per Share since 2007* **
Indexed; 2007 = 100
XOM
BP
CVX
RDS
Indexed Growth
Unmatched Shareholder Distributions
32
Enhanced per share interest in ExxonMobil reserves and production
|
 33
2011 Financial and Operating Results
Strong results across all key measures and business lines
Relentless Focus on Operational Excellence
Strong Financial and Operating Results
Disciplined Investments Focused on Long-Term Value
Unmatched Shareholder Distributions |
 34
Competitive Advantages
Chairman and CEO
Rex Tillerson |
 35
Competitive Advantages
ExxonMobil possesses unique competitive advantages
Balanced Portfolio
Disciplined Investing
High-Impact Technologies
Operational Excellence
Global Integration |
 36
Competitive Advantages
ExxonMobil possesses unique competitive advantages
Balanced Portfolio
Disciplined Investing
High-Impact Technologies
Operational Excellence
Global Integration |
 37
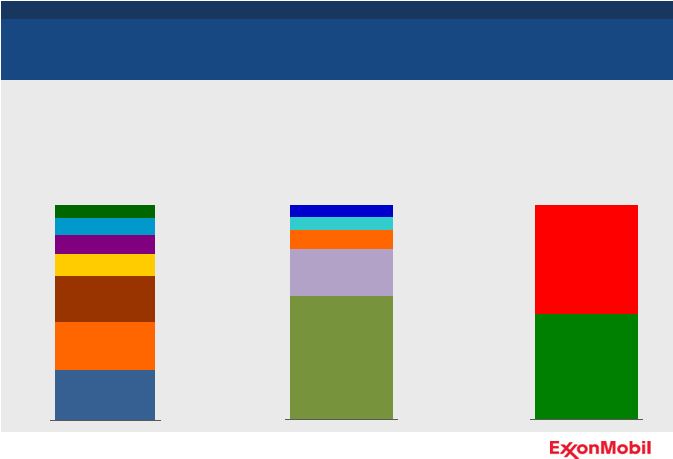
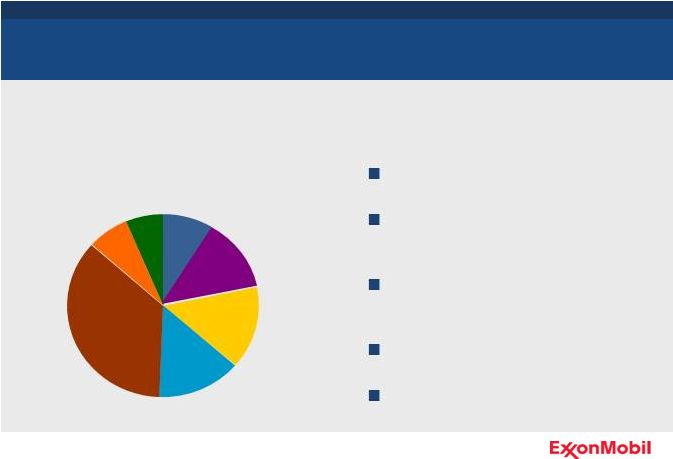
2011 Resource Base
Balanced Portfolio
Upstream
Diverse resource base of over 87 billion oil-equivalent barrels
0
30
60
90
Africa
Australia/Oceania
Asia
Americas
Europe
Geography
0
30
60
90
Liquids
Gas
Liquids / Gas
0
30
60
90
Resource Base (BOEB)
Type
Unconventional
Oil and Gas
Arctic
Conventional
Heavy Oil /
Oil Sands
Deepwater
Acid / Sour
LNG |
 Resource Base Growth
Consistently adding quality resources at attractive finding costs
* Excludes XTO acquisition and the proved portion of discovered undeveloped
additions. ** Sources: Chevron Analyst Presentation (3/11), BP Strategy
Presentation (3/10), Shell Strategy Update (3/11) Annual Resource
Additions* BOEB
Discovered Undeveloped
By-the-Bit
Production
Upstream
$/OEB
Finding Cost (as reported)**
’02 -
’09
’04 -
’08
’08 -
’10
Balanced Portfolio
38 |
 Global Liquids Position
Upstream
Robust liquids portfolio of quality operations and advantaged projects
12.2 BOEB proved liquid reserves
Strong growth potential
Significant long-plateau volumes
LNG/Unconv
Heavy Oil /
Oil Sands
Conventional
Acid / Sour
Deepwater
Arctic
Liquids Resource Base
BOEB
2011 Liquids Production
Normal
Depletion
Long-
Plateau
Percent
Balanced Portfolio
39 |
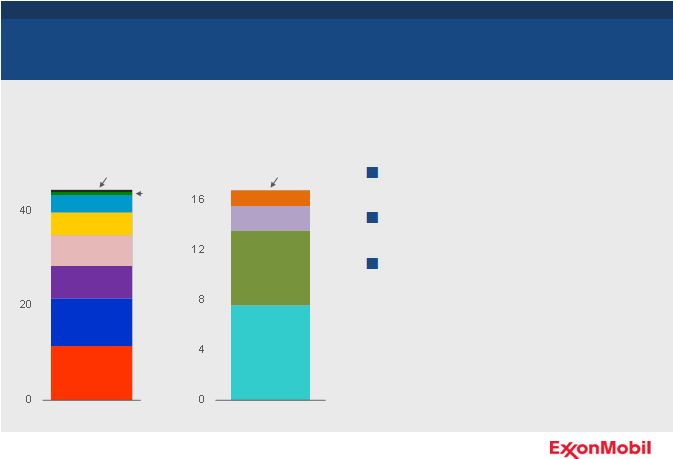 Global Gas Position
Upstream
Gas portfolio diverse in resource type, markets, and contract structures
76 TCF proved gas reserves
Large, diverse resource base
Leading unconventional position with
significant growth potential
LNG
Shale Gas
Conventional
Deep-
water
Acid / Sour
Tight Gas
Arctic
CBM/Other
Gas Resource Base
BOEB
Markets
BCFD
Europe
Asia
Americas
Africa
Middle East
Balanced Portfolio
40 |
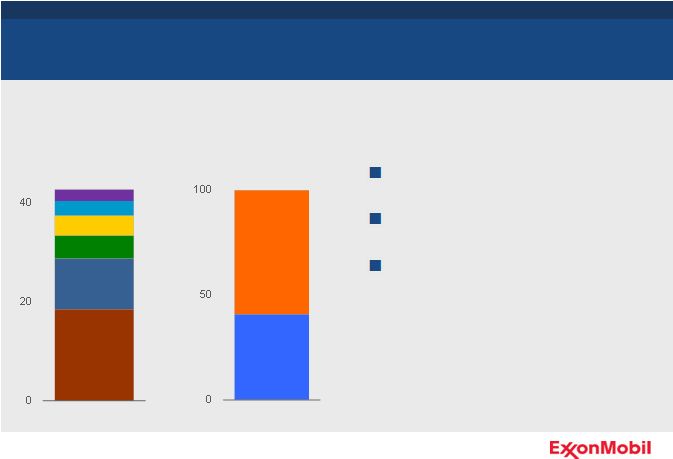
 41
Production and Contract Mix
Upstream
Significant portion of production linked to oil pricing
0
1
2
3
4
5
Gas
Oil
Production Mix
MOEBD
Gas
Oil
2011
2015 Estimated
0
1
2
3
4
5
Oil
Oil
Indexed
Gas
Indexed
Oil
Oil
Indexed
Gas
Indexed
Contract Mix
MOEBD
2011
2015 Estimated
Balanced Portfolio |
 42
New Opportunity Growth
Upstream
Balanced Portfolio
Growing global portfolio of high-quality resource opportunities
Horn River
Alberta Tight Oil
Athabasca
Beaufort
Summit Creek
Gulf of Mexico
Guyana
Permian Basin
Rockies
Woodford
Utica
Colombia
Marcellus
Kara Sea
Vietnam
Indonesia
Russian Black
Sea
Norway
West
Greenland
Romania
Tanzania
Nigeria
PNG
Australia
Angola
Faroe Islands
Madagascar
Ireland
Argentina
China
Germany
Poland
Abu Dhabi
Iraq
New Play Tests
Unconventional
Conventional Discov’d/Undev.
Established Conventional Basin
Play Type |
 43
Scale Advantage
Largest global refiner with the highest level of integration
Average Refinery Size*
KBD
Downstream
Refineries 60 percent larger
than industry average
Leveraging scale to improve
profitability
* ExxonMobil average global refinery capacity compared to industry equity share
capacity; year-end 2011. Equity share capacity calculated on a
consistent basis using public information. Source: Oil & Gas Journal.
Balanced Portfolio
100
120
140
160
180
200
220
ExxonMobil
Industry Average
Cost efficiencies
Circuit optimization
Reliability
Feed flexibility |
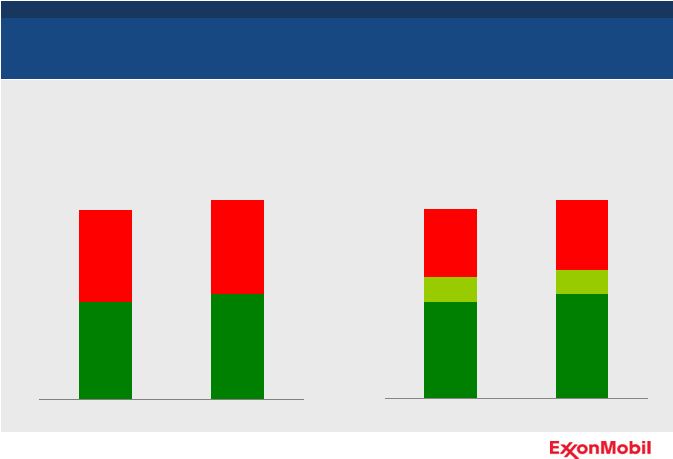
 44
Lubricants Leadership Position
Largest basestock manufacturer and leading marketer of synthetics
Downstream
Global synthetics demand growing 6
percent per year
Industry leadership in basestocks and
synthetic lubricants
Well-positioned to capture growth
Market Position
Percent share
ExxonMobil
Competitor Average*
* ExxonMobil estimate of key competitor market share based on Kline industry
data and public information. Competitors include BP, RDS, and CVX.
Balanced Portfolio
0
5
10
15
20
Basestocks
Synthetic Lubes
Supported by advanced technology
and brand leadership |
 45
World-Class Brands
A leading marketer of high-quality products with trusted brands
Downstream
Global reach
Diverse sales channels
Global brands trusted for product
quality and supply reliability
Global Fuels Marketing Sales
Aviation
Marine
Retail
Industrial and
Wholesale
Percent, sales
Balanced Portfolio |
 Balanced Portfolio Maximizes Value
Facilities strategically located,
supplying all major growth regions
Commodities provide scale and
upside earnings capture
Specialties generate stable yet
growing earnings base
Proprietary technology underpins
portfolio
Earnings
$B
Commodities
Specialties
Chemical
Balanced Portfolio
0
1
2
3
4
5
'02
'03
'04
'05
'06
'07
'08
'09
'10
'11
46
Industry-leading Chemical performance driven by strong portfolio
|
 Competitive Advantages
ExxonMobil possesses unique competitive advantages
Balanced Portfolio
Disciplined Investing
High-Impact
Technologies
Operational Excellence
Global Integration
47 |
 Project Inventory
Disciplined Investing
Upstream
Extensive portfolio supports selective investment decisions
Portfolio of 120+ projects
Developing 23 net BOEB across all
regions and resource types
Industry-leading project
management
High-impact technology
Investment selectivity
Project Distribution by Type
Percent, resource
Arctic
Heavy Oil /
Oil Sands
Conventional
Unconventional
Deepwater
LNG
Acid / Sour
9%
13%
15%
14%
36%
7%
6%
48 |
 Near-Term Project Start-Ups
Upstream
21 major project start-ups are planned between 2012 and 2014
Acid / Sour
Kashagan Phase 1
Oil Sands
Kearl
Nigeria
Satellites
LNG
Papua New Guinea
Arctic
Arkutun-Dagi
Deepwater Angola
Satellites
Deepwater GOM
Hadrian South / Lucius
Conventional
Kipper / Tuna
Disciplined Investing
49 |
 Major Project Production Outlook
Upstream
Significant new production supports long-term volumes
Over 1 MOEBD added by 2016
80 percent liquids volumes
Significant long-plateau volumes
Long-term growth supported by
diverse portfolio
* Outlook based on 2011 average prices (Brent crude $111/B).
Major Project Production Outlook*
MOEBD
Papua New Guinea
Gorgon Jansz
Hadrian South
Gas
Liquids
Usan
Kearl
Banyu Urip
AB17 Pazflor
West Qurna I
Upper Zakum 750
Kashagan Phase 1
Syncrude Aurora North
Kizomba Satellites Phase 1
Disciplined Investing
0.0
0.4
0.8
1.2
'11
'12
'13
'14
'15
'16
50 |
 Selective Investments
Increasing high-value diesel production for growing markets
Downstream
Global diesel demand expected to
rise by 85 percent through 2040
Recent investments contributed to
record ULSD production in 2011
Progressing additional investments to
supply more lower-sulfur fuels
Ultra-Low Sulfur Diesel Production
ExxonMobil, indexed
Disciplined Investing
100
150
200
250
300
'06
'07
'08
'09
'10
'11
51 |
 Portfolio Management
Downstream
Disciplined Investing
Global Asset Sales
(2003 -
2011)
Refineries
11
Pipeline Miles
5.9k
Terminals
145
Countries Exited
65
Retail Stations
16.8k
Ongoing portfolio management delivers value
52 |
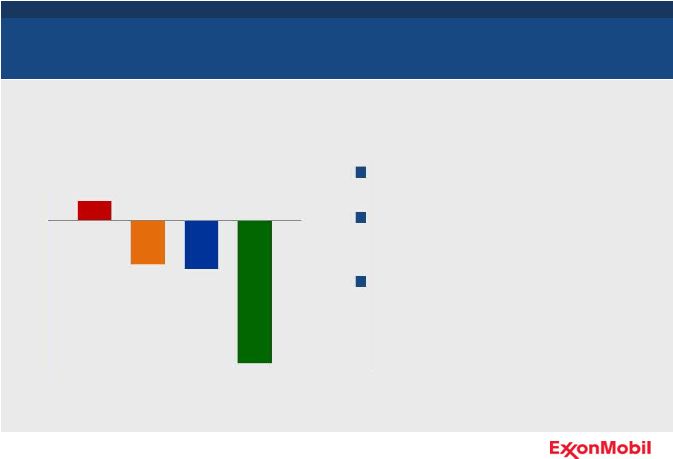
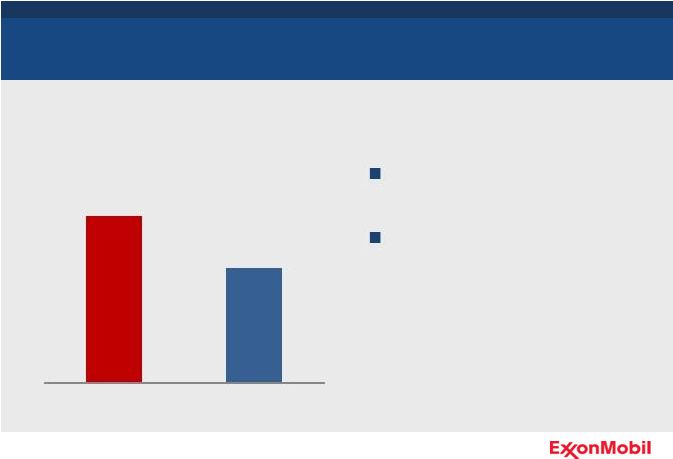
 53
Effects from Portfolio Highgrading
Improved capital efficiency
Divestments reduced capital
employed more than 20 percent since
2003
Relatively low impact to earnings
Disciplined and ongoing approach to
capital management
Disciplined Investing
Downstream
Impact of Divestments / Restructuring
Percent, 2011 versus 2003; Downstream only
Capital
Employed
-23%
+5%
ROCE
Restructuring has driven a material decrease in our capital employed
|
 54
Singapore Expansion
Establishing world-class integrated platform to support Asia growth
Chemical
Two-thirds of chemical growth from
Asia Pacific
Once complete, largest refining-
chemical complex in our circuit
2.6 million tonnes of new capacity
98 percent mechanically complete
with units progressively starting up
Value capture accelerates as global
economy strengthens
Disciplined Investing |
 55
Competitive Advantages
ExxonMobil possesses unique competitive advantages
Balanced Portfolio
Disciplined Investing
High-Impact Technologies
Operational Excellence
Global Integration |
 56
Technology Leadership
Developing fundamental science to meet the world’s energy challenges
Metallurgy solutions
for challenging
arctic conditions
Feed flexibility
advantage through
molecule
management
Corporate Strategic Research
Unique, world-class scientific
research capability
Fundamental research enables
identification of technology
opportunities
Foundation for technology
development in the business lines
Corporate
High-Impact Technologies |
 57
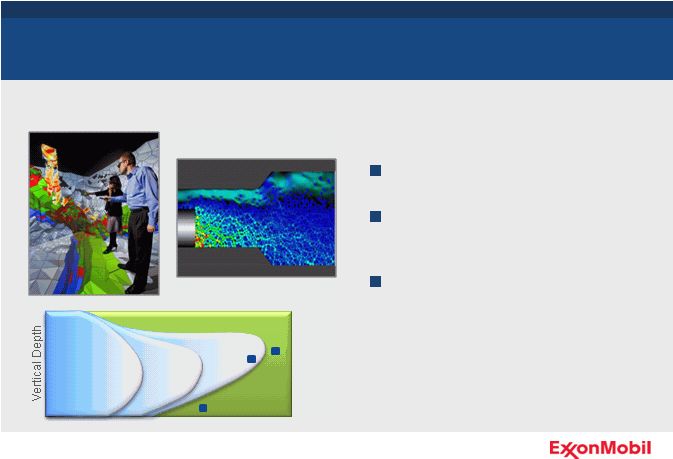
Research and Development
Progressing breakthrough research to develop high-reward, risk
reduction technologies across the Upstream business
Upstream
Imaging
Shale Gas / Tight Oil
Stimulation
Extended Reach
Drilling
Exploration
Development
Production
High-Impact Technologies |
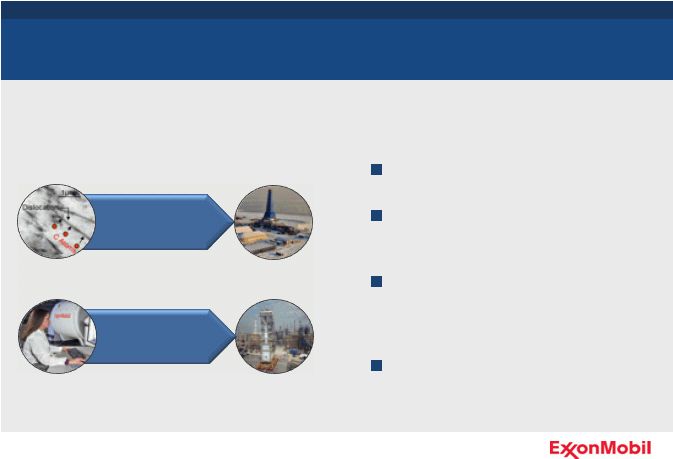
 58
Extended Reach Drilling
Developing and applying integrated technologies to unlock greater value
Upstream
Horizontal Displacement
1980’s
1990’s
2000’s
Canada
California
Sakhalin
Drilled 23 of 27 longest-reach wells
Integrated suite of technologies from
modeling to wellbore planning
Increased capital efficiency and
access to additional reserves
High-Impact Technologies |
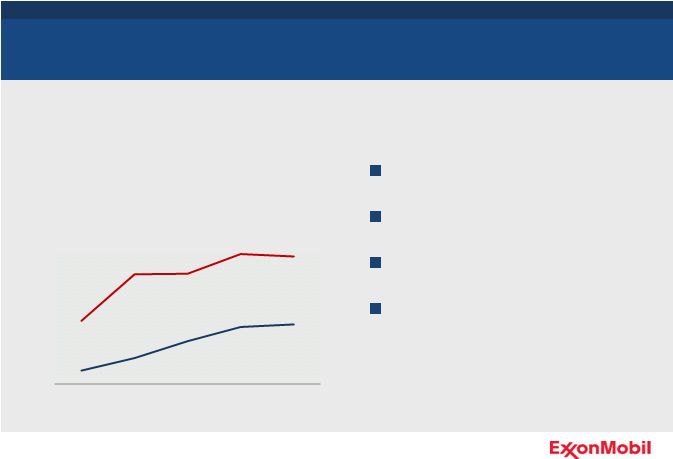 59
Margin Improvement
Advantaged technologies enable our ability to improve margins
Downstream
Lower raw materials costs
Expanded feed flexibility
Increased refining utilization
Higher product realizations
“Discounted”
Crudes*
Percent, indexed
ExxonMobil
Industry Average
Source: ExxonMobil estimate based on public information.
* Includes “challenged”
crudes which are discounted in the market due to properties that make them
challenging to process. High-Impact Technologies
50
100
150
200
'04
'06
'08
'10
'11 |
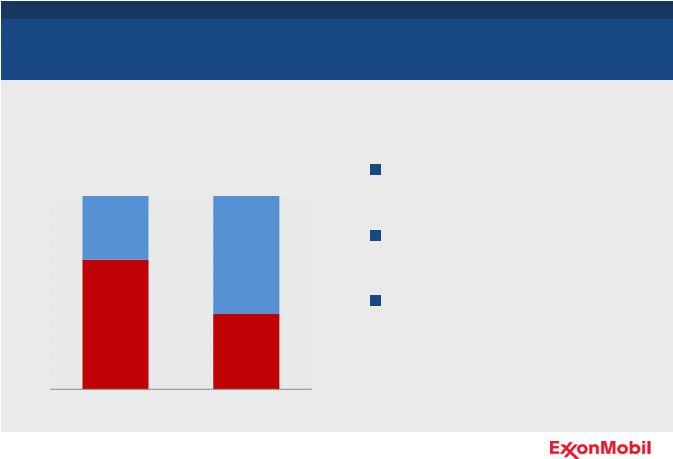 60
Feedstock Flexibility
Significant flexibility to process advantaged feedstocks
Facilities configured to run wide
range of feedstock
Access to range of feeds to
capitalize on lowest-cost options
Proprietary molecule management
technologies maximize value
Chemical
Worldwide Feedstock*
Percent
Advantaged
feeds
Benchmark
feeds
Source: IHS Chemical; full-year estimate as of September 2011.
* Ethylene feedstock; ExxonMobil data includes share of JV production.
High-Impact Technologies
0
25
50
75
100
ExxonMobil
Industry Average |
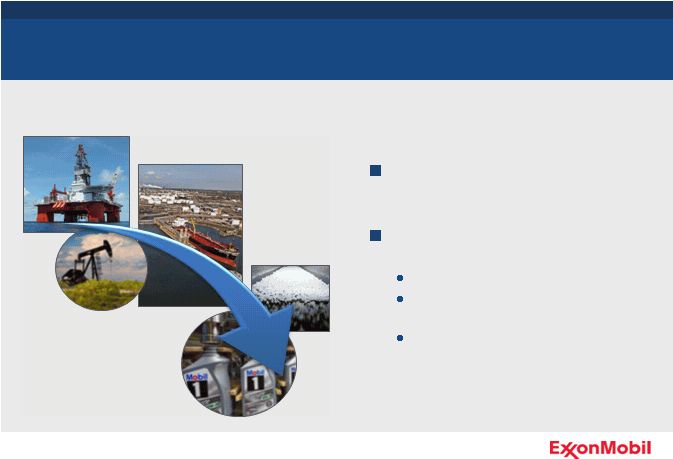
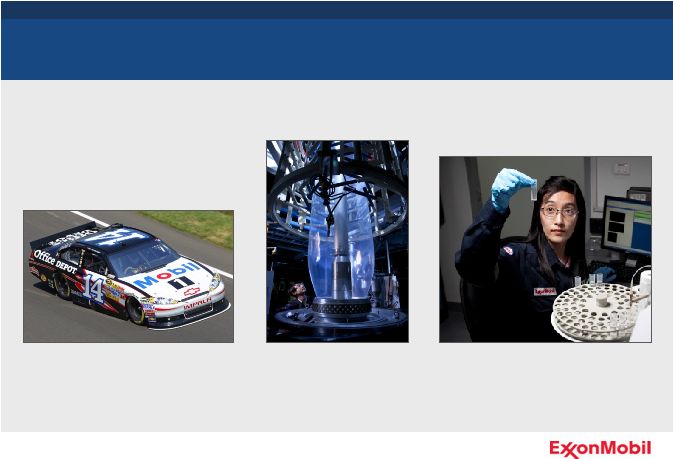 61
Higher-Value Products
Advantaged technologies improve our products
Downstream / Chemical
Industry-leading
synthetic lubes
Higher-quality
fuel products
Premium chemical
products
High-Impact Technologies |
 62
Competitive Advantages
ExxonMobil possesses unique competitive advantages
Balanced Portfolio
Disciplined Investing
High-Impact Technologies
Operational Excellence
Global Integration |
 63
People
Operational Excellence
Operational excellence begins with exceptional employees
Culture of excellence
Tailored, world-class training
Diverse, global work experiences
Host country workforce development
Corporate |
 64
Reliability and Cost Management
Best practices deliver strong reliability and life-cycle cost performance
Upstream
Strong reliability performance
Operated uptime >3 percent higher
than assets operated-by-others over
the last five years
-
Operational Excellence
Maintaining integrity of facilities
Disciplined global operating and
maintenance systems |
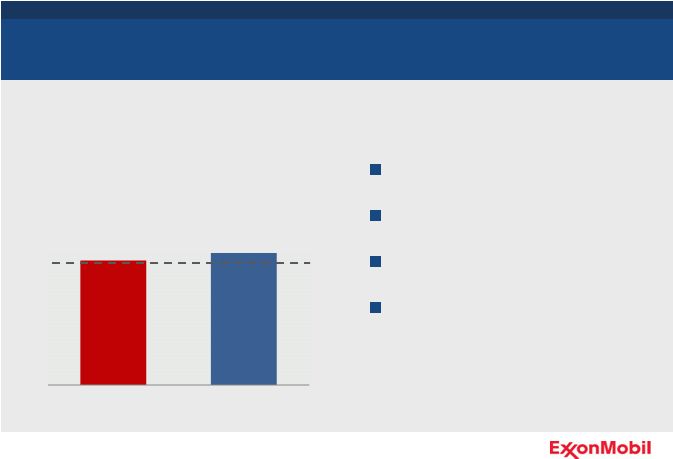 65
Project Execution
Proven execution performance and delivery of complex projects
Rigorous project management
Superior cost and schedule delivery
Maximize efficiencies
Reappraisal to continuously improve
project performance
Upstream
* Actual versus funded cost variance (%); ’07 to ’11 project start-ups in ExxonMobil portfolio
Cost Performance*
2007 –
2011 Average
Percent
109%
103%
Operational Excellence
0
50
100
150
ExxonMobil Operated
Operated-by-Others |
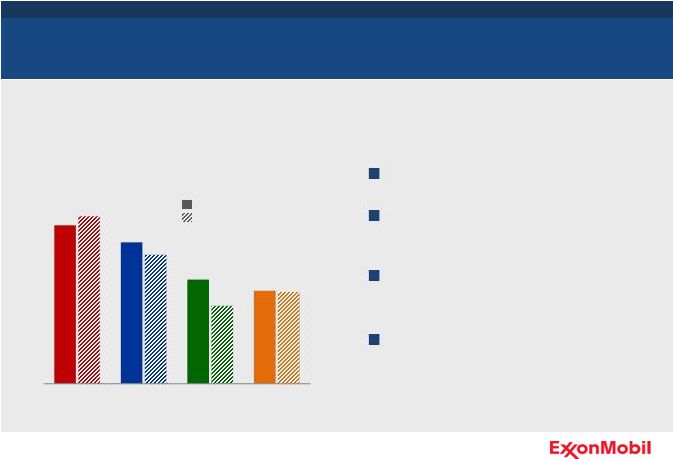
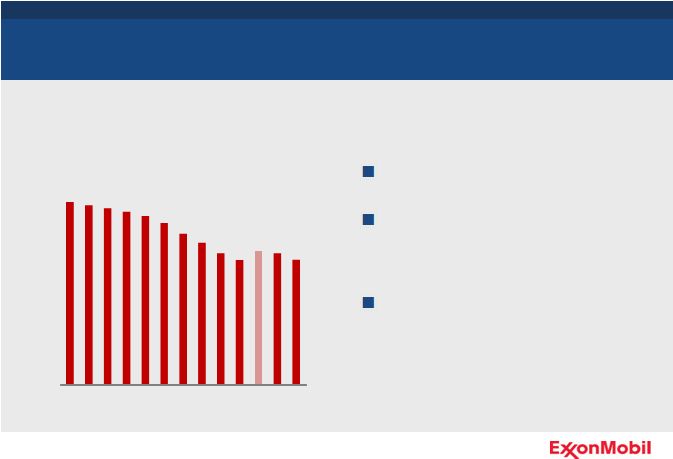
 66
Cost Management
Disciplined and consistent approach to cost management
Continual effort to maximize the
value of each asset
Mature contracting strategies
Ongoing portfolio management
Upstream
* Upstream technical costs using 10-K/20-F information; beginning in 2009
equity companies and oil sands mining operations are included.
Total Costs per OEB*
$/OEB
CVX
RDS
BP
XOM
Operational Excellence
0
5
10
15
20
25
'06
'07
'08
'09
'10 |
 67
Angola and Sakhalin Developments
Delivering significant life-cycle value from frontier developments
Upstream
Enabling frontier developments with
differentiating technologies
Delivering operational excellence
Over 1.7 billion barrels produced
Over 95 percent uptime
Rapidly nationalizing the workforce
Maintaining strong government
relations
Operational Excellence |
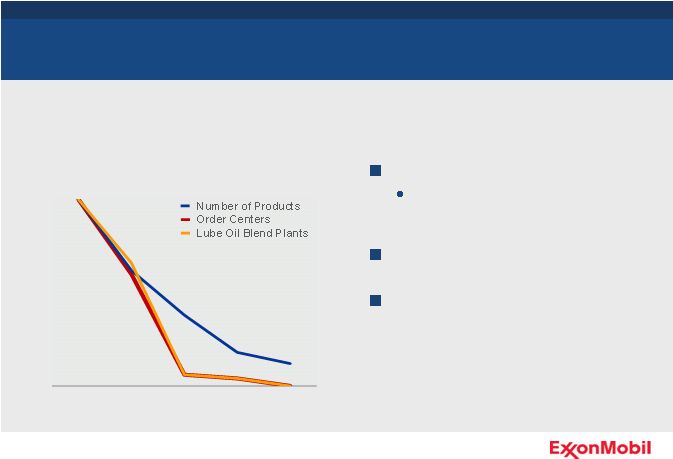 68
Improving Productivity
Focus on optimizing productivity delivers competitive advantage
Downstream
Ongoing consolidation activities
Integrated marketing company
announced in 2011
Streamlined product offering
Global organization, systems, and
processes driving lower operating
expenses
Supply Chain Operating Efficiencies
Indexed
Operational Excellence
50
60
70
80
90
100
'04
'06
'08
'10
'11 |
 69
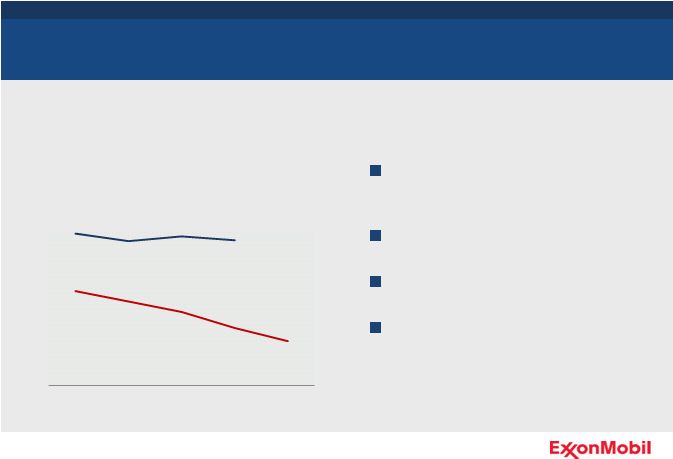
Operating Efficiency
Sustaining high levels of operating efficiency
Downstream / Chemical
Refining and Chemical expanding
energy efficiency advantage
Globally shared best practices
Advanced technologies
Targeted investments
Refining Energy Intensity*
Indexed
ExxonMobil
Industry Average
* Data indexed to ExxonMobil (’04). Source:
Solomon Associates fuels refining benchmarking data; available for even
years. 2011 data estimated by ExxonMobil. Operational Excellence
90
95
100
105
110
'04
'06
'08
'10
'11 |
 70
Higher Operating Rates
Technology enables higher capacity utilization
Chemical
Reliability focus
Feedstock flexibility expands range of
economic operation
Fast-growing and high-value
derivatives
Global Steam Cracker Capacity Utilization
2007 –
2011 Average
Percent
ExxonMobil
Source: IHS Chemical
Operational Excellence
85
86
87
88
89
90
Industry Average |
 71
Competitive Advantages
ExxonMobil possesses unique competitive advantages
Balanced Portfolio
Disciplined Investing
High-Impact Technologies
Operational Excellence
Global Integration |
 72
Maximizing Value through Integration
Global Integration
Corporate
Maximize value from Upstream
resource through to finished products
Leverage global functional
organization
Broadly deploy best practices
Economies of scale, shared support
services, purchasing
Maximize technology potential
Continuing to create value through the integrated business model
|
 73
Marketing New Crudes
Early integration across the supply chain enhances resource value
Upstream / Downstream
Upstream leveraging Downstream to
optimize equity crude value
Consistent integrated approach
Molecular assays
Crude valuation
Technical readiness
Refining capability and placement
Global Integration |
 74
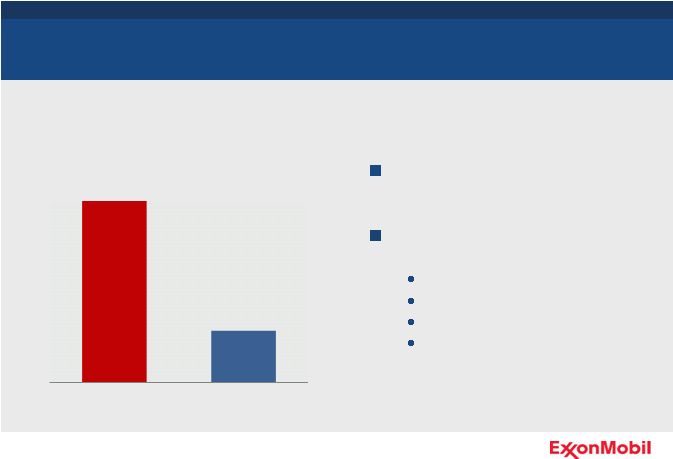
Integrated Manufacturing
ExxonMobil has integration advantages that are difficult to replicate
Higher-value products
Integrated molecular optimization
Assets with unparalleled feed
flexibility
Common site management, utilities,
and infrastructure
Refining Integration with Chemicals/Lubes*
Percent
Downstream / Chemical
Source: Parpinelli Tecnon database
* Calculated on a consistent basis using public information; year-end
2011. Global Integration
20
40
60
80
ExxonMobil
Industry Average* |
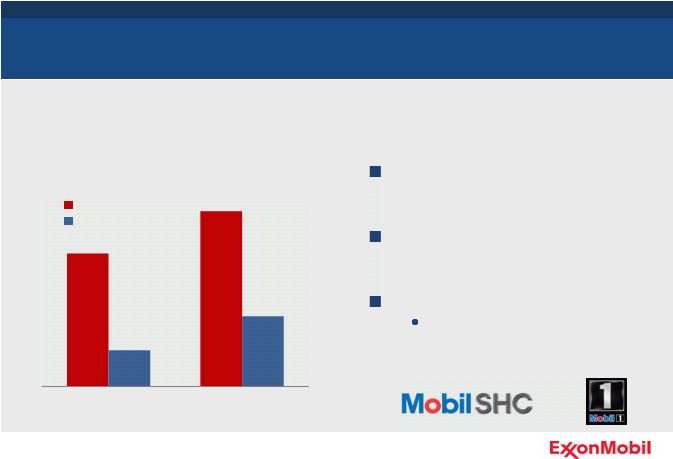
 75
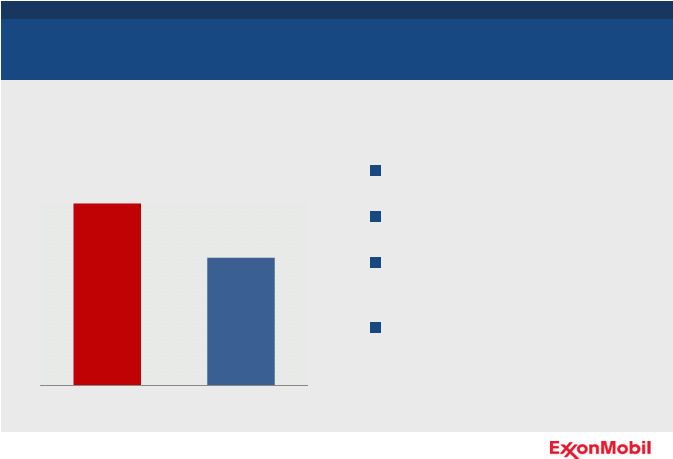
Industry-Leading Results
Downstream / Chemical
Proven business strategies enabled
by technology
Businesses optimized together to
maximize shareholder value
2008 –
2011 average annual
results:
Earnings of $8 billion
19 percent ROCE; nearly three
times the competitor average
* Competitor data estimated on a consistent basis with ExxonMobil and
based on public information. Competitors include BP, RDS, and CVX.
Downstream and Chemical Combined ROCE
Percent
ExxonMobil
Competitor Range
Global Integration
0
10
20
30
40
'08
'09
'10
'11
Downstream and Chemical businesses outperform competition
|
 76
Competitive Advantages
ExxonMobil possesses unique competitive advantages
Balanced Portfolio
Disciplined Investing
High-Impact Technologies
Operational Excellence
Global Integration |
 77
Senior Vice President
Mark Albers
Unlocking Greater Value in the Upstream
Senior Vice President
Andy Swiger |
 78
Upstream
Consistent execution of our strategies, underpinned by a relentless
focus on operational excellence, drives delivery of superior results
High-quality resources captured at
attractive costs
Effective partnerships
Distinguishing technologies
Proven project execution
Operational excellence |
 79
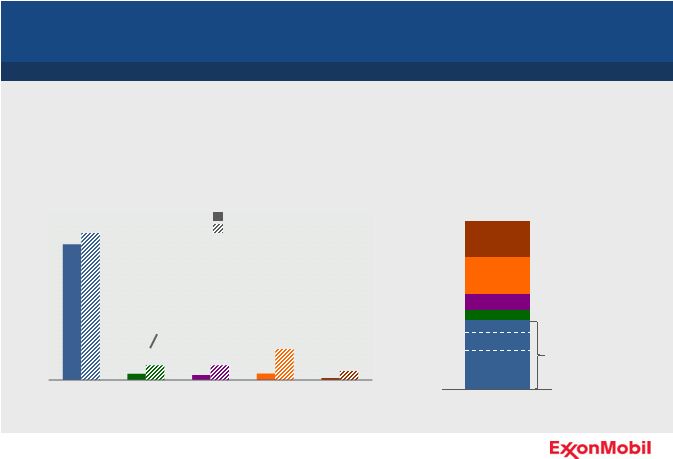
Meeting the Energy Challenge
Diverse and material portfolio across resource types of growing
importance in meeting global energy demand
0
30
60
90
2011 ExxonMobil Resource Base
Unconventional
Oil and Gas
Conventional
Heavy Oil / Oil Sands
Deepwater
Liquefied Natural Gas
Arctic
Acid / Sour
BOEB
* Source: ExxonMobil 2012 Outlook for Energy
World Oil and Gas Supply Growth*
MOEBD
2010 Production
2040 Production
Conventional
Deepwater
LNG
Unconventional
Oil and Gas
Heavy Oil /
Oil Sands
0.3%
2.8%
3.5%
5.3%
4.8%
Annual Growth
Rate to 2040
0
50
100
150 |
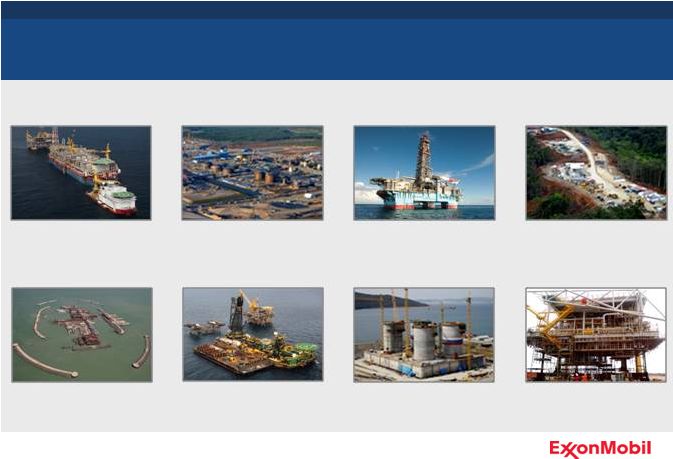
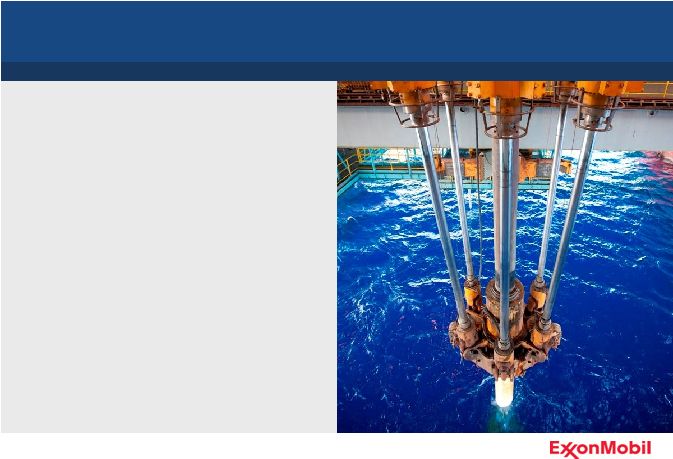
 80
Conventional
Delivering significant value from conventional resources
Note: Conventional includes arctic and acid/sour resource types
|
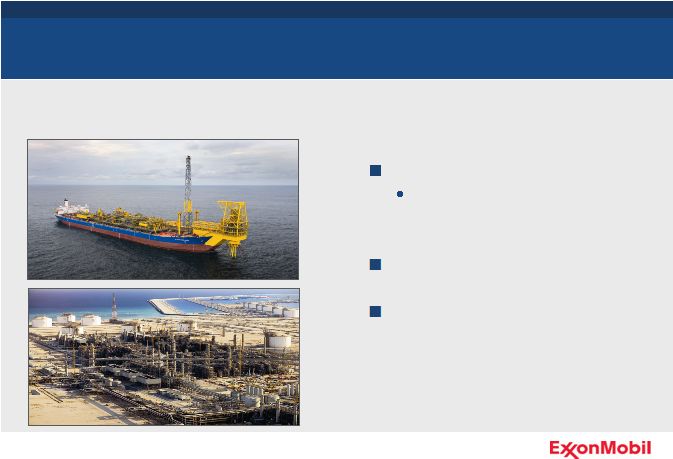
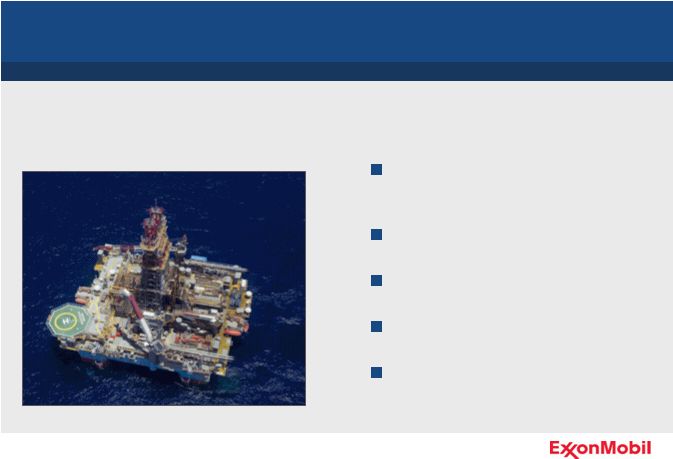
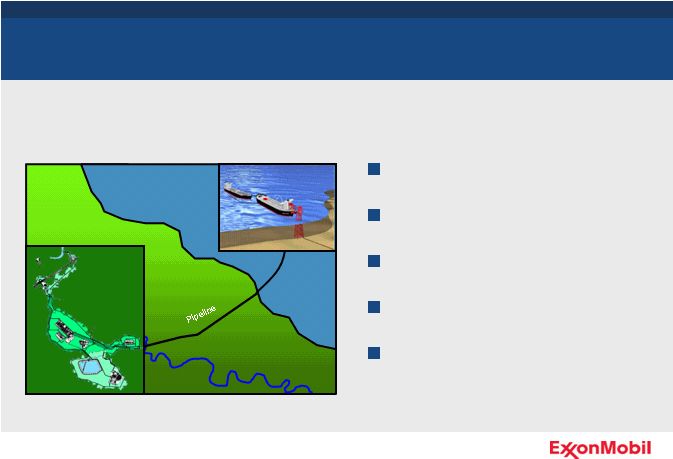 Banyu Urip, Indonesia
Significant onshore oil development progressing on schedule
Conventional
450 MB oil resource
Early production of 20 KBD
165 KBD full field capacity
5 Full Field EPC contracts awarded
Anticipated start-up in 2014
81
Central
Processing
Facilities
Floating Storage &
Offloading Vessel |
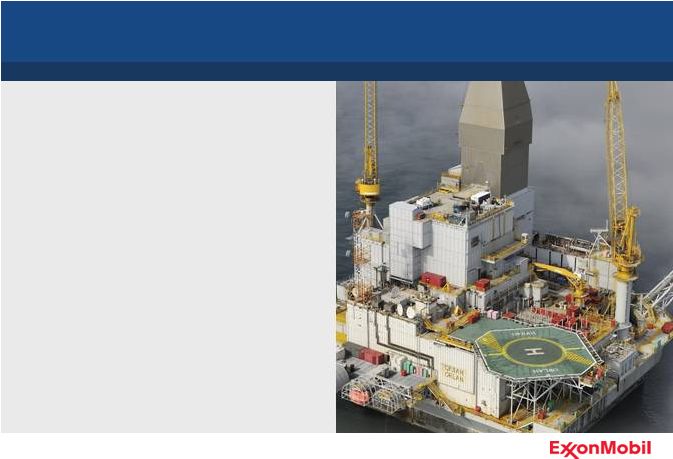
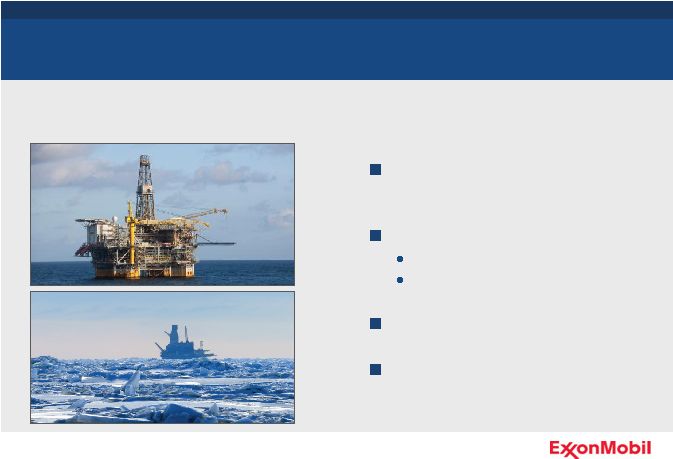
 Sakhalin and Hebron
Applying proven arctic capabilities to progress additional developments
Arctic
Odoptu holds world record for extended
reach well
Arkutun-Dagi fabrication in progress and
on schedule for 2014 start-up
Initial engineering under way
82
Sakhalin
Hebron |
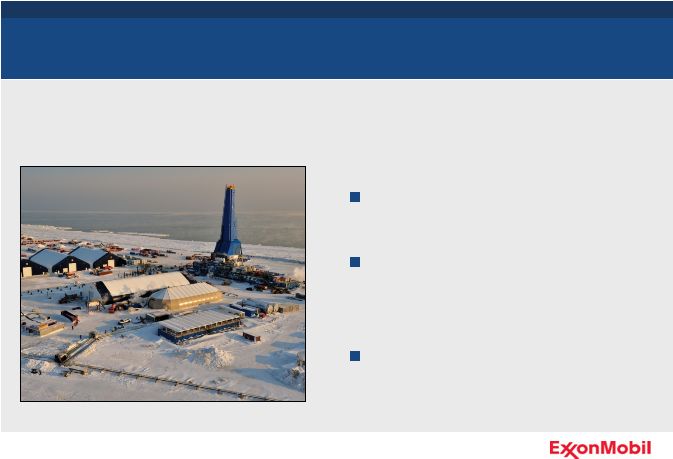
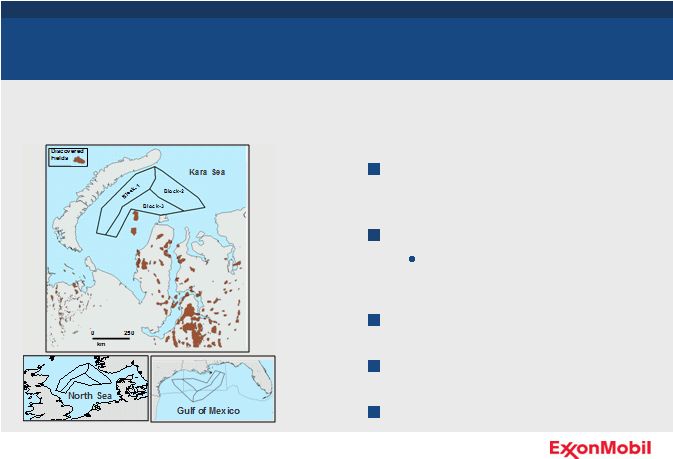 Russia
Extending capabilities to significant new arctic acreage position
Arctic
Entered into Strategic Cooperation
Agreement with Rosneft
Kara Sea –
31 million acres
Extension of prolific West Siberia
hydrocarbon province
Progressing definitive agreements
Pursuing fiscal improvements
Commencing exploration activities
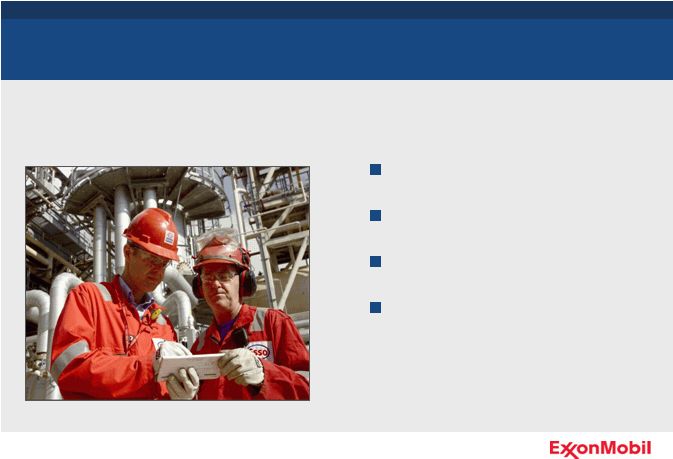
83 |
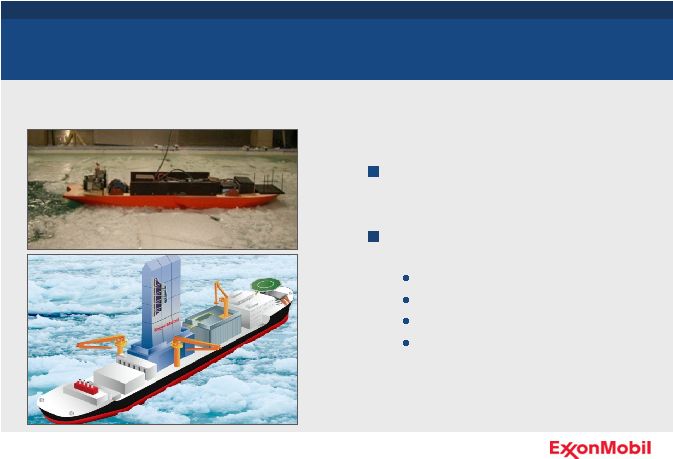 Technology
Continuing to advance new technology solutions for arctic resources
Arctic
90 years of arctic technology
development
Progressing next-generation
technologies
Advanced arctic characterization
Ice management systems
Floating drilling
Gravity-based structures
Laboratory Ice Management Trials
Floating Arctic Drillship
84 |
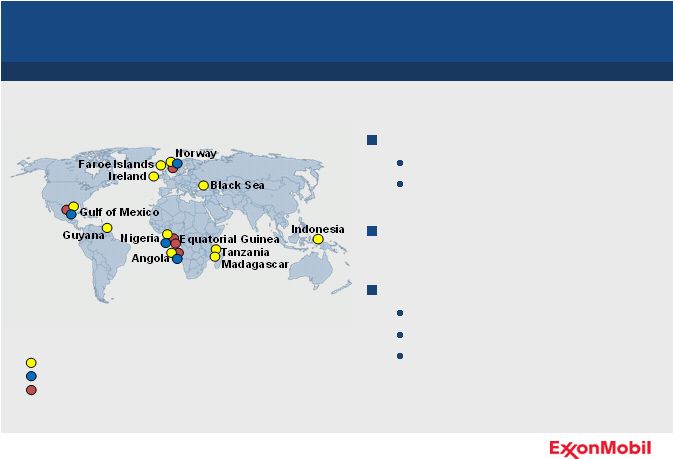 Deepwater
Building on established deepwater capability
Innovative design approaches
Early Production Systems
“Design One, Build Multiple”
Progressing
exploration
activities
West and East Africa
Black Sea
Gulf of Mexico
85
Cost-effective subsea satellite field
development
Exploration
Major Projects
Production Operations |
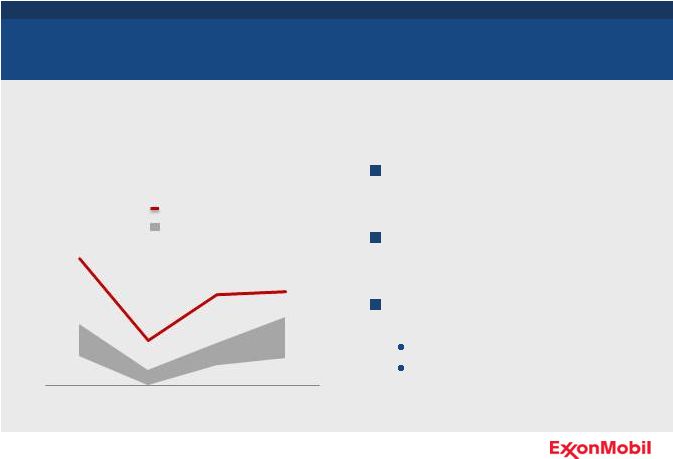
 Gulf of Mexico
Progressing development of discoveries in the Gulf of Mexico
Deepwater
Large, high-quality acreage position
Significant discoveries at Hadrian and
Lucius
Progressing developments
Lucius / Hadrian South funded
Hadrian North FEED under way
Julia Phase 1 FEED under way
Maturing prospect inventory
Oil Discovery
Gas Discovery
ExxonMobil Lease
Well
Lucius and Hadrian Discoveries
GOM Project Development Costs*
$/OEB (2012$)
Hadrian
South
Lucius
Hadrian
North
2 Miles
40
* Source: Wood Mackenzie
Discovery
ExxonMobil Participation
Industry
0
20
86 |
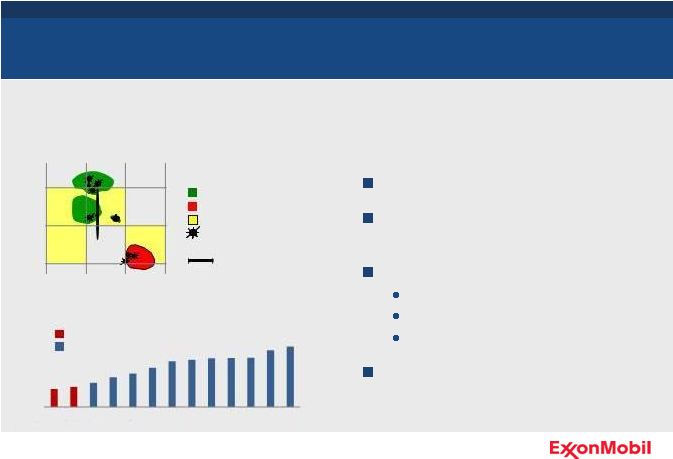
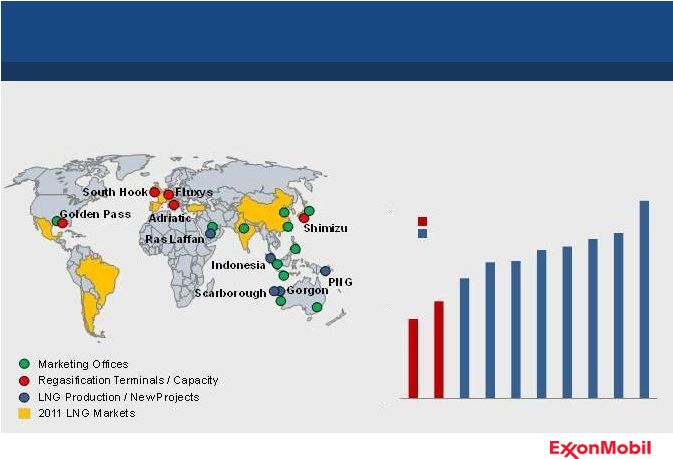 Liquefied Natural Gas
ExxonMobil has leading global liquefied natural gas capability
ExxonMobil Participation
Industry
LNG Project
LNG Development Costs*
$/OEB (2012$)
* Source: Wood Mackenzie
0
10
20
87 |
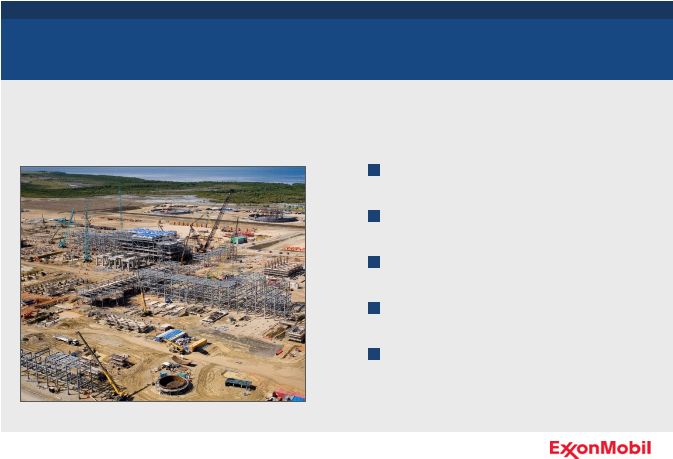 Papua New Guinea
Extending global LNG experience and project execution capabilities
Liquefied Natural Gas
High-quality 9 TCF resource
Two-train 6.6 MTA LNG plant
Progressing on schedule
Anticipate start-up in 2014
Active exploration program
88 |
 Unconventional Resources
Unconventional resource base
doubled since 2005
Accounts for over 40 percent of total
resource base
Gas growth balanced by strong
position in heavy oil / oil sands
Deep inventory of attractive
opportunities
Unconventional Resource Base
BOEB*
Unconventional
Oil and Gas
Heavy Oil /
Oil Sands
* Resource base at year end
89
0
10
20
30
40
Industry-leading global unconventional resource base
2005
2011 |
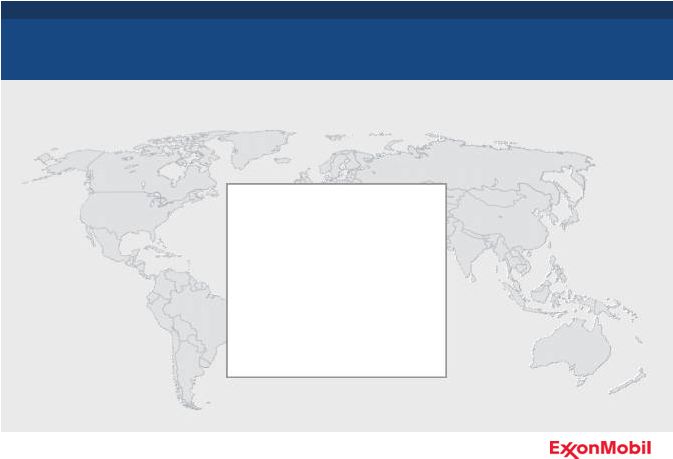
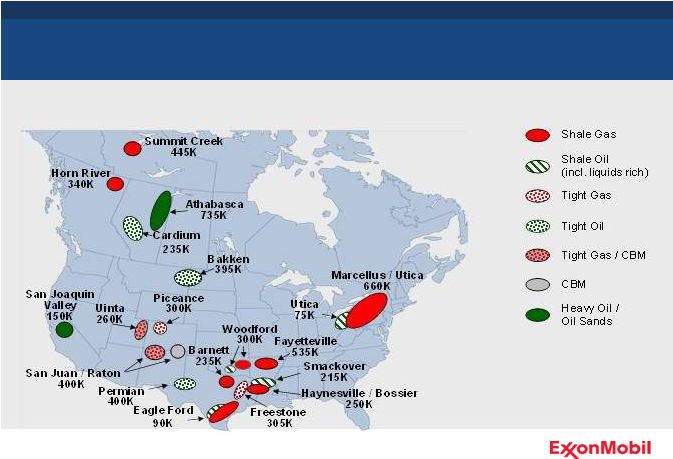 North America
Unconventional Resources
Material position in unconventional resource plays across N. America
90 |
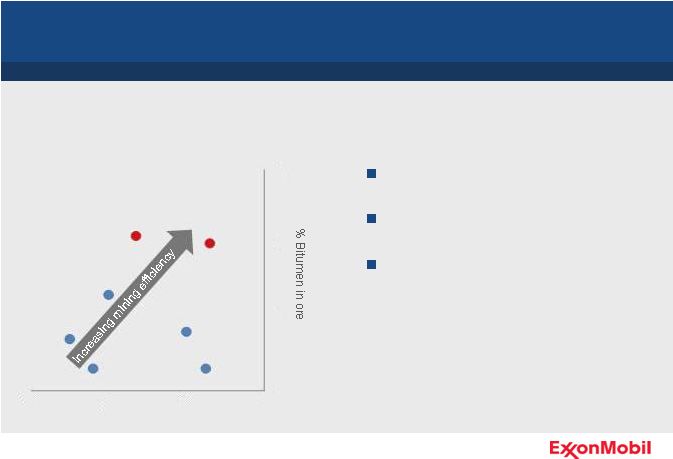 Oil
Sands High-quality oil sands resource underpins long-term resource
value Kearl
Firebag
Ratio of material moved to bitumen in-place
Oil Sands Mining Resource Quality
10
11
12
13
6
8
10
12
Significant acreage position
Among the highest quality
Growth
area, material, long-plateau
production
91 |
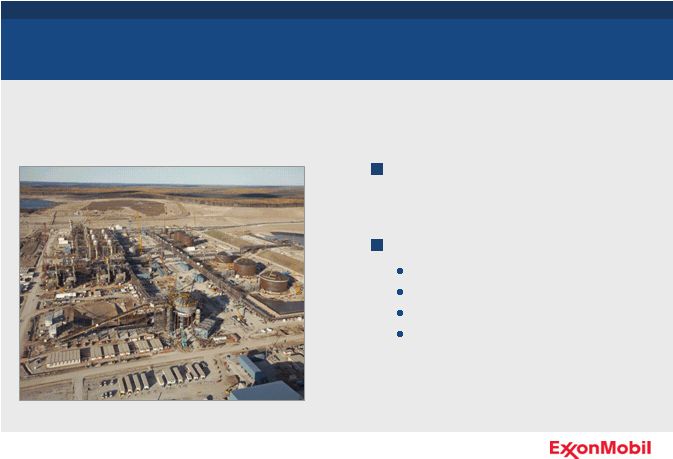
 Kearl
High-quality resource and enabling technologies deliver long-term value
Oil Sands
Long-term plateau production profile
On schedule to commence operations
year-end 2012
Expansion Project fully funded with
start-up year-end 2015
Proprietary technology
Attractive returns
0
200
400
Debottleneck
Expansion
Debottleneck
Initial Development
Kearl Development
KOEBD
Kearl Development
KOEBD
92 |
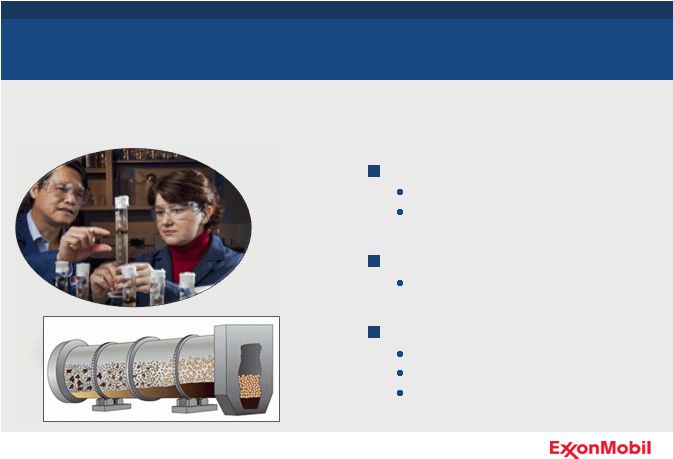 Technology
Emerging new technologies to further unlock oil sands value
Oil Sands
Paraffinic Froth Treatment
Eliminates need for on-site upgrader
Reduces GHG emissions and cost
Wet Tailings
Lowers tailings handling costs
Non-Aqueous Extraction
Significantly reduces water use
Avoids new wet tailings ponds
Higher bitumen recoveries
93 |
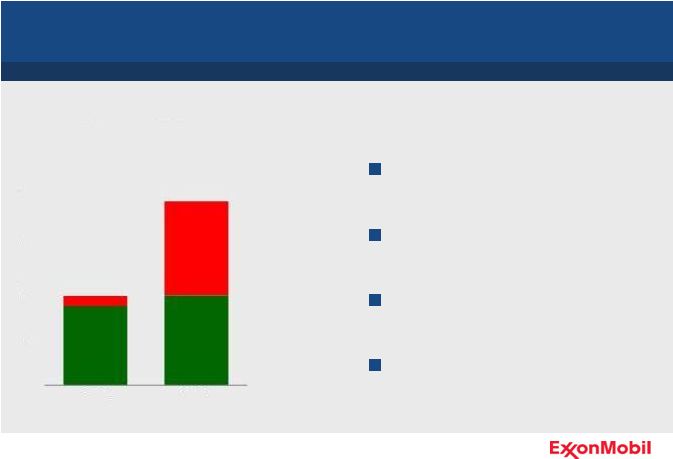
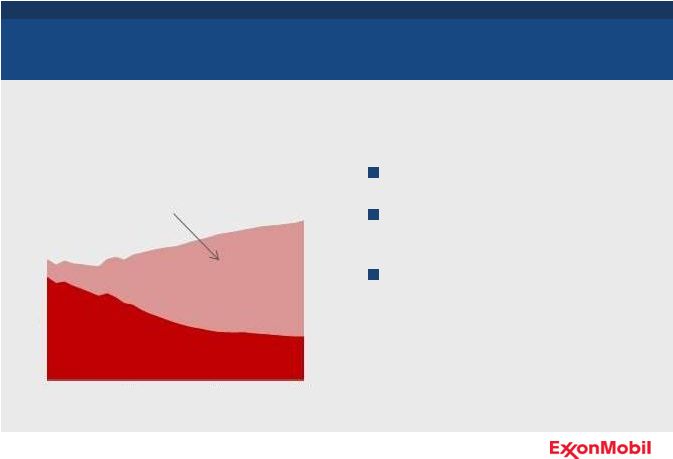 North America Gas
Technology unlocking new supplies
Significant unconventional growth to
offset conventional decline
About 70 percent of North America
demand is met by unconventional
production by 2030
Source: ExxonMobil 2012 Outlook for Energy
Local Production to Meet Demand
Unconventional
Conventional
GCFD
4.4% avg annual
growth
Unconventional Oil and Gas
0
40
80
120
'00
'10
'20
'30
Significant gas production growth required to meet demand
94 |
 Unconventional Capability
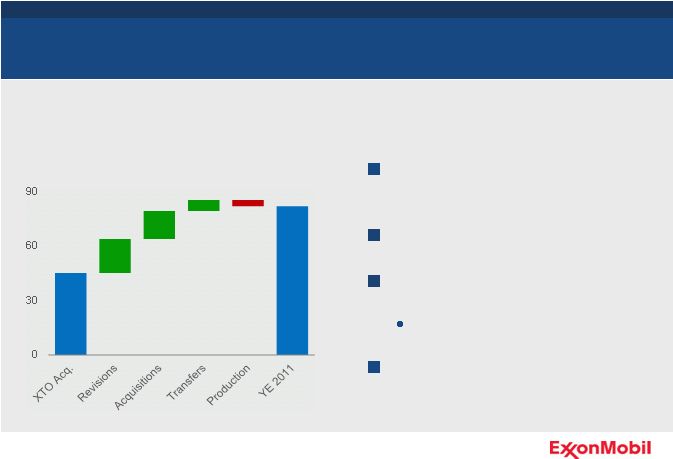
XTO established the foundation of our global unconventional capability
Unconventional Oil and Gas
Key enabler to unlocking global
unconventional resource value
XTO managing 82 TCFE at year-end
Adding quality acquisitions at attractive
costs
15 TCFE at $0.23/KCFE
Leveraging XTO capability in global
pursuits
95
XTO Resource Base Evolution (U.S.)
TCFE |
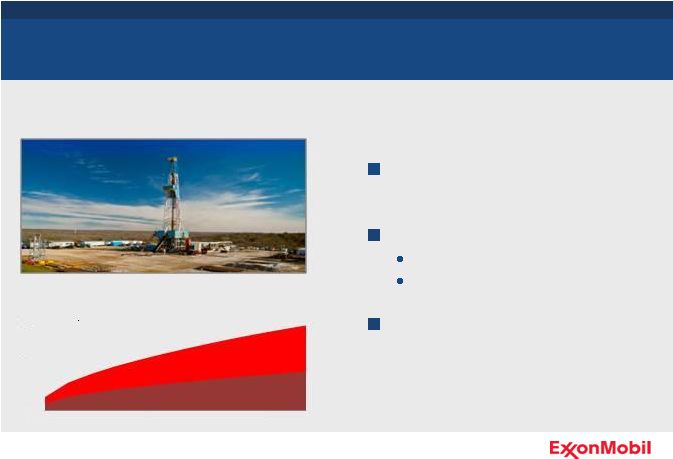 Liquids-Rich Plays
Unconventional Oil and Gas
Legacy tight oil positions in the Bakken
and Permian
Expanding Woodford Ardmore play
Over 170K net acres; 9 operated rigs
Develop ~600 MOEB at <$10/OEB
Growing portfolio of emerging plays
including Cardium in Canada
Gas
Liquids
96
Woodford Ardmore Development Scenario
KOEBD
0
40
80
2012
2017
2022
Well-positioned in liquids-rich unconventional plays
|
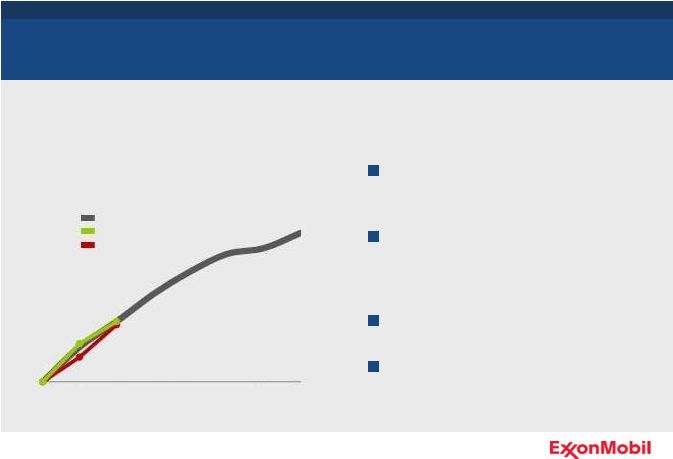 Operational Excellence
Unconventional Oil and Gas
Mature play learnings being applied
to new plays
Continue to extract value even as
wells have become more complex to
drill
Systematic approach
Apply approach to global portfolio
Drilling Days Evolution
Percent Improvement
Time (years)
0
40
80
1
2
3
4
5
6
7
8
Operational efficiency and technology capture additional value
Barnett
Haynesville
Fayetteville
97 |
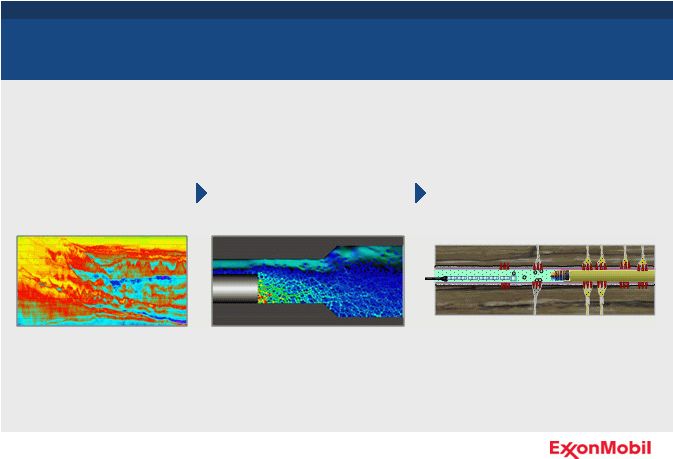
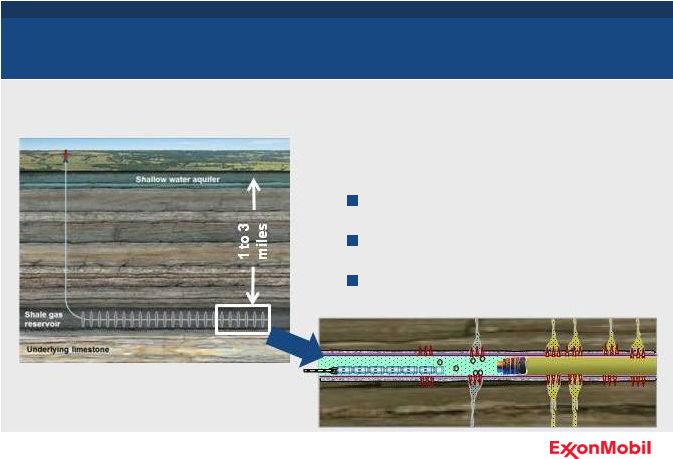 Technology
Unconventional Oil and Gas
Enhanced perforating and stimulation
technologies
Reduce completion costs
Improve recovery
Enable water reuse
New technologies are further enhancing unconventional value
98 |
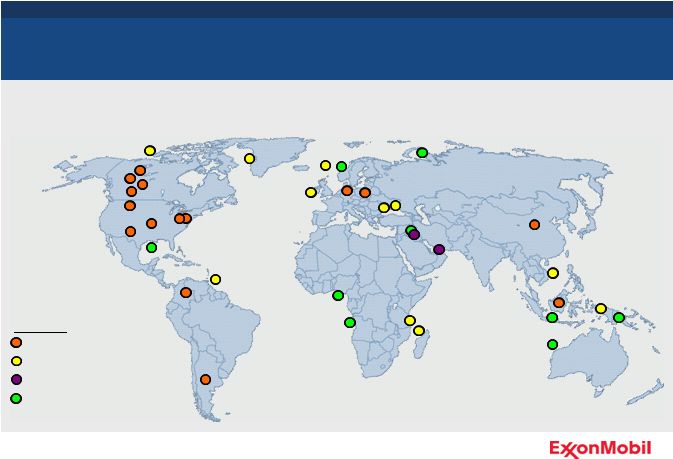
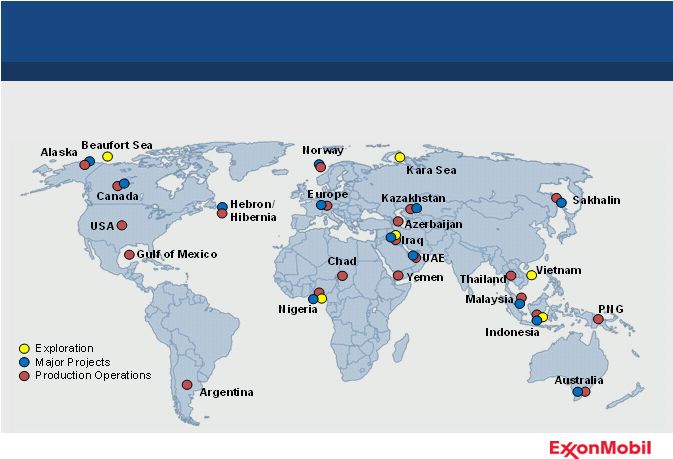
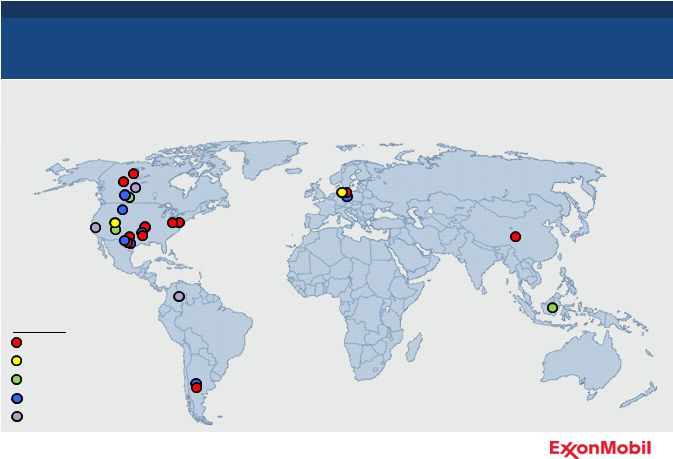 Global Portfolio
Unconventional Resources
Growing global portfolio with early-mover, quality acreage pursuits
99
Indonesia
China
Canada
USA
Europe
Play Type
Colombia
Argentina
Shale Gas
Tight Gas
Coal Bed Methane
Tight / Shale
Oil
Heavy Oil / Oil Sands |
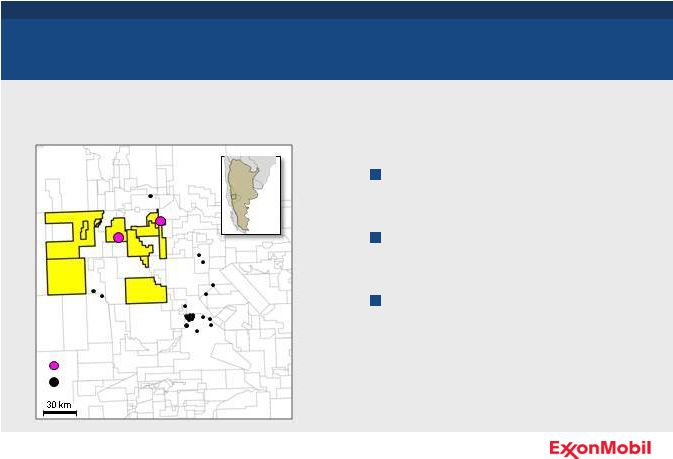 Argentina
Unconventional Resources
100
ExxonMobil Current Drilling
Industry Vaca Muerta Exploration Well
Material position in the Vaca
Muerta play of the Neuquén Basin
Drilling commenced to evaluate
liquids and gas potential
Leveraging ExxonMobil
unconventional capabilities globally
Commencing exploration activities in a promising unconventional play
|
 101
Unlocking Greater Value
Superior value creation relies on high-quality resources, growth
markets, enabling technologies, and growing organizational capability
High-quality resources captured at
attractive costs
Effective partnerships
Distinguishing technologies
Proven project execution
Operational excellence
0
30
60
90
2011 ExxonMobil Resource Base
Unconventional
Oil and Gas
Conventional
Heavy Oil / Oil Sands
Deepwater
Liquefied Natural Gas
Arctic
Acid / Sour
BOEB |
 102
Chairman and CEO
Rex Tillerson
Outlook |
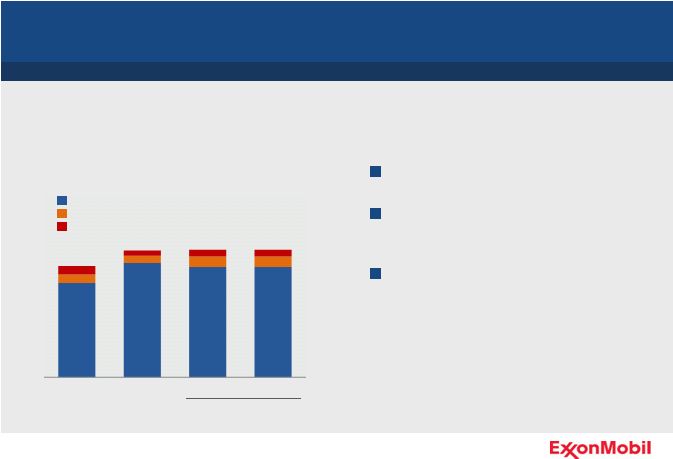 103
Committed to investing through the business cycle
Investment Plan
Capex by Business Line
$B
Upstream
Downstream
Chemical / Other
Estimate ~$37B/yr
Disciplined, resilient investments
Progressing large inventory of
high-quality projects
Expect to invest approximately
$37 billion per year 2012 –
2016
0
10
20
30
40
50
'10
'11
'12
'13 -'16 |
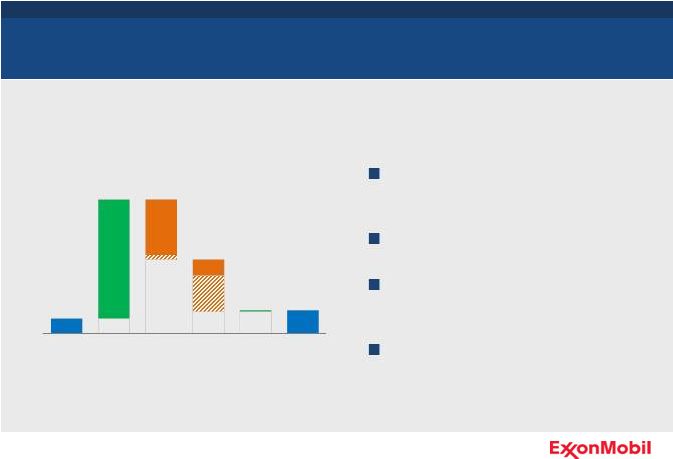
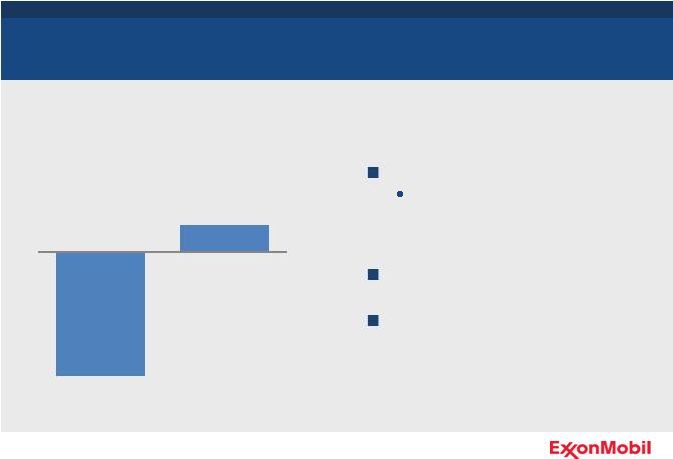
 104
Upstream Production Outlook
Production in line with long-term growth estimates
2011 Production
MOEBD
* Excludes impact of future divestments and OPEC quota effects.
** 2011 Outlook as communicated in 2011 Analyst Meeting.
2009 to 2014 Growth Projections*
Percent Growth
4.0
4.3
4.6
2011
Analyst
Meeting
Outlook**
Price /
Entitlements
Performance
2011
Actual
2
3
4
5
2011
Analyst
Meeting
Outlook**
Price /
Entitlements
Performance
2012
Analyst
Meeting |
 105
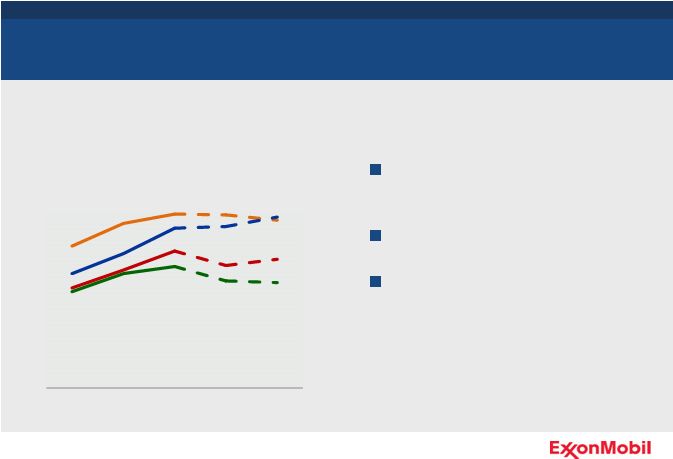
Upstream Production Outlook
Production driven by strong performance, quality projects and resources
* Excludes impact of future divestments and OPEC quota effects.
Total Production Outlook*
MOEBD
Base Production
Project Volumes
0
2
4
6
'10
'11
'12
'13
'14
'15
'16
Projections based on 2011
average prices ($111/B Brent)
Volume outlook:
2011 to 2012: down 3 percent
2011 to 2016: up 1 to 2 percent/yr
Base decline rate of 3 percent
Unconventional and long-plateau
volumes mitigate
decline |
 Upstream Production Outlook
Balanced portfolio with strong contributions from liquids and gas
Projections based on 2011 average
prices ($111/B Brent)
Major projects and strong work
program drive growth
Liquids: 2 to 3 percent per year
Gas: 0.5 to 1 percent per year
Growing contribution of long-plateau
volumes
Total Production Outlook*
MOEBD
* Excludes impact of future divestments and OPEC quota effects.
Liquids
Gas
0
2
4
6
'10
'11
'12
'13
'14
'15
'16
106 |
 107
Chairman and CEO
Rex Tillerson
Summary |
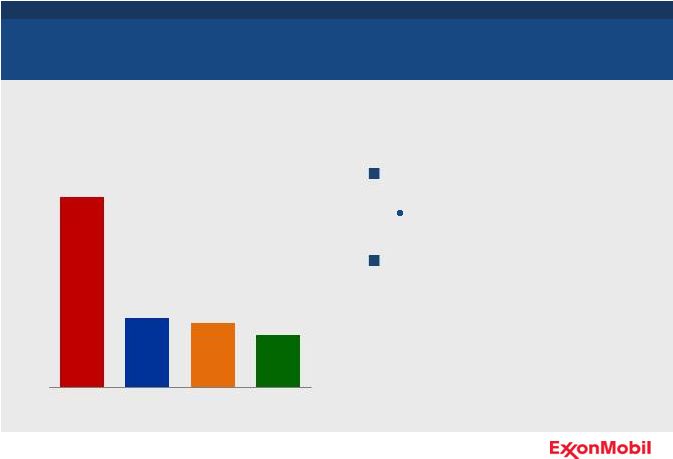
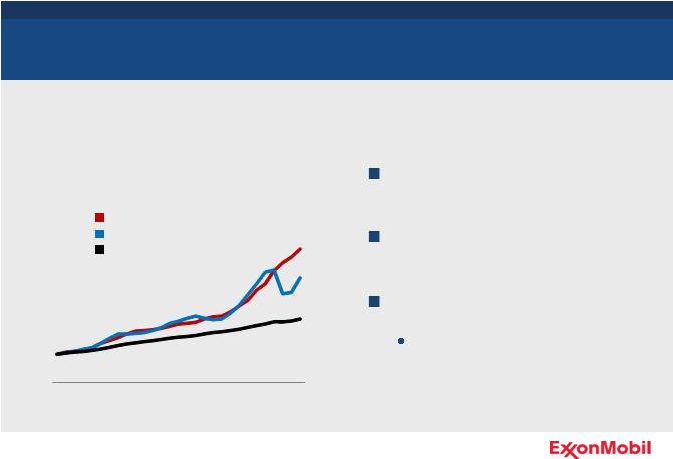
 108
Long-term performance exceeds competitor average and S&P 500
Financial results and stock market
returns best viewed over long term
Reflects strong financial and
operating performance
Competitive advantages maximize
shareholder value
* RDS, BP, and CVX
Shareholder Returns
Value of $1,000 Invested (as of YE 2011)
$K
ExxonMobil
Competitor Average*
S&P 500
Share Performance
0
3
6
9
12
20 Years
10 Years
5 Years |
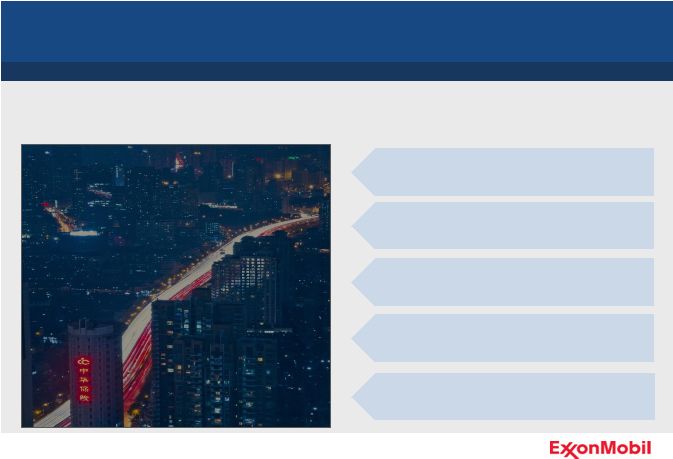  Meeting the World’s Energy Challenges
Expanded supply
Expanded supply
of traditional fuels
of traditional fuels
•
Large, diverse resource base
•
Strong LNG portfolio
•
Strategic projects
•
World-class R&D programs
•
Technology to unlock value
•
Financial strength
•
Disciplined, resilient investments
Meeting Asia
Meeting Asia
Pacific demand
Pacific demand
growth
growth
Technology
Technology
advances
advances
Unprecedented
Unprecedented
levels of
levels of
investment
investment
Development of
Development of
new sources of
new sources of
energy
energy
•
Leadership in unconventional
resource development
Meeting the world’s growing
energy needs requires:
ExxonMobil has:
109 |
 ExxonMobil Strengths
Relentless focus on maximizing long-term shareholder value
Strong Financial and Operating Performance
Balanced Portfolio
Disciplined Investing
High-Impact Technologies
Operational Excellence
Global Integration
110 |