Attached files
| file | filename |
|---|---|
| 8-K - FORM 8-K - Cooper-Standard Holdings Inc. | d315274d8k.htm |
 Cooper Standard 4Q & Full Year 2011
Fourth Quarter and Full Year Earnings Call
March 14, 2012
Exhibit 99.1 |
 cooperstandard
Introduction & Agenda
•
Introduction:
Glenn
Dong,
Treasurer
•
Executive
Overview:
Jim
McElya,
CEO
•
Business
Highlights:
Keith
Stephenson,
COO
•
Financial
Review
&
2012
Guidance:
Allen
Campbell,
CFO
•
Questions
&
Answers
2 |
 cooperstandard
Safe Harbor
3
This presentation includes forward-looking statements as contemplated by the 1995 Private
Securities Litigation Reform Act, reflecting management’s current analysis and
expectations, based on what are believed to be reasonable assumptions. The words
“estimates,” “expects,” “anticipates,” “projects,” “plans,” “intends,” “believes,” “forecasts,” or future
or conditional verbs, such as “will,” “should,” “could,” or
“may,” and variations of such words or similar expressions are intended to identify
forward-looking statements. Forward-looking statements may involve known and unknown risks,
uncertainties and other factors, which may cause actual results to differ materially from those
projected, stated or implied, depending on many factors, including, without limitation: our
dependence on the automotive industry; further restructuring of our customers; availability and
cost of raw materials; pricing pressures and volume requirements of our customers; the ability
to meet significant increase in customer demand; increased costs negatively impacting our profitability; competition
in the automotive industry; sovereign and other risks related to our conducting operations outside the
United States; foreign currency fluctuations; our ability to achieve benefits from our joint
venture operations not operated for our sole benefit; our exposure to the uncertainty of
political disruptions and increased violence in Mexico; the uncertainty of our ability to
achieve expected cost reduction savings; our dependence on certain major customers and platforms; our
exposure to product liability and warranty claims; labor conditions; our ability to attract and retain
key personnel; our ability to meet customers’ needs for new and improved products in a
timely manner; our ability to select and integrate attractive business acquisitions; our legal
rights to our intellectual property portfolio; environmental and other regulations; the outcome
of legal proceedings the Company is or may become party to; volatility in our expected annual effective tax rate;
impact of our capital structure on our financial condition and ability to obtain financing in the
future; our ability to generate cash to meet our debt and other cash obligations; our pension
plans; any impairment of a significant amount of our goodwill or other intangible asset;
potential conflicts of interest between our owners and us; limitations on flexibility in
operating our business contained in our debt agreements; our exposure to natural disasters; and other
risks described from time to time in the Company’s Securities and Exchange Commission
filings. There may be other factors that may cause the company’s actual results to
differ materially from those projected in any forward-looking statement. Accordingly, there
can be no assurance that Cooper Standard will meet future results, performance or achievements expressed or
implied by such forward-looking statements. This paragraph is included to provide a safe harbor
for forward-looking statements, which are not generally required to be publicly revised as
circumstances change and which Cooper Standard does not intend to update. The
forward-looking statements in this presentation are made as of the date hereof, and the
Company does not assume any obligation to update, amend or clarify them to reflect events, new
information or circumstances occurring after the date hereof. |
 Jim
McElya Chairman & CEO
Executive Overview
4Q & Full Year 2011 |
 cooperstandard
Executive Overview: 2011 & Q4 Review
•
Full Year 2011:
•
Sales up 18.2%
•
Adjusted EBITDA margin of 11.4%
•
•
5
* Based on currently estimated production volumes for the future
periods pertaining to the
awards; includes new, replacement and conquest business.
Net new business awards of $403 million*
Q4 2011:
Driven By:
•
Sales up 15.2%
•
Adjusted EBITDA margins of 9.6%
Higher industry volumes, favorable foreign currency movement, and
acquisitions
– |
 cooperstandard
Executive Overview
6
2011 Priorities
Actions
Successfully launch new technologies
Launched
pumps
with
Renault-Nissan
and
PSA
Customer awards on:
•
Obstacle Detection Systems (ODS)
•
Wastegate actuators
•
Throttle valves
•
Next generation fuel rails
Aggressively pursue business on global
platforms
Expanded product capability in multiple regions
Continue expansion in Asia & South America
Added India and new Brazil site
Manage raw material costs and supply
Secured key raw material price adjustments at
key customers
Leverage global alliance with Nishikawa
Purchased 20% Nishikawa Thailand
Sold 10% NISCO
Furthered European plan |
 cooperstandard
7
Executive Overview: Industry Trends
•
Production volumes to grow
•
Stress of excess capacity on OEMs and supply
base in Europe
•
Emphasis on fuel economy and alternative
powertrains
•
Impact of higher fuel prices |
 cooperstandard
8
2012 Priorities
•
Focus on top-line growth
•
Expand advanced technology in fluid business
•
Leverage customer relationships and footprint to
win global platform awards
•
Additional expansion into emerging markets
•
Improve our European cost structure
•
Manage raw material costs |
 Business Highlights
4Q & Full Year 2011
Keith Stephenson
Chief Operating Officer |
 Business Highlights 4
th
Quarter
•
Solid revenue growth including new joint
venture relationships
•
Key program launches and continued growth of
global platforms
•
Cooper Standard France joint venture
increases opportunities for global business
wins
•
On-going global footprint evolution
•
Continued operational execution
cooperstandard
10 |
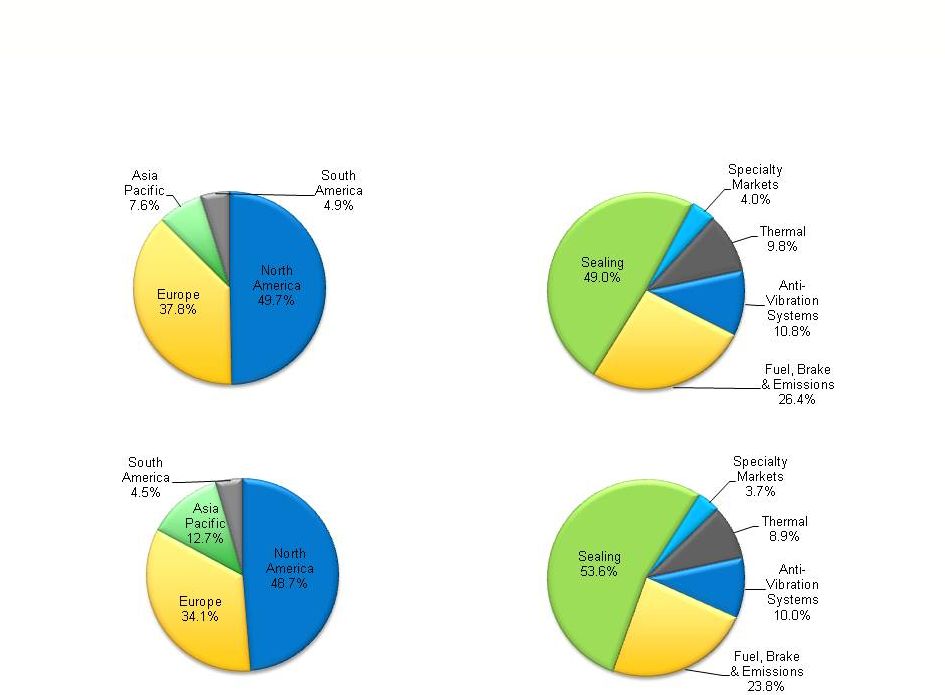 2011
Sales By Region & Product Groups *Sales by Region
Including Joint Venture Sales
*Sales by Product
Including Joint Venture Sales
Consolidated Sales by Region
Consolidated Sales by Product
*Includes JV sales with Hasco (SAIC), Sujan, Nisco N.A. and Nishikawa
Thailand cooperstandard
11 |
 Vehicle Launches 4
th
Quarter 2011
12
–
Fiat –
Panda
(Europe)
Sealing
–
Fiat –
Palio
(South America)
Sealing, Trim
–
Ford –
Lincoln
MKX
(North America)
Fuel & Brake, Thermal Oil Cooling
–
GM –
Chevrolet
Cruze
(North America & Asia)
Sealing, Fuel & Brake
–
GM –
Chevrolet Malibu
(Asia)
Sealing, Fuel & Brake
–
Honda –
Civic
(South America)
Sealing
Ford MKX
GM Chevrolet Cruze
Fiat Palio
Honda Civic
Fiat Panda
Note: Photos are representative and may not reflect final production models
GM Chevrolet Malibu
cooperstandard |
 cooperstandard
13
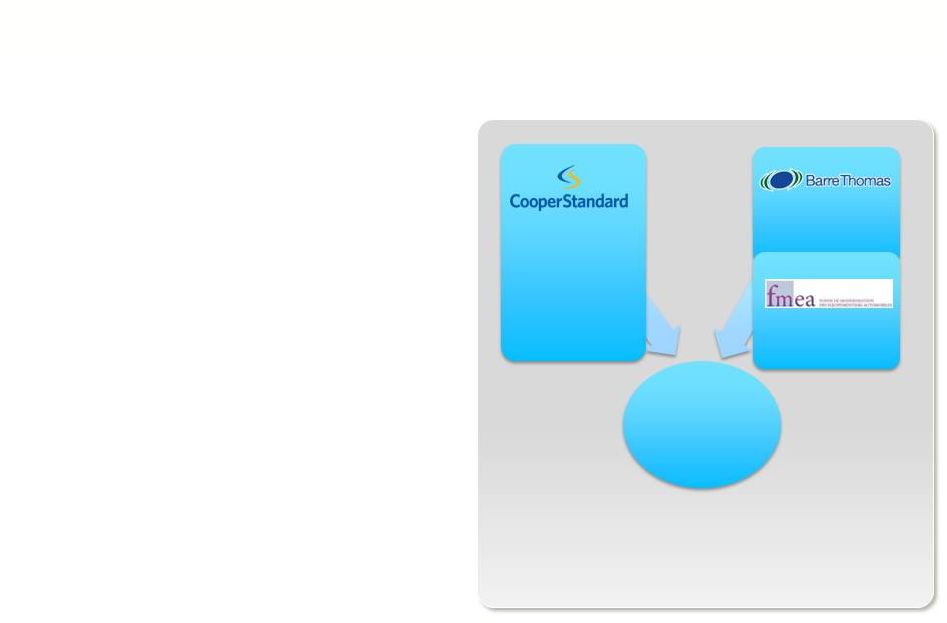
CS France Overview
•
Completed in Q2 2011
•
Strategic Objectives
–
Extend global sealing
leadership position
–
Expand hose and AVS
capabilities
–
Strengthen relationship with
global OEMs
–
Consolidate supplier base
while broadening footprint in
E. Europe and India
–
Fund the rationalization of
W. Europe capacity
51%
49%
•
Equity split –
CSA France 51% / FMEA 49%
•
FMEA contributed cash of EUR 24 million
•
Incremental sales of $150 million in 2011
CS
France
Plants
Technology
Management
SPBT Shares
Plants
Management
Cash Funding |
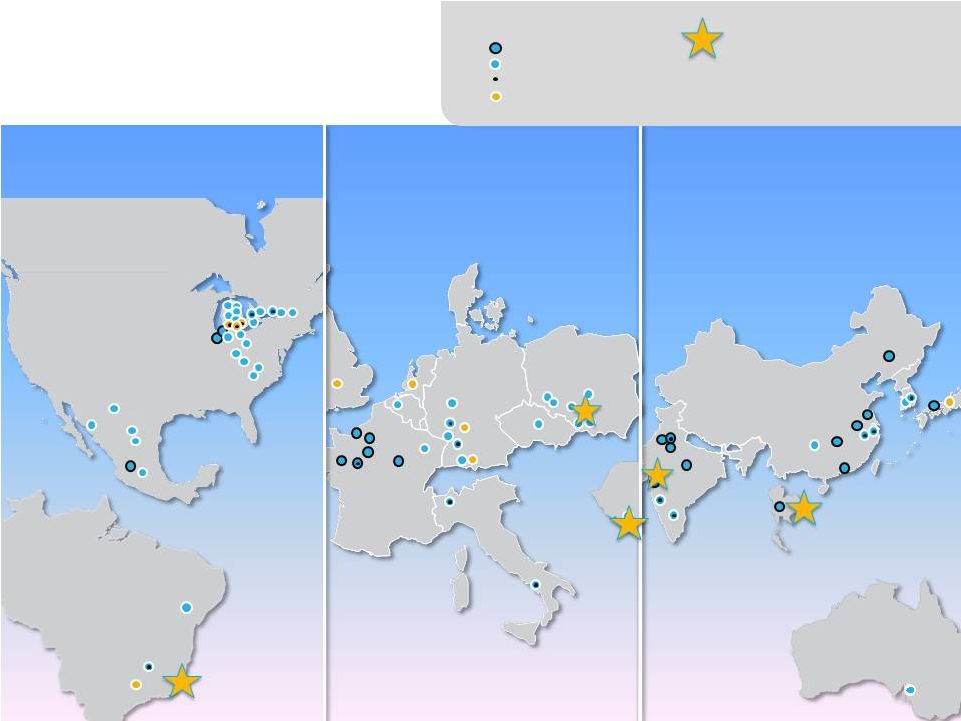 Global Footprint
Actions
Recent Footprint Expansion:
•
•
•
•
•
Joint Venture
Operation
Manufacturing
Technical Center
Sales / Administration
Americas
Europe
Asia Pacific
Craiova, Romania
Czestochowa, Poland
Mumbai, India
Nakhonratchasima, Thailand
Sao Paulo, Brazil |
 cooperstandard
15
Continued Operational Execution
•
Flexing our cost structure consistent with
regional market conditions
•
Achieved significant lean savings despite raw
material challenges
•
Integrating recent acquisitions
•
Numerous customer awards for quality and
service |
 Financial Overview
4Q & Full Year 2011
Allen Campbell
Chief Financial Officer |
 cooperstandard
Q4 and Full Year 2011 Performance
17
$ Millions
Q4 2010
Q4 2011
Net Sales
$603.7
$695.7
Operating Profit
$ 25.7
$ 22.9
Gross Profit
$ 96.8
$ 97.6
FY 2010
FY 2011
$2,414.1
$2,853.5
$ 142.2
$ 125.2
$ 409.6
$ 450.6
Net Income
$ 14.8
$ 23.2
$ 320.3
$ 102.8
Adjusted EBITDA
$ 66.6
$ 276.5
$ 324.1
$ 61.7
% Margin
9.6%
11.5%
10.2%
11.4%
SGA
$ 67.9
$ 66.7
$ 251.7
$ 257.6 |
 cooperstandard
EBITDA and Adjusted EBITDA Reconciliation
18
$ USD Millions
2010
2011
Net income
$ 320.3
$ 102.8
Provision for income tax expense
45.0
EBITDA
$ 537.2
$ 288.2
Restructuring
6.4
32.3
Adjusted EBITDA
$ 276.5
$ 324.1
20.8
12 Months Ended December 31st
Net Interest expense
69.5
40.5
Depreciation and amortization
102.4
124.1
Stock based compensation
6.6
Other / foreign exchange
21.6
10.8
(7.9)
EDITDA and Adjusted EBITDA are Non-GAAP measures. Reference comments on slide
24. Reorganization / Fresh Start
--
Inventory write-up
8.1
0.7
EBITDA excl. Reorganization
288.2
233.8
303.4 |
 cooperstandard
19
Base Business vs Joint Venture Financial Summary
Adjusted EBITDA margin
12.0%
7.3%
11.4%
Parent &
Wholly Owned
Joint
$ USD Millions
Subsidiaries
Ventures
Total
Sales
$2,458.8
$394.7
$2,853.5
Gross Profit
$417.2
$33.4
$450.6
Restructuring
$11.5
$40.7
$52.2
Equity Earnings
$0.8
$4.6
$5.4
Other Income (Expense)
($0.2)
$7.4
$7.2
Noncontrolling Interests
$0.0
$26.3
$26.3
Net Income
$102.8
$0.0
$102.8
Adjusted EBITDA
$295.2
$28.9
$324.1
Year Ended December 31, 2011
Gross Profit margin
17.0%
8.5%
15.8% |
 Cooper Standard Sales -
2011
Total $2,853.5
Total $3,158.9
*Includes JV sales with Hasco (SAIC), Sujan, Nisco N.A. and Nishikawa
Thailand Base
$2,695.6
Acquisitions
$157.9
Consolidated
$2,853.5
Unconsolidated
JVs
$305.4
0
500
1000
1500
2000
2500
3000
3500
cooperstandard
20 |
 cooperstandard
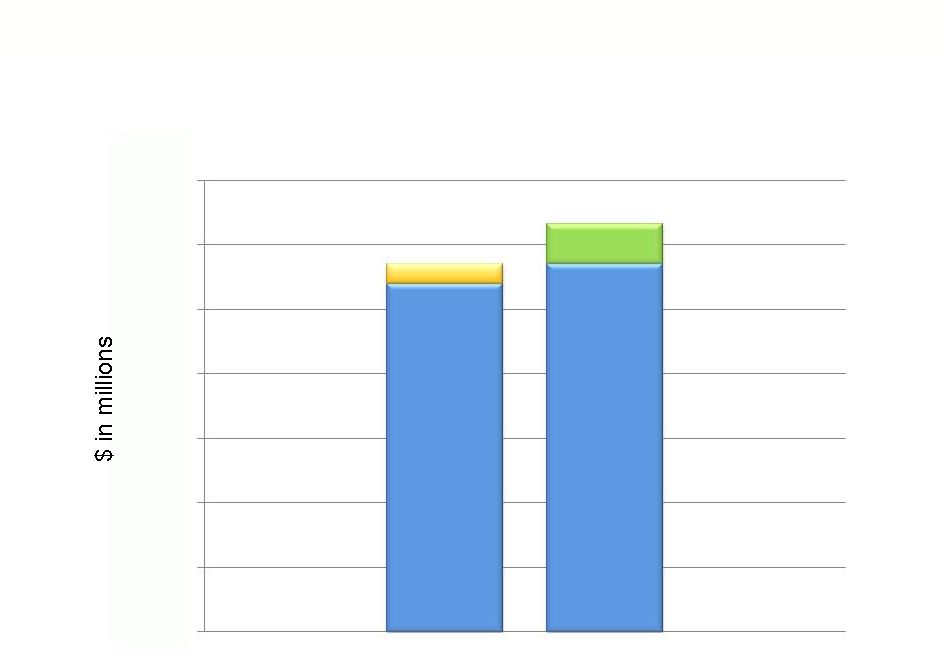
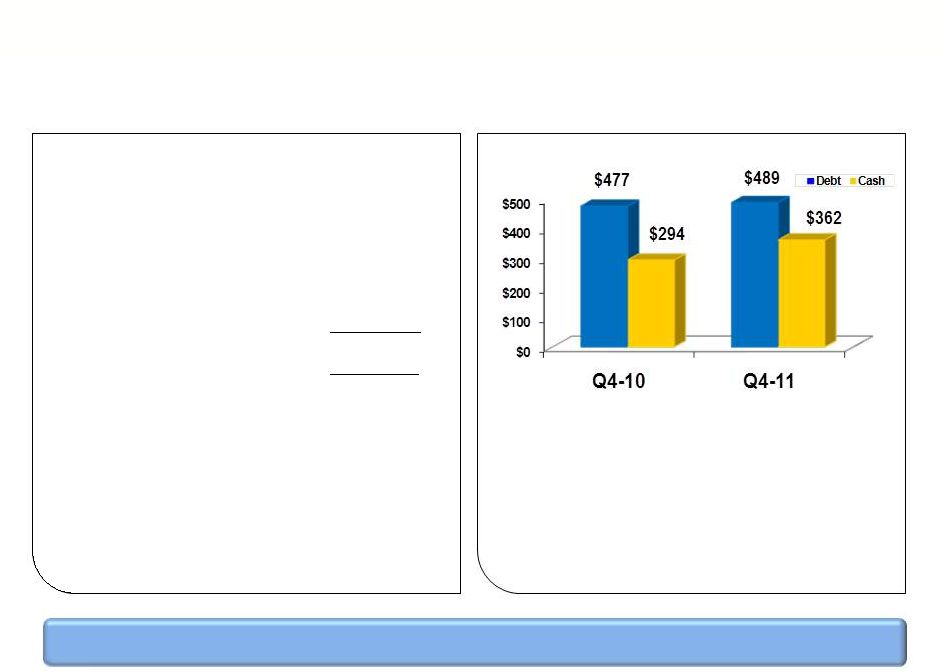
Cash Flow 4Q 2011
21
Cash Balance as of December 31, 2010
294.5
$
Cash generated
67.3
Cash Balance as of December 31, 2011
361.7
$
($ in Millions)
Q4 -
2011
YTD -
2011
Cash from business
$ 56.2
$ 202.4
Pension
funding
-
US
(3.0)
(34.4)
Changes in operating assets & liabilities
73.4
4.3
Cash from operations
$ 126.6
$ 172.3
Capital expenditures
(38.1)
(108.3)
Cash from operations less CAPEX
$ 88.5
$ 64.0
Acquisition of business, plus cash acquired
(2.4)
28.5
Proceeds from partial sale of joint venture
-
16.0
Investment in affiliate
-
(10.5)
Dividends –
Preferred Stock
(1.7)
(7.1)
Financing activities
(2.3)
(10.0)
Foreign exchange/other
0.8
(6.1)
Repurchase of preferred stock
(7.5)
(7.5)
Net cash generated
$ 75.4
$ 67.3
Note: Numbers subject to rounding |
 cooperstandard
22
Liquidity as of December 31, 2011
Cash on Balance Sheet
$361.7M
ABL Revolver
125.0M
Letters of Credit
(29.8)M
Total Liquidity
$456.9 M
Flexible capital structure allows for future growth opportunities
•
26% increase in cash from the prior
quarter
•
ABL Revolver undrawn
•
Net leverage = $127 million
•
Net leverage ratio = 0.4x
•
No major debt maturity until 2018
Note: Numbers subject to rounding |
 cooperstandard
2012 Guidance*
•
Sales: $2.85 billion -
$2.95 billion
•
Capital expenditures: $110 million -
$120 million
•
Cash restructuring: $45 million -
$55 million
•
Cash taxes: $25 million -
$30 million
* Guidance is based on North American production of 14.4 million,
and Europe (including Russia) production of
19.2 million. cooperstandard
23 |
 cooperstandard
Non-GAAP Financial Measures
24
EBITDA and adjusted EBITDA are measures not recognized under Generally
Accepted Accounting Principles (GAAP) which exclude certain non-cash and
non-recurring items.
When analyzing the company’s operating performance, investors should use
EBITDA and adjusted EBITDA in addition to, and not as alternatives for, net
income (loss), operating income, or any other performance measure derived in
accordance with GAAP, or as an alternative to cash flow from operating
activities as a measure of the company’s performance. EBITDA and adjusted
EBITDA have limitations as analytical tools and should not be considered in
isolation or as substitutes for analysis of the company’s results of operations as
reported under GAAP. Other companies may report EBITDA and adjusted
EBITDA differently and therefore Cooper Standard’s results may not be
comparable to other similarly titled measures of other companies. |
 Questions & Answers |
 cooperstandard
Summary
•
Continue expansion in Asia & South America
•
Aggressively pursue business on global platforms
•
Leverage global alliance with Nishikawa
•
Successfully launch new technologies
•
Manage raw material costs and supply
26
Ready to Thrive in the New Competitive Landscape
and Drive Shareholder Value |
 Appendix |
 cooperstandard
28
Q4 2011 Adjusted EBITDA
(1)
Includes cash and noncash.
(2)
Proportionate share of restructuring costs related to Cooper Standard France joint
venture. (3)
Non-cash stock amortization expense and non-cash stock option
expense. (4)
Severance costs associated with the right sizing of German facilities.
(5)
Costs related to corporate development activities.
$USD Millions
Three Months Ended
December 31, 2010
Three Months Ended
December 31, 2011
Net income
$
14.8
$
23.2
Provision for income tax benefit
(0.2)
(6.0)
Interest expense, net of interest income
10.8
10.3
Depreciation and amortization
29.7
32.1
EBITDA
$
55.1
$
59.6
Restructuring
(1)
(0.7)
4.1
Non-controlling interest restructuring
(2)
-
(0.9)
Stock-based compensation
(3)
2.8
2.5
Severance
(4)
5.8
-
Other
(5)
(1.3)
1.3
Adjusted EBITDA
$
61.7
$
66.6 |
 cooperstandard
29
Base Business vs Joint Venture Financial
Adjusted EBITDA –
Full Year 2011
Parent &
Wholly Owned
Joint
$ USD Millions
Subsidiaries
Ventures
Total
Net Income
102.8
$
-
$
102.8
$
Provision for income tax expense
18.7
2.1
20.8
Net interest expense
39.4
1.1
40.5
Depreciation and amoritization
108.8
15.3
124.1
EBITDA
269.7
$
18.5
$
288.2
$
Restructuring
(1)
11.5
40.7
52.2
Noncontrolling
interest
restructuring
(2)
-
(19.9)
(19.9)
Acquisition
costs
(3)
1.7
0.5
2.2
Inventory
write-up
(4)
0.1
0.6
0.7
Net
gain
on
partial
sale
of
joint
venture
(5)
-
(11.4)
(11.4)
Stock
based
compensation
(6)
10.8
-
10.8
Other
(7)
1.3
-
1.3
Adjusted EBITDA
295.1
$
29.0
$
324.1
$
(1)
Includes cash and non-cash restructuring.
(2)
Proportionate share of of restructuring costs related to the Cooper Standard
joint venture. (3)
Costs incurred in relationship to the Cooper Standard joint venture
agreement. (4)
Write-up of inventory to fair value at the date of acquisition of USi Inc. and
the FMEA joint venture, net of noncontrolling interest. (5)
Net gain on partial sale of ownership percentage in joint venture.
(6)
Non-cash stock amortization expense and non-cash stock option expense for
grants issued at emergence from bankruptcy. (7)
Costs related to corporate development activities. Year Ended December 31,
2011 |