Attached files
| file | filename |
|---|---|
| 8-K - 8-K - AIkido Pharma Inc. | a12-7025_18k.htm |
Exhibit 99.1
|
|
Molecular Factor Computing (MFC) of the Extent of Atherosclerosis in D-Tagatose Treatment Claire Kruger, Ph.D., Dietrich Conze, Ph.D., Molly Binkley1, Robert Lodder, Ph.D. 1. University of Kentucky |
|
|
MFC of the Extent of Atherosclerosis in D-Tagatose Treatment Background Atherosclerosis and cardiovascular disease Drug treatments, D-tagatose and SPX106T, efficacy HICI and MFC Design considerations Conventional and synchrotron How to Apply MFC and HICI Mouse and human experiments Atherosclerosis and aneurysm |
|
|
Cardiovascular Disease Epidemic Atherosclerotic cardiovascular disease results in >19 million deaths annually A large number of victims who are apparently healthy die suddenly without prior symptoms Available screening and diagnostic methods, as well as therapies, have been insufficient to identify the victims and intervene in the process before the event occurs |
|
|
Dyslipidemia Market A growing epidemic of metabolic syndrome and dyslipidemia supports blockbuster products in an area with limited competition Unmet needs still exist due to: adverse events with niacin, lack of robust cardiovascular benefit with fibrates, and unwanted lipid effects of raising the bad LDL cholesterol (fish oils) or decreasing the good HDL cholesterol (fibrates) Need new safe agents for use in patients with both high cholesterol and high triglycerides High Cholesterol Only High Cholesterol and High Triglycerides High Trigs Only Statins $24B Fibrates $2B Fish Oil $1B 45% 45% 3% Statin Combos $0.5B No or detrimental effect on LDL % of population |
|
|
MFC of the Extent of Atherosclerosis in D-Tagatose Treatment Background Atherosclerosis and cardiovascular disease Drug treatments, D-tagatose and SPX106T, efficacy HICI and MFC Design considerations Conventional and synchrotron How to Apply MFC and HICI Mouse and human experiments Atherosclerosis and aneurysm |

|
|
Preclinical Phase 1 Phase 2 Phase 3 Marketed Pharmaceutical Pipeline Compounds Formulated with D-Tagatose SPX 8522876 dyslipidemias Dose Ranging Study (D-Tagatose) Type-2 diabetes Phase 2 Completed SPX 7233801 atherosclerosis SPX 10624258 metabolic syndrome SPX 8818309 obesity SPX 8818440 diabetes NEET Study (D-Tagatose) 1 Type-2 diabetes Phase 3 Completed 1. Proceeded directly from phase 1 to 3 due to FDA GRAS approval “SPX-106” |
|
|
/ SPX-106 Total Cholesterol LDLr -/- Mouse Treated with Sugar and Drug Mixtures for Three Weeks mg__ dL Day 36 TRIGLYCERIDES p=0.03 for tagatose vs. water p=0.008 for tagatose vs. glucose / fructose p=0.001 for tag/SPX106 vs. glucose / fructose CHOLESTEROL p=0.05 for gluc/fruc vs. tagatose p=0.01 for gluc/fruc vs. tagatose / SPX106 n=10 per group Triglycerides Day 36 * * * * (SPX-106T = SPX-106 in D-tagatose) |
|
|
/ SPX-106T Triglycerides Total Cholesterol LDLr -/- Mouse Treated with Sugar and Drug Mixtures for Nine Weeks mg__ dL Day Day TRIGLYCERIDES p=0.035 for tagatose vs. water p=0.046 for tagatose vs. glucose / fructose p=0.009 for SPX-106T vs. water p=0.011 for SPX-106T vs. glucose / fructose CHOLESTEROL p=0.05 for gluc/fruc vs. tagatose p=0.01 for gluc/fruc vs. SPX-106T n=10 per group * * * * (SPX-106T = SPX-106 in D-tagatose) |
|
|
The SPX-106T combination is the most effective of the treatments for lowering triglycerides The SPX-106 dose is responsible for lowering most of the triglycerides in the blood, followed by tagatose D-tagatose lowers triglycerides by -3.1 mg/dl per g/kg/dose of the sugar, while the SPX-106 lowers triglycerides by -372 mg/dl per g/kg/dose of the drug. Both glucose and fructose raise triglycerides The SPX-106/tagatose combination is the most effective of the treatments for lowering cholesterol The SPX-106 concentration is responsible for lowering most of the cholesterol in the mice blood, followed by tagatose D-tagatose lowers cholesterol by -3.9 mg/dl per g/kg/dose of the sugar, while the SPX-106 lowers cholesterol by -629 mg/dl per g/kg/dose of the drug. Both glucose and fructose raise cholesterol Peak Factor Analysis Results for the LDLr -/- Mice |
|
|
VLDL, LDL and HDL at 9 Weeks by FPLC and Enzymatic Assay in LDLr -/- Mice Glucose & Fructose Glucose & Fructose & SPX-106T Mean VLDL=127, LDL=141, HDL=110 mg/dl Mean VLDL=82*, LDL=116*, HDL=107 mg/dl VLDL LDL HDL VLDL LDL HDL Mean TC=378 mg/dl n=10 Mean TC=305* mg/dl p<0.05, n=10 * * |
|
|
Vulnerable Atherosclerotic Plaque |
|
|
Spherix SPX106T Atherosclerosis Results Atherosclerotic lesion area reduced nearly 5-fold on Western diet, **p<0.01, *p<0.05 SPX106T-treated Control Sinus of Valsalva Aortic arch Thoracic aorta Oil Red O mm2 % plaques % plaques ** * |
|
|
MFC of the Extent of Atherosclerosis in D-Tagatose Treatment Background Atherosclerosis and cardiovascular disease Drug treatments, D-tagatose and SPX106T, efficacy HICI and MFC Design considerations Conventional and synchrotron How to Apply MFC and HICI Mouse and human experiments Atherosclerosis and aneurysm |

|
|
Advantages of NIR Spectrometry NIR spectroscopy for the simultaneous determination of multiple chemical components in mixtures NIR radiation is able to penetrate through the skin and has been shown to measure accurately blood levels of analytes in vivo Diffuse reflectance NIR imaging is a candidate for nondestructive determination of lipoprotein cholesterol in atheromas |
|
|
Spatial Feature Encoding with Lenslet Arrays and Digital Masks Spectral Feature Encoding with Molecular Computing: Factor Analysis Methods Integrated sensing and processing by the detector itself Hyperspectral Integrated Computational Imaging |
|
|
Molecular Factor Computing Based Spectroscopy Principal Component Analysis Molecular Factor Loadings The mathematical loadings are divided into positive and negative values for implementation in molecular filters. |
|
|
Molecular Variety |
|
|
Fellgett advantage (acquisition of all wavelengths simultaneously permits higher signal-to-noise ratio for a given acquisition time) Jacquinot advantage (the absence of monochromator slits allows higher optical throughput) Decrease in computational demand by integrating the sensing and processing directly into the transducer (the integrated sensing and processing, or ISP, advantage) High Signal Noise Ratio (S/N) Advantages of MFC Spectrometry |
|
|
MFC High Throughput Spectrometer |
|
|
MFC High Throughput Spectrometer |
|
|
MFC of the Extent of Atherosclerosis in D-Tagatose Treatment Background Atherosclerosis and cardiovascular disease Drug treatments, D-tagatose and SPX106T, efficacy HICI and MFC Design considerations Conventional and synchrotron How to Apply MFC and HICI Mouse and human experiments Atherosclerosis and aneurysm |

|
|
Spectral Collection Using MFC Spectrometer Z |
|
|
Advantages of MFC on the Synchrotron (Brookhaven) Intense broadband radiation (xray, UV, visible, NIR, IR, THz) Light intensity is similar at all wavelengths Increase in SNR 30x decrease in scan time Naturally polarized light |
|
|
Developing Fast MFC Instrument DISPLAY RIBBON CONNECTOR PARALLEL PROCESSOR SPLITTERS m x n ROTARY SWITCH WHITE LIGHT SOURCE CYLINDRICAL LENS Y CONNECTOR RIBBON FIBER DETECTORS COLLIMATOR COLLIMATOR FILTERS |
|
|
NIR MFC Development Synchrotron 2-stage system with safety interlocks for radiation containment |
|
|
Experimental Sampling Setup Sample |
|
|
Molecular Filter Selection Algorithm Multiply the reflectance spectra of samples (training samples) with transmission spectra of NIR library (LT) to generate sample scores (S) S = R x LT Run genetic algorithm to pre-select 200 scores that appear most frequently Set maximum number of MFC filters to 8 Stepwise selection of final MFC filters set Cross-validation to evaluate the selected molecules and model |
|
|
2nd Derivative Spectra |
|
|
Selected MFC Filters Phenyl-hydrazine (PH) 2-dimethylbutyric acid (DMBA) 2,5-dihydrofuran (DHF) Ethyl iodoacetate (EIA) Tetramethylurea (TMU) Thiopheneethanol (TE) 2,2-diethoxypropane (DEP) Dicyclohexyl phthalate (DCP) |
|
|
MFC of the Extent of Atherosclerosis in D-Tagatose Treatment Background Atherosclerosis and cardiovascular disease Drug treatments, D-tagatose and SPX106T, efficacy HICI and MFC Design considerations Conventional and synchrotron How to Apply MFC and HICI Mouse and human experiments Atherosclerosis and aneurysm |
|
|
Study Design 3 week run-in period 16 week feeding period Body weight monitored weekly; food intake measured for the first 4 weeks, 8 week old male and female LDLr-/- mice N=6 per gender for TAG and SUCR groups; N=5 per gender for Control At study endpoint, blood and tissues were obtained from anesthetized mice. Total serum cholesterol, plasma triglyceride, plasma insulin analyses Retroperitoneal adipose tissue for histological analyses Aortic tissue from heart to ileal bifurcation (atherosclerosis measurement, infrared microscopy) |
|
|
A diet containing sucrose, but not TAG, promotes the development of obesity in male and female LDLr-/- mice (*P < 0.001). LDLr-/-, low-density lipoprotein receptor deficient |
|
|
A diet containing sucrose, but not TAG, promotes hyperglycemia Fasting Blood Glucose (mg/dl) Male Female CONTROL ± 23 151 ± 8 SUCR ± 13 * 177 ± 6 ** TAG 168 ± 5 ± 11 * P<0.05 compared to CONTROL and TAG ** P<0.05 compared to TAG, but not CONTROL 207 267 145 |
|
|
Metabolic Parameters of Control and Experimental Mice Gender Diet Body weight (g) Plasma insulin (uIU/ml) Adipocyte diameter (µm) Total plasma triglycerides (mg/dl) Tibialis anterior (mg) M CONTROL 30 ± 0. 17 ± 3 74 ± 3 110 ± 20 58 ± 4 SUCR 40 ± 2 * 28 ± 6 83 ± 3 822 ± 148 ** 59 ± 3 TAG 27 ± 0 13 ± 1 79 ± 3 162 ± 29 58 ± 2 F CONTROL 24 ± 1 15 ± 1 30 ± 1 79 ± 16 35 ± 7 SUCR 31 ± 1 * 17 ± 2 50 ± 1 ** 326 ± 37 ** 43 ± 2 TAG 24 ± 1 14 ± 1 31 ± 1 54 ± 8 42 ± 2 Data are mean — + SEM from N = 5/6 mice/group) * P<0.01 compared to TAG; ** P<0.01 compared to TAG and CONTROL |
|
|
Adipocyte diameter and macrophage immunostaining in SUCR-fed compared to TAG and CONTROL LDLr-/- mice CONTROL SUCR TAG Adipocyte diameter Macrophage immunostaining All images a-f are x20 magnification |
|
|
Who Cares about Adipocytes? Obesity-associated inflammation is associated with is a link between obesity and increased risks for the development of T2D, hypertension, and CVD SUCR-fed exhibited hypertrophied adipocytes infiltrated with macrophages In contrast, smaller adipocyte size in TAG-fed mice may have limited macrophage infiltration and inflammation, thereby decreasing aspects of the metabolic syndrome in TAG compared to SUCR mice |
|
|
TC concentrations and VLDL/LDL/HDL concentrations are markedly decreased in TAG and CONTROL LDLr-/- mice compared to SUCR-fed Data are mean ± s.e.m. from N = 5–6 mice/gender/diet group. *, Denotes significantly different from TAG and CONTROL; †, denotes significantly different from CONTROL, P < 0.05. HDL, high-density lipoprotein; LDL, low-density lipoprotein; LDLr-/-, LDL receptor deficient; VLDL, very LDL |
|
|
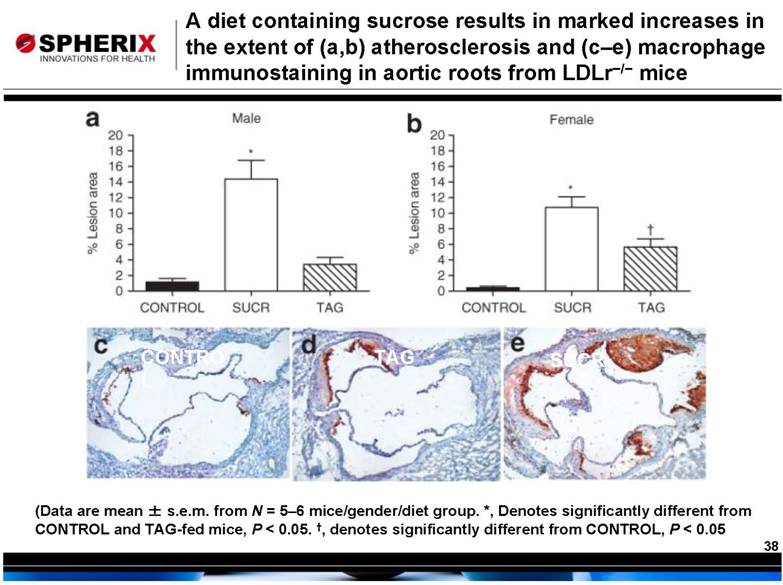
A diet containing sucrose results in marked increases in the extent of (a,b) atherosclerosis and (c–e) macrophage immunostaining in aortic roots from LDLr-/- mice (Data are mean ± s.e.m. from N = 5–6 mice/gender/diet group. *, Denotes significantly different from CONTROL and TAG-fed mice, P < 0.05. †, denotes significantly different from CONTROL, P < 0.05 CONTROL TAG SUCR |
|
|
Infrared microspectrometry of atherosclerotic lesions in the mice CONTROL SUCR TAG |

|
|
Atherosclerotic lesions and their composition CONTROL mice showed the lowest levels of vascular wall lipid, while SUCR mice exhibited the highest level A novel finding in this study was a reduction in the collagen composition of atherosclerotic lesions within the SUCR group Increase in collagen content in TAG versus SUCR groups may contribute to a more stable plaque phenotype |
|
|
MFC of the Extent of Atherosclerosis in D-Tagatose Treatment Background Atherosclerosis and cardiovascular disease Drug treatments, D-tagatose and SPX106T, efficacy HICI and MFC Design considerations Conventional and synchrotron How to Apply MFC and HICI Mouse and human experiments Atherosclerosis and aneurysm |

|
|
Angioscopic Images and Spectra 2-D and 3-D spectrometry help define a signature of plaque vulnerability and describe changes with drug therapy |
|
|
Spatial Feature Encoding |
|
|
New Direction with Collagen and Elastin: Aortic Aneurysm InSb FPA imaging Raster imaging pixel by pixel |