Attached files
| file | filename |
|---|---|
| EXCEL - IDEA: XBRL DOCUMENT - NUTRI SYSTEM INC /DE/ | Financial_Report.xls |
| EX-32.1 - SECTION 906 CEO CERTIFICATION - NUTRI SYSTEM INC /DE/ | d276122dex321.htm |
| EX-31.1 - SECTION 302 CEO CERTIFICATION - NUTRI SYSTEM INC /DE/ | d276122dex311.htm |
| EX-32.2 - SECTION 906 CFO CERTIFICATION - NUTRI SYSTEM INC /DE/ | d276122dex322.htm |
| EX-21.1 - SUBSIDIARIES OF NUTRISYSTEM, INC - NUTRI SYSTEM INC /DE/ | d276122dex211.htm |
| EX-31.2 - SECTION 302 CFO CERTIFICATION - NUTRI SYSTEM INC /DE/ | d276122dex312.htm |
| EX-23.1 - CONSENT OF KPMG LLP - NUTRI SYSTEM INC /DE/ | d276122dex231.htm |
Table of Contents
UNITED STATES
SECURITIES AND EXCHANGE COMMISSION
Washington, D.C. 20549
FORM 10-K
(Mark One)
| x | ANNUAL REPORT PURSUANT TO SECTION 13 OR 15(d) OF THE SECURITIES EXCHANGE ACT OF 1934 for the fiscal year ended December 31, 2011 |
| ¨ | TRANSITION REPORT PURSUANT TO SECTION 13 OR 15(d) OF THE SECURITIES EXCHANGE ACT OF 1934 for the transition period from to |
Commission File Number 0-28551
Nutrisystem, Inc.
(Exact name of registrant as specified in its charter)
| Delaware | 23-3012204 | |
| (State or other jurisdiction of incorporation or organization) |
(I.R.S. Employer Identification No.) | |
| Fort Washington Executive Center | ||
| 600 Office Center Drive | ||
| Fort Washington, Pennsylvania | 19034 | |
| (Address of principal executive offices) |
(Zip Code) | |
Registrant’s telephone number, including area code: (215) 706-5300
Securities registered pursuant to Section 12(b) of the Act:
| Title of each class |
Name of each exchange on which registered | |
| Common Stock, $.001 par value | The NASDAQ Stock Market LLC |
Securities registered pursuant to Section 12(g) of the Act:
None
Indicate by check mark if the registrant is a well-known seasoned issuer, as defined in Rule 405 of the Securities Act. Yes ¨ No x
Indicate by check mark if the registrant is not required to file reports pursuant to Section 13 or Section 15(d) of the Act. Yes ¨ No x
Indicate by check mark whether the registrant: (1) has filed all reports required to be filed by Section 13 or 15(d) of the Securities Exchange Act of 1934 during the preceding 12 months (or for such shorter period that the registrant was required to file such reports), and (2) has been subject to such filing requirements for the past 90 days. Yes x No ¨
Indicate by check mark whether the registrant has submitted electronically and posted on its corporate Website, if any, every Interactive Data File required to be submitted and posted pursuant to Rule 405 of Regulation S-T during the preceding 12 months (or for such shorter period that the registrant was required to submit and post such files). Yes x No ¨
Indicate by check mark if disclosure of delinquent filers pursuant to Item 405 of Regulation S-K is not contained herein, and will not be contained, to the best of registrant’s knowledge, in the definitive proxy or information statements incorporated by reference in Part III of this Form 10-K or any amendment to this Form 10-K. ¨
Indicate by checkmark whether the registrant is a large accelerated filer, an accelerated filer, a non-accelerated filer or a smaller reporting company (as defined in Exchange Act Rule 12b-2).
Large Accelerated Filer ¨ Accelerated Filer x Non-accelerated filer ¨ Smaller reporting company ¨
Indicate by checkmark whether the registrant is a shell company (as defined in Rule 12b-2 of the Act). Yes ¨ No x
The aggregate market value of the voting and non-voting common equity held by non-affiliates of the registrant as of June 30, 2011, was $379,264,423. Such aggregate market value was computed by reference to the closing price of the common stock as reported on the NASDAQ Stock Market on June 30, 2011 (the last business day of the registrant’s most recently completed second fiscal quarter).
Number of shares outstanding of the registrant’s common stock, $0.001 par value, as of March 2, 2012: 28,235,476 shares
DOCUMENTS INCORPORATED BY REFERENCE
Portions of the definitive proxy statement to be filed with the Securities and Exchange Commission for
Nutrisystem, Inc.’s annual meeting of stockholders are incorporated by reference into Part III of this Form 10-K.
Table of Contents
TRADEMARKS, TRADE NAMES AND SERVICE MARKS
Nutrisystem® , Nutrisystem® Flex® and Nutrisystem® Select® are registered trademarks of Nutrisystem, Inc. or its subsidiaries. Other service marks, trademarks and trade names of Nutrisystem, Inc. or its subsidiaries may be used in this Annual Report on Form 10-K (the “Annual Report”). All other service marks, trademarks and trade names referred to in the Annual Report are the property of their respective owners. Solely for convenience, any trademarks referred to in the Annual Report may appear without the ® or TM symbol, but such references are not intended to indicate, in any way, that we or the owner of such trademark, as applicable, will not assert, to the fullest extent under applicable law, our or its rights, or the right of the applicable licensor, to these trademarks.
INDUSTRY AND MARKET DATA
The market data and other statistical information used throughout this Annual Report are based on independent industry publications, government publications and other published independent sources. Some data are also based on our good faith estimates, which are derived from other relevant statistical information, as well as the independent sources listed above. Although we believe these sources are reliable, we have not independently verified the information.
2
Table of Contents
Nutrisystem, Inc.
3
Table of Contents
Special Note Regarding Forward-Looking Statements
From time to time, information provided by us, including but not limited to statements in this Annual Report, or other statements made by or on our behalf, may contain “forward-looking” information within the meaning of the Private Securities Litigation Reform Act of 1995. Words such as “believe,” “estimate,” “will be,” “will,” “would,” “expect,” “anticipate,” “plan,” “project,” “intend,” “could,” “should,” or other similar words or expressions often identify forward-looking statements.
Such statements are based on current expectations only, and are subject to certain risks, uncertainties, and assumptions, many of which are beyond our control. Should one or more of these risks or uncertainties materialize, or should underlying assumptions prove incorrect, actual results, performance, or achievements may vary materially from those anticipated, estimated, or projected. Among the factors that could cause actual results to materially differ include:
| • | competition from other weight management industry participants or the development of more effective or more favorably perceived weight management methods; |
| • | our ability to continue to develop innovative new programs and enhance our existing programs, or the failure of our programs to continue to appeal to the market; |
| • | the effectiveness of our marketing and advertising programs; |
| • | loss, or disruption in the business of, any of our food suppliers; |
| • | loss, or disruption in the business, of any of our fulfillment providers; |
| • | disruptions in the shipping of our food products; |
| • | health or advertising related claims by consumers; |
| • | failure to attract or negative publicity with respect to any of our spokespersons; |
| • | our ability to successfully make acquisitions or enter into joint ventures, including our ability to successfully integrate, operate or realize the projected benefits of such businesses; |
| • | general business and economic conditions, particularly the pace, continuation, and possible reversal of the recovery in the worldwide economy; |
| • | the seasonal nature of our business; |
| • | our ability to enforce our intellectual property rights, as well as the impact of our involvement in any claims related to intellectual property rights; |
| • | uncertainties regarding the satisfactory operation of our information technology or systems; |
| • | risks associated with unauthorized penetration of our information security; |
| • | the impact of existing and future laws and regulations; |
| • | the impact of our debt service obligations and restrictive debt covenants; |
| • | our inability to recruit and retain key executive officers; and |
| • | other risks and uncertainties, including those detailed from time to time in our periodic reports filed with the Securities and Exchange Commission. |
We undertake no obligation to publicly update or revise any forward-looking statements, whether as a result of new information, future events, or otherwise.
4
Table of Contents
PART I
| ITEM 1. | BUSINESS |
Overview
Nutrisystem, Inc. (together with its consolidated subsidiaries, “Nutrisystem,” the “Company,” “we,” “us,” or “our”) is a leading provider of a weight management system based on a low-calorie, portion-controlled, prepared meal program. Typically, our customers purchase monthly food packages containing a 28-day supply of breakfasts, lunches, dinners and desserts, which they supplement with dairy, fruit, salad, vegetables and low-glycemic carbohydrate items. Most of our customers order on an auto-delivery basis (“Auto-Delivery”), in which we send a month’s food supply on an ongoing basis until notified by the customer to stop our shipments. Our food for the Core program is shelf-stable at room temperature and will last for up to two years, making it relatively inexpensive to ship and store. We have also expanded our product offerings to include a combination of our ready-to-go food and our fresh-frozen line of menu items. This Select program is priced higher than the Core program.
Our program is based on the following cornerstones that represent who we are to our customers:
Results. We believe our program enables our customers to lose weight successfully. The Nutrisystem program is based on 40 years of nutrition research and the science of the low Glycemic Index, and offers over 130 portion-controlled items that include relatively higher amounts of fiber, contain “good” carbohydrates and zero trans fats. The Glycemic Index is a measure of the quality of carbohydrates in foods. Foods on the lower end of the Glycemic Index are generally considered “good” carbohydrates. We also offer transition and maintenance plans, which include support tools and desired meal occasions that customers wish to continue to receive from Nutrisystem. These plans are designed to help our customers keep the weight off.
Convenience. We sell our weight management program primarily through a direct-to-consumer sales and distribution approach using the Internet and telephone. Our customers can order 24 hours a day, seven days a week on our website, www.nutrisystem.com, and the food is shipped directly to the customer’s door.
Simplicity. We provide a comprehensive weight management program, consisting of a pre-packaged food program and counseling. Our customers can either choose our pre-selected favorites food package or customize their monthly food orders for their specific tastes. Our program does not require customers to visit centers, measure foods or count calories. The entrees are individually packaged and food preparation time is minimal.
Value. We do not charge membership fees. Additionally, we advertise various promotional offers and pricing throughout the year.
Anonymity. The direct-to-consumer approach using the Internet and telephone provides the privacy that our customers value. We provide online and telephone counseling and support to our customers using our trained weight loss coaches, diet counselors and other nutrition and dietary staff, and thus, our customers do not need to travel for a face-to-face meeting.
Competitive Strengths
We believe our program offers consumers a sensible approach to losing weight without the use of faddish, unhealthy or unrealistic weight loss methods. We intend to capitalize on the following competitive strengths to grow:
Product Efficacy. We believe most of our customers are very satisfied with our products and believe they have lost weight while using our program. Our customer surveys found that customers lost an average of 1.0 to 2.0 pounds per week and tended to stay on the program for 11 to 12 weeks. We believe these surveys indicate overall satisfaction with our program and a potential willingness to refer our program to others.
5
Table of Contents
We have also sponsored clinical trials at leading academic centers. The first two trials to report results were in patients with type 2 diabetes. Statistically significant and clinically meaningful weight loss and improvements in glycemic control were observed in both trials, in addition to improvements in secondary endpoints such as waist circumference, total plasma cholesterol and blood pressure. The second trial also examined medication use and found that the health benefits were achieved while medication use was decreased in approximately 30% of the subjects on our Nutrisystem® D® Program, which has been specifically designed to produce gradual weight loss in overweight patients diagnosed with type 2 diabetes.
Strong Brand Recognition. We believe that our brand is well recognized in the weight management industry. Our company and our predecessors have been in the weight management industry for 40 years, and we estimate that our company and our predecessors have spent hundreds of millions of dollars in advertising over that time period.
Low Cost, Highly Scalable Model. Unlike traditional commercial weight loss programs, which primarily sell through franchisee and company-owned centers, we generate revenue in our direct channel through the Internet and telephone (including the redemption of prepaid program cards). Our method of distribution removes the fixed costs and capital investment associated with diet centers. We also minimize fixed costs and capital investments in food procurement and fulfillment: we outsource the production of our food products to a number of vendors and we currently outsource 100% of our fulfillment operations to a third party provider.
Superior Consumer Value Proposition. Our goal is to offer our customers a complete weight management program that is convenient, private and cost-effective. Our customers place their orders through the Internet or over the telephone and have their food delivered directly to their homes. This affords our customers the convenience and anonymity that other diets which rely on weight-loss centers cannot ensure. Additionally, we provide our customers with a month of food, including daily breakfast, lunch, dinner and dessert, which removes the confusion of reading nutrition labels, measuring portions or counting calories, carbohydrates or points. We believe our weight management program offers our customers significant value and is priced below those of our competitors. In addition, we do not charge a membership fee, whereas many of our competitors do.
Our Industry
Weight management is a challenge for a significant portion of the U.S., as well as the global population. The 2009-2010 National Health and Nutrition Examination Study estimated that over 78 million U.S. adults were obese in 2009-2010 and the World Health Organization projects that by 2015, 2.3 billion people will be overweight and 700 million of these will be obese.
According to the U.S. Department of Health and Human Services, overweight and obese individuals are increasingly at risk for diseases such as diabetes, heart disease, certain types of cancer, stroke, arthritis, sleep apnea and depression. However, there is evidence that weight loss may reduce the risk of developing these conditions, as well as improve the health and quality of life of people who have these conditions. Our clinical trial results and analyses of real world customer results confirm that people who stay on the Nutrisystem program for at least three months have a very high probability of achieving clinically meaningful weight loss.
In addition to the health risks, there are also cultural implications for those who are overweight or obese. U.S. consumers are inundated with imagery in media, fashion and entertainment that depicts the thin body as the ideal body type. Studies suggest that there is rampant discrimination against the obese. Despite the high percentage of overweight and obese individuals in the U.S., the popularity of dieting appears to indicate consumers’ desire to be thin.
Competition
The weight loss industry is very competitive and consists of pharmaceutical products and weight loss programs, as well as a wide variety of diet foods and meal replacement bars and shakes, appetite suppressants
6
Table of Contents
and nutritional supplements. The weight loss market is served by a diverse array of competitors. Potential customers seeking to manage their weight can turn to traditional center-based competitors, online diet-oriented sites, self-directed dieting and self-administered products such as the over-the-counter drugs and other medically supervised programs.
We believe that the principal competitive factors in the weight loss market are:
| • | the availability, convenience, privacy and effectiveness of the weight reduction program; |
| • | brand recognition and trustworthiness; |
| • | media spending; |
| • | new products; |
| • | program pricing; and |
| • | the ability to attract and retain customers through promotion and personal referral. |
Based on these factors, we believe that we can compete effectively in the weight management industry. We, however, have no control over how successful competitors will be in addressing these factors. By providing a well-recognized food-based program using the direct channel, we believe that we have a competitive advantage in our market.
Our Products and Services
For 40 years, the Nutrisystem name has been recognized as a leader in the weight loss industry. We provide a comprehensive weight management program, consisting primarily of a pre-packaged food program, online tools and counseling. Trained counselors are available to answer questions and make recommendations to help each customer achieve and maintain his or her weight loss goal. Customers support and encourage each other and share information through hosted Internet chat rooms and bulletin boards. These services are complemented with relevant information on diet, nutrition and exercise, which is provided on our community website and emailed to our customers bi-weekly. Additionally, online and smart phone weight management tools are available to our customers. These tools include the interactive Mindset Makeover® guide, a behavior modification program that was co-authored by an international leader in the field of obesity research and is offered to our customers free of charge. This insightful and motivational guide walks clients through the program and can serve as an interactive tool for our counselors to use to facilitate communication and enhance weight loss success for our clients.
Our Nutrisystem program consists of over 130 portion-controlled items that serve as the foundation of a low Glycemic Index diet. The Glycemic Index is a measure of the quality of carbohydrates in foods and foods on the lower end of the index are generally considered “good” carbohydrates. Our program is portioned for weight loss and offers a balance of carbohydrate, protein and fat that meets national dietary guidelines. We have also worked to reduce the sodium content of our meal program. Including grocery additions, our plans contain 1800-2200 milligrams of sodium per day, consistent with national guidelines, and tailored versions of the plans are available that deliver as low as 1500 mg/day. In contrast, the average American consumes 2800-4000 milligrams of sodium per day. We constantly strive to meet or exceed nutritional guidelines as they are updated.
In December 2011, we launched SUCCESS, our most comprehensive program to date. It is designed to help take the weight off and keep it off through frequent, portion-controlled, balanced nutrition and low Glycemic Index eating. The SUCCESS program offers our largest ever assortment of signature fresh-frozen meals including new artisanal Chef’s Table™ dinner entrees, developed by Nutrisystem’s Celebrity Chef Culinary Council using revolutionary advanced steamer technology; new chocolate, vanilla, strawberry and coffee advanced protein shakes; the introduction of a personalized “My Daily 3™” physical activity program; and increased personalization and flexibility through transition and maintenance plans that help consumers manage their weight on their own.
7
Table of Contents
Nutrisystem Select includes fresh-frozen foods and enhances Nutrisystem’s tradition of effective weight loss and weight management. Most of our weight plans offer these fresh-frozen foods. The program provides customers with premium fresh-frozen foods that complement Nutrisystem’s prepared food weight loss programs and still adheres to Nutrisystem’s nutritional guidelines. When a customer orders Nutrisystem Select, two separate shipments are delivered. The first shipment will be sent directly to the customer and will contain Nutrisystem’s standard shelf-stable food. The second shipment will contain the fresh-frozen foods and will also be delivered directly to the customer’s home.
The Nutrisystem® D® Program is a weight loss program specifically designed to produce gradual weight loss in overweight patients diagnosed with type 2 diabetes. Results from a 2009 clinical study conducted at the Temple University School of Medicine and published in the journal Postgraduate Medicine show that the Nutrisystem D Program in combination with weekly counseling sessions helped overweight individuals with type 2 diabetes lose more weight and experience greater reductions in their A1C levels (a key measure of blood glucose control) as compared to those in the control group. This weight loss was also associated with reductions in blood pressure, cholesterol and waist circumference. A follow up study at the University of Pennsylvania and Temple University School of Medicine was completed in July 2011 and initial findings were presented at the Obesity Society’s annual conference in October 2011, confirming and extending the key findings of the first diabetes trial. A third trial in type 2 diabetes is ongoing. Multiple trials involving the other Nutrisystem programs are recently completed or ongoing. In addition, several abstracts analyzing real world results from customers were accepted to medical conferences in 2011.
We continue to offer our program at Costco through the use of prepaid program cards and gift cards. The Nutrisystem program has also been offered at other large retailers. Each retailer is offered a unique promotional package and pricing through the use of prepaid program cards. We have discontinued offering our program at underperforming retailers, but we continually explore other major retailers where we may potentially offer our program in the future.
Typically, our customers purchase monthly food packages of shelf-stable and fresh-frozen food containing 28 days of breakfasts, lunches, dinners and desserts, which they supplement with dairy, fruit, salad, vegetables and low-glycemic carbohydrate items. In certain instances, depending on the promotional offers available, customers can receive more than the typical 28 days of food. Most customers order through our Auto-Delivery feature. By offering a variety of shelf-stable and fresh-frozen foods, we help our customers sustain their weight loss efforts. On our website, customers can order food 24 hours a day, seven days a week. The transition and maintenance plans included in the SUCCESS launch, along with the previously developed Flex program, allow customers the means to gradually increase their responsibility for grocery shopping and food preparation while adhering to the principles of the Nutrisystem approach. These lower cost programs help extend the supportive relationship and allow time to reinforce the dietary changes that produced the initial weight loss. These plans include recipes and portion-control tools in addition to a reduced number of Nutrisystem® entrees delivered each month.
The features of our weight loss program address many of the most common limitations of traditional weight loss programs, including high initiation and recurring membership fees, the inconvenience of traveling to weight loss centers for scheduled appointments and lack of privacy. In addition, our prepared meals provide our customers with a structured program with limited weighing and measuring of foods, and no need to count calories, carbohydrates or points. We believe that the convenience of home delivery, reduced grocery shopping time, and rapid food preparation also aid customer compliance with our weight loss program.
Our food items have accounted for 99% of our revenues for each of the years ended December 31, 2011, 2010 and 2009, respectively. No other product or service has accounted for more than 1% of consolidated revenue in any of the last three years. Approximately 99% of our revenues for the year ended December 31, 2011 were generated in the United States as compared to approximately 98% of our revenues for both of the years ended December 31, 2010 and 2009.
8
Table of Contents
Marketing
Marketing is a core competency that drives sales and builds the Nutrisystem brand. We have strong expertise in all facets of both offline and online marketing and utilize an integrated marketing process designed to drive profitable revenue in an efficient, effective way.
Offline Marketing. We believe Nutrisystem is one of the leading and most efficient offline direct response advertisers in the industry. We deploy a hybrid of proven direct response techniques to: 1) build brand equity and awareness; 2) encourage qualified customers to call or visit our website; and 3) deliver profitable sales. We track response to each advertisement through unique toll-free numbers and URLs and we deploy multi-channel campaigns to target new customers that include television, print, direct mail and telemarketing efforts. To reactivate lapsed customers and upsell to those already on our program, we utilize a combination of direct mail and telemarketing efforts which complements our other media advertising.
Online Marketing. Our online marketing strategy focuses on driving high-volume, cost-effective, qualified leads to our website with an emphasis on increasing both front-end and back-end conversion through constant testing and optimization. We are continually exploring new online opportunities as the market evolves, but focus the majority of our efforts on search optimization (paid and natural), affiliate management, portal relationships, large ad networks, strategic partnerships, targeted display media and internal/external email campaigns.
Public Relations. The consumer and business media outreach programs accentuate Nutrisystem as a leader and innovator in the weight loss category. Our public relations strategically complement offline and online marketing to increase top-of-mind awareness for Nutrisystem, as well as to foster positive word-of-mouth, in order to enhance purchase consideration of our product. The Nutrisystem brand, our marketing and product innovations, as well as success stories from celebrities and everyday people who have lost weight on our program are regularly featured in top-tier media outlets such as: The Today Show, Good Morning America, The Tonight Show, USA TODAY, People Magazine, Access Hollywood, E! News, Entertainment Tonight and Forbes.com. We typically compensate our celebrity spokespersons based on their initial weight loss on our program and maintenance of the weight loss over time. We are continuing to strive to drive much stronger public relations and social media participation and engagement through blogs, forums, Facebook and Twitter.
Ecommerce
As a leading ecommerce company and brand, we constantly strive to employ the latest tools and technology in order to drive increased performance of online customer conversion, retention and reactivation. We utilize our ecommerce platform to drive a highly-customizable and personalized user experience, as well as to effectively and efficiently manage day-to-day ecommerce business operations. In addition, we combine internal resources with external agencies in the development of our website information architecture, user interface and user experience. In order to optimize the key online business drivers, we continually perform usability testing and are constantly optimizing our website using a variety of sophisticated third party testing tools. Finally, we measure our online interaction with customers, along with broader website performance, via web analytics platforms and tools.
Sales and Counseling
A majority of our direct business sales occur on our website. The remaining sales are by telephone, and our call center processes all of them. Our weight loss program is also sold through QVC, a television home shopping network, which represented 4% of our revenue in 2011.
As of December 31, 2011 we employed approximately 73 weight loss counselors and 199 sales agents. Staffing levels for counselors and sales agents are largely a function of the volume of revenue and orders. Sales agents are responsible for in-bound sales calls and will initiate out-bound sales calls to our leads and other
9
Table of Contents
targeted potential customers. Additionally, certain sales agents assist in retaining customers. Counselors initiate some out-bound sales calls but primarily focus on in-bound calls and email. Counselors also handle online web conversations from new visitors and appointments with existing customers. Sales agents are paid primarily on commission while counselors receive an hourly wage.
We seek to hire counselors with backgrounds in psychology, sociology, nutrition, dietetics or other health-related fields and with suitable temperaments to speak with our customers. Counselors are trained in our program, our Internet chat service, email, motivational techniques and customer service problem solving. Sales agents are well-versed in explaining our program and working with our customers to determine the program that would best fit their needs in helping them reach their weight loss goals.
Customer Service
As of December 31, 2011, we employed approximately 90 customer service representatives. Customer service representatives are trained to handle in-bound calls and emails from customers who have questions or problems with an order after the sale transaction is completed. Typical customer inquiries relate to the arrival date of the customer’s order shipment, reporting of missing or damaged items and credits and exchanges. For email inquiries, we have a software system that scans the customer’s email message for key words and automatically supplies the representative with a form response that is reviewed, edited and sent back to the customer. Customer service representatives are paid an hourly wage.
Fulfillment
An integrated order receipt, billing, picking, shipping and delivery tracking system comprised of proprietary and third party components is utilized for our orders. This system integrates the front end, or website customer interface, with order processing and shipping, and allows Internet customers to access shippers’ order tracking numbers online. Our computer-assisted picking system allows for virtually paperless order picking in all warehouse facilities.
We utilize an integrated network of distribution facilities through an existing arrangement with our outside fulfillment provider. In recent years, we have embarked on several key initiatives within our supply chain, including the installation of new material handling equipment and a new warehouse management system. These initiatives resulted in realized cost improvements, enhanced vendor productivity and warehouse efficiencies, and they helped increase key metrics supporting customer satisfaction. In addition, these initiatives resulted in improved inventory management and allowed us to reduce our overall warehouse footprint. We currently utilize four outsourced distribution facilities located in Chambersburg, Pennsylvania, Allentown, Pennsylvania and two in Sparks, Nevada. Additionally, we had an agreement, which expired in November 2011, with a provider of fine frozen foods, for the development and distribution of frozen foods under the Nutrisystem brand. We have found other frozen food supply options to replace this supplier. During 2011, 100% of our fulfillment was handled by two outsourced providers. As of December 31, 2011, all fulfillment was being handled by one outsourced provider.
We have a service agreement with our outside fulfillment provider, which provides for storage, handling of fresh-frozen and ready-to-go foods and other services, including pricing and minimum space commitments. The current contract expires on December 17, 2014, but may be terminated sooner upon 180 days written notice. We believe that other outside fulfillment providers could be utilized if needed and we continually evaluate the need for secondary fulfillment services.
We continue to partner with our fulfillment provider to reduce the warehouse order turn-around time for processing and shipping orders. In 2011, approximately 99% of all direct customer initial orders were shipped within two business days of the date the order was received. In addition, we can ship to approximately 99% of the domestic population within five business days using standard ground transportation. In 2011, we made capital investments in new material handling equipment to target improvements in productivity, cost, quality and service.
10
Table of Contents
Direct customers are not charged for their orders until the ordered product is shipped. We do not charge customers for shipping and handling on Auto-Delivery food orders provided customers take receipt of their second order. If a customer cancels before receipt of a second order, the customer will be charged for shipping and the difference in pricing for an Auto-Delivery order versus a non Auto-Delivery order.
Product Development
All of our foods and supplements are currently outsourced from more than 30 manufacturers or vendors. We have entered into supply agreements with some of these food vendors. The majority of these agreements provide for annual pricing, annual purchase obligations, as well as exclusivity in the production of certain products, with terms of five years or less. One agreement also provides for certain rebates to us if certain volume thresholds are exceeded. All of these contracts may be terminated by us upon written notice, generally between 30 and 180 days. We anticipate meeting all annual purchase obligations.
In 2011, approximately 16% and 15%, respectively, of inventory purchases were from two suppliers. We have a supply arrangement with one of these vendors that requires us to make certain minimum purchases. In 2010, these vendors supplied 17% and 18%, respectively, of total purchases and in 2009 these vendors supplied 19% and 18%, respectively, of total purchases. Additionally, we were dependent on one frozen food supplier for less than 20% of our food costs in 2011. The amount provided from this supplier in 2010 was negligible. We had a supply agreement with this supplier that expired in November 2011 and we have found other frozen food supply options to replace this supplier.
Our product development team uses a number of sources – customer feedback, market trends, nutrition science, and breakthroughs in food technology – to create new ideas for our program. New foods are created to enhance the variety of our current offerings or to support the efforts of creating a new program. Typically, concepts are formulated in the test kitchen to meet our stringent demands for nutrition and stability. We then contract with food manufacturers who further develop viable new products based on our specifications. Alternatively, manufacturers may suggest items. Regardless of a given food item’s pathway through development, that food is evaluated for nutrition, compliance with our program, taste (using testing panels), and cost considerations. The number of stock keeping units, or SKUs, we introduce each year varies depending on whether we are introducing a new program or simply updating an existing one.
Our Customers
We offer weight loss programs designed for women, men, seniors as well as people with type 2 diabetes who want to lose weight. Based on our customer data, our typical customer is female, approximately 50 years of age and weighs approximately 187 pounds. We believe that, on average, our customers want to lose approximately 43 pounds over a period of time. Based on our customer surveys, we believe our typical customers tend to stay on our program for 11 to 12 weeks, lose 1.0 to 2.0 pounds per week and have tried other popular diet programs. We believe that these surveys indicate a willingness to refer our program to others and that our customers value the following Nutrisystem program attributes:
| • | effective weight loss; |
| • | direct delivery to their door; |
| • | easy to follow and stay on the program; |
| • | food can be easily prepared in minutes; |
| • | wide variety of food; and |
| • | they do not feel hungry while on the program. |
11
Table of Contents
Information Systems
Our ecommerce and community websites, both of which are based primarily on third party software customized to meet our business needs, are each hosted in a top tier, co-location facility. These facilities provide redundant network connections, physical and fire security and diesel generated power back up for the equipment upon which our websites rely and are intended to provide an uninterruptible power supply. Our servers and our network are monitored 24 hours a day, seven days a week.
We use a variety of security techniques to protect our confidential customer data. When our customers place an order or access their account information, we secure that transaction by using some of the best available encryption technologies, including secure sockets layer, or SSL. Our customer data is protected against unauthorized access by security measures and we engage a variety of industry leading technology providers including VeriSign, CyberSource and SecureWorks to further ensure the security of our credit card transactions and the safety of our customers’ personal information.
Intellectual Property
We own numerous domestic and international trademarks and other proprietary rights that are important to our business. Depending upon the jurisdiction, trademarks are valid as long as they are used in the regular course of trade and/or their registrations are properly maintained. We believe the protection of our trademarks, copyrights, patents, domain names, trade dress, and trade secrets is important to our success. We aggressively protect our intellectual property rights by relying on a combination of watch services and trademark, copyright, patent, trade dress and trade secret laws, and through the domain name dispute resolution system.
Employees
As of December 31, 2011, we had approximately 455 administrative, sales, counseling and customer service personnel, 19 employees dedicated to fulfillment and 37 employees in marketing. None of our employees are represented by a labor union, and we consider relations with our employees to be good.
Seasonality
Typically in the weight loss industry, revenue is strongest in the first quarter and lowest in the fourth calendar quarter. We believe our business experiences seasonality, driven primarily by the predisposition of dieters to initiate a diet at certain times of the year and the placement of our advertising is based on the price and availability of certain media at such times.
Available Information
All periodic and current reports, registration statements, code of conduct and other material that the Company is required to file with the Securities and Exchange Commission (“SEC”), including the Company’s annual report on Form 10-K, quarterly reports on Form10-Q, current reports on Form 8-K, and amendments to those reports filed or furnished pursuant to Section 13(a) of the Securities Exchange Act of 1934 (the “1934 Act Reports”), are available free of charge through the Company’s investor relations page at www.nutrisystem.com. Such documents are available as soon as reasonably practicable after electronic filing of the material with the SEC. The Company’s Internet website and the information contained therein or connected thereto are not intended to be incorporated into this Annual Report.
The public may also read and copy any materials filed by the Company with the SEC at the SEC’s Public Reference Room at 100 F Street, NE, Washington, DC 20549. The public may obtain information on the operation of the Public Reference Room by calling the SEC at 1-800-SEC-0330. The SEC maintains an Internet site, www.sec.gov, which contains reports, proxy and information statements, and other information regarding issuers that file such information electronically with the SEC.
12
Table of Contents
Executive Officers of the Company
The Company’s executive officers and their respective ages and positions as of December 31, 2011 are as follows:
| Name |
Age | Position | ||||
| Joseph M. Redling |
53 | Chairman, President and Chief Executive Officer | ||||
| David D. Clark |
47 | Executive Vice President and Chief Financial Officer | ||||
| Michael R. Amburgey |
50 | Executive Vice President and Chief Marketing Officer | ||||
Joseph M. Redling has served as our President and Chief Operating Officer since September 2007, as our Chief Executive Officer since May 2008 and as member of our Board since April 2008. In November 2008, Mr. Redling became Chairman of our Board. Before joining us, Mr. Redling held a number of executive positions at AOL, Inc., a global web services company, including Chief Marketing Officer, President of AOL Access, President of AOL Paid Services and Customer Management and Chief Executive Officer of AOL International from September 2001 through March 2007.
David D. Clark has served as our Chief Financial Officer since November 2007 and in July 2008, the Board promoted Mr. Clark from the position of Senior Vice President, which he had held since November 2007, to Executive Vice President. Prior to joining us, Mr. Clark was Chief Financial Officer of Claymont Steel Holdings, Inc., a manufacturer of steel plate, from November 2006 through October 2007. Prior to that, Mr. Clark was Chief Financial Officer of SunCom Wireless Holdings, a publicly traded provider of digital wireless communications services, from its founding in 1997 through February 2006 and held the additional position of Executive Vice President from 2000 through February 2006 and Senior Vice President from 1997 through 2000.
Michael R. Amburgey has served as our Executive Vice President and Chief Marketing Officer since October 2011. Prior to joining the Company, Mr. Amburgey had been Head of Marketing at Healthways, Inc. during September 2011, and he served as Senior Vice President Consumer Marketing at Schneider Electric from May 2011 to August 2011. Concurrently, Mr. Amburgey was Partner at Chief Outsiders, a strategic consulting firm that provides chief marketing services, from December 2010 to October 2011. Previously, Mr. Amburgey was Chief Marketing Officer at Oreck Corporation from September 2008 to October 2010 and served as Vice President of Marketing and Direct Response Sales at Oreck Corporation from September 2007 to September 2008.
13
Table of Contents
| ITEM 1A. | RISK FACTORS |
You should consider carefully the following risks and uncertainties when reading this Annual Report. If any of the events described below actually occurs, the Company’s business, financial condition and operating results could be materially adversely affected. You should understand that it is not possible to predict or identify all such risks and uncertainties. Consequently, you should not consider the following to be a complete discussion of all potential risks or uncertainties.
Risks Related to Our Business
Our future growth and profitability will depend in large part upon the effectiveness and efficiency of our marketing expenditures and our ability to select effective markets and media in which to advertise.
Our marketing expenditures were $110.9 million, $145.9 million and $146.4 million in 2011, 2010 and 2009, respectively. Our future growth and profitability will depend in large part upon the effectiveness and efficiency of our marketing expenditures, including our ability to:
| • | create greater awareness of our brand and our program; |
| • | identify the most effective and efficient levels of spending in each market, media and specific media vehicle; |
| • | determine the appropriate creative messages and media mix for advertising, marketing and promotional expenditures; |
| • | effectively manage marketing costs (including creative and media) in order to maintain acceptable customer acquisition costs; |
| • | acquire cost-effective national television advertising; |
| • | select the most effective markets, media and specific media vehicles in which to advertise; and |
| • | convert consumer inquiries into actual orders. |
Our planned marketing expenditures may not result in increased revenue or generate sufficient levels of brand name and program awareness. We may not be able to manage our marketing expenditures on a cost-effective basis whereby our customer acquisition costs may exceed the contribution profit generated from each additional customer.
Our sales may be adversely impacted by the health and stability of the general economy.
Unfavorable changes in general economic conditions, such as a recession or prolonged economic slowdown, may reduce the demand for our products and otherwise adversely affect our sales. For example, economic forces, including general economic conditions, demographic trends, consumer confidence in the economy, changes in disposable consumer income and/or reductions in discretionary spending, may cause consumers to defer purchases of our program which could adversely affect our revenue, gross margins, and/or our overall financial condition and operating results.
We rely on third parties to provide us with adequate food supply and certain fulfillment, Internet, networking and call center services, the loss of any of which could cause our revenue, earnings or reputation to suffer.
Food Manufacturers. We rely solely on third party manufacturers to supply all of the food and other products we sell. In 2011, approximately 16% and 15%, respectively, of inventory purchases were from two suppliers. If we are unable to obtain sufficient quantity, quality and variety of food and other products in a timely and low-cost manner from our manufacturers, we will be unable to fulfill our customers’ orders in a timely manner, which may cause us to lose revenue and market share or incur higher costs, as well as damage the value of the Nutrisystem brand.
14
Table of Contents
Freight and Fulfillment. In 2011, more than 90% of our orders were shipped by one third party provider and 100% of our order fulfillment was handled by our third party providers. Should these providers be unable to service our needs for even a short duration, our revenue and business could be harmed. Additionally, the cost and time associated with replacing these providers on short notice would add to our costs. Any replacement fulfillment provider would also require startup time, which could cause us to lose sales and market share.
Internet, Networking and Call Center. Our business also depends on a number of third parties for Internet access, networking and call center services, and we have limited control over these third parties. Should our network connections go down, our ability to fulfill orders would be delayed. Further, if our website or call center become unavailable for a noticeable period of time due to Internet or communication failures, our business could be adversely affected, including harm to our brand and loss of sales.
Therefore, we are dependent on maintaining good relationships with these third parties. The services we require from these parties may be disrupted by a number of factors associated with their businesses, including the following:
| • | labor disruptions; |
| • | delivery problems; |
| • | financial condition or results of operations; |
| • | internal inefficiencies; |
| • | equipment failure; |
| • | natural or man-made disasters; and |
| • | with respect to our food suppliers, shortages of ingredients or United States Department of Agriculture (“USDA”) or United States Food and Drug Administration (“FDA”) compliance issues. |
We may be subject to claims that our personnel are unqualified to provide proper weight loss advice.
Some of our counselors for our weight management program do not have extensive training or certification in nutrition, diet or health fields and have only undergone the training they receive from us. We may be subject to claims from our customers alleging that our personnel lack the qualifications necessary to provide proper advice regarding weight loss and related topics. We may also be subject to claims that our personnel have provided inappropriate advice or have inappropriately referred or failed to refer customers to health care providers for matters other than weight loss. Such claims could result in lawsuits, damage to our reputation and divert management’s attention from our business, which would adversely affect our business.
We may be subject to health or advertising related claims from our customers.
Our weight loss program does not include medical treatment or medical advice, and we do not engage physicians or nurses to monitor the progress of our customers. Many people who are overweight suffer from other physical conditions, and our target consumers could be considered a high-risk population. A customer who experiences health problems could allege or bring a lawsuit against us on the basis that those problems were caused or worsened by participating in our weight management program. For example, our predecessor businesses suffered substantial losses due to health-related claims and related publicity. Further, customers who allege that they were deceived by any statements that we made in advertising or labeling could bring a lawsuit against us under consumer protection laws. Currently, we are neither subject to any such allegations nor have we been named in any such litigation. If we were subject to any such claims, while we would defend ourselves against such claims, we may ultimately be unsuccessful in our defense. Also, defending ourselves against such claims, regardless of their merit and ultimate outcome, would likely be lengthy and costly, and adversely affect our results of operations. Further, our general liability insurance may not cover claims of these types.
15
Table of Contents
The weight management industry is highly competitive. If any of our competitors or a new entrant into the market with significant resources pursues a weight management program similar to ours, our business could be significantly affected.
Competition is intense in the weight management industry and we must remain competitive in the areas of program efficacy, price, taste, customer service and brand recognition. Our competitors include companies selling pharmaceutical products and weight loss programs, as well as a wide variety of diet foods and meal replacement bars and shakes, appetite suppressants and nutritional supplements. Some of our competitors are significantly larger than we are and have substantially greater resources. Our business could be adversely affected if someone with significant resources decided to imitate our weight management program. For example, if a major supplier of pre-packaged foods decided to enter this market and made a substantial investment of resources in advertising and training diet counselors, our business could be significantly affected. Any increased competition from new entrants into our industry or any increased success by existing competition could result in reductions in our sales or prices, or both, which could have an adverse effect on our business and results of operations.
We are dependent on certain third party agreements for a percentage of revenue.
We have contractual agreements with certain third party retailers. Under the agreements, these third parties control when and how often our products and services are offered and we are not guaranteed any minimum level of sales or transactions. Additionally, some agreements contain exclusive rights in specified locations to promote our products during the contract term and for a specified period thereafter. If any third party elects not to renew their agreement or reduces the promotion of our products, our operating profits will suffer. Additionally, in certain instances, we could be prohibited from selling our products through competitors of these third parties for a specified time after the termination of the agreements.
New weight loss products or services may put us at a competitive disadvantage.
On an ongoing basis, many existing and potential providers of weight loss solutions, including many pharmaceutical firms with significantly greater financial and operating resources than we have, are developing new products and services. The creation of a weight loss solution, such as a drug therapy, that is perceived to be safe, effective and “easier” than a portion-controlled meal plan would put us at a disadvantage in the marketplace and our results of operations could be negatively affected.
We may be subject to litigation from our competitors.
Our competitors may pursue litigation against us based on our advertising or other marketing practices regardless of its merit and chances of success, especially if we engage in competitive advertising, which includes advertising that directly or indirectly mentions a competitor or a competitor’s weight loss program in comparison to our program. While we would defend ourselves against any such claims, our defense may ultimately be unsuccessful. Also, defending against such claims, regardless of their merit and ultimate outcome, may be lengthy and costly, strain our resources and divert management’s attention from their core responsibilities, which would have a negative impact on our business.
Our business is subject to online security risks, including security breaches and identity theft.
Unauthorized users who penetrate our information security could misappropriate proprietary or customer information or data or cause interruptions to the product offerings on our website. As a result, it may become necessary to expend significant additional amounts of capital and resources to protect against, or to alleviate, problems caused by unauthorized users. These expenditures, however, may not prove to be a timely remedy against unauthorized users who are able to penetrate our information security. In addition to purposeful security breaches, the inadvertent transmission of computer viruses could adversely affect our computer systems and, in turn, harm our business.
16
Table of Contents
A significant number of states require that customers be notified if a security breach results in the disclosure of their personal financial account or other information. Additional states and governmental entities are considering such “notice” laws. In addition, other public disclosure laws may require that material security breaches be reported. If we experience a security breach and such notice or public disclosure is required in the future, our reputation and our business may be harmed.
In the ordinary course of our business, we collect and utilize proprietary and customer information and data. Privacy concerns among prospective and existing customers regarding our use of such information or data collected on our website or through our services and products, such as weight management information, financial data, email addresses and home addresses, could keep them from using our website or purchasing our services or products. We currently face certain legal obligations regarding the manner in which we treat such information and data. Businesses have been criticized by privacy groups and governmental bodies for their use and handling of such information and data. Currently, a significant number of our customers authorize us to bill their credit cards directly for fees charged by us. We rely on third party software products to secure our credit card transactions. Although we have developed systems and processes that are designed to protect consumer information and prevent fraudulent payment transactions and other security breaches, failure to prevent or mitigate such fraud or breaches or changes in industry standards or regulations may adversely affect our business and operating results.
We may experience fluctuations in our operating results which may cause our stock price to be volatile.
We have experienced and expect to continue to experience fluctuations in our quarterly results of operations. Our business is seasonal, with revenues generally stronger in the first quarter and weaker in the fourth quarter. The market price of our common stock is subject to fluctuations in response to our operating results, general trends in the weight loss industry, announcements by our competitors, our ability to meet or exceed securities analysts’ expectations, recommendations by securities analysts, the condition of the financial markets and other factors. These fluctuations, as well as general economic and market conditions, may adversely affect the market price of our common stock and cause it to fluctuate significantly.
Future acquisitions and the pursuit of new business opportunities present risks, and we may be unable to achieve the financial and strategic goals of any acquisition or new business.
A component of our growth strategy may be to acquire existing businesses or pursue other business opportunities in the market for weight management and fitness products and services. Even if we succeed in acquiring or building such businesses, we will face a number of risks and uncertainties, including:
| • | difficulties in integrating newly acquired or newly started businesses into existing operations, which may result in increasing operating costs that would adversely affect our operating income and earnings; |
| • | the risk that our current and planned facilities, information systems, personnel and controls will not be adequate to support our future operations; |
| • | diversion of management time and capital resources from our existing businesses, which could adversely affect their performance and our operating results; |
| • | dependence on key management personnel of acquired or newly started businesses and the risk that we will be unable to integrate or retain such personnel; |
| • | the risk that the new products or services we may introduce or begin offering, whether as a result of internal expansion or business acquisitions, will not gain acceptance among consumers and existing customers; |
| • | the risk that new efforts may have a detrimental effect on our brand; |
| • | the risk that we will face competition from established or larger competitors in the new markets we may enter, which could adversely affect the financial performance of any businesses we might acquire or start; and |
17
Table of Contents
| • | the risk that the anticipated benefits of any acquisition or of the commencement of any new business may not be realized, in which event we will not be able to achieve any return on our investment in that new business. |
Consummating these transactions could also result in the incurrence of additional debt and related interest expense, as well as unforeseen contingent liabilities, all of which could have a material adverse effect on our business, financial condition or results of operations. We may also issue additional equity in connection with these transactions, which would dilute our existing shareholders.
If we do not continue to receive referrals from existing customers, our customer acquisition cost may increase.
We rely on word-of-mouth advertising for a portion of our new customers. If our brand suffers or the number of customers acquired through referrals drops due to other circumstances, our costs associated with acquiring new customers and generating revenue will increase, which will, in turn, have an adverse affect on our profitability.
We use spokespersons to promote our products. If these spokespersons suffer adverse publicity, our revenue could be adversely affected.
Our marketing strategy depends in part on celebrity spokespersons, as well as customer spokespersons, to promote our weight management program. Any of these spokespersons may become the subject of adverse news reports, negative publicity or otherwise be alienated from a segment of our customer base, whether weight loss related or not. If so, such events may reduce the effectiveness of his or her endorsement and, in turn, adversely affect our revenue and results of operations.
Third parties may infringe on our brand, trademarks and other intellectual property rights, which may have an adverse impact on our business.
We currently rely on a combination of trademark and other intellectual property laws and confidentiality procedures to establish and protect our proprietary rights, including our brand. If we fail to successfully enforce our intellectual property rights, the value of our brand, services and products could be diminished and our business may suffer. Our precautions may not prevent misappropriation of our intellectual property. Any legal action that we may bring to protect our brand and other intellectual property could be unsuccessful and expensive and could divert management’s attention from other business concerns. In addition, legal standards relating to the validity, enforceability and scope of protection of intellectual property, especially in Internet-related businesses, are uncertain and evolving. We cannot assure you that these evolving legal standards will sufficiently protect our intellectual property rights in the future.
We may in the future be subject to intellectual property rights claims.
Third parties may in the future make claims against us alleging infringement of their intellectual property rights. Any intellectual property claims, regardless of merit, could be time-consuming and expensive to litigate or settle and could significantly divert management’s attention from other business concerns. In addition, if we were unable to successfully defend against such claims, we may have to pay damages, stop selling the service or product or stop using the software, technology or content found to be in violation of a third party’s rights, seek a license for the infringing service, product, software, technology or content or develop alternative non-infringing services, products, software, technology or content. If we cannot license on reasonable terms, develop alternatives or stop using the service, product, software, technology or content for any infringing aspects of our business, we may be forced to limit our service and product offerings. Any of these results could reduce our revenues and our ability to compete effectively, increase our costs or harm our business.
18
Table of Contents
Our credit agreement contains financial and other covenants. The failure to comply with such covenants could have an adverse effect on us.
Our credit agreement contains certain financial and other covenants, including a maximum leverage ratio, a minimum fixed charge ratio and a minimum consolidated earnings before interest, taxes, depreciation and amortization, and includes limitations on, among other things, liens, capital expenditures, certain acquisitions, consolidations and sales of assets. Any failure to comply with the restrictions of the credit agreement may result in an event of default under the agreement.
We are dependent on our key executive officers for future success.
Our future success depends to a significant degree on the skills, experience and efforts of our key executive officers. The loss of the services of any of these individuals could harm our business. We have not obtained life insurance on any key executive officers. If any key executive officers left us or were seriously injured and became unable to work, our business could be harmed.
Provisions in our certificate of incorporation may deter or delay an acquisition of us or prevent a change in control, even if an acquisition or a change of control would be beneficial to our stockholders.
Provisions of our certificate of incorporation (as amended) may have the effect of deterring unsolicited takeovers or delaying or preventing a third party from acquiring control of us, even if our stockholders might otherwise receive a premium for their shares over then current market prices. In addition, these provisions may limit the ability of stockholders to approve transactions that they may deem to be in their best interests.
Our certificate of incorporation (as amended) permits our Board of Directors to issue preferred stock without stockholder approval upon such terms as the Board of Directors may determine. The rights of the holders of our common stock will be junior to, and may be adversely affected by, the rights of the holders of any preferred stock that may be issued in the future. The issuance of preferred stock could have the effect of making it more difficult for a third party to acquire, or of discouraging a third party from acquiring, a majority of our outstanding common stock. The issuance of a substantial number of preferred shares could adversely affect the price of our common stock.
Risks Related to Our Industry
Changes in consumer preferences could negatively impact our operating results.
Our program features pre-packaged food selections, which we believe offer convenience and value to our customers. Our continued success depends, to a large degree, upon the continued popularity of our program versus various other weight loss, weight management and fitness regimens, such as low carbohydrate diets, appetite suppressants and diets featured in the published media. Changes in consumer tastes and preferences away from our pre-packaged food and support and counseling services, and any failure to provide innovative responses to these changes, may have a materially adverse impact on our business, financial condition, operating results, cash flows and prospects.
Our success is also dependent on our food innovation including maintaining a robust array of food items and improving the quality of existing items. If we do not continually expand our food items or provide customers with items that are desirable in taste and quality, our business could be harmed.
The weight loss industry is subject to adverse publicity, which could harm our business.
The weight loss industry receives adverse publicity from time to time, and the occurrence of such publicity could harm us, even if the adverse publicity is not directly related to us. In the early 1990s, our predecessor
19
Table of Contents
businesses were subject to extremely damaging adverse publicity relating to a large number of lawsuits alleging that the Nutrisystem weight loss program in use at that time led to gall bladder disease. This publicity was a factor that contributed to the bankruptcy of our predecessor businesses in 1993. More recently, our predecessor businesses were severely impacted by significant litigation and damaging publicity related to their customers’ use of fen-phen as an appetite suppressant, which the FDA ordered withdrawn from the market in September 1997. The significant decline in business resulting from the fen-phen problems caused our predecessor businesses to close all of their company-owned weight loss centers.
Congressional hearings about practices in the weight loss industry have also resulted in adverse publicity and a consequent decline in the revenue of weight loss businesses. Future research reports or publicity that is perceived as unfavorable or that question certain weight loss programs, products or methods could result in a decline in our revenue. Because of our dependence on consumer perceptions, adverse publicity associated with illness or other undesirable effects resulting from the consumption of our products or similar products by competitors, whether or not accurate, could also damage customer confidence in our weight loss program and result in a decline in revenue. Adverse publicity could arise even if the unfavorable effects associated with weight loss products or services resulted from the user’s failure to use such products or services appropriately.
Our industry is subject to governmental regulation that could increase in severity and hurt results of operations.
Our industry is subject to federal, state and other governmental regulation. Certain federal and state agencies, such as the Federal Trade Commission, or FTC, regulate and enforce such laws relating to advertising, disclosures to consumers, privacy, consumer pricing and billing arrangements and other consumer protection matters. A determination by a federal or state agency, or a court, that any of our practices do not meet existing or new laws or regulations could result in liability, adverse publicity, and restrictions of our business operations. Some advertising practices in the weight loss industry have led to investigations from time to time by the FTC and other governmental agencies. Many companies in the weight loss industry, including our predecessor businesses, have entered into consent decrees with the FTC relating to weight loss claims and other advertising practices. We continue to be subject to such a consent decree, which, in part, restricts how we advertise the successes our customers have achieved in losing weight through the program and require us to include the phrase “results not typical.” In October 2009, the FTC published its revised Guides concerning the Use of Endorsements and Testimonials in Advertising which now requires us to use a statement as to what the typical weight loss a customer can expect to achieve on our program when using a customer’s weight loss testimonial in advertising. Federal and state regulation of advertising practices generally, and in the weight loss industry in particular, may increase in scope or severity in the future, which could have a material adverse impact on our business.
Other aspects of our industry are also subject to government regulation. For example, the labeling and distribution of food products are subject to strict USDA and FDA requirements and food manufacturers are subject to rigorous inspection and other requirements of the USDA and FDA, and companies operating in foreign markets must comply with those countries’ requirements for proper labeling, controls on hygiene, food preparation and other matters. If federal, state, local or foreign regulation of our industry increases for any reason, then we may be required to incur significant expenses, as well as modify our operations to comply with new regulatory requirements, which could harm our operating results. Additionally, remedies available in any potential administrative or regulatory actions may include product recalls and requiring us to refund amounts paid by all affected customers or pay other damages, which could be substantial.
Laws and regulations directly applicable to communications, operations or commerce over the Internet such as those governing intellectual property, privacy, libel and taxation, are more prevalent and remain unsettled. If we are required to comply with new laws or regulations or new interpretations of existing laws or regulations, or if we are unable to comply with these laws, regulations or interpretations, our business could be adversely affected.
20
Table of Contents
Future laws or regulations, including laws or regulations affecting our marketing and advertising practices, relations with consumers, employees, service providers, or our services and products, may have an adverse impact on us.
The sale of ingested products involves product liability and other risks.
Like other distributors of products that are ingested, we face an inherent risk of exposure to product liability claims if the use of our products results in illness or injury. The foods that we resell in the U.S. are subject to laws and regulations, including those administered by the USDA and FDA that establish manufacturing practices and quality standards for food products. Product liability claims could have a material adverse effect on our business as existing insurance coverage may not be adequate. Distributors of weight loss food products, vitamins, nutritional supplements and minerals, including our predecessor businesses, have been named as defendants in product liability lawsuits from time to time. The successful assertion or settlement of an uninsured claim, a significant number of insured claims or a claim exceeding the limits of our insurance coverage would harm us by adding costs to the business and by diverting the attention of senior management from the operation of the business. We may also be subject to claims that our products contain contaminants, are improperly labeled, include inadequate instructions as to use or inadequate warnings covering interactions with other substances. Product liability litigation, even if not meritorious, is very expensive and could also entail adverse publicity for us and reduce our revenue. In addition, the products we distribute, or certain components of those products, may be subject to product recalls or other deficiencies. Any negative publicity associated with these actions would adversely affect our brand and may result in decreased product sales and, as a result, lower revenues and profits.
| ITEM 1B. | UNRESOLVED STAFF COMMENTS |
None.
| ITEM 2. | PROPERTIES |
We currently lease one location in Horsham, Pennsylvania and one in Fort Washington, Pennsylvania. These two locations total approximately 171,157 square feet of office space. The lease in Horsham expires in 2018. The lease for our Fort Washington location expires in 2022. We have additional fulfillment capacity in Chambersburg, Pennsylvania, Allentown, Pennsylvania and Sparks, Nevada through an outsourced provider. We have no lease obligations to any of our outsourced fulfillment providers; however, we are subject to minimum space commitments which we may reduce over a specified period of time. Management believes the outsourced fulfillment capacity is adequate to meet our needs for the foreseeable future.
21
Table of Contents
| ITEM 3. | LEGAL PROCEEDINGS |
Litigation
Commencing on October 9, 2007, several putative class action suits were filed in the United States District Court for the Eastern District of Pennsylvania naming Nutrisystem, Inc. and certain of its officers and directors as defendants and alleging violations of Sections 10(b) and 20(a) of the Securities Exchange Act of 1934. The complaints purported to bring claims on behalf of a class of persons who purchased the Company’s common stock between February 14, 2007 and October 3, 2007 or October 4, 2007. The complaints alleged that the defendants issued various materially false and misleading statements relating to the Company’s projected performance that had the effect of artificially inflating the market price of its securities. These actions were consolidated in December 2007 under docket number 07-4215, and a consolidated amended complaint was filed on March 7, 2008 that raised the same claims but alleged a class period of February 14, 2007 through February 19, 2008. The consolidated amended complaint asked the court to (1) certify a class, (2) award compensatory damages, reasonable costs and expenses and (3) grant such other and further relief as the court deemed just and proper. The defendants filed a motion to dismiss on May 6, 2008 that was granted by the Court on August 31, 2009. On September 29, 2009, plaintiff filed a notice of appeal, and on May 19, 2010, upon motion by the plaintiff/appellant, the appeal was dismissed with prejudice without costs to either party. The dismissal is final.
On April 27, 2010, counsel for a stockholder sent a letter relating to the same events that formed the bases of the federal putative class action described above. Specifically, the stockholder has demanded, pursuant to Delaware Chancery Court Rule 23.1, that the Board of Directors (1) undertake (or cause to be undertaken) an independent internal investigation into violations of Delaware law committed by Company management during the time periods described above and (2) commence a civil action against each member of management to recover for the benefit of the Company the amount of damages sustained by the Company as a result of their breaches of fiduciary duties described above. The Board of Directors appointed a special committee consisting of three independent directors to investigate this demand. The special committee engaged independent legal counsel to assist it in this investigation. In April 2011, the special committee, with the assistance of independent legal counsel, completed its investigation and delivered to the Board of Directors the special committee’s recommendation that the Company refuse the demands made in the stockholder’s letter. At its April 2011 meeting, the Board of Directors, after deliberation and discussion, unanimously determined to accept the special committee’s recommendation as in the best interests of the Company and its stockholders. Promptly thereafter, the special committee’s counsel delivered to the stockholder’s counsel a letter informing counsel of the Board of Directors’ actions and the Company’s decision to refuse the stockholder’s demands. In May 2011, the stockholder’s counsel sent a letter to the Company’s counsel demanding to inspect and make copies of certain specified books, records, minutes and other documents of the Company for the purposes set forth in such letter. Without waiving any of its rights to challenge the propriety of such purposes under Delaware law, in early June 2011, the Company delivered to the stockholder’s counsel copies of certain minutes of the Board of Directors and the special committee according to the terms of a confidentiality agreement that the Company and the stockholder had executed. The Company has not received any further correspondence or communications from the stockholder or his counsel since that time.
On August 5, 2011, a lawsuit was filed by a stockholder in the United States District Court for the Eastern District of Pennsylvania naming Nutrisystem, Inc., certain of its officers and directors, and one of its former officers as defendants and alleging breaches by defendants of their fiduciary duties of candor, good faith and loyalty, unjust enrichment, and aiding and abetting from 2010 to the present in connection with the award of excessive and unwarranted 2010 executive compensation. Plaintiff specifically claims the action to be a failed “say-on-pay” shareholder derivative action stemming from the advisory, non-binding vote of the Company’s stockholders at its May 12, 2011 annual meeting in which the Company’s stockholders did not approve the Company’s 2010 executive compensation. The complaint is listed under docket number 2:11-cv-05036-PD and specifically alleges that (1) the defendants breached their fiduciary duties in connection with the issuance of certain false and misleading statements contained in Nutrisystem’s Proxy Statement; (2) the defendants breached
22
Table of Contents
their fiduciary duties in connection with the Board of Directors’ compensation practices; (3) the defendants breached their fiduciary duties in connection with the Company’s failure to respond to the negative “say-on-pay” vote; and (4) as a result of the foregoing the defendants were unjustly enriched at the expense of the Company. Accordingly, the complaint asks the court to (1) award judgment against the defendants and in favor of the Company for an unspecified amount of damages sustained by the Company as a result of defendants’ violation of state law, (2) grant extraordinary equitable and/or injunctive relief as necessary or permitted by law, equity and the statutory provisions cited in the complaint, including disgorgement, attachment, impoundment, imposition of a constructive trust on or otherwise restricting the disposition/exercise of improvidently awarded executive compensation based upon false financial reporting and/or the proceeds of defendants’ trading activities or their other assets so as to ensure that plaintiff on behalf of the Company has an effective remedy; (3) order the implementation and administration of internal controls and systems at the Company designed to prohibit and prevent excessive and/or unwarranted executive compensation payments to the Company’s chief executive, chief financial, and other senior executive officers; (4) award to plaintiff the costs and disbursements of the action, including reasonable attorneys’ fees, and accountants’ and expert fees, costs and expenses; and (5) grant such other and further relief as the court deems just and proper. On October 21, 2011 the defendants filed a motion to dismiss the complaint pursuant to Rules 12(b)(6) and 23.1 of the Federal Rules of Civil Procedure for failure to state a claim upon which relief can be granted and for failure to adequately plead demand futility. On November 21, 2011 plaintiff filed his brief in opposition to the defendants’ motion to dismiss the complaint and alleged that the directors issued false and misleading statements in the Company’s proxy statement by stating that the Company adhered to a pay-for-performance policy when in fact it did not. In its opposition brief, plaintiff abandoned the count contained in its complaint that the defendants breached their fiduciary duties in connection with the Company’s failure to respond to the negative “say-on-pay” vote. On December 5, 2011 defendants filed their reply brief in support of their motion to dismiss the complaint. The court has scheduled a preliminary pretrial conference for March 8, 2012. The Company believes that the claims are without merit and intends to defend the litigation vigorously.
On September 1, 2011, a lawsuit was filed by another stockholder in the Court of Common Pleas of Montgomery County, Pennsylvania naming Nutrisystem, Inc., certain of its officers and directors, and one of its former officers as defendants and alleging breaches by defendants of their fiduciary duties of candor, good faith and loyalty, unjust enrichment, and aiding and abetting from 2010 to the present in connection with the award of excessive and unwarranted 2010 executive compensation. This action stems from the same failed “say-on-pay” advisory, non-binding vote of the Company’s stockholders at its May 12, 2011 annual meeting in which the Company’s stockholders did not approve the Company’s 2010 executive compensation. The complaint is listed under docket number 2011-24985 and specifically alleges that (1) the defendants breached their fiduciary duties in connection with the issuance of certain materially false and misleading statements and omissions of fact in Nutrisystem’s Proxy Statement; (2) the defendants breached their fiduciary duties in connection with the Company’s excessive 2010 executive compensation and the failure to rescind such compensation in response to the negative “say-on-pay” vote; and (3) as a result of the foregoing the executive defendants were unjustly enriched at the expense of the Company. Accordingly, the complaint asks the court to (1) determine that the action is a proper derivative action maintainable under the law and that demand is excused; (2) award judgment against the defendants and in favor of the Company for an unspecified amount of damages sustained by the Company as a result of defendants’ breaches of fiduciary duties; (3) grant injunctive and other equitable relief as necessary or permitted by law, equity and the statutory provisions cited in the complaint, including disgorgement, attachment, impoundment, imposition of a constructive trust on or otherwise restricting the disposition/exercise of disloyally awarded 2010 executive compensation; (4) direct the Company to take all necessary actions to reform and improve its corporate governance and internal procedures to comply with all applicable laws and to protect the Company and its stockholders from a repeat of the damaging events described in the Complaint; (5) award to plaintiff the costs and disbursements of the action, including reasonable allowance of fees and costs for plaintiff’s attorneys, experts and accountants; and (6) grant such other and further relief as the court deems just and proper. On November 10, 2011, the defendants filed preliminary objections to the complaint asserting (1) the court should decline to exercise subject matter jurisdiction over the action pursuant to Pennsylvania Rule of Civil Procedure 1028(a)(1) and (a)(4) under Pennsylvania’s internal affairs doctrine; (2) failure to state a claim
23
Table of Contents
upon which relief may be granted under Pennsylvania Rule of Civil Procedure 1028(a)(4); and (3) lack of capacity to sue under Pennsylvania Rule of Civil Procedure 1028(a)(5) because the plaintiff did not make a demand on the company’s directors and failed to adequately allege that such demand was excused. On November 21, 2011, defendants filed a praecipe for argument in which they requested oral argument. On December 23, 2011, plaintiff filed his opposition to the defendants’ preliminary objections and alleged that the directors issued false and misleading statements in the Company’s proxy statement by stating that the Company adhered to a pay-for-performance policy when in fact it did not. On January 23, 2012, defendants filed their reply brief in support of their preliminary objections to the complaint. Oral argument was heard by the court on February 8, 2012. On February 13, 2012, the court denied the defendants’ preliminary objections. The defendants’ answer to the complaint is now required to be filed by March 13, 2012. The Company believes that the claims are without merit and intends to defend the litigation vigorously.
The Company is also involved in other various claims and routine litigation matters. In the opinion of management, after consultation with legal counsel, the outcomes of such matters are not anticipated to have a material adverse effect on the Company’s consolidated financial position, results of operations or cash flows in future years.
24
Table of Contents
PART II
| ITEM 5. | MARKET FOR REGISTRANT’S COMMON EQUITY, RELATED STOCKHOLDER MATTERS AND ISSUER PURCHASES OF EQUITY SECURITIES |
Market Information
The Company’s common stock has been traded on the NASDAQ Stock Market since June 22, 2005, under the symbol “NTRI.” The following table sets forth, for the periods indicated, the high and low sale prices for the Company’s common stock as reported on the NASDAQ Stock Market.
| High | Low | |||||||
| 2012 First Quarter (through March 2, 2012) |
$ | 15.55 | $ | 11.03 | ||||
| 2011 First Quarter |
$ | 22.64 | $ | 13.05 | ||||
| 2011 Second Quarter |
16.11 | 12.37 | ||||||
| 2011 Third Quarter |
15.74 | 10.46 | ||||||
| 2011 Fourth Quarter |
13.80 | 10.61 | ||||||
| 2010 First Quarter |
$ | 31.90 | $ | 15.26 | ||||
| 2010 Second Quarter |
24.90 | 17.13 | ||||||
| 2010 Third Quarter |
24.57 | 17.21 | ||||||
| 2010 Fourth Quarter |
22.03 | 18.41 | ||||||
Holders
As of March 2, 2012, the Company had approximately 215 record holders of its common stock.
Dividends
Prior to 2008, we had not declared or paid any dividend since inception. We have paid a quarterly dividend of $0.175 per share beginning with the second quarter of 2008. The declaration and payment of dividends in the future will be determined by the Company’s Board of Directors in light of conditions then existing, including the Company’s earnings, financial condition, capital requirements and other factors. See “Management’s Discussion and Analysis of Financial Condition and Results of Operations – Liquidity, Capital Resources and Other Financial Data.”
Securities Authorized for Issuance Under Equity Compensation Plans
The information under the heading “Equity Compensation Plan Information” to be filed in the Company’s definitive proxy statement for the 2012 annual meeting of stockholders is incorporated by reference.
Recent Sales of Unregistered Securities
On October 14, 2011, we issued 117,188 shares of common stock to Black Doll, Inc. in consideration for marketing services. In granting the shares, we relied upon the exemption from registration set forth in Section 4(2) of the Securities Act of 1933.
25
Table of Contents
Issuer Purchases of Equity Securities
The following table provides information relating to our purchases of our common stock during the quarter ended December 31, 2011:
| Period |
Total Number of Shares Purchased (1)(2) |
Average Price Paid per Share |
Total Number of Shares Purchased as Part of Publicly Announced Plans or Programs (1) |
Approximate Dollar Value of Shares that May Yet Be Purchased Under the Plans or Programs (1) |
||||||||||||
| October 1 – October 31, 2011 |
— | — | — | $ | 150,000,000 | |||||||||||
| November 1 – November 30, 2011 |
— | — | — | $ | 150,000,000 | |||||||||||
| December 1 – December 31, 2011 |
— | — | — | $ | 150,000,000 | |||||||||||
| (1) | On July 28, 2011, we announced that our Board of Directors had authorized the repurchase of up to $150.0 million of our outstanding shares of common stock in open-market transactions on the NASDAQ Stock Market or through privately negotiated transactions, including block transactions. The timing and actual number of shares repurchased depend on a variety of factors including price, corporate and regulatory requirements, alternative investment opportunities and other market conditions. The stock repurchase program has an expiration date of June 30, 2013 but may be limited or terminated at any time by our Board of Directors without prior notice. |
| (2) | For the period from October 1, 2011 through December 31, 2011, employees surrendered 5,930 shares of common stock to the Company for payment of the minimum tax withholding obligations upon the vesting of shares of restricted common stock. |
26
Table of Contents
STOCK PRICE PERFORMANCE GRAPH
The following graph shows a comparison of cumulative total return since December 29, 2006, for our common stock, the Russell 2000 Index and the Dow Jones Consumer Services Index (a published industry index), each of which assumes an initial value of $100 and reinvestment of dividends. Our common stock traded on the NASDAQ National Market until May 24, 2001. It then traded on the OTC Bulletin Board under the ticker symbol THIN.OB., the American Stock Exchange under the ticker symbol NSI and now trades on the NASDAQ Stock Market under the ticker symbol NTRI.
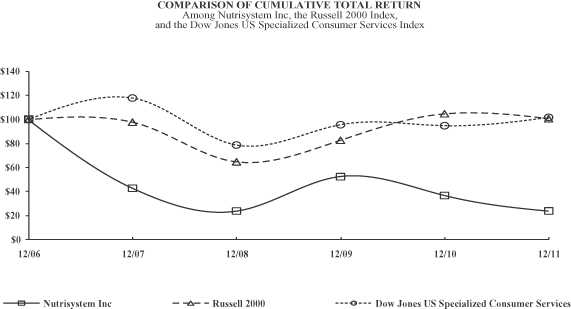
| 12/06 | 12/07 | 12/08 | 12/09 | 12/10 | 12/11 | |||||||||||||||||||
| Nutrisystem, Inc. |
$ | 100 | $ | 43 | $ | 24 | $ | 53 | $ | 37 | $ | 24 | ||||||||||||
| Russell 2000 |
100 | 98 | 65 | 83 | 105 | 101 | ||||||||||||||||||
| Dow Jones US Specialized Consumer Services |
100 | 118 | 79 | 96 | 95 | 102 | ||||||||||||||||||
27
Table of Contents
| ITEM 6. | SELECTED FINANCIAL DATA |
The selected consolidated financial data presented below has been derived from our Consolidated Financial Statements for each of the periods indicated. The data set forth below is qualified by reference to and should be read in conjunction with “Management’s Discussion and Analysis of Financial Condition and Results of Operations” and our Consolidated Financial Statements included as Items 7 and 8, respectively, in this Annual Report.
Selected Consolidated Financial Data
(In thousands, except per share data)
| Year Ended December 31, | ||||||||||||||||||||
| 2011 | 2010 | 2009 | 2008 | 2007 | ||||||||||||||||
| Statement of Operations Data: |
||||||||||||||||||||
| Revenue |
$ | 401,336 | $ | 509,515 | $ | 524,618 | $ | 686,181 | $ | 776,767 | ||||||||||
|
|
|
|
|
|
|
|
|
|
|
|||||||||||
| Costs and expenses: |
||||||||||||||||||||
| Cost of revenue |
198,405 | 224,806 | 241,163 | 325,172 | 349,891 | |||||||||||||||
| Marketing |
110,922 | 145,868 | 146,426 | 174,862 | 178,700 | |||||||||||||||
| General and administrative |
60,812 | 73,853 | 76,418 | 86,701 | 79,435 | |||||||||||||||
| Depreciation and amortization |
12,068 | 11,773 | 11,177 | 8,093 | 5,812 | |||||||||||||||
|
|
|
|
|
|
|
|
|
|
|
|||||||||||
| Operating income from continuing operations |
19,129 | 53,215 | 49,434 | 91,353 | 162,929 | |||||||||||||||
| Other (expense) income |
0 | (32 | ) | 407 | (1,145 | ) | (39 | ) | ||||||||||||
| Equity and impairment loss |
0 | 0 | (4,000 | )(a) | (9,458 | )(a) | (800 | ) | ||||||||||||
| Interest (expense) income, net |
(468 | ) | 5 | 104 | 454 | 3,728 | ||||||||||||||
| Income taxes |
6,400 | 19,309 | 13,072 | 34,018 | 60,871 | |||||||||||||||
| Discontinued operations, net |
0 | (242 | )(b) | (4,083 | )(b, c) | (933 | )(b, c) | (795 | )(c) | |||||||||||
|
|
|
|
|
|
|
|
|
|
|
|||||||||||
| Net income |
$ | 12,261 | $ | 33,637 | $ | 28,790 | $ | 46,253 | $ | 104,152 | ||||||||||
|
|
|
|
|
|
|
|
|
|
|
|||||||||||
| Basic income per common share: |
||||||||||||||||||||
| Continuing operations |
$ | 0.44 | $ | 1.14 | $ | 1.07 | $ | 1.50 | $ | 3.05 | ||||||||||
| Discontinued operations |
0 | (0.01 | ) | (0.14 | ) | (0.03 | ) | (0.02 | ) | |||||||||||
|
|
|
|
|
|
|
|
|
|
|
|||||||||||
| Basic |
$ | 0.44 | $ | 1.13 | $ | 0.93 | $ | 1.47 | $ | 3.03 | ||||||||||
|
|
|
|
|
|
|
|
|
|
|
|||||||||||
| Diluted income per common share: |
||||||||||||||||||||
| Continuing operations |
$ | 0.43 | $ | 1.13 | $ | 1.06 | $ | 1.48 | $ | 2.98 | ||||||||||
| Discontinued operations |
0 | (0.01 | ) | (0.14 | ) | (0.03 | ) | (0.02 | ) | |||||||||||
|
|
|
|
|
|
|
|
|
|
|
|||||||||||
| Diluted |
$ | 0.43 | $ | 1.12 | $ | 0.92 | $ | 1.45 | $ | 2.96 | ||||||||||
|
|
|
|
|
|
|
|
|
|
|
|||||||||||
| Weighted average shares outstanding: |
||||||||||||||||||||
| Basic |
27,033 | 28,312 | 29,458 | 30,684 | 34,397 | |||||||||||||||
| Diluted |
27,325 | 28,686 | 29,769 | 31,172 | 35,171 | |||||||||||||||
| December 31, | ||||||||||||||||||||
| 2011 | 2010 | 2009 | 2008 | 2007 | ||||||||||||||||
| Balance Sheet Data: |
||||||||||||||||||||
| Cash, cash equivalents and marketable securities |
$ | 57,607 | $ | 41,219 | $ | 62,522 | $ | 38,309 | $ | 42,448 | ||||||||||
| Working capital |
76,239 | 74,020 | 103,341 | 78,448 | 103,349 | |||||||||||||||
| Total assets |
150,354 | 149,953 | 170,787 | 159,471 | 198,560 | |||||||||||||||
| Borrowings under credit facility |
30,000 | 30,000 | 0 | 0 | 0 | |||||||||||||||
| Non-current liabilities |
4,734 | 5,313 | 1,550 | 1,298 | 1,006 | |||||||||||||||
| Stockholders’ equity |
74,958 | 74,976 | 128,963 | 115,825 | 141,502 | |||||||||||||||
28
Table of Contents
| (a) | In June 2009, we abandoned our interest in Zero Technologies, LLC (“Zero Water”) as management determined that the business was no longer aligned with our current strategic direction. An equity and impairment loss of $4,000 was recorded during 2009 to write-off the remaining investment. During 2008, we recorded an equity loss of $2,975 for our share of Zero Water’s loss and the amortization expense for the difference between the cost and the underlying equity in net assets of Zero Water at the investment date. Additionally, we recorded an impairment charge of $6,483 during 2008 to reduce the carrying value of the equity investment to its estimated fair value. The impairment charge primarily resulted from lower-than-expected operating results and projections of future performance coupled with the current non-strategic business direction of Zero Water and the overall general economic decline which indicated that the full carrying value of the equity investment was not recoverable. See the discussion contained in Note 7 of the Notes to the Consolidated Financial Statements. |
| (b) | In the first quarter of 2010, we committed to a plan to sell the business operations conducted by our subsidiary, Nutrisystem Fresh, Inc. (“NuKitchen”), as it was no longer aligned with the business direction of the Company. NuKitchen has been treated as a discontinued operation. During the third quarter of 2010, this business was shut down as we were unsuccessful in locating a buyer. Accordingly, the operating results of this discontinued operation have been presented separately from continuing operations for all periods presented. The loss on discontinued operations during 2010 was primarily from operations. During the fourth quarter of 2009, an impairment charge of $4,541 was recorded in connection with the NuKitchen acquisition. This charge consisted of $2,717 of goodwill and $1,824 of identifiable intangible assets. See the discussion contained in Note 12 of the Notes to the Consolidated Financial Statements. |
| (c) | In the fourth quarter of 2007, we committed to a plan to sell our subsidiary Slim and Tone LLC (“Slim and Tone”). This subsidiary has been treated as a discontinued operation. Accordingly, the operating results of this discontinued operation have been presented separately from continuing operations and are included in loss on discontinued operation, net of income tax in the accompanying consolidated statements of operations for all periods presented. In 2007, we recorded a pre-tax loss on disposal of $1,256, consisting of an impairment of goodwill and intangibles of $1,156 and a pre-tax loss of $100. See the discussion contained in Note 12 of the Notes to the Consolidated Financial Statements. |
29
Table of Contents
| ITEM 7. | MANAGEMENT’S DISCUSSION AND ANALYSIS OF FINANCIAL CONDITION AND RESULTS OF OPERATIONS |
The following discussion should be read in conjunction with the financial information included elsewhere in this Annual Report.
Background
We provide weight management products and services and offer nutritionally balanced weight loss programs designed for women, men, and seniors, as well as the Nutrisystem® D® program, specifically designed to help people with type 2 diabetes who want to lose weight and manage their diabetes. The Nutrisystem programs are based on 40 years of nutrition research and on the science of the low Glycemic Index. Our pre-packaged foods are sold directly to weight loss program participants primarily through the Internet and telephone (including the redemption of prepaid program cards), referred to as the direct channel, and through QVC, a television shopping network. Approximately 80% of our order volumes are processed through the Internet.
Revenue consists primarily of food sales. For 2011, 2010 and 2009, the direct channel accounted for 95%, 96% and 94%, respectively, of total revenue compared to 4%, 4% and 6%, respectively, for QVC. During 2011, 1% of total revenue came from other channels. We incur significant marketing expenditures to support our brand as we continue to advertise across various media channels. New media channels are tested on a continual basis and we consider our media mix to be diverse. We market our weight management system through television, print, direct mail, Internet and public relations. We review and analyze a number of key operating and financial metrics to manage our business, including the number of new customers, revenue per customer, total revenues, marketing per new customer, operating margins and reactivation revenue.
Our mix of revenue can be divided into three categories. First, new customer revenue is all revenue within a quarter from customers joining within that quarter. New customer revenue is the main driver of revenue growth. Second, on-program revenue is all revenue from customers who joined in previous quarters but who are still within their first nine months on the program. Third, reactivation revenue is all revenue generated from customers who are more than nine months from their initial purchase.
Our eCommerce, direct-to-consumer business model provides flexibility which allows us to manage marketing spend according to customer demand. We believe this flexibility is especially valuable due to the current instability in general economic conditions. Additionally, we initiated a concerted effort to improve lifetime customer economics, length of stay, and overall customer satisfaction and are continuously redesigning our eCommerce platform and website. Our product offerings have expanded to include fresh-frozen foods, and we entered into the retail channel and introduced the Nutrisystem® D® program during the last several years. Further, we have taken steps to reduce our overall operating costs.
Over the past several years, our financial performance has been adversely impacted by a number of factors, including the economic downturn and declines in consumers’ discretionary spending. We believe these factors have primarily driven the decline in the number of new customer starts which in turn began to hamper reactivation revenue. We continued to see a challenging environment in 2011. Our plan for 2011, a year that we expected to be challenging from a revenue standpoint, was to optimize our business model to maximize profitability and cash flow, strengthen our balance sheet, return cash to stockholders, and invest in growth initiatives for 2012 and beyond. We experienced significantly reduced sales below the comparable 2010 period throughout the month of January. Our 2011 diet season launch was ineffective in light of intense competitive activity, bargain-focused consumer behavior and weak promotional offerings. To increase sales effectiveness, we re-launched our “Rollback” pricing strategy, which increased sales traction in the months of February and March but had a negative impact on gross margins offset by increased marketing efficiency. Similarly, the remaining months of 2011 were also hampered by continued bargain-focused consumer behavior and economic concerns.
30
Table of Contents
We continued to react with discounted sales promotions thus reducing average selling prices and gross margins partially offset by increased marketing efficiency. Additionally, we incurred severance and other related charges of $2.7 million during the first quarter of 2011, which were more than offset by reductions in general and administrative expenses throughout the remainder of 2011.
In December 2011, we launched SUCCESS, our most comprehensive program to date and teamed with new celebrities for new national ad campaigns. The SUCCESS program is designed to help take the weight off and keep it off through frequent, portion-controlled, balanced nutrition and low Glycemic Index eating. It offers our largest ever assortment of signature fresh-frozen meals including new artisanal Chef’s Table™ dinner entrees, developed by Nutrisystem’s Celebrity Chef Culinary Council using revolutionary advanced steamer technology; new chocolate, vanilla, strawberry and coffee advanced protein shakes; the introduction of a personalized “My Daily 3™” physical activity program; and increased personalization and flexibility through transition and maintenance plans that help consumers manage their weight on their own. SUCCESS replaced our Nutrisystem Advanced program resulting in additional costs during the fourth quarter of 2011 primarily for marketing, packaging and increased reserves for excess and obsolete inventory and returns.
Critical Accounting Policies and Estimates
Our consolidated financial statements are prepared in accordance with U.S. generally accepted accounting principles. Our significant accounting policies are described in Note 2 of the consolidated financial statements included in Item 8.
The preparation of these financial statements requires management to make estimates and assumptions that affect the reported amounts of assets and liabilities, the disclosure of contingent assets and liabilities at the date of the financial statements and the reported amounts of revenue and expenses during the reporting period. Management develops, and changes periodically, these estimates and assumptions based on historical experience and on various other factors that are believed to be reasonable under the circumstances. Actual results may differ from these estimates under different assumptions or conditions. Management considers the following accounting estimates to be the most critical in preparing our consolidated financial statements. These critical accounting estimates are discussed with our audit committee quarterly.
Reserves for Returns. We review the reserves for customer returns at each reporting period and adjust them to reflect data available at that time. To estimate reserves for returns, we consider actual return rates in preceding periods and changes in product offerings or marketing methods that might impact returns going forward. To the extent the estimate of returns changes, we will adjust the reserve, which will impact the amount of product sales revenue recognized in the period of the adjustment. The provision for estimated returns for the years ended December 31, 2011, 2010 and 2009 was $12.9 million, $24.1 million and $30.2 million, respectively. The decrease in the provision during 2011 was due to the decrease in revenue and a decrease in the return rate due to system improvements which offset the additional reserve for the new program launch. The reserve for returns incurred but not received and processed was $726,000 and $1.0 million at December 31, 2011 and 2010, respectively, and has been included in other accrued expenses and current liabilities in the accompanying consolidated balance sheets.
Excess and Obsolete Inventory. We continually assess the quantities of inventory on hand to identify excess or obsolete inventory and a provision is recorded for any estimated loss. We estimate the reserve for excess and obsolete inventory based primarily on our forecasted demand and/or our ability to sell the products, introduction of new products, future production requirements and changes in our customers’ behavior. The reserve for excess and obsolete inventory was $769,000 and $419,000 at December 31, 2011 and 2010, respectively. The increase in the reserve was due to the new program launch in December 2011.
Income Taxes. Deferred tax assets and liabilities are recognized for the future tax consequences attributable to differences between the financial statement carrying amounts of existing assets and liabilities and the
31
Table of Contents
respective tax bases and operating loss and tax credit carryforwards. Deferred tax assets are evaluated for future realization and reduced by a valuation allowance to the extent we believe a portion will not be realized. We consider many factors when assessing the likelihood of future realization of our deferred tax assets, including our recent earnings and expectations of future taxable income and other relevant factors. We estimate the annual effective income tax rate at the beginning of each year and revise the estimate at each reporting period based on a number of factors including operating results, level of tax exempt interest income and sales by state, among other items.
Results of Operations
Revenue and expenses consist of the following components:
Revenue. Revenue consists primarily of food sales. Food sales include sales of food, supplements, shipping and handling charges billed to customers and sales credits and adjustments, including product returns. No revenue is recorded for food products provided at no charge as part of promotions.
Cost of Revenue. Cost of revenue consists primarily of the cost of the products sold, including compensation related to fulfillment, the costs of outside fulfillment, incoming and outgoing shipping costs, charge card fees and packing material. Cost of products sold includes products provided at no charge as part of promotions and the non-food materials provided with customer orders.
Marketing Expense. Marketing expense includes media, advertising production, marketing and promotional expenses and payroll-related expenses, including share-based payment arrangements, for personnel engaged in these activities. Internet advertising expense is recorded based on either the rate of delivery of a guaranteed number of impressions over the advertising contract term or on a cost per customer acquired, depending upon the terms. Direct-mail advertising costs are capitalized if the primary purpose was to elicit sales to customers who could be shown to have responded specifically to the advertising and results in probable future economic benefits. The capitalized costs are amortized to expense over the period during which the future benefits are expected to be received. All other advertising costs are charged to expense as incurred or the first time the advertising takes place.
General and Administrative Expense. General and administrative expense consists of compensation for administrative, information technology, counselors, customer service and sales personnel, share-based payment arrangements for related employees, facility expenses, website development costs, professional service fees and other general corporate expenses.
Equity and Impairment Loss. Equity and impairment loss consisted of our share of the earnings or losses of our equity interests. In June 2009, we abandoned our interest in Zero Water, as it was determined that the business was no longer aligned with our strategic direction. We held approximately a 27% fully diluted interest in Zero Water. The investment in Zero Water was accounted for using the equity method of accounting.
Interest (Expense) Income, Net. Interest (expense) income, net consists of interest expense on our outstanding indebtedness net of interest income earned on cash balances and marketable securities.
Income Taxes. We are subject to corporate level income taxes and record a provision for income taxes based on an estimated effective income tax rate for the year.
Loss on Discontinued Operations, Net. We ceased the operations of two of our subsidiaries, Slim and Tone and NuKitchen. Accordingly, the operating results of these discontinued operations have been presented separately from continuing operations for all periods presented.
32
Table of Contents
Overview of the Direct Channel
In the years ended 2011, 2010 and 2009, the direct channel represented 95%, 96% and 94%, respectively, of our revenue. Revenues through the direct channel were $382.8 million in 2011 compared to $490.8 million in 2010 and $495.4 million in 2009. Revenue is primarily generated through customer starts, reactivation of former customers and the customer ordering behavior, including length of time on our program and the diet program selection. The decrease in 2011 is primarily attributable to lower average selling prices, discounted promotional offerings and declines in new customers, on-program revenue and reactivation revenue. Critical to increasing customer starts is our ability to deploy marketing dollars while maintaining marketing effectiveness. Factors influencing our marketing effectiveness include the quality of the advertisements, promotional activity by our competitors, as well as the price and availability of appropriate media.
Year Ended December 31, 2011 Compared to Year Ended December 31, 2010
| Year Ended December 31, | ||||||||||||||||
| 2011 | 2010 | $ Change | % Change | |||||||||||||
| (in thousands) | ||||||||||||||||
| REVENUE |
$ | 401,336 | $ | 509,515 | $ | (108,179 | ) | -21 | % | |||||||
|
|
|
|
|
|
|
|||||||||||
| COSTS AND EXPENSES: |
||||||||||||||||
| Cost of revenue |
198,405 | 224,806 | (26,401 | ) | -12 | % | ||||||||||
| Marketing |
110,922 | 145,868 | (34,946 | ) | -24 | % | ||||||||||
| General and administrative |
60,812 | 73,853 | (13,041 | ) | -18 | % | ||||||||||
| Depreciation and amortization |
12,068 | 11,773 | 295 | 3 | % | |||||||||||
|
|
|
|
|
|
|
|||||||||||
| Total costs and expenses |
382,207 | 456,300 | (74,093 | ) | -16 | % | ||||||||||
|
|
|
|
|
|
|
|||||||||||
| Operating income from continuing operations |
19,129 | 53,215 | (34,086 | ) | -64 | % | ||||||||||
| OTHER EXPENSE |
0 | (32 | ) | 32 | 100 | % | ||||||||||
| INTEREST (EXPENSE) INCOME, net |
(468 | ) | 5 | (473 | ) | -9460 | % | |||||||||
|
|
|
|
|
|
|
|||||||||||
| Income from continuing operations before income taxes |
18,661 | 53,188 | (34,527 | ) | -65 | % | ||||||||||
| INCOME TAXES |
6,400 | 19,309 | (12,909 | ) | -67 | % | ||||||||||
|
|
|
|
|
|
|
|||||||||||
| Income from continuing operations |
12,261 | 33,879 | (21,618 | ) | -64 | % | ||||||||||
| LOSS ON DISCONTINUED OPERATIONS, net |
0 | (242 | ) | 242 | 100 | % | ||||||||||
|
|
|
|
|
|
|
|||||||||||
| Net income |
$ | 12,261 | $ | 33,637 | $ | (21,376 | ) | -64 | % | |||||||
|
|
|
|
|
|
|
|||||||||||
| % of revenue |
||||||||||||||||
| Gross margin |
50.6 | % | 55.9 | % | ||||||||||||
| Marketing |
27.6 | % | 28.6 | % | ||||||||||||
| General and administrative |
15.2 | % | 14.5 | % | ||||||||||||
| Operating income from continuing operations |
4.8 | % | 10.4 | % | ||||||||||||
Revenue. Revenue decreased to $401.4 million in 2011 from $509.5 million in 2010. The revenue decline occurred across all of our sales channels primarily due to lower average selling prices and fewer customer starts and on-program customers as a result of bargain-focused consumer behavior and discounted promotional offerings. In 2011, direct revenue accounted for 95% of total revenue compared to 4% for QVC and 1% for other channels. In 2010, direct revenue accounted for 96% of total revenue compared to 4% for QVC.
Costs and Expenses. Cost of revenue decreased to $198.4 million in 2011 from $224.8 million in 2010. Gross margin as a percent of revenue decreased to 50.6% in 2011 from 55.9% in 2010. The decrease in gross margin was primarily attributable to our promotional pricing and to an increase in the sales of our fresh-frozen food programs, which have a higher cost per sales dollar.
33
Table of Contents
Marketing expense decreased to $110.9 million in 2011 from $145.9 million in 2010. Marketing expense as a percent of revenue decreased to 27.6% in 2011 from 28.6% in 2010. During the beginning of the first quarter of 2011, we experienced significant pressures on response and conversion rates across all sales channels causing a decrease in new customers and directly impacting our marketing efficiency. As a result, we reduced the spending for advertising media but increased our promotional incentives to increase demand and leverage marketing efficiency. Substantially all of the marketing spending in 2011 promoted the direct business. The decrease in marketing is attributable to decreased spending in media ($38.8 million) partially offset by increased spending for the production of television advertising ($3.7 million). In total, media spending was $88.8 million in 2011 and $127.6 million in 2010.
General and administrative expense decreased to $60.8 million in 2011 from $73.9 million in 2010 and as a percent of revenue increased to 15.2% in 2011 from 14.5% in 2010. The decrease was is primarily attributable to lower compensation, benefits and temporary help ($7.8 million), decreased professional and outside computer services ($2.1 million), lower facilities expense ($1.3 million) and decreased non-cash expense for share-based payment arrangements ($1.9 million). We implemented a series of measures, including reductions in headcount and outside professional services during the first quarter of 2011 that resulted in reductions in our general and administrative expenses.
Depreciation and amortization expense increased to $12.1 million in 2011 from $11.8 million in 2010.
Interest (Expense) Income, Net. Interest expense, net, was $468,000 in 2011 compared to interest income, net, of $5,000 in the comparable period of 2010 due to increased average borrowings outstanding during 2011 under our credit facility.
Income Taxes. In 2011, we recorded income tax expense of $6.4 million, which reflects an effective tax rate of 34.3% as compared to $19.3 million of income tax expense in 2010 with an effective tax rate of 36.3%. The change in the effective tax rate was due to the impact of limitations on executive compensation deductions and food donations in comparison to pre-tax income, as well as reductions in tax reserves due to the lapse of the statute of limitations during the fourth quarter of 2011 and tax credits and other miscellaneous adjustments occurring throughout the year.
34
Table of Contents
Year Ended December 31, 2010 Compared to Year Ended December 31, 2009
| Year Ended December 31, | ||||||||||||||||
| 2010 | 2009 | $ Change | % Change | |||||||||||||
| (in thousands) | ||||||||||||||||
| REVENUE |
$ | 509,515 | $ | 524,618 | $ | (15,103 | ) | -3 | % | |||||||
|
|
|
|
|
|
|
|||||||||||
| COSTS AND EXPENSES: |
||||||||||||||||
| Cost of revenue |
224,806 | 241,163 | (16,357 | ) | -7 | % | ||||||||||
| Marketing |
145,868 | 146,426 | (558 | ) | 0 | % | ||||||||||
| General and administrative |
73,853 | 76,418 | (2,565 | ) | -3 | % | ||||||||||
| Depreciation and amortization |
11,773 | 11,177 | 596 | 5 | % | |||||||||||
|
|
|
|
|
|
|
|||||||||||
| Total costs and expenses |
456,300 | 475,184 | (18,884 | ) | -4 | % | ||||||||||
|
|
|
|
|
|
|
|||||||||||
| Operating income from continuing operations |
53,215 | 49,434 | 3,781 | 8 | % | |||||||||||
| OTHER (EXPENSE) INCOME |
(32 | ) | 407 | (439 | ) | -108 | % | |||||||||
| EQUITY AND IMPAIRMENT LOSS |
0 | (4,000 | ) | 4,000 | 100 | % | ||||||||||
| INTEREST INCOME, net |
5 | 104 | (99 | ) | -95 | % | ||||||||||
|
|
|
|
|
|
|
|||||||||||
| Income from continuing operations before income taxes |
53,188 | 45,945 | 7,243 | 16 | % | |||||||||||
| INCOME TAXES |
19,309 | 13,072 | 6,237 | 48 | % | |||||||||||
|
|
|
|
|
|
|
|||||||||||
| Income from continuing operations |
33,879 | 32,873 | 1,006 | 3 | % | |||||||||||
| LOSS ON DISCONTINUED OPERATIONS, net |
(242 | ) | (4,083 | ) | 3,841 | 94 | % | |||||||||
|
|
|
|
|
|
|
|||||||||||
| Net income |
$ | 33,637 | $ | 28,790 | $ | 4,847 | 17 | % | ||||||||
|
|
|
|
|
|
|
|||||||||||
| % of revenue |
||||||||||||||||
| Gross margin |
55.9 | % | 54.0 | % | ||||||||||||
| Marketing |
28.6 | % | 27.9 | % | ||||||||||||
| General and administrative |
14.5 | % | 14.6 | % | ||||||||||||
| Operating income from continuing operations |
10.4 | % | 9.4 | % | ||||||||||||
Revenue. Revenue decreased to $509.5 million in 2010 from $524.6 million in 2009. The revenue decrease resulted primarily from decreased reactivation revenue and a reduction in sales through QVC partially offset by an increase in retail revenue. In 2010, direct revenue accounted for 96% of total revenue compared to 4% for QVC. In 2009, direct revenue accounted for 94% of total revenue compared to 6% for QVC.
Costs and Expenses. Cost of revenue decreased to $224.8 million in 2010, from $241.2 million in 2009. Gross margin as a percent of revenue increased to 55.9% in 2010 from 54.0% in 2009. The increase in gross margin was primarily attributable to a reduced level of returns, the mix of products with higher gross margins and ongoing cost savings initiatives.
Marketing expense decreased to $145.9 million in 2010 from $146.4 million in 2009. Marketing expense as a percent of revenue increased to 28.6% in 2010 from 27.9% in 2009. Substantially all of the marketing spending in 2010 promoted the direct business. The decrease in marketing is attributable to decreased spending in the production of television advertising ($3.2 million). This decrease is partially offset by increased spending in advertising media ($1.5 million) and marketing consulting ($1.4 million). In total, media spending was $127.6 million in 2010 and $126.1 million in 2009.
General and administrative expense decreased to $73.9 million in 2010 from $76.4 million in 2009 and as a percent of revenue decreased to 14.5% in 2010 from 14.6% in 2009. The decrease in spending is primarily attributable to decreased professional, outside and computer services ($3.2 million) due to our focus on cost containment and charges incurred in 2009 to streamline work processes and right size our organization ($1.9 million). These decreases were partially offset by higher compensation and benefits and temporary help ($1.9 million) and increased non-cash expense for share-based payment arrangements ($1.5 million).
35
Table of Contents
Depreciation and amortization expense increased to $11.8 million in 2010 from $11.2 million in 2009 due to the relocation of our corporate headquarters and capital expenditures on our website.
Other (Expense) Income. Other (expense) income represents the impact of changes in the Canadian dollar.
Equity and Impairment Loss. In 2009, we abandoned our interest in Zero Water because the business was no longer aligned with our strategic direction. An equity and impairment loss of $4.0 million was recorded including the write-off of the remaining investment.
Interest Income, Net. Interest income, net decreased to $5,000 in 2010 from $104,000 in 2009 primarily due to borrowings under our credit facility during 2010.
Income Taxes. In 2010, we recorded income tax expense of $19.3 million, which reflects an effective tax rate of 36.3% as compared to $13.1 million of income tax expense in 2009 at an effective tax rate of 28.5%. The increase in the effective tax rate was primarily the result of the abandonment of our investment in Zero Water in 2009 which provided an income tax deduction for the entire original $14.3 million tax basis investment in Zero Water and reduced 2009 income tax payments by approximately $5.0 million.
Contractual Obligations and Commercial Commitments
As of December 31, 2011, our principal commitments consisted of obligations under supply agreements with food vendors, an agreement with our outside fulfillment provider, operating leases and employment contracts. Although we have no material commitments for capital expenditures, we anticipate continuing requirements for capital expenditures.
Following is a summary of our contractual obligations. We have no other commercial commitments.
| Payments Due by Period (in millions) | ||||||||||||||||||||
| Contractual obligations |
Total | Less Than 1 Year |
1-3 Years | 4-5 Years | More Than 5 Years |
|||||||||||||||
| Borrowings under credit facility |
$ | 30.0 | $ | 0 | $ | 0 | $ | 30.0 | $ | 0 | ||||||||||
| Fulfillment and food purchase obligations |
98.4 | 51.8 | 46.1 | 0.5 | 0 | |||||||||||||||
| Operating leases |
33.7 | 3.2 | 6.5 | 6.7 | 17.3 | |||||||||||||||
|
|
|
|
|
|
|
|
|
|
|
|||||||||||
| $ | 162.1 | $ | 55.0 | $ | 52.6 | $ | 37.2 | $ | 17.3 | |||||||||||
|
|
|
|
|
|
|
|
|
|
|
|||||||||||
We have entered into supply agreements with various food vendors. The majority of these agreements provide for annual pricing, annual purchase obligations, as well as exclusivity in the production of certain products, with terms of five years or less. One agreement also provides for certain rebates to us if certain volume thresholds are exceeded. Additionally, we have entered into an agreement with our outside fulfillment provider which contains minimum space requirements. We anticipate that we will meet all annual purchase obligations.
In December 2011, the Company executed an amended and restated credit agreement with a group of lenders that provides for a $100.0 million unsecured revolving credit facility through December 5, 2016. Our previous $200.0 million facility was set to expire in October 2012. We borrowed $30.0 million against this facility during 2011 which was used to repay amounts outstanding under the old facility. The credit agreement provides for interest at either a floating rate, which will be a base rate, or a Eurocurrency rate equal to the London Inter-Bank Offered Rate for the relevant term, plus an applicable margin. We are subject to an unused fee payable quarterly. In 2010, we entered into two separate $10.0 million notional value floating to fixed interest rate swap agreements (“Swaps”) that mature on August 3, 2012 and September 28, 2012, respectively. Under the Swaps, we receive interest equivalent to the three-month LIBOR and pay a fixed rate of interest of 0.75%, with settlements occurring quarterly. In January 2012, we entered into a third $10.0 million notional value interest rate swap for the amended and restated credit agreement.
In addition, we have no off-balance sheet financing arrangements.
36
Table of Contents
Liquidity, Capital Resources and Other Financial Data
The capital and credit markets have become more volatile as a result of the recent global economic conditions, which has caused a general tightening in the credit markets, lower levels of liquidity and increased financing costs. Despite these factors, we believe that available capital resources are sufficient to fund our working capital requirements, capital expenditures, income tax obligations, dividends and share repurchases for the foreseeable future. As our previous credit agreement was set to expire in 2012, we entered into a $100 million amended and restated credit agreement that extended the commitment period and replaced our previous agreement.
At December 31, 2011, we had working capital of $76.2 million, an increase of $2.2 million from the $74.0 million working capital balance at December 31, 2010. Cash and cash equivalents at December 31, 2011 were $47.6 million, an increase of $27.2 million from the balance of $20.4 million at December 31, 2010. In addition, we had $10.0 million invested in marketable securities at December 31, 2011 as compared to $20.8 million at December 31, 2010. Our principal sources of liquidity during this period were cash flows from operations.
We have a $100.0 million unsecured revolving credit facility with a group of lenders which is committed until December 5, 2016 with an expansion feature, subject to certain conditions, to increase the facility to $180.0 million.
In 2011, we generated cash flow of $47.3 million from operating activities, a decrease of $19.3 million from 2010. The decrease in cash flow from operations is primarily attributable to lower net income for 2011 and net changes in operating assets and liabilities primarily driven by inventory balances and the use of supplier advances.
In 2011, net cash provided by investing activities was $2.9 million primarily from the $20.9 million sale of marketable securities reduced by purchases of marketable securities of $10.1 million and capital additions of $8.0 million. We are continuing to invest in our ecommerce and web platform to incorporate new product initiatives.
In 2011, net cash used in financing activities was $23.0 million, a decrease of $45.6 million from 2010. During 2011, we did not repurchase any of our shares of common stock as compared to $75.0 million spent to purchase shares in 2010.
On July 28, 2011, we announced that our Board of Directors had authorized the repurchase of up to $150.0 million of our outstanding shares of common stock in open-market transactions on the NASDAQ Stock Market or through privately negotiated transactions, including block transactions. The timing and actual number of shares repurchased depend on a variety of factors including price, corporate and regulatory requirements, alternative investment opportunities and other market conditions. The stock repurchase program has an expiration date of June 30, 2013 but may be limited or terminated at any time without prior notice.
Our Board of Directors declared quarterly dividends of $0.175 per share, which were paid on March 17, 2011, May 19, 2011, August 18, 2011 and November 25, 2011. Subsequent to December 31, 2011, our Board of Directors declared a quarterly dividend of $0.175 per share payable on March 26, 2012 to stockholders of record as of March 15, 2012. Although we intend to continue to pay regular quarterly dividends, the declaration and payment of future dividends are discretionary and will be subject to quarterly determination by our Board of Directors following its review of our financial performance.
Seasonality
Typically in the weight loss industry, revenue is strongest in the first calendar quarter and lowest in the fourth calendar quarter. We believe our business experiences seasonality, driven by the predisposition of dieters to initiate a diet and the price and availability of certain media.
37
Table of Contents
| ITEM 7A. | QUANTITATIVE AND QUALITATIVE DISCLOSURES ABOUT MARKET RISK |
We have interest-rate risk exposure for changes in interest rates relating to our outstanding borrowings. We manage our exposure to changing interest rates through the use of a combination of variable-rate debt and fixing the interest rate of certain variable-rate debt through the use of interest rate swaps. At December 31, 2011, we had two interest rate swap agreements (the “Swaps”), with notional amounts of $10.0 million each, which mature on August 3, 2012 and September 28, 2012, respectively. Under the Swaps, we receive interest equivalent to the three-month LIBOR and pay a fixed rate of interest of 0.75% with settlements occurring quarterly. In January 2012, we entered into a third $10.0 million notional value interest rate swap for the amended and restated credit agreement. At December 31, 2011, we had $30.0 million of debt outstanding at a weighted average interest rate of 1.26%. A 1 percentage point change in the weighted average rate would affect annual interest by approximately $300,000.
We believe that we are not subject to any material risks arising from changes in foreign currency exchange rates, commodity prices, equity prices or other market changes that affect market risk instruments. Our cash and cash equivalents at December 31, 2011 of $47.6 million were maintained in bank and money market accounts. Additionally, we invested $10.0 million in marketable securities, which are classified as available-for-sale securities and are reported at fair value in the accompanying consolidated balance sheets. As such, a change in interest rates of 1 percentage point would not have a material impact on our operating results and cash flows.
| ITEM 8. | FINANCIAL STATEMENTS AND SUPPLEMENTARY DATA |
The information required by this Item is set forth on pages 42 through 66 hereto and is incorporated by reference herein.
38
Table of Contents
| ITEM 9. | CHANGES IN AND DISAGREEMENTS WITH ACCOUNTANTS ON ACCOUNTING AND FINANCIAL DISCLOSURE |
None.
| ITEM 9A. | CONTROLS AND PROCEDURES |
Disclosure Controls and Procedures
The Securities and Exchange Commission defines the term “disclosure controls and procedures” to mean a company’s controls and other procedures that are designed to ensure that information required to be disclosed in the reports that it files or submits under the Securities Exchange Act of 1934 is recorded, processed, summarized and reported, within the time periods specified in the Securities and Exchange Commission’s rules and forms. Based on the evaluation of the effectiveness of our disclosure controls and procedures by our management, with the participation of our Chief Executive Officer and our Chief Financial Officer, as of the end of the period covered by this report, our Chief Executive Officer and our Chief Financial Officer have concluded that our disclosure controls and procedures at the end of the period covered by this report were effective to ensure that information required to be disclosed in the reports that we file or submit under the Securities Exchange Act of 1934 is (i) recorded, processed, summarized and reported, within the time periods specified in the Commission’s rules and forms, and (ii) accumulated and communicated to our management, including our Chief Executive Officer and Chief Financial Officer, as appropriate to allow timely decisions regarding disclosure.
Management’s Report on Internal Control Over Financial Reporting
Management is responsible for establishing and maintaining adequate internal control over the Company’s financial reporting. Internal control over financial reporting is a process designed to provide reasonable assurance regarding the reliability of the Company’s financial reporting and the preparation of consolidated financial statements for external purposes in accordance with generally accepted accounting principles. Internal control over financial reporting includes policies and procedures that: (i) pertain to maintaining records that, in reasonable detail, accurately and fairly reflect the transactions and dispositions of the assets of the Company; (ii) provide reasonable assurance that transactions are recorded as necessary for preparation of the Company’s financial statements in accordance with generally accepted accounting principles and that the receipts and expenditures of the Company are being made in accordance with management and board of director authorization; and (iii) provide reasonable assurance that unauthorized acquisition, use or disposition of the Company’s assets that could have a material effect on its financial statements would be prevented or detected on a timely basis.
Because of its inherent limitations, internal control over financial reporting may not prevent or detect misstatements. Also, projections of any evaluation of effectiveness to future periods are subject to the risk that controls may become inadequate because of changes in conditions, or that the degree of compliance with the policies or procedures may deteriorate.
There was no change in our internal control over financial reporting that occurred during the most recent fiscal quarter that has materially affected, or is reasonably likely to materially affect, our internal control over financial reporting.
Management evaluated the effectiveness of the Company’s internal control over financial reporting based on the framework in Internal Control – Integrated Framework issued by the Committee of Sponsoring Organizations of the Treadway Commission (“COSO”). Based upon that evaluation, management concluded that the Company’s internal control over financial reporting was effective as of December 31, 2011.
The Company’s independent registered public accounting firm, KPMG LLP, has audited the Company’s internal control over financial reporting as of December 31, 2011. Their report on the effectiveness of the Company’s internal control over financial reporting appears on page 40.
39
Table of Contents
Report of Independent Registered Public Accounting Firm
The Board of Directors and Stockholders
Nutrisystem, Inc.:
We have audited Nutrisystem, Inc.’s internal control over financial reporting as of December 31, 2011, based on criteria established in Internal Control - Integrated Framework issued by the Committee of Sponsoring Organizations of the Treadway Commission (COSO). Nutrisystem, Inc.’s management is responsible for maintaining effective internal control over financial reporting and for its assessment of the effectiveness of internal control over financial reporting, included in the accompanying Management’s Report on Internal Control Over Financial Reporting. Our responsibility is to express an opinion on the Company’s internal control over financial reporting based on our audit.
We conducted our audit in accordance with the standards of the Public Company Accounting Oversight Board (United States). Those standards require that we plan and perform the audit to obtain reasonable assurance about whether effective internal control over financial reporting was maintained in all material respects. Our audit included obtaining an understanding of internal control over financial reporting, assessing the risk that a material weakness exists, and testing and evaluating the design and operating effectiveness of internal control based on the assessed risk. Our audit also included performing such other procedures as we considered necessary in the circumstances. We believe that our audit provides a reasonable basis for our opinion.
A company’s internal control over financial reporting is a process designed to provide reasonable assurance regarding the reliability of financial reporting and the preparation of financial statements for external purposes in accordance with generally accepted accounting principles. A company’s internal control over financial reporting includes those policies and procedures that (1) pertain to the maintenance of records that, in reasonable detail, accurately and fairly reflect the transactions and dispositions of the assets of the company; (2) provide reasonable assurance that transactions are recorded as necessary to permit preparation of financial statements in accordance with generally accepted accounting principles, and that receipts and expenditures of the company are being made only in accordance with authorizations of management and directors of the company; and (3) provide reasonable assurance regarding prevention or timely detection of unauthorized acquisition, use, or disposition of the company’s assets that could have a material effect on the financial statements.
Because of its inherent limitations, internal control over financial reporting may not prevent or detect misstatements. Also, projections of any evaluation of effectiveness to future periods are subject to the risk that controls may become inadequate because of changes in conditions, or that the degree of compliance with the policies or procedures may deteriorate.
In our opinion, Nutrisystem, Inc. maintained, in all material respects, effective internal control over financial reporting as of December 31, 2011, based on criteria established in Internal Control - Integrated Framework issued by the Committee of Sponsoring Organizations of the Treadway Commission.
We also have audited, in accordance with the standards of the Public Company Accounting Oversight Board (United States), the consolidated balance sheets of Nutrisystem, Inc. and subsidiaries as of December 31, 2011 and 2010, and the related consolidated statements of operations, stockholders’ equity and comprehensive income, and cash flows for each of the years in the three-year period ended December 31, 2011, and our report dated March 12, 2012 expressed an unqualified opinion on those consolidated financial statements.
/s/ KPMG LLP
Philadelphia, Pennsylvania
March 12, 2012
40
Table of Contents
| ITEM 9B. | OTHER INFORMATION |
None.
PART III
| ITEM 10. | DIRECTORS, EXECUTIVE OFFICERS AND CORPORATE GOVERNANCE |
The information concerning directors and compliance with Section 16(a) of the Securities Exchange Act of 1934 and our Code of Conduct that applies to our principal executive officer, principal financial officer, principal accounting officer or controller called for by Item 10 of Form 10-K will be set forth under the captions “Election of Directors,” “Section 16(a) Beneficial Ownership Reporting Compliance” and “Code of Conduct” in our definitive proxy statement for the 2012 annual meeting of stockholders, to be filed within 120 days after the end of the fiscal year covered by this annual report on Form 10-K, and is incorporated herein by reference.
The required information as to executive officers is set forth in Part I hereof and is incorporated herein by reference.
| ITEM 11. | EXECUTIVE COMPENSATION |
The information required by Item 11 of Form 10-K is incorporated by reference to the information contained in our definitive proxy statement for the 2012 annual meeting of stockholders.
| ITEM 12. | SECURITY OWNERSHIP OF CERTAIN BENEFICIAL OWNERS AND MANAGEMENT AND RELATED STOCKHOLDER MATTERS |
The information required by Item 12 of Form 10-K is incorporated by reference to the information contained in our definitive proxy statement for the 2012 annual meeting of stockholders.
| ITEM 13. | CERTAIN RELATIONSHIPS AND RELATED TRANSACTIONS, AND DIRECTOR INDEPENDENCE |
The information required by Item 13 of Form 10-K is incorporated by reference to the information contained in our definitive proxy statement for the 2012 annual meeting of stockholders.
| ITEM 14. | PRINCIPAL ACCOUNTING FEES AND SERVICES |
The information required by Item 14 of Form 10-K is incorporated by reference to the information contained in our definitive proxy statement for the 2012 annual meeting of stockholders.
PART IV
| ITEM 15. | EXHIBITS, FINANCIAL STATEMENT SCHEDULES |
(a) 1. Financial Statements
See Index to the Consolidated Financial Statements on page 42 of this Annual Report.
| 2. | Financial Statement Schedules |
None, as all information required in these schedules is included in the Notes to the Consolidated Financial Statements.
| 3. | Exhibits |
Reference is made to the Exhibit Index on page 67 of this Annual Report for a list of exhibits required by Item 601 of Regulation S-K to be filed as part of this Annual Report.
41
Table of Contents
NUTRISYSTEM, INC. AND SUBSIDIARIES
INDEX TO CONSOLIDATED FINANCIAL STATEMENTS
42
Table of Contents
Report of Independent Registered Public Accounting Firm
The Board of Directors and Stockholders
Nutrisystem, Inc.:
We have audited the accompanying consolidated balance sheets of Nutrisystem, Inc. and subsidiaries (the Company) as of December 31, 2011 and 2010, and the related consolidated statements of operations, stockholders’ equity and comprehensive income, and cash flows for each of the years in the three-year period ended December 31, 2011. These consolidated financial statements are the responsibility of the Company’s management. Our responsibility is to express an opinion on these consolidated financial statements based on our audits.
We conducted our audits in accordance with the standards of the Public Company Accounting Oversight Board (United States). Those standards require that we plan and perform the audit to obtain reasonable assurance about whether the financial statements are free of material misstatement. An audit includes examining, on a test basis, evidence supporting the amounts and disclosures in the financial statements. An audit also includes assessing the accounting principles used and significant estimates made by management, as well as evaluating the overall financial statement presentation. We believe that our audits provide a reasonable basis for our opinion.
In our opinion, the consolidated financial statements referred to above present fairly, in all material respects, the financial position of Nutrisystem, Inc. and subsidiaries as of December 31, 2011 and 2010, and the results of their operations and their cash flows for each of the years in the three-year period ended December 31, 2011, in conformity with U.S. generally accepted accounting principles.
We also have audited, in accordance with the standards of the Public Company Accounting Oversight Board (United States), Nutrisystem, Inc.’s internal control over financial reporting as of December 31, 2011, based on criteria established in Internal Control—Integrated Framework issued by the Committee of Sponsoring Organizations of the Treadway Commission (COSO), and our report dated March 12, 2012 expressed an unqualified opinion on the effectiveness of the Company’s internal control over financial reporting.
/s/ KPMG LLP
Philadelphia, Pennsylvania
March 12, 2012
43
Table of Contents
NUTRISYSTEM, INC. AND SUBSIDIARIES
(In thousands, except share and per share amounts)
| December 31, | ||||||||
| 2011 | 2010 | |||||||
| ASSETS |
||||||||
| CURRENT ASSETS: |
||||||||
| Cash and cash equivalents |
$ | 47,594 | $ | 20,376 | ||||
| Marketable securities |
10,013 | 20,843 | ||||||
| Receivables |
11,198 | 9,256 | ||||||
| Inventories, net |
31,514 | 28,747 | ||||||
| Prepaid income taxes |
3,350 | 5,513 | ||||||
| Deferred income taxes |
1,584 | 1,854 | ||||||
| Supplier advances |
2,637 | 15,240 | ||||||
| Other current assets |
9,011 | 11,855 | ||||||
|
|
|
|
|
|||||
| Total current assets |
116,901 | 113,684 | ||||||
| FIXED ASSETS, net |
29,771 | 34,324 | ||||||
| OTHER ASSETS |
3,682 | 1,945 | ||||||
|
|
|
|
|
|||||
| $ | 150,354 | $ | 149,953 | |||||
|
|
|
|
|
|||||
| LIABILITIES AND STOCKHOLDERS’ EQUITY |
||||||||
| CURRENT LIABILITIES: |
||||||||
| Accounts payable |
$ | 32,581 | $ | 26,435 | ||||
| Accrued payroll and related benefits |
679 | 4,874 | ||||||
| Deferred revenue |
2,916 | 4,488 | ||||||
| Other accrued expenses and current liabilities |
4,486 | 3,867 | ||||||
|
|
|
|
|
|||||
| Total current liabilities |
40,662 | 39,664 | ||||||
| BORROWINGS UNDER CREDIT FACILITY |
30,000 | 30,000 | ||||||
| NON-CURRENT LIABILITIES |
4,734 | 5,313 | ||||||
|
|
|
|
|
|||||
| Total liabilities |
75,396 | 74,977 | ||||||
|
|
|
|
|
|||||
| COMMITMENTS AND CONTINGENCIES (Note 9) |
||||||||
| STOCKHOLDERS’ EQUITY: |
||||||||
| Preferred stock, $.001 par value (5,000,000 shares authorized, no shares issued and outstanding) |
0 | 0 | ||||||
| Common stock, $.001 par value (100,000,000 shares authorized; shares issued and outstanding – 28,180,705 at December 31, 2011 and 28,099,812 at December 31, 2010) |
28 | 28 | ||||||
| Additional paid-in capital |
10,091 | 3,088 | ||||||
| Retained earnings |
64,931 | 71,988 | ||||||
| Accumulated other comprehensive loss |
(92 | ) | (128 | ) | ||||
|
|
|
|
|
|||||
| Total stockholders’ equity |
74,958 | 74,976 | ||||||
|
|
|
|
|
|||||
| $ | 150,354 | $ | 149,953 | |||||
|
|
|
|
|
|||||
The accompanying notes are an integral part of these consolidated financial statements.
44
Table of Contents
NUTRISYSTEM, INC. AND SUBSIDIARIES
CONSOLIDATED STATEMENTS OF OPERATIONS
(In thousands, except per share amounts)
| Year Ended December 31, | ||||||||||||
| 2011 | 2010 | 2009 | ||||||||||
| REVENUE |
$ | 401,336 | $ | 509,515 | $ | 524,618 | ||||||
|
|
|
|
|
|
|
|||||||
| COSTS AND EXPENSES: |
||||||||||||
| Cost of revenue |
198,405 | 224,806 | 241,163 | |||||||||
| Marketing |
110,922 | 145,868 | 146,426 | |||||||||
| General and administrative |
60,812 | 73,853 | 76,418 | |||||||||
| Depreciation and amortization |
12,068 | 11,773 | 11,177 | |||||||||
|
|
|
|
|
|
|
|||||||
| Total costs and expenses |
382,207 | 456,300 | 475,184 | |||||||||
|
|
|
|
|
|
|
|||||||
| Operating income from continuing operations |
19,129 | 53,215 | 49,434 | |||||||||
| OTHER (EXPENSE) INCOME |
0 | (32 | ) | 407 | ||||||||
| EQUITY AND IMPAIRMENT LOSS (Note 7) |
0 | 0 | (4,000 | ) | ||||||||
| INTEREST (EXPENSE) INCOME, net |
(468 | ) | 5 | 104 | ||||||||
|
|
|
|
|
|
|
|||||||
| Income from continuing operations before income taxes |
18,661 | 53,188 | 45,945 | |||||||||
| INCOME TAXES |
6,400 | 19,309 | 13,072 | |||||||||
|
|
|
|
|
|
|
|||||||
| Income from continuing operations |
12,261 | 33,879 | 32,873 | |||||||||
|
|
|
|
|
|
|
|||||||
| DISCONTINUED OPERATIONS (Note 12): |
||||||||||||
| Loss on discontinued operations, net of income tax benefit of $566 in 2010 and $2,398 in 2009 |
0 | (242 | ) | (4,083 | ) | |||||||
|
|
|
|
|
|
|
|||||||
| Net income |
$ | 12,261 | $ | 33,637 | $ | 28,790 | ||||||
|
|
|
|
|
|
|
|||||||
| BASIC INCOME PER COMMON SHARE: |
||||||||||||
| Income from continuing operations |
$ | 0.44 | $ | 1.14 | $ | 1.07 | ||||||
| Loss on discontinued operations |
0.00 | (0.01 | ) | (0.14 | ) | |||||||
|
|
|
|
|
|
|
|||||||
| Net income |
$ | 0.44 | $ | 1.13 | $ | 0.93 | ||||||
|
|
|
|
|
|
|
|||||||
| DILUTED INCOME PER COMMON SHARE: |
||||||||||||
| Income from continuing operations |
$ | 0.43 | $ | 1.13 | $ | 1.06 | ||||||
| Loss on discontinued operations |
0.00 | (0.01 | ) | (0.14 | ) | |||||||
|
|
|
|
|
|
|
|||||||
| Net income |
$ | 0.43 | $ | 1.12 | $ | 0.92 | ||||||
|
|
|
|
|
|
|
|||||||
| WEIGHTED AVERAGE SHARES OUTSTANDING: |
||||||||||||
| Basic |
27,033 | 28,312 | 29,458 | |||||||||
| Diluted |
27,325 | 28,686 | 29,769 | |||||||||
| Dividends declared per common share |
$ | 0.70 | $ | 0.70 | $ | 0.70 | ||||||
|
|
|
|
|
|
|
|||||||
The accompanying notes are an integral part of these consolidated financial statements.
45
Table of Contents
NUTRISYSTEM, INC. AND SUBSIDIARIES
CONSOLIDATED STATEMENTS OF STOCKHOLDERS’ EQUITY AND COMPREHENSIVE INCOME
(In thousands, except share amounts)
| Common Shares |
Common Stock |
Additional Paid-in Capital |
Retained Earnings |
Accumulated Other Comprehensive (Loss) Income |
Total | |||||||||||||||||||
| BALANCE, January 1, 2009 |
30,784,920 | $ | 31 | $ | 0 | $ | 115,769 | $ | 25 | $ | 115,825 | |||||||||||||
| Net income |
0 | 0 | 0 | 28,790 | 0 | 28,790 | ||||||||||||||||||
| Foreign currency translation adjustment |
0 | 0 | 0 | 0 | (96 | ) | (96 | ) | ||||||||||||||||
| Unrealized loss on marketable securities, net of tax |
0 | 0 | 0 | 0 | (13 | ) | (13 | ) | ||||||||||||||||
|
|
|
|||||||||||||||||||||||
| Total comprehensive income |
28,681 | |||||||||||||||||||||||
| Share-based expense, net |
171,758 | 0 | 7,704 | 0 | 0 | 7,704 | ||||||||||||||||||
| Exercise of stock options |
119,806 | 0 | 563 | 0 | 0 | 563 | ||||||||||||||||||
| Equity compensation awards, net |
0 | 0 | (450 | ) | 0 | 0 | (450 | ) | ||||||||||||||||
| Cash dividends |
0 | 0 | 0 | (21,421 | ) | 0 | (21,421 | ) | ||||||||||||||||
| Purchase and retirement of common shares |
(132,200 | ) | 0 | (1,302 | ) | (637 | ) | 0 | (1,939 | ) | ||||||||||||||
|
|
|
|
|
|
|
|
|
|
|
|
|
|||||||||||||
| BALANCE, December 31, 2009 |
30,944,284 | 31 | 6,515 | 122,501 | (84 | ) | 128,963 | |||||||||||||||||
| Net income |
0 | 0 | 0 | 33,637 | 0 | 33,637 | ||||||||||||||||||
| Foreign currency translation adjustment |
0 | 0 | 0 | 0 | (3 | ) | (3 | ) | ||||||||||||||||
| Unrealized loss on marketable securities, net of tax |
0 | 0 | 0 | 0 | (13 | ) | (13 | ) | ||||||||||||||||
| Unrealized loss on interest rate swaps, net of tax |
0 | 0 | 0 | 0 | (28 | ) | (28 | ) | ||||||||||||||||
|
|
|
|||||||||||||||||||||||
| Total comprehensive income |
33,593 | |||||||||||||||||||||||
| Share-based expense, net |
371,030 | 0 | 7,537 | 0 | 0 | 7,537 | ||||||||||||||||||
| Exercise of stock options |
54,927 | 0 | 124 | 0 | 0 | 124 | ||||||||||||||||||
| Equity compensation awards, net |
0 | 0 | 418 | 0 | 0 | 418 | ||||||||||||||||||
| Cash dividends |
0 | 0 | 0 | (20,662 | ) | 0 | (20,662 | ) | ||||||||||||||||
| Purchase and retirement of common shares |
(3,270,429 | ) | (3 | ) | (11,506 | ) | (63,488 | ) | 0 | (74,997 | ) | |||||||||||||
|
|
|
|
|
|
|
|
|
|
|
|
|
|||||||||||||
| BALANCE, December 31, 2010 |
28,099,812 | 28 | 3,088 | 71,988 | (128 | ) | 74,976 | |||||||||||||||||
| Net income |
0 | 0 | 0 | 12,261 | 0 | 12,261 | ||||||||||||||||||
| Foreign currency translation adjustment |
0 | 0 | 0 | 0 | (4 | ) | (4 | ) | ||||||||||||||||
| Loss recognized on sales of marketable securities, net of tax |
0 | 0 | 0 | 0 | 26 | 26 | ||||||||||||||||||
| Unrealized gain on interest rate swaps, net of tax |
0 | 0 | 0 | 0 | 14 | 14 | ||||||||||||||||||
|
|
|
|||||||||||||||||||||||
| Total comprehensive income |
12,297 | |||||||||||||||||||||||
| Share-based compensation expense, net |
55,892 | 0 | 7,793 | 0 | 0 | 7,793 | ||||||||||||||||||
| Exercise of stock options |
25,001 | 0 | 129 | 0 | 0 | 129 | ||||||||||||||||||
| Equity compensation awards, net |
0 | 0 | (919 | ) | 0 | 0 | (919 | ) | ||||||||||||||||
| Cash dividends |
0 | 0 | 0 | (19,318 | ) | 0 | (19,318 | ) | ||||||||||||||||
|
|
|
|
|
|
|
|
|
|
|
|
|
|||||||||||||
| BALANCE, December 31, 2011 |
28,180,705 | $ | 28 | $ | 10,091 | $ | 64,931 | $ | (92 | ) | $ | 74,958 | ||||||||||||
|
|
|
|
|
|
|
|
|
|
|
|
|
|||||||||||||
The accompanying notes are an integral part of these consolidated financial statements.
46
Table of Contents
NUTRISYSTEM, INC. AND SUBSIDIARIES
CONSOLIDATED STATEMENTS OF CASH FLOWS
(In thousands)
| Year Ended December 31, | ||||||||||||
| 2011 | 2010 | 2009 | ||||||||||
| CASH FLOWS FROM OPERATING ACTIVITIES: |
||||||||||||
| Net income |
$ | 12,261 | $ | 33,637 | $ | 28,790 | ||||||
| Adjustments to reconcile net income to net cash provided by operating activities: |
||||||||||||
| Loss on discontinued operations |
0 | 242 | 4,083 | |||||||||
| Depreciation and amortization |
12,068 | 11,773 | 11,177 | |||||||||
| (Gain) loss on disposal of fixed assets |
(62 | ) | 120 | 113 | ||||||||
| Share–based compensation expense |
9,758 | 10,951 | 9,382 | |||||||||
| Deferred income tax (benefit) expense |
(384 | ) | 4,118 | (2,531 | ) | |||||||
| Equity and impairment loss |
0 | 0 | 4,000 | |||||||||
| Realized loss on sales of marketable securities |
34 | 0 | 0 | |||||||||
| Changes in operating assets and liabilities: |
||||||||||||
| Receivables |
(1,942 | ) | 3,682 | 4,308 | ||||||||
| Inventories, net |
(2,767 | ) | 23,265 | (929 | ) | |||||||
| Supplier advances |
12,333 | (15,240 | ) | 0 | ||||||||
| Other assets |
2,980 | (1,086 | ) | (2,499 | ) | |||||||
| Accounts payable |
6,777 | (6,766 | ) | 1,221 | ||||||||
| Accrued payroll and related benefits |
(4,195 | ) | 3,784 | (1,029 | ) | |||||||
| Deferred revenue |
(1,572 | ) | 778 | (1,125 | ) | |||||||
| Income taxes |
2,151 | (2,525 | ) | 2,475 | ||||||||
| Other accrued expenses and liabilities |
(111 | ) | 200 | (824 | ) | |||||||
|
|
|
|
|
|
|
|||||||
| Net cash provided by operating activities of continuing operations |
47,329 | 66,933 | 56,612 | |||||||||
| Net cash (used in) provided by operating activities of discontinued operations |
0 | (316 | ) | 852 | ||||||||
|
|
|
|
|
|
|
|||||||
| Net cash provided by operating activities |
47,329 | 66,617 | 57,464 | |||||||||
|
|
|
|
|
|
|
|||||||
| CASH FLOWS FROM INVESTING ACTIVITIES: |
||||||||||||
| Purchases of marketable securities |
(10,067 | ) | (540 | ) | (30,344 | ) | ||||||
| Proceeds from sales of marketable securities |
20,897 | 10,000 | 0 | |||||||||
| Capital additions |
(8,041 | ) | (19,594 | ) | (8,184 | ) | ||||||
| Proceeds from the sale of fixed assets |
122 | 22 | 125 | |||||||||
|
|
|
|
|
|
|
|||||||
| Net cash provided by (used in) investing activities of continuing operations |
2,911 | (10,112 | ) | (38,403 | ) | |||||||
| Net cash provided by (used in) investing activities of discontinued operations |
0 | 112 | (168 | ) | ||||||||
|
|
|
|
|
|
|
|||||||
| Net cash provided by (used in) investing activities |
2,911 | (10,000 | ) | (38,571 | ) | |||||||
|
|
|
|
|
|
|
|||||||
| CASH FLOWS FROM FINANCING ACTIVITIES: |
||||||||||||
| Borrowings under credit facility |
30,000 | 30,000 | 0 | |||||||||
| Repayments of borrowings under credit facility |
(30,000 | ) | 0 | 0 | ||||||||
| Debt issuance costs |
(991 | ) | 0 | 0 | ||||||||
| Exercise of stock options |
129 | 124 | 563 | |||||||||
| Taxes related to equity compensation awards, net |
(2,842 | ) | (3,079 | ) | (2,170 | ) | ||||||
| Repurchase and retirement of common stock |
0 | (74,997 | ) | (1,939 | ) | |||||||
| Payment of dividends |
(19,318 | ) | (20,662 | ) | (21,421 | ) | ||||||
|
|
|
|
|
|
|
|||||||
| Net cash used in financing activities |
(23,022 | ) | (68,614 | ) | (24,967 | ) | ||||||
|
|
|
|
|
|
|
|||||||
| Effect of exchange rate changes on cash and cash equivalents |
0 | 9 | (193 | ) | ||||||||
| NET INCREASE (DECREASE) IN CASH AND CASH EQUIVALENTS |
27,218 | (11,988 | ) | (6,267 | ) | |||||||
| CASH AND CASH EQUIVALENTS, beginning of year |
20,376 | 32,364 | 38,631 | |||||||||
| CASH AND CASH EQUIVALENTS, end of year |
47,594 | 20,376 | 32,364 | |||||||||
|
|
|
|
|
|
|
|||||||
| LESS CASH AND CASH EQUIVALENTS OF DISCONTINUED OPERATIONS, end of year |
0 | 0 | 166 | |||||||||
|
|
|
|
|
|
|
|||||||
| CASH AND CASH EQUIVALENTS OF CONTINUING OPERATIONS, end of year |
$ | 47,594 | $ | 20,376 | $ | 32,198 | ||||||
|
|
|
|
|
|
|
|||||||
The accompanying notes are an integral part of these consolidated financial statements.
47
Table of Contents
NUTRISYSTEM, INC. AND SUBSIDIARIES
NOTES TO CONSOLIDATED FINANCIAL STATEMENTS
(In thousands, except share and per share amounts)
| 1. | BACKGROUND |
Nature of the Business
Nutrisystem, Inc. (the “Company” or “Nutrisystem”), a provider of weight management products and services, offers nutritionally balanced weight loss programs designed for women, men, and seniors, as well as the Nutrisystem® D® program, specifically designed to help people with type 2 diabetes who want to lose weight and manage their diabetes. The Nutrisystem® programs are based on 40 years of nutrition research and on the science of the low glycemic index. The Company’s pre-packaged foods are sold directly to weight loss program participants primarily through the Internet and telephone (including the redemption of prepaid program cards), referred to as the direct channel, and through QVC, a television shopping network. Approximately 99%, 98% and 98% of revenues for the years ended December 31, 2011, 2010 and 2009, respectively, were generated in the United States.
| 2. | SUMMARY OF SIGNIFICANT ACCOUNTING POLICIES |
Presentation of Financial Statements
The Company’s consolidated financial statements include 100% of the assets and liabilities of Nutrisystem, Inc. and its wholly owned subsidiaries. All significant intercompany accounts and transactions have been eliminated.
Cash Equivalents and Marketable Securities
Cash equivalents include only securities having a maturity of three months or less at the time of purchase. At December 31, 2011 and December 31, 2010, demand accounts and money market accounts comprised all of the Company’s cash and cash equivalents.
Marketable securities at December 31, 2011 consist of investments in an income fund that principally holds short-term municipal securities of the U.S. and at December 31, 2010 consisted of investments in a bond fund that held short-term U.S. government securities with original maturities of greater than three months. The Company classifies these as available-for-sale securities. The marketable securities are reported at fair value with the related unrealized gains and losses included in accumulated other comprehensive loss, a component of stockholders’ equity, net of related tax effects.
The Company evaluates its investments for other-than-temporary impairment by reviewing factors such as the length of time and extent to which fair value has been below cost basis and the Company’s ability and intent to hold the investment for a period of time which may be sufficient for anticipated recovery of the market value. There were no other-than-temporary impairments in 2011 or 2010.
Inventories
Inventories consist principally of packaged food held in outside fulfillment locations. Inventories are valued at the lower of cost or market, with cost determined using the first-in, first-out (FIFO) method. Quantities of inventory on hand are continually assessed to identify excess or obsolete inventory and a provision is recorded for any estimated loss. The reserve is estimated for excess and obsolete inventory based primarily on forecasted demand and/or the Company’s ability to sell the products, introduction of new products, future production requirements and changes in customers’ behavior. The reserve for excess and obsolete inventory was $769 and $419 at December 31, 2011 and 2010, respectively.
48
Table of Contents
Fixed Assets
Fixed assets are stated at cost. Depreciation is provided using the straight-line method over the estimated useful lives of the related assets, which are generally two to seven years. Leasehold improvements are amortized on a straight-line basis over the lesser of the estimated useful life of the asset or the related lease term. Expenditures for repairs and maintenance are charged to expense as incurred, while major renewals and improvements are capitalized.
Included in fixed assets is the capitalized cost of internal-use software and website development incurred during the application development stage. Capitalized costs are amortized using the straight-line method over the estimated useful life of the asset, which is generally two to five years. Costs incurred related to planning or maintenance of internal-use software and website development are charged to expense as incurred. The net book value of capitalized software was $10,285 and $12,845 at December 31, 2011 and 2010, respectively.
Long-Lived Assets
The Company continually evaluates whether events or circumstances have occurred that would indicate that the remaining estimated useful lives of long-lived assets may warrant revision or that the remaining balance may not be recoverable. Long-lived assets are evaluated for indicators of impairment. When factors indicate that long-lived assets should be evaluated for possible impairment, an estimate of the related undiscounted cash flows over the remaining life of the long-lived assets is used to measure recoverability. If any impairment is indicated, measurement of the impairment will be based on the difference between the carrying value and fair value of the asset, generally determined based on the present value of expected future cash flows associated with the use of the asset. As of December 31, 2011, management believes that no reductions to the remaining useful lives or write-downs of long-lived assets are required.
Foreign Currency Translation
The functional currency of the Company’s Canadian subsidiary, which has been legally dissolved, was the Canadian dollar. Assets and liabilities were translated into U.S. dollars at exchange rates as of the financial statement date and revenues and expenses were translated at average exchange rates prevailing during the respective periods. Translation adjustments were included as a separate component of accumulated other comprehensive loss in stockholders’ equity in the accompanying consolidated balance sheets. Gains and losses from foreign currency transactions were recognized as other (expense) income in the accompanying consolidated statements of operations and were $0 in 2011, $32 of expense in 2010 and $407 of income in 2009.
Derivative Instruments
Interest rate swap agreements, a type of financial derivative instrument, are utilized by the Company to reduce interest rate risk on credit facility borrowings. The Company recognizes the interest rate swaps in the accompanying consolidated balance sheets at fair value. The Company has designated and accounted for its interest rate swaps as cash flow hedges of variable-rate debt. The effective portion of the gain or loss on the derivative is reported as a component of accumulated other comprehensive income (loss) in stockholders’ equity in the accompanying consolidated balance sheets, net of tax, and reclassified into earnings in the periods during which the hedged transactions affect earnings. To the extent that the change in value of the derivative does not perfectly offset the change in value of the items being hedged, that ineffective portion is immediately recognized in earnings.
Revenue Recognition
Revenue from product sales is recognized when the earnings process is complete, which is upon transfer of title to the product. Recognition of revenue upon shipment meets the revenue recognition criteria in that persuasive
49
Table of Contents
evidence of an arrangement exists, delivery has occurred, the selling price is fixed and determinable and collection is reasonably assured. The Company also sells prepaid program cards to wholesalers and retailers. Revenue from these cards is recognized after the card is redeemed online at the Company’s website by the customer and the product is shipped to the customer.
Deferred revenue consists primarily of unredeemed prepaid program cards and unshipped frozen foods. When a customer orders the Nutrisystem® Select® program, two separate shipments are delivered. The first shipment contains Nutrisystem’s standard shelf-stable food. The second shipment contains the fresh-frozen foods and is generally delivered within two weeks of a customer’s order. Both shipments qualify as separate units of accounting and the fair value is based on the estimated selling price of both units.
Customers may return unopened product within 30 days of purchase in order to receive a refund or credit. Fresh-frozen products are non-returnable and non-refundable unless the order is canceled within seven days of delivery. Estimated returns are accrued at the time the sale is recognized and actual returns are tracked monthly. The Company reviews its history of actual versus estimated returns to ensure reserves are appropriate.
Revenue from product sales includes amounts billed for shipping and handling and is presented net of returns and billed sales tax. Revenue from shipping and handling charges was $2,867, $5,763 and $5,193 in 2011, 2010 and 2009, respectively. Shipping-related costs are included in cost of revenue in the accompanying consolidated statements of operations.
Dependence on Suppliers
In 2011, approximately 16% and 15%, respectively, of inventory purchases were from two suppliers. The Company has a supply arrangement with one of these vendors that requires the Company to make minimum purchases. In 2010, these vendors supplied approximately 17% and 18%, respectively, of inventory purchases and in 2009, approximately 19% and 18%, respectively, of total purchases (see Note 9). Additionally, the Company was dependent on one frozen food supplier for less than 20% of its food costs in 2011. The amount provided from this supplier in 2010 was negligible. The Company had a supply agreement with this supplier that expired in November 2011 and the Company has found other frozen food supply options to replace this supplier.
During 2011 and 2010, the Company outsourced 100% of its fulfillment operations to third party providers. During 2009, more than 85% of its fulfillment operations were handled by third party providers.
Vendor Rebates
One of the Company’s suppliers provides for rebates based on purchasing levels. The Company accounts for this rebate on an accrual basis as purchases are made at a rebate percent determined based upon the estimated total purchases from the vendor. The estimated rebate is recorded as a reduction in the carrying value of purchased inventory and is reflected in the consolidated statements of operations when the associated inventory is sold. A receivable is recorded for the estimate of the rebate earned. The rebate period is June 1 through May 31 of each year. For the years ended December 31, 2011, 2010 and 2009, the Company reduced cost of revenue by $1,401, $1,912 and $2,316, respectively, for these rebates. A receivable of $686 and $541 at December 31, 2011 and 2010, respectively, has been recorded in receivables in the accompanying consolidated balance sheets. Historically, the actual rebate received from the vendor has closely matched the estimated rebate recorded. An adjustment is made to the estimate upon determination of the final rebate.
Marketing Expense
Marketing expense includes media, advertising production, marketing and promotional expenses and payroll-related expenses, including share-based payment arrangements, for personnel engaged in these activities. Media expense was $88,828, $127,597 and $126,117 in 2011, 2010 and 2009, respectively. Direct-mail advertising
50
Table of Contents
costs are capitalized if the primary purpose was to elicit sales to customers who could be shown to have responded specifically to the direct mailing and results in probable future economic benefits. The capitalized costs are amortized to expense over the period during which the future benefits are expected to be received. Typically, this period falls within 40 days of the initial direct mailing. All other advertising costs are charged to expense as incurred or the first time the advertising takes place. At December 31, 2011 and 2010, $4,800 and $7,152, respectively, of costs have been prepaid for future advertisements and promotions.
Lease Related Expenses
Certain of the Company’s lease contracts contain rent holidays, various escalation clauses, or landlord/tenant incentives. The Company records rental costs, including costs related to fixed rent escalation clauses and rent holidays, on a straight-line basis over the lease term. Lease allowances utilized for space improvement are recorded as leasehold improvement assets and amortized over the shorter of the economic useful life of the asset or the lease term. Tenant lease incentive allowances received are recorded as deferred rent and amortized as reductions to rent expense over the lease term. Included in the accompanying consolidated balance sheets is $3,646 of a tenant improvement allowance at December 31, 2011, of which $345 is included in other accrued expenses and current liabilities and $3,301 in non-current liabilities. At December 31, 2010, the tenant improvement allowance was $3,991, of which $345 is included in other accrued expenses and current liabilities and $3,646 in non-current liabilities.
Income Taxes
Deferred tax assets and liabilities are recognized for the future tax consequences attributable to differences between the financial statement carrying amounts of existing assets and liabilities and the respective tax bases and operating loss and tax credit carryforwards. Deferred tax assets and liabilities are measured using enacted tax rates expected to apply to taxable income in the years in which those temporary differences are expected to be recovered or settled. The effect on deferred tax assets and liabilities of a change in tax rates is recognized in the consolidated statements of operations in the period that includes the enactment date. In assessing the ability to realize deferred tax assets, the Company considers whether it is more likely than not that some portion or all of the deferred tax assets will not be realized.
A tax benefit from an uncertain tax position may be recognized only if it is “more likely than not” that the position is sustainable, based on its technical merits. The tax benefit of a qualifying position is the largest amount of tax benefit that is greater than 50% likely of being realized upon settlement with a taxing authority having full knowledge of all relevant information. The liability for unrecognized tax benefits is classified as noncurrent unless the liability is expected to be settled in cash within 12 months of the reporting date. The Company records accrued interest and penalties related to unrecognized tax benefits as part of interest expense.
Segment Information
The Company is managed and operated as one business. The entire business is managed by a single management team that reports to the chief executive officer. Revenue consists primarily of food sales.
51
Table of Contents
Earnings Per Share
The Company uses the two-class method to calculate earnings per share (“EPS”) as the unvested restricted stock issued under the Company’s equity incentive plans are participating shares with nonforfeitable rights to dividends. Under the two-class method, earnings per common share are computed by dividing the sum of distributed earnings to common stockholders and undistributed earnings allocated to common stockholders by the weighted average number of common shares outstanding for the period. In applying the two-class method, undistributed earnings are allocated to both common shares and participating securities based on the number of weighted average shares outstanding during the period. The following table sets forth the computation of basic and diluted EPS:
| Year Ended December 31, | ||||||||||||
| 2011 | 2010 | 2009 | ||||||||||
| Income from continuing operations |
$ | 12,261 | $ | 33,879 | $ | 32,873 | ||||||
| Income allocated to unvested restricted stock |
(460 | ) | (1,620 | ) | (1,436 | ) | ||||||
|
|
|
|
|
|
|
|||||||
| Income from continuing operations allocated to common shares |
11,801 | 32,259 | 31,437 | |||||||||
| Loss on discontinued operations allocated to common shares |
0 | (231 | ) | (3,924 | ) | |||||||
|
|
|
|
|
|
|
|||||||
| Net income allocated to common shares |
$ | 11,801 | $ | 32,028 | $ | 27,513 | ||||||
|
|
|
|
|
|
|
|||||||
| Weighted average shares outstanding: |
||||||||||||
| Basic |
27,033 | 28,312 | 29,458 | |||||||||
| Effect of dilutive securities |
292 | 374 | 311 | |||||||||
|
|
|
|
|
|
|
|||||||
| Diluted |
27,325 | 28,686 | 29,769 | |||||||||
|
|
|
|
|
|
|
|||||||
| Basic income per common share: |
||||||||||||
| Income from continuing operations |
$ | 0.44 | $ | 1.14 | $ | 1.07 | ||||||
| Loss on discontinued operations |
0.00 | (0.01 | ) | (0.14 | ) | |||||||
|
|
|
|
|
|
|
|||||||
| Net income |
$ | 0.44 | $ | 1.13 | $ | 0.93 | ||||||
|
|
|
|
|
|
|
|||||||
| Diluted income per common share: |
||||||||||||
| Income from continuing operations |
$ | 0.43 | $ | 1.13 | $ | 1.06 | ||||||
| Loss on discontinued operations |
0.00 | (0.01 | ) | (0.14 | ) | |||||||
|
|
|
|
|
|
|
|||||||
| Net income |
$ | 0 .43 | $ | 1.12 | $ | 0.92 | ||||||
|
|
|
|
|
|
|
|||||||
In 2011, 2010 and 2009, common stock equivalents representing 656,871, 167,158 and 527,891 shares of common stock, respectively, were excluded from weighted average shares outstanding for diluted income per common share purposes because the effect would be anti-dilutive.
Share-Based Payment Awards
The cost of all share-based awards to employees and non-employees, including grants of stock options, restricted stock and restricted stock units, is recognized in the financial statements based on the fair value of the awards at grant date. The fair value of stock option awards is determined using the Black-Scholes valuation model on the date of grant. The fair value of restricted stock and restricted stock unit awards is equal to the market price of the Company’s common stock on the date of grant.
The fair value of share-based awards is recognized on a straight-line basis over the requisite service period, net of estimated forfeitures. The Company relies primarily upon historical experience to estimate expected forfeitures and recognizes compensation expense on a straight-line basis from the date of grant. The Company issues new shares upon exercise of stock options or vesting of restricted stock or restricted stock units.
52
Table of Contents
Cash Flow Information
The Company made payments for income taxes of $6,049, $16,660 and $11,449 in 2011, 2010, and 2009, respectively. Interest payments in 2011, 2010 and 2009 were $655, $283 and $304, respectively. During 2011, the Company had non-cash capital additions of $1,198 of unpaid invoices in accounts payable and accrued expenses. During 2010, the Company had non-cash capital additions of $3,991 through a tenant improvement allowance and $1,664 of unpaid invoices in accounts payable and accrued expenses.
Recently Issued Accounting Pronouncements
Accounting Standards Update No. 2011-05 – “Comprehensive Income (Topic 220): Presentation of Comprehensive Income” (“ASU No. 2011-05”) amends existing guidance by allowing only two options for presenting the components of net income and other comprehensive income: (1) in a single continuous financial statement, statement of comprehensive income or (2) in two separate but consecutive financial statements, consisting of an income statement followed by a separate statement of other comprehensive income. ASU No. 2011-05 requires retrospective application, and it is effective for fiscal years, and interim periods within those years, beginning after December 15, 2011, with early adoption permitted. The Company believes the adoption of this update will change the order in which certain financial statements are presented and provide additional detail on those financial statements when applicable, but will not have any other impact on its consolidated financial position or results of operations.
Use of Estimates
The preparation of financial statements in accordance with U.S. generally accepted accounting principles requires management to make estimates and assumptions that affect the reported amounts of assets and liabilities at the date of the financial statements and the reported amounts of revenue and operating expenses during the reporting period. Actual results could differ from these estimates.
Reclassifications
Certain immaterial reclassifications have been made to prior year amounts to conform to the current year presentation.
| 3. | CASH, CASH EQUIVALENTS AND MARKETABLE SECURITIES |
At December 31, 2011, cash, cash equivalents and marketable securities of continuing operations consisted of the following:
| Cost | Gross Unrealized Gains |
Gross Unrealized Losses |
Estimated Fair Value |
|||||||||||||
| Cash |
$ | 12,465 | $ | 0 | $ | 0 | $ | 12,465 | ||||||||
| Money market account |
35,129 | 0 | 0 | 35,129 | ||||||||||||
| Municipal income fund |
10,000 | 13 | 0 | 10,013 | ||||||||||||
|
|
|
|
|
|
|
|
|
|||||||||
| $ | 57,594 | $ | 13 | $ | 0 | $ | 57,607 | |||||||||
|
|
|
|
|
|
|
|
|
|||||||||
53
Table of Contents
At December 31, 2010, cash, cash equivalents and marketable securities of continuing operations consisted of the following:
| Cost | Gross Unrealized Gains |
Gross Unrealized Losses |
Estimated Fair Value |
|||||||||||||
| Cash |
$ | 15,283 | $ | 0 | $ | 0 | $ | 15,283 | ||||||||
| Money market account |
5,093 | 0 | 0 | 5,093 | ||||||||||||
| U.S. government bond fund |
20,877 | 0 | 34 | 20,843 | ||||||||||||
|
|
|
|
|
|
|
|
|
|||||||||
| $ | 41,253 | $ | 0 | $ | 34 | $ | 41,219 | |||||||||
|
|
|
|
|
|
|
|
|
|||||||||
| 4. | FAIR VALUE MEASUREMENTS |
A three-tier fair value hierarchy has been established by the Financial Accounting Standards Board (“FASB”) to prioritize the inputs used in measuring fair value. These tiers are as follows:
Level 1—Valuations based on quoted prices for identical assets and liabilities in active markets.
Level 2—Valuations based on observable inputs other than quoted prices included in Level 1, such as quoted prices for similar assets and liabilities in active markets, quoted prices for identical or similar assets and liabilities in markets that are not active, or other inputs that are observable or can be corroborated by observable market data.
Level 3—Valuations based on unobservable inputs reflecting the Company’s own assumptions, consistent with reasonably available assumptions made by other market participants. These valuations require significant judgment.
The fair values of the Company’s cash equivalents and marketable securities are based on quoted prices in active markets for identical assets. The fair values of the Company’s derivative instruments are determined using pricing models that take into account contract terms and certain observable current market information such as London Inter-Bank Offered Rate (“LIBOR”) interest rates.
The following table summarizes the Company’s financial assets and liabilities measured at fair value at December 31, 2011:
| Total Fair Value | Quoted Prices in Active Markets for Identical Assets (Level 1) |
Significant Other Observable Inputs (Level 2) |
||||||||||
| Money market account |
$ | 35,129 | $ | 35,129 | $ | 0 | ||||||
| U.S. government bond fund |
10,013 | 10,013 | 0 | |||||||||
|
|
|
|
|
|
|
|||||||
| Total assets |
$ | 45,142 | $ | 45,142 | $ | 0 | ||||||
|
|
|
|
|
|
|
|||||||
| Interest rate swap |
$ | (22 | ) | $ | 0 | $ | (22 | ) | ||||
|
|
|
|
|
|
|
|||||||
The following table summarizes the Company’s financial assets and liabilities measured at fair value at December 31, 2010:
| Total Fair Value | Quoted Prices in Active Markets for Identical Assets (Level 1) |
Significant Other Observable Inputs (Level 2) |
||||||||||
| Money market account |
$ | 5,093 | $ | 5,093 | $ | 0 | ||||||
| U.S. government bond fund |
20,843 | 20,843 | 0 | |||||||||
|
|
|
|
|
|
|
|||||||
| Total assets |
$ | 25,936 | $ | 25,936 | $ | 0 | ||||||
|
|
|
|
|
|
|
|||||||
| Interest rate swap |
$ | (44 | ) | $ | 0 | $ | (44 | ) | ||||
|
|
|
|
|
|
|
|||||||
54
Table of Contents
| 5. | FIXED ASSETS |
Fixed assets consist of the following:
| December 31, | ||||||||
| 2011 | 2010 | |||||||
| Furniture and fixtures |
$ | 5,709 | $ | 5,767 | ||||
| Computer hardware and software |
45,246 | 41,298 | ||||||
| Equipment |
2,977 | 1,887 | ||||||
| Leasehold improvements |
11,101 | 10,524 | ||||||
|
|
|
|
|
|||||
| 65,033 | 59,476 | |||||||
| Accumulated depreciation |
(35,262 | ) | (25,152 | ) | ||||
|
|
|
|
|
|||||
| $ | 29,771 | $ | 34,324 | |||||
|
|
|
|
|
|||||
Depreciation and amortization expense was $12,068, $11,773 and $11,177 in 2011, 2010 and 2009, respectively.
| 6. | GOODWILL AND IDENTIFIABLE INTANGIBLE ASSETS |
On July 1, 2008, the Company acquired certain assets of Power Chow, LLC (d/b/a NuKitchen) (“NuKitchen”), a provider of freshly prepared meals designed to promote weight management and healthy living. The total purchase price of $5,717 was allocated to identifiable intangible assets ($3,000) and goodwill ($2,717). As further discussed in Note 12, NuKitchen has been treated as a discontinued operation in 2010 and 2009. NuKitchen was closed in 2010.
During the fourth quarter of 2009, a goodwill impairment charge of $2,717 was recorded as a result of the Company conducting its annual impairment test of goodwill. Additionally, the Company recorded an impairment charge of $1,824 for identifiable intangible assets. The Company used a combination of income and market based approaches to estimate the fair value. The impairment is classified in discontinued operations (see Note 12). The impairment charge primarily resulted from management’s determination that the resources needed to grow a premium product in a down economy were unsustainable after conducting market tests during the fourth quarter of 2009, particularly with respect to the higher-end consumer segment.
| 7. | EQUITY INVESTMENT |
On October 11, 2007, the Company purchased an approximately 27% fully diluted equity interest in Zero Technologies, LLC (“Zero Water”), at a purchase price of $14,258. This investment was accounted for under the equity method of accounting. In June 2009, the Company abandoned its interest in Zero Water as management determined that the business was no longer aligned with the Company’s strategic direction. An equity and impairment loss of $4,000 was recorded to write-off the remaining investment.
| 8. | CREDIT FACILITY AND INTEREST RATE SWAPS |
On December 5, 2011, the Company executed an amended and restated credit agreement with a group of lenders that provides for a $100,000 unsecured revolving credit facility with an expansion feature, subject to certain conditions, to increase the facility to $180,000 (the “Credit Facility”). The Credit Facility replaced the $200,000 facility that was expiring in October 2012. The Company borrowed $30,000 million against the Credit Facility during 2011 which was used to repay amounts outstanding under the old facility. As of December 31, 2011, the Company had $30,000 in borrowings outstanding under the Credit Facility at a weighted average interest rate of 1.26%.
The Credit Facility provides for interest at either a floating rate, which will be a base rate, or a Eurocurrency rate equal to LIBOR for the relevant term, plus an applicable margin. The base rate will be the higher of the lender’s
55
Table of Contents
base rate or one-half of one percent above the Federal Funds Rate. The Credit Facility is also subject to an unused fee payable quarterly. The unused fee is subject to adjustment based on the Company’s consolidated leverage ratio and ranges from 0.25-0.45% per year. During 2011, 2010 and 2009, the Company incurred $417, $87 and $0 in interest, respectively, and $279, $294 and $304 in an unused line fee, respectively. Interest payments and unused line fees are classified within interest (expense) income, net in the accompanying consolidated statements of operations.
The Credit Facility contains financial and other covenants, including a maximum leverage ratio, a minimum fixed charge ratio and a minimum consolidated earnings before interest, taxes, depreciation and amortization, and includes limitations on, among other things, liens, capital expenditures, certain acquisitions, consolidations and sales of assets. As of December 31, 2011, the Company was in compliance with all covenants contained in the Credit Facility.
At December 31, 2011, the Company had $1,097 of unamortized debt issuance costs associated with the Credit Facility, of which $991 were incurred in December 2011 for amending the Credit Facility. These costs are being amortized over the remaining term of the Credit Facility. The amount of unused Credit Facility at December 31, 2011 was $70,000. The Credit Facility can be drawn upon through December 5, 2016, at which time all amounts must be repaid.
The Company uses interest rate swaps, a type of derivative financial instrument, to manage interest costs and minimize the effects of interest rate fluctuations on cash flows associated with its variable-rate debt. The Company does not use interest rate derivatives for trading or speculative purposes. While interest rate swaps are subject to fluctuations in value, these fluctuations are generally offset by the value of the underlying exposures being hedged. The Company minimizes the risk of credit loss by entering into these agreements with financial institutions that have high credit ratings.
In November 2010, the Company entered into two separate $10,000 notional value floating to fixed interest rate swap agreements (“Swaps”) that mature on August 3, 2012 and September 28, 2012, respectively. Under the Swaps, the Company receives interest equivalent to the three-month LIBOR and pays a fixed rate of interest of 0.75%, with settlements occurring quarterly. The objective of the hedges is to eliminate the variability of cash flows in interest payments for $20,000 of floating rate debt. The Swaps’ estimated fair value was a liability of $22 and $44 as of December 31, 2011 and 2010, respectively. The corresponding change in fair value is included in accumulated other comprehensive loss in the accompanying consolidated balance sheets. There were no amounts of cash flow hedge ineffectiveness recorded during 2011 or 2010. The Company expects a liability of $22 to be reclassified into earnings within the next 12 months as both Swaps mature in 2012. In January 2012, we entered into a third $10,000 notional value interest rate swap for the amended and restated credit agreement.
| 9. | COMMITMENTS AND CONTINGENCIES |
Operating Leases
The Company leases its corporate headquarters and certain equipment. These leases generally have initial terms of one to 12 years and have renewal options for additional periods. Certain of the leases also contain escalation clauses based upon increases in costs related to the properties. Lease obligations, with initial or remaining terms of one or more years, consist of the following at December 31, 2011:
| 2012 |
$ | 3,226 | ||
| 2013 |
3,233 | |||
| 2014 |
3,234 | |||
| 2015 |
3,302 | |||
| 2016 |
3,372 | |||
| Thereafter |
17,295 | |||
|
|
|
|||
| $ | 33,662 | |||
|
|
|
56
Table of Contents
Total rent expense for 2011, 2010 and 2009 was $3,136, $3,540 and $3,269, respectively.
Litigation
Commencing on October 9, 2007, several putative class action suits were filed in the United States District Court for the Eastern District of Pennsylvania naming Nutrisystem, Inc. and certain of its officers and directors as defendants and alleging violations of Sections 10(b) and 20(a) of the Securities Exchange Act of 1934. The complaints purported to bring claims on behalf of a class of persons who purchased the Company’s common stock between February 14, 2007 and October 3, 2007 or October 4, 2007. The complaints alleged that the defendants issued various materially false and misleading statements relating to the Company’s projected performance that had the effect of artificially inflating the market price of its securities. These actions were consolidated in December 2007 under docket number 07-4215, and a consolidated amended complaint was filed on March 7, 2008 that raised the same claims but alleged a class period of February 14, 2007 through February 19, 2008. The consolidated amended complaint asked the court to (1) certify a class, (2) award compensatory damages, reasonable costs and expenses and (3) grant such other and further relief as the court deemed just and proper. The defendants filed a motion to dismiss on May 6, 2008 that was granted by the Court on August 31, 2009. On September 29, 2009, plaintiff filed a notice of appeal, and on May 19, 2010, upon motion by the plaintiff/appellant, the appeal was dismissed with prejudice without costs to either party. The dismissal is final.
On April 27, 2010, counsel for a stockholder sent a letter relating to the same events that formed the bases of the federal putative class action described above. Specifically, the stockholder has demanded, pursuant to Delaware Chancery Court Rule 23.1, that the Board of Directors (1) undertake (or cause to be undertaken) an independent internal investigation into violations of Delaware law committed by Company management during the time periods described above and (2) commence a civil action against each member of management to recover for the benefit of the Company the amount of damages sustained by the Company as a result of their breaches of fiduciary duties described above. The Board of Directors appointed a special committee consisting of three independent directors to investigate this demand. The special committee engaged independent legal counsel to assist it in this investigation. In April 2011, the special committee, with the assistance of independent legal counsel, completed its investigation and delivered to the Board of Directors the special committee’s recommendation that the Company refuse the demands made in the stockholder’s letter. At its April 2011 meeting, the Board of Directors, after deliberation and discussion, unanimously determined to accept the special committee’s recommendation as in the best interests of the Company and its stockholders. Promptly thereafter, the special committee’s counsel delivered to the stockholder’s counsel a letter informing counsel of the Board of Directors’ actions and the Company’s decision to refuse the stockholder’s demands. In May 2011, the stockholder’s counsel sent a letter to the Company’s counsel demanding to inspect and make copies of certain specified books, records, minutes and other documents of the Company for the purposes set forth in such letter. Without waiving any of its rights to challenge the propriety of such purposes under Delaware law, in early June 2011, the Company delivered to the stockholder’s counsel copies of certain minutes of the Board of Directors and the special committee according to the terms of a confidentiality agreement that the Company and the stockholder had executed. The Company has not received any further correspondence or communications from the stockholder or his counsel since that time.
On August 5, 2011, a lawsuit was filed by a stockholder in the United States District Court for the Eastern District of Pennsylvania naming Nutrisystem, Inc., certain of its officers and directors, and one of its former officers as defendants and alleging breaches by defendants of their fiduciary duties of candor, good faith and loyalty, unjust enrichment, and aiding and abetting from 2010 to the present in connection with the award of excessive and unwarranted 2010 executive compensation. Plaintiff specifically claims the action to be a failed “say-on-pay” shareholder derivative action stemming from the advisory, non-binding vote of the Company’s stockholders at its May 12, 2011 annual meeting in which the Company’s stockholders did not approve the Company’s 2010 executive compensation. The complaint is listed under docket number 2:11-cv-05036-PD and specifically alleges that (1) the defendants breached their fiduciary duties in connection with the issuance of
57
Table of Contents
certain false and misleading statements contained in Nutrisystem’s Proxy Statement; (2) the defendants breached their fiduciary duties in connection with the Board of Directors’ compensation practices; (3) the defendants breached their fiduciary duties in connection with the Company’s failure to respond to the negative “say-on-pay” vote; and (4) as a result of the foregoing the defendants were unjustly enriched at the expense of the Company. Accordingly, the complaint asks the court to (1) award judgment against the defendants and in favor of the Company for an unspecified amount of damages sustained by the Company as a result of defendants’ violation of state law, (2) grant extraordinary equitable and/or injunctive relief as necessary or permitted by law, equity and the statutory provisions cited in the complaint, including disgorgement, attachment, impoundment, imposition of a constructive trust on or otherwise restricting the disposition/exercise of improvidently awarded executive compensation based upon false financial reporting and/or the proceeds of defendants’ trading activities or their other assets so as to ensure that plaintiff on behalf of the Company has an effective remedy; (3) order the implementation and administration of internal controls and systems at the Company designed to prohibit and prevent excessive and/or unwarranted executive compensation payments to the Company’s chief executive, chief financial, and other senior executive officers; (4) award to plaintiff the costs and disbursements of the action, including reasonable attorneys’ fees, and accountants’ and expert fees, costs and expenses; and (5) grant such other and further relief as the court deems just and proper. On October 21, 2011 the defendants filed a motion to dismiss the complaint pursuant to Rules 12(b)(6) and 23.1 of the Federal Rules of Civil Procedure for failure to state a claim upon which relief can be granted and for failure to adequately plead demand futility. On November 21, 2011 plaintiff filed his brief in opposition to the defendants’ motion to dismiss the complaint and alleged that the directors issued false and misleading statements in the Company’s proxy statement by stating that the Company adhered to a pay-for-performance policy when in fact it did not. In its opposition brief, plaintiff abandoned the count contained in its complaint that the defendants breached their fiduciary duties in connection with the Company’s failure to respond to the negative “say-on-pay” vote. On December 5, 2011 defendants filed their reply brief in support of their motion to dismiss the complaint. The court has scheduled a preliminary pretrial conference for March 8, 2012. The Company believes that the claims are without merit and intends to defend the litigation vigorously.
On September 1, 2011, a lawsuit was filed by another stockholder in the Court of Common Pleas of Montgomery County, Pennsylvania naming Nutrisystem, Inc., certain of its officers and directors, and one of its former officers as defendants and alleging breaches by defendants of their fiduciary duties of candor, good faith and loyalty, unjust enrichment, and aiding and abetting from 2010 to the present in connection with the award of excessive and unwarranted 2010 executive compensation. This action stems from the same failed “say-on-pay” advisory, non-binding vote of the Company’s stockholders at its May 12, 2011 annual meeting in which the Company’s stockholders did not approve the Company’s 2010 executive compensation. The complaint is listed under docket number 2011-24985 and specifically alleges that (1) the defendants breached their fiduciary duties in connection with the issuance of certain materially false and misleading statements and omissions of fact in Nutrisystem’s Proxy Statement; (2) the defendants breached their fiduciary duties in connection with the Company’s excessive 2010 executive compensation and the failure to rescind such compensation in response to the negative “say-on-pay” vote; and (3) as a result of the foregoing the executive defendants were unjustly enriched at the expense of the Company. Accordingly, the complaint asks the court to (1) determine that the action is a proper derivative action maintainable under the law and that demand is excused; (2) award judgment against the defendants and in favor of the Company for an unspecified amount of damages sustained by the Company as a result of defendants’ breaches of fiduciary duties; (3) grant injunctive and other equitable relief as necessary or permitted by law, equity and the statutory provisions cited in the complaint, including disgorgement, attachment, impoundment, imposition of a constructive trust on or otherwise restricting the disposition/exercise of disloyally awarded 2010 executive compensation; (4) direct the Company to take all necessary actions to reform and improve its corporate governance and internal procedures to comply with all applicable laws and to protect the Company and its stockholders from a repeat of the damaging events described in the Complaint; (5) award to plaintiff the costs and disbursements of the action, including reasonable allowance of fees and costs for plaintiff’s attorneys, experts and accountants; and (6) grant such other and further relief as the court deems just and proper. On November 10, 2011, the defendants filed preliminary objections to the complaint asserting (1) the court should decline to exercise subject matter jurisdiction over the action pursuant to Pennsylvania Rule
58
Table of Contents
of Civil Procedure 1028(a)(1) and (a)(4) under Pennsylvania’s internal affairs doctrine; (2) failure to state a claim upon which relief may be granted under Pennsylvania Rule of Civil Procedure 1028(a)(4); and (3) lack of capacity to sue under Pennsylvania Rule of Civil Procedure 1028(a)(5) because the plaintiff did not make a demand on the Company’s directors and failed to adequately allege that such demand was excused. On November 21, 2011, defendants filed a praecipe for argument in which they requested oral argument. On December 23, 2011, plaintiff filed his opposition to the defendants’ preliminary objections and alleged that the directors issued false and misleading statements in the Company’s proxy statement by stating that the Company adhered to a pay-for-performance policy when in fact it did not. On January 23, 2012, defendants filed their reply brief in support of their preliminary objections to the complaint. Oral argument was heard by the court on February 8, 2012. On February 13, 2012, the court denied the defendants’ preliminary objections. The defendants’ answer to the complaint is now required to be filed by March 13, 2012. The Company believes that the claims are without merit and intends to defend the litigation vigorously.
The Company is also involved in other various claims and routine litigation matters. In the opinion of management, after consultation with legal counsel, the outcomes of such matters are not anticipated to have a material adverse effect on the Company’s consolidated financial position, results of operations or cash flows in future years.
Contractual Commitments
The Company has entered into supply agreements with various food vendors. The majority of these agreements provide for annual pricing and annual purchase obligations, as well as exclusivity in the production of certain products, with terms of five years or less. One agreement also provides rebates if certain volume thresholds are exceeded. In 2010, a new pricing and food purchase agreement with a frozen food supplier was executed which required advance payments to the supplier. The agreement with this supplier expired in November 2011 and the Company has found other frozen food supply options to replace this supplier. As of December 31, 2011 and 2010, advances were $2,907 and $15,240, respectively. Included in the $2,907 are advances of $2,313 to a new frozen food supplier whereby the Company has committed to purchase up to $10,000 of product through 2013. A portion of the supplier advances in 2011 was classified as other assets in the accompanying consolidated balance sheets. The Company has additional purchase obligations of $88,476 as of December 31, 2011. The Company anticipates it will meet all annual purchase obligations in 2012.
| 10. | STOCKHOLDERS’ EQUITY |
Common Stock
In 2011, the Company issued 25,001 shares of common stock upon the exercise of stock options and received proceeds of $129. During 2011, employees surrendered to the Company 147,848 shares of common stock valued at $1,923 for payment of the minimum tax withholding obligations. Also, in 2011, the Company issued 154,836 shares of common stock as compensation to board members and spokespersons pursuant to their respective contracts. Costs recognized for the vested portion of these stock grants were $1,296 which approximated fair value. During each of the four quarters of 2011, the Company paid a dividend of $0.175 per share to all stockholders of record. Subsequent to December 31, 2011, the Board of Directors declared a quarterly dividend of $0.175 per share payable on March 26, 2012 to stockholders of record as of March 15, 2012. As of December 31, 2011, 70,313 shares of common stock issued to spokespersons remain unvested. Additional expense for those shares will be recognized upon vesting.
In 2010, the Company issued 54,927 shares of common stock upon the exercise of stock options and received proceeds of $124. During 2010, employees surrendered to the Company 154,585 shares of common stock valued at $3,497 for payment of the minimum tax withholding obligations. Also, in 2010, the Company issued 30,700 shares of common stock as compensation to board members and spokespersons pursuant to their respective contracts. Costs recognized for these stock grants were $622 which approximated fair value. During each of the four quarters of 2010, the Company paid a dividend of $0.175 per share to all stockholders of record.
59
Table of Contents
In 2009, the Company issued 119,806 shares of common stock upon the exercise of stock options and received proceeds of $563. During 2009, employees surrendered to the Company 118,307 shares of common stock valued at $1,726 for payment of the minimum tax withholding obligations. Also, in 2009, the Company issued 39,039 shares of common stock as compensation to board members and spokespersons pursuant to their respective contracts. Costs recognized for these stock grants were $538 which approximated fair value. During each of the four quarters of 2009, the Company paid a dividend of $0.175 per share to all stockholders of record.
On July 28, 2011, the Company announced that its Board of Directors had authorized a new stock repurchase program of up to $150,000 of the Company’s outstanding shares of common stock in open-market transactions on the NASDAQ National Market or through privately negotiated transactions, including block transactions. The timing and actual number of shares repurchased depend on a variety of factors including price, corporate and regulatory requirements, alternative investment opportunities and other market conditions. This stock repurchase program has an expiration date of June 30, 2013 but may be limited or terminated at any time by the Board of Directors without prior notice. No shares of common stock were repurchased during 2011.
Under previously authorized stock repurchase plans, the Company purchased and retired 3,270,429 shares of common stock for an aggregate cost of $74,997 during 2010 and 132,200 shares of common stock for an aggregate cost of $1,939 during 2009. The cost of the purchased shares was reflected in the accompanying statement of stockholders’ equity as a reduction of common stock (equal to par value of purchased shares), additional paid-in capital (“APIC”) (equal to balance in APIC) with the excess recorded as a reduction in retained earnings.
Preferred Stock
The Company has authorized 5,000,000 shares of preferred stock issuable in series upon resolution of the Board of Directors. Unless otherwise required by law, the Board of Directors can, without stockholder approval, issue preferred stock in the future with voting and conversion rights that could adversely affect the voting power of the common stock. The issuance of preferred stock may have the effect of delaying, averting or preventing a change in control of the Company.
| 11. | INCOME TAXES |
The provision for income taxes from continuing operations consists of the following:
| Year Ended December 31, | ||||||||||||
| 2011 | 2010 | 2009 | ||||||||||
| Current: |
||||||||||||
| Federal |
$ | 7,493 | $ | 14,635 | $ | 14,731 | ||||||
| State |
(555 | ) | 405 | 580 | ||||||||
| Foreign |
(154 | ) | 151 | 292 | ||||||||
|
|
|
|
|
|
|
|||||||
| 6,784 | 15,191 | 15,603 | ||||||||||
|
|
|
|
|
|
|
|||||||
| Deferred: |
||||||||||||
| Federal |
(412 | ) | 4,053 | 607 | ||||||||
| State |
28 | 65 | 611 | |||||||||
| Valuation allowance |
0 | 0 | (3,749 | ) | ||||||||
|
|
|
|
|
|
|
|||||||
| (384 | ) | 4,118 | (2,531 | ) | ||||||||
|
|
|
|
|
|
|
|||||||
| $ | 6,400 | $ | 19,309 | $ | 13,072 | |||||||
|
|
|
|
|
|
|
|||||||
The income tax benefit attributable to discontinued operation consists of the following:
| Year Ended December 31, | ||||||||||||
| 2011 | 2010 | 2009 | ||||||||||
| Discontinued operations |
$ | 0 | $ | (566 | ) | $ | (2,398 | ) | ||||
60
Table of Contents
A reconciliation of the statutory federal income tax rate to the Company’s effective tax rate is as follows:
| Year Ended December 31, | ||||||||||||
| 2011 | 2010 | 2009 | ||||||||||
| Statutory federal income tax rate |
35.0 | % | 35.0 | % | 35.0 | % | ||||||
| State and foreign income taxes, net of federal benefit |
0 | 0 | 1.4 | |||||||||
| Executive compensation limitation |
7.9 | 3.5 | 2.6 | |||||||||
| Food donations |
(3.9 | ) | (2.2 | ) | (2.4 | ) | ||||||
| Changes in reserves |
(2.0 | ) | 0 | 0 | ||||||||
| Tax credits |
(1.2 | ) | 0 | 0 | ||||||||
| Other |
(1.5 | ) | 0 | (0.3 | ) | |||||||
| Valuation allowance |
0 | 0 | (7.8 | ) | ||||||||
|
|
|
|
|
|
|
|||||||
| 34.3 | % | 36.3 | % | 28.5 | % | |||||||
|
|
|
|
|
|
|
|||||||
The change in the effective tax rate from 2010 to 2011 was due to the impact of limitations on executive compensation deductions and food donations in comparison to pre-tax income as well as reductions in tax reserves due to the lapse of the statute of limitations during the fourth quarter of 2011 and tax credits and other miscellaneous adjustments occurring throughout the year.
The significant items comprising the Company’s deferred income tax assets and liabilities are as follows:
| December 31, | ||||||||
| 2011 | 2010 | |||||||
| Deferred tax asset: |
||||||||
| Reserves and accruals |
$ | 834 | $ | 1,206 | ||||
| Goodwill/Intangible assets |
494 | 584 | ||||||
| Net operating loss carryforward |
1,043 | 1,100 | ||||||
| Stock-based compensation |
868 | 1,048 | ||||||
| Charitable contribution carryforward |
2,549 | 1,977 | ||||||
| Other |
1,033 | 579 | ||||||
|
|
|
|
|
|||||
| 6,821 | 6,494 | |||||||
| Deferred tax liability: |
||||||||
| Property and equipment |
(3,782 | ) | (3,839 | ) | ||||
|
|
|
|
|
|||||
| Net deferred tax asset |
$ | 3,039 | $ | 2,655 | ||||
|
|
|
|
|
|||||
At December 31, 2011, the net deferred tax asset of $3,039 is comprised of $1,584 included in current assets and $1,455 included in other assets in the accompanying consolidated balance sheet. At December 31, 2010, the net deferred tax asset of $2,655 is comprised of $1,854 included in current assets and $801 included in other assets in the accompanying consolidated balance sheet. At December 31, 2011 and 2010, the Company had net operating loss carryforwards of approximately $12,832 and $13,716, respectively, for state tax purposes. The decrease is due to the utilization of net operating losses. For state tax purposes, there is a limitation on the amount of net operating loss carryforwards that can be utilized in a given year to offset state taxable income. Net operating losses will begin to expire in 2024.
Based on the projected level of future taxable income over the periods in which the deferred tax assets are deductible, management believes it is more likely than not that the Company will realize the net deferred tax assets. In 2008, the Company recorded a valuation allowance of $3,749 related to its impairment of its investment in Zero Water since the character of the deduction could be a capital item and there was no history of generating capital gains. In 2009, the Company abandoned its investment in Zero Water (see Note 7) which provided the Company with a current year income tax deduction for its entire original $14,258 tax basis investment in Zero Water. This reduced 2009 federal income tax payments by approximately $4,990. This reduction in ordinary income tax payments resulted in a similar decrease in income tax expense for the year
61
Table of Contents
ended December 31, 2009 including a reversal of a $3,749 valuation allowance established in 2008 for deferred tax assets related to prior Zero Water losses and impairment charges. These Zero Water losses and impairment charges were considered realizable during the year ended December 31, 2009 due to the terms of the abandonment which changed the tax loss from capital to ordinary which the Company believes is more likely than not to realize.
The total amount of gross unrecognized tax benefits as of December 31, 2011 and 2010 was $1,919 and $2,478, respectively. The total amount of unrecognized tax benefits that, if recognized, would affect the effective income tax rate is approximately $1,247 and $1,611, as of December 31, 2011 and 2010, respectively. The Company records accrued interest and penalties related to unrecognized tax benefits as part of interest expense. During 2011, 2010 and 2009, the Company recognized $133, $99 and $70, respectively, in interest and penalties. The Company’s federal income tax returns for 2008 through 2011 are open and are subject to examination by the Internal Revenue Service. State tax jurisdictions that remain open to examination range from 2000 through 2011. The Company does not believe that that there will be any material changes to unrecognized tax positions over the next 12 months.
A reconciliation of the beginning and ending amounts of the total unrecognized tax benefit is as follows:
| Year Ended December 31, | ||||||||||||
| 2011 | 2010 | 2009 | ||||||||||
| Balance at beginning of year |
$ | 2,478 | $ | 1,375 | $ | 1,193 | ||||||
| Increase related to current year tax positions |
85 | 1,184 | 182 | |||||||||
| Reductions related to settlement of tax matters |
0 | (42 | ) | 0 | ||||||||
| Decrease due to lapse of statute of limitations |
(644 | ) | (39 | ) | 0 | |||||||
|
|
|
|
|
|
|
|||||||
| Balance at end of year |
$ | 1,919 | $ | 2,478 | $ | 1,375 | ||||||
|
|
|
|
|
|
|
|||||||
| 12. | DISCONTINUED OPERATIONS |
In the fourth quarter of 2007, the Company committed to a plan to sell its subsidiary, Slim and Tone LLC (“Slim and Tone”) and this subsidiary has been treated as a discontinued operation. Accordingly, the operating results of this discontinued operation have been presented separately from continuing operations for all periods presented. The plan to sell was not completed and operations ceased as of December 31, 2009. Slim and Tone had revenues of $65 and pre-tax losses of $390 for the year ended December 31, 2009.
In the first quarter of 2010, the Company committed to a plan to sell the business operations conducted by NuKitchen, as it was no longer aligned with the business direction of the Company. The Company was unsuccessful in locating a buyer for the NuKitchen business and, therefore, it closed the business during 2010. NuKitchen has been treated as a discontinued operation. Accordingly, the operating results of this discontinued operation have been presented separately from continuing operations for all periods presented. NuKitchen had revenues of $1,707 and $3,113 and pre-tax losses of $808 and $6,091 (including impairment charge) for the years ended December 31, 2010 and 2009, respectively.
| 13. | EQUITY INSTRUMENTS |
Equity Incentive Plans
The Company had three equity incentive plans: the 1999 Equity Incentive Plan, the 2000 Equity Incentive Plan and the 2008 Long-Term Incentive Plan (collectively, the “Equity Incentive Plans”). The 2008 Long-Term Incentive Plan is currently the only plan under which new awards may be granted. Under that plan, a variety of equity instruments can be granted to key employees including incentive and nonqualified stock options to purchase shares of the Company’s common stock, restricted stock, restricted stock units or shares of common stock. The 1999 Equity Incentive Plan, the 2000 Equity Incentive Plan and the 2008 Long-Term Incentive Plan
62
Table of Contents
authorize up to 1,000,000, 5,600,000 and 2,700,000 shares of common stock, respectively, for issuance. At December 31, 2011, the 2008 Long-Term Incentive Plan had 500,039 shares available for grant.
Under each of the plans, the Board of Directors determines the term of each award, but no award can be exercisable more than 10 years from the date the award is granted. To date, all of the awards issued under the Equity Incentive Plans expire 10 years from the grant date. The Board also determines the vesting provisions and the exercise price per share, which is the fair market value at date of grant. Awards issued to employees generally vest over terms ranging from three to five years.
The following table summarizes the Company’s stock option activity for 2009, 2010 and 2011:
| Number of Shares |
Weighted- Average Exercise Price Per Share |
Weighted- Average Remaining Contractual Life (years) |
Aggregate Intrinsic Value |
|||||||||||||
| Outstanding, January 1, 2009 |
253,066 | $ | 6.24 | |||||||||||||
| Exercised |
(119,806 | ) | $ | 4.70 | ||||||||||||
| Forfeited |
(5,500 | ) | $ | 23.79 | ||||||||||||
|
|
|
|||||||||||||||
| Outstanding, December 31, 2009 |
127,760 | $ | 6.92 | |||||||||||||
| Exercised |
(54,927 | ) | $ | 2.27 | ||||||||||||
| Forfeited |
(20,000 | ) | $ | 6.00 | ||||||||||||
|
|
|
|||||||||||||||
| Outstanding, December 31, 2010 |
52,833 | $ | 12.10 | |||||||||||||
| Granted |
327,280 | $ | 14.37 | |||||||||||||
| Exercised |
(25,001 | ) | $ | 5.17 | ||||||||||||
| Forfeited |
(18,805 | ) | $ | 19.22 | ||||||||||||
|
|
|
|||||||||||||||
| Outstanding, December 31, 2011 |
336,307 | $ | 14.43 | 9.25 | $ | 92 | ||||||||||
|
|
|
|
|
|
|
|
|
|||||||||
| Exercisable at December 31, 2011 |
15,635 | $ | 15.58 | 2.83 | $ | 92 | ||||||||||
|
|
|
|
|
|
|
|
|
|||||||||
| Expected to vest at December 31, 2011 |
332,776 | $ | 14.43 | 9.24 | $ | 92 | ||||||||||
|
|
|
|
|
|
|
|
|
|||||||||
In 2011, the Company recorded pre-tax compensation charges of $150 for stock option awards. In 2010 and 2009, the Company did not record any compensation charges for stock option awards as all outstanding awards were fully vested. There were no option grants in 2010 or 2009. The weighted-average grant date fair value of stock options granted in 2011 was $4.50. The total intrinsic value of stock options exercised in 2011, 2010 and 2009 was $204, $1,001 and $1,352, respectively.
The fair value of each stock option was estimated on the date of grant using the Black-Scholes option pricing model and the following weighted average assumptions:
| 2011 | ||||
| Expected dividend yield |
4.76 | % | ||
| Expected volatility |
53.15 | % | ||
| Risk-free interest rate |
1.38 | % | ||
| Expected life (in years) |
4.75 | |||
In 2011, 2010 and 2009, the Company authorized the issuance of 30,275, 19,124 and 30,618 shares of common stock, respectively, as compensation to the Board of Directors resulting in compensation expense of $455 in each year. In addition, in 2011, 2010 and 2009, the Company issued a total of 124,561, 11,576, and 8,421 shares of common stock, respectively, to non-employees for services. Costs recognized for these shares were $841, $167 and $83 in 2011, 2010 and 2009, respectively, and approximated fair value. The stock-based compensation costs were recorded in marketing and general and administrative expenses in 2011, 2010, and 2009 in the accompanying consolidated statements of operations.
63
Table of Contents
The Company has issued restricted stock to employees generally with vesting terms ranging from three to five years. The fair value is equal to the market price of the Company’s common stock on the date of grant. Expense for restricted stock is amortized ratably over the vesting period. The following table summarizes the restricted stock activity for 2009, 2010 and 2011:
| Number of Shares |
Weighted- Average Grant-Date Fair Value |
Aggregate Intrinsic Value |
||||||||||
| Nonvested, January 1, 2009 |
1,400,347 | $ | 23.19 | |||||||||
| Granted |
515,653 | $ | 14.96 | |||||||||
| Vested |
(334,350 | ) | $ | 23.32 | ||||||||
| Forfeited |
(264,627 | ) | $ | 22.15 | ||||||||
|
|
|
|||||||||||
| Nonvested, December 31, 2009 |
1,317,023 | $ | 20.12 | |||||||||
| Granted |
569,705 | $ | 18.13 | |||||||||
| Vested |
(499,287 | ) | $ | 19.59 | ||||||||
| Forfeited |
(76,623 | ) | $ | 19.00 | ||||||||
|
|
|
|||||||||||
| Nonvested, December 31, 2010 |
1,310,818 | $ | 19.52 | |||||||||
| Granted |
337,256 | $ | 13.70 | |||||||||
| Vested |
(496,864 | ) | $ | 22.68 | ||||||||
| Forfeited |
(288,352 | ) | $ | 16.53 | ||||||||
|
|
|
|||||||||||
| Nonvested, December 31, 2011 |
862,858 | $ | 16.43 | $ | 11,157 | |||||||
|
|
|
|
|
|
|
|||||||
Additionally, the Company grants restricted stock units. The restricted stock units granted during 2010 and 2011 were primarily performance-based units. The performance-based units have performance conditions and graded-vesting. Each vesting tranche is treated as an individual award and the compensation expense is recognized on a straight-line basis over the requisite service period for each tranche. The requisite service period is a combination of the performance period and the subsequent vesting period based on continued service. The level of achievement of such goals may cause the actual amount of units that ultimately vest to range from 0% to 200% of the original units granted which is reflected as performance factor adjustment in the table below. The Company recognizes expense for performance-based restricted stock units when it is probable that the performance criteria specified will be achieved. The fair value is equal to the market price of the Company’s common stock on the date of grant. Expense is amortized ratably over the vesting period. The following table summarizes the restricted stock unit activity:
| Number of Restricted Stock Units |
Weighted- Average Grant-Date Fair Value |
Aggregate Intrinsic Value |
||||||||||
| Nonvested, January 1, 2009 |
0 | $ | 0 | |||||||||
| Granted |
5,500 | $ | 14.84 | |||||||||
| Vested |
0 | $ | 0 | |||||||||
| Forfeited |
0 | $ | 0 | |||||||||
|
|
|
|||||||||||
| Nonvested, December 31, 2009 |
5,500 | $ | 14.84 | |||||||||
| Granted |
67,496 | $ | 17.53 | |||||||||
| Performance factor adjustment |
(14,999 | ) | $ | 17.53 | ||||||||
| Vested |
(1,833 | ) | $ | 14.84 | ||||||||
| Forfeited |
0 | $ | 0 | |||||||||
|
|
|
|||||||||||
| Nonvested, December 31, 2010 |
56,164 | $ | 17.35 | |||||||||
| Granted |
54,999 | $ | 14.49 | |||||||||
| Performance factor adjustment |
(54,999 | ) | $ | 14.49 | ||||||||
| Vested |
0 | $ | 0 | |||||||||
| Forfeited |
(19,848 | ) | $ | 17.03 | ||||||||
|
|
|
|||||||||||
| Nonvested, December 31, 2011 |
36,316 | $ | 17.53 | $ | 470 | |||||||
|
|
|
|
|
|
|
|||||||
64
Table of Contents
The Company recorded compensation expense of $8,312, $10,329 and $8,844 in the accompanying consolidated statements of operations for 2011, 2010 and 2009, respectively, in connection with the issuance of the restricted shares and restricted stock units. As of December 31, 2011, shares of restricted stock of 831,855 and restricted stock units of 35,753 were expected to vest. The Company recognized an (increase)/decrease in taxes payable of ($919), $418 and ($450) in 2011, 2010 and 2009, respectively, from the exercise of certain stock options and restricted stock and payment of certain dividends and recorded these amounts as decreases and increases to APIC in the accompanying consolidated statements of stockholders’ equity. As of December 31, 2011, there was $12,086 of total unrecognized compensation expense related to unvested share-based compensation arrangements, which is expected to be recognized over a weighted-average period of 1.4 years.
| 14. | EMPLOYEE BENEFIT PLAN |
The Company maintains a qualified tax deferred defined contribution retirement plan (the “Plan”). Under the provisions of the Plan, substantially all employees meeting minimum age and service requirements are entitled to contribute on a before and after-tax basis a certain percentage of their compensation. The Company matched 100% of employees’ first 3% contribution and 50% of the employees’ next 2% contribution. Effective June 1, 2009, the Company elected to suspend its matching contribution. Effective April 1, 2010, the Company reinstated its matching contribution of 100% of employees’ first 3% contribution and 50% of the employees’ next 2% contribution. Employees vest immediately in their contributions and the Company’s contribution. The Company’s contributions in 2011, 2010 and 2009 were $692, $528 and $452, respectively.
| 15. | RETURNS RESERVE |
Following is an analysis for the returns reserve:
| Year Ended December 31, | ||||||||||||
| 2011 | 2010 | 2009 | ||||||||||
| Balance at beginning of year |
$ | 1,009 | $ | 1,850 | $ | 2,074 | ||||||
| Provision for estimated returns |
12,881 | 24,114 | 30,169 | |||||||||
| Actual returns |
(13,164 | ) | (24,955 | ) | (30,393 | ) | ||||||
|
|
|
|
|
|
|
|||||||
| Balance at end of year |
$ | 726 | $ | 1,009 | $ | 1,850 | ||||||
|
|
|
|
|
|
|
|||||||
65
Table of Contents
| 16. | QUARTERLY CONSOLIDATED FINANCIAL DATA (UNAUDITED) |
| Quarter | ||||||||||||||||||||
| First | Second | Third | Fourth | Year | ||||||||||||||||
| (In thousands, except per share amounts) | ||||||||||||||||||||
| 2011: |
||||||||||||||||||||
| Revenue |
$ | 132,672 | $ | 116,129 | $ | 85,643 | $ | 66,892 | $ | 401,336 | ||||||||||
| Gross margin |
$ | 68,845 | $ | 58,502 | $ | 44,386 | $ | 31,198 | $ | 202,931 | ||||||||||
| Net (loss) income |
$ | (3,424 | ) | $ | 10,767 | $ | 6,068 | $ | (1,150 | ) | $ | 12,261 | ||||||||
| Basic (loss) income per common share |
$ | (0.12 | ) | $ | 0.39 | $ | 0.22 | $ | (0.04 | ) | $ | 0.44 | ||||||||
|
|
|
|
|
|
|
|
|
|
|
|||||||||||
| Diluted (loss) income per common share |
$ | (0.12 | ) | $ | 0.38 | $ | 0.21 | $ | (0.04 | ) | $ | 0.43 | ||||||||
|
|
|
|
|
|
|
|
|
|
|
|||||||||||
| 2010: |
||||||||||||||||||||
| Revenue |
$ | 158,830 | $ | 141,634 | $ | 121,189 | $ | 87,862 | $ | 509,515 | ||||||||||
| Gross margin |
$ | 86,691 | $ | 79,842 | $ | 68,535 | $ | 49,641 | $ | 284,709 | ||||||||||
| Income from continuing operations |
$ | 4,899 | $ | 12,680 | $ | 9,221 | $ | 7,079 | $ | 33,879 | ||||||||||
| (Loss) gain on discontinued operations, net |
$ | (98 | ) | $ | (89 | ) | $ | (66 | ) | $ | 11 | $ | (242 | ) | ||||||
| Net income |
$ | 4,801 | $ | 12,591 | $ | 9,155 | $ | 7,090 | $ | 33,637 | ||||||||||
| Basic income per common share: |
||||||||||||||||||||
| Income from continuing operations |
$ | 0.16 | $ | 0.41 | $ | 0.32 | $ | 0.25 | $ | 1.14 | ||||||||||
| Loss on discontinued operations |
$ | 0 | $ | (0.01 | ) | $ | 0 | $ | 0 | $ | (0.01 | ) | ||||||||
|
|
|
|
|
|
|
|
|
|
|
|||||||||||
| Net income |
$ | 0.16 | $ | 0.40 | $ | 0.32 | $ | 0.25 | $ | 1.13 | ||||||||||
|
|
|
|
|
|
|
|
|
|
|
|||||||||||
| Diluted income per common share: |
||||||||||||||||||||
| Income from continuing operations |
$ | 0.16 | $ | 0.40 | $ | 0.32 | $ | 0.25 | $ | 1.13 | ||||||||||
| Loss on discontinued operations |
$ | (0.01 | ) | $ | 0 | $ | 0 | $ | 0 | $ | (0.01 | ) | ||||||||
|
|
|
|
|
|
|
|
|
|
|
|||||||||||
| Net income |
$ | 0.15 | $ | 0.40 | $ | 0.32 | $ | 0.25 | $ | 1.12 | ||||||||||
|
|
|
|
|
|
|
|
|
|
|
|||||||||||
The sum of the quarterly basic and diluted per share amounts may not equal amounts reported for the year. This is due to the effects of rounding and changes in weighted average shares outstanding for each period.
66
Table of Contents
INDEX TO EXHIBITS
| No. |
Description | |
| *3.1 | Certificate of Incorporation. | |
| 3.2 | Amended and Restated By-laws incorporated by reference to the designated exhibit of the Company’s Current Report on Form 8-K filed on July 22, 2009. | |
| +10.1 | Nutrisystem, Inc. 2008 Long Term Incentive Plan incorporated by reference to the designated exhibit of the Company’s Report on Form S-8 filed on May 13, 2008. | |
| +**10.2 | 2000 Equity Incentive Plan of the Company. | |
| +**10.3 | 2000 Equity Incentive Plan for Outside Directors and Consultants of the Company. | |
| 10.4 | Agreement dated December 21, 2004 between Nutrisystem, Inc. and QVC, Inc. incorporated by reference to the designated exhibit of the Company’s Report on Form10-K filed on March 14, 2006. | |
| 10.5 | Agreement dated June 14, 2005 between Truitt Bros., Inc. and Nutrisystem, Inc. incorporated by reference to the designated exhibit of the Company’s Report on Form 8-K filed on June 14, 2005. | |
| 10.6 | Agreement dated September 16, 2005 between Nutrisystem, Inc. and Oregon Freeze Dry, Inc. incorporated by reference to the designated exhibit of the Company’s Report on Form 8-K filed on September 20, 2005. | |
| +10.7 | Compensation Policy For Non-Employee Directors incorporated by reference to the designated exhibit of the Company’s Report on Form 8-K filed on March 6, 2008. | |
| 10.8 | Amended and Restated Credit Agreement dated December 5, 2011, incorporated by reference to the designated exhibit of the Company’s Report on Form 8-K filed on December 9, 2011. | |
| +10.9 | Employment Agreement dated September 4, 2007, between Nutrisystem, Inc. and Joseph Redling, the Company’s President and Chief Operating Officer, incorporated by reference to the designated exhibit of the Company’s Report on Form 10-Q filed on November 6, 2007. | |
| +10.10 | Amendment to Employment Agreement dated April 7, 2008, between Nutrisystem, Inc. and Joseph Redling, the Company’s President and Chief Operating Officer, incorporated by reference to the designated exhibit of the Company’s Report on Form 8-K filed on April 11, 2008. | |
| +10.11 | Second Amendment to Employment Agreement dated December 29, 2008, between Nutrisystem, Inc. and Joseph Redling regarding 409A matters incorporated by reference to the designated exhibit of the Company’s Report on Form 10-K filed on March 6, 2009. | |
| +10.12 | Third Amendment to Employment Agreement dated June 30, 2009, between Nutrisystem, Inc. and Joseph Redling incorporated by reference to the designated exhibit of the Company’s Report on Form 8-K filed on July 2, 2009. | |
| +10.13 | Fourth Amendment to Employment Agreement dated July 20, 2011, between Nutrisystem, Inc. and Joseph Redling incorporated by reference to the designated exhibit of the Company’s Report on Form 8-K filed on July 26, 2011. | |
| +10.14 | Amended and Restated Employment Agreement dated October 22, 2008, between Nutrisystem, Inc. and David Clark, the Company’s Executive Vice President and Chief Financial Officer, incorporated by reference to the designated exhibit of the Company’s Report on Form 10-Q filed on November 7, 2008. | |
| +10.15 | Employment Agreement dated May 14, 2008, between Nutrisystem, Inc. and Scott A. Falconer, the Company’s Executive Vice President of Customer Management and Product Development, incorporated by reference to the designated exhibit of the Company’s Report on Form 8-K filed on May 16, 2008. | |
| +10.16 | Amendment to the Employment Agreement dated December 30, 2008, between Nutrisystem, Inc. and Scott A. Falconer regarding 409A matters incorporated by reference to the designated exhibit of the Company’s Report on Form 10-K filed on March 6, 2009. | |
67
Table of Contents
| No. |
Description | |
| +10.17 | Employment Agreement dated September 28, 2009, between Nutrisystem, Inc. and Chris Terrill, the Company’s Executive Vice President and Chief Marketing Officer, incorporated by reference to the designated exhibit of the Company’s Report on Form 10-Q filed on November 5, 2009. | |
| +10.18 | Form of Performance-Based Restricted Stock Unit Grant incorporated by reference to the designated exhibit of the Company’s Report on Form 10-Q filed on May 6, 2010. | |
| +10.19 | Form of 2011 Performance-Based Restricted Stock Unit Grant incorporated by reference to the designated exhibit of the Company’s Report on Form 10-Q filed on November 4, 2010. | |
| +10.20 | Form of 2012 Performance-Based Restricted Stock Unit Grant incorporated by reference to the designated exhibit of the Company’s Report on Form 10-Q filed on November 4, 2010. | |
| +10.21 | Employment Agreement dated October 3, 2011, between Nutrisystem, Inc. and Michael R. Amburgey, the Company’s Executive Vice President and Chief Marketing Officer, incorporated by reference to the designated exhibit of the Company’s Report on Form 8-K filed on October 19, 2011. | |
| 10.22 | Lease Agreement, dated October 13, 2009, between B.R. Properties Owner, LP and Nutrisystem, Inc. incorporated by reference to the designated exhibit of the Company’s Report on Form 10-Q filed on August 5, 2010. | |
| 21.1 | Subsidiaries of Nutrisystem, Inc. | |
| 23.1 | Consent of KPMG LLP. | |
| 31.1 | Certifying Statement of the Chief Executive Officer pursuant to Section 302 of the Sarbanes-Oxley Act of 2002. | |
| 31.2 | Certifying Statement of the Chief Financial Officer pursuant to Section 302 of the Sarbanes-Oxley Act of 2002. | |
| 32.1 | Certifying Statement of the Chief Executive Officer pursuant to Section 1350 of Title 18 of the United States Code. | |
| 32.2 | Certifying Statement of the Chief Financial Officer pursuant to Section 1350 of Title 18 of the United States Code. | |
| 101.INS* | XBRL Instance Document | |
| 101.SCH* | XBRL Taxonomy Extension Schema Document | |
| 101.CAL* | XBRL Taxonomy Extension Calculation Linkbase Document | |
| 101.LAB* | XBRL Taxonomy Extension Label Linkbase Document | |
| 101.PRE* | XBRL Taxonomy Extension Presentation Linkbase Document | |
| 101.DEF* | XBRL Taxonomy Extension Definition Linkbase Document | |
| * | Incorporated by reference to the designated exhibit of the Company’s Registration Statement on Form 10 filed on December 17, 1999 (file number 0-28551). |
| ** | Incorporated by reference to the designated exhibit of the Company’s Form PRE 14A filed on May 12, 2000 (file number 0-28551). |
| + | Management contract or compensatory plan or arrangement. |
68
Table of Contents
SIGNATURES
Pursuant to the requirements of Section 13 or 15(d) of the Securities Exchange Act of 1934, the Registrant has duly caused this Report to be signed on its behalf by the undersigned, thereunto duly authorized.
| Nutrisystem, Inc. | ||
| By: | /s/ Joseph M. Redling | |
| Joseph M. Redling, Chairman, President and | ||
| Chief Executive Officer | ||
Dated: March 12, 2012
Pursuant to the requirements of the Securities Exchange Act of 1934, this Report has been signed below by the following persons on behalf of the Registrant and in the capabilities indicated.
| BY: | /s/ JOSEPH M. REDLING |
March 12, 2012 | ||
| Joseph M. Redling Chairman, President and Chief Executive Officer and Director |
||||
| BY: | /s/ DAVID D. CLARK |
March 12, 2012 | ||
| David D. Clark Chief Financial Officer and Principal Accounting Officer |
||||
| BY: | /s/ ROBERT F. BERNSTOCK |
March 12, 2012 | ||
| Robert F. Bernstock Director |
||||
| BY: | /s/ MICHAEL F. DEVINE, III |
March 12, 2012 | ||
| Michael F. Devine, III Director |
||||
| BY: | /s/ MICHAEL J. HAGAN |
March 12, 2012 | ||
| Michael J. Hagan Director |
||||
| BY: | /s/ LAURA W. LANG |
March 12, 2012 | ||
| Laura W. Lang Director |
||||
| BY: | /s/ THEODORE J. LEONSIS |
March 12, 2012 | ||
| Theodore J. Leonsis Director |
||||
| BY: | /s/ WARREN V. (PETE) MUSSER |
March 12, 2012 | ||
| Warren V. (Pete) Musser Director |
||||
| BY: | /s/ BRIAN P. TIERNEY |
March 12, 2012 | ||
| Brian P. Tierney Director |
||||
| BY: | /s/ STEPHEN T. ZARRILLI |
March 12, 2012 | ||
| Stephen T. Zarrilli Director |
||||
69