Attached files
| file | filename |
|---|---|
| 8-K - 8-K - Brookfield Property REIT Inc. | a12-6975_18k.htm |
Exhibit 99.1
|
|
Investor Presentation March 2012 |

|
|
FORWARD-LOOKING STATEMENTS AND NON-GAAP MEASURES 2 This presentation contains forward-looking statements. These statements relate to future events or to future financial performance and involve known and unknown risks, uncertainties, and other factors that may cause actual results, levels of activity, or performance to differ from those achievements expressed or implied by these forward-looking statements. The words “possible,” “propose,” “might,” “could,” “would,” “projects,” “plan,” “forecasts,” “anticipates,” “expect,” “intend,” “believe,” “seek,” or “may,” the negative of these terms and other comparable terminology, are intended to identify forward-looking statements, but are not the exclusive means of identifying them. Actual results may differ materially from the results suggested by these forward-looking statements, for a number of reasons, including, but not limited to, our ability to refinance, extend, restructure or repay near and intermediate term debt, our substantial level of indebtedness, our ability to raise capital through equity issuances, asset sales or the incurrence of new debt, retail and credit market conditions, impairments, our liquidity demands, retail and economic conditions. Readers are referred to the documents filed by General Growth Properties, Inc. ( "GGP") with the Securities and Exchange Commission (the "SEC"), which further identify important risk factors that could cause actual results to differ materially from the forward-looking statements in this presentation. Except as may be required by law, we disclaim any obligation to update any forward-looking statements, whether as a result of new information, future developments or otherwise. The 2012 guidance included in this presentation reflects management’s view of current and future market conditions, including assumptions with respect to rental rates, occupancy levels and the earnings impact of the events referenced in this release and previously disclosed. The guidance also reflects management’s view of future capital market conditions, which is generally consistent with the current forward rates for LIBOR and U.S. Treasury bonds. The estimates do not include possible future gains or losses or the impact on operating results from other possible future property acquisitions or dispositions, possible capital markets activity or possible future impairment charges. EPS estimates may be subject to fluctuations as a result of several factors, including changes in the recognition of depreciation and amortization expense and any gains or losses associated with disposition activity. The 2012 guidance is a forward-looking statement. This presentation also makes reference to real estate property net operating income (“NOI”), earnings before interest, taxes, depreciation and amortization (“EBITDA”), and funds from operations (“FFO”). NOI is defined as income from property operations after operating expenses have been deducted, but prior to deducting financing, administrative and income tax expenses. EBITDA is defined as NOI less certain property management, administrative expenses and preferred unit distributions, net of management fees and other operational items. FFO is defined as net income (loss) attributable to common stockholder in accordance with GAAP, excluding gains (or losses) from cumulative effects of accounting changes, extraordinary items and sales of properties, plus real estate related depreciation and amortization and including adjustments for unconsolidated partnerships and joint ventures. NOI, EBITDA and FFO are presented in this presentation on a proportionate basis, which includes GGP’s share from consolidated and unconsolidated properties. As we conduct substantially all of our business through GGP Limited Partnership (the “Operating Partnership”, which is 99% owned by GGP) and we include the conversion of non-GGP limited common units of the Operating Partnership in the total diluted weighted average FFO per share amounts, all FFO amounts in this presentation reflect the FFO of the Operating Partnership. In order to present GGP’s operations in a manner most relevant to its future operations, Core NOI has been presented to exclude certain non-cash and non-recurring revenue and expenses. A reconciliation of NOI to Core NOI has been included in the Supplemental For the three and twelve months ended December 31, 2011, furnished to the SEC. NOI is not an alternative to GAAP operating income (loss) or net income (loss) available to common stockholders. For reference, as an aid in understanding management’s computation of NOI, a reconciliation of NOI to consolidated operating income in accordance with GAAP has been included in the Supplemental. |
|
|
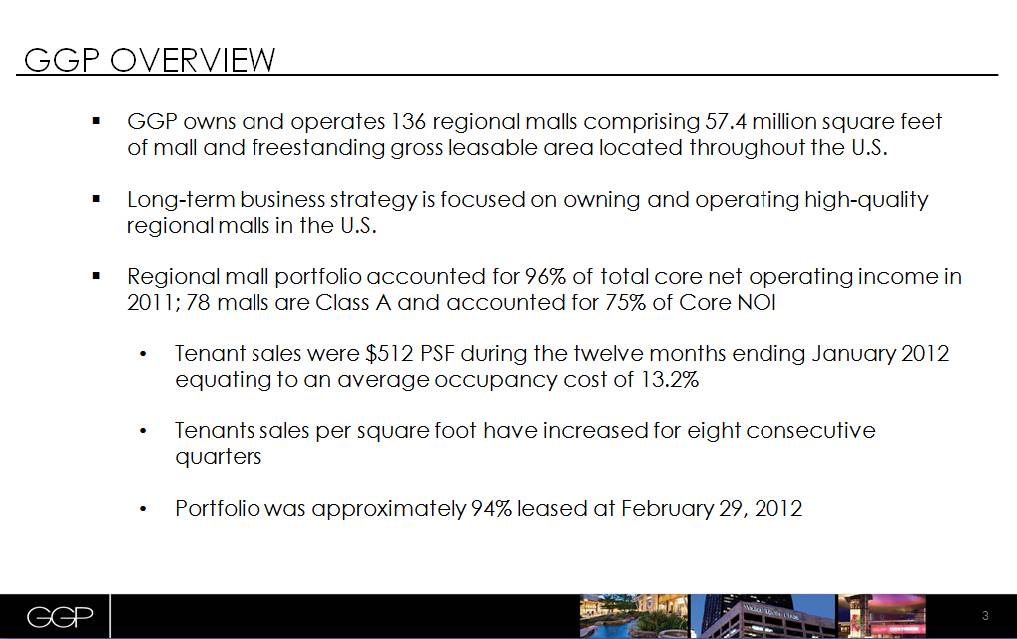
3 GGP owns and operates 136 regional malls comprising 57.4 million square feet of mall and freestanding gross leasable area located throughout the U.S. Long-term business strategy is focused on owning and operating high-quality regional malls in the U.S. Regional mall portfolio accounted for 96% of total core net operating income in 2011; 78 malls are Class A and accounted for 75% of Core NOI Tenant sales were $512 PSF during the twelve months ending January 2012 equating to an average occupancy cost of 13.2% Tenants sales per square foot have increased for eight consecutive quarters Portfolio was approximately 94% leased at February 29, 2012 GGP OVERVIEW |
|
|
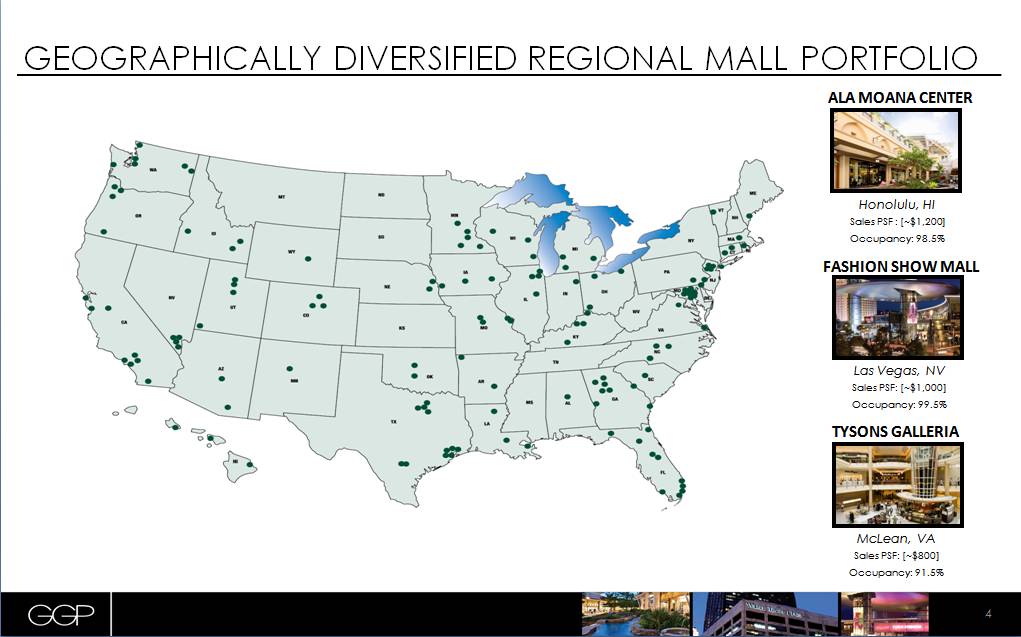
4 Las Vegas, NV Sales PSF: [~$1,000] Occupancy: 99.5% Honolulu, HI Sales PSF : [~$1,200] Occupancy: 98.5% McLean, VA Sales PSF: [~$800] Occupancy: 91.5% ALA MOANA CENTER FASHION SHOW MALL TYSONS GALLERIA GEOGRAPHICALLY DIVERSIFIED REGIONAL MALL PORTFOLIO |
|
|
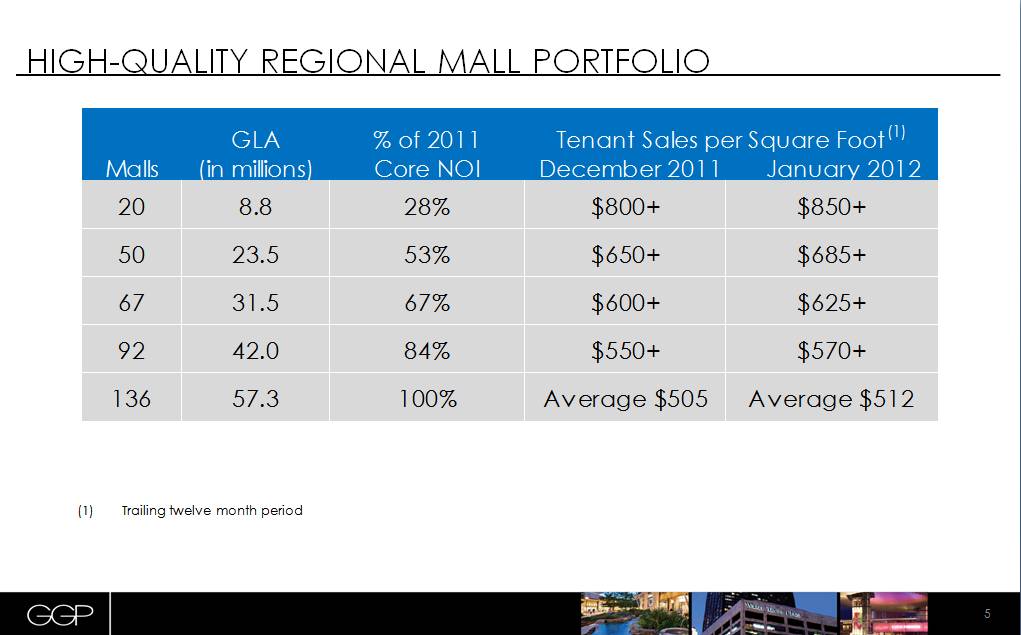
5 HIGH-QUALITY REGIONAL MALL PORTFOLIO Trailing twelve month period Malls GLA (in millions) % of 2011 Core NOI 20 8.8 28% $800+ $850+ 50 23.5 53% $650+ $685+ 67 31.5 67% $600+ $625+ 92 42.0 84% $550+ $570+ 136 57.3 100% Average $505 Average $512 Tenant Sales per Square Foot (1) December 2011 January 2012 |
|
|
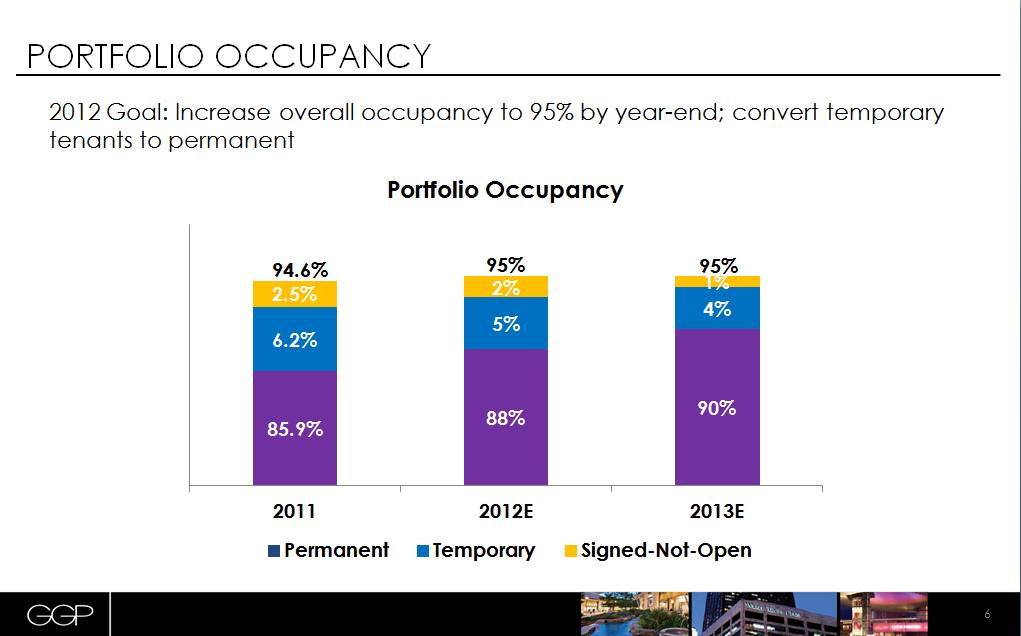
PORTFOLIO OCCUPANCY 6 2012 Goal: Increase overall occupancy to 95% by year-end; convert temporary tenants to permanent 94.6% 95% 95% |
|
|
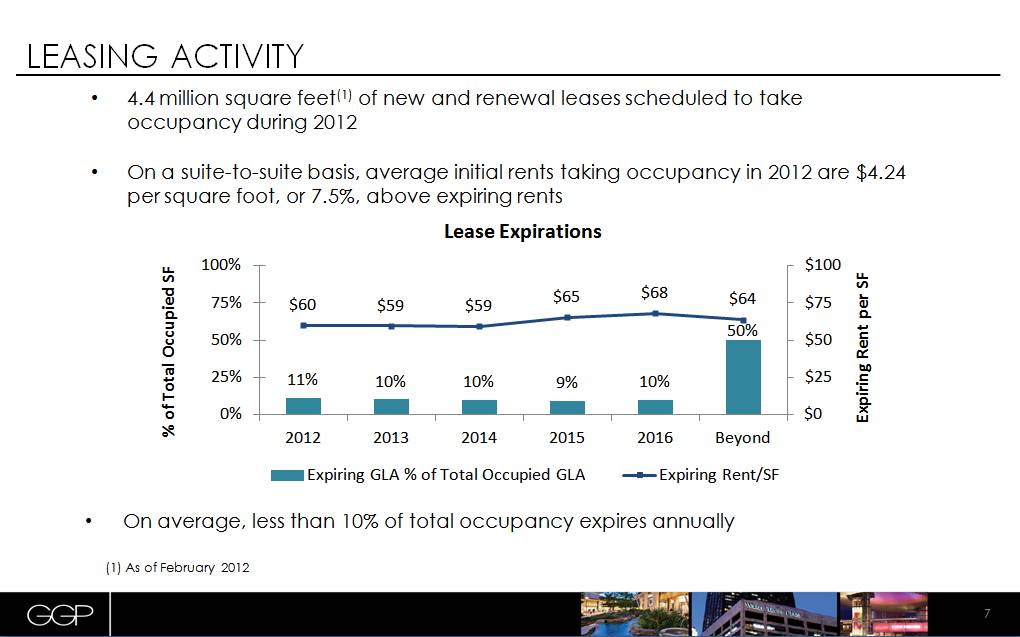
LEASING ACTIVITY 7 4.4 million square feet(1) of new and renewal leases scheduled to take occupancy during 2012 On a suite-to-suite basis, average initial rents taking occupancy in 2012 are $4.24 per square foot, or 7.5%, above expiring rents On average, less than 10% of total occupancy expires annually (1) As of February 2012 |
|
|
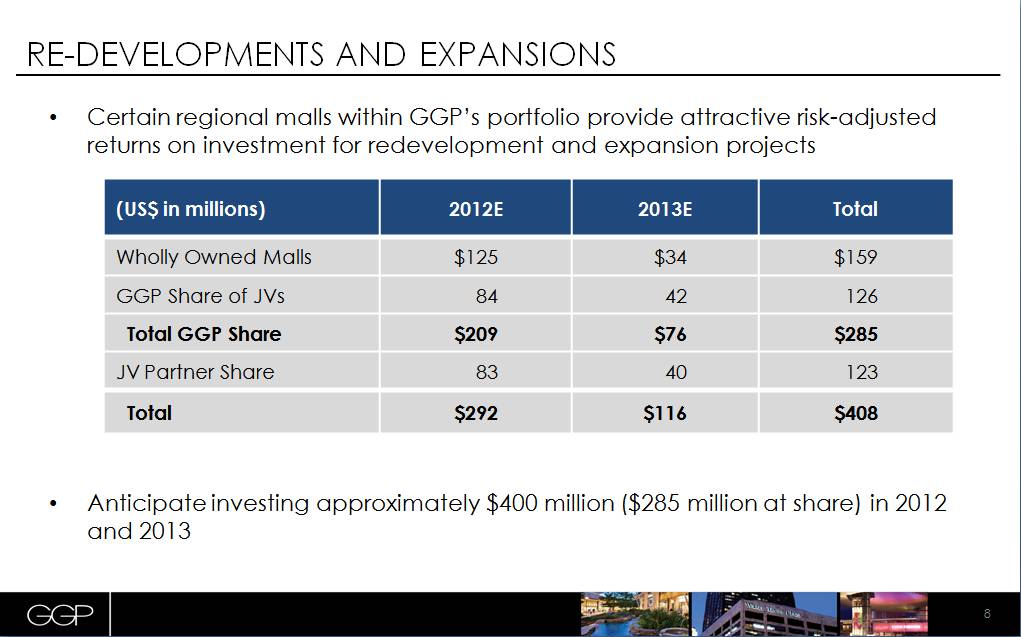
8 RE-DEVELOPMENTS AND EXPANSIONS Certain regional malls within GGP’s portfolio provide attractive risk-adjusted returns on investment for redevelopment and expansion projects Anticipate investing approximately $400 million ($285 million at share) in 2012 and 2013 (US$ in millions) 2012E 2013E Total Wholly Owned Malls $125 $34 $159 GGP Share of JVs 84 42 126 Total GGP Share $209 $76 $285 JV Partner Share 83 40 123 Total $292 $116 $408 |
|
|
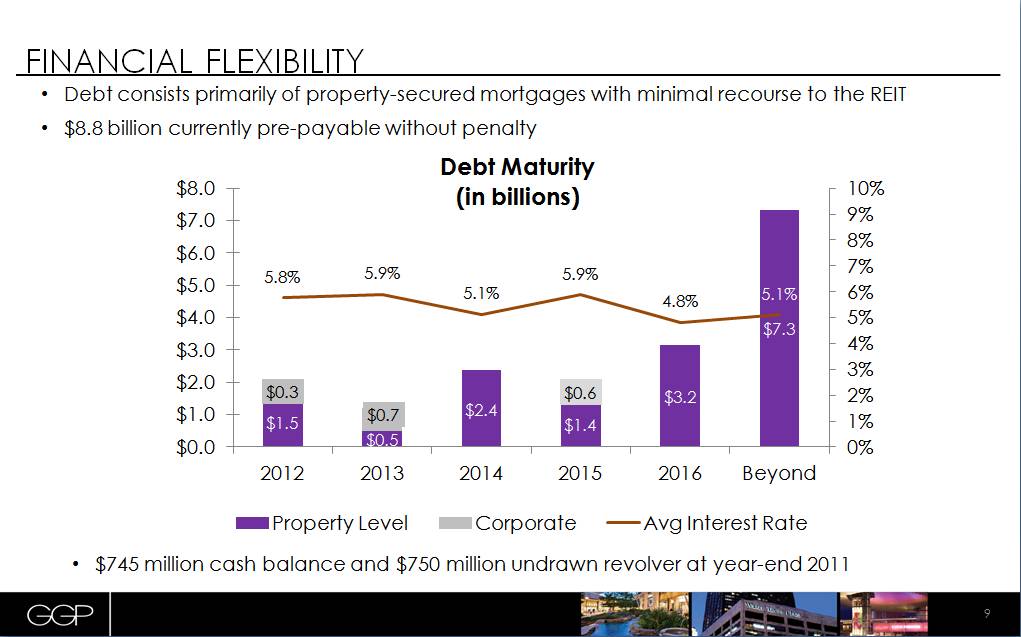
9 FINANCIAL FLEXIBILITY Debt consists primarily of property-secured mortgages with minimal recourse to the REIT $8.8 billion currently pre-payable without penalty $745 million cash balance and $750 million undrawn revolver at year-end 2011 |
|
|
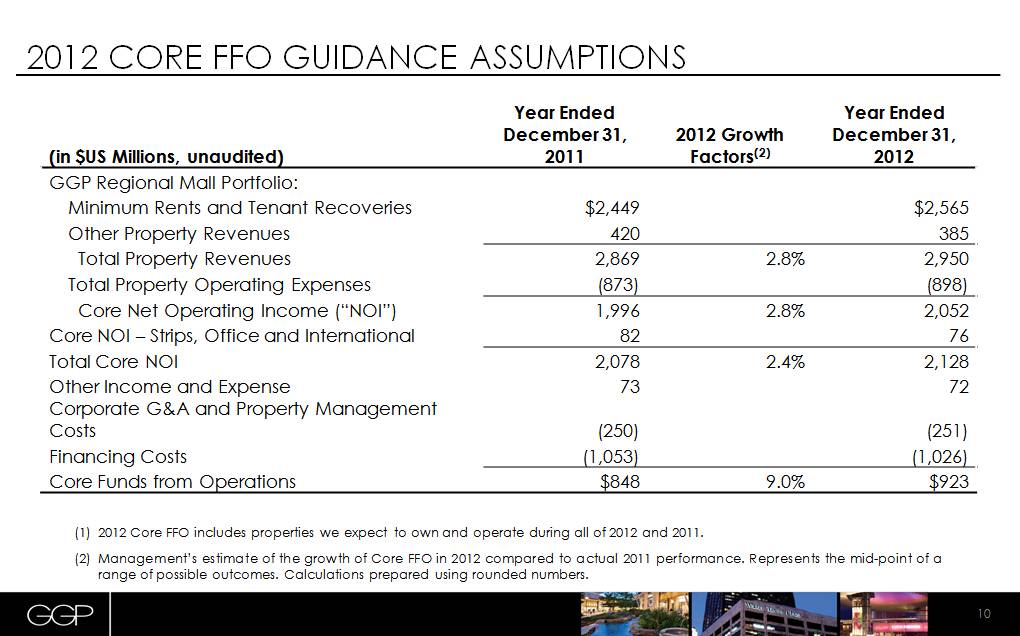
10 2012 CORE FFO GUIDANCE ASSUMPTIONS (in $US Millions, unaudited) Year Ended December 31, 2011 2012 Growth Factors(2) Year Ended December 31, 2012 GGP Regional Mall Portfolio: Minimum Rents and Tenant Recoveries $2,449 $2,565 Other Property Revenues 420 385 Total Property Revenues 2,869 2.8% 2,950 Total Property Operating Expenses (873) (898) Core Net Operating Income (“NOI”) 1,996 2.8% 2,052 Core NOI – Strips, Office and International 82 76 Total Core NOI 2,078 2.4% 2,128 Other Income and Expense 73 72 Corporate G&A and Property Management Costs (250) (251) Financing Costs (1,053) (1,026) Core Funds from Operations $848 9.0% $923 2012 Core FFO includes properties we expect to own and operate during all of 2012 and 2011. Management’s estimate of the growth of Core FFO in 2012 compared to actual 2011 performance. Represents the mid-point of a range of possible outcomes. Calculations prepared using rounded numbers. |
|
|
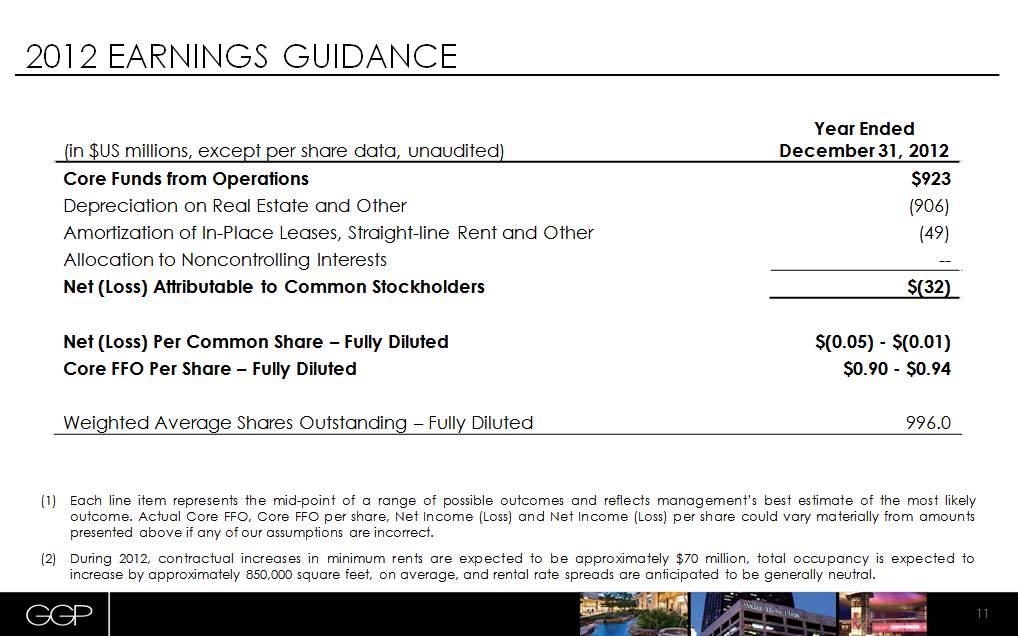
11 2012 EARNINGS GUIDANCE (in $US millions, except per share data, unaudited) Year Ended December 31, 2012 Core Funds from Operations $923 Depreciation on Real Estate and Other (906) Amortization of In-Place Leases, Straight-line Rent and Other (49) Allocation to Noncontrolling Interests -- Net (Loss) Attributable to Common Stockholders $(32) Net (Loss) Per Common Share – Fully Diluted $(0.05) - $(0.01) Core FFO Per Share – Fully Diluted $0.90 - $0.94 Weighted Average Shares Outstanding – Fully Diluted 996.0 Each line item represents the mid-point of a range of possible outcomes and reflects management’s best estimate of the most likely outcome. Actual Core FFO, Core FFO per share, Net Income (Loss) and Net Income (Loss) per share could vary materially from amounts presented above if any of our assumptions are incorrect. During 2012, contractual increases in minimum rents are expected to be approximately $70 million, total occupancy is expected to increase by approximately 850,000 square feet, on average, and rental rate spreads are anticipated to be generally neutral. |
|
|
12 CONTACT INFORMATION Michael Berman Executive Vice President and Chief Financial Officer michael.berman@ggp.com (312) 960-5044 Kevin Berry Vice President of Investor Relations kevin.berry@ggp.com (312) 960-5529 General Growth Properties, Inc. (NYSE: GGP) 110 North Wacker Drive Chicago, IL 60606 www.ggp.com |