Attached files
| file | filename |
|---|---|
| 8-K - ESSEX PROPERTY TRUST INC 8-K 3-12-2012 - ESSEX PROPERTY TRUST, INC. | form8k.htm |
EXHIBIT 99.1

Citigroup CEO Conference
March 12-14, 2012
Via - Sunnyvale, CA

Safe Harbor Disclosure
Certain statements in this presentation, which are not historical facts, may be
considered forward-looking statements within the meaning of the federal
securities laws. The forward looking statements, some of which can be identified
by terms and phrases such as “forecast”, “estimate”, “expect”, “anticipate”,
“should”, “could”, “may”, and similar expressions, reflect the current views of
Essex Property Trust, Inc. (“Essex” or the “Company”) and its affiliates with respect
to future events and are subject to risks and uncertainties. Such forward-looking
statements involve the risk that actual results could be materially different from
those described in such forward-looking statements. Factors that could cause
actual results to be materially different are discussed under the caption “Risk
Factors” in Item 1A of the Company’s Report on Form 10-K for the year ended
December 31, 2011. All forward-looking statements and reasons why results may
differ included in this presentation are made of the date hereof, and we assume
no obligation to update any such forward-looking statements or reasons why
actual results may differ.
2
Essex Property Trust, Inc.

Page
Section I. About Essex & Performance Record 3-6
Section II. National Fundamental Drivers 7-9
Section III. West Coast Apartment Outlook 10-20
Section IV. Company Information 21-30
Table of Contents
3
Essex Property Trust, Inc.

At IPO, Essex owned 16 multifamily properties (4,410 units); currently, Essex has ownership
in 160 apartment communities (32,913 units)
in 160 apartment communities (32,913 units)
§ Multifamily REIT dedicated to supply-constrained markets
- Formed in 1971
- Initial Public Offering in June 1994
• IPO stock price was $19.50 a share
• Today the stock trades around $140 per share
§ Cumulative Dividend paid in excess of $50 per share since IPO
§ Consistent operating philosophy through numerous market cycles
- Research-based strategy
- Rigorous underwriting leveraging real-time platform operating data
- Total return driven
§ Experienced management team - top executives have worked together for an average
tenure of 20 years
4
Section I. About Essex & Performance Record
About Essex Property Trust
Southern CA - 50% of NOI
Northern CA - 33% of NOI
Seattle - 17% of NOI
Essex Property Trust, Inc.

Performance Record
5
Source: NAREIT. Represents the value of a $100 investment and reinvestment of all dividends.
Essex Property Trust, Inc.
Essex Property Trust, Inc.
6
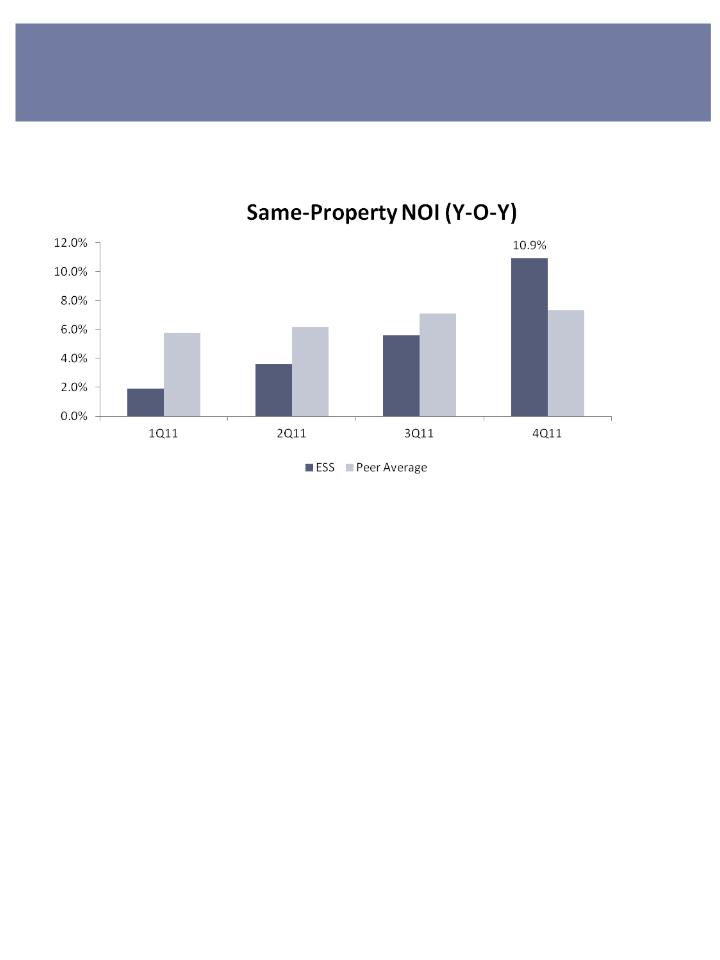
In 4Q 2011 Industry Leading NOI Growth
Accelerating and Industry Leading Same-Property NOI Growth
Source: Peer group includes 11 multifamily REITs

Essex Property Trust, Inc.
7
Section II. National Fundamental Drivers
Job growth accelerating and jobless claims abating
20-34 year olds is a key renter cohort
§ Lost fewer jobs in the recession
§ Gaining a greater percentage of jobs during the recovery
2008-2009 Share of Job Losses
2010-2011* Share of Job Gains
*Through December 2011
Source: BLS

Echo Boomers will Drive Demand with Higher Propensity to Rent
National Multifamily Fundamental Drivers
Source: U.S. Census Bureau, Robert Charles Lesser & Co., and Green Street Advisors.
Essex Property Trust, Inc.

9
Residential Supply Distortion
Essex Property Trust, Inc.
The “Distressing Gap” for homebuilders has benefited multifamily
owners as it indicates home values are too low to support for-sale
construction. Thus, we believe that new home construction will not
return in a meaningful way until distressed home sales abate. The
best indicator of this will be increasing home prices.
owners as it indicates home values are too low to support for-sale
construction. Thus, we believe that new home construction will not
return in a meaningful way until distressed home sales abate. The
best indicator of this will be increasing home prices.

Critical Factors:
§ West Coast rents declined further and recovered later relative to
other major U.S. metros
§ Better than average job growth prospects, especially in high paying
industries
§ New supply remains muted, <1% annual addition to residential stock
in Essex markets
§ High cost of for-sale housing limits transitions from renters to home
owners
Section III. West Coast Apartment Outlook
Why Essex is Maintaining the West Coast Focus?
10
Essex Property Trust, Inc.
Source: Axiometrics
Approximately 63% of Essex’s NOI is located in the top five projected rent
growth markets in the nation over the next five years
growth markets in the nation over the next five years
Drivers of strong continued demand in Essex markets
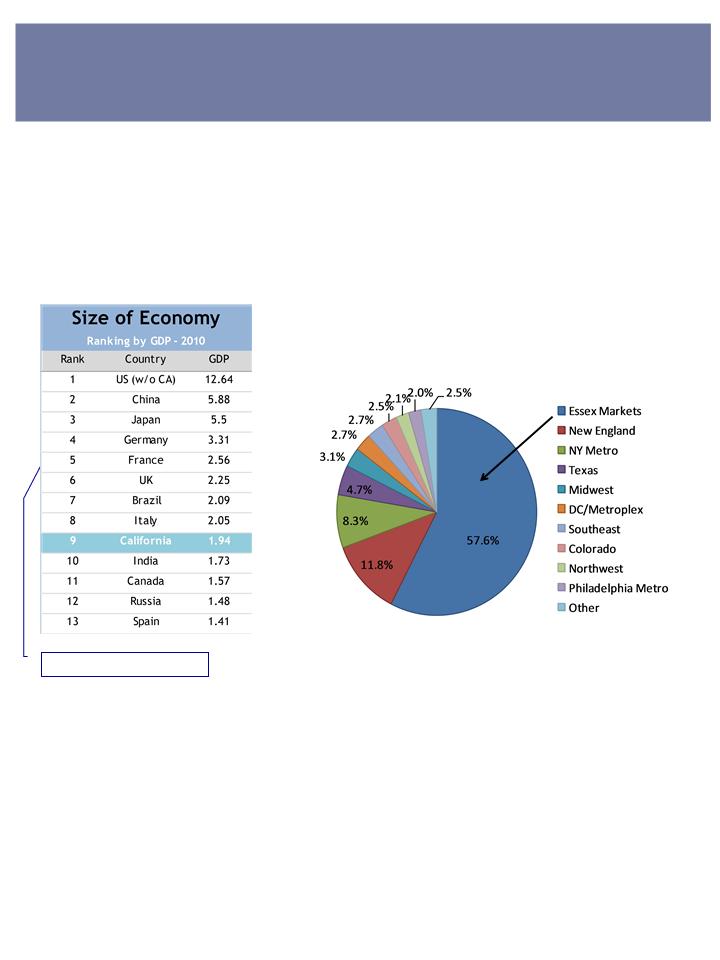
§ California and Washington combined are the 6th largest economy in the world
§ 58% of Venture Capital spending is in our markets - key driver of growth industries & jobs
§ Incoming Echo Boomers (64 million) & quality of life factors favor the West Coast
§ Higher percentage of educated workers
Source: PriceWaterhouseCoopers
Source: World Development Indicators
Database, World Bank, 1 July 2011 & BEA
GDP of CA+WA = $2.29
The West Coast is a Dominant Economic Player
11
$3.8 billion
Essex Property Trust, Inc.
Venture Capital Spending (4Q 2011)

California Outperforms U.S. Average - Population & Jobs
|
Source: US Census
|
|
Source: BLS
|
12
Essex Property Trust, Inc.
6 Months of Outperformance
CA Outperforms

December Y-Y Job Growth: Selected Metros by % Growth
(000’s)
13
Source: BLS
§ Tech/ Energy based markets are leading the way
§ LA job growth improving and expected to be 1% in 2012
Essex Portfolio Contains Leading Job Growth Markets
Job Growth: 1.8 million jobs created in U.S. and 157,000 in Essex markets in
2011
2011
Essex Property Trust, Inc.
|
Top 20 Markets
|
Absolute
Change |
% Growth
|
|
|
|
|
|
San Jose
|
25.7
|
3.0%
|
|
Houston
|
75.8
|
3.0%
|
|
|
|
|
|
San Diego
|
26.9
|
2.2%
|
|
|
|
|
|
San Francisco
|
19.7
|
2.1%
|
|
Inland Empire
|
22.9
|
2.0%
|
|
Miami
|
18.2
|
1.8%
|
|
Jacksonville
|
10.6
|
1.8%
|
|
Orange County
|
24.6
|
1.8%
|
|
|
|
|
|
Ventura
|
4.6
|
1.7%
|
|
Dallas Ft Worth
|
45.7
|
1.6%
|
|
Boston
|
37.9
|
1.5%
|
|
Portland
|
14.3
|
1.5%
|
|
Detroit
|
24.6
|
1.4%
|
|
Baltimore
|
17.1
|
1.3%
|
|
Newark NJ
|
12.7
|
1.3%
|
|
Minneapolis
|
19.8
|
1.2%
|
|
|
|
|
|
US
|
1,767
|
1.3%
|
14
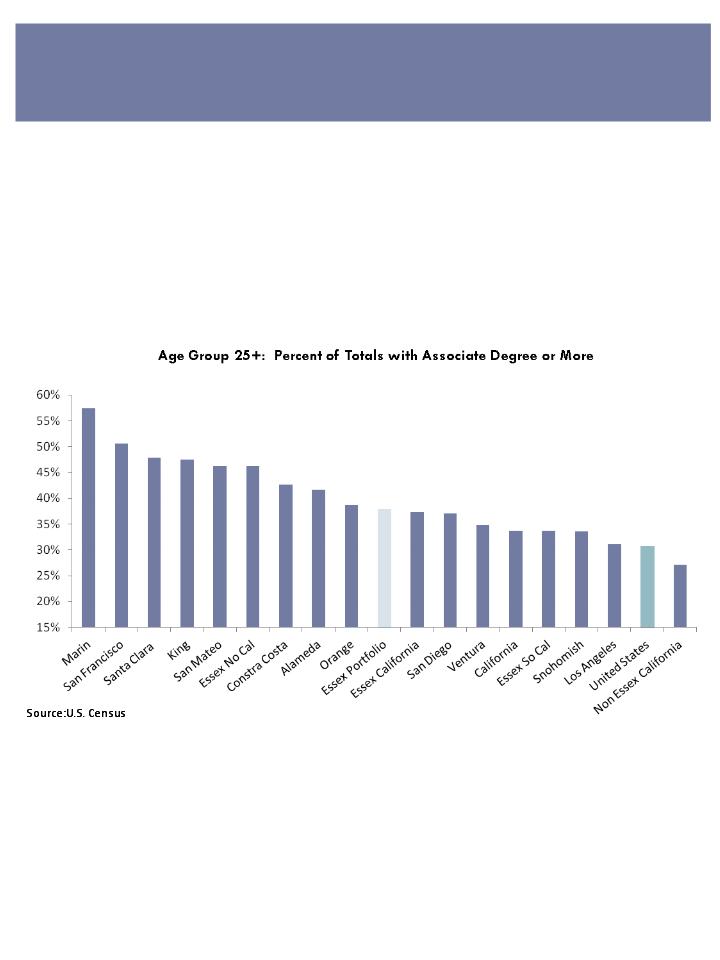
Education Data for Essex Counties & State/U.S. Data
§ Essex’s tech markets have a significantly higher percentage of college
educated workers.
§ These markets should continue to lead job and personal income growth
§ Concentrated in the highest skilled California counties
Essex Attracts Higher Wage Renters
Essex Property Trust, Inc.

15
§ High Single-Family Prices Restrict Homeownership
§ Despite the fall in home prices since 2008, prices remain high in
supply-constrained markets
|
Source: National Association of Realtors, Dataquick, Essex
|
Expensive Single Family Housing
Essex Property Trust, Inc.

16
Conclusions:
§ When single family supply recovers, we expect a sharp rebound in
the non-constrained markets
§ The coastal rental markets will have less competition from for-sale as
compared to 2003 - 2007, due to more restrictive lending standards and
higher housing costs
|
Source: U.S. Census
|
For-Sale Supply Risk Low
Essex Property Trust, Inc.
Essex Portfolio Average

Seattle Market Review
Average Rent
as a % of
Median Household Income
(in 000’s)
Job Growth
vs.
Total Residential Supply
(% change)
Actual Job Growth by Sector:
Dec. ‘11 vs. Dec. ‘10
Gap = 7.5% of
current rents
current rents
17
Source: Essex, U.S. Census, BLS
Office Absorption: 2.0% in 2011
Total Jobs Created (000’s) 36.9
0.2
11.2
6.3
0.7
-1.3
13.5
6.0
3.1
Boeing
- Expanding facilities
- Backlog of $300 billion
- Renewed commitment to WA state
Amazon
- Expands by 3 million sq ft.
0.8
-3.6

Northern California Market Review
(San Jose MSA Example)
Average Rent
as a % of
Median Household Income
(in 000’s)
Job Growth
vs.
Total Residential Supply
(% change)
Actual Job Growth by Sector:
Dec. ‘11 vs. Dec. ‘10
18
Gap = 1% of
current rents
current rents
Source: Essex, U.S. Census, BLS
Office Absorption: 3.9% in 2011
25.7
3.1
3.9
2.8
3.7
0.3
3.7
7.6
-0.2
Total Jobs Created (000’s)
1.6
-0.8

Southern California Market Review
(Los Angeles MSA Example)
Average Rent
as a % of
Median Household Income
(in 000’s)
Job Growth
vs.
Total Residential Supply
(% change)
Actual Job Growth by Sector:
Dec. ‘11 vs. Dec. ‘10
19
Gap = 9.7% of
current rents
current rents
Source: Essex, U.S. Census, BLS
Office Absorption: 0.6% for 2nd half
of 2011
of 2011
17.3
1.3
-3.7
3.1
5.4
7.2
-2.1
7.9
-0.7
-Government/construction job losses
are abating
are abating
- Y-o-Y job growth trends up in the
2nd half of 2011
2nd half of 2011
-Professional and business services
strengthening
strengthening
Total Jobs Created (000’s)
-0.6
-0.5
20
Southern California Market Review
Occupancy breaks through 95% for both markets for the first time since Q4 2007.
Essex Property Trust, Inc.
|
Source: Axiometrics, Realfacts
|
|
*LA/Orange Numerical Average
|

§ To Grow FFO/share, consistent with NAV Growth, in the top tier of
multifamily REITs
• Focus on improving operating platform
• Target acquisitions generating an unlevered return of 8.5-9%
• Target development generating at least 10% unlevered returns and
for unfunded commitments to represent 5-7% of total capital
• Target redevelopment generating unlevered returns of 8-10%
• Actively upgrade the portfolio through investment and property
sales
Section IV. Company Information
Essex Intermediate Goals
21
Essex Property Trust, Inc.

Multiple Investment Platforms
Committed approximately $2 billion of investments in acquisitions,
developments, redevelopments and co-investments since the beginning of 2010
developments, redevelopments and co-investments since the beginning of 2010
§ Acquisitions
- Targeting markets with high rent growth potential to enhance the quality
of the portfolio and to accelerate portfolio growth
- Since 2010, Essex has acquired over $1.2 billion of high quality and well-
located properties
§ Development
- Upgrading the portfolio
- Started five developments totaling $423 million in 2011
§ Co-Investments & Preferred Equity Investments
- Diversifying capital sources
- Enhancing risk adjusted returns
- Moderating portfolio volatility
§ Redevelopment
- Repositioning the portfolio and augmenting internal growth
- Capitalizing on the strategy of owning Class B quality assets in “A” locations
22
Essex Property Trust, Inc.

Active Acquirer Early in the Cycle
§ The 2010 and 2011 acquisitions are expected to generate
approximately a 5.5% yield in 2012
approximately a 5.5% yield in 2012
§ Upgraded the quality of our portfolio:
§ Average age of new investments is below the portfolio average
§ Average rents are higher as compared to the existing portfolio
Represents the consolidated same property portfolio as of 12/31/11 and the consolidated acquisitions as of 12/31/11.
23
Essex Property Trust, Inc.

Essex Skyline - Santa Ana, CA
24
416 on Broadway - Glendale, CA
Santee Court - Los Angeles, CA
Delano - Redmond, WA
Bon Terra - Redmond, WA
Reveal - Woodland Hills, CA
Anavia - Orange, CA
Allegro - Valley Village, CA

DEVELOPMENT PIPELINE
Currently have 5 active development projects totaling $423 million.
|
|
|
|
|
|
Estimated
Units |
|
Estimated retail
sq. feet |
|
Incurred to
Date |
|
Estimated
Total Cost |
|
Construction
Complete |
|
Project Name
|
|
Location
|
|
|
|
|
|
|
|
|
|
|
|
|
|
|
|
|
|
|
|
|
|
|
|
|
|
|
|
|
Queen Anne (JV)
|
|
Seattle, WA
|
|
275
|
|
17,000
|
|
$33.5
|
|
$79.1
|
|
Mar-13
|
|
|
Epic (JV)
|
|
San Jose, CA
|
|
280
|
|
|
|
$36.7
|
|
$98.6
|
|
May-13
|
|
|
West Dublin (JV)
|
|
Dublin, CA
|
|
309
|
|
|
|
$23.1
|
|
$94.5
|
|
Jun-13
|
|
|
Santa Monica (JV)
|
|
West Hollywood, CA
|
|
184
|
|
12,750
|
|
$19.7
|
|
$75.4
|
|
Jul-14
|
|
|
Fountain at La Brea (JV)
|
|
West Hollywood, CA
|
|
187
|
|
18,200
|
|
$27.0
|
|
$75.0
|
|
Feb-14
|
|
|
Total Active Development Pipeline
|
|
1,235 |
|
47,950
|
|
$140.0 |
|
$422.6
|
|
|
||
ACTIVE DEVELOPMENT PIPELINE
(Dollars in Millions)
25
Essex Property Trust, Inc.
Queen Anne - Seattle, WA
Santa Monica - West Hollywood, CA

§ Capitalize on the strategy of owning Class B quality assets in “A” locations - supply
constraint in Essex markets results in older housing stock which leads to greater
renovation potential
§ Selective repositioning: rent justified improvements to maximize NOI and value
Highridge - Rancho Palos Verde, CA
255 units
$16.6 million renovation cost
$65,000 cost per unit
9.25% return
Redevelopment
Before
After
Before
After
The Pointe at Cupertino - Cupertino, CA
116 units
$8.0 million renovation cost
$69,000 cost per unit
9.5% return
REDEVELOPMENT
26

Fund & Joint Ventures
27
The co-investment program facilitates external growth via private capital,
provides a diversified source of equity and enhances risk adjusted returns.
This platform represents 19% of the units in Essex’s total portfolio.
Current Co-Investment Programs Consists of:
§ Fund II
- 14 well-positioned assets with dispositions beginning in 2012/2013
§ Programmatic Joint Ventures
- Wesco I - a 50/50 joint venture to acquire apartments. The joint
venture has invested $425 million to date.
- Wesco II - a 50/50 joint venture in preferred equity investment of $175
million
million
- Canada Pension Plan Investment Board (“CPPIB”) - 55% Essex/45%
CPPIB joint venture to develop Epic and West Dublin.
§ Single Asset Joint Venture
- Essex Skyline at MacArthur Place - a 50/50 joint venture investment in a
349-unit high-rise condominium
§ Development Joint Ventures with Regional Developers:
- Queen Anne- a 50/50 joint venture to develop and operate a 275-unit
community
community
- Fountain at La Brea - a 50/50 joint venture to develop and operate a 187-
unit community
unit community
- Santa Monica - a 50/50 joint venture to develop and operate a 184-unit
community
community
Essex Property Trust, Inc.

§ Leverage of 34% on a debt to total market capitalization basis, one of the lowest
within the multifamily peer group.
within the multifamily peer group.
§ Debt to adjusted EBITDA is expected to be approximately 7.0X by year-end 2012.
§ Nearly $400 million in available liquidity from cash on hand, marketable
securities, and unused balance on our line of credit
securities, and unused balance on our line of credit
§ Unencumbered NOI was 44% at year end 2011 vs 35% at year end 2010. Expect
to be at +50% by year end 2012.
to be at +50% by year end 2012.
§ Limited near term debt maturing with less than 15% of debt coming due over the
next 3 years
next 3 years
§ Achieved investment grade ratings : S&P: BBB; Moody’s: Baa2; and Fitch: BBB
Conservatively Proportioned and Flexible Balance Sheet
28
Source: Company filings as of 12/31/11
Essex Property Trust, Inc.

2012 Guidance
FFO Per Share Guidance
$6.50-$6.80
Same Property Revenue Growth (Midpoint)
6.0%
Same Property NOI Growth of the Consolidated portfolio (Midpoint) *
7.7%
Market Expectations
2012
2012
2012
Market
Market
Market
Job Growth
Rent Growth
Occupancy
Southern California
1.2%
6.2%
95.6%
Northern California
1.7%
8.0%
96.8%
Seattle Metro
1.8%
9.0%
95.5%
Weighted Average
1.4%
7.4%
96.0%
US Economic Assumptions
GDP Growth of 2.6%
Job Growth of 1.3%
Target Acquisitions
$300 million - $500 million
* Excludes joint ventures which have greater exposure to Seattle and Northern California
29
Essex Property Trust, Inc.

Key Strengths
§ Attractive market fundamental in our West Coast markets
§ Strong growth prospects
§ Internal growth is forecast at 7.7% in ’12
§ External growth through development and acquisitions
§ Strong balance sheet with ample financial flexibility to take
advantage of attractive opportunities as they arise
§ Proven management team with superior results
30
Essex Property Trust, Inc.

___________________________
___________________________
___________________________
___________________________
___________________________
___________________________
___________________________
___________________________
___________________________
___________________________
___________________________
___________________________
___________________________
NOTES

Via - Sunnyvale, CA
416 on Broadway - Glendale, CA
Joule - Seattle, WA
For additional information, please contact the Company’s
Investor Relations department at (650) 849-1600.
Investor Relations department at (650) 849-1600.
Fourth & U - Berkeley, CA
Axis 2300 - Irvine, CA
Arbors at Park Rose - Oxnard, CA