Attached files
| file | filename |
|---|---|
| EX-23 - EXHIBIT 23 - ATRION CORP | a5019114ex23.htm |
| EX-21 - EXHIBIT 21 - ATRION CORP | a5019114ex21.htm |
| EX-31.2 - EXHIBIT 31.2 - ATRION CORP | a5019114ex31_2.htm |
| EX-32.2 - EXHIBIT 32.2 - ATRION CORP | a5019114ex32_2.htm |
| EX-31.1 - EXHIBIT 31.1 - ATRION CORP | a5019114ex31_1.htm |
| EX-32.1 - EXHIBIT 32.1 - ATRION CORP | a5019114ex32_1.htm |
| EX-10.V - EXHIBIT 10V - ATRION CORP | a50191194ex10_v.htm |
| EXCEL - IDEA: XBRL DOCUMENT - ATRION CORP | Financial_Report.xls |
| 10-K - ATRION CORPORATION 10-K - ATRION CORP | a50191194.htm |
Exhibit 13.1
|
Company/Index
|
2006
|
2007
|
2008
|
2009
|
2010
|
2011
|
||||||||||||||||||
|
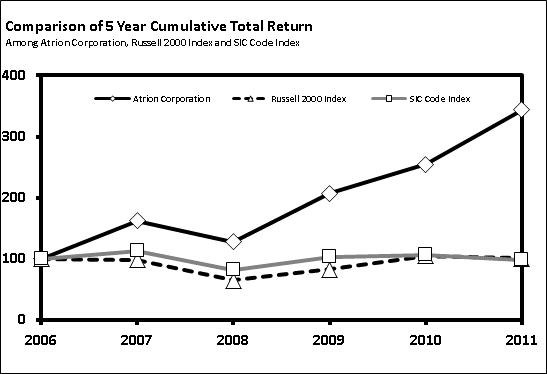
Atrion Corporation
|
$100.00 | $162.45 | $127.50 | $206.84 | $254.36 | $343.72 | ||||||||||||||||||
|
Russell 2000 Index
|
$100.00 | $98.44 | $65.18 | $82.89 | $105.16 | $100.77 | ||||||||||||||||||
|
SIC Code Index
|
$100.00 | $112.88 | $81.88 | $103.60 | $106.28 | $98.60 | ||||||||||||||||||
The graph set forth above compares the total cumulative return for the five-year period ended December 31, 2011 on the Company's common stock, the Russell 2000 Index and SIC Code 3841 Index--Surgical and Medical Instruments (compiled by Zacks Investment Research, Inc.), assuming $100 was invested on December 31, 2006 in our common stock, the Russell 2000 Index and the SIC Code Index and dividends were reinvested.