Attached files
| file | filename |
|---|---|
| 8-K - FORM 8-K - Crestwood Midstream Partners LP | d312713d8k.htm |
 Morgan Stanley MLP and Diversified
Natural Gas Corporate Access Day
March 8, 2012
Exhibit 99.1 |
 Forward Looking Statements
2
This
presentation
contains
forward-looking
statements
and
projections,
made
in
reliance
on
the
safe
harbor
provisions
of
the
Private
Securities
Litigation
Reform
Act
of
1995,
regarding
future
events,
occurrences,
circumstances,
activities,
performance,
outcomes
and
results
of
Crestwood
Midstream
Partners
LP
(“Crestwood”
or
“CMLP”).
Although
these
statements
reflect
the
current
views,
assumptions
and
expectations
of
Crestwood’s
management,
the
matters
addressed
herein
are
subject
to
numerous
risks
and
uncertainties,
which
could
cause
actual
activities,
performance,
outcomes
and
results
to
differ
materially
from
those
indicated.
However,
a
variety
of
factors
could
cause
actual
results
to
materially
differ
from
Crestwood’s
current
expectations
in
financial
condition,
results
of
operations
and
cash
flows
including, without limitation, changes in general economic conditions; fluctuations
in natural gas prices; the extent and success
of
drilling
efforts,
as
well
as
the
extent
and
quality
of
natural
gas
volumes
produced
within
proximity
of
our
assets;
failure
or
delays
by
our
customers
in
achieving
expected
production
in
their
natural
gas
projects;
competitive
conditions
in
our
industry;
actions
or
inactions
taken
or
non-performance
by
third
parties,
including
suppliers,
contractors,
operators,
processors,
transporters
and
customers;
our
ability
to
consummate
acquisitions,
successfully
integrate
acquired
businesses,
and
realize
any
cost
savings
and
other
synergies
from
any
acquisition;
fluctuations
in
the
value
of
certain
of
our
assets
and
liabilities;
changes
in
the
availability
and
cost
of
capital;
operating
hazards,
natural
disasters,
weather-related
delays,
casualty
losses
and
other
matters
beyond
our
control;
timely
receipt
of
necessary
government
approvals
and
permits,
our
ability
to
control
the
costs
of
construction,
including
costs
of
materials,
labor
and
rights-of-way
and
other
factors
that
may
impact
our
ability
to
complete
projects
within
budget
and
on
schedule;
the
effects
of
existing
and
future
laws
and
governmental
regulations,
including
environmental
and
climate
change
requirements;
the
effects
of
existing
and
future
litigation;
and
risks
related
to
our
substantial
indebtedness;
and
other
factors
disclosed
in
Crestwood’s
filings
with
the
Securities
and
Exchange
Commission.
The
forward-looking
statements
included
in
this
presentation
are
made
only
as
of
the
date
of
this
presentation,
and
we
undertake
no
obligation
to
update
any
of
these
forward-looking
statements
to
reflect
new
information,
future
events
or
circumstances
except
to
the
extent
required
by
applicable
law. |
 Table of Contents
1.
Antero Marcellus Overview
2.
Crestwood Update
3.
Financial Overview
3 |
 Antero Marcellus Overview
4
*
*
*
*
*
* |
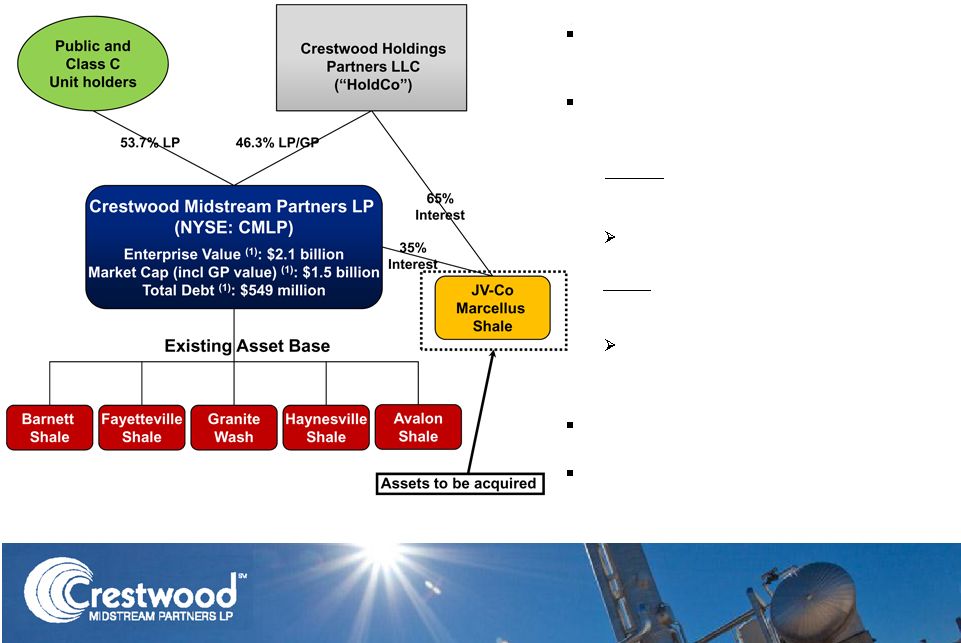
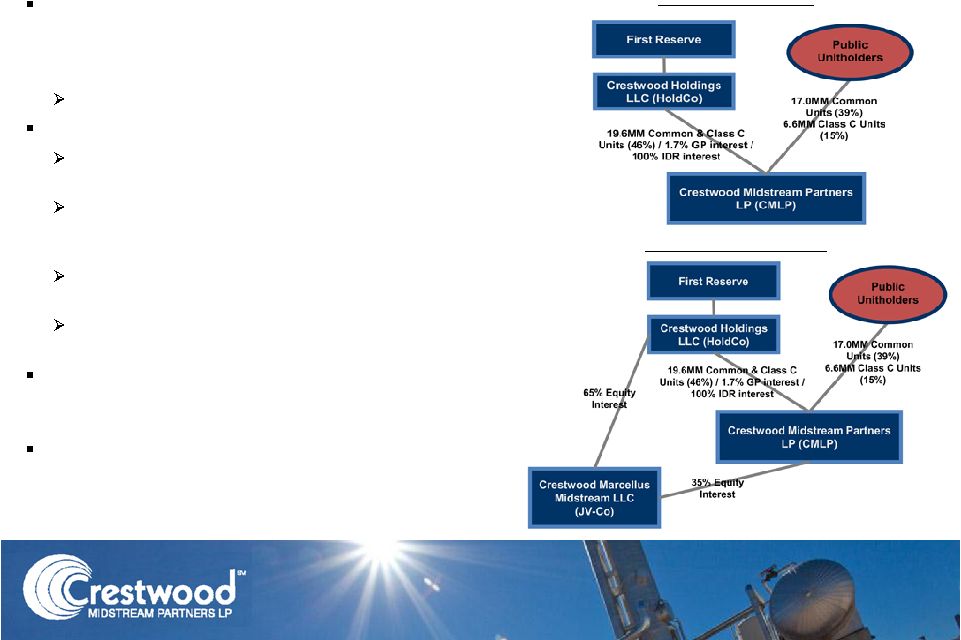 Transaction Overview
Current Structure
Joint venture (“JV-Co”) between CMLP and
Crestwood Holdings (Holdco) to acquire
gathering system assets in the Marcellus
Shale from Antero Resources
CMLP will be operator of JV-Co
Total purchase price of $375 million at closing
HoldCo to own 65% and CMLP to own 35% at
Closing
CMLP will fund its pro rata portion with
available borrowing capacity under its $500
MM revolving credit facility
New $200MM revolver at joint venture level will
fund growth capex
$40 MM potential earn-out to Antero if volumes
exceed thresholds during 2012 and 2013
Strategy for HoldCo to drop its 65% interest in
JV-Co to CMLP over time as the growth / build-
out stage is completed
CMLP has access to baked-in growth through
future drop-down acquisitions from HoldCo at
attractive multiples
5
Pro Forma Structure |
 Enhances
Crestwood’s
long-term
growth
strategy
(5
th
acquisition
completed in past 18 months)
Provides material footprint in the Marcellus Shale, the premier shale
play in North America
Substantial rich-gas exposure
Provides further geographic and producer diversification
Antero is a leading unconventional gas producer with some of the
lowest F&D and net development costs in the industry
Maintains 95% fixed fee contract mix
Creates a drop-down opportunity with higher visibility to built-in growth
at CMLP
Significant downside protection through minimum volume
commitments extending through 2018
7 year right of first offer on additional rich gas acreage improves long-
term portfolio
Strategic Rationale
6 |
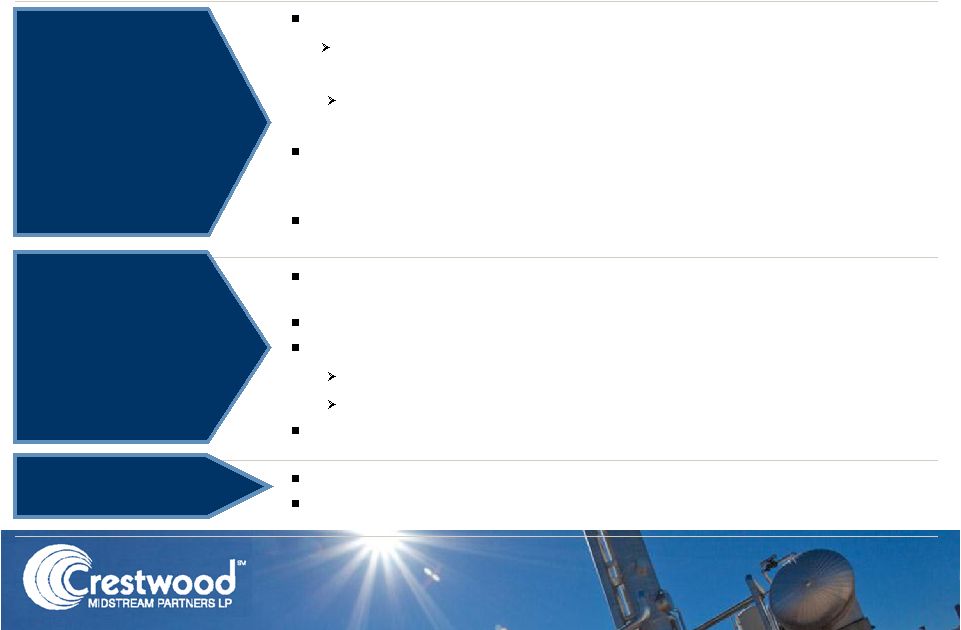
 Transaction Merits
The Southwest portion of the Marcellus Shale is among the
most prolific natural gas play in North America
~45% of drilling locations in the rich gas window (>1075 Btu)
Increases exposure to liquids rich production areas that
provide producers greater drilling economics in today’s
low gas price environment
Opportunity to expand gathering relationship with Antero
through a 7 year right of first offer on any future
development of Antero’s Doddridge County acreage
adjacent to current Area of Dedication (“AOD”)
Substantial minimum volume commitments provide visibility
into the “ultimate downside”
risk for the transaction
At the minimum volume levels, net cash flows are sufficient to
provide accretion to CMLP’s distributable cash flow per unit
Volume commitments improve action ability for future drop-
downs
Assets Located in
Core Fairway of the
Marcellus Shale with
Material Rich Gas
Exposure
Downside
Protected by 7 Years
of Substantial
Minimum Volume
Commitments
7 |
 Transaction Merits (cont’d)
Substantial experience developing unconventional resources
~300
horizontal
shale
wells
in
the
Barnett
Shale,
Woodford
Shale
and
Marcellus
Shale
Antero is drilling top-tier wells in the Marcellus Shale and has
consistenty been a low-cost leader across all unconventional plays
Antero currently has hedged 710 Bcfe of future production at average
NYMEX price of $5.53 / MMBtu; 84% of 2012E production hedged at
average NYMEX price of $5.69 / MMBtu
Over 35% of Antero operated Marcellus wells have an EUR of 10 Bcf or
higher
Antero to dedicate approximately 127,000 gross acres; operates 100% of
its acreage in the AOD
~2.8 Tcfe of net proved reserves attributable to Antero’s Marcellus
acreage Antero has drilled and completed 59 wells in the AOD
Average IPs of 13 MMcf/d and average EURs of 9 Bcf per well
2 years of production history to support EURs
Gross operated production within the AOD currently ~210 MMcfd
100% Fee-based, 20-year contracts
No direct commodity price exposure
Acreage Dedication
Area De-Risked
Through Substantial
Production History
100% Fee-Based
Contract Structure
Anchor Tenant with
Track Record as a
“Best In Class
Operator”
8 |
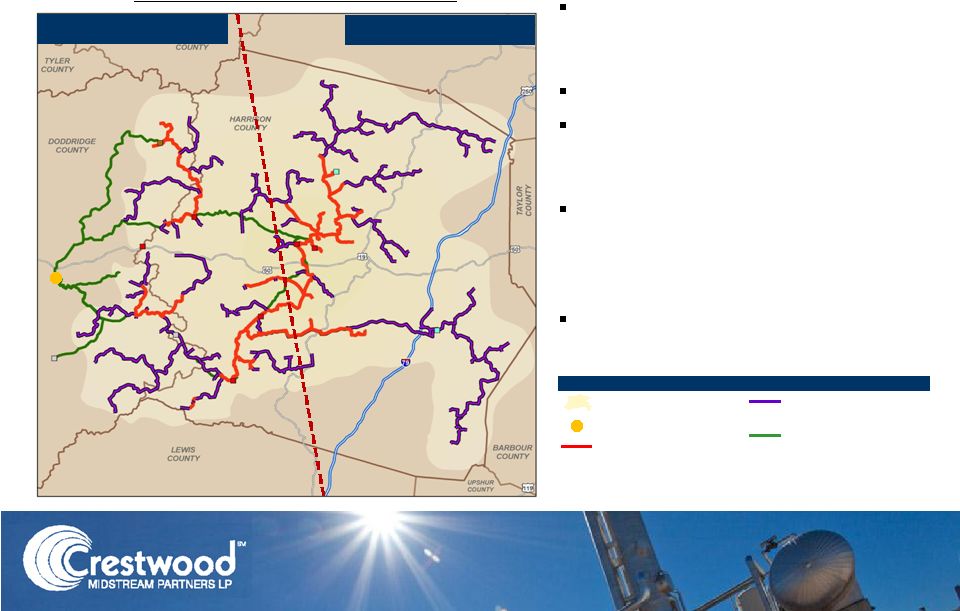 Antero Marcellus Midstream Overview
AOD encompasses ~260,000 gross
acres in most prolific gas play in
U.S.
~2.8 Tcfe of net proved reserves
Antero is currently running 6 rigs
in the AOD; ~210 MMcfd currently
flowing to the system
Significant acreage (~45%) of the
AOD in area of potential rich gas
wells that will be gathered to the
MWE Sherwood plant
Inventory of 800+ Antero wells and
300+ 3
rd
party wells
Rich Gas Service
Lean Gas Service
Legend
Area of Dedication (AOD)
Planned MWE Sherwood Plant
Pipeline in Service at YE 2012
Planned Pipeline (2013 –
2016)
Existing and Planned Third
Party Pipeline
5-Year Midstream Development Plan
9 |
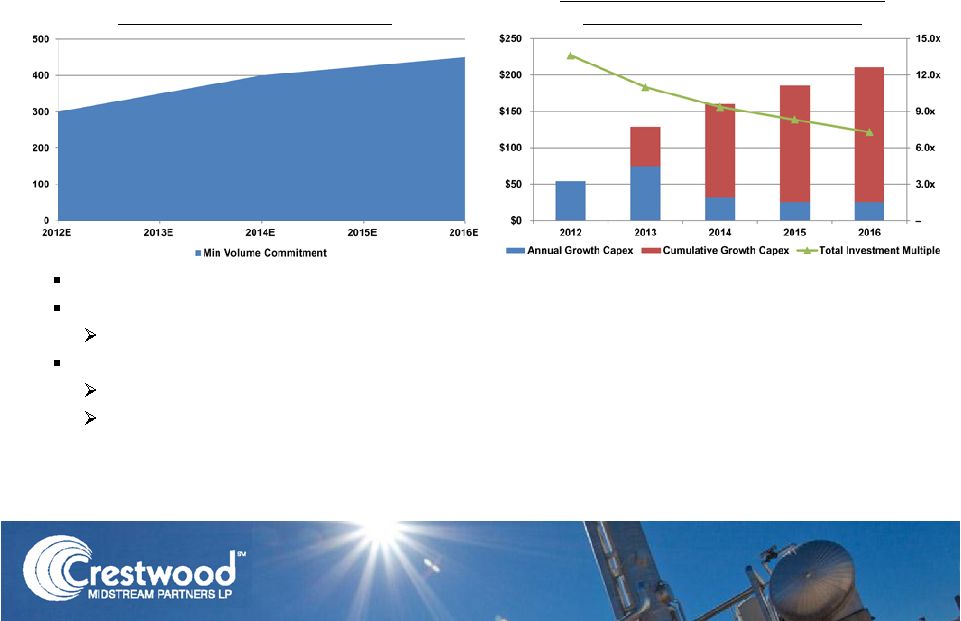 Volume Growth Drives Down Multiple
Minimum Volume Commitment
Estimated Capital Requirements and
Return on Capital Investment
(1)
1)
Return on Capital Investment represents the total cumulative capital investment for
Antero Marcellus JV (i.e. $375 MM purchase price at closing plus ~$210 MM in
estimated growth capital expenditures over the next five years) divided by the estimated cash flow attributable to the asset.
The multiple does not take capital
structure / financing plans into consideration (i.e. solely represents the cash
flow generated relative to the total capital requirements). MMcfd
($MM)
10
$375 million acquisition at closing (implied purchase multiple of 11x -
12x)
Expected future capital spend of ~$200+ million over the next five years
Financed with $200 million revolving credit facility at the JV entity
Antero’s current drilling plans generate substantial volume growth to the
system Drives
multiple
of
total
invested
capital
down
to
~6.5x
–
7.0x
by
2016
Minimum volume commitment provides high visibility to the projected growth
(significant portion of volumetric forecast over the next five years is
guaranteed) |
 Crestwood Update
11
*
*
*
*
*
* |
 A
Consolidated Enterprise Capitalized for Growth 1)
Pro Forma CMLP’s funding of the 35% interest in the Antero Marcellus JV.
12
Capital structure provides competitive
advantage and positions Crestwood
for substantial growth
Strong sponsorship and financial
support provides access to multiple
“buckets”
of capital
HoldCo
–
First Reserve equity capital,
Term Loan B markets, JV-Co revolving
credit facility
Capital for early-stage acquisitions /
development projects
CMLP
–
equity capital markets, debt
capital markets, CMLP revolving
credit facility
Capital for acquisitions /
development projects that provide
immediate accretion to distributable
cash flow per unit
Opportunity
for
drop
down
of
assets
from
HoldCo
to
CMLP
Strategic
capital
allocation
and
financing
solutions
designed
to
maximize
value
creation |
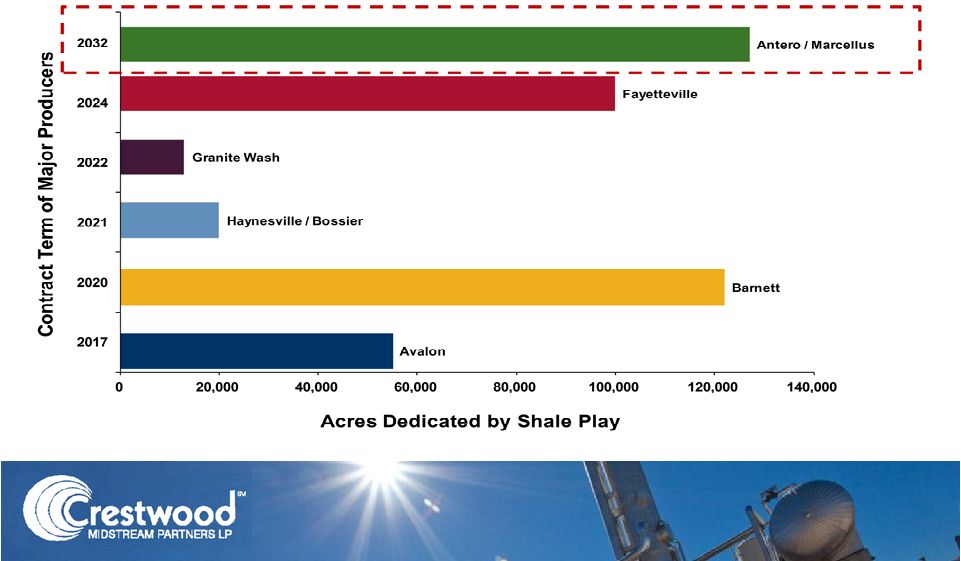
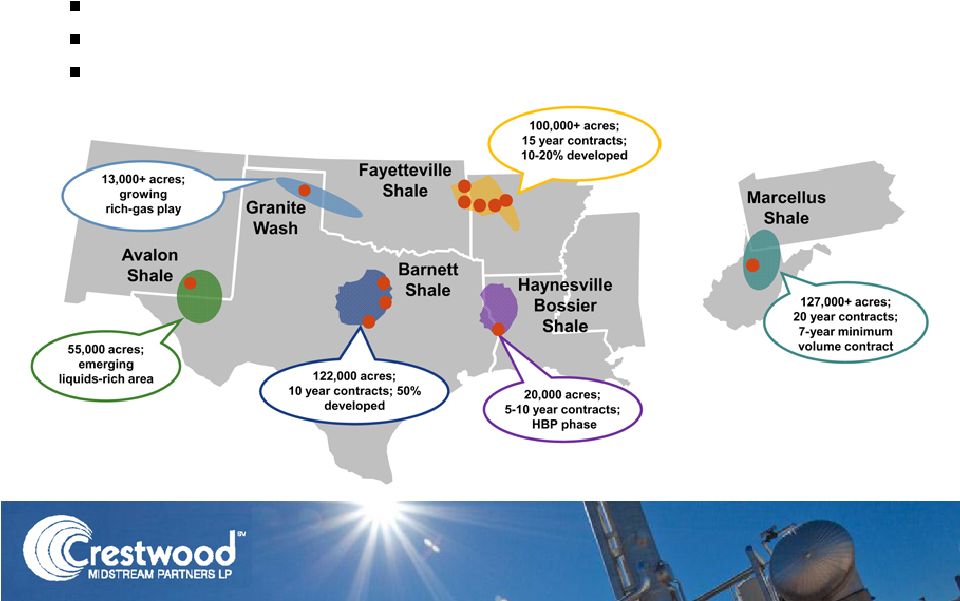 Assets in Leading Shale Plays
~437,000 acres dedicated to Crestwood pro forma for the Antero acquisition
Producer contracts extending through 2017-2032 enable long term
development Pace of drilling, well connects and capacity expansions drive
growth 13 |
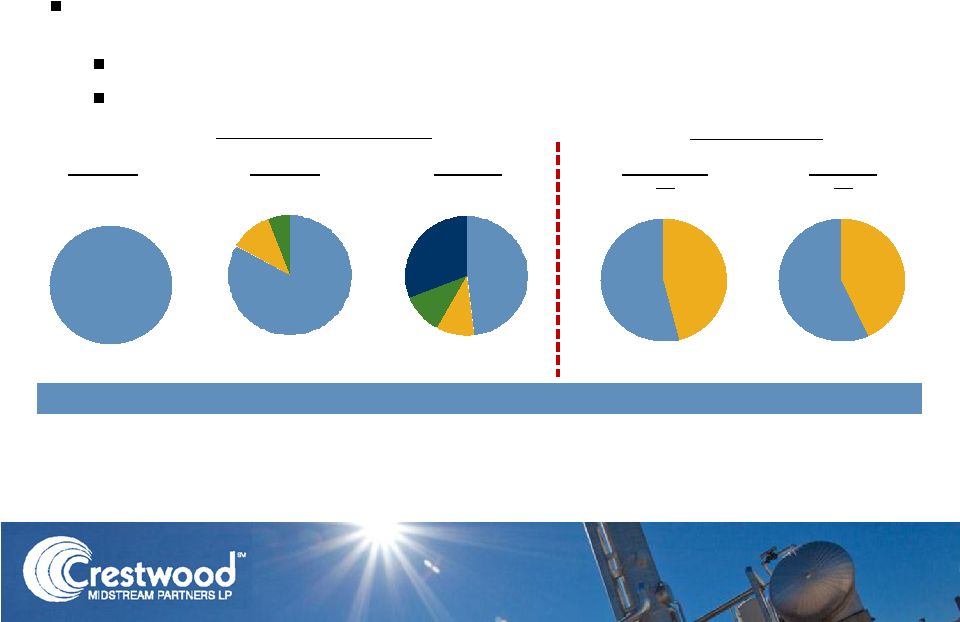 Rich Gas
43%
Dry Gas
57%
Continued Strategy of Diversification
2010A
2011A
2012E
1)
Includes Haynesville/Bossier Shale, Granite Wash, and Avalon Shale.
2)
Represents 100% of JV-Co volumes.
3)
Represents net revenues for each system (total revenues, net of product purchases).
On a gross basis, revenues from rich gas plays account for ~53% and ~51% of
total revenues in 2011 and 2012E, respectively. Revenues from dry gas plays include Alliance and Lake Arlington systems
in the Barnett Shale,
Fayetteville Shale, Haynesville/Bossier Shale and JV-Co revenues coming from
development of Antero’s dry gas acreage. Revenues from rich gas plays include
the Cowtown system in the Barnett Shale, Granite Wash, Avalon Shale and JV-Co
revenues coming from development of Antero’s rich gas acreage. Continued
Focus on De-Risking the Partnership through Diversification Expand presence
into new basins reducing single-producer and single-basin
dependence
Marcellus acquisition further reduces dependence on the Barnett Shale
~40% -
50% of Crestwood’s net revenues from rich gas plays
Barnett
100.0%
Barnett
83.0%
Other
5.7%
Fayetteville
11.3%
(1)
Fayetteville
10.1%
Barnett
48.1%
Other
10.6%
Marcellus
31.2%
(1)
Current
(3)
2012E
(3)
Rich Gas
46%
Dry Gas
54%
(2)
14
% of Gathering Volumes
% of Revenues |
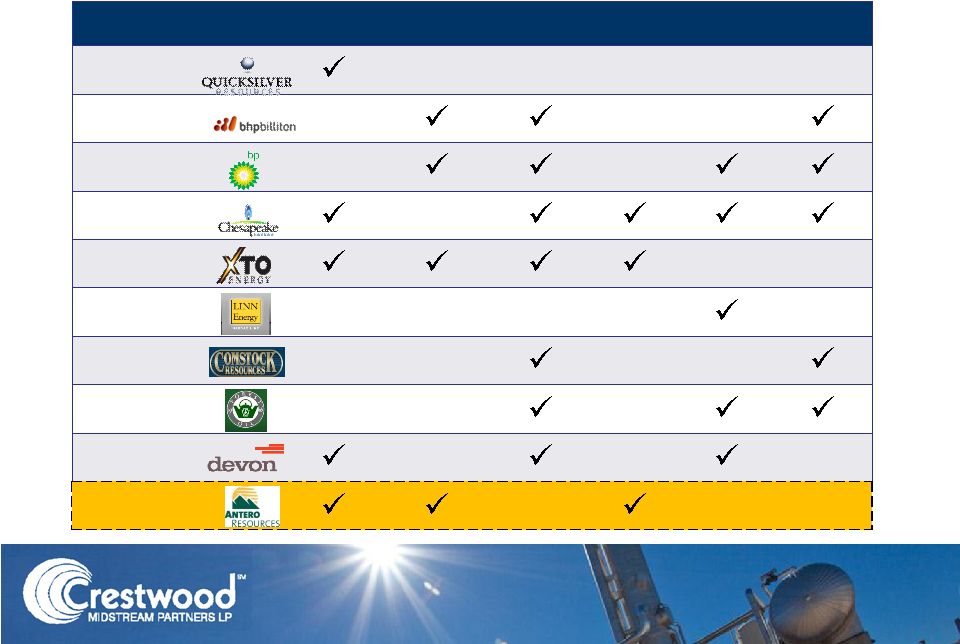 Experienced Shale Producers
Barnett
Fayetteville
Haynesville
Marcellus
Granite
Wash
Eagle Ford
Quicksilver
Resources
BHP Billiton
BP
Chesapeake
XTO
Linn Energy
Comstock
Forest Oil
Devon
Antero
Note: Check marks represent areas of general operation for select producers; they
are not indicative of locations where Crestwood has contracts with select producers
15 |
 Long Term Fixed Fee Contracts
Our contract portfolio is > 95% Fixed Fee
16 |
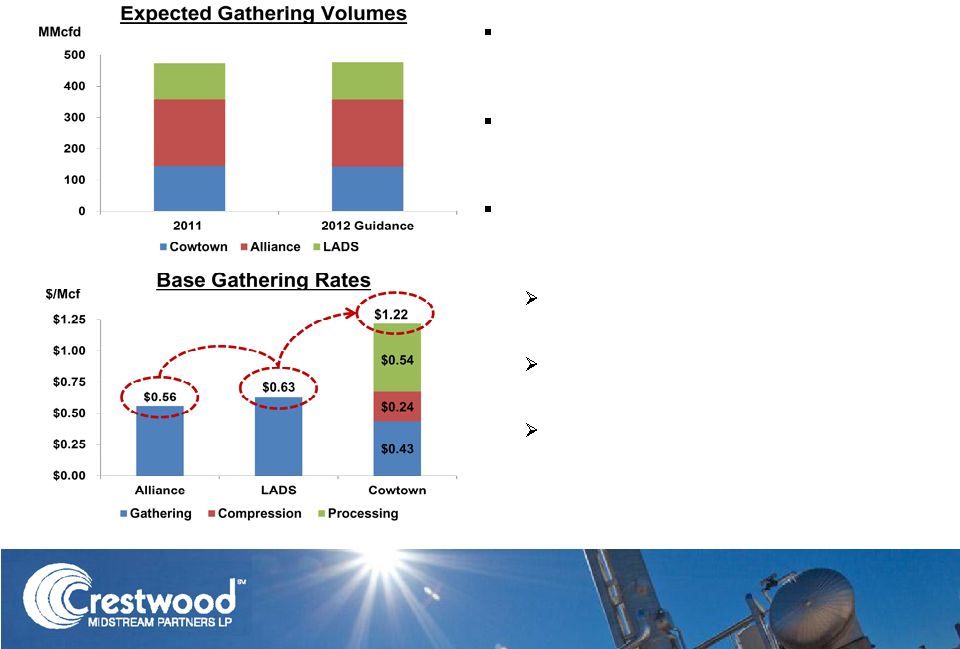 Barnett Shale Outlook
Volumes expected to be relatively flat in
Barnett Shale per latest guidance from
KWK
Significant shift in new drilling activity to
focus on liquids-rich corridor in Cowtown
gathering area
Combined gathering and processing fee in
Cowtown drives higher margin for
Crestwood
Favorable drilling economics with
current high NGL price environment
Largest acreage dedication with 10+
years of rich gas project inventory
Ample capacity to meet growing
processing demand
17 |
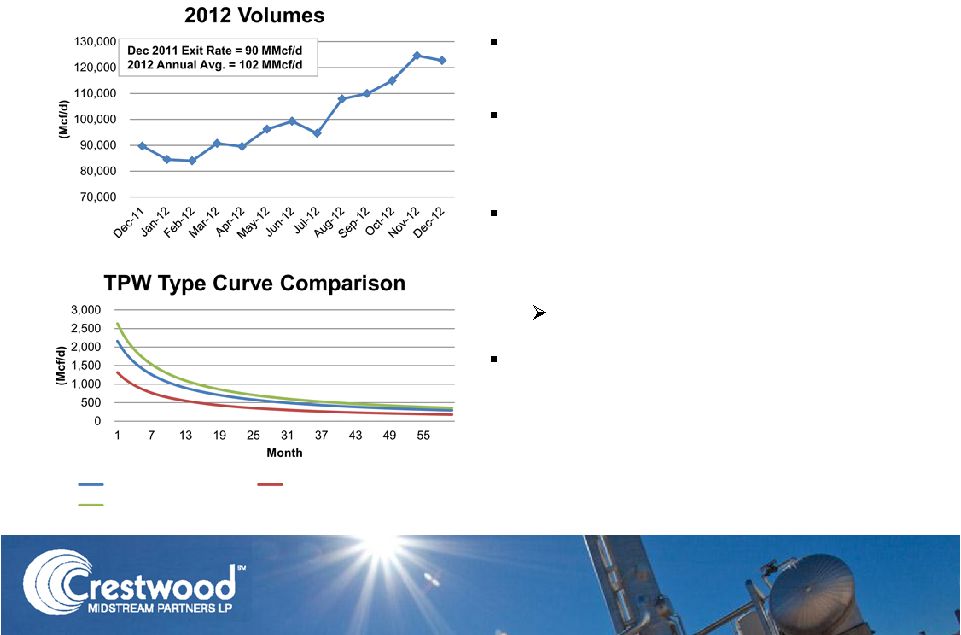 Fayetteville Shale Outlook
BHP currently running two drilling
rigs on CMLP acreage
Expected drilling and completion
activity for BHP in 2012 roughly flat
to activity from CHK in 2011
Type curve continues to outperform
the assumptions at completion of
the Frontier acquisition
Current EUR of ~3.0 Bcf
13% volume growth expected in
2012 over the December 2011 exit
rate of ~90 MMcfd
18
Acq. 2.7 Bcf EUR Curve
Acq. 1.5 Bcf EUR Curve
Updated 3.0 Bcf EUR Curve |
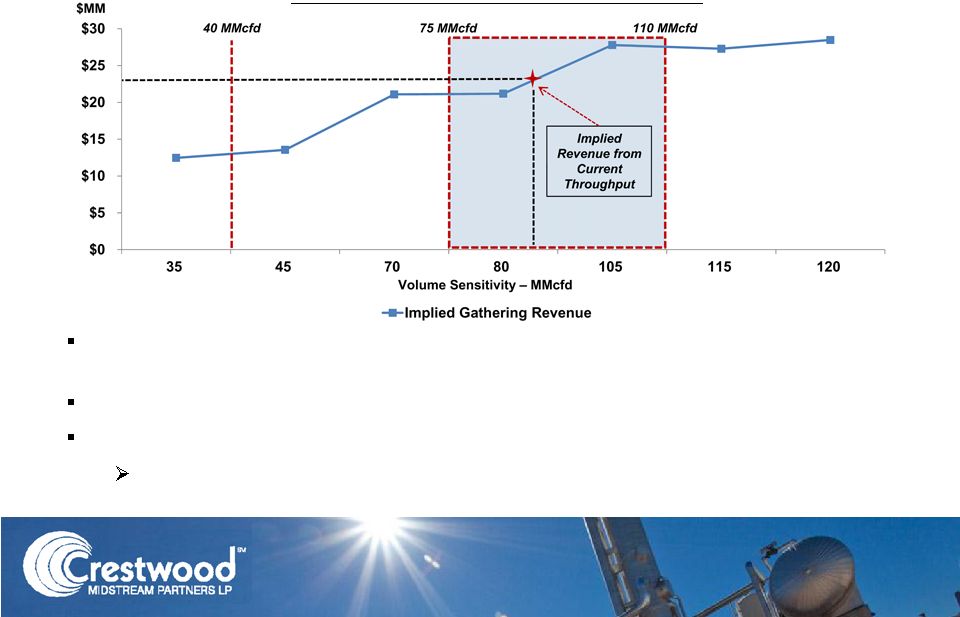 Fayetteville Shale Outlook (cont’d)
Sliding scale incentivizes producer to increase gathering volumes through
system (current rate of $0.725 / MMBtu plus treating fees)
Provides downside risk protection to Crestwood
Rate adjustments triggered at 40 MMcfd, 75 MMcfd and 110 MMcfd
Increases in throughput above 110 MMcfd produce linear increases in
revenues
Gathering Volume & Revenue Sensitivity
19 |
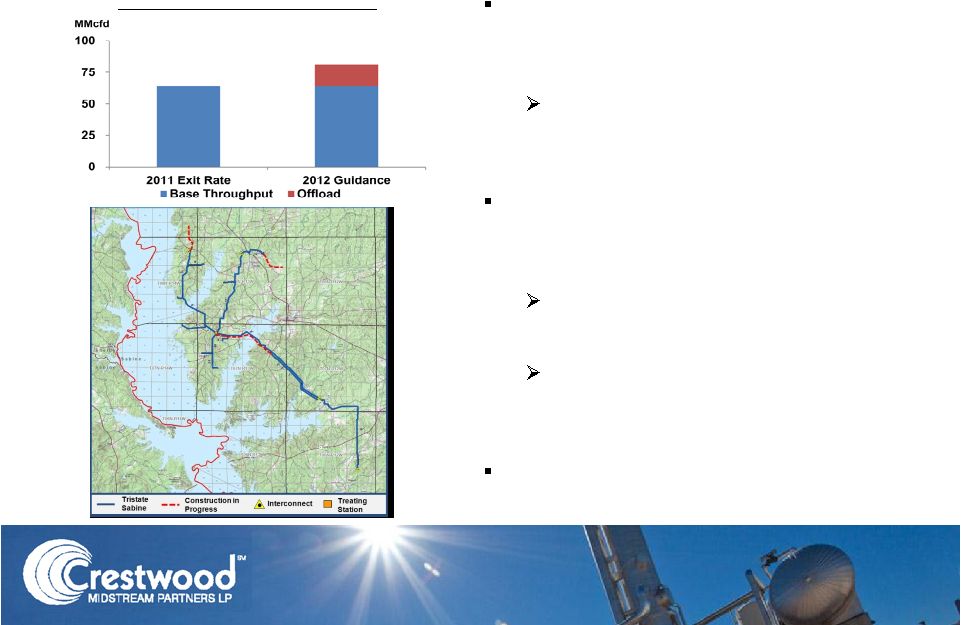 Haynesville/Bossier Outlook
Expected drilling activity in the area
continues to slow in weaker gas price
environment
Volumes from new completions
expected to be relatively flat in
2012 relative to 2011 exit rate
Total system volume growth driven by
recent off-load agreement with nearby
adjacent producer
Volumes near system capacity in
2012
Additional CO
2
treating facility
required to handle incremental
volumes
Tristate Sabine continues to prove out
as a reasonable value acquisition
Expected Gathering Volumes
20 |
 Continued opportunity / optionality for CMLP’s rich gas systems (Granite Wash and
Avalon Shale) as producer activity continues to increase
No capital projects included in current 2012 guidance
Advanced discussions with existing producers continue to progress
CMLP to provide updates and adjustments to 2012 guidance once definitive agreements
are reached
120
MMcfd
and
60
MMcfd
processing
plants
available
for
immediate
installation
or
relocation
Competitive advantage over new-build projects that would likely have
multi-year lag prior to installation
Indian Creek –
Granite Wash
Granite Wash currently one of the most active plays in North America
Continued discussion with producers on opportunities for installation of available
processing capacity
Las Animas –
Avalon Shale
Substantial
increases
in
recent
drilling
activity
as
producers
work
to
“prove
up”
their
Avalon
/
Bone Spring positions
Upstream activity currently restrained by infrastructure limitations
CMLP’s footprint and readily available processing capacity provides potential
for “first mover”
advantage
Rich Gas Development Outlook
21 |
 Financial Overview
22
*
*
*
*
*
*
*
* |
 Strategically Financing Significant Growth
1)
Revolver paydown represents the balance of equity and debt financing in excess of
the actual capital requirements. 2)
$131 MM represents capital contribution for CMLP’s 35% proportionate interest
(total Antero purchase price of $375 MM). Utilization of a
consolidated capital
structure (including
continued support from
the General Partner) to
acquire and integrate
world-class assets will
always be a key
component of CMLP’s
strategy
In the last 18 months,
CMLP Management has
completed 5 acquisitions
with total transaction value
of ~$1.5 billion
Conservatively financed
growth with approximately
50% equity and 50% debt
23
Uses of Funds
Sources of Funds
Transaction
Capital
Investment
Equity
Debt
Total
Financing
Sources
($MM)
2011
Avalon Acquisition
5.1
$
-
$
5.1
$
5.1
$
Frontier Acquisition
344.6
$
153.0
$
200.0
$
353.0
$
May 2011 Follow-On Equity Offering
-
$
53.0
$
(53.0)
$
-
$
Tristate Acquisition
64.4
$
-
$
64.4
$
64.4
$
Capital Expenditures
48.4
$
-
$
48.4
$
48.4
$
Revolver Paydown
(1)
-
$
-
$
(8.4)
$
(8.4)
$
Total -
2011
462.5
$
206.0
$
256.5
$
462.5
$
2012
January 2012 Follow-On Equity
-
$
103.0
$
(103.0)
$
-
$
Antero Acquisition
(2)
131.3
$
-
$
131.3
$
131.3
$
Revolver Paydown
(1)
-
$
-
$
-
$
-
$
Total -
2012 YTD
131.3
$
103.0
$
28.3
$
131.3
$
Total -
Since January 2011
593.7
$
309.0
$
284.7
$
593.7
$
% of Total
52.0%
48.0%
100.0% |
 2011 Performance
24
2011
2010
% Change
2011
2010
% Change
Volumes Gathered (MMcfd)
661.6
397.0
67%
570.3
343.3
66%
Volumes Processed (MMcfd)
148.3
125.9
18%
144.1
127.8
13%
($MM)
Revenues
59.3
$
31.3
$
205.8
$
113.6
$
Product purchases
(12.8)
-
(38.8)
-
O&M expense
(10.1)
(5.7)
(36.3)
(25.7)
G&A expense
(6.2)
(9.6)
(24.1)
(17.7)
Transaction related expenses
0.2
6.3
3.4
6.3
Adjusted EBITDA
30.4
$
22.3
$
36%
110.0
$
76.5
$
44%
Adjusted distributable cash flow
23.4
$
17.5
$
34%
87.8
$
63.3
$
39%
Cash distributions declared
20.7
$
14.3
$
70.5
$
52.4
$
Distribution coverage ratio
1.1x
1.2x
1.2x
1.2x
Retained cash flow
2.7
$
3.2
$
17.3
$
10.9
$
Distributions per Unit
0.49
$
0.43
$
14%
1.87
$
1.66
$
13%
Three Months Ended
Year Ended
December 31,
December 31, |
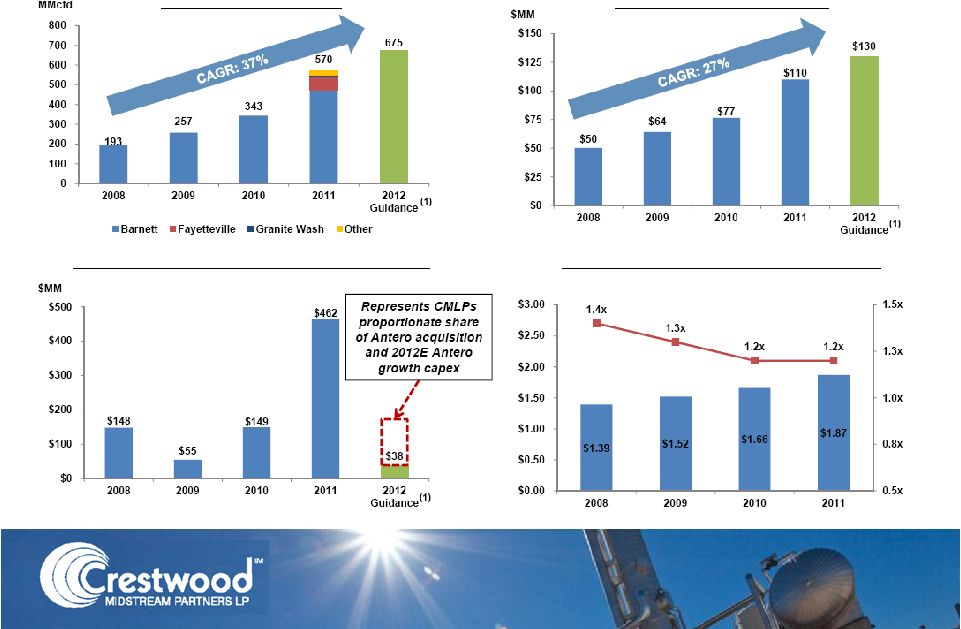 CMLP Historical Financial Summary
Throughput (MMcfd)
Adjusted EBITDA ($MM)
Capital Expenditures (Incl. Acquisitions)
Distributions per Unit and Coverage
1)
Represents the midpoint of 2012 guidance. Figures exclude contributions from the
recently announced Antero acquisition. 25 |
 Capitalization and Leverage
26
Pro Forma
December 31,
Pro Forma
December 31,
Capitalization
$ Millions
2011
Adustments
2011
Revolving credit facility
312.5
$
28.5
$
(1)
341.0
$
7.75% Senior Notes
200.0
200.0
Total debt
512.5
28.5
541.0
Partners' capital
455.6
102.8
(1)
558.4
Total capitalization
968.1
$
131.3
$
1,099.4
$
Debt / Total capitalization
53%
49%
Pro Forma LTM Adjusted EBITDA
119.1
$
(2)
5.1
$
(3)
124.2
$
Debt / Pro Forma Adjusted EBITDA
4.3x
4.4x
Maximum Permitted Leverage
5.5x
5.5x
(Increase from 5.0x for 270 days post acquisition)
Borrowing Capacity at 5.5x Leverage
142.6
$
142.1
$
(1)
Adjusted for $102.8 million of proceeds received from follow-on equity
offering in January 2012 and CMLP's 35% interest in the Antero acquisition,
expected to close by March 31, 2012.
(2)
Includes $9.1 million of pro forma EBITDA for Frontier and Tristate acquisitions
as defined in CMLP's credit agreement. (3)
Represents CMLP's 35% interest of EBITDA for the last twelve months related to
Antero acquisition. |
 Key
Investment Considerations Leading diversified portfolio of shale plays
Long-term fixed fee contracts with limited
commodity exposure
Growing cash flow as producers develop
dedicated acreage
14% YOY distribution growth with 1.2x
coverage ratio
Experienced management team and strong
general partner
27 |
 Non-GAAP Financial Measures
The following slides of this presentation provide reconciliations of the
non-GAAP financial measures adjusted EBITDA and adjusted distributable
cash flow to their most directly comparable financial measures calculated and presented in
accordance with generally accepted accounting principles in the United States of
America ("GAAP"). Our non-GAAP financial measures should not be
considered as alternatives to GAAP measures such as net income or operating income
or any other GAAP measure of liquidity or financial performance.
We define adjusted EBITDA as net income from continuing operations adjusted for
interest expense, income taxes, depreciation, amortization and accretion
expense and certain non-recurring expenses, including but not limited to items
such as transaction related expenses and gains/losses on the exchange of property,
plant and equipment. Adjusted EBITDA is commonly used as a
supplemental financial measure by senior management and by external users of our
financial statements, such as investors, research analysts and rating agencies, to
assess the financial performance of our assets without regard to financing
methods, capital structures or historical cost basis. We define adjusted distributable cash
flow as net income from continuing operations adjusted for: (i) the addition of
depreciation, amortization and accretion expense; (ii) the addition of
income taxes; (iii) the addition of non-cash interest expense; (iv) the subtraction of
maintenance capital expenditures and (v) certain non-recurring expenses,
including but not limited to items such as transaction
related
expenses
and
gains/losses
on
the
exchange
of
property,
plant
and
equipment.
The
GAAP
measure
most directly comparable to adjusted distributable cash flow is net income from
continuing operations. 28 |
 Non-GAAP Reconciliations
29
2008
2009
2010
2011
2010
2011
Total revenues
76,084
$
95,881
$
113,590
$
205,820
$
31,291
$
59,290
$
Product purchases
-
-
-
(38,787)
-
(12,777)
Operations and maintenance expense
(19,395)
(21,968)
(25,702)
(36,303)
(5,723)
(10,138)
General and administrative expense
(6,407)
(9,676)
(17,657)
(24,153)
(9,545)
(6,157)
Gain from exchange of property, plant and equipment
-
-
-
1,106
-
-
Other income
11
1
-
-
-
-
EBITDA
50,293
64,238
70,231
107,683
16,023
30,218
Non-recurring transaction related expenses
-
-
6,318
2,279
6,318
219
Adjusted EBITDA
50,293
64,238
76,549
109,962
22,341
30,437
Less:
Depreciation, amortization and accretion expense
13,131
20,829
22,359
33,812
5,663
9,831
Interest expense
8,437
8,519
13,550
27,617
4,742
7,692
Income tax provision (benefit)
253
399
(550)
1,251
(721)
353
Non-recurring transaction related expenses
-
-
6,318
2,279
6,318
219
Net income from continuing operations
28,472
$
34,491
$
34,872
$
45,003
$
6,339
$
12,342
$
Net income from continuing operations
28,472
$
34,491
$
34,872
$
45,003
$
6,339
$
12,342
$
Depreciation, amortization and accretion expense
13,131
20,829
22,359
33,812
5,663
9,831
Income tax provision (benefit)
253
399
(550)
1,251
(721)
353
Non-cash interest expense
6,096
3,836
4,961
3,473
1,638
931
Non-cash equity compensation
1,017
1,705
5,522
916
3,521
65
Maintenance capital expenditures
(1,890)
(10,000)
(6,600)
(1,409)
(1,650)
(384)
Distributable cash flow
47,079
51,260
60,564
83,046
14,790
23,138
Transaction related expenses and non-recurring gains
-
-
2,737
4,779
2,737
219
Adjusted distributable cash flow
47,079
$
51,260
$
63,301
$
87,825
$
17,527
$
23,357
$
Cash distributions declared for respective period
33,736
39,428
52,423
70,453
14,287
20,729
Distribution coverage
1.40x
1.30x
1.21x
1.25x
1.23x
1.13x
Year Ended December 31,
December 31,
Three Months Ended
($ in thousands) |
 Non-GAAP Reconciliation: 2012 Forecast
Forecast
Year Ended
December 31, 2012
(1)
Adjusted EBITDA
$125 million to $135 million
Depreciation,amortization and accretion expense
$41 million
Interest expense, net
$28 million
Income tax provision
$1 million
Net income
$55 million to $65 million
(1)
Represents guidance provided on February 28, 2012. Amounts exclude the impact of the
joint venture with Crestwood Holdings, expected to close by March 31, 2012
30 |