Attached files
| file | filename |
|---|---|
| 8-K - FORM 8-K - PNC FINANCIAL SERVICES GROUP, INC. | d312473d8k.htm |
 The PNC
Financial Services Group, Inc. Citigroup 2012 Financial Services Conference
March 8, 2012
Exhibit 99.1 |
 2
DRAFT
Cautionary Statement Regarding Forward-Looking
Information and Adjusted Information
This presentation includes “snapshot” information about PNC used by way of
illustration. It is not intended as a full business or financial review and
should be viewed in the context of all of the information made available by PNC in its SEC
filings. The presentation also contains forward-looking statements regarding
our outlook for earnings, revenues, expenses, capital levels and ratios, liquidity levels, asset levels, asset quality and other
matters regarding or affecting PNC and its future business and operations.
Forward-looking statements are necessarily subject to numerous assumptions,
risks and uncertainties, which change over time.
The forward-looking statements in this presentation are qualified by the factors affecting
forward-looking statements identified in the more detailed Cautionary Statement
included in the Appendix, which is included in the version of the presentation materials posted on our corporate website at
www.pnc.com/investorevents. We provide greater detail regarding some of these factors in
our 2011 Form 10-K, including in the Risk Factors and Risk Management sections and
in the Legal Proceedings and Commitments and Guarantees Notes of the Notes to Consolidated Financial Statements in
that report, and in our subsequent SEC filings. Our forward-looking statements may
also be subject to other risks and uncertainties, including those we may discuss in
this presentation or in SEC filings, accessible on the SEC’s website at www.sec.gov and on PNC’s corporate website at
www.pnc.com/secfilings. We have included web addresses in this presentation as inactive
textual references only. Information on these websites is not part of this
presentation.
Future events or circumstances may change our outlook and may also affect the nature of the
assumptions, risks and uncertainties to which our forward-looking statements are
subject. Forward-looking statements in this presentation speak only as of the date of this presentation. We do not
assume any duty and do not undertake to update those statements. Actual results or
future events could differ, possibly materially, from those anticipated in
forward-looking statements, as well as from historical performance.
In this presentation, we sometimes refer to adjusted results to help illustrate the impact of
certain types of items. This information supplements our results as reported in
accordance with GAAP and should not be viewed in isolation from, or as a substitute for, our GAAP results. We believe that this
additional information and the reconciliations we provide may be useful to investors,
analysts, regulators and others as they evaluate the impact of these respective items
on our results for the periods presented due to the extent to which the items are not indicative of our ongoing operations. We
may also provide information on pretax pre-provision earnings (total revenue less
noninterest expense) and on tangible book value per share (calculated as book value per
share less total intangible assets, other than servicing rights, per share). We believe that pretax pre-provision earnings,
a non-GAAP measure, is useful as a tool to help evaluate the ability to provide for credit
costs through operations, and that tangible book value per share, a non-GAAP
measure, is useful as a tool to help to better evaluate growth of the company’s business apart from the amount, on a per share
basis, of intangible assets other than servicing rights included in book value. Where
applicable, we provide GAAP reconciliations for such additional information,
including in the Appendix.
In certain discussions, we may also provide information on yields and margins for all
interest-earning assets calculated using net interest income on a
taxable-equivalent basis by increasing the interest income earned on tax-exempt assets
to make it fully equivalent to interest income earned on taxable investments. We
believe this adjustment may be useful when comparing yields and margins for all earning assets. We may also use
annualized, proforma, estimated or third party numbers for illustrative or comparative
purposes only. These may not reflect actual results.
This presentation may also include discussion of other non-GAAP financial measures, which,
to the extent not so qualified therein or in the Appendix, is qualified by GAAP
reconciliation information available on our corporate website at www.pnc.com under “About PNC–Investor Relations.” |
 DRAFT
Evolving Environment Presents Challenges and
Opportunities
Tepid U.S.
Economic
Recovery and
Extended Low
Rates
Regulatory
Change
Market
Dislocation
PNC’s position
Business model challenges
Improving commercial loan growth
Consumer deleveraging
Reinvestment yield pressure
Housing-related delinquencies
Lower fee income
Compliance risk
Impact on business composition
Basel II & III
Impact of shadow banking
Public distrust
GSE reform
European bank deleveraging
Industry impact
Capture relationship market share
Invest in products, people and services
Expansion in attractive growth markets
Maintain a moderate risk profile
Reduce funding cost
Lower cost to serve
“Play by the new rule book”
Rebalance the customer value proposition
Leverage scale advantage to absorb costs
Invest in innovative products and solutions
Leverage our improved brand recognition
Selectively grow distribution
3 |
 DRAFT
Investing for Future Growth
Expand sales capacity by 16% across targeted growth markets, businesses
and new product initiatives
Nearly
$130
million
capital
expenditures
on
approximately
60
new
branches
Planned 2012 investments
Revenue
Generating
Product and
Business
Investments
Over $400 million investment in new technologies and product
capabilities to further drive customer retention and operating
efficiencies PNC
Wealth
Insight
SM
TM
4 |
 DRAFT
5
A Strong Retail Franchise -
Adapting to a Challenging
Environment
Franchise positioning
Strategic priorities
Our footprint covers nearly half of the U.S.
population
Ranked
#6
in
U.S.
deposits
1
Serving nearly six million households
Gallup ranking above the industry average
for
“customer
confidence”
in
the
past
five
consecutive years
Grow checking relationships
Increase share of wallet
Lower cost to serve
Selectively invest to achieve profitable
growth
Earnings under pressure from low rate environment
Retail
Banking
pretax
pre-provision
earnings
2
3
$1.8
$0.9
$2.4
$-
$1
$2
$3
2008
2009
2010
2011
Actual
Assuming
Rates
Flat
to
2008
Interest
Rates
4
(1) Source: SNL DataSource. Rank based on U.S. deposits as of June 30, 2011 and, for PNC, the
deposits PNC acquired on March 2, 2012 in the RBC Bank (USA) transaction. (2) Pretax
pre-provision earnings, a non-GAAP measure, is calculated as total revenue less noninterest
expense. (3) 2008 adjusted to include proforma National City 2008 results. (4) Assumes the
application of 2008 interest rates (rather than the actual interest rates) to the
actual balances and related funds transfer pricing activities of four categories of core deposits for 2009,
2010 and 2011. Further information on footnotes 2, 3 and 4 is provided in the Appendix. |
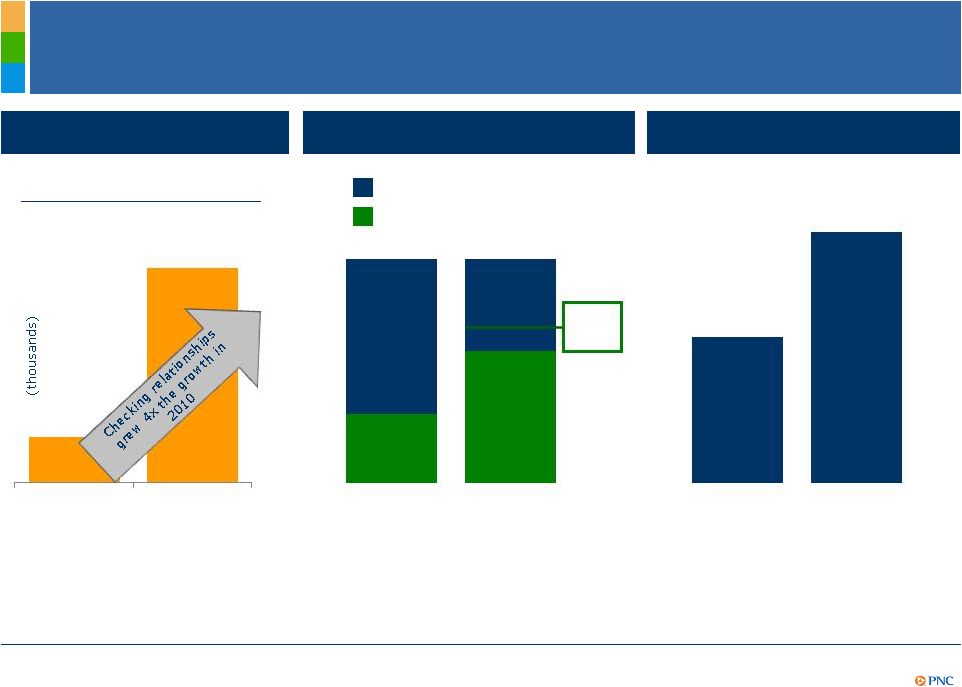 6
DRAFT
Customer Growth Provides Sustainable Revenue
Opportunity –
Retail Banking
Customer growth
Checking relationship growth
Relationship checking
Free checking
4Q10
4Q11
+75
+296
New originations
New consumer household
cross-sell penetration
2010
34%
2011
44%
2010
2011
70%
Goal
31%
59%
3
2
1
(1) Checking relationship growth refers to consumer and small business accounts including
41,000 relationships acquired by branch acquisitions in 2011. (2) Relationship checking
refers to accounts with a committed balance level or self-service accounts with lower cost of servicing. (3)
Percentage of new consumer households as measured within three months with a primary checking
account having at least two services and one additional bank deposit or loan product
with us. |
 7
DRAFT
Serving Customers Tomorrow –
Retail Banking
Preserve our customer-centric service model while we evolve to a lower cost
structure Use our differentiated Customer Interaction Management capability to deliver
greater value Lower cost to serve by migrating certain customer transactions toward
lower cost channels Invest and grow “virtual”
customers”
Significant cost save opportunity with virtual sales kiosks and alternative formats
Goals
Cost per transaction
Active online banking customers
ATM channel migration
opportunity
3,519
3,057
Withdrawals
Deposits
Check
cashing
40%
potential
20%
potential
Branch
Call Center
ATM
Online/ Mobile
Business
Consumer
2010
2011
0
2
4
6
8
10
12
Teller
ATM |
 8
DRAFT
Corporate & Institutional Banking –
A “Through-the-Cycle”
Relationship Bank
Franchise positioning
Strategic priorities
Multi-product and financing capabilities offered nationally
A leading middle market loan syndicator
New presence in attractive Southeast markets
Capitalize on market dislocation to grow long-term primary client
relationships
Leverage RBC Bank (USA) acquisition and de novo expansion into Southeast
Continue to invest in people, products and technologies
Build-out select industry verticals
(1) Source: Loan Pricing Corporation, 2011.
1 |
 9
DRAFT
Customer growth
1,165
1,012
Cross-sell opportunities
Average quarterly loan growth
of select C&IB segments
4Q10
4Q11
Average revenue per new
Corporate Banking primary clients
$150
$250
+
Cross-sell
Corporate Banking new
primary
clients
1
0-1 year
Actual
Within 3 years
Goal
2010
2011
6.9
8.9
8.7
9.8
4.3
6.1
Business Credit
Middle Market
Corporate Finance
New primary
clients
$100
Customer Growth Provides Sustainable Revenue
Opportunity –
Corporate & Institutional Banking
(1) A Corporate Banking primary client is defined as a corporate banking relationship with
annual revenue generation of $50,000 or more or, within corporate banking, a commercial
banking client relationship with annual revenue generation of $10,000 or more. |
 10
DRAFT
Asset Management Group –
Capturing Greater Market
Share
Franchise positioning
Strategic priorities
Top 10 bank-held wealth manager in the U.S.
Hawthorn -
Top 10 ultra-affluent provider in the U.S.
Over $240 billion in investable assets
Over 3,100 employees
4
with a broad market presence in 70 cities
Open architecture platform and strong performance in manufactured products
Achieve optimal staffing levels across markets
Leverage referral channels across the businesses
Drive growth in high potential and newly acquired markets
Offer seamless wealth and retirement products to all customer segments to
capture greater market share
(1) Source: Barron’s 2011 rankings. (2) Source: Family Wealth Alliance 2011 rankings. (3)
Company wide; includes $34 billion of brokerage assets. (4) As of 12/31/2011.
1
2
3 |
  11
DRAFT
Customer Growth Provides Sustainable Revenue
Opportunity –
Asset Management Group
Strong referral channel driving higher sales
+52%
Discretionary
AUM
net
flows
2010 vs. 2011
+36%
Total sales
Capturing referral
channel
sales¹
2010
2011
2010 vs. 2011
-$0.6
$0.8
2
Non-core
activity
3
-$1.7
(1) Referral sales are new sales from clients referred to AMG by Retail Banking or Corporate
and Institutional Banking. (2) Total net flows defined as net change from clients
including dividends received. (3) Non-core activity represents short-term liquidity assets. |
  DRAFT
Capturing the Wealth Opportunity
Call center
Internet
Branch
Salesforce
Call center
Internet
Branch
Call center
Internet
Mass Market
< $100K
(4 MM)
Affluent
$100K -
$1 MM
(1.6 MM)
High Net Worth
> $1 MM
(.4 MM)
Differentiated
Multi-Channel
Approach
Client -
Focused
“Go-to-Market”
Strategy
Focused on growth in the mass market and affluent
customer segments
Diverse channel approach to deepen customer
relationships and share of wallet
Distinctive “concierge”
branch service model which directs
customers to appropriate channel for highest service level
Single platform drives exceptional user experience
Strong product capabilities across all risk appetites
12 |
 13
DRAFT
Continuous Improvement –
Expense Efficiencies
Provide Capacity to Invest
$8.7
$.6
($.4)
$.3-$.4
$9.2 -$9.3
RBC Bank (USA)
expense
(net of cost saves)
Efficiency
gains
Customer
enhancements
Product
innovation
2011
2012
Estimate
RBC Expenses
Continuous
Improvements
Investments
Mid-single
digit %
growth
estimate
Noninterest expense outlook
(1) Refer to the Cautionary Statement in the Appendix, including assumptions. (2) 2011
noninterest expense of $9.1 billion (GAAP) then adjusted for the $198 million
non-cash charge related to the trust preferred securities redemption in 2011 and the $240 million fourth
quarter 2011 charge for residential mortgage foreclosure-related expenses. (3) The 2012
expense base outlook includes ten months of RBC Bank (USA) estimated operating
costs of approximately $600 million. (4) Excludes the possible impact of legal and regulatory
contingencies, charges on further trust preferred redemptions, and RBC Bank (USA) integration
expenses in 2012.
2
4
1
3 |
 14
DRAFT
Strong Capital and Liquidity Position
Highlights
Tier 1 common ratio
Target Basel III Tier 1 common ratio to reach
between 8.0-8.5%
1
during 2013
Capital priorities:
–
Build capital to support client growth and
business investment
–
Maintain appropriate capital in light of
economic uncertainty
–
Return excess capital to shareholders
Strong liquidity position at year-end 2011
–
Loan-to-deposit ratio of 85%
–
Parent company two year liquidity coverage
3
of 172%
Basel
III
requirements
2
8.0% -
8.5%
1
2013 Target
Basel III
(1) Proforma estimate is based on PNC’s Tier 1 common ratio of 10.3% as of 12/31/11, and
includes an assumed benefit of 1.7%, which reflects First Call 2012 and 2013
estimates and current dividend payout, as well an assumed decrease of 3.5%-4.0%, which reflects assumptions utilizing Basel II
methodology regarding credit, operating and market risk and includes the treatment of
BlackRock and sub-investment grade securities (assuming no AOCI double counting)
under Basel II and the addition of RBC Bank (USA) risk weighted assets. This estimate is subject to further regulatory guidance
and clarity. The estimate is based on the phase-in of Basel III framework in effect as of
2012. (2) Regulatory requirements include capital conservation buffer (but not any
potential additional surcharges or buffers) and are subject to further regulatory guidance and clarity. (3) Parent company liquidity
coverage defined as liquid assets divided by funding obligations within a two year period. |
 15
DRAFT
Outlook
1
–
Full Year 2012 vs. 2011
PNC is Positioned to Deliver Strong Results in 2012.
PNC is Positioned to Deliver Strong Results in 2012.
Estimated % Change
3
Combined
2
Balance sheet
Loans
Increase mid to high teens
Total revenue
Increase mid to high single digits
Combined
2
Income
statement
Net interest income
Increase mid to high single digits
Noninterest income
Increase mid single digits
Noninterest expense
Increase
mid
single
digits
4
Loan loss provision
Stable
5
PNC stand-alone positioned for strong results in 2012
RBC Bank (USA) acquisition expected to be accretive in 2012, excluding
integration costs
(1) Refer to the Cautionary Statement in the Appendix, including assumptions. (2) Reflects
combined PNC and RBC Bank (USA). (3) Estimated change for 2012 is based on 2011
reported results. (4) Excluding legal and regulatory related contingencies, integration costs and any capital
actions related to TPS redemptions for both 2011 and 2012 periods. (5) Excluding legal and
regulatory related contingencies. |
 16
DRAFT
Cautionary Statement Regarding Forward-Looking
Information
Appendix
This presentation includes “snapshot” information about PNC used by way of
illustration and is not intended as a full business or financial review. It
should not be viewed in isolation but rather in the context of all of the information made available by PNC in its SEC filings.
We also make statements in this presentation, and we may from time to time make other
statements, regarding our outlook for earnings, revenues, expenses, capital levels and
ratios, liquidity levels, asset levels, asset quality and other matters regarding or affecting PNC and its future
business and operations that are forward-looking statements within the meaning of the
Private Securities Litigation Reform Act. Forward-looking statements are
typically identified by words such as “believe,” “plan,” “expect,” “anticipate,” “see,” “look,” “intend,” “outlook,” “project,” “forecast,
“estimate,” “goal,” “will,” “should” and other similar
words and expressions. Forward-looking statements are subject to numerous assumptions,
risks and uncertainties, which change over time.
Forward-looking statements speak only as of the date made. We do not assume any duty
and do not undertake to update forward-looking statements. Actual results or
future events could differ, possibly materially, from those anticipated in forward-looking statements, as well as from
historical performance.
Our forward-looking statements are subject to the following principal risks and
uncertainties. •
Our businesses, financial results and balance sheet values are affected by business and
economic conditions, including the following::
o
Changes in interest rates and valuations in debt, equity and other financial markets.
o
Disruptions in the liquidity and other functioning of U.S. and global financial
markets.
o
The impact on financial markets and the economy of the downgrade by Standard & Poor’s
of U.S. Treasury obligations and other U.S. government-backed debt, as well as
issues surrounding the level of U.S. and European government debt and concerns regarding the
creditworthiness of certain sovereign governments in Europe.
o
Actions by Federal Reserve, U.S. Treasury and other government agencies, including those that
impact money supply and market interest rates.
o
Changes in customers’, suppliers’ and other counterparties’ performance and
creditworthiness.
o
Slowing or failure of the current moderate economic recovery.
o
Continued effects of aftermath of recessionary conditions and uneven spread of positive
impacts of recovery on the economy and our counterparties, including adverse impacts on
levels of unemployment, loan utilization rates, delinquencies, defaults and counterparty ability
to meet credit and other obligations.
o
Changes in customer preferences and behavior, whether due to changing business and economic
conditions, legislative and regulatory initiatives, or other factors.
•
Our forward-looking financial statements are subject to the risk that economic and
financial market conditions will be substantially different than we are currently
expecting. These statements are based on our current view that the modest economic expansion will persist in 2012 and
interest rates will remain very low. |
 17
DRAFT
Cautionary Statement Regarding Forward-Looking
Information (continued)
Appendix
•
Legal and regulatory developments could have an impact on our ability to operate our
businesses, financial condition, results of operations, competitive position,
reputation, or pursuit of attractive acquisition opportunities. Reputational impacts could affect matters such as business
generation and retention, liquidity, funding, and ability to attract and retain
management. These developments could include:
o
Changes resulting from legislative and regulatory reforms, including broad-based
restructuring of financial industry regulation and changes to laws and regulations
involving tax, pension, bankruptcy, consumer protection, and other industry aspects, and changes in
accounting policies and principles. We will be impacted by extensive reforms provided
for in the Dodd-Frank Wall Street Reform and Consumer Protection Act and otherwise
growing out of the recent financial crisis, the precise nature, extent and timing of which, and their
impact on us, remains uncertain.
o
Changes to regulations governing bank capital and liquidity standards, including due to the
Dodd-Frank Act and to Basel III initiatives.
o
Unfavorable resolution of legal proceedings or other claims and regulatory and other
governmental investigations or other inquiries. In addition to matters relating
to PNC’s business and activities, such matters may include proceedings, claims, investigations, or inquiries
relating to pre acquisition business and activities of acquired companies, such as National
City. These matters may result in monetary judgments or settlements or other
remedies, including fines, penalties, restitution or alterations in our business practices and in additional
expenses and collateral costs, and may cause reputational harm to PNC.
o
Results of the regulatory examination and supervision process, including our failure to
satisfy requirements of agreements with governmental agencies.
o
Impact on business and operating results of any costs associated with obtaining rights in
intellectual property claimed by others and of adequacy of our intellectual property
protection in general.
•
Business and operating results are affected by our ability to identify and effectively manage
risks inherent in our businesses, including, where appropriate, through effective use
of third-party insurance, derivatives, and capital management techniques, and to meet evolving regulatory
capital standards. In particular, our results currently depend on our ability to manage
elevated levels of impaired assets.
•
Business and operating results also include impacts relating to our equity interest in
BlackRock, Inc. and rely to a significant extent on information provided to us by
BlackRock. Risks and uncertainties that could affect BlackRock are discussed in more detail by BlackRock in its
SEC filings.
•
Our acquisition of RBC Bank (USA) presents us with risks and uncertainties related both to the
acquisition itself and to the integration of the acquired businesses into PNC,
including:
o
Anticipated benefits of the transaction, including cost savings and strategic gains, may be
significantly harder or take longer to achieve than expected or may not be achieved in
their entirety as a result of unexpected factors or events.
o
Our ability to achieve anticipated results from this transaction is dependent also on the
extent of credit losses in the acquired loan portfolios and the extent of deposit
attrition, in part related to the state of economic and financial markets. Also, litigation and regulatory
and other governmental investigations that may be filed or commenced, as a result of this
transaction or otherwise, could impact the timing or realization of anticipated
benefits to PNC.
o
Integration of RBC Bank (USA)’s business and operations into PNC may take longer than
anticipated or be substantially more costly than anticipated or have unanticipated
adverse results relating to RBC Bank (USA)’s or PNC’s existing businesses. PNC’s ability to integrate
RBC Bank (USA) successfully may be adversely affected by the fact that this transaction
results in PNC entering several markets where PNC did not previously have any
meaningful retail presence. |
 18
DRAFT
Cautionary Statement Regarding Forward-Looking
Information (continued)
Appendix
•
In addition to the RBC Bank (USA) transaction, we grow our business in part by acquiring from
time to time other financial services companies, financial services assets and related
deposits and other liabilities. These other acquisitions often present risks and uncertainties analogous to
those presented by the RBC Bank (USA) transaction. Acquisition risks include those
presented by the nature of the business acquired as well as risks and uncertainties
related to the acquisition transactions themselves, regulatory issues, and the integration of the acquired businesses into
PNC after closing.
•
Competition can have an impact on customer acquisition, growth and retention and on credit
spreads and product pricing, which can affect market share, deposits and
revenues. Industry restructuring in the current environment could also impact our business and financial
performance through changes in counterparty creditworthiness and performance and in the
competitive and regulatory landscape. Our ability to anticipate and respond to
technological changes can also impact our ability to respond to customer needs and meet competitive demands.
•
Business and operating results can also be affected by widespread disasters, dislocations,
terrorist activities or international hostilities through impacts on the economy and
financial markets generally or on us or our counterparties specifically.
We provide greater detail regarding some of these factors in our 2011 Form 10-K, including
the Risk Factors and Risk Management sections and the Legal Proceedings and Commitments
and Guarantees Notes of the Notes to Consolidated Financial Statements in that report, and our
subsequent SEC filings. Our forward-looking statements may also be subject to other
risks and uncertainties, including those we may discuss elsewhere in this presentation
or in SEC filings, accessible on the SEC’s website at www.sec.gov and on our corporate website at
www.pnc.com/secfilings. We have included these web addresses as inactive textual
references only. Information on these websites is not part of this document.
Any annualized, proforma, estimated, third party or consensus numbers in this presentation are
used for illustrative or comparative purposes only and may not reflect actual
results. Any consensus earnings estimates are calculated based on the earnings projections made by analysts
who cover that company. The analysts’ opinions, estimates or forecasts (and
therefore the consensus earnings estimates) are theirs alone, are not those of PNC or
its management, and may not reflect PNC’s or other company’s actual or anticipated results. |
 19
DRAFT
Non-GAAP to GAAP Reconcilement
Appendix
$ in millions
Dec. 31, 2008 (1)
Dec. 31, 2009
Dec. 31, 2010
Dec. 31, 2011
Net interest income, as reported
$1,594
$3,522
$3,435
$3,280
Proforma adjustments:
National City
1,907
-
-
-
Adjusted proforma net interest income
$3,501
Noninterest income, as reported
$1,137
$2,199
$1,951
$1,762
Proforma adjustments:
National City
1,297
-
-
-
Adjusted proforma noninterest income
$2,434
Total revenue, as reported
$2,731
$5,721
$5,386
$5,042
Total revenue, adjusted proforma
$5,935
Noninterest expense, as reported
$1,789
$4,169
$4,056
$4,103
Proforma adjustments:
National City
2,305
-
-
-
Adjusted proforma noninterest expense
$4,094
Pretax pre-provision earnings (revenue less noninterest expense) (1)
$1,841
$1,552
$1,330
$939
Retail Banking results for the year ended
(1) 2008 adjusted to reflect PNC Retail Banking (as reported reclassified to reflect the
reporting of PNC Wealth Management in the Asset Management Group segment beginning in
2009) combined proforma with results of the National City retail banking business for that year.
PNC believes that pretax pre-provision earnings, a non-GAAP measure, is useful as a
tool to help evaluate the ability to provide for credit costs through operations. For
purposes of this comparison, adjustments have been made to 2008 in the table above to reflect including the National City
retail banking business results on a proforma basis to provide comparability.
|
 20
DRAFT
Non-GAAP to GAAP Reconcilement
Appendix
$ in millions
Dec. 31, 2008
Dec. 31, 2009
Dec. 31, 2010
Dec. 31, 2011
Net interest income, as adjusted proforma for 2008 and as reported for 2009-2011
$3,501
$3,522
$3,435
$3,280
2008 interest rate adjustment:
Difference for holding interest rates flat to 2008 interest rates (1)
-
747
1,073
1,419
Net interest income, assuming 2008 rates
$3,501
$4,269
$4,508
$4,699
Noninterest income, as adjusted proforma for 2008 and as reported for 2009-2011
$2,434
$2,199
$1,951
$1,762
Total revenue, assuming 2008 rates
$5,935
$6,468
$6,459
$6,461
Noninterest expense, as adjusted proforma for 2008 and as reported for 2009-2011
$4,094
$4,169
$4,056
$4,103
Pretax pre-provision earnings, assuming 2008 interest rates
$1,841
$2,299
$2,403
$2,358
PNC believes that pretax pre-provision earnings, a non-GAAP measure, is useful as a
tool to help evaluate the ability to provide for credit costs through operations. PNC
also believes that results adjusted to assume 2008 interest rates provide useful information on the impact of the low interest rate
environment in the 2009-2011 period. For purposes of this comparison, adjustments have
been made to 2008 in the table above to reflect including the National City retail
banking business results on a proforma basis to provide comparability. Retail Banking
results for the year ended (1) Represents the difference in net interest income if you
apply the 2008 interest rates (rather than the actual interest rates) to the actual balances and
related funds transfer pricing activities for four categories of core deposits for 2009, 2010
and 2011. The four categories of core deposits include interest- bearing demand,
noninterest bearing demand, money market and savings deposits. This adjustment does not assume any change in customer behavior for
2009, 2010 and 2011 deposit balances due to the assumed 2008 interest rates.
|
 21
DRAFT
Peer Group of Banks
Appendix
The PNC Financial Services Group, Inc.
PNC
BB&T Corporation
BBT
Bank of America Corporation
BAC
Capital One Financial, Inc.
COF
Comerica Inc.
CMA
Fifth Third Bancorp
FITB
JPMorgan Chase
JPM
KeyCorp
KEY
M&T Bank
MTB
Regions Financial Corporation
RF
SunTrust Banks, Inc.
STI
U.S. Bancorp
USB
Wells Fargo & Co.
WFC
Ticker |