Attached files
| file | filename |
|---|---|
| 8-K - 8-K - M&T BANK CORP | d312920d8k.htm |
 Citigroup 2012 Financial Services Conference
March 8, 2012
Exhibit 99 |
 2
This presentation
contains
forward
looking
statements
within
the
meaning
of
the
Private
Securities
Litigation
Reform
Act giving the Company's expectations or predictions of future financial or business
performance or conditions. Forward-looking statements are typically
identified by words such as "believe," "expect," "anticipate," "intend,"
"target," "estimate," "continue," "positions,"
"prospects" or "potential," by future conditional verbs such as "will,"
"would," "should," "could" or "may," or by variations of such
words or by similar expressions. These forward-looking statements are subject
to numerous assumptions, risks and uncertainties which change over time. Forward-looking
statements
speak
only
as
of
the
date
they
are
made
and
we
assume
no
duty
to
update
forward-looking
statements.
In addition to factors previously disclosed in our SEC reports and those identified elsewhere
in this presentation, the following factors among others, could cause actual results to
differ materially from forward-looking statements or historical performance:
changes in asset quality and credit risk; the inability to sustain revenue and earnings growth;
changes in interest rates and capital markets; inflation; customer acceptance of M&T
products and services; customer borrowing,
repayment,
investment
and
deposit
practices;
customer
disintermediation;
the
introduction,
withdrawal,
success and timing of business initiatives; competitive conditions; the inability to realize
cost savings or revenues or to implement integration plans and other consequences
associated with mergers, acquisitions and divestitures; economic conditions; and the
impact, extent and timing of technological changes, capital management activities, and other
actions of the Federal Reserve Board and legislative and regulatory actions and reforms,
including those associated with the Dodd-Frank Wall Street Reform and Consumer
Protection Act. Annualized, pro forma, projected and estimated numbers are used for
illustrative purpose only, are not forecasts and may not reflect actual results.
Disclaimer |
 3
Today’s Agenda
Who is M&T Bank?
2011 Highlights
Consistent, conservative operating philosophy
Wilmington Trust
Outlook |
 4
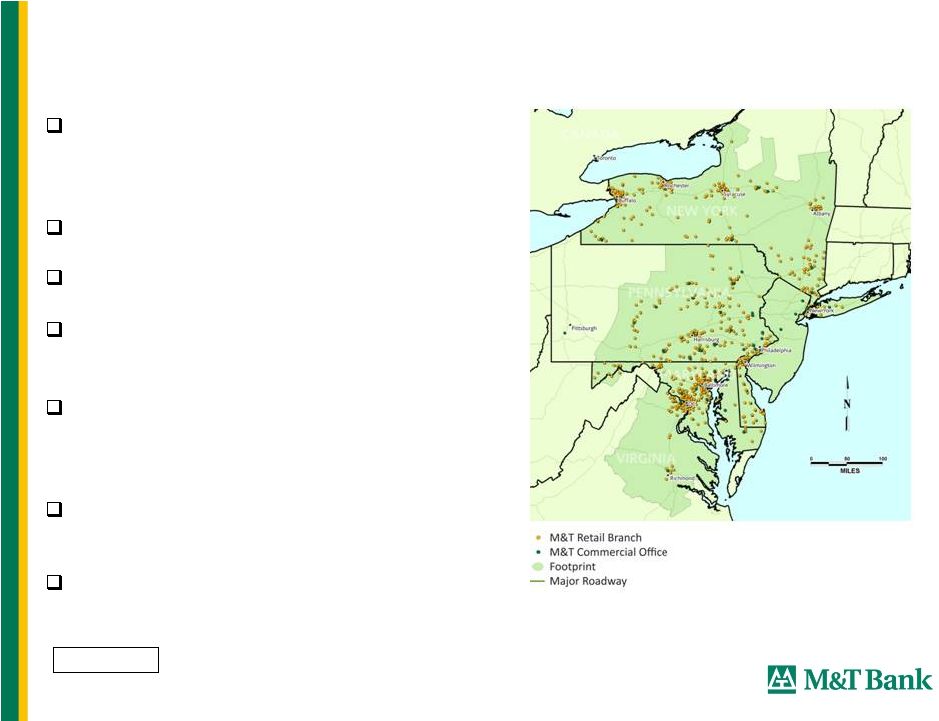
Top 20 US-based full-service commercial
bank holding company by assets and Top 15
by market cap
Founded in 1856
$78 billion total assets
776
domestic branches and more than 2,000
ATMs
15,666 employees located in New York,
Maryland, Pennsylvania, Washington, D.C.,
Virginia, West Virginia and Delaware
Over 2 million consumer/retail household
customers
Approximately 220,000 commercial
customers
M&T Bank Corporate Profile
As of 12/31/11 |
 5
Most honored bank in 2011 Greenwich Excellence Awards for Small Business
Banking: 12 national awards and 2 regional awards
Highest number of awards among all 750 banks rated by business customers
Received the highest possible Community Reinvestment Act (CRA) rating on every
exam since 1982
M&T Charitable Foundation has contributed over $147 million to
not-for-profit organizations in its communities over the past 10
years Contributed $40 million to M&T Charitable Foundation in 2011
More than 3,000 M&T employees volunteer with
5,100 different not-for-profit organizations
Strong long-term returns for shareholders
Recognition from Customers, Communities & Shareholders
|
 6
Strong Presence In Our Communities
We lend in the markets where we live and work to people and enterprises whom we
know #1 Small Business Lender in:**
Baltimore
Binghamton
Buffalo
Philadelphia
Rochester
Syracuse
Washington, DC
Wilmington
Ranked 6
th
Nationally
Ranked 3
rd
in Eastern U.S.
#1 lead bank market share
among middle market clients in:*
Baltimore
Binghamton
Buffalo
Harrisburg
Northern Pennsylvania
Rochester
Syracuse
State of Maryland overall
State of Delaware overall
* Independent market research
** Small Business Administration
#1 or #2 deposit market share
in 8 of top 10 communities:
#2 in Baltimore
#1 in Binghamton
#1 in Buffalo
#2 in Harrisburg
#2 in Rochester
#1 in Syracuse
#1 State of Delaware / Wilmington City
#1 in York |
 7
Summary of Full Year 2011 Results
12% increase in diluted GAAP & Net Operating EPS
Net operating return on tangible common equity of 17.96%
Increased tangible book value per common share by 14%
No secondary equity offering
Consummated Wilmington Trust merger in May
Expansion into new markets, encompassed by the Wilmington
Trust Diversification into a wider array of
trust and fiduciary businesses, Completed integration of core banking
systems at end of 3Q franchise |
 8
Executed on 2011 Capital Plan
Retired $330 million of WT’s TARP preferred stock from US Treasury
Redeemed additional $370 million of M&T’s TARP preferred stock
Issued $500 million of 6.875% perpetual preferred stock to bolster Tier 1
capital
Unchanged $2.80 per share dividend
Built capital ratios
while absorbing WT and supporting loan growth
Tier 1 common capital ratio up 35bp to 6.86% at year-end 2011
Tangible
common
equity
ratio
up
21bp
to
6.40%
at
year
end
2011. |
 9
Strong
credit
through
crisis
Focused
on returns
Consistent
capital
generation
(1)
The Efficiency Ratio and Pre-tax, Pre-provision Earnings are non-GAAP
financial measures. A reconciliation of GAAP to non-GAAP financial
measures is available in the appendix. The Efficiency Ratio reflects
non-interest expense (excluding amortization expense associated with
intangible assets and merger-related expenses) as a percentage of fully taxable
equivalent net interest income and non-interest revenues (excluding
gains or losses from securities transactions and merger-related gains).
(2)
Excludes merger-related gains and expenses and amortization expense associated
with intangible assets. (1)
Key Ratios
2006
2007
2008
2009
2010
2011
Net Interest Margin
3.70%
3.60%
3.38%
3.49%
3.84%
3.73%
Efficiency Ratio -
Tangible
(1)
51.51%
52.77%
54.35%
56.50%
53.71%
60.43%
Pre-tax, Pre-provision Earnings ($MM)
1,312
1,156
1,152
1,123
1,461
1,495
Allowance to Loans (As At)
1.51%
1.58%
1.61%
1.69%
1.74%
1.51%
Net Charge-Offs to Loans
0.16%
0.26%
0.78%
1.01%
0.67%
0.47%
Net Operating Return on
Tangible Assets
(2)
1.67%
1.27%
0.97%
0.71%
1.17%
1.26%
Tangible Common Equity
(2)
29.55%
22.58%
19.63%
13.42%
18.95%
17.96%
Common
Equity
to
Assets
-
Tangible
5.84%
5.01%
4.59%
5.13%
6.19%
6.40%
Tier 1 Common Capital Ratio
6.42%
5.62%
6.08%
5.66%
6.51%
6.86%
Tier 1 Capital Ratio
7.74%
6.84%
8.83%
8.59%
9.47%
9.67%
Total Capital Ratio
11.78%
11.18%
12.83%
12.30%
13.08%
13.26%
Leverage Ratio
7.20%
6.59%
8.35%
8.43%
9.33%
9.28%
TBV per Share
28.57
27.98
25.94
28.27
33.26
37.79
Superior
pre-credit
earnings |
 10
Consistent, Conservative Operating Philosophy
Focus on return, not volume
Solid underwriting
Efficient provider of basic banking services
Prudent capital allocation
Disciplined approach to acquisitions
Acquirer of choice -
superior returns for our partners
Management, employees & Board own or control >20% of
M&T stock
Owner-operators
|
 11
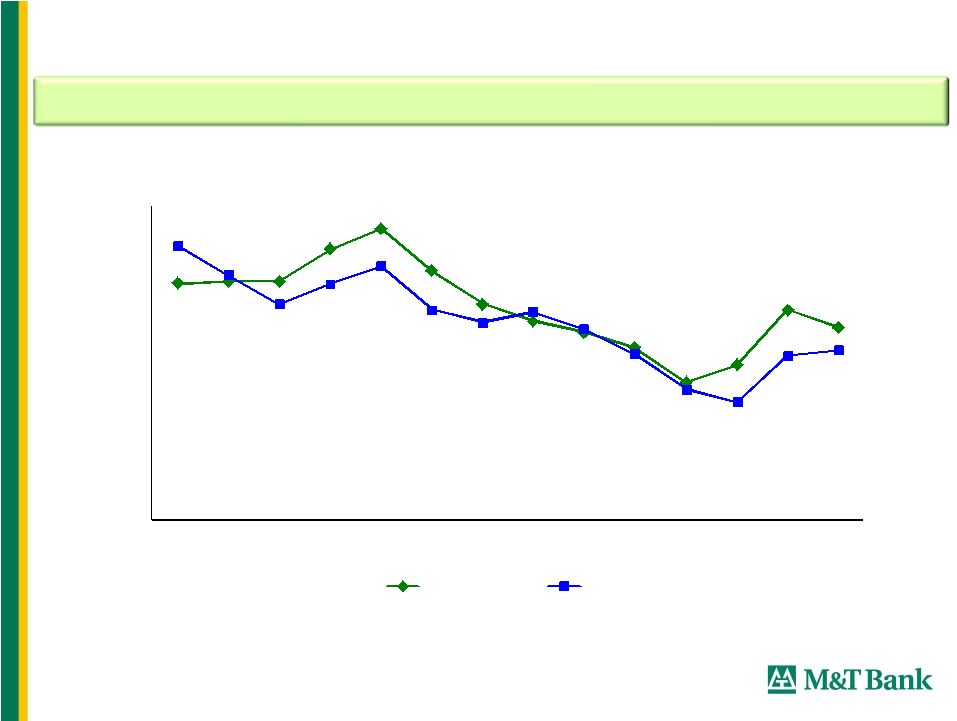
4.01
3.73
4.25
3.58
2.5
3.0
3.5
4.0
4.5
'98
'99
'00
'01
'02
'03
'04
'05
'06
'07
'08
'09
'10
'11
MTB
Peer Median
Disciplined margin management
Note: Taxable Equivalent net interest margin used for M&T and for peer banks
when available.
Net Interest Margin
M&T focuses on returns and relationships rather than volumes
|
 12
Notes:
1) Source: Industry data was obtained from the 1/6/2012 H8 prepared by the Federal
Reserve. 2) Loan growth at Domestically Chartered Commercial Banks, adjusted
to exclude the March 31, 2010 impact of FAS 167 balance sheet consolidation
and September 2008 addition of Washington Mutual.
3) Industry
Commercial
loans
include
both
“C&I
and
Other
Loans”
and
“Commercial
Real
Estate
Loans”
as
outlined
in
the
H8
report.
4) The 1Q11 decline in industry loans is unadjusted for Citigroup’s sale of
$26 billion in consumer loans to Sallie Mae. 5) MTB loan growth
acquisition adjusted for Partners and First Horizon (Dec-07), Provident (Jun-09), Bradford (Sep-09), K Bank (Dec-10), and
Wilmington Trust (Jun-11)
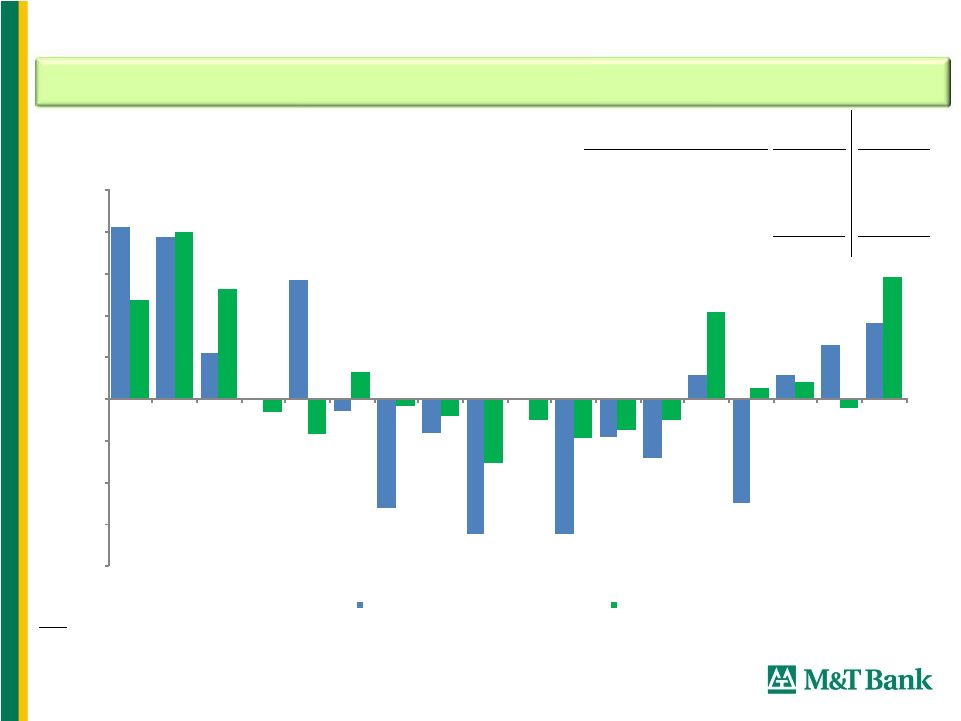
Linked Quarter Loan Growth
M&T has outperformed the industry through the credit cycle
Total
Industry
MTB
Commercial Loans
2.1%
2.5%
Res. Real Estate Loans
1.8%
10.3%
Consumer Loans
1.3%
-0.6%
Total Loans & Leases
1.8%
2.9%
4Q11 Linked Qtr Loan Growth
Domestic Unnualized
4.1%
3.9%
1.1%
0.0%
2.8%
-0.3%
-2.6%
-0.8%
-3.2%
0.0%
-3.3%
-0.9%
-1.4%
0.5%
-2.5%
0.5%
1.3%
1.8%
2.4%
4.0%
2.6%
-0.3%
-0.9%
0.6%
-0.2%
-0.4%
-1.5%
-0.5%
-0.9%
-0.7%
-0.5%
2.1%
0.2%
0.4%
-0.2%
2.9%
-4.0%
-3.0%
-2.0%
-1.0%
0.0%
1.0%
2.0%
3.0%
4.0%
5.0%
Sep-07
Dec-07
Mar-08
Jun-08
Sep-08
Dec-08
Mar-09
Jun-09
Sep-09
Dec-09
Mar-10
Jun-10
Sep-10
Dec-10
Mar-11
Jun-11
Sep-11
Dec-11
Domestically Chartered Commercial Banks
MTB |
 13
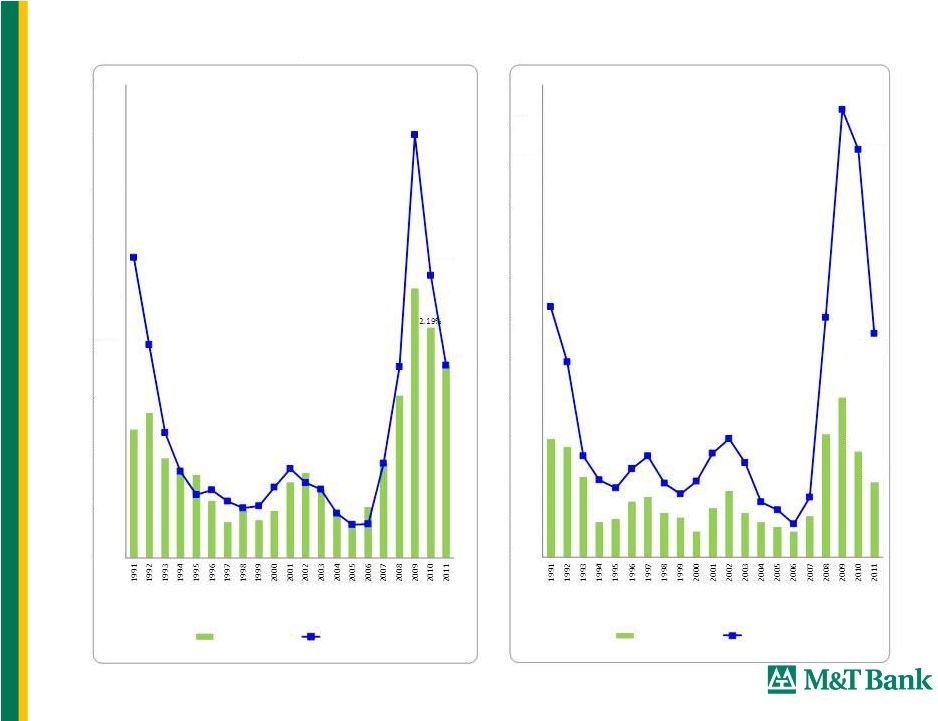
Historical Credit Cycle: 1991 -
2011
Source: SNL Interactive. Regulatory and GAAP filings
* Top 25 publicly traded banks in each year.
0.67%
0.47%
2.59%
1.42%
0.00%
0.25%
0.50%
0.75%
1.00%
1.25%
1.50%
1.75%
2.00%
2.25%
2.50%
2.75%
3.00%
NCOs / Average Loans
MTB
Top 25 Median*
1.83%
2.68%
1.83%
0.00%
0.50%
1.00%
1.50%
2.00%
2.50%
3.00%
3.50%
4.00%
4.50%
Nonaccrual Loans / Total Loans
MTB
Top 25 Median* |
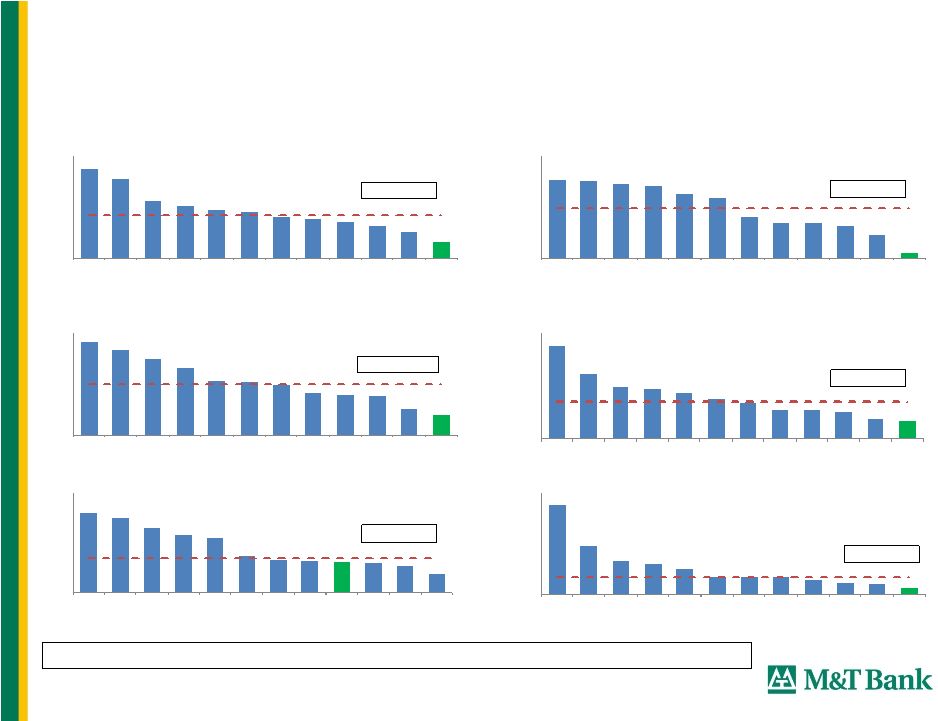 14
17.5%
15.7%
11.1%
10.4%
9.4%
9.1%
8.0%
7.7%
7.0%
6.1%
5.1%
3.1%
Median 8.5%
0%
5%
10%
15%
20%
Peer 1
Peer 2
Peer 3
Peer 4
Peer 5
Peer 6
Peer 7
Peer 8
Peer 9
Peer 10
Peer 11
MTB
Total Loans
9.3%
9.1%
8.7%
8.5%
7.5%
7.1%
4.8%
4.1%
4.0%
3.8%
2.8%
0.6%
Median 5.9%
0%
3%
6%
9%
12%
Peer 1
Peer 2
Peer 3
Peer 4
Peer 5
Peer 6
Peer 7
Peer 8
Peer 9
Peer 10
Peer 11
MTB
Comm. Real Estate
36.5%
33.2%
29.9%
26.4%
21.3%
20.8%
19.8%
16.6%
15.7%
15.3%
10.2%
8.0%
Median 20.3%
0%
10%
20%
30%
40%
Peer 1
Peer 2
Peer 3
Peer 4
Peer 5
Peer 6
Peer 7
Peer 8
Peer 9
Peer 10
Peer 11
MTB
Construction
15.7%
11.0%
8.9%
8.5%
7.7%
6.7%
6.1%
5.0%
4.9%
4.5%
3.4%
2.9%
Median 6.4%
0%
5%
9%
14%
18%
Peer 1
Peer 2
Peer 3
Peer 4
Peer 5
Peer 6
Peer 7
Peer 8
Peer 9
Peer 10
Peer 11
MTB
Commercial & Industrial
12.0%
11.2%
9.8%
8.7%
8.2%
5.5%
5.0%
4.7%
4.7%
4.4%
3.9%
2.7%
Median 5.2%
0%
3%
6%
9%
12%
15%
Peer 1
Peer 2
Peer 3
Peer 4
Peer 5
Peer 6
Peer 7
Peer 8
MTB
Peer 9
Peer 10
Peer 11
Residential Mortgage
26.4%
14.3%
9.8%
9.1%
7.3%
5.3%
5.2%
5.2%
4.5%
3.3%
3.3%
1.8%
Median 5.3%
0%
6%
12%
18%
24%
30%
Peer 1
Peer 2
Peer 3
Peer 4
Peer 5
Peer 6
Peer 7
Peer 8
Peer 9
Peer 10
Peer 11
MTB
HELOC
Loss Experience Through Financial Crisis 3Q07 –
4Q11*
* Represents
cumulative
net
credit
losses
from
3Q07
through
4Q11
as
percentage
of
average
loans
over
that
period |
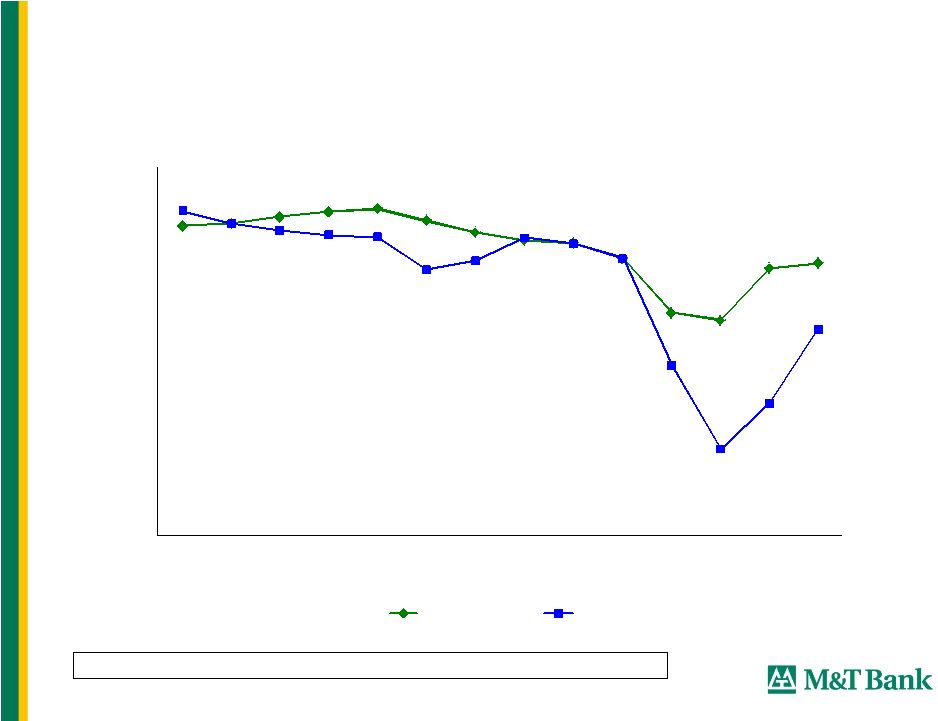 15
3.78%
3.32%
3.96%
2.52%
0.00%
0.50%
1.00%
1.50%
2.00%
2.50%
3.00%
3.50%
4.00%
4.50%
'98
'99
'00
'01
'02
'03
'04
'05
'06
'07
'08
'09
'10
'11
MTB
Peer Median
Balancing risk and rewards in lending
Risk-Adjusted Net Interest Margin*
1998-2011
*Reflects FTE Net Interest Income less Net Charge-offs as percentage of average
earning assets |
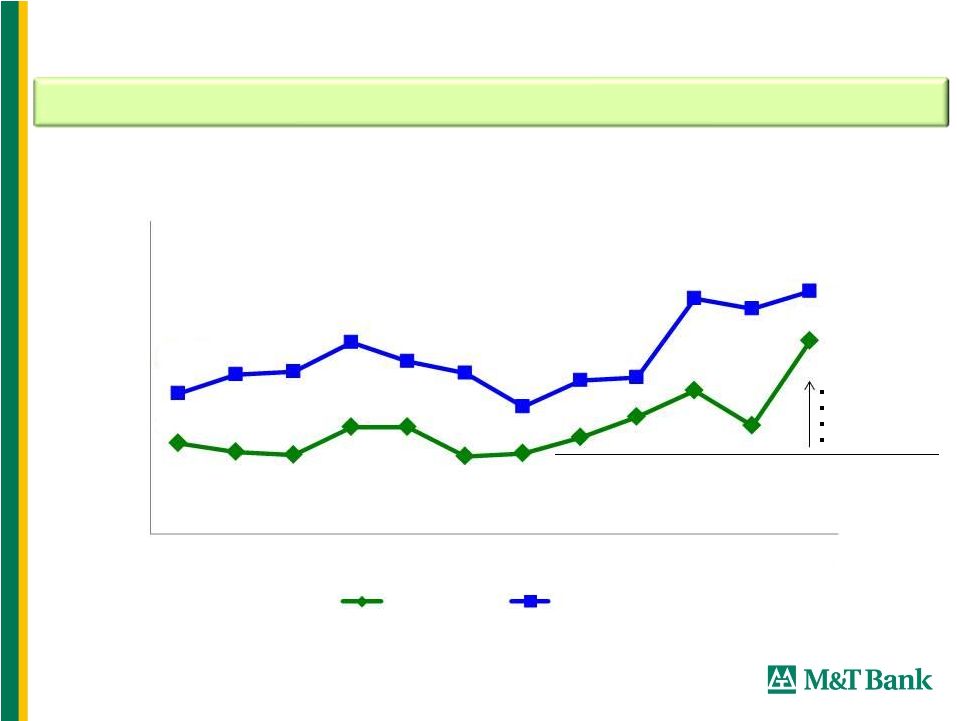 16
Efficiency Ratio
M&T’s philosophy relies on efficiently delivering banking services
2011 results influenced by Wilmington Trust and noteworthy 4Q items
Wilmington Trust
FDIC
Fee Regulation
Credit Cycle
52.25%
60.43%
56.28%
64.33%
45%
50%
55%
60%
65%
70%
'00
'01
'02
'03
'04
'05
'06
'07
'08
'09
'10
'11
MTB
Peer Median
Efficiency Ratio reflects non-interest expense (excluding amortization expense associated with
intangible assets, merger-related expenses and other non-recurring expenses) as a
percentage of fully taxable equivalent net interest income and non-interest revenues (excluding
gains from securities transactions and merger-related gains). The Efficiency Ratio is a
non-GAAP measure. See Appendix for a reconciliation to GAAP measures. |
 17
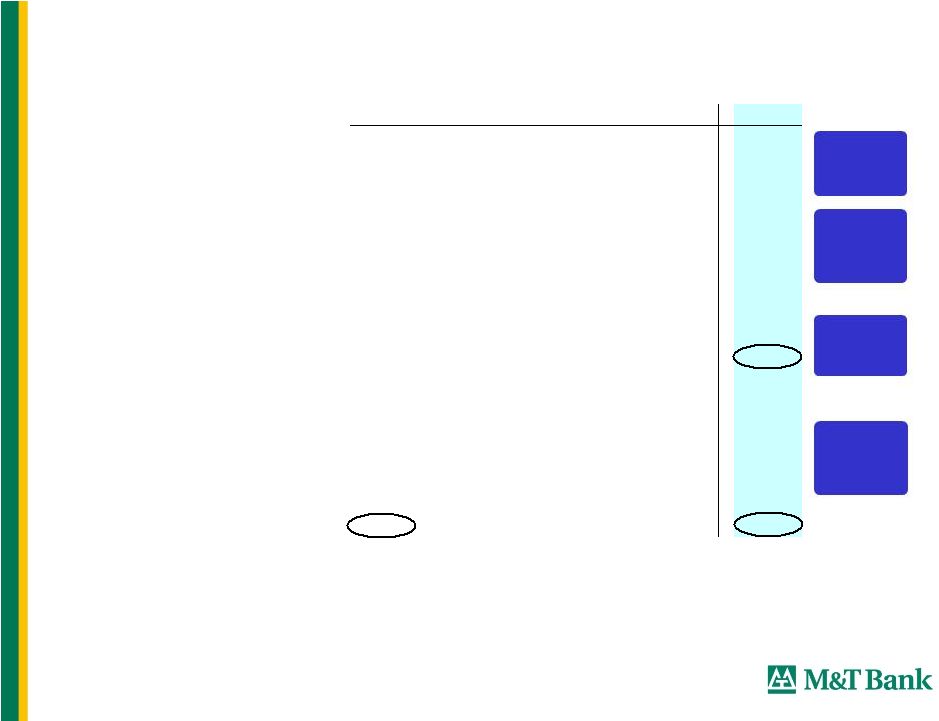
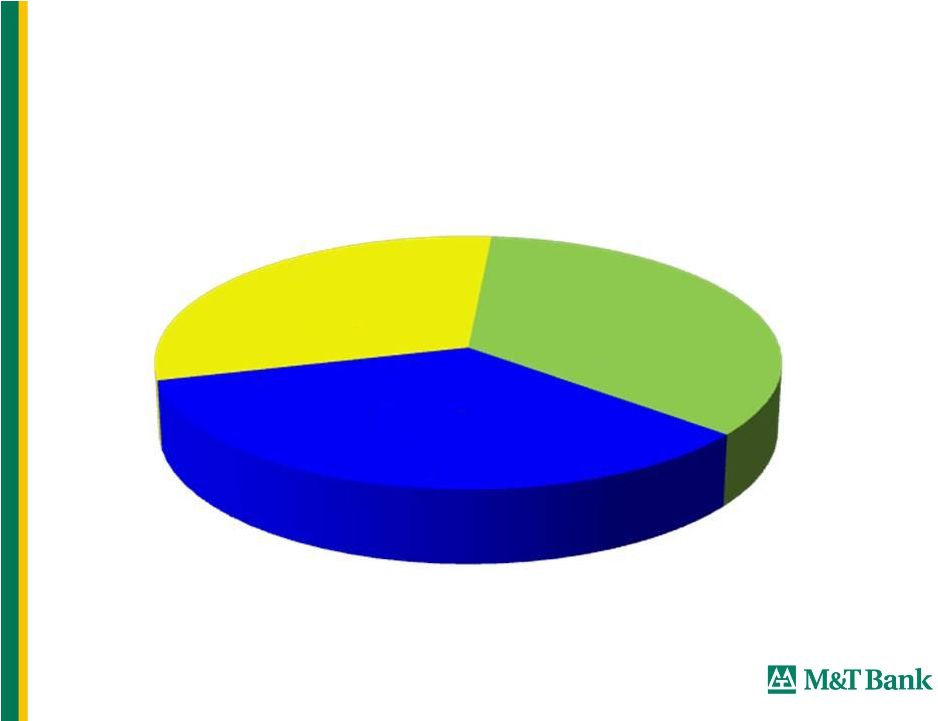
Prudent Capital Allocation
Cumulative Capital Retained, Dividends and Share Repurchases
1983 –
2011
Share
Repurchases
34%
Dividends
31%
Capital
Retained
35% |
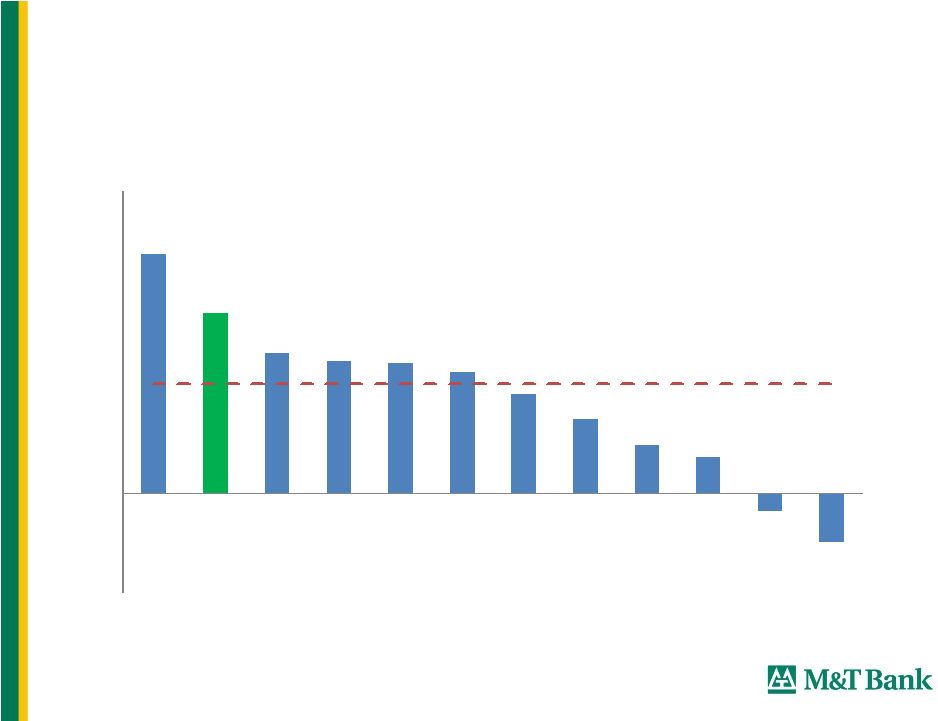 18
23.8%
18.0%
14.0%
13.2%
13.0%
12.0%
10.0%
7.4%
4.7%
3.6%
-1.7%
-4.9%
-10%
0%
10%
20%
30%
Peer 1
MTB
Peer 2
Peer 3
Peer 4
Peer 5
Peer 6
Peer 7
Peer 8
Peer 9
Peer 10
Peer 11
Peer Median 10.9%
Net Operating Return on Tangible Common Equity –
FY-2011
Note: Excludes amortization of intangibles and goodwill impairment,
merger-related items, and other nonrecurring items as noted by SNL. |
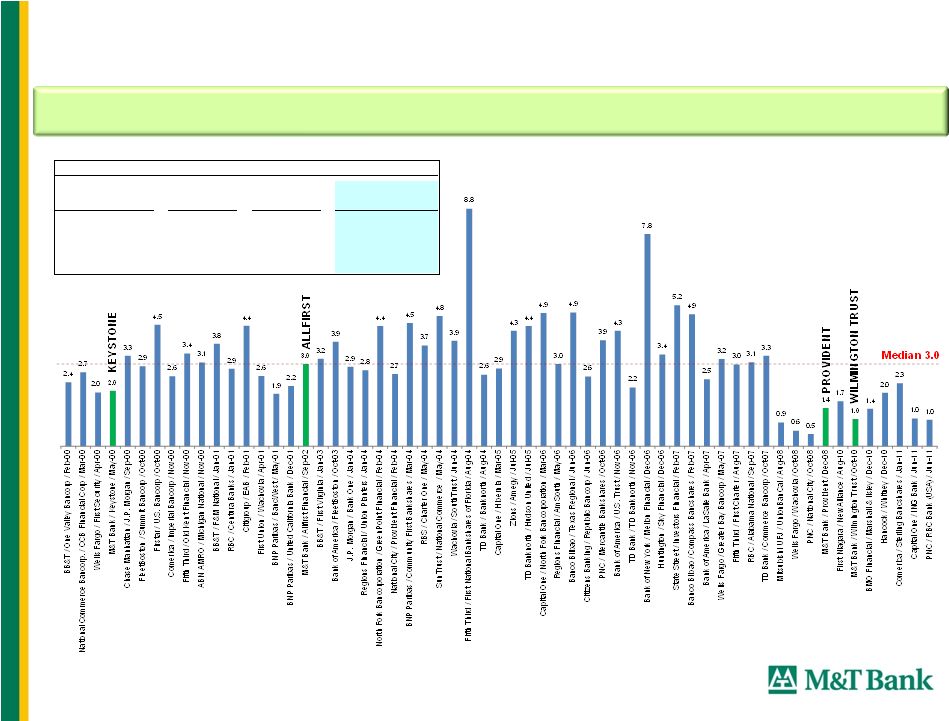 Acquistion
MTB Total
Return
BKX Total
Return
Outperformance
Wilmington Trust
9.0%
1.9%
7.2%
Provident
63.6%
9.4%
54.2%
Allfirst
30.4%
-17.1%
47.5%
Keystone
169.2%
-20.4%
189.6%
Total Returns to Date Since Acquisition Announcement*
M&T’s Acquisitions vs. Bank Deals > than $1B since 2000:
Deal Value / Tangible Common Equity
The M&T strategy: Value accrues to seller over time
(1)
Deal Value at Announcement and Tangible Common Equity at Most Recent Quarter before
Announcement (2)
Although Provident and Wilmington were both less than $1.0 billion in Deal Value,
they have been included for reference (2)
Source: SNL
Financial,
SNL
Total
Return
for
MTB,
Bloomberg
-
BKX
Total
Return
* Return calculated from first closing price post-announcement [Wilmington:
11/1/2010, Provident: 12/19/2008, Allfirst: 9/26/2002, Keystone: 5/17/2000] through 3/5 /12
19 |
 20
Overview of Wilmington Trust Acquisition, May 2011
M&T consummated Wilmington Trust merger May 2011
o
Completed
integration
of
core
banking
systems
at
end
of
3
Quarter
2011
Compelling partnership:
o
Wilmington’s #1 market share in Delaware combined with M&T’s leading
Mid-Atlantic commercial bank presence provides top-tier scale
o
M&T’s ability to leverage and grow the established value of the
Wilmington Trust brand in trust, wealth management and corporate
services o
Increased fee income diversifies revenue and enhances M&T’s ROE
o
Shared values for community banking creates added returns for communities
rd |
 21
WT merger targets announced at acquisition –
11/1/10:
High single-digit 2012 GAAP EPS accretion
Low double-digit 2012 net operating EPS accretion
Merger synergies about 15% of WT expense base -
$80 million annualized by
end of 2012
Merger-related expenses likely won’t exceed $100 million excl. purchase
accounting & Capex
2012 EPS impact consistent with original targets
$13 million of merger synergies realized in 4Q11
On track to realize full annual run-rate by 4Q12 following Trust systems
integration
$84 million merger-related expenses incurred through y/e 2011
Up to $10 million remaining merger-related expenses in 1H12
Update on Wilmington Trust merger
Update at Investor Conference -
September 2011
First Quarter 2012 status: |
 22
Wilmington Trust is comprised of 2 Complementary Businesses
Corporate Client Services (CCS)
2011
post–acquisition
fee
revenues
-
$119
million
Four discrete business groups
Corporate Trust / Capital Markets
Retirement & Institutional Services
M&T Insurance Agency
Investment Management
Wealth Advisory Services (WAS)
2011
post-acquisition
fee
revenues
-
$87
million
Two distinct customer segments:
Opportunities typically arise through referrals
from lawyers, accountants, record keepers,
investment bankers, financial advisors and
consultants.
Provide administrative and/or fiduciary solutions
to corporations, governments & large institutions
for complex transactions and legal structures.
M&T’s middle market customer base includes
some 8,500 commercial clients; we believe
expanding Commercial/Wealth relationships will
be a strong generator of new business.
Wealth
creators
-
entrepreneurs
and
privately
held business owners that need both
traditional commercial loan
and deposit services
for their business plus fiduciary and investment
services for personal wealth
Multigenerational
wealth
“family
offices”
with
complex fiduciary, investment and private
banking needs. |
 23
One-time NIM expansion from 4Q11’s 3.60% as excess liquidity held at Fed
over 2H11 has been deployed or withdrawn
For FY2012, expect NIM slightly lower than FY2011’s 3.73%
NIM outlook combined w/ mid-single digit loan growth implies growth in
NII Remain cautious with our outlook for credit
Expect continued, slow, steady improvement
Focused on expenses
Reminder: Seasonal expense surge in 1Q due to equity compensation grants
Outlook Consistent with Remarks on January earnings call
|
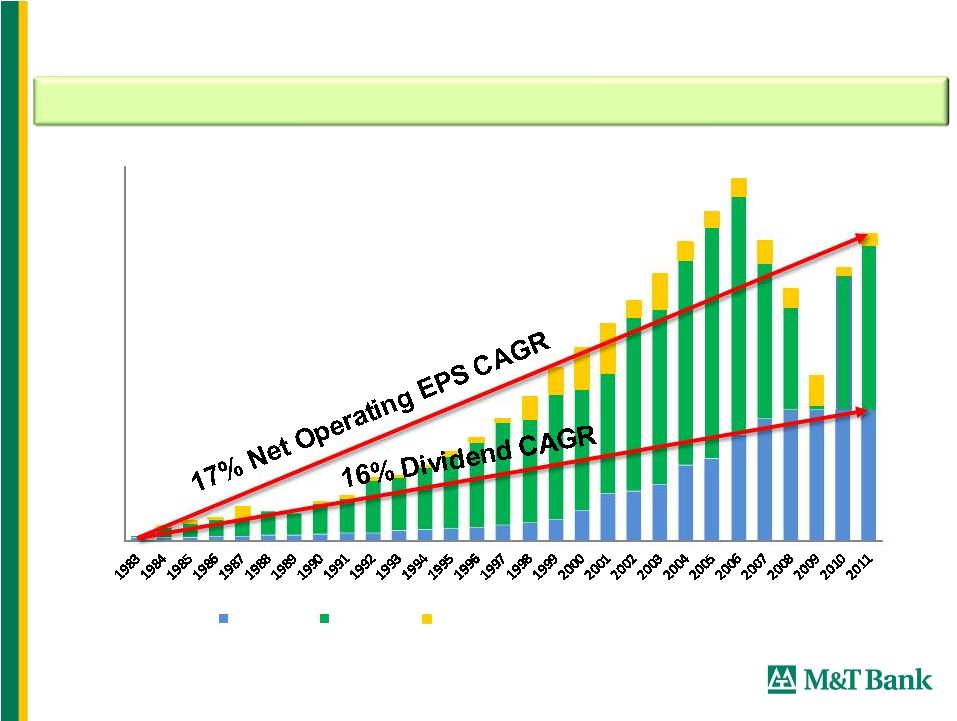 24
Earnings & Dividend Growth: 1983 -
2011
Note: Data
prior
to
1998
does
not
include
provisions
of
SFAS
No.
123
and
No.
148
stock
option
expensing.
M&T maintained its dividend and experienced no losses through the recent crisis
Net Operating Income and Net Operating EPS are non-GAAP financial
measures. Refer to the Appendix for a reconciliation between these measures
and GAAP 2.80
2.80
5.84
6.55
$0.00
$1.00
$2.00
$3.00
$4.00
$5.00
$6.00
$7.00
$8.00
Dividends
GAAP EPS
Impact of Amortization and Merger-related expenses |
 25
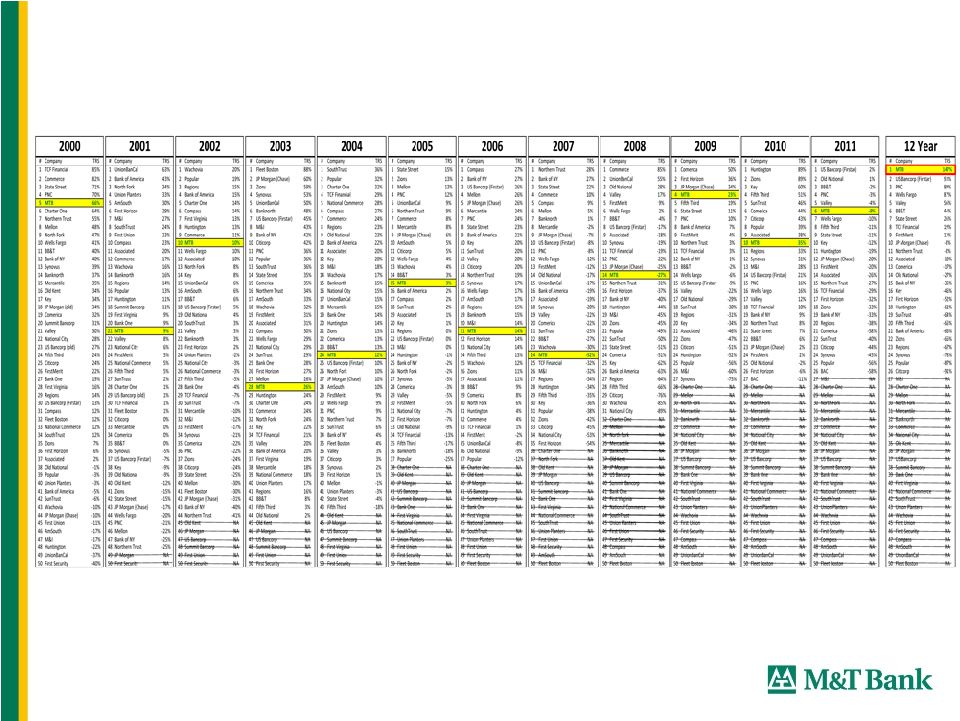
Strong Long-term Returns to Shareholders
Highest annual stock price appreciation among top 100 banks since 1983
19.3% annual total return since 1980
Highest total return among top 50 banks since 2000
19 highest return among top 50 banks in 2011
th |
 Citigroup 2012 Financial Services Conference
March 8, 2012 |
 27
1 1983 Stock Prices Source: Compustat and/or SNL
M&T Bank Corporation…
a solid investment
Stock
Closing Price at
Return
2/29/2012
3/31/1983
CAGR
Rank
Company Name
Ticker
($)
($)
1
(%)
1
M&T Bank Corporation
MTB
81.62
1.34
15.3
2
State Street Corporation
STT
42.23
1.06
13.6
3
U.S. Bancorp
USB
29.40
0.92
12.7
4
Northern Trust Corporation
NTRS
44.41
1.51
12.4
5
Wells Fargo & Company
WFC
31.29
1.18
12.0
23
—
—
2.8
Median
—
—
7.6
MTB Price @ Median Growth Rate
11.09
1.34
7.6
Of the largest 100
banks operating in
1983, only 23 remain
today
Among the
remaining, M&T
ranks 1
st
in stock
price growth |
 28
19.3% Annual rate of return since 1980*
–
22
nd
best return of the entire universe of over 700 U.S. based
stocks that have traded publicly since 1980
$3,418 invested in M&T in 1980 would be worth $1 million today
*CAGR calculated assuming reinvestment of dividends through February 29,
2012. M&T Bank Corporation…
a solid investment
Rank
Company Name
Industry
Annual Return
1
Eaton Vance Corp.
Financials
25.1
2
Limited Brands Inc.
Consumer Discretionary
23.3
3
Gap Inc.
Consumer Discretionary
22.8
4
Progressive Corp.
Financials
22.8
5
TJX Cos.
Consumer Discretionary
22.6
6
Stryker Corp.
Health Care
22.2
7
Wal-Mart Stores Inc.
Consumer Staples
21.8
8
Hasbro Inc.
Consumer Discretionary
21.6
9
Mylan Inc.
Health Care
21.6
10
Precision Castparts Corp.
Industrials
21.4
11
Leucadia National Corp.
Financials
20.9
12
Raven Industries Inc.
Industrials
20.9
13
Valspar Corp.
Materials
20.7
14
State Street Corp.
Financials
20.3
15
HollyFrontier Corp.
Energy
20.3
16
Danaher Corp.
Industrials
20.3
17
Berkshire Hathaway Inc. Cl A
Financials
20.2
18
Robert Half International Inc.
Industrials
19.8
19
Forest Laboratories Inc.
Health Care
19.8
20
Family Dollar Stores Inc.
Consumer Discretionary
19.4
21
Graco Inc.
Industrials
19.4
22
M&T Bank Corp.
Financials
19.3 |
 29
Total Returns to Shareholders
(1)
Largest 50 banks by market capitalization as of January 1, 2000
(1) Total Return To Shareholder from 12/31/1999 to 12/31/2011, as sourced
from Barclays Capital and SNL Financial. |
 30
Appendix |
 31
2011 Peer Group -
Largest 12 Regional Banks
BB&T Corporation
M&T Bank Corporation
Capital One Financial Corporation
PNC Financial Services Group, Inc.
Comerica Incorporated
Regions Financial Corporation
Fifth Third Bancorp
Synovus Financial Corp.
SunTrust Banks, Inc.
Huntington Bancshares Incorporated
Zions Bancorporation
KeyCorp |
 32
Reconciliation of GAAP and Non-GAAP Measures
Net
Income
2000
2001
2002
2003
2004
2005
2006
2007
2008
2009
2010
2011
$'s in millions
Net income
$268.2
$353.1
$456.7
$573.9
$722.5
$782.2
$839.2
$654.3
$555.9
$379.9
$736.2
$859.5
Intangible amortization*
56.1
99.4
32.5
47.8
46.1
34.7
38.5
40.5
40.5
39.0
35.3
37.6
Merger-related items*
16.4
4.8
-
39.2
-
-
3.0
9.1
2.2
36.5
(16.3)
(12.8)
Net operating income
$340.7
$457.3
$489.2
$660.9
$768.6
$816.9
$880.7
$703.8
$598.6
$455.4
$755.2
$884.3
Pre-Tax,
Pre-Provision
Income
GAAP Pre-tax Income
$422.3
$551.6
$675.9
$850.7
$1,066.5
$1,170.9
$1,231.6
$963.5
$739.8
$519.3
$1,092.8
$1,224.6
Provision for credit losses
38.0
103.5
122.0
131.0
95.0
88.0
80.0
192.0
412.0
604.0
368.0
270.0
Pre-Tax, Pre-Provision Income
$460.3
$655.1
$797.9
$981.7
$1,161.5
$1,258.9
$1,311.6
$1,155.5
$1,151.8
$1,123.3
$1,460.8
$1,494.6
Earnings
Per
Share
Diluted earnings per share
$3.24
$3.58
$4.78
$4.95
$6.00
$6.73
$7.37
$5.95
$5.01
$2.89
$5.69
$6.35
Intangible amortization*
0.67
1.00
0.34
0.41
0.38
0.30
0.33
0.37
0.36
0.34
0.29
0.30
Merger-related items*
0.20
0.05
-
0.34
-
-
0.03
0.08
0.02
0.31
(0.14)
(0.10)
Diluted net operating
earnings per share
$4.11
$4.63
$5.12
$5.70
$6.38
$7.03
$7.73
$6.40
$5.39
$3.54
$5.84
$6.55
Efficiency Ratio
$'s in millions
Non-interest expenses
$718.6
$980.6
$961.6
$1,448.2
$1,516.0
$1,485.1
$1,551.7
$1,627.7
$1,727.0
$1,980.6
$1,914.8
$2,478.1
less: intangible amortization
69.6
121.7
51.5
78.2
75.4
56.8
63.0
66.5
66.6
64.3
58.1
61.6
less: merger-related expenses
26.0
8.0
-
60.4
-
-
5.0
14.9
3.5
89.2
0.8
83.7
Non-interest operating expenses
$623.0
$850.9
$910.1
$1,309.6
$1,440.6
$1,428.3
$1,483.7
$1,546.3
$1,656.8
$1,827.2
$1,856.0
$2,332.8
Tax equivalent revenues
$1,189.4
$1,653.3
$1,773.6
$2,446.2
$2,694.9
$2,761.3
$2,883.1
$2,804.1
$2,900.6
$3,125.7
$3,399.6
$3,998.6
less: gain/(loss) on sale of securities
(3.1)
1.9
(0.6)
2.5
2.9
1.2
2.6
1.2
34.4
1.2
2.8
150.2
less: net OTTI losses recognized
-
-
-
-
-
(29.4)
-
(127.3)
(182.2)
(138.3)
(86.3)
(77.0)
less: merger-related gains
-
-
-
-
-
-
-
-
-
29.1
27.5
64.9
Denominator for efficiency ratio
$1,192.5
$1,651.4
$1,774.2
$2,443.7
$2,692.0
$2,789.5
$2,880.5
$2,930.2
$3,048.4
$3,233.7
$3,455.6
$3,860.5
Net operating efficiency ratio
52.3%
51.5%
51.3%
53.6%
53.5%
51.2%
51.5%
52.8%
54.4%
56.5%
53.7%
60.4%
*Net of tax |
 33
Reconciliation of GAAP and Non-GAAP Measures
Average Assets
2006
2007
2008
2009
2010
2011
$'s in millions
Average assets
55,839
$
58,545
$
65,132
$
67,472
$
68,380
$
73,977
$
Goodwill
(2,908)
(2,933)
(3,193)
(3,393)
(3,525)
(3,525)
Core deposit and other
intangible assets
(191)
(221)
(214)
(191)
(153)
(168)
Deferred taxes
38
24
30
33
29
43
Average tangible assets
52,778
$
55,415
$
61,755
$
63,921
$
64,731
$
70,327
$
Average Common Equity
$'s in millions
Average common equity
6,041
$
6,247
$
6,423
$
6,616
$
7,367
$
8,207
$
Goodwill
(2,908)
(2,933)
(3,193)
(3,393)
(3,525)
(3,525)
Core deposit and other
intangible assets
(191)
(221)
(214)
(191)
(153)
(168)
Deferred taxes
38
24
30
33
29
43
Average tangible common equity
2,980
$
3,117
$
3,046
$
3,065
$
3,718
$
4,557
$ |