Attached files
| file | filename |
|---|---|
| 8-K - 8-K - DUKE REALTY CORP | d312271d8k.htm |
 RELIABLE. ANSWERS.
Investor Presentation
Exhibit 99.1
March 8, 2012 |
 40
Years Timeline 2
2011 Duke Realty Corporation
RELIABLE. ANSWERS |
 RELIABLE. ANSWERS.
2011
Duke
Realty
Corporation
3
2009
2010 and 2011
FOCUS:
Liquidity
More than $1.5 billion
capital raised
Strategy refined
FOCUS:
Strategy execution
Operating
fundamentals
Balance sheet
strength
FOCUS:
Asset quality
Cash flow growth
Shareholder return
Where we’ve been and where we’re going…
2012 and beyond |
 RELIABLE. ANSWERS.
2011 Duke Realty Corporation
Suburban Office Market Still Challenging
Economic and federal budget uncertainty limiting business investment and expansion
decisions Recovery
is
still
chugging
along
though,
with
Q4
overall
vacancy
declining
to
12.7%,
down
50
bps
from
previous
year,
with
class
A
only
space
vacancy
declining
80
bps
from
prior
year
Absorption for Q3 and Q4 modest, but strongest since 2007 and supply additions at
record low Re-leasing capital expenditures remain elevated
Medical Office Traction Remains
Operators now making expansion decisions after two year pause
Relationships are a key driver of on campus MOB business
Demographics and economics positive growth drivers
Medical office development and acquisition activity continues
4
Market Outlook
Still challenging, but trends improving in all product types
Industrial Market Continues Slow Recovery
Net absorption in U.S. for Q4 2011 was positive for the 7th consecutive
quarter Strong
demand
for
large,
modern
product
remains,
Q4
vacancy
down
230bps
over
prior
year
Rents beginning to improve, occupancy levels getting closer to equilibrium and
limited new supply ISM index has been slowly climbing after a moderate
trough in mid-2011 Manufacturing sector, wholesale trade and
transportation realizing a majority of recent job growth Source: PPR and
Duke Realty |
 RELIABLE. ANSWERS.
2011
Duke
Realty
Corporation
Focus on:
Increasing cash flow
Maximizing return on
assets
5
Strategy for Success
Focus on:
Improving coverage ratios
Improving ratings
Focus on:
Portfolio repositioning
Strategic acquisitions &
dispositions
Development opportunities
Strategies for delivering shareholder value |
 RELIABLE. ANSWERS.
2011
Duke
Realty
Corporation
Strategic Focus
2011 Goals and Objectives
Q4 2011 Update
•
Lease-up portfolio, manage cap ex; reach
positive same property income growth
•
Balance execution with capital strategy relative
to level and quality of cash flow and same
property NOI; Debt to EBITDA <7.0x
•
Development starts of $100 to $200 million
focus on medical office and build-to-suit
•
Total portfolio occupancy as of December 31, 2011 of 90.7%;
industrial portfolio at 91.9%
•
Approximately 5.1 million square feet of leases completed
•
Debt to EBITDA @ 6.0x*; 4.7% Same Property NOI growth
•
$12.7 million development start; a 52% pre-leased medical office
•
Continue strong momentum from 2010 on
repositioning of portfolio
•
Pursue acquisitions of medical and industrial
assets
•
Planned asset dispositions of primarily Midwest
office
•
Closed on over $388 million of acquisitions during the quarter
•
$1.11 billion in dispositions of non-core assets
•
Closed 79 building, $1.06 billion suburban office portfolio
sale to Blackstone
•
Opportunistically access capital markets . . .
push out maturity schedule further
•
Continue improving our coverage ratios
•
Maintain minimal balance on line of credit
•
YTD Fixed charge ratio of 1.82x versus 1.79x for 2010
•
Paid off $167 million of 3.75% Convertible Debt at maturity
•
Zero credit facility balance and $212MM of cash at quarter end,
primarily due to proceeds from Blackstone sale
•
Renewed $850MM line of credit for up to 5 year term (including
the 1 year extension option) at lower cost
Asset
Strategy
Operations
Strategy
Capital
Strategy
6
Strong Q4 finish and executing across all three aspects of our strategy
* Timing of Blackstone transaction; Including adjustments to EBITDA for Blackstone
transaction results in recast Debt to EBITDA of 7.03x |
 2011
Duke
Realty
Corporation
OPERATIONS STRATEGY
7 |
 2011
Duke
Realty
Corporation
8
Focus on Fundamentals
LEASING OF
PORTFOLIO
STRATEGIC
NEW DEVELOPMENT
AND LAND DISPOSITION
AFFO PAYOUT
OPERATIONS STRATEGY
Maximize return on assets |
 2011
Duke
Realty
Corporation
9
New, High Quality Portfolio with Long-term Leases
OPERATIONS STRATEGY
Premier portfolio of assets
Portfolio average
Bulk
Industrial
Suburban Office
Medical
Office
Property age
10.6 years
13.2 years
4.1 years
Property size
217,000 SF
116,000 SF
89,000 SF
Lease term
7.1 years
7.3 years
11.4 years
Tenant size
72,000 SF
12,000 SF
10,000 SF |
 Consistent Operating Performance
Stabilized Occupancy (%)
Strong
historical
stabilized
occupancy
–
fundamentals
improving
Lease Renewals (%)
Strong lease renewal percentages
Stabilized occupancy
In-service occupancy
80%
72%
79%
77%
69%
2007
2008
2009
2010
2011
29.9
21.4
22.7
25.9
2007
2008
2009
2010
2011
Leasing Activity
New
Leases
and
Renewals
–
Consistent
Execution
(in
millions
of
square feet)
Lease Maturity Schedule
Lease maturities are well balanced with no one year accounting for
more than 12%
24.5
OPERATIONS STRATEGY
Demonstrated ability to
maintain consistency through economic cycles
2011
Duke
Realty
Corporation
10
95%
92%
92%
89%
88%
91%
91%
89%
89%
87% |
 2011 Duke Realty Corporation
1.5%
(0.2%)
(0.2%)
3.2%
(0.6%)
0.2%
(1.0%)
0.0%
1.0%
2.0%
3.0%
4.0%
Suburban Office Peers
Industrial Peers
5-Year Avg.
1-Year Avg.
Annual Same-Store
NOI Growth
(1)
%, y-y
Sources SNL and company filings
Duke Realty
Suburban Office Peers
(2)
Industrial Peers (3)
Consistent NOI Growth Outperformance
Relative Performance vs. Peers
OPERATIONS STRATEGY
11
1.
Based on simple average of year-over-year annual same-property cash NOI growth, includes
2007 - 2011 2.
Suburban Office Peers include BDN, CLI, HIW, LRY and PKY; weighted by historical market cap 3.
Industrial includes DCT, EGP, FR, FPO, PSB, AMB and PLD; weighted by historical market cap Notes
|
 RELIABLE. ANSWERS.
2011
Duke
Realty
Corporation
12
Office Average: $4,857
58.6%
46.0%
52.2%
44.8%
38.0%
41.3%
53.6%
33.9%
40.2%
43.7%
0%
20%
40%
60%
80%
BDN
OFC
HIW
CLI
LRY
DRE
FR
DCT
PLD
EGP
91.3%
86.5%
90.7%
94.7%
92.5%
87.9%
89.7%
88.9%
88.2%
88.3%
80%
83%
86%
89%
92%
95%
LRY
HIW
CLI
OFC
BDN
DRE
EGP
PLD
DCT
FR
8.9x
7.2x
7.1x
9.5x
7.3x
7.4x
6.7x
6.3x
5.0x
5.2x
0.0x
3.0x
6.0x
9.0x
12.0x
OFC
BDN
HIW
LRY
CLI
DRE
PLD
FR
DCT
EGP
DRE Benchmarking Statistics
Source: SNL Financial, 3/6/12
Industrial Average: 7.7x
Industrial Average: 91.2%
$27,541
Industrial Average: $8,841
Office Average: 88.6%
Office Average: 6.5x
Office Average: 46.0%
Industrial Average: 44.1%
Total Market Cap ($ in millions)
(1)
Total Debt / Total Market Cap
Portfolio Occupancy
Total Debt / 2012E EBITDA
(1)
Key:
Office: LRY=Liberty; CLI=Mack-Cali; HIW=Highwoods; BDN=Brandywine
Industrial: PLD=Prologis; FR=First Industrial; DCT=DCT Industrial Trust; EGP=
Eastgroup; FPO= First Potomic (1) Pro forma for $1Bn suburban office
portfolio sale to Blackstone: debt by $452MM and preferred decreased by $168MM
6,561
4,760
2,835
2,798
2,190
4,086
4,355
4,523
8,279
$0
$2,000
$4,000
$6,000
$8,000
LRY
CLI
OFC
HIW
BDN
DRE
PLD
FR
DCT
EGP
$28,000 |
 RELIABLE. ANSWERS.
2011
Duke
Realty
Corporation
13
Industrial Average: 15.8x
Office Average: 11.1x
6.3%
5.7%
5.5%
4.9%
4.9%
4.3%
0.0%
5.4%
3.3%
4.5%
0.0%
1.0%
2.0%
3.0%
4.0%
5.0%
6.0%
7.0%
8.0%
CLI
LRY
BDN
HIW
OFC
DRE
DCT
EGP
PLD
FR
8.6%
7.2%
7.3%
8.1%
6.9%
6.2%
6.1%
7.6%
7.6%
7.5%
5.5%
6.0%
6.5%
7.0%
7.5%
8.0%
8.5%
9.0%
CLI
BDN
LRY
HIW
OFC
DRE
FR
DCT
PLD
EGP
17.8x
16.1x
18.9x
28.6x
28.0x
14.4x
24.6x
21.1x
16.2x
15.6x
10.0x
14.0x
18.0x
22.0x
26.0x
30.0x
LRY
HIW
OFC
BDN
CLI
DRE
PLD
FR
DCT
EGP
13.3x
11.8x
11.6x
8.0x
13.3x
20.4x
14.2x
10.7x
15.7x
12.9x
6.0x
10.0x
14.0x
18.0x
22.0x
LRY
HIW
OFC
CLI
BDN
DRE
PLD
EGP
DCT
FR
DRE Valuation Statistics
Industrial Average: 25.6x
Source: SNL Financial, 3/6/12
(1) Per Wall Street research as of 2/21/12
Industrial Average: 3.5%
Industrial Average: 6.8%
Office Average: 16.0x
Office Average: 5.5%
Office Average: 7.7%
Price / 2012E FFO
Implied Cap Rate
(1)
Dividend Yield
Price / 2012E AFFO
Key:
Office: LRY=Liberty; CLI=Mack-Cali; HIW=Highwoods; BDN=Brandywine
Industrial: PLD=Prologis; FR=First Industrial; DCT=DCT Industrial Trust; EGP=
Eastgroup; FPO= First Potomic |
 2011 Duke Realty Corporation
RELIABLE. ANSWERS.
14
Positioned for NAV Growth
KEY NAV GROWTH DRIVERS
Lease up
existing
vacancy
Increased
management/
service fees
Accretive
future
development
Upside from
land holdings
Portfolio occupancy of 90.7%; 100-200 bps below historical levels
Strong leasing pipeline
Demonstrated track record of 70-80% renewal rate
Will benefit from uptick in third party and JV partners development &
construction activity
Property
management
and
leasing
fees
-
will
trend
higher
as
occupancy
improves
Current pipeline of 569K SF of medical office and 344K SF of suburban office
2012 estimated development starts of $200 to $300 million
Attractive basis enhances accretive developments
Potential upside from impaired carrying value
Will opportunistically assess development and disposition alternatives
Increase Rents/
Reduced Capex
Rent roll downs burning off and positive same property NOI performance
Research forecasts market wide average annual rent growth of 3.2% from
2013-16 |
 2011
Duke
Realty
Corporation
15
Land and Development Capabilities
OPERATIONS STRATEGY
HELD FOR DEVELOPMENT
Midwest
26.3
2.8
Indianapolis, Chicago,
Cincinnati, Columbus,
Minneapolis, and
St. Louis major
positions
East
3.8
2.1
New Jersey,
Baltimore,
Washington D.C., and
Raleigh
Southeast
8.5
1.3
Atlanta, Central
Florida, and, South
Florida
Southwest
5.8
0.7
Phoenix, Dallas, and
Houston
Total
44.4 million SF
6.9 million SF
Attractive positions contribute to future development and value
Development –
Amounts in million SF
$498
million
Office
30%
Industrial
70%
Office
Industrial |
 2011
Duke
Realty
Corporation
16
Atlanta -
Office
OPERATIONS STRATEGY
Strategic new development on Duke Realty land
•
Headquarters
Build
to
Suit
for
Primerica,
A2/AA-
rated
financial
services
Company
•
345,000 square feet
•
Fifteen year lease term
•
Owned land at Legacy Office Park in Gwinnett County, 37 acres
•
First development at this park
•
$65 million project |
 2011
Duke
Realty
Corporation
17
Indianapolis –
Medical Office
OPERATIONS STRATEGY
Grow Medical Office
•
Wishard Faculty Office Building
•
Aa2 rated system sponsored by Marion County
•
275,000 square feet
•
Thirty year lease term
•
50/50 Joint Venture with Hospital System
•
On campus of new hospital to open in 2013
•
$90 million project |
 2011
Duke
Realty
Corporation
18
2011 PERFORMANCE
Average portfolio occupancy of 89.7%
Industrial at 91.9% occupancy
Nearly 25 million SF of leases executed
Same property NOI increase of 3.2%
2012 GOALS
Average portfolio occupancy of 91%
Achieve positive rent increases on renewals
Further improve lease quality (Cap Ex / NER)
Strong positive same property performance…again
OPERATIONS STRATEGY
Quality, well-positioned assets to drive performance |
 2011
Duke
Realty
Corporation
ASSET STRATEGY
19 |
 2011
Duke
Realty
Corporation
$1 Billion
20
Track Record
Flex disposition
$1 Billion
2005
2006
Savannah
Washington DC
2007
Healthcare
2009
Asset Strategy
2010
Dugan
CBRERT
Premier
Suburban
Office
Disposition
2011
Proven ability to execute
ASSET STRATEGY |
 2011
Duke
Realty
Corporation
21
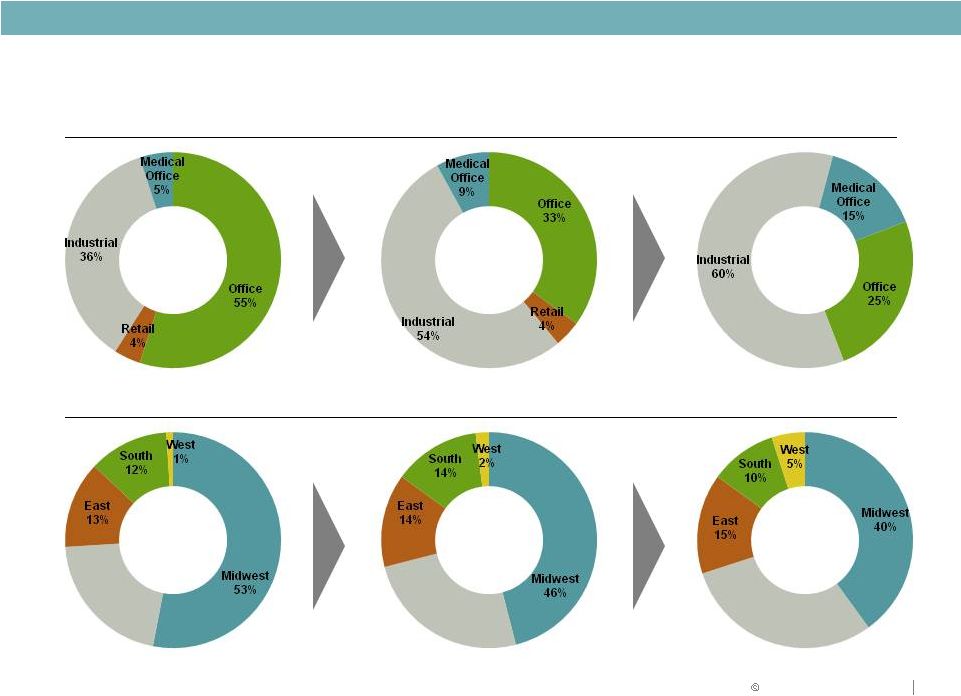
Portfolio Strategy
December 31, 2011
BY PRODUCT
2009
2013
BY GEOGRAPHY
ASSET STRATEGY
2009
2013
2011
Southeast
21%
Southeast
24%
Southeast
30%
2011 |
 2011
Duke
Realty
Corporation
22
Asset Strategy –
Quarterly Repositioning Activities
ACQUISITIONS
(1)
DISPOSITIONS
2010
Q1 2010
$9
Q1 2010
$123
Q2 2010
28
Q2 2010
31
Q3 2010
442
Q3 2010
43
Q4 2010
440
Q4 2010
302
2010 Total
$919
2010 Total
$499
2011
Q1 2011
$140
Q1 2011
$456
Q2 2011
$116
Q2 2011
$ 58
Q3 2011
$103
Q3 2011
$ 6
Q4 2011
$388
Q4 2011
$1,114
2011 Total
$747
2011 Total
$1,634
Total
$1,666
Total
$2,133
(1)
Stabilized Costs
ASSET STRATEGY
($ in millions) |
 2011
Duke
Realty
Corporation
23
Asset Strategy: Road Map
($ in millions)
Investment
12/31/10
Investment
12/31/11
ACTION PLAN
Investment
2013
PRODUCT TYPE
Amount
%
Amount
%
Acquisitions /
Developments /
Repositioning
Amount
%
Industrial
$3,645
45%
$4,129
54%
$809
$4,920
60%
Office
3,770
46%
2,555
33%
(420)
2,050
25%
Medical Office
515
6%
732
9%
498
1,230
15%
Retail
280
3%
304
4%
(314)
0
0%
$8,210
100%
$7,720
100%
$573
$8,200
100 %
REGION
Midwest
$3,970
48%
$3,564
46%
($209)
$3,280
40%
Southeast
2,270
28%
1,839
24%
630
2,460
30%
East
955
11%
1,064
14%
172
1,230
15%
South
950
12%
1,091
14%
(268)
820
10%
West
65
1%
162
2%
248
410
5%
$8,210
100%
$7,720
100%
$573
$8,200
100%
Portfolio sale accelerates suburban office repositioning
ASSET STRATEGY |
 2011
Duke
Realty
Corporation
24
ASSET STRATEGY
Asset Strategy: Progress To Date
BUILDING ACQUISITIONS
BUILDING DISPOSITIONS
Q4 2009
15
Q4 2009
144
2010
919
2010
499
2011
747
2011
1,634
Proforma Total
$1,681
Proforma Total
$2,277
PRO FORMA
PROGRESS TO DATE
TOTAL
VALUE
ASSUMED
DEBT
NET
Dispositions
$2,277
($0)
$2,277
Acquisitions
$1,681
($651)
$1,030
Excess Cash
$1,247
Only
100 Bps
difference in
Cap Rates
Matching
acquisitions
with
dispositions
.
.
.
limiting
earnings
impact
($ in millions) |
 2011
Duke
Realty
Corporation
25
2011 PERFORMANCE
$1.6 billion of dispositions
$747 million of acquisitions
Over $200 million of development starts
Made significant progress on strategic plan
2012 GOALS
$250 million of dispositions
$400 million of acquisitions
$250 million of development starts
Continue making progress on strategic plan
ASSET STRATEGY
Quality portfolio further improving with asset strategy
|
 2011
Duke
Realty
Corporation
CAPITAL STRATEGY AND 2011 GUIDANCE
26 |
 2011
Duke
Realty
Corporation
Capital Strategy Focus
27
Reducing leverage
Increasing coverage ratios
Maintaining size and quality of unencumbered asset base
Executing portfolio repositioning in alignment with capital strategy
objectives
Further improve balance sheet strength and ratings
CAPITAL STRATEGY
1
2
3
4 |
 2011
Duke
Realty
Corporation
28
Key Metrics & Goals
2009
Actual
2010
Actual
2011
Actual
Goal
Debt to Gross Assets
44.5%
46.3%
46.8%
45.0%
Debt + Preferred to Gross
Assets
54.9%
55.5%
55.6%
50.0%
Fixed Charge Coverage Ratio
1.79 : 1
1.79 : 1
1.82 : 1
2.00 : 1
Debt/EBITDA
6.65
7.31
6.02*
< 6.00
Debt + Preferred/EBITDA
8.47
8.88
7.34*
< 7.75
CAPITAL STRATEGY
Progressing toward strategic plan goals
Timing of Blackstone transaction; Including adjustments to EBITDA for Blackstone transaction results
in recast Debt to EBITDA of 7.03x and Debt+Preferred/EBITDA of 8.35x *
|
 2011
Duke
Realty
Corporation
29
CAPITAL STRATEGY
Continue to execute on capital strategy objectives
CAPITAL SOURCE
2007
2008
2009
2010
2011
TOTAL
Common Stock
$230
-
$575
$311
-
$1,116
Preferred Stock
-
$300
-
-
-
$300
Unsecured Debt
$300
$325
$500
$250
-
$1,375
Secured Debt
-
-
$270
-
-
$270
Asset Dispositions
$785
$475
$300
$533
$1,650
$3,344
TOTAL
$1,115
$1,100
$1,645
$1,094
$1,650
$6,405
•
Investment grade rated debt for over 15 years
•
Proven access to multiple capital sources
•
Available line of credit -
$850 million capacity
•
Dividend covered by AFFO
Continue to strengthen balance sheet
($ in millions) |
 2011 Duke Realty Corporation
CAPITAL STRATEGY
30
Liquidity Position
($ in millions)
Manageable debt maturities
and beyond |
  RELIABLE. ANSWERS.
2011
Duke
Realty
Corporation
2012 Range of Estimates
Metrics
2011
Actual
Pessimistic
Optimistic
Key Assumptions
Core FFO per share
$1.15
$0.94
$1.06
- Blackstone/repositioning dilution $.10 - $.12
- Lower service operations income
- Partially offset by improvement in occupancy of core portfolio
AFFO Payout Ratio
87%
96%
80%
- Annual dividend maintained at $0.68 per share
Average Occupancy - In-Service
89.7%
89.5%
92.5%
- Positive momentum anticipated given industrial and medical office perform
- Lower expirations than 2011 (7% vs. 10%)
- Upside to guidance driven by lease-up of portfolio
Same Property NOI Growth
3.2%
(1.5%)
2.5%
- Occupancy increase lower than 2011
- Rental rate pressure remains
Building Acquisitions
$747
$300
$500
- Remain selective regarding property type and location in alignment with
long-term strategy
- Focus on industrial and medical office
Building Dispositions
$1,634
$200
$300
- Continue to prune remaining non-core office portfolio
Land Sale Proceeds
$12
$20
$30
- Selling 10% to 20% of identified non-strategic parcels
- Demand still sluggish
Construction and Development Starts
$489
$300
$500
- Comprised of medical office and industrial starts
- Development of $200 to $300 million
- Third party of $100 to $200 million
Construction Volume
$727
$400
$600
- Wind down of BRAC project partially offset by development volume
Service Operations Income
$46
$20
$25
- Reduced fees from BRAC project
General & Administrative expense
$40
$43
$38
- In line with 2011
- 2012 Range -
$ in millions
Leasing Actions Combined with Modest Rental Rate Increases Drive
Upside
31 |
 Strong balance sheet …
executing according to strategy
* Timing of Blackstone transaction; Including adjustments to EBITDA for
Blackstone transaction results in recast Debt to EBITDA of 7.03x
32
2011
Duke
Realty
Corporation
2011 PERFORMANCE
$1.6 billion of capital raised through asset
dispositions
Retired $333 million of unsecured bonds
Redeemed $109 million of preferred equity
Fixed charge ratio of 1.82x and
debt to EBITDA of 6.02x*
2012 GOALS
Opportunistically access capital markets
Continue improving coverage ratios
Maintain minimal balance on line of credit
CAPITAL STRATEGY |
 2011
Duke
Realty
Corporation
MIDWEST OVERVIEW
Performance Update
33 |
 2011
Duke
Realty
Corporation
34
Midwest
New Lease -
Industrial
Plainfield 8 –
Indianapolis
250,000 SF
Tenant: Gilchrist & Soames
Term: 11 years
Renewal -
Industrial
Mosteller Dist Ctr. II -
Cincinnati
206,000 SF
Tenant: Kellogg’s
Term: 2 years
Strong distribution base: Over 30% of U.S.
population within one day’s drive
74 Fortune 500 headquarters
High growth and return opportunities, particularly in
Chicago, Columbus, and Indianapolis
Duke Realty’s roots and a position of strength
Original
location
–
since
1972
Low basis product
Dominant market position
46% of our total investment
Acquisition -
Industrial
Eight Bldg Portfolio -
Chicago
1,500,000 SF
100% Leased
Remaining Term: 4 years
MIDWEST OVERVIEW
Disposition-Office
Three Bldg Portfolio-
Cleveland
273,000 SF
22 Year Old Portfolio
MARKET OVERVIEW & KEY POINTS
Committed to Midwest because we perform…
Midwest remains a key component to our strategy
RECENT TRANSACTIONS |
 2011
Duke
Realty
Corporation
35
Midwest Overview
Location
Product
Type
Industrial
Office
Average Age
12.1 years
16.2 years
Average Building Size
240,000 SF
124,000 SF
Total Square Footage
55.4 million
12.4 million
Current Occupancy
94.5%
83.9%
Indianapolis
96.2%
91.9%
Chicago
98.50%
87.8%
Cincinnati
91.7%
82.4%
St. Louis
87.6%
78.8%
Columbus
96.8%
88.0%
Minneapolis
86.0%
100%
MIDWEST OVERVIEW |
 2011
Duke
Realty
Corporation
36
Midwest Focus
DOMINANT POSITION
BULK INDUSTRIAL
REDUCE OFFICE
CONCENTRATION
MIDWEST OVERVIEW
Enhancing dominant industrial position in Midwest |
 2011
Duke
Realty
Corporation
EAST & SOUTHEAST OVERVIEW
Performance Update
37 |
 2011 Duke Realty Corporation
38
East & Southeast Overview
Strong presence: entered Southeast in 1999 (Weeks
merger) and East in 2006 (acquisition of Winkler
portfolio)
15 Fortune 500 headquarters
East and Southeast cities among top growth markets
in country…
strong in-migration
Diversified economies; Government, healthcare,
finance and education
Eastern cities maintained highest employment rate
through downturn
Atlanta and Northeast corridor strong in bulk industrial
38% of our total investment
MARKET OVERVIEW & KEY POINTS
EAST & SOUTHEAST OVERVIEW
Renewal–
Industrial
Atlantic Business Ctr
South Florida
Point Blank Body Armor
104,000 SF
Term: 3 Years
New Leases -
Office
Liberty Ctr I Washington DC
Fortune 50 Defense
Contractor
80,000 SF
Term: 7 Years
Renewal -
Office
Crabtree Overlook
Raleigh
75,000 SF
Tenant: Alcatel-Lucent
Term: 5 Years
RECENT TRANSACTIONS |
 East
& Southeast Overview Location
Product
Type
Industrial
Office
9.5 years
10.1 years
161,000 SF
110,000 SF
28.6 million
9.7 million
86.9%
86.2%
77.2%
81.5%
83.0%
85.2%
96.6%
88.2%
91.7%
87.5%
92.2%
84.0%
91.8%
NA
EAST & SOUTHEAST OVERVIEW
Office
39%
Industrial
48%
Medical
Office
5%
Retail
8%
Atlanta
19%
D.C./
Baltimore
13%
Central
Florida
7%
Raleigh
24%
South
Florida
28%
Savannah
9%
39
2011
Duke
Realty
Corporation
Average Age
Average Building Size
Total Square Footage
Current Occupancy
Atlanta
South Florida
Raleigh
Washington D.C./Baltimore
Central Florida
Savannah |
 2011
Duke
Realty
Corporation
40
East & Southeast Focus
BULK INDUSTRIAL/PORTS
LEASE UP AND RENT GROWTH
ACQUISITIONS & DEVELOPMENT
EAST & SOUTHEAST OVERVIEW
Maximize assets and market position |
 2011
Duke
Realty
Corporation
41
SOUTHWEST OVERVIEW
Performance Update |
 2011
Duke
Realty
Corporation
42
Southwest
Acquisition -
Industrial
Lakeside Ranch / Pioneer
Dallas
1,400,000 SF
100% Leased
Remaining Term: 5 Years
Acquisition-
Industrial
1283 Sherborn Street
Southern California
290,000 SF
100% Leased
Remaining Term: 9 Years
MARKET OVERVIEW & KEY POINTS
Renewal/Expansion-
Industrial
Freeport X
Container Store
Dallas
955,000 SF
Duke Realty one of top 3 owner/developers in
Dallas/Ft.Worth
Duke Realty presence since 1999 (Weeks merger) 52 Fortune 500 headquarters
Demographic drivers: modern transportation and
infrastructure, population and job growth
Strong industrial demand expected post-recovery
Port, inland port and logistics key for bulk distribution
markets
16% of our total investment
Expand industrial presence by pursuing select
acquisition opportunities in Houston, Phoenix and
Southern California
SOUTHWEST OVERVIEW
RECENT TRANSACTIONS |
 2011 Duke Realty Corporation
SOUTHWEST OVERVIEW
43
Southwest Overview
Industrial
Office
Average Age
8.3 years
7.3 years
Average Building Size
272,000 SF
106,700 SF
Total Square Footage
23.4 million
1.6 million
Current Occupancy
91.8%
95.2%
Dallas
89.6%
100%
Nashville
95.9%
93.4%
Houston
95.3%
100%
Phoenix
94.4%
N/A
Southern California
100%
N/A |
 2011
Duke
Realty
Corporation
44
Southwest Focus
DALLAS LEASE-UP
HOUSTON INDUSTRIAL PORT
DALLAS INLAND PORT
SOUTHERN CALIFORNIA
EXPANSION
SOUTHWEST OVERVIEW
Grow |
 2011
Duke
Realty
Corporation
45
MEDICAL OFFICE STRATEGY &
Performance Update |
 2011
Duke
Realty
Corporation
Medical Office Portfolio at December 31, 2011
46
In-Service
Under
Development
Total
Properties
38
5
43
Investment $
$625 M
$106 M
$731 M
Square Feet
3.38 M
568 K
3.95 M
Occupancy
90%
83%
89%
Local
26%
Regional
48%
National
26%
Specialty
Hospital
4%
MOB On-
Campus
89%
MOB
Off-Campus
7%
Portfolio investment by product type
Portfolio investment by
hospital system
MEDICAL OFFICE STRATEGY |
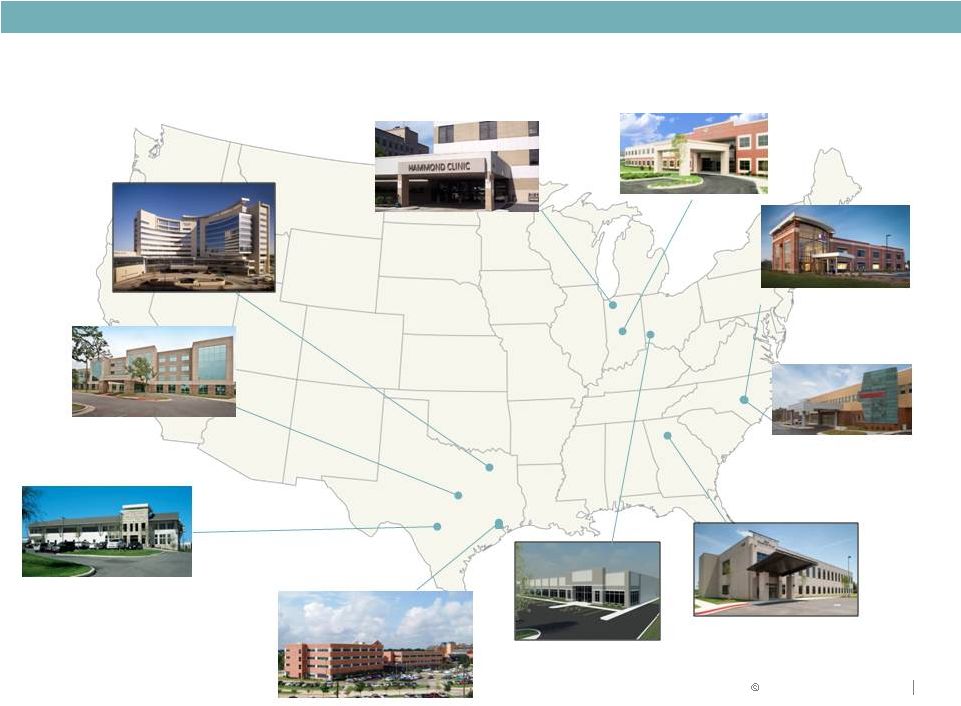
 PIEDMONT ATLANTIC
Atlanta*
Birmingham
Charlotte
Nashville*
Raleigh*
NORTHEAST
Baltimore*
Boston
Philadelphia
Richmond
Washington, D.C.*
GREAT LAKES
Chicago*
Columbus*
Indianapolis*
Louisville
Minneapolis*
St. Louis*
FLORIDA
Jacksonville
Miami
Orlando*
Tampa*
GULF COAST
ARIZONA SUN
CORRIDOR
NORTHERN
CALIFORNIA
SOUTHERN
CALIFORNIA
CASCADIA
Megaregions by 2050:
major cities that produce more than $100 billion in goods and
services. Mega-regions will drive need for healthcare,
transportation infrastructure and jobs through 2050
Duke Realty Markets: Demographic Focus
*
Duke Realty market
Map Source: ATLANTA REGIONAL COMMISSION MEGAREGIONS REPORT
47
TEXAS TRIANGLE
Austin*
Dallas
*
Houston*
San Antonio
Populations in contiguous regions with
MEDICAL OFFICE STRATEGY
2011
Duke
Realty
Corporation |
 2011
Duke
Realty
Corporation
48
Healthcare Data Points
The nation’s largest industry
•
Represents more than 17% of GDP, predicted to exceed 23% by
2020
•
Americans spend more than 5% of pre-tax income on
healthcare. Lower income brackets pay 15% or more ($7,800
per capita health expenditures in 2008/2009)
Reform
•
Increased number of people insured expected to increase by 30
to
50
million
–
increased
demand
for
care
•
Number
of
physicians
will
increase
–
more
space
demand
•
Hospitals expect margin pressure and need to increase market
share –
Hospitals seeking capital partners for “non-core
assets”
•
May
reduce
reimbursements
–
real
estate
efficiency
a
priority –
larger deals and floor plates
Healthcare systems growing and physician employment changing
MEDICAL OFFICE STRATEGY |
 2011
Duke
Realty
Corporation
49
Healthcare Systems
Consolidation of hospitals into systems
continues
Hospitals need capital and must grow
market share
Healthcare systems are drivers for more
strategically located outpatient facilities
Employment of Physicians
More physicians are being employed by
hospitals
Hospitals and physicians are forming
multi-specialty practices to prepare for
improved quality and reduced
reimbursement
Hospitals are driving more medical office
space needs for physicians
Fewer Independent Community Hospitals
More Physician’s Aligning with Hospitals
Demand Drivers
#
Hospitals
5,000
MEDICAL OFFICE STRATEGY
Source: Robert Kocher, MD and Nikhil R. Sahni, B.S., “Hospitals’ Race to Employ Physicians
– The Logic behind a Money-Losing Proposition. ”The New England Journal of
Medicine.;364:1790-1793. 12 May 2011. Physician Compensation and Production Survey, Medical Group Mgt Assoc, 2003-2009.
|
 2011
Duke
Realty
Corporation
50
Development Focus
ACTION PLAN
National brand awareness
Be “Experts”
–
Speak at national conferences (ASHE, BOMA)
–
Third party references
National system relationships
–
Ascension
–
Tenet
–
HCA
–
Adventist
Regional system relationships
–
Baylor Health
–
Rex Healthcare
–
Carolina Healthcare Systems
–
Advocate
System
Focus
MEDICAL OFFICE STRATEGY |
 Healthcare Projects Delivered/Acquired in 2011
Western Ridge MOB II
Cincinnati, OH
29,500 SF, 80% leased
New Hampton Place
Snellville, GA
40,000 SF, 66% leased
Rex Holly Springs MOB
Raleigh, NC
30,000 SF, 100% leased
Christus St. Catherine
Houston, TX
169,000 SF, 96% leased
Baylor Cancer Center
Dallas, TX
460,000 SF, 95% leased
WakeMed Brier Creek
Healthplex
Raleigh, NC
48,000 SF, 79% leased
Cedar Park MOB
Austin, TX
83,000 SF, 95% leased
Christus Santa Rosa
San Antonio, TX
111,000 SF, 100% leased
Max Simon MOB
Indianapolis, IN
85,000 SF, 100% leased
Franciscan Alliance
Chicago area (Hammond, IN)
195,000 SF, 100% leased
MEDICAL OFFICE STRATEGY
51
2011 Duke Realty Corporation |
 Healthcare Projects Under Development at December 31, 2011
Baylor McKinney MOB I
McKinney, TX
114,000 SF, 66% preleased
WakeMed Raleigh
Medical Park
Raleigh, NC
86,000 SF, 58% preleased
Marquette General Hospital MOB
Escanaba, MI
43,000 SF, 100% preleased
North Fulton MOB
Atlanta, GA
52,000 SF, 52% preleased
Wishard Faculty Office
Building
Indianapolis, IN
275,000 SF, 100% preleased
MEDICAL OFFICE STRATEGY
2011
Duke
Realty
Corporation
52 |
 Existing healthcare assets $775 Million by
1/31/2012
New developments
$200 Million in 2012 and
2013
Acquire
$200-$250 Million in 2012 and 2013
Goal: Grow Medical Office to $1.25 Billion by 2013
MEDICAL OFFICE STRATEGY
Our Plan
Our Focus
Growth regions (Southeast, South)
Health system relationships
On-campus assets
Class A product (50,000 –
400,000 + square feet)
National industry expert
53
2011
Duke
Realty
Corporation |
 2011 Duke Realty Corporation
54
WHY DUKE REALTY?
Quality portfolio improving with asset strategy
Solid balance sheet improving with capital strategy
Unmatched ability to execute on daily operations
Development capabilities in place with existing land bank
Talent and leadership depth to execute
Delivering on what we say we will do
MEDICAL OFFICE STRATEGY |
 Vision Road Map –
Future Duke Realty
Low leverage industrial and office REIT in high growth markets
and product segments
MEDICAL OFFICE STRATEGY
What We Will Be
Action Plan
•
Low leveraged
•
Move from 54% to 45% leverage
Non-Strategic property and land sales
•
Product focused
•
Become bulk industrial focused
Industrial: Increase from 35% to > 60%
Office: Decrease from 55% to < 25%
Medical: Grow from 5% to 15%+
•
Concentrated in high growth
markets
•
Align investment and resources to high
growth markets; dispose/exit non
-strategic
areas
Differentiated asset strategy within
tighter geographic focus
55
2011
Duke
Realty
Corporation |
 2011 Duke Realty Corporation
APPENDIX
56 |
 2011
Duke
Realty
Corporation
EXECUTIVE TEAM
57 |
 2011
Duke
Realty
Corporation
58
DENNIS D. OKLAK
Chairman and Chief Executive Officer
Denny serves as head of Duke Realty’s Executive Committee, overseeing the
company’s strategic direction and its Investment Committee, with
responsibility for approving major capital transactions. Prior to becoming
Chief Executive Officer in April 2004, Denny served as President and Chief Operating
Officer, a position in which he was responsible for all real estate
operations. In the 25 years he has been with Duke Realty, Denny has served
in various roles throughout the company including Executive Vice President
and Chief Administrative Officer and Vice President and Treasurer.
Denny
spent
nine
years
with
Deloitte
&
Touche,
a
global
auditing
and
consulting
firm
before
joining
Duke
Realty.
CHRISTIE B. KELLY
Executive Vice President and Chief Financial Officer
Christie oversees all accounting and financial reporting functions of Duke Realty,
including property, operations,
taxation,
treasury,
financial
analysis,
and
investor
relations.
She
joined
Duke
Realty
in
2009,
bringing
with
her
25
years’
experience
in
financial
management,
mergers and acquisitions, information technology and investment banking. Most
recently, she was a Senior
Vice
President,
Global
Real
Estate,
with
Lehman
Brothers,
where
she
led
real
estate
equity
syndication in the United States and Canada. She spent most of her career at
General Electric, holding a variety of domestic and global leadership roles
for GE Real Estate, GE Capital, GE Corporate Audit, and GE Medical Systems.
EXECUTIVE |
 JAMES B. CONNOR
Senior Regional Executive Vice President, Midwest
Jim manages and leads business units in Minneapolis, St. Louis, Chicago,
Indianapolis, Cincinnati, Columbus and Cleveland, and is a member of the
company’s Executive, Investment and Overhead Committees.
Previously, Jim served as Senior Vice President of Duke Realty’s Chicago
operations, where he was responsible for that market’s office and
industrial portfolios. He led and directed the leasing, acquisition and
development activity, building Duke Realty’s Chicago portfolio to more than 12.8 million square feet
and was awarded the 2000 Build-to-Suit of the Year and 2002 Redevelopment
of the Year by the National Association of Industrial and Office
Professionals (NAIOP). In 2008, he was recognized by the Society of
Industrial and Office Realtors for the Largest Investment Transaction in the Country.
Jim joined Duke Realty 13 years ago after holding numerous executive and brokerage
positions with Cushman & Wakefield, most recently serving as Senior
Managing Director for the Midwest area. CHARLES E. PODELL
Senior Vice President, Indiana Operations
Charlie is responsible for all development, marketing, and leasing activities for
the company’s Indiana operations, comprising more than 29 million
square feet of industrial and office properties. Charlie joined Duke Realty
in 1989 as an Industrial Leasing Representative, later becoming Director of
Leasing. In 1997, he was named Assistant Vice President, taking responsibility for
the leasing and development of three industrial parks. In 2001, Charlie was
promoted to Vice President of Leasing for Duke Realty’s Indiana
Industrial Team. In 2006, Charlie was chosen to oversee the Duke Realty portion
of the Browning/Duke Realty Joint venture. This JV is made up of
more than 1,500 acres and 20 million
square feet of new development. In 2009, he was named Senior Vice President of all
of Duke’s Indiana operations.
MIDWEST
59
2011
Duke
Realty
Corporation |
 2011
Duke
Realty
Corporation
60
JON C. BURGER
Senior Vice President, Cincinnati
Jon is responsible for the development, construction, leasing, and management of
Duke Realty’s office and industrial portfolio in Cincinnati.
Previously, Jon served as Vice President, Cleveland Operations. Prior to
joining Duke Realty, he was a Managing Director at Armstrong Development. He also spent 13
years as a Principal with Trammel Crow Company.
STEVEN W. SCHNUR
Senior Vice President, Chicago
Steve is responsible for the Chicago market’s expanding office and industrial
portfolios. In addition to leading
the
Asset
Management
and
Leasing
Operations,
he
works
to
identify
new
land
positions,
acquisition and development opportunities, and prospects for built-to-suit
development. Prior to his position with Duke Realty, Steve was Director of
Real Estate for Opus North Corporation, where he was responsible for the
development and leasing-related activities for industrial, office and
residential projects.
MIDWEST |
 2011
Duke
Realty
Corporation
61
JAMES T. CLARK
Senior Vice President, Columbus
Jim is responsible for all development, leasing and asset management activities
for the Columbus, Ohio market.
Previously as Vice President for the Columbus Office division, he oversaw leasing,
development and acquisitions for Tuttle Crossing and Easton. Jim has been
with the company since 1996 and has served in several different capacities
including leasing, development and operations of the Columbus Office
portfolio. Prior to Duke Realty, Jim worked in Columbus for The Galbreath
Company. Jim has helped develop four planned office parks and was involved
in significant built-to-suit projects including Discover Card,
Nationwide Insurance, Lane Bryant and Alliance Data Systems. In addition, he
oversaw large industrial projects for Kellogg’s, Restoration Hardware and
Kraft. THOMAS (TOBY) R. MARTIN
Senior Vice President, St. Louis
Toby is responsible for overseeing the leasing, management, and expansion of Duke
Realty’s more than 7 million-square foot St. Louis industrial and
office portfolio. Before joining Duke Realty in 2008, Toby worked in the
commercial real estate industry for more than 15 years. He joined Colliers
Turley Martin Tucker in 1991, holding several management positions, including
Senior Vice President and Management Committee member. In 2003, he founded TM
Properties III, L.P., a real estate investment company focusing on
industrial and retail properties in the central corridor of the United
States. He operates this company, as well as TM Properties, LLC, a company founded by
his father, under the name of Martin Equity Management.
During his brokerage career, Toby represented landlords and tenants in hundreds of
transactions involving millions of square feet of space.
MIDWEST |
 2011
Duke
Realty
Corporation
62
PAT MASCIA
Senior Vice President, Minneapolis/St. Paul
Pat is the business unit head responsible for the profitability and operation of
Duke Realty’s Twin Cities’ office.
Pat joined Duke Realty in 2004. He began his real estate career practicing real
estate, real estate finance and municipal law with Briggs and Morgan, P.A.
in Saint Paul for six years. He then joined Opus Corporation
as
Associate
General
Counsel,
a
position
he
held
for
approximately
two
years.
Pat
was
later
named Vice President of Dispositions, Finance, and Investments at Opus Properties,
L.L.C. and held this position for approximately five years before joining
Duke Realty. MIDWEST |
 2011
Duke
Realty
Corporation
63
JEFF TURNER
Regional Executive Vice President, South and West Regions
Jeff has responsibility for the company’s South and West Regions, including
overseeing all development, leasing, asset management, and real estate
operations. Duke Realty’s South and West Regions include the cities of
Dallas, Houston, Nashville, Phoenix and Seattle, where Duke Realty has
nearly 23 million square feet of office and industrial properties. Jeff is also a
member of the company’s Management and Investment and Executive
Committees. Previously, Jeff served as Senior Vice President of Duke
Realty’s Dallas operations, where his team grew the Dallas portfolio
from 1.3 million square feet to more than 15 million square feet, primarily
through speculative and built-to-suit development and a large joint
venture with JP Morgan Investments. Prior to joining Duke Realty 13 years
ago Jeff was Vice President for Paragon Group, where he was involved in
industrial leasing and development for 13 years and was a National Top Producer.
JEFF THORNTON
Senior Vice President, Dallas
Jeff
is
responsible
for
leasing,
land
and
building
acquisitions,
built-to-suit
and
multi-tenant
development
projects, and overseeing the day-to-day activities of the Dallas
office. Jeff joined Duke Realty in 2001 and served as Vice President of
Industrial Leasing. He was responsible for the development and marketing of
Duke Realty’s industrial projects in the Dallas/Fort Worth area, which
totaled more than 13 million square feet. Prior to joining Duke Realty, Jeff
was Leasing Manager at Insignia/ESG where he leased and sold both office
and industrial properties for institutional owners including Aetna Life Insurance Company,
Weingarten
Realty,
J.P.
Morgan,
John
Hancock,
and
The
Blackstone
Group.
SOUTHWEST |
 2011
Duke
Realty
Corporation
64
JEFF PALMQUIST
Senior Vice President, Nashville
Jeff is responsible for leading and directing the leasing, property management and
marketing of the existing 4.8-million square foot Nashville portfolio,
as well as all new development and land and building acquisitions and
dispositions. Jeff joined Duke Realty in 1995 as a Senior Leasing
Representative in its Columbus office and was promoted to Vice President,
Industrial Leasing in 1999. During his tenure in Columbus, Jeff was
instrumental in Duke Realty’s completion of more than 7.5 million square feet
of industrial development and acquisitions In 2006, Jeff relocated to
Nashville to assume day-to-day responsibilities for the office. KEVIN
ROGUS Senior Vice President, Phoenix
Kevin
is
responsible
for
identifying
opportunities
and
executing
Duke
Realty’s
projects
in
Phoenix
and
expansion into new markets in the western United States.
Kevin joined Duke Realty in 1985, holding various positions during his first 14
years, including Project Engineer, Preconstruction Manager, Construction
Manager, and Vice President of Construction for Cincinnati
operations. From 1999 to 2003, he was Senior Vice President of Duke
Realty’s Construction group, with responsibility for the overall
performance of all design and construction activities in Cincinnati, Ohio;
Nashville, Tennessee; Raleigh, North Carolina; and Orlando, Florida. From
2003–2006, Kevin was Senior Vice President of Duke Realty’s
Cincinnati, Ohio operations, where he oversaw the development, construction,
leasing, and management of a 17.5 million-square foot office and industrial portfolio.
SOUTHWEST |
 2011
Duke
Realty
Corporation
65
DAVID HUDSON
Senior Vice President, Houston
David
is
responsible
for
new
development,
leasing,
acquisitions,
and
other
day-to-day
activities
of
Duke
Realty’s Houston office. Since joining the company in February 2006,
David has overseen the development of more than 900,000 square feet of
office and industrial properties in the Houston market and continues to
search for opportunities to expand Duke Realty’s presence in Texas.
Prior to Duke Realty, David worked for Trammell Crow Company, where he was
responsible for the marketing and leasing of approximately 9 million square
feet of office and warehouse space. Additionally, David supervised and
trained marketing representatives in dealing with investors and owners of
industrial properties, including several large institutional and private investors. He also has
been actively involved in both built-to-suit and speculative
transactions. SOUTHWEST |
 2011
Duke
Realty
Corporation
66
J. SAMUEL O’BRIANT
Regional Executive Vice President, Southeast & East
Sam has overall responsibility for the company’s new investment activities
and portfolio operations in its Southeast and East regions, overseeing
business units in Atlanta, Savannah, Central and South Florida,
Raleigh,
Washington,
DC,
Baltimore
and
northern
New
Jersey.
Duke
Realty’s
southeast
and
east
property portfolios total more than 38 million square feet of office and
industrial space and more than 1,400
acres
of
land
for
future
development.
In
addition,
he
is
a
member
of
the
company’s
Executive,
Investment and Operating Committees.
Previously,
Sam
served
as
Regional
Senior
Vice
President
for
the
Southeast
Region
and,
before
that,
managed the company's Atlanta and Savannah industrial business units. Before
joining Duke Realty in 2004, Sam held positions with MetLife Real Estate
Investments, iStar Financial, and First Industrial Realty Trust, most
recently serving as Vice President of Acquisitions and Development at First
Industrial.
J. CHRISTOPHER BROWN
Senior Vice President, Atlanta
Chris is responsible for all development, marketing and leasing activities for the
company’s Georgia office and industrial properties, comprising nearly
20 million square feet in metro Atlanta and Savannah. Chris
joined
Duke
Realty
in
1996
as
a
Financial
Analyst.
Between
1999
and
2004,
Chris
served
in a
variety of roles in acquisitions/dispositions, ultimately being promoted to Vice
President in 2002. In 2004, Chris
transferred
to
Leasing
as
a
Leasing
Representative
for
the
Atlanta
Industrial
Group.
In
2006,
he
was promoted to Vice President of Leasing for the Atlanta Industrial Group. In
2007, Chris was promoted to
Senior
Vice
President,
Atlanta
Industrial
Group
and,
in
2009,
took
the
leading
role
in
Duke
Realty’s
Savannah portfolio and its Atlanta suburban office portfolio.
Before joining Duke Realty, Chris was a Senior Real Estate Consultant for four
years and a Tax Accountant for one year with Arthur Andersen, LLP.
SOUTHEAST & EAST |
 2011
Duke
Realty
Corporation
67
DOUG IRMSCHER
Senior Vice President, Central Florida
Doug
is
responsible
for
the
overall
profitability
and
operations
of
the
company’s
expanding
office
and
industrial portfolios in Orlando and Tampa. In addition, he is responsible for
identifying new land positions, building acquisitions, new development and
build-to-suit opportunities. Since relocating to Orlando in 2001,
Doug has developed than 3 million square feet of office and industrial projects.
Prior to relocating to Orlando, Doug was responsible for more than 4 million
square feet of suburban office space in the Cincinnati, Ohio office. He
joined the company in 1994 and has served in several different capacities
on the leasing/development side of the business. JEFF SHEEHAN
Senior Vice President, Raleigh
Jeff is responsible for the overall operations of Duke Realty’s Raleigh
office, as well as the pursuit of opportunities throughout the state. Duke
Realty’s portfolio in the Triangle region is composed of 5.4 million
square feet of office and industrial space. Jeff
joined
Duke
Realty’s
Executive
Leadership
Program
in
2000.,
starting
out
as
a
Financial
Analyst.
He
then
transferred
to
Sales/Leasing
as
a
Leasing
Representative
in
2002.
In
2005,
Jeff
was
promoted
to
Senior Leasing Representative, where he was responsible for the sales and leasing
of office properties in the Triangle area. He was promoted to Vice
President of Leasing in the Raleigh office in 2006, and moved into his
current role in January 2007. SOUTHEAST & EAST
|
 2011
Duke
Realty
Corporation
68
ED MITCHELL
Senior Vice President, South Florida
Ed is responsible for the development, marketing, leasing, and management of the
South Florida office, retail and industrial portfolio, which currently
consists of more than 1,700,000 square feet. Duke Realty also has 155 acres
of land in South Florida that will support the development of approximately 800,000
square feet of office space and 1.1 million square feet of industrial
properties. Prior to joining Duke Realty in 2007, he was First Vice
President with CB Richard Ellis for three years and Managing Director for
four years; Director of Leasing and Development with Premier Commercial
Realty for five years; and Leasing Representative and Construction Manager with
Trammell Crow Company for five years.
PETER SCHOLZ
Senior Vice President, Washington D.C.
Peter oversees the marketing, leasing, property management, acquisition, and
development functions of a nearly 4.0 million-square foot industrial
and office portfolio in the Washington, D.C. market. Peter joined Duke
Realty in 2006 as part of The Mark Winkler Company acquisition that led to Duke
Realty’s entry into the Washington, D.C. market. As a principal with and
Senior Vice President of that company, Peter was responsible for directing
its leasing and transaction group, serving as the liaison with
third-party asset management clients, coordinating build-to-suit activities, and evaluating acquisition
and disposition opportunities.
Peter has more than 25 years of experience in real estate management, leasing,
development, and finance, and has held positions within the Marriott
Corporation and was a principal with Landstar Development Corporation prior
to joining The Mark Winkler Company. SOUTHEAST & EAST
|
 2011
Duke
Realty
Corporation
69
JAMES D. BREMNER
President, Healthcare
Jim leads the company’s efforts in the development, ownership, leasing and
management of healthcare facilities. He has 30 years of real estate
experience and 15 years of dedicated healthcare experience (4 years with
Duke Realty). Duke Realty entered the healthcare market in 2007 with the
acquisition of Bremner Healthcare, a company Jim founded in 1986. Prior to
that, Jim was a partner and President of Revel Companies, which leased and
managed more than 5,000 apartment units and 4 million square feet of office space.
In addition to sitting on Duke Realty’s Executive and Investment Committees,
Jim brings a “hands-on” approach to the many phases of the
development process, including capital analysis, ownership modeling and
physician relationships. DONALD R. DUNBAR
Executive Vice President, Healthcare
Don is responsible for the planning, funding and execution of healthcare
development projects in the Midwest and East Coast regions. His expertise
in strategic planning, physician ownership modeling, and leasing services
offers a distinct skill set for successful healthcare development. Don
guides each project to a successful start, working with hospital personnel, the healthcare leasing
team, project managers, and general contractors.
Don joined the healthcare group in 1989, and has been actively involved in
developing and managing real estate since 1985.
HEALTHCARE |
 2011
Duke
Realty
Corporation
70
DEENI TAYLOR
Executive Vice President, Healthcare
Deeni works with physicians and hospitals to understand their goals and objectives
regarding their real estate. With his 25-year hospital career,
Deeni’s wealth of knowledge and experience are valuable in each
development project. Deeni came to the Healthcare group after serving as
Chief Strategy Officer for St. Vincent Health, an Ascension Health system
of 16 hospitals serving 45 counties in central Indiana. Before joining St.
Vincent Health, Taylor was president of UNITY Health Management Services in
Birmingham, Alabama. He
also
worked
for
St.
Vincent’s
Hospital
in
Birmingham,
Alabama,
as
Vice
President
of
Planning
and
Marketing.
HEALTHCARE
KEITH KONKOLI
Senior Vice President, Healthcare –
Midwest
Keith oversees new business development, project development, asset management,
and leasing for all healthcare projects in the Midwest Region. Keith
ensures effective use of the company’s delivery system and ensures
that funds generated from operations are maximized to grow our client base through
professional development, acquisitions and third-party fees.
Keith joined Duke Realty as a Senior Property Manager in the Columbus office in
1997. In 2000, he moved to Atlanta and was promoted to Vice President,
Property Management. In 2004, he was named Regional Asset Manager for the
Indianapolis Asset Management group and, in 2005, was promoted to Senior
Vice President, Real Estate Operations. |
 MARK
A. DENIEN Senior Vice President and Chief Accounting Officer
Mark has been Senior Vice President of Accounting for Duke Realty since 2006. He
joined the company six years ago as Senior Vice President of
Administration. Prior to joining Duke Realty, he was with KMPG, LLP for 16
years and left the firm as a partner. RON HUBBARD
Assistant Vice President, Investor Relations
FINANCE
Ron
comes
to
Duke
Realty
with
17
years
of
experience
in
investor
relations,
corporate
finance and
financial analysis from a real estate investment management firm, a
publicly-traded healthcare REIT and
a
big
6
CPA
firm.
Prior
to
joining
Duke
Realty,
Ron
spent
3
years
with
Nationwide
Health
Properties, a firm with investments in medical office, nursing homes and senior
housing, as Vice President of Investor Relations & Capital Markets,
where he was responsible for investor relations, corporate finance and
project finance. Ron also spent 11 years with Pacific Life’s Real
Estate Division as Managing Director of REIT Finance where he was the
credit analyst and portfolio manager for $1.5 billion
of
REIT
unsecured
notes,
preferred
equity
securities
and
leveraged
loans.
Ron
holds
a
Masters
Degree in Business with a
dual major in Real Estate and Finance from the University of Wisconsin, and
an undergraduate degree in Accounting from the same institution.
71
2011
Duke
Realty
Corporation |
 NICK
ANTHONY Senior Vice President, Capital Transactions and JV Management
As Senior Vice President, Capital Transactions and JV Management, Nick is
responsible for the overall management
of
Duke
Realty’s
joint
venture
business,
as
well
as
acquisition
and
disposition
activity.
Previously, as Vice President of Portfolio Management, Nick was responsible for
the overall management of the Dugan Joint Venture, a $1 billion industrial
portfolio between J.P. Morgan and Duke Realty. He began his career with
Duke Realty in 1989 as a Staff Accountant. FINANCE
72
2011
Duke
Realty
Corporation |
 Forward-Looking Statement
This slide presentation contains statements that constitute “forward-looking
statements” within the
meaning of the Securities Act of 1933 and the Securities Exchange Act of 1934 as
amended by the Private Securities Litigation Reform Act of 1995. These
forward-looking statements include, among others, our statements regarding
(1) strategic initiatives with respect to our assets, operations and capital and (2) the
assumptions underlying our expectations. Prospective investors are cautioned
that any such forward- looking statements are not guarantees of future
performance and involve risks and uncertainties, and that actual results may
differ materially from those contemplated by such forward-looking statements. A
number of important factors could cause actual results to differ
materially from those contemplated by
forward-looking statements in this slide presentation. Many of these
factors are beyond our ability to control or predict. Factors that could
cause actual results to differ materially from those contemplated in this
slide presentation include the factors set forth in our filings with the Securities and Exchange
Commission, including our annual report on Form10-K, quarterly reports on Form
10-Q and current reports on Form 8-K. We believe these
forward-looking statements are reasonable, however, undue reliance should
not be placed on any forward-looking statements, which are based on current expectations. We
do
not assume any obligation to update any forward-looking statements as a result of
new information or future developments or otherwise.
Certain of the financial measures appearing in this slide presentation are or may be
considered to be non- GAAP financial measures. Management believes that
these non-GAAP financial measures provide additional appropriate measures
of our operating results. While we believe these non-GAAP financial
measures are useful in evaluating our company, the information should be considered
supplemental in nature and not a substitute for the information prepared in
accordance with GAAP. We have provided for
your reference supplemental financial disclosure for these measures, including the
most directly comparable GAAP measure and an associated reconciliation in our
most recent quarter supplemental report, which is available on our website at
www.dukerealty.com. Our most recent quarter supplemental report also
includes the information necessary to recalculate certain operational ratios and ratios of
financial position. The calculation of these non-GAAP measures may differ
from the methodology used by other REITs, and therefore, may not be
comparable. 73
2011
Duke
Realty
Corporation
RELIABLE. ANSWERS. |