Attached files
| file | filename |
|---|---|
| EX-21.1 - LIST OF SUBSIDIARIES - Aleris Corp | d176100dex211.htm |
| EX-23.2 - CONSENT OF ERNST & YOUNG LLP - Aleris Corp | d176100dex232.htm |
Table of Contents
As filed with the Securities and Exchange Commission on March 8, 2012
Registration No. 333-173721
UNITED STATES
SECURITIES AND EXCHANGE COMMISSION
Washington, D.C. 20549
AMENDMENT NO. 5
TO
FORM S-1
REGISTRATION STATEMENT
UNDER
THE SECURITIES ACT OF 1933
ALERIS CORPORATION
(Exact name of registrant as specified in its charter)
| Delaware | 3341 | 27-1539594 | ||
| (State or other jurisdiction of incorporation or organization) |
(Primary Standard Industrial Classification Code Number) |
(I.R.S. Employer Identification Number) |
25825 Science Park Drive, Suite 400
Cleveland, OH 44122-7392
(216) 910-3400
(Address, including zip code, and telephone number, including area code, of registrant’s principal executive offices)
Christopher R. Clegg, Esq.
25825 Science Park Drive, Suite 400
Cleveland, OH 44122-7392
(216) 910-3400
(Name, address, including zip code, and telephone number, including area code, of agent for service)
Copies of all communications to:
| Daniel J. Bursky, Esq. Bonnie A. Barsamian, Esq. Fried, Frank, Harris, Shriver & Jacobson LLP One New York Plaza New York, New York 10004 (212) 859-8000 (212) 859-4000 (facsimile) |
William B. Gannett, Esq. Douglas S. Horowitz, Esq. Cahill Gordon & Reindel LLP Eighty Pine Street New York, New York 10005 (212) 701-3000 (212) 269-5420 (facsimile) |
Approximate date of commencement of proposed sale to the public: As soon as practicable after the effective date of this registration statement.
If any of the securities being registered on this Form are to be offered on a delayed or continuous basis pursuant to Rule 415 under the Securities Act of 1933, as amended, check the following box. ¨
If this Form is filed to register additional securities for an offering pursuant to Rule 462(b) under the Securities Act, check the following box and list the Securities Act registration statement number of the earlier effective registration statement for the same offering. ¨
If this Form is a post-effective amendment filed pursuant to Rule 462(c) under the Securities Act, check the following box and list the Securities Act registration statement number of the earlier effective registration statement for the same offering. ¨
If this Form is a post-effective amendment filed pursuant to Rule 462(d) under the Securities Act, check the following box and list the Securities Act registration statement number of the earlier effective registration statement for the same offering. ¨
Indicate by check mark whether the registrant is a large accelerated filer, an accelerated filer, a non-accelerated filer, or a smaller reporting company. See the definitions of “large accelerated filer,” “accelerated filer” and “smaller reporting company” in Rule 12b-2 of the Exchange Act. (Check one):
| Large accelerated filer | ¨ | Accelerated filer | ¨ | |||
| Non-accelerated filer | x (Do not check if a smaller reporting company) | Smaller reporting company | ¨ | |||
CALCULATION OF REGISTRATION FEE
|
| ||||
| Title of each class of securities to be registered |
Proposed maximum aggregate offering price(1)(2) |
Amount of registration fee(3) | ||
| Common Stock, $0.01 par value |
$100,000,000 | $11,610 | ||
|
| ||||
|
| ||||
| (1) | Estimated solely for the purposes of calculating the registration fee pursuant to Rule 457(o) under the Securities Act of 1933, as amended (the “Securities Act”). |
| (2) | Includes the offering price of shares of common stock that may be purchased by the underwriters to cover over-allotments, if any. |
| (3) | Previously paid. |
The Registrant hereby amends this Registration Statement on such date or dates as may be necessary to delay its effective date until the Registrant shall file a further amendment which specifically states that this Registration Statement shall thereafter become effective in accordance with Section 8(a) of the Securities Act of 1933, as amended, or until the Registration Statement shall become effective on such date as the Securities and Exchange Commission, acting pursuant to said Section 8(a), may determine.
Table of Contents
The information in this prospectus is not complete and may be changed. Neither we nor the selling stockholders may sell these securities until the registration statement filed with the Securities and Exchange Commission is effective. This prospectus is not an offer to sell these securities and it is not soliciting an offer to buy these securities in any jurisdiction where the offer or sale is not permitted.
Subject to completion, dated March 8, 2012
Prospectus

Aleris Corporation
shares
Common stock
We are offering shares of our common stock, and the selling stockholders named in this prospectus are offering shares of our common stock. We will not receive any proceeds from the sale of the shares by the selling stockholders.
This is an initial public offering of our common stock. Currently, no public market exists for our common stock. We currently expect that the initial public offering price will be between $ and $ per share. Our common stock has been approved for listing on the New York Stock Exchange under the symbol “ARS.”
Investing in our common stock involves a high degree of risk. See “Risk factors” beginning on page 25 of this prospectus to read about factors you should consider before buying shares of our common stock.
| Per share | Total | |||||||
| Public offering price |
$ | $ | ||||||
| Underwriting discount |
$ | $ | ||||||
| Proceeds, before expenses, to us |
$ | $ | ||||||
| Proceeds, before expenses, to the selling stockholders |
$ | $ | ||||||
|
|
||||||||
The underwriters may also purchase up to an additional shares from the selling stockholders, at the public offering price, less the underwriting discount, within 30 days from the date of this prospectus to cover overallotments, if any.
Neither the Securities and Exchange Commission, nor any state securities commission has approved or disapproved of these securities or determined if this prospectus is truthful or complete. Any representation to the contrary is a criminal offense.
The shares will be ready for delivery on or about , 2012.
| J.P. Morgan | Barclays Capital | Deutsche Bank Securities | ||
| BofA Merrill Lynch | Goldman, Sachs & Co. | |||
| KeyBanc Capital Markets | ||||||||||||
| Credit Suisse | ||||||||||||
| Moelis & Company | ||||||||||||
| Morgan Stanley | ||||||||||||
| UBS Investment Bank | ||||||||||||
| Davenport & Company LLC | ||||||||||||
The date of this prospectus is , 2012
Table of Contents
You should rely only on the information contained in this prospectus and any free writing prospectus that we authorize to be delivered to you. We have not, the selling stockholders have not and the underwriters have not authorized any person to provide you with any additional or different information. If anyone provides you with additional, different or inconsistent information, you should not rely on it. This prospectus is not an offer to sell, nor is it an offer to buy, these securities in any jurisdiction where an offer or sale is not permitted. You should assume that the information in this prospectus is accurate only as of the date on the front cover, regardless of the time of delivery of this prospectus or of any sale of our common stock. Our business, prospects, financial condition or results of operations may have changed since that date.
| 1 | ||||
| 25 | ||||
| 46 | ||||
| 48 | ||||
| 49 | ||||
| 50 | ||||
| 52 | ||||
| 54 | ||||
| 56 | ||||
| 58 | ||||
| Management’s discussion and analysis of financial condition and results of operations |
61 | |||
| 116 | ||||
| 139 | ||||
| 147 | ||||
| 189 | ||||
| 194 | ||||
| 196 | ||||
| 200 | ||||
| 208 | ||||
| Material U.S. federal income and estate tax considerations for non-U.S. holders |
211 | |||
| 215 | ||||
| 224 | ||||
| 224 | ||||
| 224 | ||||
| F-1 | ||||
i
Table of Contents
Aleris Corporation is a Delaware corporation. Our principal executive offices are located at 25825 Science Park Drive, Suite 400, Cleveland, Ohio 44122 and our telephone number at that address is (216) 910-3400. You may find additional information about us and our subsidiaries on our website at www.aleris.com. The information contained on, or that can be accessed through, our website is not incorporated by reference in, and is not a part of, this prospectus.
Basis of presentation
We are a holding company and currently conduct our business and operations through our direct wholly owned subsidiary, Aleris International, Inc. and its consolidated subsidiaries. In April 2011, we changed our name from “Aleris Holding Company” to “Aleris Corporation.” As used in this prospectus, unless otherwise specified or the context otherwise requires, “Aleris,” “we,” “our,” “us,” and the “Company” refer to Aleris Corporation and its consolidated subsidiaries. Aleris International, Inc. is referred to herein as “Aleris International.” Any references in this prospectus to “our bankruptcy,” “our reorganization,” “our emergence from bankruptcy” or similar terms or phrases refer to the bankruptcy and reorganization of Aleris International as described in this prospectus.
We were formed in order to acquire the assets and operations of the entity formerly known as Aleris International, Inc. (the “Predecessor”) through the Predecessor’s plan of reorganization and emergence from bankruptcy. Aleris International emerged from bankruptcy on June 1, 2010 (the “Emergence Date”). Pursuant to the First Amended Joint Plan of Reorganization as modified (the “Plan of Reorganization”), the Predecessor transferred all of its assets to subsidiaries of Intermediate Co., a newly formed entity that is wholly owned by us. In exchange for the acquired assets, Intermediate Co. contributed shares of our common stock and senior subordinated exchangeable notes to the Predecessor. These instruments were then distributed or sold pursuant to the Plan of Reorganization. The Predecessor then changed its name to “Old AII, Inc.” and was dissolved and Intermediate Co. changed its name to Aleris International, Inc.
We have been considered the “Successor” to the Predecessor by virtue of the fact that our only operations and all of our assets are those of Aleris International, the direct acquirer of the Predecessor. As a result, our financial results are presented alongside those of the Predecessor herein. In accordance with the provisions of Financial Accounting Standards Board Accounting Standards Codification 852, “Reorganizations,” we applied fresh-start accounting upon the emergence and became a new entity for financial reporting purposes as of the Emergence Date. This dramatically impacted 2010 operating results as certain pre-bankruptcy debts were discharged in accordance with the Plan of Reorganization immediately prior to emergence and assets and liabilities were adjusted to their fair values upon emergence. As a result, the financial information of the Successor subsequent to emergence from Chapter 11 is not comparable to that of the Predecessor prior to emergence. For certain percentages and amounts presented in this prospectus, the Successor and Predecessor results have been combined to derive “Combined” results for the year ended December 31, 2010.
During the fourth quarter of 2011, we realigned our operating structure into five business segments. Our historical financial results have been restated to conform with the current year presentation of the new business segments.
ii
Table of Contents
Industry data
Information in this prospectus concerning processing volumes, production capacity, rankings and other industry information, including our general expectations concerning the rolled aluminum products and aluminum industries, are based on estimates prepared by us using certain assumptions and our knowledge of these industries as well as data from third party sources. Our estimates, in particular as they relate to our general expectations concerning the aluminum industry, involve risks and uncertainties and are subject to changes based on various factors, including those discussed under “Risk factors” in this prospectus.
iii
Table of Contents
This summary highlights significant aspects of our business and this offering, but it is not complete and does not contain all of the information you should consider before making your investment decision. You should carefully read the entire prospectus, including the information presented under the section entitled “Risk factors” and the financial statements and related notes, before making an investment decision. This summary contains forward-looking statements that involve risks and uncertainties. Our actual results may differ significantly from the results discussed in the forward-looking statements as a result of certain factors, including those set forth in “Risk factors” and “Forward-looking statements.”
We are a holding company and currently conduct our business and operations through our direct wholly owned subsidiary, Aleris International, Inc. and its consolidated subsidiaries. In April 2011, we changed our name from “Aleris Holding Company” to “Aleris Corporation.” As used in this prospectus, unless otherwise specified or the context otherwise requires, “Aleris,” “we,” “our,” “us,” and the “Company” refer to Aleris Corporation and its consolidated subsidiaries. Aleris International, Inc. is referred to herein as “Aleris International.” Any references in this prospectus to “our bankruptcy,” “our reorganization,” “our emergence from bankruptcy” or similar terms or phrases refer to the bankruptcy and reorganization of Aleris International as described in this prospectus.
EBITDA and Adjusted EBITDA are defined and discussed in footnotes (b) and (c) in “Summary historical consolidated financial and other data.” Segment Adjusted EBITDA is defined and discussed in “Management’s discussion and analysis of financial condition and results of operations—Our segments.” Unless otherwise indicated or the context requires, all information in this prospectus relating to the number of shares of common stock to be outstanding after this offering reflects the for 1 stock split that we will effectuate prior to the consummation of this offering.
Our company
Overview
We are a global leader in the manufacture and sale of aluminum rolled and extruded products, aluminum recycling and specification alloy manufacturing, with locations in North America, Europe and China. Our business model strives to reduce the impact of aluminum price fluctuations on our financial results and protect and stabilize our margins, principally through pass-through pricing (market-based aluminum price plus a conversion fee), tolling arrangements (conversion of customer-owned material) and derivative financial instruments.
We operate 41 production facilities worldwide, with 14 production facilities that provide rolled and extruded aluminum products and 27 recycling and specification alloy manufacturing plants. We are currently constructing our 42nd production facility, a state-of-the-art aluminum rolling mill in China that will produce semi-finished rolled aluminum products, through the China joint venture. We possess a combination of low-cost, flexible and technically advanced manufacturing operations supported by an industry-leading research and development platform. Our facilities are strategically located to service our customers, which include a number of the world’s largest companies in the aerospace, automotive and other transportation industries, building and construction, containers and packaging and metal distribution industries.
1
Table of Contents
For the year ended December 31, 2011, we generated revenues of $4.8 billion, net income attributable to Aleris Corporation of $161.6 million, and Adjusted EBITDA of $331.6 million. Approximately 50% of our revenues were derived from North America and the remaining 50% were derived from the rest of the world. Adjusted EBITDA is a non-U.S. GAAP financial measure. Please see footnote (c) in “Summary historical consolidated financial and other data” for a definition and discussion of Adjusted EBITDA and a reconciliation to net income attributable to Aleris Corporation.
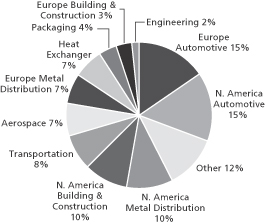
We operate two global business units, Global Rolled and Extruded Products and Global Recycling. Within our two global business units, we have five business segments: Rolled Products North America (“RPNA”), Rolled Products Europe (“RPEU”), Extrusions, Recycling and Specification Alloys North America (“RSAA”), and Recycling and Specification Alloys Europe (“RSEU”). The following charts present the percentage of our consolidated revenue by segment and by end-use for the year ended December 31, 2011:
| Revenue by Segment | Revenue by End-Use | |
|
|
| |
Rolled Products North America
We are a producer of rolled aluminum products with leading positions in the North American transportation, building and construction, and metal distribution end-use industries. We produce aluminum sheet and fabricated products using direct-chill and continuous-cast processes at eight production facilities in North America. We believe that many of our facilities are low cost, flexible and allow us to maximize our use of scrap with proprietary manufacturing processes providing us with a competitive advantage.
Substantially all of our rolled aluminum products are produced in response to specific customer orders. Our rolling mills have the flexibility to utilize primary or scrap aluminum, which allows us to optimize input costs and maximize margins. Approximately 96% of our RPNA segment’s revenues are derived utilizing a formula pricing model which allows us to pass through risks from the volatility of aluminum price changes by charging a market-based aluminum price plus a conversion fee.
2
Table of Contents
The following table presents our volume, revenues, segment income and segment Adjusted EBITDA for our RPNA segment for the periods presented:
| (Dollars in millions, metric tons in thousands) |
For the year ended |
For the seven months ended December 31, 2010 |
For the five months ended May 31, 2010 |
For the year ended |
||||||||||||
|
|
||||||||||||||||
| Metric tons invoiced |
370.5 | 213.8 | 156.8 | 309.4 | ||||||||||||
| Revenues |
$ | 1,346.4 | $ | 699.4 | $ | 507.2 | $ | 893.6 | ||||||||
| Segment income |
$ | 111.1 | $ | 44.9 | $ | 49.4 | $ | 89.7 | ||||||||
| Segment Adjusted EBITDA(1) |
$ | 104.9 | $ | 44.5 | $ | 43.6 | $ | 64.3 | ||||||||
|
|
||||||||||||||||
| (1) | Segment Adjusted EBITDA is a non-U.S. GAAP financial measure. Please see “Management’s discussion and analysis of financial condition and results of operations—Our segments” for a definition and discussion of segment Adjusted EBITDA and a reconciliation to segment income. |
Rolled Products Europe
Our RPEU segment consists of two rolled aluminum products manufacturing facilities, located in Germany and Belgium. This segment produces rolled products for a wide variety of technically sophisticated applications, including aerospace plate and sheet, brazing sheet (clad aluminum material used for, among other applications, vehicle radiators and HVAC systems), automotive sheet, and heat treated plate for engineering uses, as well as for other uses in the transportation, construction, and packaging industries. Substantially all of our rolled aluminum products in Europe are manufactured to specific customer requirements using direct-chill ingot cast technologies that allow us to use and offer a variety of alloys and products for a number of technically demanding end-uses. We compete successfully in these highly technical applications based on our industry-leading research and development capabilities as well as our state-of-the-art facilities.
The following table presents our volume, revenues, segment income and segment Adjusted EBITDA for our RPEU segment for the periods presented:
| (Dollars in millions, metric tons in thousands) |
For the year ended |
For the seven months ended December 31, 2010 |
For the five months ended May 31, 2010 |
For the year ended |
||||||||||||
|
|
||||||||||||||||
| Metric tons invoiced |
314.4 | 183.8 | 120.2 | 231.8 | ||||||||||||
| Revenues |
$ | 1,541.6 | $ | 763.7 | $ | 464.4 | $ | 936.7 | ||||||||
| Segment income |
$ | 157.6 | $ | 40.4 | $ | 55.1 | $ | 37.2 | ||||||||
| Segment Adjusted EBITDA(1) |
$ | 151.5 | $ | 75.0 | $ | 29.4 | $ | 32.6 | ||||||||
|
|
||||||||||||||||
| (1) | Segment Adjusted EBITDA is a non-U.S. GAAP financial measure. Please see “Management’s discussion and analysis of financial condition and results of operations—Our segments” for a definition and discussion of segment Adjusted EBITDA and a reconciliation to segment income. |
Extrusions
The extruded products business includes five extrusion facilities located in Germany, Belgium and China. Industrial extrusions are made in all locations and the production of extrusion systems, including building systems, is concentrated in Vogt, Germany. Large extrusions and project
3
Table of Contents
business serving rail and other transportation sectors are concentrated in Bonn, Germany and Tianjin, China. Rods and hard alloys serving the aerospace, automotive, and industrial sectors are produced in Duffel, Belgium. The extruded aluminum products are produced for the automotive, transportation (rail and shipbuilding), electrical, mechanical engineering, and building and construction industries. We further serve our customers by performing value-added fabrication on most of our extruded products.
The following table presents our volume, revenues, segment income (loss) and segment Adjusted EBITDA for our Extrusions segment for the periods presented:
| (Dollars in millions, metric tons in thousands) |
For the year ended |
For the seven months ended December 31, 2010 |
For the five months ended May 31, 2010 |
For the year ended |
||||||||||||
|
|
||||||||||||||||
| Metric tons invoiced |
75.7 | 42.6 | 29.4 | 65.0 | ||||||||||||
| Revenues |
$ | 410.3 | $ | 214.6 | $ | 132.5 | $ | 342.9 | ||||||||
| Segment income (loss) |
$ | 10.9 | $ | 5.3 | $ | 2.7 | $ | (1.7 | ) | |||||||
| Segment Adjusted EBITDA(1) |
$ | 7.9 | $ | 10.4 | $ | 1.1 | $ | 0.6 | ||||||||
|
|
||||||||||||||||
| (1) | Segment Adjusted EBITDA is a non-U.S. GAAP financial measure. Please see “Management’s discussion and analysis of financial condition and results of operations—Our segments” for a definition and discussion of segment Adjusted EBITDA and a reconciliation to segment income (loss). |
Recycling and Specification Alloys North America
We are a leading recycler of aluminum and manufacturer of specification alloys serving customers in North America. Our recycling operations primarily convert aluminum scrap, dross (a by-product of the melting process) and other alloying agents as needed and deliver the recycled metal and specification alloys in molten or ingot form to our customers. We believe that the benefits of recycling, which include substantial energy and capital investment savings relative to the cost of smelting primary aluminum, support the long-term growth of this method of aluminum production, especially as concerns over energy use and carbon emissions grow. Our specification alloy operations combine various aluminum scrap types with hardeners and other additives to produce alloys with chemical compositions and specific properties, including increased strength, formability and wear resistance, as specified by customers for their particular application. Our specification alloy operations principally service customers in the automotive industry. Our other recycling operations typically service other aluminum producers and manufacturers, generally under tolling arrangements, where we convert customer-owned scrap and dross and return the recycled metal to our customers for a fee. For the year ended December 31, 2011, approximately 61% of the total volumes shipped by our RSAA segment were under tolling arrangements. We use tolling arrangements to both reduce our metal commodity exposure and our overall working capital requirements. We operate 21 strategically located production plants in North America, with 19 in the United States, one in Canada and one in Mexico.
4
Table of Contents
The following table presents our volume, revenues, segment income and segment Adjusted EBITDA for our RSAA segment for the periods presented:
| (Dollars in millions, metric tons in thousands) |
For the year ended |
For the seven months ended December 31, 2010 |
For the five months ended May 31, 2010 |
For the year ended |
||||||||||||
|
|
||||||||||||||||
| Metric tons invoiced |
894.5 | 560.7 | 349.6 | 690.6 | ||||||||||||
| Revenues |
$ | 983.8 | $ | 540.5 | $ | 373.7 | $ | 564.2 | ||||||||
| Segment income |
$ | 80.9 | $ | 33.8 | $ | 29.7 | $ | 18.9 | ||||||||
| Segment Adjusted EBITDA(1) |
$ | 80.9 | $ | 35.7 | $ | 29.7 | $ | 22.5 | ||||||||
|
|
||||||||||||||||
| (1) | Segment Adjusted EBITDA is a non-U.S. GAAP financial measure. Please see “Management’s discussion and analysis of financial condition and results of operations—Our segments” for a definition and discussion of segment Adjusted EBITDA and a reconciliation to segment income. |
Recycling and Specification Alloys Europe
We are a leading European recycler of aluminum scrap and magnesium through our RSEU segment. Our recycling operations primarily convert aluminum scrap, dross and other alloying agents as needed and deliver the recycled metal and specification alloys in molten or ingot form to our customers. Our European recycling business consists of seven facilities located in Germany, Norway and Wales. Our RSEU segment supplies specification alloys to the European automobile industry and serves other European aluminum industries from its plants. The segment’s specification alloy operations combine various aluminum scrap types with hardeners and other additives to produce alloys with chemical compositions and specific properties, including increased strength, formability and wear resistance, as specified by customers for their particular applications. Our recycling operations typically service other aluminum producers and manufacturers, generally under tolling arrangements, where we convert customer-owned scrap and dross and return the recycled metal to our customers for a fee.
The following table presents our volume, revenues, segment income (loss) and segment Adjusted EBITDA for our RSEU segment for the periods presented:
| (Dollars in millions, metric tons in thousands) |
For the year ended |
For the seven months ended December 31, 2010 |
For the five months ended May 31, 2010 |
For the year ended |
||||||||||||
|
|
||||||||||||||||
| Metric tons invoiced |
387.2 | 220.3 | 152.0 | 310.6 | ||||||||||||
| Revenues |
$ | 685.1 | $ | 332.9 | $ | 214.5 | $ | 353.6 | ||||||||
| Segment income (loss) |
$ | 35.3 | $ | 16.8 | $ | 10.9 | $ | (1.5 | ) | |||||||
| Segment Adjusted EBITDA(1) |
$ | 35.3 | $ | 20.7 | $ | 10.9 | $ | (4.4 | ) | |||||||
|
|
||||||||||||||||
| (1) | Segment Adjusted EBITDA is a non-U.S. GAAP financial measure. Please see “Management’s discussion and analysis of financial condition and results of operations—Our segments” for a definition and discussion of segment Adjusted EBITDA and a reconciliation to segment income (loss). |
5
Table of Contents
Our industry
Aluminum is a widely-used, attractive industrial material. Compared to several alternative metals such as steel and copper, aluminum is lightweight, has a high strength-to-weight ratio and is resistant to corrosion. Aluminum can be recycled repeatedly without any material decline in performance or quality. The recycling of aluminum delivers energy and capital investment savings relative to both the cost of producing primary aluminum and many other competing materials. The penetration of aluminum into a wide variety of applications continues to grow. We believe several factors support fundamental long-term growth in aluminum consumption generally and demand for those products we produce specifically, including urbanization in emerging economies, economic recovery in developed economies and an increasing global focus on sustainability.
The following chart illustrates expected global demand for primary aluminum:
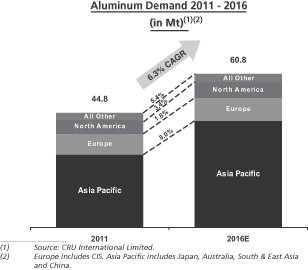
The global aluminum industry consists of primary aluminum producers with bauxite mining, alumina refining and aluminum smelting capabilities; aluminum semi-fabricated products manufacturers, including aluminum casters, recyclers, extruders and flat rolled products producers; and integrated companies that are present across multiple stages of the aluminum production chain. The industry is cyclical and is affected by global economic conditions, industry competition and product development.
6
Table of Contents
Primary aluminum prices are determined by worldwide forces of supply and demand and, as a result, are volatile. This volatility has a significant impact on the profitability of primary aluminum producers whose selling prices are typically based upon prevailing London Metal Exchange (“LME”) prices while their costs to manufacture are not highly correlated to LME prices. Aluminum rolled and extruded product prices are generally determined on a metal cost plus conversion fee basis. As a result, the impact of aluminum price changes on the manufacturers of these products is significantly less than the impact on primary aluminum producers.
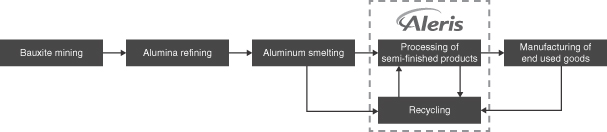
We participate in select segments of the aluminum fabricated products industry, including rolled and extruded products; we also recycle aluminum and produce aluminum specification alloys. We do not smelt aluminum, nor do we participate in other upstream activities, including mining bauxite or refining alumina. Since the majority of our products are sold on a market-based aluminum price plus conversion fee basis or under tolling arrangements, we are less exposed to aluminum price volatility.
Our competitive strengths
We believe that a combination of the following competitive strengths differentiates our business and allows us to maintain and build upon our strong industry position:
Well positioned to benefit from long-term growth in aluminum consumption
As a leader in the manufacture and sale of aluminum rolled and extruded products, as well as in aluminum recycling and specification alloy manufacturing, we believe we are well positioned to participate in the long-term growth in aluminum consumption generally, and demand for those products we produce specifically. We also believe the trend toward aluminum recycling will continue, driven by its lower energy and capital equipment costs as compared to those of primary aluminum producers.
In certain industries, such as automotive, aluminum, because of its strength-to-weight ratio, is the metal of choice for “light-weighting” and increasing fuel efficiency. As a result, aluminum is replacing other materials more rapidly than before. We believe that this trend will accelerate as increased European Union and U.S. regulations relating to reductions in carbon emissions and fuel efficiency, as well as high fuel prices, will force the automotive industry to increase its use of aluminum to “light-weight” vehicles. According to the International Aluminum Institute, global greenhouse gas savings from the use of aluminum for light-weighting vehicles have the potential to double between 2005 and 2020 to 500 million metric tons of carbon dioxide per year.
7
Table of Contents
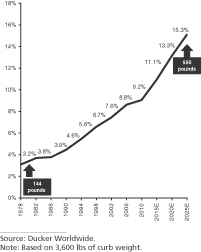
The following charts illustrate expected global demand for aluminum products:
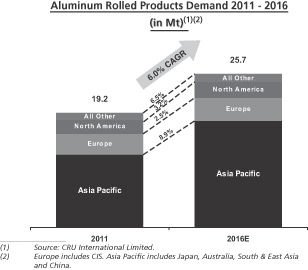
|
North American light vehicle aluminum content as a percent of curb weight
| |
Leading positions in attractive industry segments
We believe we are the number one supplier by volume of recycled aluminum specification alloy material in both the United States and Europe to the automotive industry and also the number two supplier by volume of aluminum automotive sheet to the European automotive industry.
We believe we are the third largest global supplier of aerospace sheet and plate based on capacity. We have benefited from the historical growth trends of the aerospace industry and have diversified into commercial, regional and business jet end-use industries, as well as defense applications. The technical and quality requirements needed to supply the aerospace industry provide a significant competitive advantage. Demand for our aerospace products, which typically trend with aircraft backlog and build rates, continued to recover in 2011. In 2011, the order backlog of Airbus and Boeing, combined, increased 17% from 7,000 planes to 8,200 planes. In line with this trend, our contracted aerospace volumes for 2012 support increased demand from our customers in 2012 to meet higher build rates associated with growing backlogs. Longer term, China is projected to be a key driver of aluminum plate demand for the manufacture of aircraft and other industrial applications. In 2011, we formed a joint venture with Zhenjiang Dingsheng Aluminum Industries Joint-Stock Co., Ltd. We are an 81% owner in the joint venture, Aleris Dingsheng Aluminum (Zhenjiang) Co., Ltd. (the “China Joint Venture”), and are building a state-of-the-art aluminum rolling mill in Zhenjiang City, Jiangsu Province in China that will produce semi-finished rolled aluminum products. We believe this mill will be the first facility in China capable of meeting the exacting standards of the global aerospace industry. As the first mover for these products in this important region, we believe we are well positioned to grow our share of global aerospace plate as well as additional value-added products as we can expand the mill’s capabilities over time.
8
Table of Contents
We are also one of the largest suppliers of aluminum to the building and construction industry in North America. We believe the building and construction industry is at a cyclical low from a volume perspective. We are well-positioned to capture increasing volumes as these industries recover. Additionally, by volume, we believe we are the second largest global supplier of brazing sheet, a technically demanding material that is used in heat exchangers by automotive manufacturers and in other heat exchanger applications. Aluminum continues to replace brass, copper and other materials in heat exchangers and its growth is being augmented by the increasing prevalence of air conditioners in automobiles.
Global platform with a broad and diverse customer base
Our main end-use industries served are aerospace, automotive and other transportation industries, building and construction, containers and packaging, as well as metal distribution in numerous geographic regions. Our business is not dependent on any one industrial segment or any particular geographic region. Our geographic diversification will be further enhanced by increased exposure to China as a result of the China Joint Venture.
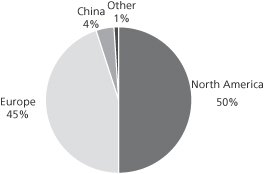
The following charts present the percentage of our consolidated revenue by end-use and by geographic region for the year ended December 31, 2011:
| Revenue by End-Use | Revenue by Geographic Region | |
|
|
| |
Long-term customer relationships
We have long-standing relationships with many of our largest customers, which include the following leading global companies in our key end-use industries.
| Aerospace | Automotive and transportation | |||
|
| ||||
| • Airbus |
• Audi | • General Motors | ||
| • Boeing |
• BMW | • Great Dane | ||
| • Embraer |
• Bosch | • Honda | ||
| • Chrysler | • Joseph Behr | |||
| • Daimler | • Visteon | |||
|
| ||||
9
Table of Contents
| Building and construction | Distribution | Packaging and other | ||
|
| ||||
| • Norandex/Reynolds |
• Reliance Steel & Aluminum | • Constellium (Alcan) | ||
| • Ply Gem Industries |
• Ryerson | • Alcoa | ||
| • Thyssen-Krupp | • Novelis | |||
|
| ||||
We believe these relationships are mutually beneficial, offering us a consistent base of customer demand and allowing us to plan and manage our operations more effectively. Our ten largest customers were responsible for approximately 27% of our consolidated revenues for the year ended December 31, 2011 and no one customer accounted for more than approximately 5% of those revenues. We have long standing relationships with our customers, including an average of 19 years of service to our top 10 customers. Knowledge gained from long-term customer relationships helps us provide our customers with superior service, including product innovation and just-in-time inventory management.
Industry-leading research, development and technology capabilities
We have industry-leading research, development and technology capabilities. We believe our aerospace and automotive products meet the most technically demanding customer quality and product performance requirements in the industry. Our efforts in research and development and technology allow us to focus on technically demanding processes, products and applications, which create a potential to differentiate us from our competitors by allowing us to supply higher quality value-added products. Because of these capabilities and our reputation for technical excellence, we often participate on the product design teams of our customers. We believe our research and development and technology capabilities will allow us to continue to grow in higher value-added applications that meet the developing needs of our customers.
Broad range of efficient manufacturing capabilities
We possess a broad range of capabilities within our manufacturing operations that allow us to compete effectively in numerous end-use industries and geographies.
| • | Our rolled products businesses compete across a number of end-use industries ranging from the most demanding heat treat aerospace plate and sheet applications to higher volume applications such as building and construction and general distribution. These operations benefit from our efficiency, flexibility and technical competence, and include our best-in-class rolling mill in Koblenz, Germany, one of the most technically sophisticated rolling mills in the world, as well as our scrap-based low-cost continuous-cast operations in Uhrichsville, Ohio, both of which we believe are among the lowest cost rolled aluminum production facilities in the world for their targeted industries. |
| • | Our extruded products business produces a wide range of hard and soft alloy extruded aluminum products serving a number of end-use industries. |
| • | Our recycling and specification alloy manufacturing operations rely on a network of facilities that have rotary and reverbatory melting furnaces, which are among the lowest cost and most efficient furnaces in the industry, and supply molten aluminum and cast ingots to some of the largest aluminum and automotive companies in the world. |
10
Table of Contents
Our ability to manufacture a wide range of product offerings across multiple end-use industries and geographies reduces our dependence on any single industry, region or product. Our flexible manufacturing operations allow us to increase or decrease production levels to meet demand. During the recent economic downturn, we adjusted our production levels by temporarily idling our Richmond rolling mill facility and furnaces in our recycling and specification alloy manufacturing operations, restructuring our German extrusion and Duffel, Belgium rolled and extruded products operations, which permanently reduced headcount by over 500 employees, and reducing overhead costs in our German manufacturing operations through Kurzarbeit, a short-term work scheme in which the German Federal Employment Agency subsidizes the wages of employees while employers cut back their working time.
Experienced management team and Board of Directors
Our executive officers and key leaders have a diversity of industry experience, including on average more than 20 years of experience with various manufacturing companies, including managing Aleris when it was a public company prior to its leveraged buyout in 2006. Our management team has expertise in the commercial, technical and management aspects of our business, which provides for focused marketing efforts, quality and cost controls and safety and environmental improvement. Our management team successfully led us through our emergence from bankruptcy and continues to focus on implementing our business strategies. Aleris’s Board of Directors includes current and former executives from Exelon, General Motors and The Mosaic Company who bring extensive experience in operations, finance, governance and corporate strategy. See “Management.”
Our business strategies
We expect to sustain and grow our Company and build on our strong industry position by pursuing the following strategies:
Continue to grow our core business and enhance our product mix
We intend to continue to grow our core business by capturing the full benefits of the economic recovery in our key end-use industries and optimizing our production facilities to ensure we remain one of the lowest cost producers for our product portfolio through targeted technology upgrades and the application of the Aleris Operating System (“AOS”).
Furthermore, we believe we have numerous opportunities to enhance our product mix. Currently, we are:
| • | transitioning many of our transportation customers from direct-chill based products to lower cost scrap-based continuous cast products, thereby providing our customers lower price points while enhancing our operating efficiencies and profitability; |
| • | enhancing our recycling capabilities in North America and Europe to increase flexibility and capacity to leverage lower-cost scrap types and broaden our alloy product offerings; |
| • | leveraging and expanding our rolled products technology to capture fast growing demand in select segments, such as auto body sheet, which we believe will grow as automakers work to meet stringent regulatory requirements on carbon reductions by using aluminum to reduce vehicles’ weight and increase fuel efficiency; |
11
Table of Contents
| • | proactively assessing and managing profitability of our customer and product portfolio to focus on higher value business; and |
| • | targeting research and development efforts towards collaboration with customers to enhance our product offerings. |
We intend to continue to supply higher value alloys targeting aerospace, automotive and other transportation industries. We will seek to extend our lower cost continuous casting operations to produce higher value rolled aluminum products.
Continue to expand in China and other select international regions
We intend to expand our global operations where we see the opportunity to enhance our manufacturing capabilities, grow with existing customers, gain new customers or penetrate higher-growth industries and regions. We believe disciplined expansion focused on these objectives will allow us to achieve attractive returns. Our international expansion has followed these principles and includes:
| • | the formation of the China Joint Venture, which is building a state-of-the-art aluminum rolling plate mill in Zhenjiang City, Jiangsu Province in China to produce value-added plate products for the aerospace, general engineering and other transportation industry segments in China and has designed the mill with the capability to expand into other high value-added products; and |
| • | expanding our existing operations in China by moving our idled extrusion press from Duffel, Belgium to our Tianjin, China extrusion plant, which will position us to continue to capture growth in China and better serve our existing customers with operations in that region. |
We expect demand for aluminum plate in China and other regions will grow, driven by the development and expansion of industries serving aerospace, engineering and other heavy industrial applications. As the first mover for high technology aerospace products in this important region, we believe we are well positioned to grow our share of aerospace and other plate demand.
We intend to continue to pursue global expansion opportunities in a disciplined, deliberate manner. Additionally, we believe that the combination of our efficient furnaces, scrap processing techniques and global customer base provides us with a highly competitive business model that is capable of operating in emerging economies.
Continue to focus on the Aleris Operating System to drive productivity
Our culture focuses on continuous improvement, achievement of synergies and optimal use of capital resources. As such, we have established the AOS, a company-wide ongoing initiative, to align and coordinate all key processes of our operations. AOS is an integrated system of principles, operating practices and tools that engages all employees in the transformation of our core business processes and the relentless pursuit of value creation. We focus on key operating metrics for all of our global businesses and plants and strive to achieve best practices both internally and in comparison with external benchmarks. The AOS initiative utilizes various tools,
12
Table of Contents
including Six Sigma and Lean methodologies, to drive sustainable productivity improvements. Our AOS and productivity programs generated approximately $32 million of net cost savings for the year ended December 31, 2011.
We believe there are significant opportunities to further reduce our manufacturing and other costs and improve profitability by continuing to deploy AOS. We believe AOS initiatives will generate productivity gains and enable us to more than offset base inflation within our operations by continuous process improvements.
Limiting our exposure to commodity price fluctuations
We continuously seek to reduce the impact of aluminum price fluctuations on our business by:
| • | using formula pricing in our rolled and extruded products businesses, based on a market-based primary aluminum price plus a conversion fee which effectively passes aluminum costs through to our customers for 88% of our global rolled products sales; |
| • | aligning physical aluminum purchases with aluminum sales; |
| • | hedging fixed price forward sales with the use of financial and commodity derivatives to protect transaction margins, which are margins associated with the sale of products and the conversion fees we earn on such sales; |
| • | hedging uncommitted or open inventory positions to protect our operating results and financial condition from the impact of changing aluminum prices on inventory values; and |
| • | pursuing tolling arrangements that reduce exposure to aluminum and other commodity price fluctuations where customer metal is available and which accounted for approximately 58% of the total metric tons invoiced in our global recycling and specification alloy manufacturing operations for the year ended December 31, 2011. |
These techniques minimize both transactional margin and inventory valuation risk. Additionally, we seek to reduce the effects of copper, zinc, natural gas and electricity price volatility through the use of financial derivatives and forward purchases as well as through price escalators and price pass-throughs contained in some of our customer supply agreements.
Selectively pursue strategic transactions
We have grown significantly through the successful completion of 11 strategic acquisitions from 2004 through 2008 targeted at broadening product offerings and geographic presence, diversifying our end-use customer base and increasing our scale and scope. We believe that a number of acquisition opportunities exist in the industries in which we operate. We focus on acquisitions that we expect would increase earnings and from which we typically would expect to be able to realize significant operational efficiencies within 12 to 24 months through the integration process. We prudently evaluate these opportunities as potential enhancements to our existing operating platforms. We also consider strategic alliances, where appropriate, to achieve operational efficiencies or expand our product offerings. In addition, we consider potential divestitures of non-strategic businesses from time to time. We continue to consider strategic alternatives on an ongoing basis, including having discussions concerning potential acquisitions and divestitures that may be material.
13
Table of Contents
Our reorganization
On February 12, 2009, Aleris International, along with certain of its U.S. subsidiaries, filed voluntary petitions for Chapter 11 bankruptcy protection in the United States Bankruptcy Court for the District of Delaware. The bankruptcy filings were the result of a liquidity crisis brought on by the global recession and financial crisis. Aleris International’s ability to respond to the liquidity crisis was constrained by its highly leveraged capital structure, which at filing included $2.7 billion of debt, resulting from the 2006 leveraged buyout of Aleris International. As a result of the severe economic decline, Aleris International experienced sudden and significant volume reductions across each end-use industry it served and a precipitous decline in the LME price of aluminum. These factors reduced the availability of financing under Aleris International’s revolving credit facility and required the posting of cash collateral on aluminum metal hedges. Accordingly, Aleris International sought bankruptcy protection to alleviate liquidity constraints and restructure its operations and financial position. Aleris International emerged from bankruptcy on June 1, 2010 with sufficient liquidity and a capital structure that allows us to pursue our growth strategy.
Our principal stockholders
In connection with Aleris International’s emergence from bankruptcy, three of its largest lender groups while in bankruptcy, certain investment funds managed by Oaktree Capital Management, L.P. (“Oaktree”) or their respective subsidiaries, certain investment funds managed by affiliates of Apollo Management Holdings, L.P. (together with Apollo Global Management, LLC and its subsidiaries, “Apollo”) and certain investment funds managed or advised by Sankaty Advisors, LLC (“Sankaty”) entered into an equity commitment agreement, pursuant to which they agreed to backstop an equity rights offering of the Company.
Oaktree is a leading global investment management firm focused on alternative markets, with $74.9 billion in assets under management as of December 31, 2011. The firm emphasizes an opportunistic, value-oriented and risk-controlled approach to investments in distressed debt, corporate debt (including high yield debt and senior loans), control investing, convertible securities, real estate and listed equities. Oaktree was founded in 1995 by a group of principals who have worked together since the mid-1980s. Headquartered in Los Angeles, the firm has over 650 employees and offices in 13 cities worldwide. The investment funds managed by Oaktree or their respective subsidiaries that are invested in the Company are referred to collectively in this prospectus as the “Oaktree Funds.”
Founded in 1990, Apollo is a leading global alternative asset manager with offices in New York, Los Angeles, London, Frankfurt, Luxembourg, Singapore, Hong Kong and Mumbai. As of September 30, 2011, Apollo had assets under management of approximately $65.1 billion in its private equity, capital markets and real estate businesses. The investment funds managed by Apollo that are invested in the Company are referred to collectively in this prospectus as the “Apollo Funds.”
Sankaty, the credit affiliate of Bain Capital, LLC, is one of the nation’s leading private managers of fixed income and credit instruments. With approximately $15.5 billion in assets under management as of December 31, 2011, funds managed or advised by Sankaty invest in a wide
14
Table of Contents
variety of securities and investments, including leveraged loans, high-yield bonds, distressed/stressed debt, mezzanine debt, structured products and equities. Headquartered in Boston and with offices in London, New York and Chicago, Sankaty has over 165 employees. The investment funds managed or advised by Sankaty that are invested in the Company are referred to collectively in this prospectus as the “Sankaty Funds.”
The Oaktree Funds, the Apollo Funds and the Sankaty Funds are referred to collectively in this prospectus as the “Investors.”
Corporate structure
A simplified overview of our corporate structure is shown in the diagram below. See “Principal and selling stockholders” and “Capitalization.”
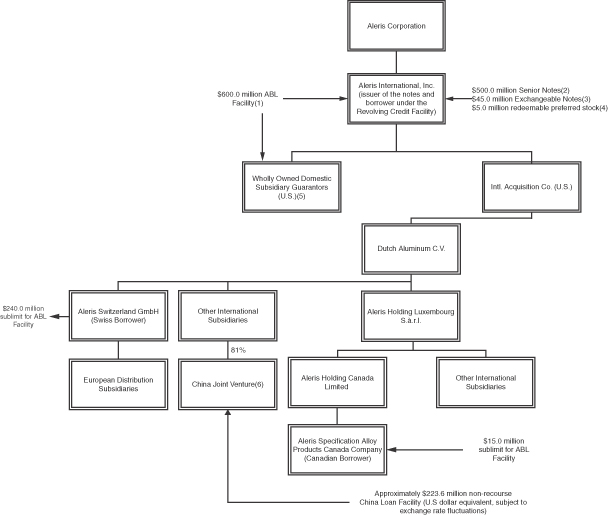
| (1) | The ABL Facility is Aleris International’s $600.0 million asset backed revolving credit facility (the “ABL Facility”) which permits multi-currency borrowings of (a) up to $600.0 million by Aleris International and its U.S. subsidiaries, (b) up to $240.0 million by Aleris Switzerland GmbH, a wholly owned Swiss subsidiary (referred to in this diagram as the Swiss Borrower), and (c) up to $15.0 million by Aleris Specification Alloys Products Canada Company, a wholly owned Canadian subsidiary (referred to in this diagram as the Canadian Borrower). The ABL Facility is secured, subject to certain exceptions, by a first-priority security interest in substantially all of our current assets and related intangible assets located in the U.S., substantially all of the |
15
Table of Contents
| current assets and related intangible assets of substantially all of our wholly owned domestic subsidiaries located in the U.S., substantially all of the current assets and related intangible assets of the Canadian Borrower located in Canada and substantially all of the current assets (other than inventory located outside of the United Kingdom) and related intangible assets of Aleris Recycling (Swansea) Ltd., of Aleris Switzerland GmbH and certain of its subsidiaries. The borrowers’ obligations under the ABL Facility are guaranteed by certain existing and future direct and indirect subsidiaries of Aleris International. See “Description of indebtedness - ABL Facility.” |
| (2) | The $500.0 million aggregate principal amount of 7 5/8% senior notes due 2018 issued by Aleris International (the “Senior Notes”) are guaranteed on a senior unsecured basis by all of Aleris International’s domestic restricted subsidiaries that guarantee its obligations under the ABL Facility. See “Description of indebtedness - 7 5/8% Senior Notes due 2018.” |
| (3) | The 6% senior subordinated exchangeable notes issued by Aleris International (the “Exchangeable Notes”) are not guaranteed by any of its subsidiaries. The Exchangeable Notes are exchangeable for our common stock at the holder’s option upon certain conditions, including the consummation of this initial public offering. For additional terms of the Exchangeable Notes, see “Description of indebtedness - 6% Senior Subordinated Exchangeable Notes.” |
| (4) | Aleris International issued $5.0 million aggregate liquidation amount ($5.4 million aggregate liquidation amount as of December 31, 2011, after giving effect to the accrual of dividends) of redeemable preferred stock upon emergence from bankruptcy. Shares of the redeemable preferred stock are exchangeable for our common stock at the holder’s option upon certain conditions, including the consummation of this initial public offering. For additional terms of the redeemable preferred stock, see “Description of capital stock - Options and exchangeable securities.” |
| (5) | Aleris International’s domestic subsidiaries that guarantee the ABL Facility and the Senior Notes are also borrowers under the ABL Facility. |
| (6) | The China Joint Venture is an unrestricted subsidiary under the indenture governing the Senior Notes and is a party to the non-recourse multi-currency secured revolving and term facility, as amended, entered into by the China Joint Venture (the “China Loan Facility”). See “Description of indebtedness - China Loan Facility.” |
16
Table of Contents
Corporate information
Aleris Corporation is a Delaware corporation. Our principal executive offices are located at 25825 Science Park Drive, Suite 400, Cleveland, Ohio 44122 and our telephone number at that address is (216) 910-3400. You may find additional information about us and our subsidiaries on our website at www.aleris.com. The information contained on, or that can be accessed through, our website is not incorporated by reference in, and is not a part of, this prospectus.
17
Table of Contents
The offering
| Common stock offered by us |
shares |
| Common stock offered by the selling stockholders |
shares |
| Shares of common stock to be outstanding after this offering |
shares |
| Use of proceeds |
We estimate that the net proceeds to us from this offering, after deducting underwriting discounts and commissions and estimated offering expenses, will be $ million, assuming the shares are offered at $ per share (the mid-point of the price range set forth on the cover page of this prospectus). |
| We intend to use the net proceeds to us from this offering for general corporate purposes, including working capital, capital expenditures, funding the construction of an aluminum rolling mill in China and funding acquisition opportunities that may become available to us from time to time. We will not receive any proceeds from the sale of shares by the selling stockholders. See “Use of proceeds.” |
| Overallotment option |
The underwriters may also purchase up to an additional shares of common stock from the selling stockholders, respectively, at the public offering price, less the underwriting discount, within 30 days from the date of this prospectus to cover overallotments, if any. |
| Dividends |
We do not anticipate paying any dividends on our common stock for the foreseeable future. See “Dividend policy.” |
| Risk factors |
You should carefully read and consider the information set forth under “Risk factors” beginning on page 27 of this prospectus and all other information set forth in this prospectus before investing in our common stock. |
| New York Stock Exchange symbol |
Our common stock has been approved for listing on the New York Stock Exchange under the symbol “ARS.” |
Unless we indicate otherwise or the context requires, all information in this prospectus relating to the number of shares of common stock to be outstanding after the offering:
| • | excludes (1) 4,660,474 shares of common stock authorized for issuance as equity awards under our equity incentive plan after taking into effect our February 2011, June 2011 and November 2011 stockholder dividends (the “2011 Stockholder Dividends”) and an increase in the number of shares available for future grants following this contemplated initial public offering, of which 3,000,062 shares are issuable pursuant to outstanding options (1,234,950 shares of which are exercisable), 211,700 shares are issuable pursuant to outstanding restricted stock units and 20,000 shares |
18
Table of Contents
| of restricted stock, (2) shares of our common stock that would be issuable upon the exchange of shares of Aleris International’s redeemable preferred stock (subject, pursuant to the terms of the redeemable preferred stock, to anti-dilution adjustments summarized below), and (3) shares of our common stock that would be issuable upon the exchange of Aleris International’s Exchangeable Notes (subject, pursuant to the terms of the Exchangeable Notes, to anti-dilution adjustments summarized below). The redeemable preferred stock and the Exchangeable Notes are subject to customary anti-dilution provisions which adjust the number of shares of common stock issuable upon exchange of such securities upon the following events: (i) stock dividends, distributions, splits, subdivisions, combinations or reclassifications; (ii) issuance or sale of shares of common stock or securities convertible into or exchangeable for common stock, without consideration or at a consideration per share that is below market; (iii) other dividends or distributions other than stock; (iv) other similar dilutive events; or (v) extraordinary corporate transactions such as mergers, consolidations, sales of assets, tenders or exchange offers, transactions or events in which all or substantially all of our common stock is converted or exchanged for stock, other securities, cash or assets. |
| • | assumes no exercise by the underwriters of their option to purchase up to shares of common stock from the selling stockholders; and |
| • | reflects the for 1 stock split that we will effectuate prior to the consummation of this offering. |
Unless we indicate otherwise, the information in this prospectus assumes that our common stock will be sold at $ per share, which is the mid-point of the estimated offering price range shown on the front cover of this prospectus.
19
Table of Contents
Summary historical consolidated financial and other data
The following summary historical consolidated financial data for the year ended December 31, 2011, the seven months ended December 31, 2010, the five months ended May 31, 2010 and the year ended December 31, 2009 and as of December 31, 2011 and 2010 and May 31, 2010 have been derived from our audited consolidated financial statements included elsewhere in this prospectus. The balance sheet data as of December 31, 2009 has been derived from our consolidated financial statements not included in this prospectus. The historical results included here and elsewhere in this prospectus are not necessarily indicative of future performance or results of operations.
We were formed in order to acquire the assets and operations of the entity formerly known as Aleris International, Inc. (the “Predecessor”) through the Predecessor’s plan of reorganization and emergence from bankruptcy. Aleris International emerged from bankruptcy on June 1, 2010 (the “Emergence Date”). Pursuant to the First Amended Joint Plan of Reorganization as modified (the “Plan of Reorganization”), the Predecessor transferred all of its assets to subsidiaries of Intermediate Co., a newly formed entity that is wholly owned by us. In exchange for the acquired assets, Intermediate Co. contributed shares of our common stock and senior subordinated exchangeable notes to the Predecessor. These instruments were then distributed or sold pursuant to the Plan of Reorganization. The Predecessor then changed its name to “Old AII, Inc.” and was dissolved and Intermediate Co. changed its name to Aleris International, Inc.
We have been considered the “Successor” to the Predecessor by virtue of the fact that our only operations and all of our assets are those of Aleris International, Inc., the direct acquirer of the Predecessor. As a result, our financial results are presented alongside those of the Predecessor herein. In accordance with the provisions of Financial Accounting Standards Board Accounting Standards Codification 852, “Reorganizations,” we applied fresh-start accounting upon the emergence and became a new entity for financial reporting purposes as of the Emergence Date. This dramatically impacted 2010 operating results as certain pre-bankruptcy debts were discharged in accordance with the Plan of Reorganization immediately prior to emergence and assets and liabilities were adjusted to their fair values upon emergence. As a result, the financial information of the Successor subsequent to emergence from Chapter 11 is not comparable to that of the Predecessor prior to emergence.
The historical consolidated financial data presented below is only a summary and should be read together with “Selected historical financial and operating data,” “Management’s discussion and analysis of financial condition and results of operations,” and our audited consolidated financial statements, including the notes to those consolidated financial statements, appearing elsewhere in this prospectus.
20
Table of Contents
| (Successor) | (Predecessor) | |||||||||||||||||
| (Dollars and shares in millions (except per share data), metric tons in thousands) |
For the year ended 2011 |
For the seven months ended December 31, 2010 |
For the five 2010 |
For the year ended 2009 |
||||||||||||||
|
|
|
|
|
|
|
|
|
|
|
|||||||||
| Statement of operations data: |
||||||||||||||||||
| Revenues |
$ | 4,826.4 | $ | 2,474.1 | $ | 1,643.0 | $ | 2,996.8 | ||||||||||
| Operating income (loss) |
195.8 | 78.5 | 74.4 | (911.0 | ) | |||||||||||||
| Net income (loss) |
161.2 | 71.4 | 2,204.1 | (1,187.4 | ) | |||||||||||||
| Net income (loss) attributable to Aleris Corporation |
161.6 | 71.4 | 2,204.1 | (1,187.4 | ) | |||||||||||||
| Earnings per share: |
||||||||||||||||||
| Basic |
$ | 5.20 | $ | 2.28 | ||||||||||||||
| Diluted |
4.91 | 2.21 | ||||||||||||||||
| Weighted-average shares outstanding: |
||||||||||||||||||
| Basic |
31.0 | 30.9 | ||||||||||||||||
| Diluted |
33.3 | 32.6 | ||||||||||||||||
| Pro forma earnings per share(a): |
||||||||||||||||||
| Basic |
$ | $ | ||||||||||||||||
| Diluted |
||||||||||||||||||
| Pro forma weighted-average shares outstanding(a): |
||||||||||||||||||
| Basic |
||||||||||||||||||
| Diluted |
||||||||||||||||||
| Balance sheet data (at end of period): |
||||||||||||||||||
| Cash and cash equivalents |
$ | 231.4 | $ | 113.5 | $ | 60.2 | $ | 108.9 | ||||||||||
| Total assets |
2,037.6 | 1,779.7 | 1,697.6 | 1,580.3 | ||||||||||||||
| Total debt |
602.0 | 50.4 | 585.1 | 842.7 | ||||||||||||||
| Total Aleris Corporation equity (deficit) |
554.4 | 937.8 | (2,189.4 | ) | (2,180.4 | ) | ||||||||||||
| Other data: |
||||||||||||||||||
| Metric tons invoiced: |
||||||||||||||||||
| RPNA |
370.5 | 213.8 | 156.8 | 309.4 | ||||||||||||||
| RPEU |
314.4 | 183.8 | 120.2 | 231.8 | ||||||||||||||
| Extrusions |
75.7 | 42.6 | 29.4 | 65.0 | ||||||||||||||
| RSAA |
894.5 | 560.7 | 349.6 | 690.6 | ||||||||||||||
| RSEU |
387.2 | 220.3 | 152.0 | 310.6 | ||||||||||||||
| Intersegment shipments |
(36.8 | ) | (30.2 | ) | (20.0 | ) | (36.2 | ) | ||||||||||
|
|
|
|
|
|
|
|
|
|
||||||||||
| Total metric tons invoiced |
2,005.5 | 1,191.0 | 788.0 | 1,571.2 | ||||||||||||||
| Net cash provided (used) by: |
||||||||||||||||||
| Operating activities |
$ | 266.9 | $ | 119.1 | $ | (174.0 | ) | $ | 56.7 | |||||||||
| Investing activities |
(197.3 | ) | (26.2 | ) | (15.7 | ) | (59.8 | ) | ||||||||||
| Financing activities |
53.7 | (83.6 | ) | 187.5 | 60.8 | |||||||||||||
| Depreciation and amortization |
70.3 | 38.4 | 20.2 | 168.4 | ||||||||||||||
| Capital expenditures |
(204.6 | ) | (46.5 | ) | (16.0 | ) | (68.6 | ) | ||||||||||
| EBITDA(b) |
274.0 | 117.1 | 2,289.2 | (855.4 | ) | |||||||||||||
| Adjusted EBITDA(c) |
331.6 | 162.1 | 102.0 | 81.7 | ||||||||||||||
|
|
|
|
|
|
|
|
|
|
|
|||||||||
| (a) | See Note 20, “Earnings per share,” to our consolidated financial statements included elsewhere in this prospectus for a discussion and further details on the calculation of pro forma earnings per share and pro forma weighted-average shares outstanding. |
| (b) | We report our financial results in accordance with U.S. GAAP. However, our management believes that certain non-U.S. GAAP performance measures, which we use in managing the business, may provide investors with additional meaningful comparisons between current results and results in prior periods. EBITDA is an example of a non-U.S. GAAP financial measure that we believe provides investors and other users of our financial information with useful information. Non-U.S. GAAP measures have limitations as analytical tools and should be considered in addition to, not in isolation or as a substitute for, or as superior to, our measures of financial performance prepared in accordance with U.S. GAAP. Management uses EBITDA as a performance metric and believes this measure provides additional information commonly used by holders of the Senior Notes |
21
Table of Contents
| and lenders under the ABL Facility with respect to the ongoing performance of our underlying business activities, as well as our ability to meet our future debt service, capital expenditures and working capital needs. In addition, EBITDA with certain adjustments is a component of certain covenants under the indenture governing the Senior Notes. EBITDA as defined in the indenture governing the Senior Notes also limits the amount of adjustments for cost savings, operational improvement and synergies for the purpose of determining our compliance with such covenants. However, EBITDA was not impacted by these limits for the periods presented. |
Our EBITDA calculations represent net income (loss) attributable to Aleris Corporation before interest income and expense, benefit from (provision for) income taxes and depreciation and amortization. EBITDA should not be construed as an alternative to net income attributable to Aleris Corporation as an indicator of our performance, or cash flows from our operating activities, investing activities or financing activities as a measure of liquidity, in each case as such measure is determined in accordance with U.S. GAAP. EBITDA as we use it may not be comparable to similarly titled measures used by other entities. See “Management’s discussion and analysis of financial condition and results of operations—EBITDA and Adjusted EBITDA.”
Our reconciliation of EBITDA to net income (loss) attributable to Aleris Corporation and net cash provided (used) by operating activities is as follows:
| (Successor) | (Predecessor) | |||||||||||||||
| (in millions) | For the year ended December 31, 2011 |
For the seven months ended December 31, 2010 |
For the five months ended May 31, 2010 |
For the year ended December 31, 2009 |
||||||||||||
| EBITDA |
$ | 274.0 | $ | 117.1 | $ | 2,289.2 | $ | (855.4 | ) | |||||||
| Interest expense, net |
(46.3 | ) | (7.0 | ) | (73.6 | ) | (225.4 | ) | ||||||||
| Benefit from (provision for) income taxes |
4.2 | (0.3 | ) | 8.7 | 61.8 | |||||||||||
| Depreciation and amortization |
(70.3 | ) | (38.4 | ) | (20.2 | ) | (168.4 | ) | ||||||||
| Net income (loss) attributable to Aleris Corporation |
$ | 161.6 | $ | 71.4 | $ | 2,204.1 | $ | (1,187.4 | ) | |||||||
| Net loss attributable to noncontrolling interest |
(0.4 | ) | — | — | — | |||||||||||
| Net income (loss) |
$ | 161.2 | $ | 71.4 | $ | 2,204.1 | $ | (1,187.4 | ) | |||||||
| Depreciation and amortization |
70.3 | 38.4 | 20.2 | 168.4 | ||||||||||||
| Benefit from deferred income taxes |
(33.6 | ) | (4.8 | ) | (11.4 | ) | (54.2 | ) | ||||||||
| Restructuring and impairment charges: |
||||||||||||||||
| Charges (gains) |
4.4 | 12.1 | (0.4 | ) | 862.9 | |||||||||||
| Payments |
(3.8 | ) | (3.3 | ) | (5.5 | ) | (45.6 | ) | ||||||||
| Reorganization items: |
||||||||||||||||
| (Gains) charges |
(1.3 | ) | 7.4 | (2,227.3 | ) | 123.1 | ||||||||||
| Payments |
(3.6 | ) | (33.7 | ) | (31.2 | ) | (25.2 | ) | ||||||||
| Currency exchange losses (gains) on debt |
5.4 | — | 25.5 | (14.9 | ) | |||||||||||
| Stock-based compensation expense |
10.1 | 4.9 | 1.3 | 2.1 | ||||||||||||
| Unrealized losses (gains) on derivative financial instruments |
37.8 | (19.8 | ) | 39.2 | (11.2 | ) | ||||||||||
| Amortization of debt issuance costs |
6.3 | 2.5 | 27.8 | 109.1 | ||||||||||||
| Other non-cash (gains) charges, net |
(8.9 | ) | (15.4 | ) | 18.3 | 1.7 | ||||||||||
| Change in operating assets and liabilities: |
||||||||||||||||
| Change in accounts receivable |
(13.0 | ) | 81.3 | (181.5 | ) | 119.5 | ||||||||||
| Change in inventories |
15.7 | (46.6 | ) | (138.7 | ) | 159.3 | ||||||||||
| Change in other assets |
(8.5 | ) | 37.0 | (15.2 | ) | (41.7 | ) | |||||||||
| Change in accounts payable |
(18.4 | ) | 24.8 | 67.4 | (103.6 | ) | ||||||||||
| Change in accrued liabilities |
46.8 | (37.1 | ) | 33.4 | (5.6 | ) | ||||||||||
| Net cash provided (used) by operating activities |
$ | 266.9 | $ | 119.1 | $ | (174.0 | ) | $ | 56.7 | |||||||
22
Table of Contents
| (c) | Adjusted EBITDA is another example of a non-U.S. GAAP financial measure that we believe provides investors and other users of our financial information with useful information. Non-U.S. GAAP measures have limitations as analytical tools and should be considered in addition to, not in isolation or as a substitute for, or as superior to, our measures of financial performance prepared in accordance with U.S. GAAP. Management uses Adjusted EBITDA as a performance metric and believes this measure provides additional information used by Aleris International’s noteholders and parties to the ABL Facility with respect to the ongoing performance of our underlying business activities, as well as our ability to meet our future debt service, capital expenditures and working capital needs. In addition, Adjusted EBITDA, without adjustments for metal price lag, is a component of certain financial covenants under the credit agreement governing the ABL Facility. Adjusted EBITDA as defined under the ABL Facility also limits the amount of adjustments for restructuring charges incurred after the Emergence Date and requires additional adjustments be made if certain annual pension funding levels are exceeded. These thresholds were not met as of December 31, 2011. |
| We define Adjusted EBITDA as EBITDA excluding metal price lag, reorganization items, net, unrealized gains and losses on derivative financial instruments, restructuring and impairment charges, the impact of recording inventory and other items at fair value through fresh-start and purchase accounting, currency exchange gains and losses on debt, stock-based compensation expense, start-up expenses, and certain other gains and losses. Adjusted EBITDA should not be construed as an alternative to net income attributable to Aleris Corporation as an indicator of our performance, or cash flows from our operating activities, investing activities or financing activities as a measure of liquidity, in each case as such measure is determined in accordance with U.S. GAAP. Adjusted EBITDA as we use it is likely to differ from the methods used by other companies in computing similarly titled or defined terms. See “Management’s discussion and analysis of financial condition and results of operations—EBITDA and Adjusted EBITDA.” |
| Our | reconciliation of net income (loss) attributable to Aleris Corporation to EBITDA and Adjusted EBITDA is as follows: |
| (Successor) | (Predecessor) | |||||||||||||||
| (in millions) | For the year ended December 31, 2011 |
For the seven months ended December 31, 2010 |
For the five months ended May 31, 2010 |
For the year ended December 31, 2009 |
||||||||||||
|
|
||||||||||||||||
| Net income (loss) attributable to Aleris Corporation |
$ | 161.6 | $ | 71.4 | $ | 2,204.1 | $ | (1,187.4 | ) | |||||||
| Interest expense, net |
46.3 | 7.0 | 73.6 | 225.4 | ||||||||||||
| (Benefit from) provision for income taxes |
(4.2 | ) | 0.3 | (8.7 | ) | (61.8 | ) | |||||||||
| Depreciation and amortization |
70.3 | 38.4 | 20.2 | 168.4 | ||||||||||||
| EBITDA |
$ | 274.0 | $ | 117.1 | $ | 2,289.2 | $ | (855.4 | ) | |||||||
| Reorganization items, net(i) |
(1.3 | ) | 7.4 | (2,227.3 | ) | 123.1 | ||||||||||
| Unrealized losses (gains) on derivative financial instruments |
37.8 | (19.8 | ) | 39.2 | (11.2 | ) | ||||||||||
| Restructuring and impairment charges (gains)(ii) |
4.4 | 12.1 | (0.4 | ) | 862.9 | |||||||||||
| Impact of recording inventory and other items at fair value through fresh-start and purchase accounting(iii) |
3.4 | 24.4 | 1.6 | 2.5 | ||||||||||||
| Currency exchange losses (gains) on debt |
0.7 | (5.8 | ) | 32.0 | (17.0 | ) | ||||||||||
| Stock-based compensation expense |
10.1 | 4.9 | 1.3 | 2.1 | ||||||||||||
| Start-up expenses |
10.2 | 2.0 | — | — | ||||||||||||
| Other(iv) |
11.2 | (1.2 | ) | 1.0 | 4.2 | |||||||||||
| (Favorable) unfavorable metal price lag(v) |
(18.9 | ) | 21.0 | (34.6 | ) | (29.5 | ) | |||||||||
| Adjusted EBITDA |
$ | 331.6 | $ | 162.1 | $ | 102.0 | $ | 81.7 | ||||||||
| (i) | See Note 4, “Fresh-start accounting,” and Note 3, “Reorganization under Chapter 11,” to our audited consolidated financial statements included elsewhere in this prospectus. |
| (ii) | See Note 5, “Restructuring and impairment charges,” to our audited consolidated financial statements included elsewhere in this prospectus. |
| (iii) | Represents the impact of applying fresh-start and purchase accounting rules under U.S. GAAP which effectively eliminate the profit associated with acquired inventories by requiring those inventories to be adjusted to fair value through the purchase price allocation. The amounts represent $0.0 million, $33.0 million, $0.0 million and $0.0 million of adjustments to the |
23
Table of Contents
| recording of inventory for the year ended December 31, 2011, the seven months ended December 31, 2010, the five months ended May 31, 2010 and the year ended December 31, 2009, respectively. The amounts in the table also represent the fair value of derivative financial instruments as of the date of the acquisition of Aleris International by TPG Capital (formerly Texas Pacific Group) (“TPG”) in 2006 or Aleris International’s emergence from bankruptcy in 2010 that settled in each of the periods presented. These amounts are included in Adjusted EBITDA to reflect the total economic gains or losses associated with these derivatives. Absent adjustment, Adjusted EBITDA would reflect the amounts recorded in the financial statements as realized gains and losses, which represent only the change in value of the derivatives from the date of TPG’s acquisition of Aleris International or Aleris International’s emergence from bankruptcy to settlement. |
| (iv) | Includes the write-down of inventories associated with plant closures and gains and losses on the disposal of assets. For the year ended December 31, 2011, also includes $11.9 million of contract termination costs associated with the cancellation of our research and development agreement with Tata Steel. |
| (v) | Represents the financial impact of the timing difference between when aluminum prices included within our revenues are established and when aluminum purchase prices included in our cost of sales are established. This lag will, generally, increase our earnings and EBITDA in times of rising primary aluminum prices and decrease our earnings and EBITDA in times of declining primary aluminum prices; however, our use of derivative financial instruments seeks to reduce this impact. Metal price lag is net of the realized gains and losses from our derivative financial instruments. We exclude metal price lag from our determination of Adjusted EBITDA because it is not an indicator of the performance of our underlying operations. |
24
Table of Contents
An investment in our common stock involves risk. You should carefully consider the following risks as well as the other information included in this prospectus, including “Management’s discussion and analysis of financial condition and results of operations” and the financial statements and related notes included elsewhere in this prospectus, before investing in our common stock. Any of the following risks could materially and adversely affect our business, financial condition or results of operations. In such a case, the trading price of the common stock could decline, and you may lose all or part of your investment in us.
Risks related to our business
If we fail to implement our business strategy, our financial condition and results of operations could be adversely affected.
Our future financial performance and success depend in large part on our ability to successfully implement our business strategy. We cannot assure you that we will be able to successfully implement our business strategy or be able to continue improving our operating results. In particular, we cannot assure you that we will be able to achieve all operating cost savings targeted through focused productivity improvements and capacity optimization, further enhancements of our business and product mix, expansion in selected international regions, opportunistic pursuit of strategic acquisitions and management of key commodity exposures.
Furthermore, we cannot assure you that we will be successful in our growth efforts or that we will be able to effectively manage expanded or acquired operations. Our ability to achieve our expansion and acquisition objectives and to effectively manage our growth effectively depends on a number of factors, including the following:
| • | our ability to introduce new products and end-use applications; |
| • | our ability to identify appropriate acquisition targets and to negotiate acceptable terms for their acquisition; |
| • | our ability to integrate new businesses into our operations; and |
| • | the availability of capital on acceptable terms. |
Implementation of our business strategy could be affected by a number of factors beyond our control, such as increased competition, legal and regulatory developments, general economic conditions or an increase in operating costs. Any failure to successfully implement our business strategy could adversely affect our financial condition and results of operations. We may, in addition, decide to alter or discontinue certain aspects of our business strategy at any time.
The cyclical nature of the metals industry, our end-use segments and our customers’ industries could limit our operating flexibility, which could negatively affect our financial condition and results of operations.
The metals industry in general is cyclical in nature. It tends to reflect and be amplified by changes in general and local economic conditions. These conditions include the level of economic growth, financing availability, the availability of affordable energy sources, employment levels, interest rates, consumer confidence and housing demand. Historically, in periods of recession or periods of minimal economic growth, metals companies have often tended to underperform other
25
Table of Contents
sectors. We are particularly sensitive to trends in the transportation and building and construction industries, which are both seasonal, highly cyclical and dependent upon general economic conditions. For example, during recessions or periods of low growth, the transportation and building and construction industries typically experience major cutbacks in production, resulting in decreased demand for aluminum. This leads to significant fluctuations in demand and pricing for our products and services. Because we generally have high fixed costs, our near-term profitability is significantly affected by decreased processing volume. Accordingly, reduced demand and pricing pressures may significantly reduce our profitability and adversely affect our financial condition. Economic downturns in regional and global economies or a prolonged recession in our principal industry segments have had a negative impact on our operations in the past and could have a negative impact on our future financial condition or results of operations. In addition, in recent years global economic and commodity trends have been increasingly correlated. Although we continue to seek to diversify our business on a geographic and industry end-use basis, we cannot assure you that diversification will significantly mitigate the effect of cyclical downturns.
Changes in the market price of aluminum impact the selling prices of our products. Market prices of aluminum are dependent upon supply and demand and a variety of factors over which we have minimal or no control, including:
| • | regional and global economic conditions; |
| • | availability and relative pricing of metal substitutes; |
| • | labor costs; |
| • | energy prices; |
| • | environmental and conservation regulations; |
| • | seasonal factors and weather; and |
| • | import and export restrictions. |
Our business requires substantial amounts of capital to operate; failure to maintain sufficient liquidity will have a material adverse effect on our financial condition and results of operations.
Our business requires substantial amounts of cash to operate and our liquidity can be adversely affected by a number of factors outside our control. Fluctuations in the LME prices for aluminum may result in increased cash costs for metal or scrap. In addition, if aluminum price movements result in a negative valuation of our current financial derivative positions, our counterparties may require posting of cash collateral. Furthermore, in an environment of falling LME prices, the borrowing base and availability under the ABL Facility may shrink and constrain our liquidity.
The loss of certain members of our management may have an adverse effect on our operating results.
Our success will depend, in part, on the efforts of our senior management and other key employees. These individuals possess sales, marketing, engineering, manufacturing, financial and administrative skills that are critical to the operation of our business. If we lose or suffer an extended interruption in the services of one or more of our senior officers, our financial condition and results of operations may be negatively affected. Moreover, the pool of qualified individuals may be highly competitive and we may not be able to attract and retain qualified personnel to replace or succeed members of our senior management or other key employees, should the need arise.
26
Table of Contents
We may be unable to manage effectively our exposure to commodity price fluctuations, and our hedging activities may affect profitability in a changing metals price environment and subject our earnings to greater volatility from period-to-period.
Significant increases in the price of primary aluminum, aluminum scrap, alloys, hardeners, or energy would cause our cost of sales to increase significantly and, if not offset by product price increases, would negatively affect our financial condition and results of operations. We are substantial consumers of raw materials, and by far the largest input cost in producing our goods is the cost of aluminum. The cost of energy used by us, however, is also substantial. Customers pay for our products based on the price of the aluminum contained in the products, plus a “rolling margin” or “conversion margin” fee (the “Price Margin”), or based on a fixed price. In general, we use this pricing mechanism to pass changes in the price of aluminum, and, sometimes, in the price of natural gas, through to our customers. In most end-uses and by industry convention, however, we offer our products at times on a fixed price basis as a service to the customer. This commitment to supply an aluminum-based product to a customer at a fixed price often extends months, but sometimes years, into the future. Such commitments require us to purchase raw materials in the future, exposing us to the risk that increased aluminum or natural gas prices will increase the cost of our products, thereby reducing or eliminating the Price Margin we receive when we deliver the product. These risks may be exacerbated by the failure of our customers to pay for products on a timely basis, or at all.
Furthermore, the RPNA and Europe segments are exposed to variability in the market price of a premium differential (referred to as “Midwest Premium” in the United States and “Duty Paid/Unpaid Rotterdam” in Europe) charged by industry participants to deliver aluminum from the smelter to the manufacturing facility. This premium differential also fluctuates in relation to several conditions. The RPNA and Europe segments follow a pattern of increasing or decreasing their selling prices to customers in response to changes in the Midwest Premium and the Duty Paid/Unpaid Rotterdam.
Similarly, as we maintain large quantities of base inventory, significant decreases in the price of primary aluminum would reduce the realizable value of our inventory, negatively affecting our financial condition and results of operations. In addition, a drop in aluminum prices between the date of purchase and the final settlement date on derivative contracts used to mitigate the risk of price fluctuations may require us to post additional margin, which, in turn, can be a significant demand on liquidity.
We purchase and sell LME forwards, futures and options contracts to seek to reduce our exposure to changes in aluminum, copper and zinc prices. The ability to realize the benefit of our hedging program is dependent upon factors beyond our control such as counterparty risk as well as our customers making timely payment to us for product. In addition, at certain times, hedging options may be unavailable or not available on terms acceptable to us. In certain scenarios when market price movements result in a decline in value of our current derivatives position, our mark-to-market expense may exceed our credit line and counterparties may request the posting of cash collateral. Despite the use of LME forwards, futures and options contracts, we remain exposed to the variability in prices of aluminum scrap. While aluminum scrap is typically priced in relation to prevailing LME prices, certain scrap types used in our RSAA operations are not highly correlated to an underlying LME price and, therefore, are not hedged. Scrap is also priced at a discount to LME aluminum (depending upon the quality of the material supplied). This discount is referred to in the industry as the “scrap spread” and fluctuates depending upon industry conditions. In addition, we purchase forwards, futures or options contracts to reduce our
27
Table of Contents
exposure to changes in natural gas prices. We do not account for our forwards, futures, or options contracts as hedges of the underlying risks. As a result, unrealized gains and losses on our derivative financial instruments must be reported in our consolidated results of operations. The inclusion of such unrealized gains and losses in earnings may produce significant period to period earnings volatility that is not necessarily reflective of our underlying operating performance. See “Management’s discussion and analysis of financial condition and results of operations—Quantitative and qualitative disclosures about market risk.”
Our internal controls over financial reporting and our disclosure controls and procedures may not prevent all possible errors that could occur.
Each quarter, our chief executive officer and chief financial officer evaluate our internal controls over financial reporting and our disclosure controls and procedures, which includes a review of the objectives, design, implementation and effect of the controls relating to the information generated for use in our financial reports. In the course of our controls evaluation, we seek to identify data errors or control problems and to confirm that appropriate corrective action, including process improvements, are being undertaken. The overall goals of these various evaluation activities are to monitor our internal controls over financial reporting and our disclosure controls and procedures and to make modifications as necessary. Our intent in this regard is that our internal controls over financial reporting and our disclosure controls and procedures will be maintained as dynamic systems that change (including with improvements and corrections) as conditions warrant. A control system, no matter how well designed and operated, can provide only reasonable, not absolute, assurance that the control system’s objectives will be satisfied. These inherent limitations include the possibility that judgments in our decision-making could be faulty, and that isolated breakdowns could occur because of simple human error or mistake. We cannot provide absolute assurance that all possible control issues within our company have been detected. The design of our system of controls is based in part upon certain assumptions about the likelihood of events, and there can be no assurance that any design will succeed absolutely in achieving our stated goals. Because of the inherent limitations in any control system, misstatements could occur and not be detected.
We may encounter increases in the cost, or limited availability, of raw materials and energy, which could cause our cost of goods sold to increase thereby reducing operating results and limiting our operating flexibility.
We require substantial amounts of raw materials and energy in our business, consisting principally of primary-based aluminum, aluminum scrap, alloys and other materials, and natural gas. Any substantial increases in the cost of raw materials or energy could cause our operating costs to increase and negatively affect our financial condition and results of operations.
Aluminum scrap, primary aluminum, rolling slab, billet and hardener prices are subject to significant cyclical price fluctuations. Metallics (primary aluminum metal, aluminum scrap and aluminum dross) represent the largest component of our costs of sales. We purchase aluminum primarily from aluminum scrap dealers, primary aluminum producers and other intermediaries. We meet our remaining requirements with purchased primary-based aluminum. We have limited control over the price or availability of these supplies in the future.
The availability and price of aluminum scrap, rolling slab and billet depend on a number of factors outside our control, including general economic conditions, international demand for metallics and internal recycling activities by primary aluminum producers and other consumers of aluminum. We rely on third parties for the supply of alloyed rolling slab and billet for certain
28
Table of Contents
products. In the future, we may face an increased risk of supply to meet our demand due to issues with suppliers and rising costs of production. Our inability to satisfy our future supply needs may impact our profitability and expose us to penalties as a result of contractual commitments with some of our customers. For example, to help a subsidiary of BaseMet B.V., a supplier of a significant portion of the aluminum slab and billet used by our RPEU and Extrusion segments, to meet our supply needs, we recently agreed to provide a loan to that subsidiary of BaseMet B.V. Notwithstanding the foregoing, there can be no assurance that the BaseMet B.V. subsidiary will be able to continue to sufficiently meet our supply needs in the future. The availability and price of rolling slab and billet could impact our margins or our ability to meet customer volumes. Increased regional and global demand for aluminum scrap can have the effect of increasing the prices that we pay for these raw materials thereby increasing our cost of sales. We often cannot adjust the selling prices for our products to recover the increases in scrap prices. If scrap and dross prices were to increase significantly without a commensurate increase in the traded value of the primary metals, our future financial condition and results of operations could be affected by higher costs and lower profitability. In addition, a significant decrease in the pricing spread between aluminum scrap and primary aluminum could make recycling less attractive compared to primary production, and thereby reduce customer demand for our recycling business.
After raw material and labor costs, utilities represent the third largest component of our cost of sales. The price of natural gas, and therefore the costs, can be particularly volatile. Price, and volatility, can differ by global region based on supply and demand, political issues and government regulation, among other things. As a result, our natural gas costs may fluctuate dramatically, and we may not be able to reduce the effect of higher natural gas costs on our cost of sales. If natural gas costs increase, our financial condition and results of operations may be adversely affected. Although we attempt to mitigate volatility in natural gas costs through the use of hedging and the inclusion of price escalators in certain of our long-term supply contracts, we may not be able to eliminate the effects of such cost volatility. Furthermore, in an effort to offset the effect of increasing costs, we may have also limited our potential benefit from declining costs.
If we were to lose order volumes from any of our largest customers, our sales volumes, revenues and cash flows could be reduced.
Our business is exposed to risks related to customer concentration. Our ten largest customers were responsible for approximately 27% of our consolidated revenues for the year ended December 31, 2011. No one customer accounted for more than 5% of those revenues. A loss of order volumes from, or a loss of industry share by, any major customer could negatively affect our financial condition and results of operations by lowering sales volumes, increasing costs and lowering profitability. In addition, our strategy of having dedicated facilities and arrangements with customers subject us to the inherent risk of increased dependence on a single or a few customers with respect to these facilities. In such cases, the loss of such a customer, or the reduction of that customer’s business at one or more of our facilities, could negatively affect our financial condition and results of operations, and we may be unable to timely replace, or replace at all, lost order volumes. In addition, several of our customers have become involved in bankruptcy or insolvency proceedings and have defaulted on their obligations to us in recent years. Similar incidents in the future would adversely impact our financial conditions and results of operations.
29
Table of Contents
We do not have long-term contractual arrangements with a substantial number of our customers, and our sales volumes and revenues could be reduced if our customers switch their suppliers.
Approximately 82% of our consolidated revenues for the year ended December 31, 2011 were generated from customers who do not have long-term contractual arrangements with us. These customers purchase products and services from us on a purchase order basis and may choose not to continue to purchase our products and services. Any significant loss of these customers or a significant reduction in their purchase orders could have a material negative impact on our sales volume and business.
We may not be able to generate sufficient cash flows to fund our capital expenditure requirements or to meet our debt service obligations.
Our operations may not be able to generate sufficient cash flows to service our indebtedness, fund our capital expenditures or provide the ability to raise needed financing on terms favorable to us. We may be unable to raise additional capital on favorable terms or at all. In addition, any failure to pursue business initiatives could adversely affect our ability to compete effectively. Further, any of the actions above could provide only temporary assistance with the cash flows of the business.
Our business requires substantial capital investments that we may be unable to fulfill.
Our operations are capital intensive. Our total capital expenditures were $204.6 million, $62.5 million and $68.6 million for the years ended December 31, 2011, 2010 and 2009, respectively, with 2011 capital expenditures including our initial spending related to the China Joint Venture. We may not generate sufficient operating cash flows and our external financing sources may not be available in an amount sufficient to enable us to make anticipated capital expenditures, service or refinance our indebtedness or fund other liquidity needs. If we are unable to make upgrades or purchase new plants and equipment, our financial condition and results of operations could be affected by higher maintenance costs, lower sales volumes due to the impact of reduced product quality, and other competitive influences.
The China Joint Venture requires substantial additional capital investments that may not be able to be satisfied.
Through the China Joint Venture, we are building a rolling mill in China. The China Joint Venture requires significant capital expenditures which are financed by the Bank of China under the China Loan Facility and by equity capital contributed by each partner. The Chinese government exercises significant control over economic growth in China through the allocation of resources, including imposing policies that impact particular industries or companies in different ways, so we may experience future disruptions to our access to capital in the Chinese banking market. We have had delays in our ability to make timely draws of amounts committed under the China Loan Facility in the past and we cannot be certain that we will be able to draw all amounts committed under the China Loan Facility in the future or as to the timing or cost of any such draws. We also may not generate sufficient operating cash flows and our external financing sources may not be available in an amount sufficient to enable us to make the anticipated capital expenditures for the China Joint Venture. In addition, funding of the China Joint Venture may depend on capital contributions by the minority China Joint Venture partner. To the extent that funding is not available from the Bank of China under the non-recourse China Loan Facility or by capital contributions by our partner, we may need to increase the amount of capital necessary to fund
30
Table of Contents
the China Joint Venture from our own or other sources of capital. The availability of financing, as well as future actions and policies of the Chinese government, could materially affect the ability of the China Joint Venture to be funded, which may delay or halt construction of our new rolling mill in China.
We may not be able to compete successfully in the industry segments we serve and aluminum may become less competitive with alternative materials, which could reduce our share of industry sales, sales volumes and selling prices.
Aluminum competes with other materials such as steel, plastic, composite materials and glass for various applications. Higher aluminum prices tend to make aluminum products less competitive with these alternative materials.
We compete in the production and sale of rolled aluminum products with a number of other aluminum rolling mills, including large, single-purpose sheet mills, continuous casters and other multi-purpose mills, some of which are larger and have greater financial and technical resources than we do. We compete with other rolled products suppliers, principally multipurpose mills, on the basis of quality, price, timeliness of delivery, technological innovation and customer service. Producers with a different cost basis may, in certain circumstances, have a competitive pricing advantage.
We also compete with other aluminum recyclers in segments that are highly fragmented and characterized by smaller, regional operators. The principal factors of competition in our aluminum recycling business include price, metal recovery rates, proximity to customers, customer service, molten metal delivery capability, environmental and safety regulatory compliance and types of services offered.
As we increase our international business, we encounter the risk that non-U.S. governments could take actions to enhance local production or local ownership at our expense.
Additional competition could result in a reduced share of industry sales or reduced prices for our products and services, which could decrease revenues or reduce volumes, either of which could have a negative effect on our financial condition and results of operations.
A portion of our sales is derived from our international operations, which exposes us to certain risks inherent in doing business abroad.
We have aluminum recycling operations in Germany, the United Kingdom, Mexico and Canada and magnesium recycling operations in Germany. We also have rolled products and extrusions operations in Germany, Belgium and China. We continue to explore opportunities to expand our international operations. Through the China Joint Venture we are building a rolling mill in China. Our international operations generally are subject to risks, including:
| • | changes in U.S. and international governmental regulations, trade restrictions and laws, including tax laws and regulations; |
| • | currency exchange rate fluctuations; |
| • | tariffs and other trade barriers; |
| • | the potential for nationalization of enterprises or government policies favoring local production; |
| • | interest rate fluctuations; |
31
Table of Contents
| • | high rates of inflation; |
| • | currency restrictions and limitations on repatriation of profits; |
| • | differing protections for intellectual property and enforcement thereof; |
| • | divergent environmental laws and regulations; and |
| • | political, economic and social instability. |
The occurrence of any of these events could cause our costs to rise, limit growth opportunities or have a negative effect on our operations and our ability to plan for future periods, and subject us to risks not generally prevalent in the United States.
The financial condition and results of operations of some of our operating entities are reported in various currencies and then translated into U.S. dollars at the applicable exchange rate for inclusion in our consolidated financial statements. As a result, appreciation of the U.S. dollar against these currencies may have a negative impact on reported revenues and operating profit, and the resulting accounts receivable, while depreciation of the U.S. dollar against these currencies may generally have a positive effect on reported revenues and operating profit. In addition, a portion of the revenues generated by our international operations are denominated in U.S. dollars, while the majority of costs incurred are denominated in local currencies. As a result, appreciation in the U.S. dollar may have a positive impact on earnings while depreciation of the U.S. dollar may have a negative impact on earnings.
Current environmental liabilities as well as the cost of compliance with, and liabilities under, health and safety laws could increase our operating costs and negatively affect our financial condition and results of operations.
Our operations are subject to federal, state, local and foreign environmental laws and regulations, which govern, among other things, air emissions, wastewater discharges, the handling, storage and disposal of hazardous substances and wastes, the remediation of contaminated sites and employee health and safety. Future environmental regulations could impose stricter compliance requirements on the industries in which we operate. Additional pollution control equipment, process changes, or other environmental control measures may be needed at some of our facilities to meet future requirements.
Financial responsibility for contaminated property can be imposed on us where current operations have had an environmental impact. Such liability can include the cost of investigating and remediating contaminated soil or ground water, fines and penalties sought by environmental authorities, and damages arising out of personal injury, contaminated property and other toxic tort claims, as well as lost or impaired natural resources. Certain environmental laws impose strict, and in certain circumstances joint and several, liability for certain kinds of matters, such that a person can be held liable without regard to fault for all of the costs of a matter even though others were also involved or responsible. The costs of all such matters have not been material to net income (loss) for any accounting period since January 1, 2007. However, future remedial requirements at currently owned or operated properties or adjacent areas could result in significant liabilities.
Changes in environmental requirements or changes in their enforcement could materially increase our costs. For example, if salt cake, a by-product from some of our recycling operations,
32
Table of Contents
were to become classified as a hazardous waste in the United States, the costs to manage and dispose of it would increase and could result in significant increased expenditures.
We could experience labor disputes that could disrupt our business.
Approximately 45% of our U.S. employees and substantially all of our non-U.S. employees, located primarily in Europe where union membership is common, are represented by unions or equivalent bodies and are covered by collective bargaining or similar agreements which are subject to periodic renegotiation. Although we believe that we will successfully negotiate new collective bargaining agreements when the current agreements expire, these negotiations may not prove successful, may result in a significant increase in the cost of labor, or may break down and result in the disruption or cessation of our operations.
Labor negotiations may not conclude successfully, and, in that case, work stoppages or labor disturbances may occur. Any such stoppages or disturbances may have a negative impact on our financial condition and results of operations by limiting plant production, sales volumes and profitability.
New governmental regulation relating to greenhouse gas emissions may subject us to significant new costs and restrictions on our operations.
Climate change is receiving increasing attention worldwide. Many scientists, legislators and others attribute climate change to increased levels of greenhouse gases, including carbon dioxide, which has led to significant legislative and regulatory efforts to limit greenhouse gas emissions. There are legislative and regulatory initiatives in various jurisdictions that would regulate greenhouse gas emissions through a cap-and-trade system under which emitters would be required to buy allowances to offset emissions of greenhouse gas. In addition, several states, including states where we have manufacturing plants, are considering various greenhouse gas registration and reduction programs. Certain of our manufacturing plants use significant amounts of energy, including electricity and natural gas, and certain of our plants emit amounts of greenhouse gas above certain minimum thresholds that are likely to be affected by existing proposals. Greenhouse gas regulation could increase the price of the electricity we purchase, increase costs for our use of natural gas, potentially restrict access to or the use of natural gas, require us to purchase allowances to offset our own emissions or result in an overall increase in our costs of raw materials, any one of which could significantly increase our costs, reduce our competitiveness in a global economy or otherwise negatively affect our business, operations or financial results. While future emission regulation appears likely, it is too early to predict how this regulation may affect our business, operations or financial results.
Further aluminum industry consolidation could impact our business.
The aluminum industry has experienced consolidation over the past several years, and there may be further industry consolidation in the future. Although current industry consolidation has not negatively impacted our business, further consolidation in the aluminum industry could possibly have negative impacts that we cannot reliably predict.
The profitability of our scrap-based recycling, rolling and extrusion operations depends, in part, on the availability of an adequate source of supplies.
We depend on scrap for our operations and acquire our scrap inventory from numerous sources. These suppliers generally are not bound by long-term contracts and have no obligation to sell scrap metals to us. In periods of low industry prices, suppliers may elect to hold scrap waiting for
33
Table of Contents
higher prices. In addition, the slowdown in industrial production and consumer consumption in the U.S. during the current economic crisis has reduced and is expected to continue to reduce the supply of scrap metal available to us. If an adequate supply of scrap metal is not available to us, we would be unable to recycle metals at desired volumes and our results of operations and financial condition would be materially and adversely affected.
Our rolled and extrusion operations depend on external suppliers for rolling slab and billet for certain products. The availability of rolling slab and billet is dependent upon a number of factors, including general economic conditions, which can impact the supply of available rolling slab and billet, and LME pricing, where lower LME prices may cause certain rolling slab and billet producers to curtail production. If rolling slab and billet are less available, our margins could be impacted by higher premiums that we may not be able to pass along to our customers or we may not be able to meet the volume requirements of our customers, which may cause sales losses or result in damage claims from our customers. We maintain long-term contracts for certain volumes of our rolling slab and billet requirements, for the remainder we depend on annual and spot purchases. If we enter into a period of persistent short supply, we could incur significant capital expenditures to internally produce 100% of our rolling slab and billet requirements.
Our operations present significant risk of injury or death. We may be subject to claims that are not covered by or exceed our insurance.
Because of the heavy industrial activities conducted at our facilities, there exists a risk of injury or death to our employees or other visitors, notwithstanding the safety precautions we take. Our operations are subject to regulation by various federal, state and local agencies responsible for employee health and safety, including the Occupational Safety and Health Administration, which has from time to time levied fines against us for certain isolated incidents. While we have in place policies to minimize such risks, we may nevertheless be unable to avoid material liabilities for any employee death or injury that may occur in the future. These types of incidents may not be covered by or may exceed our insurance coverage and may have a material adverse effect on our results of operations and financial condition.
New derivatives legislation could have an adverse impact on our ability to hedge risks associated with our business and on the cost of our hedging activities.
We use over-the-counter (“OTC”) derivatives products to hedge our metal commodity risks and, historically, our interest rate and currency risks. Legislation has been adopted to increase the regulatory oversight of the OTC derivatives markets and impose restrictions on certain derivative transactions, which could affect the use of derivatives in hedging transactions. Final regulations pursuant to this legislation defining which companies will be subject to the legislation have not yet been adopted. If future regulations subject us to additional capital or margin requirements or other restrictions on our trading and commodity positions, they could have an adverse effect on our ability to hedge risks associated with our business and on the cost of our hedging activities.
Risks related to our indebtedness
Our substantial leverage and debt service obligations could adversely affect our financial condition and restrict our operating flexibility.
We have substantial consolidated debt and, as a result, significant debt service obligations. As of December 31, 2011, our total consolidated indebtedness was $602.0 million, excluding $39.1 million of outstanding letters of credit. We also would have had the ability to borrow up to
34
Table of Contents
$389.8 million under the ABL Facility. The China Joint Venture, which is an unrestricted subsidiary under the indenture governing the Senior Notes, has the ability to borrow up to approximately $223.6 million (on a U.S. dollar equivalent, subject to exchange rate fluctuations) under the non-recourse China Loan Facility. Our substantial level of debt and debt service obligations could have important consequences including the following:
| • | making it more difficult for us to satisfy our obligations with respect to our indebtedness, which could result in an event of default under the indenture governing the Senior Notes and the agreements governing our other indebtedness; |
| • | limiting our ability to obtain additional financing on satisfactory terms to fund our working capital requirements, capital expenditures, acquisitions, investments, debt service requirements and other general corporate requirements; |
| • | increasing our vulnerability to general economic downturns, competition and industry conditions, which could place us at a competitive disadvantage compared to our competitors that are less leveraged and therefore we may be unable to take advantage of opportunities that our leverage prevents us from exploiting; |
| • | exposing our cash flows to changes in floating rates of interest such that an increase in floating rates could negatively impact our cash flows; |
| • | imposing additional restrictions on the manner in which we conduct our business under financing documents, including restrictions on our ability to pay dividends, make investments, incur additional debt and sell assets; and |
| • | reducing the availability of our cash flows to fund our working capital requirements, capital expenditures, acquisitions, investments, other debt obligations and other general corporate requirements, because we will be required to use a substantial portion of our cash flows to service debt obligations. |
The occurrence of any one of these events could have an adverse effect on our business, financial condition, results of operations, prospects and ability to satisfy our obligations under our indebtedness.
Despite current indebtedness levels, we and our subsidiaries may still be able to incur substantially more debt. This could further exacerbate the risks associated with our substantial leverage.
We and our subsidiaries may be able to incur substantial additional indebtedness, including secured indebtedness, in the future. Although the indenture governing the Senior Notes and the ABL Facility contain restrictions on the incurrence of additional indebtedness, these restrictions are subject to a number of significant qualifications and exceptions, and any indebtedness incurred in compliance with these restrictions could be substantial. Our ability to borrow under the ABL Facility will remain limited by the amount of the borrowing base. In addition, the ABL Facility and the Senior Notes allow us to incur a significant amount of indebtedness in connection with acquisitions and a significant amount of purchase money debt. If new debt is added to our and our subsidiaries’ current debt levels, the related risks that we and they face would be increased.
35
Table of Contents
Covenant restrictions under our indebtedness may limit our ability to operate our business and, in such event, we may not have sufficient assets to pay amounts due under our indebtedness.
The terms of the ABL Facility and the outstanding Senior Notes restrict Aleris International and its subsidiaries from taking various actions such as incurring additional debt under certain circumstances, paying dividends, making investments, entering into transactions with affiliates, merging or consolidating with other entities and selling all or substantially all of our assets. In addition, under certain circumstances, the ABL Facility requires Aleris International to comply with a minimum fixed charge coverage ratio and may require us to reduce our debt or take other actions in order to comply with this ratio. These restrictions could limit our ability to obtain future financings, make needed capital expenditures, withstand future downturns in our business or the economy in general or otherwise conduct necessary corporate activities. We may also be prevented from taking advantage of business opportunities that arise because of limitations imposed on us by the restrictive covenants under the ABL Facility and the outstanding Senior Notes. A breach of any of these provisions could result in a default under the ABL Facility or the outstanding Senior Notes, as the case may be, that would allow lenders or noteholders to declare our outstanding debt immediately due and payable. If we are unable to pay those amounts because we do not have sufficient cash on hand or are unable to obtain alternative financing on acceptable terms, the lenders or noteholders could initiate a bankruptcy proceeding or, in the case of the ABL Facility, proceed against any assets that serve as collateral to secure such debt.
To service our indebtedness, we will require a significant amount of cash. Our ability to generate cash depends on many factors beyond our control, and any failure to meet our debt service obligations could harm our business, financial condition and results of operations.
Our ability to satisfy our debt obligations will primarily depend upon our future operating performance. As a result, prevailing economic conditions and financial, business and other factors, many of which are beyond our control, will affect our ability to make these payments to satisfy our debt obligations. Included in such factors are the requirements, under certain scenarios, of our counterparties that we post cash collateral to maintain our hedging positions. In addition, price declines, by reducing our borrowing base, could limit availability under the ABL Facility and further constrain our liquidity.
If we do not generate sufficient cash flow from operations to satisfy our debt service obligations, including payments on the notes, we may have to undertake alternative financing plans, such as refinancing or restructuring our indebtedness, selling assets, reducing or delaying capital investments or seeking to raise additional capital. Our ability to restructure or refinance our debt will depend on the condition of the capital markets and our financial condition at such time. Any refinancing of our debt could be at higher interest rates and may require us to comply with more onerous covenants, which could further restrict our business operations. The terms of existing or future debt instruments and the indenture governing the outstanding Senior Notes may restrict us from adopting some of these alternatives, which in turn could exacerbate the effects of any failure to generate sufficient cash flow to satisfy our debt service obligations. In addition, any failure to make payments of interest and principal on our outstanding indebtedness on a timely basis would likely result in a reduction of our credit rating, which could harm our ability to incur additional indebtedness on acceptable terms.
Our inability to generate sufficient cash flow to satisfy our debt service obligations, or to refinance our obligations at all or on commercially reasonable terms, would have an adverse
36
Table of Contents
effect, which could be material, on our business, financial condition and results of operations, may restrict our current and future operations, particularly our ability to respond to business changes or to take certain actions, as well as on our ability to satisfy our obligations in respect of the exchange notes.
The terms of the ABL Facility and the indenture governing the outstanding Senior Notes may restrict our current and future operations, particularly our ability to respond to changes in our business or to take certain actions.
The credit agreement governing the ABL Facility and the indenture governing the outstanding Senior Notes contain, and the terms of any future indebtedness would likely contain, a number of restrictive covenants that impose significant operating and financial restrictions, including restrictions on our ability to engage in acts that may be in our best long-term interests. The indenture governing the outstanding Senior Notes and the credit agreements governing the ABL Facility include covenants that, among other things, restrict the ability of Aleris International and its subsidiaries to:
| • | incur additional indebtedness; |
| • | pay dividends on our capital stock and make other restricted payments; |
| • | make investments and acquisitions; |
| • | engage in transactions with our affiliates; |
| • | sell assets; |
| • | merge; and |
| • | create liens. |
In addition, our ability to borrow under the ABL Facility is limited by a borrowing base. See “Description of indebtedness—ABL Facility.” Moreover, the ABL Facility provides discretion to the agent bank acting on behalf of the lenders to impose additional availability and other reserves, which could materially impair the amount of borrowings that would otherwise be available to us. There can be no assurance that the agent bank will not impose such reserves or, were it to do so, that the resulting impact of this action would not materially and adversely impair our liquidity.
A breach of any of the restrictive covenants in the ABL Facility would result in a default thereunder. If any such default occurs, the lenders under the ABL Facility may elect to declare all outstanding borrowings thereunder, together with accrued interest and other fees, to be immediately due and payable, or enforce their security interest, any of which could result in an event of default under the notes. The lenders will also have the right in these circumstances to terminate any commitments they have to provide further borrowings.
The operating and financial restrictions and covenants in these debt agreements and any future financing agreements may adversely affect our ability to finance future operations or capital needs or to engage in other business activities.
Risks related to the Chapter 11 Cases
Our actual financial results may vary significantly from the projections filed with the Bankruptcy Court.
In connection with the disclosure statement and the hearing to consider confirmation of the Plan of Reorganization, Aleris International prepared projected financial information to demonstrate to the Bankruptcy Court the feasibility of its Plan of Reorganization and its ability to continue
37
Table of Contents
operations upon emergence from the Chapter 11 reorganization cases (the “Chapter 11 Cases”). This information was not audited or reviewed by our independent public accountants. These projections were prepared solely for the purpose of the Chapter 11 Cases and not for the purpose of an offering of our common stock and have not been, and will not be, updated on an ongoing basis. These projections are not included in this prospectus and have not been incorporated by reference into this prospectus and should not be relied upon in connection with the offering or sale of our common stock. At the time they were prepared, the projections reflected numerous assumptions concerning our anticipated future performance and with respect to prevailing and anticipated industry and economic conditions that were and remain beyond our control and that may not materialize. Projections are inherently subject to substantial and numerous uncertainties and to a wide variety of significant business, economic and competitive risks and the assumptions underlying the projections and/or valuation estimates may prove to be wrong in material respects. Actual results may vary significantly from those contemplated by the projections. As a result, you should not rely upon these projections in deciding whether to invest in our common stock.
Neither our financial condition nor our results of operations covering periods after the Emergence Date will be comparable to the financial condition or results of operations reflected in our historical financial statements covering periods before the Emergence Date.
As of the date of Aleris International’s emergence from bankruptcy, we have adopted fresh-start accounting rules as a result of the bankruptcy reorganization as prescribed in accordance with the Reorganizations topic of the FASB Accounting Standards Codification and the Hierarchy of Generally Accepted Accounting Principles (“GAAP”). As required by fresh-start accounting, assets and liabilities have been recorded at fair value, based on values determined in connection with the implementation of Aleris International’s Plan of Reorganization. Accordingly, our consolidated financial condition and results of operations from and after emergence from Chapter 11 will not be comparable to the financial condition or results of operations reflected in the historical financial statements included elsewhere in this prospectus.
Further, during the course of the Chapter 11 Cases, our financial results were volatile as asset impairments, government regulations, bankruptcy professional fees, contract terminations and rejections and claims assessments, among other things, significantly impacted our consolidated financial statements. As a result, the amounts reported in our financial statements after emergence from Chapter 11 will materially differ from the historical financial statements included elsewhere in this prospectus.
When Aleris International emerged from bankruptcy protection, the emergence was structured as an asset acquisition. Although we expect the asset acquisition to be treated as a taxable transaction, there is no assurance that the IRS would not take a contrary position. Were the transfer of assets to the Company determined to constitute a tax-free reorganization, the Company’s consolidated group would carry over the tax attributes of Old AII, Inc. and its subsidiaries (including tax basis in assets), subject to the required attribute reduction attributable to the substantial cancellation of debt incurred and other applicable limitations. The required attribute reduction would be expected to leave the Company’s consolidated group with little or no net operating loss carryforwards and with a significantly diminished tax basis in its assets (with the result that the Company’s consolidated group could have increased taxable income over time, as such assets are sold or would otherwise be depreciated or amortized).
38
Table of Contents
We may be subject to claims that were not discharged in the Chapter 11 Cases, which could have a material adverse effect on our results of operations and profitability.
Substantially all claims that arose prior to the date of the Aleris International bankruptcy filing were resolved during the Chapter 11 Cases. Subject to certain exceptions (such as certain employee and customer claims), all claims against and interests in the debtors that arose prior to the initiation of the Chapter 11 Cases (1) are subject to compromise and/or treatment under the Plan of Reorganization and (2) were discharged, in accordance with and subject to the Bankruptcy Code and the terms of the Plan of Reorganization. Pursuant to the terms of the Plan of Reorganization, the provisions of the Plan of Reorganization constitute a good faith compromise or settlement of all such claims. The entry of the order confirming the Plan of Reorganization constituted the Bankruptcy Court’s approval of the compromise or settlement arrived at with respect to all such claims. Circumstances in which claims and other obligations that arose prior to our bankruptcy filing may not have been discharged include instances where a claimant had inadequate notice of the bankruptcy filing or a valid argument as to when its claim arose as a matter of law or otherwise.
We cannot be certain that the Chapter 11 Cases will not adversely affect our operations going forward.
Although Aleris International emerged from bankruptcy upon consummation of the Plan of Reorganization on June 1, 2010, we cannot assure you that having been subject to bankruptcy protection will not adversely affect our operations going forward, including our ability to negotiate favorable terms from suppliers, hedging counterparties and others and to attract and retain customers. The failure to obtain such favorable terms and attract and retain customers could adversely affect our financial performance.
Risks related to an investment in our common stock and this offering
An active, liquid trading market for our common stock may not develop.
Prior to this offering, there has not been a public market for our common stock. We cannot predict the extent to which investor interest in our company will lead to the development of a trading market on the NYSE or otherwise or how active and liquid that market may become. If an active and liquid trading market does not develop, you may have difficulty selling any of our common stock that you purchase. The initial public offering price for the shares will be determined by negotiations between us and the underwriters and may not be indicative of prices that will prevail in the open market following this offering. The market price of our common stock may decline below the initial offering price, and you may not be able to sell your shares of our common stock at or above the price you paid in this offering, or at all.
The price of our common stock may fluctuate significantly and you could lose all or part of your investment.
Our stock price may be volatile. Volatility in the market price of our common stock may prevent you from being able to sell your common stock at or above the price you paid for your common stock. The market price for our common stock could fluctuate for various reasons, including:
| • | our operating and financial performance and prospects; |
| • | the price outlook for aluminum; |
| • | our quarterly or annual earnings or those of other companies in our industries; |
39
Table of Contents
| • | conditions that impact demand for our products and services; |
| • | future announcements concerning our business or our competitors’ businesses; |
| • | our results of operations that vary from those of our competitors; |
| • | the public’s reaction to our press releases, other public announcements and filings with the United States Securities and Exchange Commission (the “SEC”); |
| • | changes in earnings estimates or recommendations by securities analysts who track our common stock; |
| • | market and industry perception of our success, or lack thereof, in pursuing our growth strategy; |
| • | strategic actions by us or our competitors, such as acquisitions or restructurings; |
| • | changes in government and environmental regulation; |
| • | changes in accounting standards, policies, guidance, interpretations or principles; |
| • | arrival and departure of key personnel; |
| • | the number of shares to be publicly traded after this offering; |
| • | sales of common stock by us, the Investors, members of our management team or other holders; |
| • | adverse resolution of new or pending litigation against us; |
| • | any announcements by third parties of significant claims or proceedings against us; |
| • | changes in general market, economic and political conditions and their effects on global economies or financial markets, including those resulting from natural disasters, terrorist attacks, acts of war and responses to such events; and |
| • | any material weakness in our internal control over financial reporting. |
Furthermore, in recent years the stock market has experienced significant price and volume fluctuations. This volatility has had a significant impact on the market price of securities issued by many companies, including companies in our industry. The changes frequently appear to occur without regard to the operating performance of the affected companies. Hence, the price of our common stock could fluctuate based upon factors that have little or nothing to do with us, and these fluctuations could materially reduce our share price and materially affect the value of your investment.
You will incur immediate and substantial dilution in the net tangible book value of the shares you purchase in this offering.
Prior investors have paid substantially less per share for our common stock than the price in this offering. The initial public offering price of our common stock is substantially higher than the net tangible book value per share of our outstanding common stock prior to completion of the offering. Accordingly, based on an initial public offering price of $ per share (the midpoint of the range set forth on the cover page of this prospectus), if you purchase our common stock in
40
Table of Contents
this offering, you will pay more for your shares than the amounts paid by our existing shareholders for their shares and you will suffer immediate dilution of approximately $ per share in net tangible book value of the common stock. See “Dilution.”
Certain of our stockholders each beneficially own a substantial amount of our common stock and will continue to have substantial control over us after this offering and their interests may conflict with or differ from your interests as a stockholder
When this offering is completed, the Oaktree Funds, Apollo Funds and Sankaty Funds each will beneficially own approximately %, % and % of our common stock, respectively ( %, % and % if the overallotment option is exercised in full). In addition, five of our directors were designated by the Oaktree Funds pursuant to an existing stockholders agreement between the Company, the Investors and other individual investors (the “Stockholders Agreement”). Although the Stockholders Agreement will terminate upon consummation of this offering, we expect that the five Oaktree Funds designated directors will remain on the Board. As a result, the Oaktree Funds, Apollo Funds and Sankaty Funds will be able to exert a significant degree of influence or actual control over our management and affairs and over matters requiring stockholder approval, including the election of directors, a merger, consolidation or sale of all or substantially all of our assets and other significant business or corporate transactions. These stockholders may have interests that are different from yours and may vote in a way with which you disagree and which may be adverse to your interests. In addition, this concentration of ownership could have the effect of delaying or preventing a change in control or otherwise discouraging a potential acquirer from attempting to obtain control of us, which could cause the market price of our common stock to decline or prevent our stockholders from realizing a premium over the market price for their common stock.
Additionally, the Oaktree Funds, Apollo Funds and Sankaty Funds are in the business of making investments in companies and may acquire and hold interests in businesses that compete directly or indirectly with us. One or more of the Investors may also pursue acquisition opportunities that may be complementary to our business and, as a result, those acquisition opportunities may not be available to us. Our amended and restated certificate of incorporation will provide that no officer or director of us who is also an officer, director, employee, managing director or other affiliate of the Oaktree Funds will be liable to us or our stockholders for breach of any fiduciary duty by reason of the fact that any such individual directs a corporate opportunity to the Oaktree Funds instead of us, or does not communicate information regarding a corporate opportunity to us that the officer, director, employee, managing director or other affiliate has directed to the Oaktree Funds.
The Investors will realize substantial benefits from the sale of their shares in this offering. As restrictions on resale end or if the Investors exercise their registration rights, a significant number of shares could become eligible for resale following this offering. As a result, the market price of our stock could decline if the Investors sell their shares or are perceived by the market as intending to sell them. See—“Future sales or the possibility of future sales of a substantial amount of our common stock may depress the price of shares of our common stock,” “Description of capital stock—Registration rights agreement” and “Shares eligible for future sale.”
41
Table of Contents
Future sales or the possibility of future sales of a substantial amount of our common stock may depress the price of shares of our common stock.
Future sales or the availability for sale of substantial amounts of our common stock in the public market could adversely affect the prevailing market price of our common stock and could impair our ability to raise capital through future sales of equity securities.
Our amended and restated certificate of incorporation will authorize us to issue shares of common stock, of which shares will be outstanding upon consummation of this offering. This number includes shares that we are selling in this offering, which will be freely transferable without restriction or further registration under the Securities Act of 1933, as amended, which we refer to throughout this prospectus as the Securities Act. The remaining shares of our common stock outstanding, including the shares of common stock owned by the selling stockholders, certain of our existing stockholders and our executive officers and directors will be restricted from immediate resale under the federal securities laws and the lock-up agreements between our current stockholders and the underwriters, but may be sold in the near future. See “Underwriting.” Following the expiration of the applicable lock-up period, all these shares of our common stock will be eligible for resale under Rule 144 or Rule 701 of the Securities Act, subject to volume limitations and applicable holding period requirements. In addition, the Investors will have the ability to cause us to register the resale of their shares. See “Shares eligible for future sale” for a discussion of the shares of our common stock that may be sold into the public market in the future.
We may issue shares of our common stock or other securities from time to time as consideration for future acquisitions and investments. If any such acquisition or investment is significant, the number of shares of our common stock, or the number or aggregate principal amount, as the case may be, of other securities that we may issue may in turn be substantial. We may also grant registration rights covering those shares of our common stock or other securities in connection with any such acquisitions and investments.
Upon consummation of this offering, we will also have options to purchase shares of our common stock, restricted stock units and shares of restricted stock outstanding. Following this offering, we intend to file a registration statement on Form S-8 covering up to million shares in connection with our employee benefit plans, including the stock options, restricted stock units and restricted stock referred to above.
We cannot predict the size of future issuances of our common stock or the effect, if any, that future issuances and sales of our common stock will have on the market price of our common stock. Sales of substantial amounts of our common stock (including shares of our common stock issued in connection with an acquisition), or the perception that such sales could occur, may adversely affect prevailing market prices for our common stock.
Because we currently have no plans to pay regular dividends on our common stock for the foreseeable future, you may not receive any return on your investment unless you sell your common stock for a price greater than that which you paid for it.
We have no plans to pay regular dividends on our common stock. Any declaration and payment of future dividends to holders of our common stock may be limited by restrictive covenants in our debt agreements, and will be at the sole discretion of our board of directors and will depend on many factors, including our financial condition, earnings, capital requirements, level of indebtedness, cash flows, statutory and contractual restrictions applying to the payment of
42
Table of Contents
dividends and other considerations that our board of directors deems relevant. In addition, the agreements governing our current and future indebtedness may restrict our ability to pay dividends on our common stock. As a result, you may not receive any return on your investment unless you sell your common stock for a price greater than that which you paid for it.
Delaware law and our organizational documents may impede or discourage a takeover, which could deprive our investors of the opportunity to receive a premium for their shares.
We are a Delaware corporation, and the anti-takeover provisions of the Delaware law impose various impediments to the ability of a third party to acquire control of us, even if a change of control would be beneficial to our existing stockholders. In addition, provisions of our amended and restated certificate of incorporation and bylaws may make it more difficult for, or prevent a third party from, acquiring control of us without the approval of our Board of Directors. These provisions include:
| • | the ability of our Board of Directors to designate one or more series of preferred stock and issue shares of preferred stock without stockholder approval; |
| • | a classified board of directors; |
| • | actions by stockholders may not be taken by written consent; |
| • | the sole power of a majority of the Board of Directors to fix the number of directors; |
| • | limitations on the removal of directors; |
| • | the sole power of our Board of Directors to fill any vacancy on our board, whether such vacancy occurs as a result of an increase in the number of directors or otherwise; |
| • | the affirmative supermajority vote of our stockholders to amend our certificate of incorporation and bylaws; |
| • | advance notice requirements for nominating directors or introducing other business to be conducted at stockholder meetings; and |
| • | the inability of stockholders to call special meetings. |
The foregoing factors, as well as the significant common stock ownership by the Investors, and certain covenant restrictions under our indebtedness could impede a merger, takeover or other business combination or discourage a potential investor from making a tender offer for our common stock, which, under certain circumstances, could reduce the market value of our common stock. See “Description of capital stock.”
We may issue shares of preferred stock in the future, which could make it difficult for another company to acquire us or could otherwise adversely affect holders of our common stock, which could depress the price of our common stock.
Our amended and restated certificate of incorporation will authorize us to issue up to million shares of one or more series of preferred stock. Our Board of Directors will have the authority to determine the preferences, limitations and relative rights of shares of preferred stock and to fix the number of shares constituting any series and the designation of such series, without any further vote or action by our stockholders. Our preferred stock could be issued with voting, liquidation, dividend and other rights superior to the rights of our common stock. The
43
Table of Contents
potential issuance of preferred stock may delay or prevent a change in control of us, discouraging bids for our common stock at a premium over the market price, and materially and adversely affect the market price and the voting and other rights of the holders of our common stock.
We are a holding company and rely on dividends and other payments, advances and transfers of funds from our subsidiaries to meet our obligations.
We have no direct operations and no significant assets other than ownership of 100% of the stock of Aleris International and its subsidiaries. Because we conduct our operations through our subsidiaries, we depend on those entities for dividends and other payments to generate the funds necessary to meet any financial obligations, and to pay any dividends with respect to our common stock. Legal and contractual restrictions in credit facilities and other agreements governing current and future indebtedness of our subsidiaries, as well as the financial condition and operating requirements of our subsidiaries, may limit our ability to obtain cash from our subsidiaries. The earnings from, or other available assets of, our subsidiaries may not be sufficient to pay dividends or make distributions or loans to enable us to pay any dividends on our common stock.
If securities analysts do not publish research or reports about our company, or if they issue unfavorable commentary about us or our industry or downgrade our common stock, the price of our common stock could decline.
The trading market for our common stock will depend in part on the research and reports that third-party securities analysts publish about our company and our industry. One or more analysts could downgrade our common stock or issue other negative commentary about our company or our industry. In addition, we may be unable or slow to attract research coverage. Alternatively, if one or more of these analysts cease coverage of our company, we could lose visibility in the market. As a result of one or more of these factors, the trading price of our common stock could decline.
The requirements of being a public company may strain our resources, divert management’s attention and affect our ability to attract and retain qualified board members.
As a public company, we will incur significant legal, accounting and other expenses that we have not incurred as a private company, including costs associated with public company reporting requirements. We also have incurred and will incur costs associated with the Sarbanes-Oxley Act of 2002, as amended, the Dodd-Frank Wall Street Reform and Consumer Protection Act and related rules implemented or to be implemented by the SEC and the NYSE. The expenses incurred by public companies generally for reporting and corporate governance purposes have been increasing. We expect these rules and regulations to increase our legal and financial compliance costs and to make some activities more time-consuming and costly, although we are currently unable to estimate these costs with any degree of certainty. These laws and regulations could also make it more difficult or costly for us to obtain certain types of insurance, including director and officer liability insurance, and we may be forced to accept reduced policy limits and coverage or incur substantially higher costs to obtain the same or similar coverage. These laws and regulations could also make it more difficult for us to attract and retain qualified persons to serve on our board of directors, our board committees or as our executive officers and may divert management’s attention. Furthermore, if we are unable to satisfy our obligations as a public company, we could be subject to delisting of our common stock, fines, sanctions and other regulatory action and potentially civil litigation.
44
Table of Contents
Compliance with the Sarbanes-Oxley Act will require substantial financial and management resources and may increase the time and costs of completing an acquisition.
Section 404 of the Sarbanes-Oxley Act requires that we evaluate and report on our system of internal controls and requires that we have such system of internal controls audited beginning with our annual report on Form 10-K for the fiscal year ending December 31, 2013. If we fail to maintain the adequacy of our internal controls, we could be subject to regulatory scrutiny, civil or criminal penalties and/or stockholder litigation. Any inability to provide reliable financial reports could harm our business.
45
Table of Contents
This prospectus contains forward-looking statements that are based on current expectations, estimates, forecasts and projections about us and the industry in which we operate and beliefs and assumptions made by our management. Forward-looking statements should be read in conjunction with the cautionary statements and other important factors included in this prospectus under “Prospectus summary,” “Risk factors,” “Management’s discussion and analysis of financial condition and results of operations” and “Business,” which include descriptions of important factors which could cause actual results to differ materially from those contained in the forward-looking statements. Our expectations, beliefs and projections are expressed in good faith, and we believe we have a reasonable basis to make these statements through our management’s examination of historical operating trends, data contained in our records and other data available from third parties, but there can be no assurance that our management’s expectations, beliefs or projections will result or be achieved.
The discussions of our financial condition and results of operations may include various forward-looking statements about future costs and prices of commodities, production volumes, industry trends, demand for our products and services and projected results of operations. Statements contained in this prospectus that are not historical in nature are considered to be forward-looking statements. They include statements regarding our expectations, hopes, beliefs, estimates, intentions or strategies regarding the future. The words “believe,” “expect,” “anticipate,” “intend,” “estimate,” “will,” “look forward to” and similar expressions are intended to identify forward-looking statements.
The forward-looking statements set forth in this prospectus regarding, among other things, achievement of production efficiencies, capacity expansions, estimates of volumes, revenues, profitability and net income in future quarters, future prices and demand for our products, and estimated cash flows and sufficiency of cash flows to fund capital expenditures, reflect only our expectations regarding these matters. Important factors that could cause actual results to differ materially from the forward-looking statements include, but are not limited to:
| • | our ability to successfully implement our business strategy; |
| • | the cyclical nature of the aluminum industry, our end-use segments and our customers’ industries; |
| • | our ability to fulfill our substantial capital investment requirements; |
| • | variability in general economic conditions on a global or regional basis; |
| • | our ability to retain the services of certain members of our management; |
| • | our ability to enter into effective aluminum, natural gas and other commodity derivatives or arrangements with customers to manage effectively our exposure to commodity price fluctuations and changes in the pricing of metals; |
| • | our internal controls over financial reporting and our disclosure controls and procedures may not prevent all possible errors that could occur; |
| • | increases in the cost of raw materials and energy; |
| • | the loss of order volumes from any of our largest customers; |
46
Table of Contents
| • | our ability to retain customers, a substantial number of whom do not have long-term contractual arrangements with us; |
| • | our ability to generate sufficient cash flows to fund our capital expenditure requirements and to meet our debt service obligations; |
| • | competitor pricing activity, competition of aluminum with alternative materials and the general impact of competition in the industry segments we serve; |
| • | risks of investing in and conducting operations on a global basis, including political, social, economic, currency and regulatory factors; |
| • | current environmental liabilities and the cost of compliance with and liabilities under health and safety laws; |
| • | labor relations (i.e., disruptions, strikes or work stoppages) and labor costs; |
| • | our levels of indebtedness and debt service obligations; |
| • | the possibility that we may incur additional indebtedness in the future; and |
| • | limitations on operating our business as a result of covenant restrictions under our indebtedness. |
Additional risks, uncertainties and other factors that may cause our actual results, performance or achievements to be different from those expressed or implied in our written or oral forward-looking statements may be found under “Risk factors” contained in this prospectus.
These factors and other risk factors disclosed in this prospectus and elsewhere are not necessarily all of the important factors that could cause our actual results to differ materially from those expressed in any of our forward-looking statements. Other unknown or unpredictable factors could also harm our results. Consequently, there can be no assurance that the actual results or developments anticipated by us will be realized or, even if substantially realized, that they will have the expected consequences to, or effects on, us. Given these uncertainties, you are cautioned not to place undue reliance on such forward-looking statements.
The forward-looking statements contained in this prospectus are made only as of the date of this prospectus. Except to the extent required by law, we do not undertake, and specifically decline any obligation, to update any forward-looking statements or to publicly announce the results of any revisions to any of such statements to reflect future events or developments.
47
Table of Contents
We estimate that the net proceeds to us of this offering will be approximately $ million, based upon an assumed initial public offering price of $ per share (the mid-point of the range set forth on the cover page of this prospectus) and after deducting underwriting discounts and commissions and other estimated expenses of the offering payable by us.
We intend to use the net proceeds of this offering for general corporate purposes, including working capital, capital expenditures, financing the construction of the China Joint Venture’s aluminum rolling mill in China and funding acquisition opportunities that may become available to us from time to time. Our management will have broad discretion over the uses of the net proceeds in this offering.
A $1.00 increase or decrease in the assumed initial public offering price of $ per share would increase or decrease, respectively, the proceeds to us from this offering by $ million, assuming the number of shares offered by us, as set forth on the cover page of this prospectus, remains the same, and after deducting underwriting discounts and commissions and estimated expenses payable by us.
We will not receive any of the proceeds from the sale of shares by the selling stockholders.
48
Table of Contents
Following completion of the offering, we do not intend to pay any cash dividends on our common stock for the foreseeable future and instead may retain earnings, if any, for future operation and expansion and debt repayment. Any decision to declare and pay dividends in the future will be made at the discretion of our Board of Directors and will depend on, among other things, our results of operations, cash requirements, financial condition, contractual restrictions and other factors that our Board of Directors may deem relevant. Because we conduct our operations through our subsidiaries, we depend on those entities for dividends and other payments to generate the funds necessary to meet any financial obligations, and to pay any dividends with respect to our common stock. Aleris International’s ability to pay dividends is limited by covenants in the ABL Facility and in the indenture governing the Senior Notes. See “Risk factors—We are a holding company and rely on dividends and other payments, advances and transfers of funds from our subsidiaries to meet our obligations” and “Description of indebtedness” for limitations on our ability to pay dividends.
On February 10, 2011, June 15, 2011 and October 19, 2011, the Boards of Directors of Aleris International and Aleris Corporation declared cash dividends of approximately $300.0 million, $100.0 million and $100.0 million, respectively, which were paid to us as cash dividends by Aleris International and which we then paid as dividends, pro rata, to our stockholders.
49
Table of Contents
On February 12, 2009, Aleris International, along with certain of its U.S. subsidiaries, filed voluntary petitions for Chapter 11 bankruptcy protection in the United States Bankruptcy Court for the District of Delaware. The bankruptcy filings were the result of a liquidity crisis brought on by the global recession and financial crisis. Aleris International’s ability to respond to the liquidity crisis was constrained by its highly leveraged capital structure, which included at filing $2.7 billion of debt, resulting from the 2006 leveraged buyout of Aleris International. As a result of the severe economic decline, Aleris International experienced sudden and significant volume reductions across each end-use industry it served and a precipitous decline in the LME price of aluminum. These factors reduced the availability of financing under the revolving credit facility and required the posting of cash collateral on aluminum metal hedges. Accordingly, Aleris International sought bankruptcy protection to alleviate liquidity constraints and restructure its operations and financial position.
On February 5, 2010, Aleris International and certain of its U.S. subsidiaries initially filed the Plan of Reorganization and a related disclosure statement with the Bankruptcy Court. Aleris Deutschland Holding GmbH, a wholly owned German subsidiary, also filed a voluntary petition for bankruptcy protection in the Bankruptcy Court. On March 12, 2010, the Bankruptcy Court approved the disclosure statement and authorized Aleris International to begin soliciting votes from its creditors to accept or reject the Plan of Reorganization. On May 13, 2010, the Bankruptcy Court entered an order confirming the Plan of Reorganization, as amended.
The Company was formed in connection with Aleris International’s reorganization to acquire the reorganized business of Aleris International upon its emergence from bankruptcy. Pursuant to the Plan of Reorganization, the entity formerly known as Aleris International, Inc. transferred all of its assets to subsidiaries of Intermediate Co., a newly formed entity that is wholly owned by the Company, and then changed its name to “Old AII, Inc.” and was dissolved. Intermediate Co. was then renamed Aleris International, Inc. and emerged from bankruptcy on June 1, 2010 with sufficient liquidity and a capital structure that allows us to pursue our growth strategy.
At the Emergence Date, Aleris International’s capital structure consisted of the following:
| • | ABL Facility. A senior secured asset-based revolving credit facility in the aggregate principal amount of $500.0 million, which provides for the issuance of up to $75.0 million of letters of credit as well as borrowings on same-day notice, referred to as swingline loans that are available in U.S. dollars, Canadian dollars, Euros, and certain other currencies. See “Description of indebtedness—ABL Facility.” |
| • | 6% senior subordinated exchangeable notes due 2020. $45.0 million aggregate principal amount of Exchangeable Notes issued by Aleris International that bear interest at 6% per annum, mature on June 1, 2020 and are exchangeable into shares of the Company’s common stock at a rate equivalent to 47.20 shares of Company common stock per $1,000 principal amount of Exchangeable Notes (after adjustment for the payments of the 2011 Stockholder Dividends), subject to further adjustment. See “Description of indebtedness—6% Senior Subordinated Exchangeable Notes.” |
| • | Redeemable preferred stock. $5.0 million aggregate liquidation amount ($5.4 million aggregate liquidation amount as of December 31, 2011, after giving effect to the accrual of dividends) of redeemable preferred stock issued by Aleris International. 5,000 shares are authorized and issued. The redeemable preferred stock is subject to mandatory redemption on |
50
Table of Contents
| the fifth anniversary of the Emergence Date, or June 1, 2015, and is exchangeable, at the holder’s option, at any time after June 1, 2013 but prior to redemption, into Company common stock on a current per share dollar exchange ratio of approximately $23.30 per share (rounded for convenience of disclosure and after adjustment for the payments of the 2011 Stockholder Dividends), subject to further adjustment. The redeemable preferred stock can also be exchanged after June 1, 2011 immediately prior to an initial public offering or upon the occurrence of a fundamental change (as defined in the certificate of designations for the redeemable preferred stock) of the Company. |
| • | Common stock. Equity securities issued by Aleris International comprised of 5,000 shares authorized, 100 shares issued to the Company. |
On the Emergence Date, the Company issued 9,828,196 shares of common stock to certain of the Predecessor’s prepetition creditors. Also on the Emergence Date, the Investors entered into an equity commitment agreement pursuant to which they agreed to backstop an equity rights offering by the Company. The Company issued an aggregate of 21,049,175 shares of common stock to the Investors and other rights offering participants pursuant to this arrangement. In addition, on the Emergence Date, the Company issued to certain officers and key employees 28,563 shares of common stock. We also reserved up to 2,928,810 shares (equal to 3,764,557 shares after adjustments to reflect the 2011 Stockholder Dividends) of our common stock for future issuance to our management under our 2010 Equity Incentive Plan.
On the Emergence Date, prepetition equity, debt and certain other obligations of the entity formerly known as Aleris International, Inc. were cancelled, terminated and repaid, as applicable, as follows:
| • | prepetition common and preferred stock were cancelled, and no distributions were made to former stockholders. |
| • | all outstanding obligations (approximately $1.1 billion, net of discounts) under prepetition 9% senior notes, prepetition 9% new senior notes and prepetition 10% senior subordinated notes were cancelled and the indentures governing these obligations were terminated. |
| • | prepetition credit agreements and its debtor-in-possession credit agreement (approximately $575.5 million) were paid in full. |
51
Table of Contents
A simplified overview of our corporate structure is shown in the diagram below. See “Principal and selling stockholders” and “Capitalization.”
| (1) | The ABL Facility is Aleris International’s $600.0 million asset backed revolving credit facility which permits multi-currency borrowings of (a) up to $600.0 million by Aleris International and its U.S. subsidiaries, (b) up to $240.0 million by Aleris Switzerland GmbH, a wholly owned Swiss subsidiary (referred to in this diagram as the Swiss Borrower), and (c) up to $15.0 million by Aleris Specification Alloys Products Canada Company, a wholly owned Canadian subsidiary (referred to in this diagram as the Canadian Borrower). The ABL Facility is secured, subject to certain exceptions, by a first-priority security interest in substantially all of our current assets and related intangible assets located in the U.S., substantially all of the current assets and related intangible assets of substantially all of our wholly owned domestic subsidiaries located in the U.S., substantially all of the current assets and related intangible assets of the Canadian Borrower located in Canada and substantially all of the current assets (other than inventory located outside of the United Kingdom) and related intangible assets of Aleris Recycling (Swansea) Ltd., of Aleris Switzerland GmbH and certain of its subsidiaries. The borrowers’ obligations under the ABL Facility are guaranteed by certain existing and future direct and indirect subsidiaries of Aleris International. See “Description of indebtedness - ABL Facility.” |
| (2) | The $500.0 million aggregate principal amount of 7 5/8% Senior Notes due 2018 issued by Aleris International are guaranteed on a senior unsecured basis by all of Aleris International’s domestic restricted subsidiaries that guarantee its obligations under the ABL Facility. See “Description of indebtedness - 7 5/8% Senior Notes due 2018.” |
| (3) | The Exchangeable Notes issued by Aleris International are not guaranteed by any of its subsidiaries. The Exchangeable Notes are exchangeable for our common stock at the holder’s option upon certain conditions, including the consummation of this initial public offering. For additional terms of the Exchangeable Notes, see “Description of indebtedness - 6% Senior Subordinated Exchangeable Notes.” |
| (4) | Aleris International issued $5.0 million aggregate liquidation amount ($5.4 million aggregate liquidation amount as of December 31, 2011, after giving effect to the accrual of dividends) of redeemable preferred stock upon emergence from |
52
Table of Contents
| bankruptcy. Shares of the redeemable preferred stock are exchangeable for our common stock at the holder’s option upon certain conditions, including the consummation of this initial public offering. For additional terms of the redeemable preferred stock, see “Description of capital stock - Options and exchangeable securities.” |
| (5) | Aleris International’s domestic subsidiaries that guarantee the ABL Facility and the Senior Notes are also borrowers under the ABL Facility. |
| (6) | The China Joint Venture is an unrestricted subsidiary under the indenture governing the Senior Notes and is a party to the non-recourse China Loan Facility. See “Description of indebtedness - China Loan Facility.” |
53
Table of Contents
The following table sets forth our capitalization as of December 31, 2011:
| • | on an actual basis; and |
| • | on an as adjusted basis to give effect to the (1) for 1 stock split that we will effectuate prior to the consummation of this offering and (2) issuance of common stock in this offering and the application of net proceeds to us as described in “Use of proceeds.” |
You should read this table in conjunction with “Prospectus summary—Summary historical consolidated financial and other data,” “Use of proceeds,” “Selected historical financial and operating data,” “Management’s discussion and analysis of financial condition and results of operations” and the consolidated financial statements and the related notes included elsewhere in this prospectus.
| (in millions, except share and per share data) | As of December 31, 2011 | |||||||
| Actual | As adjusted | |||||||
|
|
||||||||
| Cash and cash equivalents |
$ | 231.4 | $ | |||||
|
|
|
|||||||
| Debt: |
||||||||
| ABL Facility(1) |
$ | — | $ | — | ||||
| Senior Notes due 2018, net of discount of $8.8 million(2) |
491.2 | 491.2 | ||||||
| Exchangeable Notes, net of discount of $0.9 million(3) |
44.1 | 44.1 | ||||||
| China Loan Facility, net of discount of $1.0 million(4) |
55.9 | 55.9 | ||||||
| Other(5) |
10.8 | 10.8 | ||||||
|
|
|
|||||||
| Total debt |
$ | 602.0 | $ | 602.0 | ||||
| Redeemable noncontrolling interest |
$ | 5.4 | $ | 5.4 | ||||
| Aleris Corporation equity: |
||||||||
| Common stock: $.01 par value; 45,000,000 authorized shares; 31,031,871 shares issued and outstanding (actual); authorized shares; shares issued and outstanding (as adjusted)(6) |
$ | 0.3 | $ | |||||
| Additional paid-in capital |
563.4 | |||||||
| Retained earnings |
19.7 | |||||||
| Accumulated other comprehensive loss |
(29.0 | ) | ||||||
|
|
|
|||||||
| Total Aleris Corporation equity |
$ | 554.4 | $ | |||||
|
|
|
|||||||
| Total capitalization |
$ | 1,161.8 | $ | |||||
|
|
||||||||
| (1) | The borrowing base available under the ABL Facility as of December 31, 2011 was $389.8 million after consideration that approximately $39.1 million of the borrowing base had been utilized in respect of outstanding letters of credit as of such date. |
| (2) | The Senior Notes were issued by Aleris International and are guaranteed on a senior unsecured basis by all of Aleris International’s domestic restricted subsidiaries that guarantee its obligations under the ABL Facility. See “Description of indebtedness—7 5/8% Senior Notes due 2018.” |
| (3) | The Exchangeable Notes were issued by Aleris International and are not guaranteed by any of its subsidiaries. See “Description of indebtedness—6% Senior Subordinated Exchangeable Notes.” |
| (4) | The China Loan Facility was entered into by the China Joint Venture and is a non-recourse multi-currency secured revolving and term facility with the Bank of China Limited, Zhenjiang Jingkou Sub-Branch. See “Description of indebtedness—China Loan Facility.” |
| (5) | We had $10.8 million of other debt outstanding as of December 31, 2011, primarily consisting of obligations under capital leases and amounts outstanding under the Tianjin revolving credit facility; includes current portion of $6.9 million. |
54
Table of Contents
| (6) | Excludes as of March 7, 2012 (1) 4,660,474 shares of common stock authorized for issuance as equity awards under our equity incentive plan, of which 3,000,062 shares are issuable pursuant to outstanding options (1,234,950 shares of which are exercisable), 211,700 shares are issuable pursuant to outstanding restricted stock units and 20,000 shares of restricted stock, (2) shares of our common stock that would be issuable upon the exchange of shares of Aleris International’s redeemable preferred stock (subject, pursuant to the terms of the redeemable preferred stock, to anti-dilution adjustments summarized below), and (3) shares of our common stock that would be issuable upon the exchange of Aleris International’s Exchangeable Notes (subject, pursuant to the terms of the Exchangeable Notes, to anti-dilution adjustments summarized below). The redeemable preferred stock and the Exchangeable Notes are subject to customary anti-dilution provisions which adjust the number of shares of common stock issuable upon exchange of such securities upon the following events: (i) stock dividends, distributions, splits, subdivisions, combinations or reclassifications; (ii) issuance or sale of shares of common stock or securities convertible into or exchangeable for common stock, without consideration or at a consideration per share that is below market; (iii) other dividends or distributions other than stock; (iv) other similar dilutive events; or (v) extraordinary corporate transactions such as mergers, consolidations, sales of assets, tenders or exchange offers, transactions or events in which all or substantially all of our common stock is converted or exchanged for stock, other securities, cash or assets. Also assumes no exercise by the underwriters of their option to purchase up to shares of common stock from the selling stockholders. |
55
Table of Contents
If you invest in our common stock, your interest will be diluted to the extent of the difference between the initial public offering price per share of our common stock and the net tangible book value per share of our common stock after this offering. Dilution results from the fact that the initial public offering price per share of common stock is substantially in excess of the net tangible book value per share of our common stock attributable to the existing stockholders for our presently outstanding shares of common stock. We calculate net tangible book value per share of our common stock by dividing the net tangible book value (total consolidated tangible assets less total consolidated liabilities) by the number of outstanding shares of our common stock.
Our net tangible book value as of December 31, 2011 was $518.4 million or $16.71 per share of our common stock, based on 31,031,871 shares of our common stock outstanding as of December 31, 2011. Dilution is determined by subtracting net tangible book value per share of our common stock from the assumed initial public offering price per share of our common stock.
Without taking into account any other changes in such net tangible book value after December 31, 2011, after giving effect to the (1) for 1 stock split that we will effectuate prior to the consummation of this offering and (2) sale of shares of our common stock in this offering assuming an initial public offering price of $ per share, less the underwriting discounts and commissions and the estimated offering expenses payable by us, our pro forma as adjusted net tangible book value at December 31, 2011 would have been $ million, or $ per share. This represents an immediate increase in net tangible book value of $ per share of our common stock to the existing stockholders and an immediate dilution in net tangible book value of $ per share of our common stock, to investors purchasing shares of our common stock in this offering. The following table illustrates such dilution per share of our common stock:
| Assumed initial public offering price per share |
$ | |||
| Net tangible book value per share of our common stock as of December 31, 2011 |
$ | 16.71 | ||
| Pro forma net tangible book value per share of our common stock after giving effect to this offering |
||||
| Amount of dilution in net tangible book value per share of our common stock to new investors in this offering |
||||
|
|
||||
A $1.00 increase or decrease in the assumed initial public offering price of $ per share of our common stock would increase or decrease our net tangible book value after giving effect to the offering by $ million, or by $ per share of our common stock, assuming no change to the number of shares of our common stock offered by us as set forth on the cover page of this prospectus, and after deducting the estimated underwriting discounts and estimated expenses payable by us.
56
Table of Contents
The following table summarizes, on a pro forma basis as of December 31, 2011, the total number of shares of our common stock purchased from us, the total cash consideration paid to us and the average price per share of our common stock paid by purchasers of such shares and by new investors purchasing shares of our common stock in this offering.
| Shares of
our common stock purchased |
Total consideration |
Average price per share of our common stock |
||||||||||||||||||
| Number | Percent | Amount | Percent | |||||||||||||||||
|
|
||||||||||||||||||||
| Existing stockholders |
(1 | ) | % | $ | % | $ | ||||||||||||||
| New investors |
(1 | ) | % | % | $ | |||||||||||||||
|
|
|
|||||||||||||||||||
| Total |
% | $ | % | $ | ||||||||||||||||
|
|
||||||||||||||||||||
| (1) | Reflects shares owned by selling stockholders that will be purchased by new investors as a result of this offering. |
To the extent that we grant options to our employees or directors in the future, and those options or existing options are exercised, shares are issued in exchange for Aleris International’s redeemable preferred stock or Exchangeable Notes, or other issuances of shares of our common stock are made, there will be further dilution to new investors. See “Description of capital stock—Options and exchangeable securities.”
57
Table of Contents
Selected historical financial and operating data
The following table sets forth selected historical financial and other operating data of the Company. The selected historical financial data for the year ended December 31, 2011, the seven months ended December 31, 2010, the five months ended May 31, 2010, and the year ended December 31, 2009 and as of December 31, 2011 and 2010 and May 31, 2010 have been derived from our consolidated financial statements included elsewhere in this prospectus. The selected historical consolidated financial data as of December 31, 2009, 2008 and 2007 and for the years ended December 31, 2008 and 2007 have been derived from our consolidated financial statements not included in this prospectus.
The following information should be read in conjunction with, and is qualified by reference to, our “Management’s discussion and analysis of financial condition and results of operations,” our consolidated financial statements, related notes and other financial information included herein.
We were formed in order to acquire the assets and operations of the entity formerly known as Aleris International, Inc. (the “Predecessor”) through the Predecessor’s plan of reorganization and emergence from bankruptcy. Aleris International emerged from bankruptcy on June 1, 2010. Pursuant to the Plan of Reorganization, the Predecessor transferred all of its assets to subsidiaries of Intermediate Co., a newly formed entity that is wholly owned by us. In exchange for the acquired assets, Intermediate Co. contributed shares of our common stock and senior subordinated exchangeable notes to the Predecessor. These instruments were then distributed or sold pursuant to the Plan of Reorganization. The Predecessor then changed its name to “Old AII, Inc.” and was dissolved and Intermediate Co. changed its name to Aleris International, Inc.
We have been considered the “Successor” to the Predecessor by virtue of the fact that our only operations and all of our assets are those of Aleris International, the direct acquirer of the Predecessor. As a result, our financial results are presented alongside those of the Predecessor herein. In accordance with the provisions of Financial Accounting Standards Board Accounting Standards Codification 852, “Reorganizations,” we applied fresh-start accounting upon the emergence and became a new entity for financial reporting purposes as of the Emergence Date. This dramatically impacted 2010 operating results as certain pre-bankruptcy debts were discharged in accordance with the Plan of Reorganization immediately prior to emergence and assets and liabilities were adjusted to their fair values upon emergence. As a result, the financial information of the Successor subsequent to emergence from Chapter 11 is not comparable to that of the Predecessor prior to emergence.
58
Table of Contents
| (Successor) | (Predecessor) | |||||||||||||||||||||||||
| (Dollars and shares in millions (except per share data), metric tons in thousands) |
For the year 2011 |
For the seven 2010 |
For the five 2010 |
For the years ended December 31, |
||||||||||||||||||||||
| 2009 | 2008 | 2007 | ||||||||||||||||||||||||
|
|
|
|
||||||||||||||||||||||||
| Income statement data: |
||||||||||||||||||||||||||
| Revenues |
$ | 4,826.4 | $ | 2,474.1 | $ | 1,643.0 | $ | 2,996.8 | $ | 5,905.7 | $ | 5,989.9 | ||||||||||||||
| Operating income (loss)(a) |
195.8 | 78.5 | 74.4 | (911.0 | ) | (1,661.4 | ) | 26.8 | ||||||||||||||||||
| Income (loss) from continuing operations(a) |
161.2 | 71.4 | 2,204.1 | (1,187.4 | ) | (1,745.2 | ) | (92.9 | ) | |||||||||||||||||
| Net income (loss)(a) |
161.2 | 71.4 | 2,204.1 | (1,187.4 | ) | (1,744.4 | ) | (125.6 | ) | |||||||||||||||||
| Net income (loss) attributable to Aleris Corporation(a) |
161.6 | 71.4 | 2,204.1 | (1,187.4 | ) | (1,744.4 | ) | (125.6 | ) | |||||||||||||||||
| Earnings per share: |
||||||||||||||||||||||||||
| Basic |
$ | 5.20 | $ | 2.28 | ||||||||||||||||||||||
| Diluted |
4.91 | 2.21 | ||||||||||||||||||||||||
| Weighted-average shares outstanding: |
||||||||||||||||||||||||||
| Basic |
31.0 | 30.9 | ||||||||||||||||||||||||
| Diluted |
33.3 | 32.6 | ||||||||||||||||||||||||
| Dividend declared per common share |
$ | 16.0 |
$ | — |
||||||||||||||||||||||
| Pro forma earnings per share(b): |
||||||||||||||||||||||||||
| Basic |
$ | $ | ||||||||||||||||||||||||
| Diluted |
||||||||||||||||||||||||||
| Pro forma weighted-average shares outstanding(b): |
||||||||||||||||||||||||||
| Basic |
||||||||||||||||||||||||||
| Diluted |
||||||||||||||||||||||||||
| Balance sheet data (at end of period): |
||||||||||||||||||||||||||
| Cash and cash equivalents |
$ | 231.4 | $ | 113.5 | $ | 60.2 | $ | 108.9 | $ | 48.5 | $ | 109.9 | ||||||||||||||
| Total assets |
2,037.6 | 1,779.7 | 1,697.6 | 1,580.3 | 2,676.0 | 5,073.3 | ||||||||||||||||||||
| Total debt |
602.0 | 50.4 | 585.1 | 842.7 | 2,600.3 | 2,717.1 | ||||||||||||||||||||
| Redeemable noncontrolling interest |
5.4 | 5.2 | — | — | — | — | ||||||||||||||||||||
| Total Aleris Corporation equity (deficit)(c) |
554.4 | 937.8 | (2,189.4 | ) | (2,180.4 | ) | (1,019.7 | ) | 850.7 | |||||||||||||||||
| Statement of cash flow data: |
||||||||||||||||||||||||||
| Net cash provided (used) by: |
||||||||||||||||||||||||||
| Operating activities |
$ | 266.9 | $ | 119.1 | $ | (174.0 | ) | $ | 56.7 | $ | (60.1 | ) | $ | 307.9 | ||||||||||||
| Investing activities |
(197.3 | ) | (26.2 | ) | (15.7 | ) | (59.8 | ) | 132.5 | (510.6 | ) | |||||||||||||||
| Financing activities |
53.7 | (83.6 | ) | 187.5 | 60.8 | (108.3 | ) | 109.4 | ||||||||||||||||||
| Depreciation and amortization |
70.3 | 38.4 | 20.2 | 168.4 | 225.1 | 203.9 | ||||||||||||||||||||
| Capital expenditures |
(204.6 | ) | (46.5 | ) | (16.0 | ) | (68.6 | ) | (138.1 | ) | (191.8 | ) | ||||||||||||||
| Other data: |
||||||||||||||||||||||||||
| Metric tons invoiced: |
||||||||||||||||||||||||||
| RPNA |
370.5 | 213.8 | 156.8 | 309.4 | 378.9 | 452.2 | ||||||||||||||||||||
| RPEU |
314.4 | 183.8 | 120.2 | 231.8 | 341.6 | 395.8 | ||||||||||||||||||||
| Extrusions |
75.7 | 42.6 | 29.4 | 65.0 | 101.0 | 106.0 | ||||||||||||||||||||
| RSAA |
894.5 | 560.7 | 349.6 | 690.6 | 1,106.5 | 1,354.0 | ||||||||||||||||||||
| RSEU |
387.2 | 220.3 | 152.0 | 310.6 | 372.8 | 374.3 | ||||||||||||||||||||
| Intersegment shipments |
(36.8 | ) | (30.2 | ) | (20.0 | ) | (36.2 | ) | (43.0 | ) | (32.0 | ) | ||||||||||||||
|
|
|
|
|
|||||||||||||||||||||||
| Total metric tons invoiced |
2,005.5 | 1,191.0 | 788.0 | 1,571.2 | 2,257.8 | 2,650.3 | ||||||||||||||||||||
|
|
|
|
||||||||||||||||||||||||
59
Table of Contents
| (a) | Operating income (loss), income (loss) from continuing operations, net income (loss) and net income (loss) attributable to Aleris Corporation include restructuring and impairment charges of $862.9 million and approximately $1.4 billion for the years ended December 31, 2009 and 2008, respectively. See Note 5,“ Restructuring and impairment charges,” to our audited consolidated financial statements included elsewhere in this prospectus for further details. Income (loss) from continuing operations, net income (loss) and net income (loss) attributable to Aleris Corporation also include reorganization gains of approximately $2.2 billion for the five months ended May 31, 2010. See Note 3, “Reorganization under Chapter 11,” and Note 4, “Fresh-start accounting,” to our audited consolidated financial statements included elsewhere in this prospectus. |
| (b) | See Note 20, “Earnings per share,” to our consolidated financial statements included elsewhere in this prospectus for a discussion and further details on the calculation of pro forma earnings per share and pro forma weighted-average shares outstanding. |
| (c) | The Company paid $500.0 million in cash dividends to its stockholders during the year ended December 31, 2011. |
60
Table of Contents
Management’s discussion and analysis of financial
condition and results of operations
The following Management’s discussion and analysis of our financial condition and results of operations (“MD&A”) is intended to help you understand our operations as well as the industry in which we operate. This discussion should be read in conjunction with our audited consolidated financial statements and notes and other financial information appearing elsewhere in this prospectus. Our discussions of our financial condition and results of operations also include various forward-looking statements about our industry, the demand for our products and services and our projected results. These statements are based on certain assumptions that we consider reasonable. For more information about these assumptions and other risks relating to our businesses and our Company, you should refer to “Risk factors.”
Basis of presentation
The financial information included in this prospectus represents our consolidated financial position as of December 31, 2011 and 2010 and our consolidated results of operations and cash flows for the year ended December 31, 2011, the seven months ended December 31, 2010, the five months ended May 31, 2010, and the year ended December 31, 2009. On June 1, 2010, we applied fresh-start accounting upon the Debtors’ (as defined under “Our reorganization,” below) emergence from bankruptcy and became a new entity for financial reporting purposes. See Note 4, “Fresh-start accounting,” to the consolidated financial statements for further details.
Overview
This overview summarizes our MD&A, which includes the following sections:
| • | Our business—a general description of our operations and reorganization, key business strategies, the aluminum industry, our critical measures of financial performance and our business segments; |
| • | Fiscal 2011 summary and outlook for 2012—a discussion of the key financial highlights for 2011, as well as material trends and uncertainties that may impact our business in the future; |
| • | Results of operations—an analysis of our consolidated and segment operating results and production for the years presented in our consolidated financial statements; |
| • | Liquidity and capital resources—an analysis of our cash flows, Adjusted EBITDA, exchange rates, contractual obligations and environmental contingencies, as well as a discussion of our debt facilities; |
| • | Critical accounting estimates—a discussion of the accounting policies that require us to make estimates and judgments; |
| • | Recently issued accounting standards updates—a discussion of the impact of a recently issued accounting standards update that has had an impact on the presentation of our results of operations; and |
| • | Quantitative and qualitative information about market risk—a discussion of our exposures to market risks, including exposures to natural gas, metal, currency, and interest rate fluctuations, as well as our practices to mitigate these exposures. |
61
Table of Contents
Our business
We are a global leader in the manufacture and sale of aluminum rolled and extruded products, aluminum recycling and specification alloy manufacturing with locations in North America, Europe, and China. Our business model strives to reduce the impact of aluminum price fluctuations on our financial results and protect and stabilize our margins, principally through pass-through pricing (market-based aluminum price plus a conversion fee), tolling arrangements (conversion of customer-owned material), and derivative financial instruments. For the year ended December 31, 2011, we generated revenues of $4.8 billion, of which approximately 50% were derived from North America and the remaining 50% were derived from the rest of the world.
We operate 41 production facilities worldwide, with 14 production facilities that provide rolled and extruded aluminum products and 27 recycling and specification alloy manufacturing plants. We are currently constructing our 42nd production facility, a state-of-the-art aluminum rolling mill in China that will produce semi-finished rolled aluminum products, through our 81% owned joint venture, Aleris Dingsheng Aluminum (Zhenjiang) Co. Ltd. (the “China Joint Venture”), that we formed with Zhenjiang Dingsheng Aluminum Industries Joint-Stock Co., Ltd. We possess a combination of low-cost, flexible and technically advanced manufacturing operations supported by an industry-leading research and development platform. Our facilities are strategically located to service our customers, which include a number of the world’s largest companies in the aerospace, automotive and other transportation industries, building and construction, containers and packaging and metal distribution industries.
Aluminum prices are determined by worldwide forces of supply and demand, and, as a result, aluminum prices are volatile. Primary aluminum prices are established on the London Metal Exchange (“LME”). This volatility was exacerbated during the recent global economic downturn. Average LME aluminum prices per ton for the years ended December 31, 2011, 2010 and 2009 were $2,398, $2,172 and $1,664, respectively. After continued high levels of volatility during much of 2009, LME aluminum price volatility moderated during 2010, but has increased again in 2011 reaching a peak of $2,772 per ton on April 28, 2011 and ending the year at $1,971 per ton. For a majority of our businesses, LME aluminum prices serve as the pricing mechanism for both the aluminum we purchase and the products we sell. Aluminum and other metal costs represented in excess of 70% of our costs of sales in 2011. Aluminum prices, plus a conversion charge for alloying and processing, comprise the invoice prices we charge our customers. As a result of utilizing LME aluminum prices to both buy our raw materials and to sell our products, we are able to pass through aluminum price changes in the majority of our commercial transactions. Consequently, while our revenues can fluctuate significantly as LME aluminum prices change, the impact of these price changes on our profitability is limited.
In addition to utilizing LME aluminum prices to establish our invoice prices to customers, we utilize derivative financial instruments to further reduce the impacts of changing aluminum prices. Derivative financial instruments are entered into at the time fixed prices are established for aluminum purchases or sales, on a net basis, and allow us to fix the margin to be realized on our long-term contracts and on short-term contracts where selling prices are not established at the same time as the physical purchase price of aluminum. However, as we have elected not to account for our derivative financial instruments as hedges for accounting purposes, changes in the fair value of our derivative financial instruments are included in our results of operations immediately. These changes in fair value (referred to as “unrealized gains and losses”) can have a significant impact on our pre-tax income in the same way LME aluminum prices can have a
62
Table of Contents
significant impact on our revenues. However, in assessing the performance of our operating segments, we exclude these unrealized gains and losses, electing to include them only at the time of settlement to better match the time at which the underlying physical purchases and sales affect earnings. For additional information on the key factors impacting our profitability, see “Our segments” and “Critical measures of our financial performance,” below.
Our reorganization
On February 12, 2009 (the “Petition Date”), Aleris International and certain of its U.S. subsidiaries (collectively, the “U.S. Debtors”) filed voluntary petitions for Chapter 11 bankruptcy protection in the United States Bankruptcy Court for the District of Delaware. Aleris Deutschland Holding GmbH (“ADH”), a wholly owned German subsidiary, filed a voluntary petition on February 5, 2010. The bankruptcy filings were the result of a liquidity crisis brought on by the global recession and financial crisis. Aleris International’s ability to respond to the liquidity crisis was constrained by its highly leveraged capital structure, which at the Petition Date included $2.7 billion of debt, resulting from its acquisition by Texas Pacific Group (“TPG”). As a result of the severe economic decline, Aleris International experienced sudden and significant volume reductions across each end-use industry we serve and a precipitous decline in the LME price of aluminum. These factors reduced the availability of financing under Aleris International’s revolving credit facility and required the U.S. Debtors to post substantial amounts of cash collateral on its aluminum hedges. Aleris International sought bankruptcy protection to alleviate its liquidity constraints and restructure its operations and financial position.
On June 1, 2010 (the “Emergence Date”), the U.S. Debtors and ADH (collectively, the “Debtors”) consummated the reorganization contemplated by the First Amended Joint Plan of Reorganization as modified (the “Plan of Reorganization”) and emerged from Chapter 11 of the Bankruptcy Code. Pursuant to the Plan of Reorganization, the entity formerly known as Aleris International, Inc. (the “Predecessor”) transferred all of its assets to subsidiaries of Intermediate Co., a newly formed entity wholly owned by us. In exchange for the acquired assets, Intermediate Co. contributed the shares of our common stock it had received in exchange for 100 shares of its common stock as well as $45.0 million of 6% senior subordinated exchangeable notes to the Predecessor. The instruments were then distributed or sold pursuant to the Plan of Reorganization. The Predecessor then changed its name to “Old AII, Inc.” and was dissolved and Intermediate Co. changed its name to Aleris International, Inc.
We have been considered the “Successor” to the Predecessor by virtue of the fact that our only operations and all of our assets are those of Aleris International, Inc., the direct acquirer of the Predecessor. As a result, our financial results are presented alongside those of the Predecessor herein. In accordance with the provisions of Financial Accounting Standards Board Accounting Standards Codification 852, “Reorganizations,” we applied fresh-start accounting upon the emergence and became a new entity for financial reporting purposes as of the Emergence Date. This dramatically impacted 2010 operating results as certain pre-bankruptcy debts were discharged in accordance with the Plan of Reorganization immediately prior to emergence and assets and liabilities were adjusted to their fair values upon emergence. As a result, our financial statements for periods after the Emergence Date are not comparable to the financial statements prior to that date.
63
Table of Contents
The aluminum industry
The overall aluminum industry consists of primary aluminum producers, aluminum casters, extruders and sheet producers and aluminum recyclers. Primary aluminum is commodity traded and priced daily on the LME. Most primary aluminum producers are engaged in the mining of bauxite ore and refining of the ore into alumina. Alumina is then smelted to form aluminum ingots and billets. Ingots and billets are further processed by aluminum sheet manufacturers and extruders to form plate, sheet and foil and extrusions profiles, or they are sold to aluminum traders or to the commodity markets. Aluminum recyclers produce aluminum in molten or ingot form.
We participate in select segments of the aluminum fabricated products industry, including rolled and extruded products; we also recycle aluminum and produce aluminum specification alloys. We do not smelt aluminum, nor do we participate in other upstream activities, including mining bauxite or processing alumina. Our industry is cyclical and is affected by global economic conditions, industry competition and product development. Compared to several substitute metals, aluminum is lightweight, has a high strength-to-weight ratio and is resistant to corrosion. Also, aluminum is somewhat unique in that it can be recycled again and again without any material decline in performance or quality, which delivers both energy and capital investment savings relative to the cost of smelting primary aluminum.
Critical measures of our financial performance
The financial performance of our rolled and extruded products operations and recycling and specification alloy operations are the result of several factors, the most critical of which are as follows:
| • | volumes; |
| • | contribution margins; and |
| • | cash conversion costs. |
The profitability of our businesses is determined, in part, by the volume of metric tons invoiced and processed. Increased production volumes will result in lower per unit costs, while higher invoiced volumes will result in additional revenues and associated margins. In addition to volumes, profitability is dependent upon the difference between the per ton selling price and per ton material cost (including coating and freight costs). We refer to this difference as “contribution margin.” Contribution margins are impacted by several factors, including rolling margins or conversion fees negotiated with our customers, metal price lag, scrap spreads and freight costs. The majority of our rolled and extruded products are priced using a conversion fee-based model, where we charge customers the prevailing market price for the aluminum content of their order plus a fee to convert the aluminum, called the “rolling margin.” The remaining products are sold under short term contracts or under long term contracts using fixed prices for the aluminum content.
Although our conversion fee-based pricing model is designed to reduce the impact of changing primary aluminum prices, we remain susceptible to the impact of these changes on our operating results. This exposure exists because we value our inventories under the first-in, first-out method, which leads to the purchase price of inventory typically impacting our cost of sales in periods subsequent to when the related sales price impacts our revenues. This lag will, generally, increase our earnings in times of rising primary aluminum prices and decrease our earnings in times of declining primary aluminum prices.
64
Table of Contents
Our exposure to changing primary aluminum prices, both in terms of liquidity and operating results, is greater for fixed price sales contracts and other sales contracts where aluminum price changes are not able to be passed along to our customers. In addition, our rolled and extruded products’ operations require that a significant amount of inventory be kept on hand to meet future production requirements. This base level of inventory is also susceptible to changing primary aluminum prices to the extent it is not committed to fixed price sales orders.
In order to reduce these exposures, we focus on reducing working capital and offsetting future physical purchases and sales. We also utilize various derivative financial instruments designed to reduce the impact of changing primary aluminum prices on these net physical purchases and sales and on inventory for which a fixed sale price has not yet been determined. Our risk management practices reduce but do not eliminate our exposure to changing primary aluminum prices and, while we have limited our exposure to unfavorable price changes, we have also limited our ability to benefit from favorable price changes. Further, our counterparties may require that we post cash collateral if the fair value of our derivative liabilities exceed the amount of credit granted by each counterparty, thereby reducing our liquidity. Cash collateral posted against our derivative financial instruments totaled $0.5 million and $3.6 million at December 31, 2011 and December 31, 2010, respectively.
We refer to the difference between the price of primary aluminum included in our revenues and the price of aluminum impacting our cost of sales, net of the impact of our hedging activities, as “metal price lag.” The impact of metal price lag is not significant in our recycling and specification alloy operations as we are able to match physical purchases with physical sales, maintain low levels of inventories and conduct a substantial amount of our business on a toll basis, as discussed below.
Also included in the contribution margin of our rolled products business is the impact of differences between changes in the prices of primary and scrap aluminum, particularly in our Rolled Products North America segment where aluminum scrap is used more frequently than in our European operations. As we price our product using the prevailing price of primary aluminum but purchase large amounts of scrap aluminum to produce our products, we benefit when primary aluminum price increases exceed scrap price increases. Conversely, when scrap price increases exceed primary aluminum price increases, our contribution margin will be negatively impacted. The difference between the price of primary aluminum and scrap prices is referred to as the “scrap spread” and is impacted by the effectiveness of our scrap purchasing activities, the supply of scrap available and movements in the terminal commodity markets.
The contribution margins of our recycling and specification alloy operations are impacted by “metal spreads” which represent the difference between our scrap aluminum purchase prices and our selling prices. While an aluminum commodity market for scrap exists in Europe, there is no comparable market that is widely-utilized commercially in North America. As a result, scrap prices in North America tend to be determined regionally and are significantly impacted by supply and demand. While scrap prices may trend in a similar direction as primary aluminum prices, the extent of price movements is not highly correlated.
Our operations are labor intensive and also require a significant amount of energy (primarily natural gas and electricity) be consumed to melt scrap or primary aluminum and to re-heat and roll aluminum slabs into rolled products. As a result, we incur a significant amount of fixed and variable labor and overhead costs which we refer to as conversion costs. Conversion costs, excluding depreciation expense, or cash conversion costs, on a per ton basis are a critical measure of the effectiveness of our operations.
65
Table of Contents
Revenues and margin percentages for our recycling and specification alloy manufacturing operations are subject to fluctuations based upon the percentage of customer-owned metric tons tolled or processed. Increased processing under such tolling agreements results in lower revenues while not affecting net income and generally also results in higher gross profit margins and net income margins. Tolling agreements subject us to less risk of changing metal prices and reduce our working capital requirements. Although tolling agreements are beneficial to us in these ways, the percentage of our metric tons able to be processed under these agreements is limited by the amount of metal our customers own and their willingness to enter into such arrangements.
Our segments
During the fourth quarter of 2011, we realigned our operating structure into two global business units, Global Rolled and Extruded Products and Global Recycling. This realignment supports our growth strategies and provides the appropriate focus on our global market segments, including aerospace and defense, automotive and heat exchangers, as well as on our regionally based products and customers. Within our two global business units, we now report five operating segments. The segments are based on the organizational structure that we use to evaluate performance, make decisions on resource allocations and perform business reviews of financial results.
Prior to the realignment, the Company operated its business in the following segments: Rolled Products North America; Recycling and Specification Alloys North America; and Europe. After the realignment, the Company’s operating segments (each of which is considered a reportable segment) are:
| • | Rolled Products North America (“RPNA”); |
| • | Rolled Products Europe (“RPEU”); |
| • | Extrusions; |
| • | Recycling and Specification Alloys North America (“RSAA”); and |
| • | Recycling and Specification Alloys Europe (“RSEU”). |
All prior period amounts presented have been restated to conform to the current year presentation of the new reportable segments.
In addition to analyzing our consolidated operating performance based upon revenues and net income (loss) attributable to Aleris Corporation before interest, taxes, depreciation and amortization (“EBITDA”), we measure the performance of our operating segments utilizing segment income and segment Adjusted EBITDA. In the fourth quarter of 2011, the Company changed its definition of segment income to reflect how management currently measures segment performance and to more closely align segment operating performance metrics with the operating performance metrics defined in Aleris International’s $600 million asset backed multi-currency revolving credit facility (the “ABL Facility”). Specifically, segment income now excludes depreciation and amortization, inventory impairment charges, gains and losses on asset sales, and certain other gains and losses. In addition, certain former regional expenses are now considered corporate expenses while others are now considered global functional expenses and allocated to all segments. The prior period amounts presented have been restated to conform to the 2011 presentation. Segment income includes gross profits, segment specific realized gains and losses on derivative financial instruments, segment specific other expense (income) and segment specific selling, general and administrative (“SG&A”) expense and an allocation of
66
Table of Contents
certain regional and global functional SG&A expenses. Segment income excludes provisions for income taxes, restructuring and impairment charges (gains), interest, depreciation and amortization, unrealized and certain realized gains (losses) on derivative financial instruments, corporate general and administrative costs, start-up expenses, gains and losses on asset sales, currency exchange gains (losses) on debt, losses on intercompany receivables, reorganization items, net and certain other gains and losses. Intersegment sales and transfers are recorded at market value. Consolidated cash, long-term debt, net capitalized debt costs, deferred tax assets and assets related to our headquarters offices are not allocated to the segments.
Segment Adjusted EBITDA eliminates from segment income (loss) the impact of recording inventory and other items at fair value through fresh-start and purchase accounting and metal price lag. Segment Adjusted EBITDA is a non-U.S. GAAP financial measure that has limitations as an analytical tool and should not be considered in addition to, or in isolation, or as a substitute for, or as superior to, our measures of financial performance prepared in accordance with GAAP. Management uses segment Adjusted EBITDA in managing and assessing the performance of our business segments and overall business and believes that segment Adjusted EBITDA provides investors and other users of our financial information with additional useful information regarding the ongoing performance of the underlying business activities of our segments, as well as comparisons between our current results and results in prior periods. For additional information regarding non-GAAP financial measures, see “EBITDA and Adjusted EBITDA.”
Rolled Products North America. Our RPNA segment produces rolled products for a wide variety of applications, including building and construction, distribution, transportation, and other uses in the consumer durables general industrial segments. Except for depot sales, which are for standard size products, substantially all of our rolled aluminum products in the United States are manufactured to specific customer requirements, using direct-chill and continuous ingot cast technologies that allow us to use and offer a variety of alloys and products for a number of end-uses. Specifically, those products are integrated into, among other applications, building panels, truck trailers, gutters, appliances, and recreational vehicles.
67
Table of Contents
Segment revenues, segment income and segment Adjusted EBITDA, along with the related reconciliations, are presented below:
| (Successor) | (Predecessor) | |||||||||||||||||
| (in millions) | For the year ended |
For the seven months ended December 31, 2010 |
For the five months ended May 31, 2010 |
For the year ended |
||||||||||||||
| Rolled Products North America |
||||||||||||||||||
| Revenues |
$ | 1,346.4 | $ | 699.4 | $ | 507.2 | $ | 893.6 | ||||||||||
| Segment income |
$ | 111.1 | $ | 44.9 | $ | 49.4 | $ | 89.7 | ||||||||||
| Impact of recording |
— | (2.7 | ) | — | — | |||||||||||||
| (Favorable) unfavorable |
(6.2 | ) | 2.3 | (5.8 | ) | (25.4 | ) | |||||||||||
| Segment Adjusted |
$ | 104.9 | $ | 44.5 | $ | 43.6 | $ | 64.3 | ||||||||||
Rolled Products Europe. Our RPEU segment consists of two rolled aluminum products manufacturing facilities, located in Germany and Belgium. Our RPEU segment produces rolled products for a wide variety of technically sophisticated applications, including aerospace plate and sheet, brazing sheet (clad aluminum material used for, among other applications, vehicle radiators and HVAC systems), automotive sheet, and heat treated plate for engineering uses, as well as for other uses in the transportation, construction, and packaging industries. Substantially all of our rolled aluminum products in Europe are manufactured to specific customer requirements using direct-chill ingot cast technologies that allow us to use and offer a variety of alloys and products for a number of technically demanding end-uses.
Segment revenues, segment income and segment Adjusted EBITDA, along with the related reconciliations, are presented below:
| (Successor) | (Predecessor) | |||||||||||||||||
| (in millions) | For the year ended |
For the seven months ended December 31, 2010 |
For the five months ended May 31, 2010 |
For the year ended |
||||||||||||||
| Rolled Products Europe |
||||||||||||||||||
| Revenues |
$ | 1,541.6 | $ | 763.7 | $ | 464.4 | $ | 936.7 | ||||||||||
| Segment income |
$ | 157.6 | $ | 40.4 | $ | 55.1 | $ | 37.2 | ||||||||||
| Impact of recording |
3.8 | 18.0 | 1.6 | 5.8 | ||||||||||||||
| (Favorable) unfavorable |
(9.9 | ) | 16.6 | (27.3 | ) | (10.4 | ) | |||||||||||
| Segment Adjusted |
$ | 151.5 | $ | 75.0 | $ | 29.4 | $ | 32.6 | ||||||||||
68
Table of Contents
Extrusions. Our Extrusions segment is a leading producer of soft and hard alloy extruded aluminum profiles targeted at high demand end-uses. Our extruded aluminum products are used for the automotive, building and construction, electrical, mechanical engineering and other transportation (rail and shipbuilding) industries. The extruded products business includes five extrusion facilities located in Germany, Belgium and China. Industrial extrusions are made in all locations and the production of extrusion systems, including building systems, is concentrated in Vogt, Germany. Large extrusions and project business serving rail and other transportation sectors are concentrated in Bonn, Germany and Tianjin, China, with rods and hard alloys produced in Duffel, Belgium. The extrusion plant in Bonn operates one of the largest extrusion presses in the world, which is mainly used for long and wide sections for railway, shipbuilding and other applications. In addition, we perform value-added fabrication to most of our extruded products.
Segment revenues, segment income (loss) and segment Adjusted EBITDA, along with the related reconciliations, are presented below:
| (Successor) | (Predecessor) | |||||||||||||||||
| (in millions) | For the year ended |
For the seven months ended December 31, 2010 |
For the five months ended May 31, 2010 |
For the year ended |
||||||||||||||
|
|
||||||||||||||||||
| Extrusions |
||||||||||||||||||
| Revenues |
$ | 410.3 | $ | 214.6 | $ | 132.5 | $ | 342.9 | ||||||||||
| Segment income |
$ | 10.9 | $ | 5.3 | $ | 2.7 | $ | (1.7 | ) | |||||||||
| Impact of recording |
(0.3 | ) | 3.2 | — | 0.2 | |||||||||||||
| (Favorable) |
(2.7 | ) | 1.9 | (1.6 | ) | 2.1 | ||||||||||||
|
|
|
|||||||||||||||||
| Segment Adjusted |
$ | 7.9 | $ | 10.4 | $ | 1.1 | $ | 0.6 | ||||||||||
|
|
||||||||||||||||||
Recycling and Specification Alloys North America. Our RSAA segment includes aluminum melting, processing and recycling activities, as well as our specification alloy manufacturing business, located in North America. This segment’s recycling operations convert scrap and dross (a by-product of melting aluminum) and combine these materials with other alloy agents as needed to produce recycled aluminum generally for customers serving end-uses related to consumer packaging, steel, transportation and construction. The segment’s specification alloy operations combine various aluminum scrap types with hardeners and other additives to produce alloys with chemical compositions and specific properties, including increased strength, formability and wear resistance, as specified by customers for their particular applications. Our specification alloy operations typically deliver recycled and specification alloy products in molten or ingot form to customers principally in the U.S. automotive industry. A significant percentage of this segment’s products are sold through tolling arrangements, in which we convert customer-owned scrap and dross and return the recycled metal in ingot or molten form to our customers for a fee.
69
Table of Contents
Segment revenues, segment income and segment Adjusted EBITDA, along with the related reconciliations, are presented below:
| (Successor) | (Predecessor) | |||||||||||||||||
| (in millions) | For the year ended |
For the seven months ended December 31, 2010 |
For the five months ended May 31, 2010 |
For the year ended |
||||||||||||||
| Recycling and |
||||||||||||||||||
| Revenues |
$ | 983.8 | $ | 540.5 | $ | 373.7 | $ | 564.2 | ||||||||||
| Segment income |
$ | 80.9 | $ | 33.8 | $ | 29.7 | $ | 18.9 | ||||||||||
| Impact of recording |
— | 1.9 | — | — | ||||||||||||||
| Unfavorable metal |
— | — | — | 3.6 | ||||||||||||||
| Segment Adjusted |
$ | 80.9 | $ | 35.7 | $ | 29.7 | $ | 22.5 | ||||||||||
Recycling and Specification Alloys Europe. We are a leading European recycler of aluminum scrap and magnesium through our RSEU segment. Our recycling operations primarily convert aluminum scrap, dross and other alloying agents as needed and deliver the recycled metal and specification alloys in molten or ingot form to our customers. Our European recycling business consists of seven facilities located in Germany, Norway and Wales. Our RSEU segment supplies specification alloys to the European automobile industry and serves other European aluminum industries from its plants. The segment’s specification alloy operations combine various aluminum scrap types with hardeners and other additives to produce alloys with chemical compositions and specific properties, including increased strength, formability and wear resistance, as specified by customers for their particular applications. Our recycling operations typically service other aluminum producers and manufacturers, generally under tolling arrangements, where we convert customer-owned scrap and dross and return the recycled metal to our customers for a fee.
70
Table of Contents
Segment revenues, segment income (loss) and segment Adjusted EBITDA, along with the related reconciliations, are presented below:
| (Successor) | (Predecessor) | |||||||||||||||||
| (in millions) | For the year ended |
For the seven months ended December 31, 2010 |
For the five months ended May 31, 2010 |
For the year ended |
||||||||||||||
| Recycling and Specification Alloys Europe |
||||||||||||||||||
| Revenues |
$ | 685.1 | $ | 332.9 | $ | 214.5 | $ | 353.6 | ||||||||||
| Segment income |
$ | 35.3 | $ | 16.8 | $ | 10.9 | $ | (1.5 | ) | |||||||||
| Impact of recording amounts at fair |
— | 3.9 | — | (3.6 | ) | |||||||||||||
| Unfavorable metal |
— | — | — | 0.7 | ||||||||||||||
| Segment Adjusted EBITDA |
$ | 35.3 | $ | 20.7 | $ | 10.9 | $ | (4.4 | ) | |||||||||
Fiscal 2011 summary
We experienced significant revenue growth in 2011 as compared to 2010 as most of our segments benefited from increased volumes, higher average selling prices, and improved economic conditions. The increase in average selling prices was primarily driven by higher aluminum prices, improved product mix and higher rolling margins. Volume growth, especially in our higher value-added products, including aerospace and other heat treated plate as well as auto body sheet, productivity savings, pricing initiatives, and wider metal and scrap spreads resulted in improved gross profits, segment income and Adjusted EBITDA in 2011.
Listed below are key financial highlights for the year ended December 31, 2011 as compared to 2010:
| • | Revenue for 2011 was approximately $4.8 billion, a 17% increase over 2010. This increase was primarily due to improved volumes, higher LME prices and rolling margins as well as an improved product mix; |
| • | Net income attributable to Aleris Corporation for 2011 was $161.6 million compared to $71.4 million for the seven months ended December 31, 2010 and approximately $2.2 billion for the five months ended May 31, 2010. 2011 net income attributable to Aleris Corporation includes $33.6 million of benefits from deferred income taxes, the majority of which pertains to the reversal of valuation allowances previously recorded against certain deferred tax assets. Net income attributable to Aleris Corporation for the five months ended May 31, 2010 included a gain of approximately $2.2 billion for reorganization items as a result of the bankruptcy proceedings and the effects of fresh-start accounting; |
71
Table of Contents
| • | Adjusted EBITDA increased 26% to $331.6 million, with approximately $28.0 million of positive impact related to volume and mix and $61.0 million attributable to price margin improvements. AOS-related productivity savings were $32.0 million which partially offset a negative impact of $52.0 million in inflation; |
| • | Aleris International issued $500.0 million aggregate principal amount of 7 5/8% senior notes due 2018 (the “Senior Notes”), the proceeds from which were paid as dividends to our stockholders; |
| • | Cash provided by operating activities was $266.9 million in 2011 driven by earnings and working capital productivity; |
| • | Liquidity at December 31, 2011 was $621.2 million, which consisted of $389.8 million of availability under the ABL Facility plus $231.4 million of cash; and |
| • | Capital expenditures increased in 2011 versus the prior year as spending on our growth projects continued to progress as planned. |
After Aleris International’s emergence from bankruptcy, we made strategic commitments to enhance the mix of products we offer to take advantage of growing demand in select segments of the industries we serve, as well as expanding into high-growth regions. We have continued to invest in the following projects throughout 2011:
| • | the formation of the China Joint Venture for the construction of a $350 million state-of-the-art aluminum rolling mill in China; |
| • | the installation of a new $70 million cold rolling mill in Duffel, Belgium to produce wide auto body sheet; |
| • | the installation of a wide coating facility in Ashville, Ohio targeted at reducing our cost structure and increasing our product capabilities; |
| • | investing in our recycling operations to increase operating efficiencies, increase capacities, and scrap processing capabilities; and |
| • | the relocation of an idled extrusion press to China to continue to help meet that country’s growing infrastructure needs. |
Aleris International is an owner in the China Joint Venture and, as a result, the operating results and financial condition of the China Joint Venture have been included in our consolidated financial statements. We anticipate that the capital expenditures for the first phase of the facility will be approximately $350.0 million. Funding of the project will be provided proportionately by Aleris International and its partner and through a $187.0 million (on a U.S. dollar equivalent, subject to exchange rate fluctuations) non-recourse loan from the Bank of China. The project continues to progress as planned, with capital spending totaling $79.5 million in 2011. The first phase of construction of the rolling mill is expected to be completed in the fourth quarter of 2012.
72
Table of Contents
Outlook for 2012
We expect 2012 revenue to continue to grow if demand continues to increase across most of the industries we serve. Specifically, the following factors are anticipated to have a significant impact on our 2012 performance:
| • | According to estimates from CRU, both global primary aluminum consumption and global flat rolled products consumption are expected to grow by approximately 6% in 2012. We expect to continue to position the business to capitalize on the increase in global aluminum demand; |
| • | Demand for our aerospace products, which typically trend with aircraft backlog and build rates, continued to recover in 2011. In 2011, the order backlog of Airbus and Boeing, combined, increased 17% from 7,000 planes to 8,200 planes. In line with this trend, our contracted aerospace volumes for 2012 support increased demand from our customers in 2012 to meet higher build rates associated with growing backlogs; |
| • | LMC Automotive (formerly owned by J.D. Power and Associates) estimates that North American light vehicle production will grow approximately 7% in 2012, while Europe light vehicle production is expected to decline by 7%; |
| • | We are one of the largest suppliers of aluminum sheet to the building and construction industry in North America. According to the National Association of Home Builders, single family housing starts in 2011 were 429,000 and are projected to be 499,000 in 2012; |
| • | Demand for many of our products is impacted by regional economic factors in North America and Europe, including GDP and industrial production. In the second half of 2011, the economic uncertainty created by the European sovereign debt crisis began to impact European GDP and industrial production and the level of demand for our non-global market segment products, including plate and sheet products. We believe our regionally based European plate and sheet products will continue to be negatively impacted at least through the first half of 2012. We expect the regional base North America products to continue to be impacted by the positive trends in U.S. GDP and industrial production; |
| • | While aerospace and automotive trends have been positive, we remain cautious related to Eurozone uncertainty and our results will also largely depend on the continued strength in a U.S. recovery; and |
| • | We have initiated a number of significant capital expenditure programs in order to capture long-term growth in our global market segments as well as in regional product lines. We expect that capital expenditures will be extraordinarily high in 2012 as the majority of spending will occur in China and the Duffel cold mill in preparation for start-up. We expect capital expenditures to be approximately $450 million in 2012. A significant portion of these capital expenditures may be funded in part by capital contributions from the China Joint Venture partner and available funding under non-recourse project financing. |
73
Table of Contents
Results of operations
Year ended December 31, 2011 compared to the seven months ended December 31, 2010 and the five months ended May 31, 2010 and for the seven months ended December 31, 2010 and the five months ended May 31, 2010 compared to the year ended December 31, 2009
Review of consolidated results
Revenues for the year ended December 31, 2011 were approximately $4.8 billion compared to approximately $2.5 billion and $1.6 billion for the seven months ended December 31, 2010 and the five months ended May 31, 2010, respectively. The 17% increase in revenues reflects an 8% increase in volume, excluding the impact of the sale of our Brazilian recycling facility, as most of our segments benefited from improved economic conditions as compared to 2010, as well as an 11% increase in average selling prices driven by higher aluminum prices, improved product mix and higher rolling margins.
The following table presents the estimated impact of key factors that resulted in the 17% increase in our consolidated revenues from 2010:
| RPNA | RPEU | Extrusions | RSAA | RSEU | Consolidated | |||||||||||||||||||
|
|
||||||||||||||||||||||||
| Price |
10 | % | 10 | % | 11 | % | 12 | % | 15 | % | 11% | |||||||||||||
| Volume/Mix |
2 | 12 | 1 | 9 | 5 | 6 | ||||||||||||||||||
| Currency |
— | 4 | 6 | — | 5 | 3 | ||||||||||||||||||
| Sale of Brazil facility |
— | — | — | (13 | ) | — | (3) | |||||||||||||||||
|
|
|
|||||||||||||||||||||||
| Total percentage change |
12 | % | 26 | % | 18 | % | 8 | % | 25 | % | 17% | |||||||||||||
|
|
||||||||||||||||||||||||
Gross profit for the year ended December 31, 2011 was $472.1 million compared to $222.3 million for the seven months ended December 31, 2010 and $187.2 million for the five months ended May 31, 2010. The 2011 results benefited from improved volumes and a more favorable mix of products sold, which increased gross profit by approximately $30.0 million, while higher pricing and wider scrap and metal spreads added an additional $61.0 million. Pricing and spreads improved as a result of price increases implemented by many of our businesses and wider scrap spreads and increased scrap utilization by our rolled products operations. Conversely, 2010 gross profits were reduced by $33.0 million in the seven months ended December 31, 2010 as a result of the adjustment of inventories to fair value upon emergence. Gross profit for the year ended December 31, 2011 was negatively impacted by an estimated $26.3 million of unfavorable metal price lag, excluding $45.2 million of realized gains on aluminum derivative financial instruments, while 2010 gross profit was positively impacted by $19.7 million of favorable metal price lag, excluding $6.0 million of realized losses. Negatively impacting 2011 gross profit was an $11.9 million increase in depreciation expense, primarily associated with capital projects placed into service in 2011. Inflation in energy and other input and personnel costs as well as higher spending for outside processing costs were partially offset by productivity savings generated by our Aleris Operating System (“AOS”) initiatives.
SG&A expenses were $274.3 million for the year ended December 31, 2011 as compared to $140.0 million and $84.2 million for the seven months ended December 31, 2010 and the five months ended May 31, 2010, respectively. The $50.1 million increase was primarily due to an increase in start-up expenses associated with the China Joint Venture, personnel costs, stock-based compensation expense, professional fees, research and development expense as well as a
74
Table of Contents
weakening U.S. dollar. In addition, we terminated our research and development agreement with Tata Steel during the third quarter of 2011 and, as a result, recorded $11.9 million of contract termination costs.
During the year ended December 31, 2011, the seven months ended December 31, 2010 and the five months ended May 31, 2010, we recorded realized (gains) losses of $(37.8) million, $13.6 million and $(10.6) million, respectively, and unrealized losses (gains) of $37.8 million, $(19.8) million and $39.2 million, respectively. Generally, our realized (gains) losses represent the cash paid or received upon settlement of our derivative financial instruments. Unrealized (gains) losses reflect the change in the fair value of derivative financial instruments from the later of the end of the prior period or our entering into the derivative instrument as well as the reversal of previously recorded unrealized (gains) losses for derivatives that settled during the period. Derivative financial instruments are utilized to reduce exposure to fluctuations in commodity prices, including aluminum and natural gas prices. See “Critical measures of our financial performance,” above, and “Quantitative and qualitative disclosures about market risk,” below, for additional information regarding our use of derivative financial instruments.
Our 2011 results also reflect a $34.3 million decrease in interest expense compared to 2010, resulting from lower levels of debt outstanding as a result of Aleris International’s reorganization and emergence from bankruptcy, partially offset by the Senior Notes issuance. Significantly impacting our operating results for the five months ended May 31, 2010 were gains from Aleris International’s reorganization, which totaled $2.2 billion and included the settlement or cancellation of prepetition debts. Other (income) expense, net for the year ended December 31, 2011 improved $31.3 million compared to 2010, primarily due to currency exchange losses recorded in 2010 related to the debtor-in-possession financing obligations, a portion of which were denominated in nonfunctional currencies in both the U.S. and Europe.
We recorded a $4.2 million benefit from income taxes in 2011, primarily as a result of the reversal of valuation allowances against certain deferred tax assets in Europe.
Revenues for the seven months ended December 31, 2010 and the five months ended May 31, 2010 were approximately $2.5 billion and $1.6 billion, respectively, compared to approximately $3.0 billion for the year ended December 31, 2009. Revenues for 2010 increased approximately $1.1 billion, or 37%, from 2009 driven primarily by a 26% increase in volumes and a 31% increase in the average LME aluminum price. We experienced improved demand across all of our operating segments in 2010.
The following table presents the estimated impact of key factors that resulted in the 37% increase in our consolidated revenues from 2009:
| RPNA | RPEU | Extrusions | RSAA | RSEU | Consolidated | |||||||||||||||||||
|
|
||||||||||||||||||||||||
| Price |
17 | % | 7 | % | (3 | )% | 32 | % | 37 | % | 17 | % | ||||||||||||
| Volume/Mix |
18 | 29 | 9 | 30 | 27 | 24 | ||||||||||||||||||
| Currency |
— | (7 | ) | (5 | ) | — | (9 | ) | (4 | ) | ||||||||||||||
|
|
|
|||||||||||||||||||||||
| Total percentage change |
35 | % | 29 | % | 1 | % | 62 | % | 55 | % | 37 | % | ||||||||||||
|
|
||||||||||||||||||||||||
Gross profit for the seven months ended December 31, 2010 and the five months ended May 31, 2010 was approximately $222.3 million and $187.2 million, respectively, compared to $176.4 million for the year ended December 31, 2009, respectively. Gross profit for 2010 increased $233.1 million from 2009 driven by increased volumes, productivity improvements resulting from AOS
75
Table of Contents
and 2009 restructuring initiatives, and the impacts of lower depreciation expense. Increased volumes contributed approximately $82.0 million to the increase in gross profit while productivity initiatives drove significantly lower cash conversion costs in 2010 and increased gross profit by an estimated $77.0 million. Impairments of our long-lived tangible and intangible assets recorded during 2009 resulted in lower depreciation expense in 2010 and increased gross profit by $91.8 million. Partially offsetting these favorable items were decreased benefits from metal price lag, $33.0 million of additional cost of sales resulting from the adjustment of inventories to fair value upon emergence, and the impact of a stronger U.S. dollar.
Our 2010 results were also impacted by gains from Aleris International’s reorganization, which totaled $2.2 billion and included the settlement or cancellation of prepetition debts. Interest expense decreased by $144.8 million from 2009 as a result of our new capital structure subsequent to Aleris International’s emergence from bankruptcy. Other expense increased compared to 2009 as the U.S. dollar strengthened in the five months preceding Aleris International’s emergence, resulting in losses on the translation of our debtor-in-possession financing obligations, a portion of which were denominated in non-functional currencies in both the U.S. and Europe.
76
Table of Contents
The following table presents key financial and operating data on a consolidated basis for the year ended December 31, 2011, the seven months ended December 31, 2010, the five months ended May 31, 2010 and the year ended December 31, 2009:
| (Successor) | (Predecessor) | |||||||||||||||||
| (in millions, except percentages) | For the year ended |
For the seven months ended December 31, 2010 |
For the five months ended May 31, 2010 |
For the year ended |
||||||||||||||
| Revenues |
$ | 4,826.4 | $ | 2,474.1 | $ | 1,643.0 | $ | 2,996.8 | ||||||||||
| Cost of sales |
4,354.3 | 2,251.8 | 1,455.8 | 2,820.4 | ||||||||||||||
| Gross profit |
472.1 | 222.3 | 187.2 | 176.4 | ||||||||||||||
| Gross profit as a percentage of revenues |
9.8% | 9.0% | 11.4% | 5.9% | ||||||||||||||
| Selling, general and administrative expenses |
274.3 | 140.0 | 84.2 | 243.6 | ||||||||||||||
| Restructuring and impairment charges (gains) |
4.4 | 12.1 | (0.4 | ) | 862.9 | |||||||||||||
| (Gains) losses on derivative financial instruments |
— | (6.2 | ) | 28.6 | (17.0 | ) | ||||||||||||
| Other operating (income) expense, net |
(2.4 | ) | (2.1 | ) | 0.4 | (2.1 | ) | |||||||||||
| Operating income (loss) |
195.8 | 78.5 | 74.4 | (911.0 | ) | |||||||||||||
| Interest expense, net |
46.3 | 7.0 | 73.6 | 225.4 | ||||||||||||||
| Reorganization items, net |
(1.3 | ) | 7.4 | (2,227.3 | ) | 123.1 | ||||||||||||
| Other (income) expense, net |
(6.2 | ) | (7.6 | ) | 32.7 | (10.3 | ) | |||||||||||
| Income (loss) before income taxes |
157.0 | 71.7 | 2,195.4 | (1,249.2 | ) | |||||||||||||
| (Benefit from) provision for income taxes |
(4.2 | ) | 0.3 | (8.7 | ) | (61.8 | ) | |||||||||||
| Net income (loss) |
161.2 | 71.4 | 2,204.1 | (1,187.4 | ) | |||||||||||||
| Net loss attributable to noncontrolling interest |
(0.4 | ) | — | — | — | |||||||||||||
| Net income (loss) attributable to Aleris Corporation |
$ | 161.6 | $ | 71.4 | $ | 2,204.1 | $ | (1,187.4 | ) | |||||||||
| Total segment income |
$ | 395.8 | $ | 141.2 | $ | 147.8 | $ | 142.6 | ||||||||||
| Depreciation and amortization |
(70.3 | ) | (38.4 | ) | (20.2 | ) | (168.4 | ) | ||||||||||
| Corporate general and administrative expenses, excluding depreciation and amortization and start-up expenses |
(72.7 | ) | (28.1 | ) | (14.6 | ) | (42.3 | ) | ||||||||||
| Restructuring and impairment (charges) gains |
(4.4 | ) | (12.1 | ) | 0.4 | (862.9 | ) | |||||||||||
| Interest expense, net |
(46.3 | ) | (7.0 | ) | (73.6 | ) | (225.4 | ) | ||||||||||
| Unallocated (losses) gains on derivative financial instruments |
(37.9 | ) | 18.8 | (38.9 | ) | 16.9 | ||||||||||||
| Reorganization items, net |
1.3 | (7.4 | ) | 2,227.3 | (123.1 | ) | ||||||||||||
| Currency exchange (losses) gains on debt |
(1.2 | ) | 3.0 | (32.0 | ) | 14.0 | ||||||||||||
| Start-up expenses |
(10.2 | ) | (2.0 | ) | — | — | ||||||||||||
| Other income (expense), net |
2.9 | 3.7 | (0.8 | ) | (0.6 | ) | ||||||||||||
| Income (loss) before income taxes |
$ | 157.0 | $ | 71.7 | $ | 2,195.4 | $ | (1,249.2 | ) | |||||||||
77
Table of Contents
Revenues and metric tons invoiced
The following tables present revenues and metric tons invoiced by segment:
| (Successor) | (Predecessor) | |||||||||||||||||
| (dollars in millions, metric tons in thousands) |
For the year ended |
For the seven months ended December 31, 2010 |
For the five months ended May 31, 2010 |
For the year ended |
||||||||||||||
| Revenues: |
||||||||||||||||||
| Rolled Products North |
$ | 1,346.4 | $ | 699.4 | $ | 507.2 | $ | 893.6 | ||||||||||
| Rolled Products Europe |
1,541.6 | 763.7 | 464.4 | 936.7 | ||||||||||||||
| Extrusions |
410.3 | 214.6 | 132.5 | 342.9 | ||||||||||||||
| Recycling and Specification Alloys |
983.8 | 540.5 | 373.7 | 564.2 | ||||||||||||||
| Recycling and Specification Alloys |
685.1 | 332.9 | 214.5 | 353.6 | ||||||||||||||
| Intersegment revenues |
(140.8 | ) | (77.0 | ) | (49.3 | ) | (94.2 | ) | ||||||||||
| Consolidated revenues |
$ | 4,826.4 | $ | 2,474.1 | $ | 1,643.0 | $ | 2,996.8 | ||||||||||
| Metric tons invoiced: |
||||||||||||||||||
| Rolled Products North |
370.5 | 213.8 | 156.8 | 309.4 | ||||||||||||||
| Rolled Products Europe |
314.4 | 183.8 | 120.2 | 231.8 | ||||||||||||||
| Extrusions |
75.7 | 42.6 | 29.4 | 65.0 | ||||||||||||||
| Recycling and Specification Alloys |
894.5 | 560.7 | 349.6 | 690.6 | ||||||||||||||
| Recycling and Specification Alloys Europe |
387.2 | 220.3 | 152.0 | 310.6 | ||||||||||||||
| Intersegment shipments |
(36.8 | ) | (30.2 | ) | (20.0 | ) | (36.2 | ) | ||||||||||
| Total metric tons invoiced |
2,005.5 | 1,191.0 | 788.0 | 1,571.2 | ||||||||||||||
Rolled Products North America revenues
RPNA revenues for the year ended December 31, 2011 were approximately $1.3 billion compared to $699.4 million and $507.2 million for the seven months ended December 31, 2010 and the five months ended May 31, 2010, respectively. The $139.8 million increase was primarily due to the following:
| • | higher LME aluminum prices, which resulted in increases in the average price of primary aluminum included in our invoiced prices. Aluminum price increases accounted for approximately $111.0 million of the increase in revenues; |
78
Table of Contents
| • | higher rolling margins resulting from price increases implemented during the second half of 2010, which increased revenues by approximately $14.0 million; and |
| • | volumes were flat in the aggregate as increased shipments in our commercial and transportation segment were offset by reductions in distribution and building and construction. Also, a higher mix of painted products positively impacted revenues. |
RPNA revenues for the seven months ended December 31, 2010 and the five months ended May 31, 2010 were $699.4 million and $507.2 million, respectively, compared to $893.6 million for the year ended December 31, 2009. The $313.0 million increase was primarily attributable to:
| • | increased demand in the distribution, transportation, and building and construction industries and across most other industries served by our North American operations. Shipments increased 18% resulting in a $158.0 million increase in revenues; and |
| • | higher LME aluminum prices, which resulted in our invoiced prices for aluminum increasing. Primary aluminum prices included in our invoiced prices increased revenues by approximately $158.0 million. |
Rolled Products Europe revenues
Revenues from our RPEU segment for the year ended December 31, 2011 were approximately $1.5 billion compared to $763.7 million and $464.4 million for the seven months ended December 31, 2010 and the five months ended May 31, 2010, respectively. The $313.5 million increase was primarily due to the following:
| • | a 3% increase in shipment levels and a favorable mix of products sold, which increased revenues by approximately $152.0 million. The increase in shipments was a result of higher demand for our aerospace, automotive, and brazing sheet products; |
| • | an increase in rolling margins resulting from a series of price increases, which increased revenues by approximately $51.0 million; |
| • | higher LME aluminum prices, which resulted in increases in the average price of primary aluminum included in our invoiced prices. Aluminum price increases accounted for approximately $58.0 million of the increase in revenues; and |
| • | a weaker U.S. dollar, which increased revenues by approximately $57.0 million. |
Revenues from our RPEU segment for the seven months ended December 31, 2010 and the five months ended May 31, 2010 were approximately $763.7 million and $464.4 million, respectively, compared to approximately $936.7 million for the year ended December 31, 2009. The $291.4 million increase in revenues is primarily attributable to:
| • | a 31% increase in shipment levels as a result of higher demand in the aerospace, automotive and distribution industries, which increased revenues by approximately $276.0 million; and |
| • | an increase in the selling prices of our products resulting from higher aluminum prices, which increased revenues approximately $62.0 million. |
These increases were partially offset by a stronger U.S. dollar, which reduced revenues by approximately $65.0 million.
79
Table of Contents
Extrusions revenues
Revenues from our Extrusions segment for the year ended December 31, 2011 were $410.3 million compared to $214.6 million and $132.5 million for the seven months ended December 31, 2010 and the five months ended May 31, 2010, respectively. The $63.2 million increase was primarily due to the following:
| • | higher LME aluminum prices, which resulted in increases in the average price of primary aluminum included in our invoiced prices. Price increases accounted for approximately $40.0 million of the increase in revenues; and |
| • | a weaker U.S. dollar, which increased revenues by approximately $19.0 million. |
Revenues from our Extrusions segment for the seven months ended December 31, 2010 and the five months ended May 31, 2010 were $214.6 million and $132.5 million, respectively, compared to $342.9 million for the year ended December 31, 2009. The $4.2 million increase in revenues is primarily attributable to:
| • | an 11% increase in shipment levels as a result of higher demand in the automotive and distribution industries, which increased revenues by approximately $32.0 million. |
This increase was partially offset by a stronger U.S. dollar, which reduced revenues by approximately $18.0 million, and lower LME aluminum prices, which resulted in decreases in the average price of primary aluminum included in our invoiced prices. Price decreases accounted for approximately $8.0 million of the decrease in revenues.
Recycling and Specification Alloys North America revenues
RSAA revenues for the year ended December 31, 2011 were $983.8 million compared to $540.5 million and $373.7 million for the seven months ended December 31, 2010 and the five months ended May 31, 2010, respectively. The $69.6 million increase was primarily due to the following:
| • | a 13% increase in North America invoiced metric tons, which increased revenues by approximately $81.0 million. The increase in volume was driven by improved demand across all of the industries served by this segment, particularly the automotive industry; and |
| • | higher selling prices for our products resulting from higher aluminum prices, which increased revenues by approximately $111.0 million. |
These increases were partially offset by the sale of our Brazilian recycling facility which reduced revenues by $122.0 million.
RSAA revenues for the seven months ended December 31, 2010 and the five months ended May 31, 2010 were $540.5 million and $373.7 million, respectively, compared to $564.2 million for the year ended December 31, 2009. The $350.0 million increase in revenues is primarily attributable to:
| • | a 32% increase in shipment levels as a result of higher demand in the automotive, steel, and container and packaging industries, which increased revenues by approximately $170.0 million; and |
| • | higher aluminum prices, which increased revenues by approximately $184.0 million. |
80
Table of Contents
Recycling and Specification Alloys Europe revenues
Revenues from our RSEU segment for the year ended December 31, 2011 were $685.1 million compared to $332.9 million and $214.5 million for the seven months ended December 31, 2010 and the five months ended May 31, 2010, respectively. The $137.7 million increase was primarily due to the following:
| • | a 4% increase in shipment levels and a favorable mix of products sold, which increased revenues by approximately $26.0 million. The increase in shipments was a result of higher demand from the automotive and most other industries served by this segment; |
| • | higher selling prices resulting from a series of price increases and higher aluminum prices, which increased revenues by approximately $81.0 million; and |
| • | a weaker U.S. dollar, which increased revenues by approximately $30.0 million. |
Revenues from our RSEU segment for the seven months ended December 31, 2010 and the five months ended May 31, 2010 were $332.9 million and $214.5 million, respectively, compared to $353.6 million for the year ended December 31, 2009. The $193.8 million increase in revenues is primarily attributable to:
| • | a 20% increase in shipment levels as a result of higher demand in the automotive and distribution industries and most other industries served by this segment, which increased revenues by approximately $95.0 million; and |
| • | an increase in the selling prices of our products resulting from higher aluminum prices, which increased revenues approximately $129.0 million. |
These increases were partially offset by a stronger U.S. dollar, which reduced revenues by approximately $31.0 million.
81
Table of Contents
Segment income and gross profit
| (Successor) | (Predecessor) | |||||||||||||||||
| (in millions) | For the year ended |
For the seven months ended December 31, 2010 |
For the five months ended May 31, 2010 |
For the year ended |
||||||||||||||
| Segment income (loss): |
||||||||||||||||||
| Rolled Products North America |
$ | 111.1 | $ | 44.9 | $ | 49.4 | $ | 89.7 | ||||||||||
| Rolled Products Europe |
157.6 | 40.4 | 55.1 | 37.2 | ||||||||||||||
| Extrusions |
10.9 | 5.3 | 2.7 | (1.7 | ) | |||||||||||||
| Recycling and Specification Alloys North America |
80.9 | 33.8 | 29.7 | 18.9 | ||||||||||||||
| Recycling and Specification Alloys Europe |
35.3 | 16.8 | 10.9 | (1.5 | ) | |||||||||||||
| Total segment income |
395.8 | 141.2 | 147.8 | 142.6 | ||||||||||||||
| Items excluded from segment income and included in gross profit: |
||||||||||||||||||
| Depreciation |
(64.0 | ) | (33.8 | ) | (18.3 | ) | (143.9 | ) | ||||||||||
| Other |
2.2 | (0.2 | ) | (0.1 | ) | (2.8 | ) | |||||||||||
| Items included in segment income and excluded from gross profit: |
||||||||||||||||||
| Segment selling, general and administrative expenses |
185.1 | 105.3 | 67.6 | 176.8 | ||||||||||||||
| Realized (gains) losses on derivative financial instruments |
(37.9 | ) | 12.6 | (10.4 | ) | (0.2 | ) | |||||||||||
| Other (income) expense, net |
(9.1 | ) | (2.8 | ) | 0.6 | 3.9 | ||||||||||||
| Gross profit |
$ | 472.1 | $ | 222.3 | $ | 187.2 | $ | 176.4 | ||||||||||
Rolled Products North America segment income
RPNA segment income for the year ended December 31, 2011 was $111.1 million compared to $44.9 million and $49.4 million for the seven months ended December 31, 2010 and the five months ended May 31, 2010, respectively. The $16.8 million increase was primarily due to the following:
| • | contribution margins benefited from improved rolling margins resulting from a series of successful pricing initiatives, which increased segment income by approximately $14.0 million. In addition, higher scrap utilization and increased benefits from scrap spreads increased segment income by approximately $18.0 million; and |
| • | more favorable metal price lag in 2011 compared to the prior year, which increased contribution margins and segment income by an estimated $2.7 million. Metal price lag increased 2011 segment income by approximately $6.2 million compared to $3.5 million in 2010. |
82
Table of Contents
These increases were partially offset by:
| • | higher costs associated with outside processing necessary to produce the current mix of products, less than optimal rates of production at our Richmond, Virginia rolling mill, higher paint and freight costs and wage inflation; and |
| • | the exclusion of $3.7 million of economic losses on derivative financial instruments from segment income in 2010. These economic losses represent the Emergence Date fair value of derivative financial instruments that settled during the seven months ended December 31, 2010. |
RPNA segment income for the seven months ended December 31, 2010 and the five months ended May 31, 2010 was $44.9 million and $49.4 million, respectively, compared to $89.7 million for the year ended December 31, 2009. The $4.6 million improvement resulted from:
| • | higher production and shipment volumes, which increased segment income by approximately $22.0 million; |
| • | productivity related savings from restructuring and AOS initiatives increased segment income by approximately $12.0 million, net of inflation; and |
| • | the exclusion of $3.7 million of economic losses on derivative financial instruments from segment income. These economic losses represent the Emergence Date fair value of derivative financial instruments that settled during the seven months ended December 31, 2010. |
These increases were partially offset by lower contribution margins driven by a $22.0 million reduction in favorable metal price lag as well as tighter scrap spreads in 2010, which reduced segment income by approximately $14.0 million.
Rolled Products Europe segment income
RPEU segment income for the year ended December 31, 2011 was $157.6 million compared to $40.4 million and $55.1 million for the seven months ended December 31, 2010 and the five months ended May 31, 2010, respectively. The $62.1 million increase was primarily due to the following:
| • | higher volumes and a favorable mix of products sold during 2011 compared to the prior year, which increased segment income by approximately $17.0 million. The increase in shipments and improved mix was primarily a result of higher demand from the aerospace and automotive industries; |
| • | the impact of the application of fresh-start accounting rules, which resulted in the recognition of an additional $22.1 million of costs of sales in 2010 associated with the write-up of inventory to fair value in June 2010; |
| • | contribution margins increased approximately $34.0 million as higher rolling margins were only partially offset by higher costs for purchased slabs; and |
| • | productivity related savings, which partially offset inflation in freight, energy and employee costs and higher research and development expense. |
83
Table of Contents
These increases were partially offset by the exclusion of $4.1 million of economic losses on derivative financial instruments from segment income in 2010 and the exclusion of $3.8 million of economic gains in 2011. These economic gains and losses represent the Emergence Date fair value of derivative financial instruments that settled during the periods.
RPEU segment income for the seven months ended December 31, 2010 and the five months ended May 31, 2010 was $40.4 million and $55.1 million, respectively, compared to segment income of $37.2 million for the year ended December 31, 2009. The $58.3 million increase in segment income was primarily attributable to:
| • | a 31% increase in shipments and higher production volumes, which increased segment income by approximately $35.0 million; |
| • | lower cash conversion costs per unit resulting from productivity savings primarily related to the restructuring initiatives implemented in 2009, resulting in savings of approximately $33.0 million in 2010; |
| • | $5.7 million of benefits paid under an insurance claim and a supply contract; |
| • | lower energy costs, which increased segment income by approximately $7.0 million; and |
| • | the exclusion of $4.1 million of economic losses on derivative financial instruments from segment income. These losses represent the Emergence Date fair value of derivative financial instruments that settled during the seven months ended December 31, 2010. |
Offsetting these increases, segment income for the seven months ended December 31, 2010 includes the impact of the application of fresh-start accounting rules which resulted in the recognition of an additional $22.1 million of costs of sales associated with the write-up of inventory to fair value. A stronger U.S. dollar further reduced segment income by approximately $11.0 million.
Extrusions segment income (loss)
Extrusions segment income for the year ended December 31, 2011 was $10.9 million compared to $5.3 million and $2.7 million for the seven months ended December 31, 2010 and the five months ended May 31, 2010, respectively. The $2.9 million increase was primarily due to the following:
| • | productivity related savings, which offset inflation in freight, energy and employee costs; |
| • | the impact of the application of fresh-start accounting rules, which resulted in the recognition of an additional $3.6 million of costs of sales in 2010 associated with the write-up of inventory to fair value in June 2010; and |
| • | favorable metal price lag in 2011 compared to the prior year, which increased contribution margins and segment income by an estimated $3.0 million. Metal price lag decreased 2010 segment income by approximately $0.3 million while increasing 2011 segment income by an estimated $2.7 million. |
These increases were partially offset by:
| • | changes in product mix, which resulted in higher conversion and material costs. This change in mix decreased segment income by approximately $4.0 million. |
84
Table of Contents
Extrusions segment income for the seven months ended December 31, 2010 and the five months ended May 31, 2010 was $5.3 million and $2.7 million, respectively, compared to a segment loss of $1.7 million for the year ended December 31, 2009. The $9.7 million increase in segment income was primarily attributable to:
| • | an 11% increase in shipments and higher production volumes, which increased segment income by approximately $4.0 million; and |
| • | lower cash conversion costs per unit resulting from productivity savings primarily related to the restructuring initiatives implemented in 2009 more than offset inflation, resulting in savings of approximately $14.0 million in 2010. |
Segment income for the seven months ended December 31, 2010 also includes the impact of the application of fresh-start accounting rules which resulted in the recognition of an additional $3.6 million of costs of sales associated with the write-up of inventory to fair value, partially offsetting these increases.
Recycling and Specification Alloys North America segment income
RSAA segment income for the year ended December 31, 2011 was $80.9 million compared to $33.8 million and $29.7 million for the seven months ended December 31, 2010 and the five months ended May 31, 2010, respectively. The $17.4 million increase was primarily due to the following:
| • | higher North American volumes to U.S. automotive producers, which increased segment income by approximately $9.0 million; |
| • | higher LME prices, which increased the selling prices of certain recycled products, partially offset by tighter metal spreads, resulted in a net increase in contribution margins of approximately $5.0 million; |
| • | productivity gains, which substantially offset increased costs as a result of inflation; and |
| • | the impact of the application of fresh-start accounting rules, which resulted in the recognition of an additional $2.2 million of costs of sales in 2010 associated with the write-up of inventory to fair value in June 2010 upon emergence. |
RSAA segment income for the seven months ended December 31, 2010 and the five months ended May 31, 2010 was $33.8 million and $29.7 million, respectively, compared to segment income of $18.9 million for the year ended December 31, 2009. The $44.6 million increase in segment income is primarily attributable to:
| • | a 32% increase in volumes, which increased segment income by approximately $21.0 million; |
| • | improved metal spreads, which increased segment income by $12.0 million; and |
| • | productivity related savings, which increased segment income by approximately $7.0 million, net of inflation. |
Offsetting these increases, segment income for the seven months ended December 31, 2010 includes the impact of the application of fresh-start accounting rules which resulted in $2.2 million of additional cost of sales associated with the write-up of inventory to fair value.
85
Table of Contents
Recycling and Specification Alloys Europe segment income (loss)
RSEU segment income for the year ended December 31, 2011 was $35.3 million compared to $16.8 million and $10.9 million for the seven months ended December 31, 2010 and the five months ended May 31, 2010, respectively. The $7.6 million increase was primarily due to the following:
| • | contribution margins benefited from a series of price increases, which increased segment income by approximately $3.0 million; |
| • | productivity related savings, which partially offset inflation in freight, energy and employee costs; and |
| • | segment income for the seven months ended December 31, 2010 includes the impact of the application of fresh-start accounting rules, which resulted in the recognition of an additional $3.7 million of costs of sales associated with the write-up of inventory to fair value in June 2010. |
RSEU segment income for the seven months ended December 31, 2010 and the five months ended May 31, 2010 was $16.8 million and $10.9 million, respectively, compared to a segment loss of $1.5 million for the year ended December 31, 2009. The $29.2 million increase in segment income was primarily attributable to:
| • | a 20% increase in shipments and higher production volumes, which increased segment income by approximately $10.0 million; |
| • | productivity savings primarily related to the restructuring initiatives implemented in 2009, resulting in savings of approximately $6.0 million in 2010; |
| • | improved contribution margins resulting from improved metal spreads, which increased segment income by approximately $19.0 million; and |
| • | lower energy costs, which increased segment income by approximately $4.0 million. |
Segment income for the seven months ended December 31, 2010 also includes the impact of the application of fresh-start accounting rules which resulted in the recognition of an additional $3.7 million of costs of sales associated with the write-up of inventory to fair value. A stronger U.S. dollar further reduced segment income by approximately $3.0 million.
Selling, general and administrative expenses
Consolidated SG&A expenses increased $50.1 million in the year ended December 31, 2011 as compared 2010. This increase was primarily due to the following:
| • | corporate SG&A expense increased $37.9 million primarily due to an $11.9 million charge related to the termination of our research and development agreement with Tata Steel, an $8.2 million increase in start-up expenses associated with the China Joint Venture, a $12.7 million increase in personnel costs as staffing levels increased after emergence from bankruptcy, a $3.9 million increase in stock-based compensation expense, a $2.5 million increase in professional and consulting fees and a weaker U.S. dollar; and |
| • | segment SG&A expense increased $12.2 million in 2011 as compared to 2010 primarily due to a $3.5 million increase in personnel costs and an increase in sales commissions. |
86
Table of Contents
As a percentage of revenues, consolidated SG&A expense remained at approximately 6% for the year ended December 31, 2011.
Consolidated SG&A expenses decreased $19.4 million in 2010 as compared to 2009. This decrease was primarily due to a $18.0 million reduction in depreciation and amortization expense associated with an impairment charge recorded in the fourth quarter of 2009 and approximately a $3.0 million reduction resulting from a stronger U.S. dollar.
Restructuring and impairment charges (gains)
2011 charges
During the year ended December 31, 2011, we recorded $4.4 million of cash restructuring charges for employee severance and benefit costs, including $3.1 million related to the Company’s reduction in force initiatives implemented at our Bonn, Germany facility. No further charges are anticipated related to this restructuring program.
2010 charges
During the seven months ended December 31, 2010, we recorded $12.1 million of cash restructuring charges, including $11.1 million related to the Company’s reduction in force initiatives implemented during the fourth quarter of 2008 and $1.0 million of restructuring charges primarily related to employee termination benefits associated with work force reductions at our Bonn, Germany facility. Payments totaling $0.3 million were made during the seven months ended December 31, 2010 related to the Bonn work force reduction. As of December 31, 2011, no further charges are anticipated related to this restructuring program.
During the five months ended May 31, 2010, we recorded $1.3 million of cash restructuring charges and $1.7 million of non-cash gains. The activity primarily resulted from the following restructuring items:
| • | Certain of our postretirement benefit plans were amended to eliminate retiree medical benefits for salaried employees/retirees. As a result of these amendments, gains of $1.1 million and $1.0 million were recorded associated with our RPNA and RPEU segments, respectively. |
| • | We recorded $0.8 million of costs associated with environmental remediation efforts required at our Rockport, Indiana facility within our RPNA segment. |
2009 charges
During the year ended December 31, 2009, we recorded non-cash impairment charges totaling $672.4 million, $45.7 million, $40.4 million and $29.9 million related to our long-lived assets, indefinite-lived intangible assets, goodwill and finite-lived intangibles, respectively. We also recorded $41.7 million and $32.8 million of other cash and non-cash charges, respectively, associated with plant closures and other restructuring initiatives during the year ended December 31, 2009. Included within these amounts are $33.5 million and $24.3 million of cash and non-cash restructuring charges recorded in 2009 related to restructuring activities initiated in 2008. These charges, totaling $862.9 million, primarily resulted from the following:
2009 impairments
In 2009, we recorded impairment charges totaling $40.4 million related to goodwill and $45.7 million related to other indefinite-lived intangible assets. These impairments, which have been
87
Table of Contents
included within the operating results of the Corporate segment, consisted of goodwill impairment related to the RSAA operating segment and trade name impairments totaling $31.7 million and $14.0 million related to the RSAA and RPNA operating segments, respectively. We also recorded impairment charges associated with certain technology, customer contract and supply contract intangible assets totaling $29.9 million in 2009. The impairments consisted of $22.8 million, $1.4 million and $5.7 million associated with our RPEU, RSEU and RSAA segments, respectively.
In accordance with ASC 360, several indicators of impairment were identified in the fourth quarter of 2009 including the finalization of the forecast model developed by the Company and its financial advisors to determine the initial equity value of the Predecessor before giving effect to to any value ascribed to the rights offering. The results of the forecast identified a deficiency in the fair value of the business as a whole compared to its carrying value, and therefore, we determined that the associated long-lived assets were required to be tested for impairment. These impairment tests resulted in the Company recording impairment charges totaling $672.4 million related to property, plant and equipment and $29.9 million related to finite-lived intangible assets in the RPEU, Extrusions, RSEU and RSAA operating segments. No impairments were necessary for the RPNA segment as the undiscounted cash flows exceeded the carrying amount of this asset group. We conducted our analysis under the premise of fair value in-exchange. An analysis of the earnings capability of the related assets indicated that there would not be sufficient cash flows available to justify investment in the assets under a fair value in-use premise.
The 2009 impairments were primarily a result of the continued adverse climate for our business, including the erosion of the capital, credit, commodities, automobile and housing markets as well as the global economy.
2009 restructuring activities
During 2009, we closed our RPNA segment headquarters in Louisville, Kentucky and sold our Terre Haute, Indiana facility. We recorded cash restructuring charges totaling $2.2 million primarily related to severance costs and recorded asset impairment charges totaling $3.5 million relating to property, plant and equipment. We based the determination of the impairments of these assets on the undiscounted cash flows expected to be realized from the affected assets and recorded the related assets at fair value. Other work force reductions across the RPNA operations resulted in the recording of $2.4 million of employee termination benefits.
88
Table of Contents
(Gains) losses on derivative financial instruments
During the year ended December 31, 2011, the seven months ended December 31, 2010, the five months ended May 31, 2010 and the year ended December 31, 2009, we recorded the following realized and unrealized (gains) and losses on derivative financial instruments:
| (Successor) | (Predecessor) | |||||||||||||||||
| (in millions) | For the year ended |
For the seven months ended December 31, 2010 |
For the five months ended May 31, 2010 |
For the year ended |
||||||||||||||
| Realized (gains) losses |
||||||||||||||||||
| Metal |
$ | (41.9 | ) | $ | 11.5 | $ | (11.8 | ) | $ | (12.8 | ) | |||||||
| Natural gas |
3.8 | 2.1 | 1.2 | 9.8 | ||||||||||||||
| Currency |
0.3 | — | — | (2.8 | ) | |||||||||||||
| Unrealized losses (gains) |
||||||||||||||||||
| Metal |
31.9 | (19.2 | ) | 38.4 | (12.2 | ) | ||||||||||||
| Natural gas |
4.5 | (0.6 | ) | 0.8 | 3.1 | |||||||||||||
| Currency |
1.4 | — | — | (2.1 | ) | |||||||||||||
| Total (gains) losses |
$ | — | $ | (6.2 | ) | $ | 28.6 | $ | (17.0 | ) | ||||||||
Generally, our realized (gains) losses represent the cash paid or received upon settlement of our derivative financial instruments. Unrealized (gains) losses reflect the change in the fair value of derivative financial instruments from the later of the end of the prior period or our entering into the derivative instrument as well as the reversal of previously recorded unrealized losses (gains) for derivatives that settled during the period. Realized (gains) losses are included within segment income while unrealized (gains) losses are excluded.
As Aleris International’s emergence from bankruptcy established a new entity for financial reporting purposes, the emergence date fair value of all derivative financial instruments will not be reported as realized losses (gains) upon settlement. This is due to the fact that the Successor acquired these derivative financial instruments at their fair value as of the emergence date. As such, the realized losses (gains) reported in the Successor periods will represent only the changes in fair value of those derivative financial instruments since the emergence date. Similarly, no reversal of the unrealized losses (gains) recorded by the Predecessor, which are equal to the emergence date fair value of those instruments, will be recorded upon settlement. While this will not change the total “(Gains) losses on derivative financial instruments” reported in the Consolidated statements of operations, it does impact the amount of realized and unrealized losses recorded and, as a result, segment income. During the year ended December 31, 2011 and the seven months ended December 31, 2010, $3.4 million of economic gains and $7.9 million of economic losses, respectively, representing the emergence date fair value of derivative financial instruments that settled during each period, were excluded from realized gains and losses and segment income. Such economic losses (gains) will continue to be excluded from segment income until all derivative financial instruments entered into prior to the emergence date are settled. Realized losses (gains) on derivative financial instruments entered into subsequent to the emergence date will not be affected.
As discussed in the “Critical measures of our financial performance” section above, we utilize derivative financial instruments to reduce the impact of changing metal and natural gas prices on
89
Table of Contents
our operating results. We evaluate the performance of our risk management practices, in part, based upon the amount of metal price lag included in our operating results. In 2011, we estimate that metal price lag reduced gross profit by approximately $26.3 million while we experienced aluminum hedge gains of $45.2 million, including $3.4 million of economic gains not recorded within realized gains as discussed above. In 2010, we estimate gross profit benefited from metal price lag by approximately $19.7 million, while we experienced aluminum hedge losses of $6.0 million, including $6.3 million of economic losses not recorded within realized losses as discussed above. The resulting $18.9 million and $13.7 million of net metal price lag improved our operating results in 2011 and 2010, respectively.
Metal price lag had a more significant impact in 2009 as our ability to enter into derivative financial instruments was limited under the terms and conditions of our debtor-in-possession financing arrangements. As a result, gross profit benefited as aluminum prices increased while our aluminum derivative financial instruments produced gains of an additional $12.8 million. The resulting metal price lag improved 2009 operating results by $29.5 million.
Interest expense, net
Interest expense, net, for the year ended December 31, 2011 decreased $34.3 million when compared to 2010. The decrease in interest expense resulted from lower levels of debt outstanding as a result of Aleris International’s reorganization and emergence from bankruptcy, partially offset by the Senior Notes issuance in the first quarter of 2011.
Interest expense, net, for the year ended December 31, 2010 decreased $144.8 million when compared to 2009. The decrease in interest expense was due to the significant reduction in debt outstanding subsequent to Aleris International’s emergence from bankruptcy. Interest expense for the year ended December 31, 2009 related to Aleris International’s prepetition and debtor-in-possession financing facilities.
Reorganization items, net
Professional advisory fees and other costs directly associated with Aleris International’s reorganization are reported as reorganization items pursuant to ASC 852. Reorganization items also include provisions and adjustments to record the carrying value of certain prepetition liabilities at their estimated allowable claim amounts.
90
Table of Contents
Reorganization items, net consisted of the following items:
| (Successor) | (Predecessor) | |||||||||||||||||
| (in millions) | For the year ended |
For the seven months ended December 31, 2010 |
For the five months ended May 31, 2010 |
For the year ended |
||||||||||||||
| Gain on settlement of liabilities subject to compromise |
$ | — | $ | — | $ | (2,204.0 | ) | $ | (1.8 | ) | ||||||||
| Fresh-start accounting |
— | — | (61.6 | ) | — | |||||||||||||
| Professional fees and expenses |
1.5 | 5.5 | 34.3 | 38.0 | ||||||||||||||
| Write-off of debt issuance costs |
— | — | 7.6 | 6.8 | ||||||||||||||
| U.S. Trustee fees |
— | 0.4 | 0.6 | 0.7 | ||||||||||||||
| Derivative financial instruments valuation adjustment |
— | — | — | 88.1 | ||||||||||||||
| Liquidation of Aleris Aluminum Canada S.E.C./Aleris Aluminum Canada L.P. |
(2.4 | ) | — | (5.1 | ) | (8.7 | ) | |||||||||||
| Other |
(0.4 | ) | 1.5 | 0.9 | — | |||||||||||||
| Total reorganization items, net |
$ | (1.3 | ) | $ | 7.4 | $ | (2,227.3 | ) | $ | 123.1 | ||||||||
(Benefit from) provision for income taxes
The benefit from income taxes was $4.2 million for the year ended December 31, 2011, compared to an income tax expense of $0.3 million for the seven months ended December 31, 2010, an income tax benefit of $8.7 million for the five months ended May 31, 2010 and an income tax benefit of $61.8 million for the year ended December 31, 2009. The income tax benefit for the year ended December 31, 2011 consisted of an income tax benefit of $8.1 million from international jurisdictions and an income tax expense of $3.9 million in the United States. The income tax expense for the seven months ended December 31, 2010 consisted of an income tax benefit of $4.5 million from international jurisdictions and an income tax expense of $4.8 million in the United States. The income tax benefit for the five months ended May 31, 2010 consisted of an income tax expense of $4.1 million from international jurisdictions and an income tax benefit of $12.8 million in the United States. The income tax benefit for the year ended December 31, 2009 consisted of $35.5 million from international jurisdictions and $26.3 million in the United States. Management determined that a valuation allowance against the net deferred tax assets of certain legal entities in their respective jurisdictions was still needed at the end of 2011 based on the fact that the available evidence still did not support the realization of those net deferred tax assets under the more-likely-than-not standard.
At December 31, 2011, 2010 and 2009, we had valuation allowances of $364.6 million, $399.4 million and $648.4 million, respectively, to reduce certain deferred tax assets to amounts that are more likely than not to be realized. Of the total 2011, 2010 and 2009 valuation allowances, $244.3 million, $267.1 million and $370.4 million relate primarily to net operating losses and
91
Table of Contents
future tax deductions for depreciation in non-U.S. tax jurisdictions, $109.1 million, $120.9 million and $223.5 million relate primarily to the U.S. federal effects of amortization, pension and postretirement benefits for the Successor and net operating losses and tax credits for the Predecessor and $11.2 million, $11.4 million and $54.5 million relate primarily to the state effects of amortization, pension and postretirement benefits for the Successor and Kentucky state recycling credits and other state net operating losses for the Predecessor, respectively. The net reduction in the valuation allowance in 2011 is primarily attributable to the recognition of the net deferred tax assets in Germany and the decrease in the underlying net deferred tax assets in the United States resulting from bonus depreciation. A benefit of $23.0 million was recognized in Germany for the reversal of the valuation allowance resulting from a change in judgment. The change in judgment was driven by new long-term contracts and reductions of interest expense that more likely than not will generate sufficient taxable income to recognize those deferred tax assets. The net reduction in the valuation allowance in 2010 is primarily attributable to the decrease in the underlying deferred tax assets resulting from the Plan of Reorganization and fresh-start accounting adjustments. We will maintain valuation allowances against our net deferred tax assets in the United States and other applicable jurisdictions until sufficient positive evidence exists to reduce or eliminate the valuation allowance.
The following table summarizes the change in uncertain tax positions:
| (Successor) | (Predecessor) | |||||||||||||||||
| (in millions) | For the year ended |
For the seven months ended December 31, 2010 |
For the five months ended May 31, 2010 |
For the year ended |
||||||||||||||
| Balance at beginning of period |
$ | 12.5 | $ | 10.7 | $ | 13.3 | $ | 11.7 | ||||||||||
| Additions based on tax positions related to the current year |
— | 0.7 | 0.7 | 1.4 | ||||||||||||||
| Additions for tax positions of prior years |
8.9 | 1.1 | — | 0.2 | ||||||||||||||
| Reductions for tax positions of prior years |
(2.7 | ) | — | (3.3 | ) | — | ||||||||||||
| Settlements |
(1.1 | ) | — | — | — | |||||||||||||
| Balance at end of period |
$ | 17.6 | $ | 12.5 | $ | 10.7 | $ | 13.3 | ||||||||||
We recognize interest and penalties related to uncertain tax positions within the “(Benefit from) provision for income taxes” in the Consolidated statements of operations. As of December 31, 2011, 2010 and 2009, we had approximately $1.9 million, $0.8 million and $0.7 million of accrued interest related to uncertain tax positions, respectively.
The 2005 through 2010 tax years remain open to examination. We have continuing responsibility for the open tax years for the Predecessor’s non-filing foreign subsidiaries. A non-U.S. taxing jurisdiction commenced an examination in the fourth quarter of 2009 that is anticipated to be completed within six months of the reporting date. We anticipate adjustments to various
92
Table of Contents
intercompany charges and depreciation lives that will result in a decrease in the reserve of $15.8 million. Additionally, we are appealing the German government’s position with regard to net operating loss carryforwards available for use in the year of our change of ownership that occurred upon emergence from Chapter 11. A successful appeal will result in a decrease in the reserve of $1.8 million.
Liquidity and capital resources
Summary
We ended 2011 with $231.4 million of cash and cash equivalents, compared with $113.5 million at the end of 2010. Liquidity at December 31, 2011 was $621.2 million, which consisted of $389.8 million of availability under the ABL Facility plus $231.4 million of cash. Our short-term debt outstanding was $6.9 million at the end of 2011, which is an increase from $5.3 million at the end of 2010. The increase in cash and cash equivalents was primarily due to our 2011 operating results, the issuance of the Senior Notes in the first quarter of 2011 and improvements in working capital, partially offset by $500.0 million of dividends paid to our stockholders.
Based on our current and anticipated levels of operations and the condition in our markets and industry, we believe that our cash on hand, cash flows from operations, and availability under the ABL Facility will enable us to meet our working capital, capital expenditures, debt service and other funding requirements for the foreseeable future. However, our ability to fund our working capital needs, debt payments and other obligations, and to comply with the financial covenants, including borrowing base limitations, under the ABL Facility, depends on our future operating performance and cash flows and many factors outside of our control, including the costs of raw materials, the state of the overall industry and financial and economic conditions and other factors, including those described under “Risk factors.” Any future acquisitions, joint ventures or other similar transactions will likely require additional capital and there can be no assurance that any such capital will be available to us on acceptable terms, if at all.
At December 31, 2011, approximately $162.7 million of our cash and cash equivalents are held by our non-U.S. subsidiaries. We currently have no plans to repatriate these foreign earnings which are permanently reinvested. If circumstances change and it becomes apparent that some or all of the permanently reinvested earnings will be remitted in the foreseeable future, an additional income tax charge may be necessary; we currently have the ability to remit all of the cash held by non-U.S. subsidiaries without incurring a U.S. tax liability.
The following discussion provides a summary description of the significant components of our sources of liquidity and long-term debt.
93
Table of Contents
Cash flows
The following table summarizes our net cash provided (used) by operating, investing and financing activities for the year ended December 31, 2011, the seven months ended December 31, 2010, the five months ended May 31, 2010, and the year ended December 31, 2009.
| (Successor) | (Predecessor) | |||||||||||||||||
| (in millions) | For the year ended |
For the seven months ended December 31, 2010 |
For the five months ended May 31, 2010 |
For the year ended |
||||||||||||||
| Net cash provided (used) by: |
||||||||||||||||||
| Operating activities |
$ | 266.9 | $ | 119.1 | $ | (174.0 | ) | $ | 56.7 | |||||||||
| Investing activities |
(197.3 | ) | (26.2 | ) | (15.7 | ) | (59.8 | ) | ||||||||||
| Financing activities |
53.7 | (83.6 | ) | 187.5 | 60.8 | |||||||||||||
Cash flows from operating activities
Cash flows provided by operating activities were $266.9 million for the year ended December 31, 2011, which resulted from $251.7 million of cash from earnings and a $22.6 million decrease in net operating assets partially offset by $7.4 million of payments for reorganization and restructuring items. The significant components of the change in net operating assets include an increase of $13.0 million in accounts receivable, a decrease of $15.7 million in inventories and an increase of $28.4 million in accounts payable and accrued liabilities. Our days sales outstanding (“DSO”) at December 31, 2011 remained consistent with 2010 at 39 days. Our days inventory outstanding (“DIO”) increased to 49 days from 45 days as certain segments experienced less than forecasted sales during 2011 for our levels of inventory. Our days payables outstanding (“DPO”) increased from 23 days at the end of 2010 to 27 days at December 31, 2011 as more favorable terms from certain suppliers were negotiated during the year. The increase in accrued liabilities reflects higher accruals for interest expense, income taxes and employee costs.
Cash flows provided by operating activities were $119.1 million for the seven months ended December 31, 2010, which resulted from $96.7 million of cash generated from earnings and a $59.4 million decrease in net operating assets, partially offset by $37.0 million of payments for reorganization and restructuring items. The largest contributor to the operating asset decrease was accounts receivable of $81.3 million. The decrease in accounts receivable was driven primarily by a seasonal reduction in year end volumes, and working capital efficiency as our average DSO improved from approximately 40 days in May 2010 to 39 days in December 2010.
Cash flows used by operating activities were $174.0 million for the five months ended May 31, 2010, which resulted from a $234.6 million increase in net operating assets and $36.7 million of payments for reorganization and restructuring items partially offset by $97.3 million of cash from earnings. The significant components of the change in net operating assets include increases of $181.5 million, $138.7 million and $100.8 million in accounts receivable, inventories, and accounts payable and accrued liabilities, respectively, as a result of increased sales volumes across all segments and the impact of higher aluminum prices. Revenues for the three months ended May 31, 2010 were approximately $200 million higher than for the three months ended December 31, 2009. These volume and revenue increases contributed to a higher level of accounts receivable. Higher demand in June 2010 and the third quarter of 2010 as compared to the first quarter of 2010 resulted in increases in both inventories and accounts payable.
94
Table of Contents
Cash flows provided by operating activities were $56.7 million in 2009, which included $127.9 million of cash provided by changes in operating assets and liabilities as working capital declined in response to market demand and lower aluminum prices. The working capital decline included reductions in accounts receivable, inventories and accounts payable, respectively of $119.5 million, $159.3 million, and $103.6 million. Contributing significantly to the reductions in receivables and inventories were gains associated with working capital efficiency as our DSO improved from an average of 46 days in 2008 to an average of 44 days in 2009 and our DIO improved from an average 53 days in 2008 to an average 48 days in 2009. The reduction in accounts payable was impacted by tighter payment terms required by our suppliers subsequent to the Chapter 11 filing. Our average DPO dropped from 38 days in 2008 to 27 days in 2009. The working capital cash generation was partially offset by an increase in other assets of $41.7 million, primarily attributable to an increase in cash postings associated with our derivative positions. Operating cash flow was negatively impacted by $70.8 million of cash payments related to reorganization and restructuring items.
Cash flows from investing activities
Cash flows used by investing activities were $197.3 million for the year ended December 31, 2011 and included $204.6 million of capital expenditures, partially offset by $7.7 million of proceeds from the sale of property, plant and equipment. The increase in capital expenditures in 2011 is primarily due to $79.5 million of strategic spending related to the China Joint Venture as well as spending to increase our capacity in auto body sheet production and scrap processing capabilities. We expect to spend approximately $450.0 million on capital in 2012, with $75.0 million of maintenance capital, approximately $136.0 million of discretionary, growth-related capital and $239.0 million to be spent by the China Joint Venture.
Cash flows used by investing activities were $26.2 million for the seven months ended December 31, 2010 and included $46.5 million of capital expenditures partially offset by $19.9 million of proceeds from the sale of businesses. Cash used in investing activities was $15.7 million for the five months ended May 31, 2010, which consisted of $16.0 million of capital spending.
Cash used in investing activities was $59.8 million in 2009, which primarily consisted of $68.6 million of capital spending partially offset by proceeds from the sale of assets.
Cash flows from financing activities
Cash flows from financing activities for the year ended December 31, 2011 included $490.0 million of net proceeds from the issuance of the Senior Notes and $56.7 million of net proceeds from the China Loan Facility (as defined below), partially offset by dividend payments totaling $500.0 million.
Cash used by our financing activities was $83.6 million for the seven months ended December 31, 2010, which included $81.8 million of net payments on the ABL Facility. Cash provided by our financing activities was $187.5 million for the five months ended May 31, 2010. Cash flows for the five months ended May 31, 2010 included the impact of Aleris International’s reorganization, including the repayment of outstanding amounts under the DIP financing arrangements partially offset by $541.1 million of net proceeds raised in the rights offering and used by us to acquire all of Aleris International’s common stock, an $80.0 million initial draw on the ABL Facility, $43.8 million from the issuance of the 6% senior subordinated exchangeable notes, net of expenses paid to the lenders, and $5.0 million from the issuance of preferred stock.
95
Table of Contents
Cash provided by financing activities totaled $60.8 million in 2009, which consisted primarily of borrowings on Aleris International’s debtor-in-possession financing and payments of related issuance costs.
Indebtedness subsequent to emergence from bankruptcy proceedings
7 5/8% Senior Notes due 2018
On February 9, 2011, Aleris International issued the Senior Notes under an indenture with U.S. Bank National Association, as trustee. The notes are unconditionally guaranteed on a senior unsecured basis by each of Aleris International’s restricted subsidiaries that is a domestic subsidiary and that guarantees Aleris International’s obligations under the ABL Facility. Interest on the Senior Notes is payable in cash semi-annually in arrears on February 15th and August 15th of each year. The Senior Notes mature on February 15, 2018. Aleris International used the net proceeds from the sale of the Senior Notes to pay cash dividends of $300.0 million, $100.0 million and $100.0 million to us on February 28, 2011, June 30, 2011 and November 10, 2011, respectively, which we then paid as a dividend, pro rata, to our stockholders.
On October 14, 2011, Aleris International exchanged the Senior Notes for $500.0 million of its new 7 5/8% Senior Notes due 2018 that have been registered under the Securities Act of 1933, as amended. The notes issued in the exchange offer are substantially identical to the Senior Notes, except that the new notes have been registered under the federal securities laws, are not subject to transfer restrictions, are not entitled to certain registration rights and will not provide for the payment of additional interest under circumstances relating to the timing of the exchange offer.
China Loan Facility
In March 2011, the China Joint Venture entered into a non-recourse multi-currency secured revolving and term loan facility with the Bank of China Limited, Zhenjiang Jingkou Sub-Branch (the “China Loan Facility”). The China Loan Facility originally consisted of a $100.0 million term loan, a RMB 532.0 million term loan (or equivalent to approximately $83.7 million) and a combined USD/RMB revolving credit facility up to an aggregate amount equivalent to $35.0 million. In December 2011, the agreement was amended and now consists of a $30.0 million term loan facility, a RMB 997.5 million term loan facility (or equivalent to approximately $157.0 million) and a RMB 232.8 million (or equivalent to approximately $36.6 million) revolving credit facility. The interest on the term USD facility is six month USD LIBOR plus 5.0% and the interest rate on the term RMB facility and the revolving credit facility is 110% of the base rate applicable to any loan denominated in RMB of the same tenor, as announced by the People’s Bank of China. As of December 31, 2011, $56.7 million was drawn under the term loan facility. Draws on the revolving facility begin in 2013. The final maturity date for all borrowings under the China Loan Facility is May 21, 2021. The China Joint Venture is an unrestricted subsidiary under the indenture governing the Senior Notes.
The China Loan Facility contains certain customary covenants and events of default. The China Loan Facility requires the China Joint Venture to, among other things, maintain a certain ratio of outstanding term loans to invested equity capital. In addition, among other things and subject to certain exceptions, the China Joint Venture is restricted in its ability to:
| • | repay loans extended by the China Joint Venture’s shareholders prior to repaying loans under the China Loan Facility or make the China Loan Facility junior to any other debts incurred of the same class for the project; |
96
Table of Contents
| • | distribute any dividend or bonus to shareholders if its pre-tax profit is insufficient to cover a loss or not used to discharge principal, interest and expenses; |
| • | dispose of any assets in a manner that will materially impair its ability to repay debts; |
| • | provide guarantees to third parties above a certain threshold that use assets that are financed by the China Loan Facility; |
| • | permit any individual investor or key management personnel changes that result in a material adverse effect; |
| • | use any proceeds from the China Loan Facility for any purpose other than as set forth therein; and |
| • | enter into additional financing to expand or increase the production capacity of the project. |
We were in compliance with all of the covenants set forth in the China Loan Facility as of December 31, 2011.
ABL Facility
In connection with Aleris International’s emergence from bankruptcy, Aleris International entered into the ABL Facility, an asset backed multi-currency revolving credit facility. On June 30, 2011, Aleris International amended and restated the ABL Facility. The new ABL Facility is a $600.0 million revolving credit facility which permits multi-currency borrowings up to $600.0 million by our U.S. subsidiaries, up to $240.0 million by Aleris Switzerland GmbH (a wholly owned Swiss subsidiary), and $15.0 million by Aleris Specification Alloy Products Canada Company (a wholly owned Canadian subsidiary). Aleris International and certain of its U.S. and international subsidiaries are borrowers under this ABL Facility. The availability of funds to the borrowers located in each jurisdiction is subject to a borrowing base for that jurisdiction and the jurisdictions in which certain subsidiaries of such borrowers are located, calculated on the basis of a predetermined percentage of the value of selected accounts receivable and U.S., Canadian and certain European inventory, less certain ineligible accounts receivable and inventory. The level of our borrowing base and availability under the ABL Facility fluctuates with the underlying LME price of aluminum which impacts both accounts receivable and inventory values included in our borrowing base. Non-U.S. borrowers also have the ability to borrow under the ABL Facility based on excess availability under the borrowing base applicable to the U.S. borrowers, subject to certain sublimits. The ABL Facility provides for the issuance of up to $75.0 million of letters of credit as well as borrowings on same-day notice, referred to as swingline loans that are available in U.S. dollars, Canadian dollars, Euros, and certain other currencies. As of December 31, 2011, we estimate that our borrowing base would have supported borrowings of $428.9 million. After giving effect to the outstanding letters of credit of $39.1 million, Aleris International had $389.8 million available for borrowing as of December 31, 2011.
Borrowings under the ABL Facility bear interest at a rate equal to the following, plus an applicable margin ranging from 0.75% to 2.50%:
| • | in the case of borrowings in U.S. dollars, a LIBOR Rate or base rate determined by reference to the higher of (1) Bank of America’s prime lending rate, (2) the overnight federal funds rate plus 0.5% or (3) a Eurodollar rate determined by Bank of America plus 1.0%; |
97
Table of Contents
| • | in the case of borrowings in Euros, a euro LIBOR rate determined by Bank of America; and |
| • | in the case of borrowings in Canadian dollars, a Canadian prime rate. |
As of December 31, 2011 and 2010, Aleris International had no amounts outstanding under the ABL Facility.
In addition to paying interest on any outstanding principal under the ABL Facility, Aleris International is required to pay a commitment fee in respect of unutilized commitments of 0.50% if the average utilization is less than 33% for any applicable period, 0.375% if the average utilization is between 33% and 67% for any applicable period, and 0.25% if the average utilization is greater than 67% for any applicable period. We must also pay customary letters of credit fees and agency fees.
The ABL Facility is subject to mandatory prepayment with (i) 100% of the net cash proceeds of certain asset sales, subject to certain reinvestment rights; (ii) 100% of the net cash proceeds from issuance of debt, other than debt permitted under the ABL Facility; and (iii) 100% of net cash proceeds from certain insurance and condemnation payments, subject to certain reinvestment rights.
In addition, if at any time outstanding loans, unreimbursed letter of credit drawings and undrawn letters of credit under the ABL Facility exceed the applicable borrowing base in effect at such time, we are required to repay outstanding loans or cash collateralize letters of credit in an aggregate amount equal to such excess, with no reduction of the commitment amount. If the amount available under the ABL Facility is less than the greater of (x) $50.0 million and (y) 15.0% of the lesser of the total commitments or the borrowing base under the ABL Facility or an event of default is continuing, we are required to repay outstanding loans with the cash we are required to deposit in collection accounts maintained with the agent under the ABL Facility.
We may voluntarily reduce the unutilized portion of the commitment amount and repay outstanding loans at any time upon three business days prior written notice without premium or penalty other than customary “breakage” costs with respect to Eurodollar, euro LIBOR and EURIBOR loans.
There is no scheduled amortization under the ABL Facility. The principal amount outstanding will be due and payable in full at maturity, on June 29, 2016 unless extended pursuant to the credit agreement.
The ABL Facility is secured, subject to certain exceptions (including appropriate limitations in light of U.S. federal income tax considerations on guaranties and pledges of assets by foreign subsidiaries, and certain pledges of such foreign subsidiaries’ stock, in each case to support loans to Aleris International or its domestic subsidiaries), by a first-priority security interest in substantially all of Aleris International’s current assets and related intangible assets located in the U.S., substantially all of the current assets and related intangible assets of substantially all of its wholly owned domestic subsidiaries located in the U.S., substantially all of the current assets and related intangible assets of the Canadian Borrower located in Canada and substantially all of the current assets (other than inventory located outside of the United Kingdom) and related intangibles of Aleris Recycling (Swansea) Ltd., of Aleris Switzerland GmbH and certain of its subsidiaries. The borrowers’ obligations under the ABL Facility are guaranteed by certain of our existing and future direct and indirect subsidiaries.
98
Table of Contents
The ABL Facility contains a number of covenants that, among other things and subject to certain exceptions, restrict Aleris International’s ability and the ability of its subsidiaries to:
| • | incur additional indebtedness; |
| • | pay dividends on our common stock and make other restricted payments; |
| • | make investments and acquisitions; |
| • | engage in transactions with our affiliates; |
| • | sell assets; |
| • | merge; and |
| • | create liens. |
Although the credit agreement governing the ABL Facility generally does not require Aleris International to comply with any financial ratio maintenance covenants, if the amount available under the ABL Facility is less than the greater of (x) $45.0 million or (y) 12.5% of the lesser of (i) the total commitments or (ii) the borrowing base under the ABL Facility at any time, a minimum fixed charge coverage ratio (as defined in the credit agreement) of at least 1.0 to 1.0 will apply. The credit agreement also contains certain customary affirmative covenants and events of default. Aleris International was in compliance with all of the covenants set forth in the credit agreement as of December 31, 2011.
6% Senior Subordinated Exchangeable Notes
On the Emergence Date, Aleris International issued $45.0 million aggregate principal amount of 6% senior subordinated exchangeable notes to the participants of the rights offering. The Exchangeable Notes have exchange rights at the holder’s option, after June 1, 2013, and are exchangeable for our common stock at a rate equivalent to 47.20 shares of our common stock per $1,000 principal amount of Exchangeable Notes (after adjustment for the payments of dividends in 2011), subject to further adjustment. The Exchangeable Notes may be redeemed at Aleris International’s option at specified redemption prices on or after June 1, 2013 or upon a fundamental change.
The Exchangeable Notes are unsecured, senior subordinated obligations of Aleris International and rank (i) junior to all of its existing and future senior indebtedness, including the ABL Facility; (ii) equally to all of its existing and future senior subordinated indebtedness; and (iii) senior to all of its existing and future subordinated indebtedness.
EBITDA and Adjusted EBITDA
We report our financial results in accordance with U.S. GAAP. However, our management believes that certain non-U.S. GAAP performance measures, which we use in managing the business, may provide investors with additional meaningful comparisons between current results and results in prior periods. EBITDA and Adjusted EBITDA, including segment Adjusted EBITDA, are examples of non-U.S. GAAP financial measures that we believe provide investors and other users of our financial information with useful information.
Management uses EBITDA and Adjusted EBITDA, including segment Adjusted EBITDA, as performance metrics and believes these measures provide additional information commonly used by the holders of the Senior Notes and parties to the ABL Facility with respect to the ongoing performance of our underlying business activities, as well as our ability to meet our future debt service, capital expenditures and working capital needs. In addition, EBITDA with certain
99
Table of Contents
adjustments is a component of certain covenants under the indenture governing the Senior Notes. Adjusted EBITDA, including the impacts of metal price lag, is a component of certain financial covenants under the credit agreement governing the ABL Facility.
Our EBITDA calculations represent net income (loss) attributable to Aleris Corporation before interest income and expense, provision for (benefit from) income taxes and depreciation and amortization. Adjusted EBITDA is defined as EBITDA excluding metal price lag, reorganization items, net, unrealized (gains) and losses on derivative financial instruments, restructuring and impairment charges (gains), the impact of recording inventory and other items at fair value through fresh-start and purchase accounting, currency exchange gains and losses on debt, stock-based compensation expense, start-up expenses, and certain other gains and losses. Segment Adjusted EBITDA represents Adjusted EBITDA on a per segment basis. EBITDA as defined in the indenture governing the Senior Notes also limits the amount of adjustments for cost savings, operational improvement and synergies for the purpose of determining our compliance with such covenants. Adjusted EBITDA as defined under the ABL Facility also limits the amount of adjustments for restructuring charges incurred after the Emergence Date and requires additional adjustments be made if certain annual pension funding levels are exceeded. These thresholds were not met as of December 31, 2011.
EBITDA and Adjusted EBITDA, including segment Adjusted EBITDA, as we use them may not be comparable to similarly titled measures used by other companies. We calculate EBITDA and Adjusted EBITDA, including segment Adjusted EBITDA, by eliminating the impact of a number of items we do not consider indicative of our ongoing operating performance. You are encouraged to evaluate each adjustment and the reasons we consider it appropriate for supplemental analysis. However, EBITDA and Adjusted EBITDA, including segment Adjusted EBITDA, are not financial measurements recognized under U.S. GAAP, and when analyzing our operating performance, investors should use EBITDA and Adjusted EBITDA, including segment Adjusted EBITDA, in addition to, and not as an alternative for, net income (loss) attributable to Aleris Corporation, operating income, or any other performance measure derived in accordance with U.S. GAAP, or in addition to, and not as an alternative for, cash flow from operating activities as a measure of our liquidity. EBITDA and Adjusted EBITDA, including segment Adjusted EBITDA, have limitations as analytical tools, and they should not be considered in isolation or as a substitute for, or superior to, our measures of financial performance prepared in accordance with GAAP. These limitations include:
| • | They do not reflect our cash expenditures or future requirements for capital expenditures or contractual commitments; |
| • | They do not reflect changes in, or cash requirements for, working capital needs; |
| • | They do not reflect interest expense or cash requirements necessary to service interest expense or principal payments under the 6% senior subordinated exchangeable notes, the Senior Notes, or the ABL Facility; |
| • | They do not reflect certain tax payments that may represent a reduction in cash available to us; |
| • | Although depreciation and amortization are non-cash charges, the assets being depreciated and amortized may have to be replaced in the future, and EBITDA and Adjusted EBITDA, including segment Adjusted EBITDA, do not reflect cash requirements for such replacements; and |
100
Table of Contents
| • | Other companies, including companies in our industry, may calculate these measures differently and, as the number of differences in the way companies calculate these measures increases, the degree of their usefulness as a comparative measure correspondingly decreases. |
In addition, in evaluating Adjusted EBITDA, including segment Adjusted EBITDA, it should be noted that in the future we may incur expenses similar to the adjustments in the below presentation. Our presentation of Adjusted EBITDA, including segment Adjusted EBITDA, should not be construed as an inference that our future results will be unaffected by unusual or non-recurring items.
For reconciliations of EBITDA and Adjusted EBITDA to their most directly comparable financial measures presented in accordance with U.S. GAAP, see the tables below. For a reconciliation of segment Adjusted EBITDA to segment income (loss), which is the most directly comparable financial measure presented in accordance with U.S. GAAP, for each of the Rolled Products North America, Rolled Products Europe, Extrusions, Recycling and Specification Alloys North America and Recycling and Specification Alloys Europe segments, see the reconciliations in “—Our segments.”
| (Successor) | (Predecessor) | |||||||||||||||||
| (in millions) | For the year ended |
For the seven months ended December 31, 2010 |
For the five months ended May 31, 2010 |
For the year ended |
||||||||||||||
| Net income (loss) attributable to Aleris Corporation |
$ | 161.6 | $ | 71.4 | $ | 2,204.1 | $ | (1,187.4 | ) | |||||||||
| Interest expense, net |
46.3 | 7.0 | 73.6 | 225.4 | ||||||||||||||
| (Benefit from) provision for income taxes |
(4.2 | ) | 0.3 | (8.7 | ) | (61.8 | ) | |||||||||||
| Depreciation and amortization |
70.3 | 38.4 | 20.2 | 168.4 | ||||||||||||||
| EBITDA |
274.0 | 117.1 | 2,289.2 | (855.4 | ) | |||||||||||||
| Reorganization items, net(i) |
(1.3 | ) | 7.4 | (2,227.3 | ) | 123.1 | ||||||||||||
| Unrealized losses (gains) on derivative financial instruments |
37.8 | (19.8 | ) | 39.2 | (11.2 | ) | ||||||||||||
| (Favorable) unfavorable metal price lag(ii) |
(18.9 | ) | 21.0 | (34.6 | ) | (29.5 | ) | |||||||||||
| Restructuring and impairment charges (gains)(iii) |
4.4 | 12.1 | (0.4 | ) | 862.9 | |||||||||||||
| Impact of recording amounts at fair value through fresh-start and purchase accounting(iv) |
3.4 | 24.4 | 1.6 | 2.5 | ||||||||||||||
| Currency exchange losses (gains) on debt |
0.7 | (5.8 | ) | 32.0 | (17.0 | ) | ||||||||||||
| Stock-based compensation expense |
10.1 | 4.9 | 1.3 | 2.1 | ||||||||||||||
| Start-up expenses |
10.2 | 2.0 | — | — | ||||||||||||||
| Other(v) |
11.2 | (1.2 | ) | 1.0 | 4.2 | |||||||||||||
| Adjusted EBITDA |
$ | 331.6 | $ | 162.1 | $ | 102.0 | $ | 81.7 | ||||||||||
| (i) | See Note 4, “Fresh-start accounting,” and Note 3, “Reorganization under Chapter 11,” to our audited consolidated financial statements included elsewhere in this prospectus. |
| (ii) | Represents the financial impact of the timing difference between when aluminum prices included within our revenues are established and when aluminum purchase prices included in our cost of sales are established. This lag will, generally, increase our earnings and EBITDA in times of rising primary aluminum prices and decrease our earnings and EBITDA in times of declining primary aluminum prices; however, our use of derivative financial instruments seeks to reduce this impact. Metal |
101
Table of Contents
| price lag is net of the realized gains and losses from our derivative financial instruments. We exclude metal price lag from our determination of Adjusted EBITDA because it is not an indicator of the performance of our underlying operations. |
| (iii) | See Note 5, “Restructuring and impairment charges,” to our audited consolidated financial statements included elsewhere in this prospectus. |
| (iv) | Represents the impact of applying fresh-start and purchase accounting rules under U.S. GAAP which effectively eliminate the profit associated with acquired inventories by requiring those inventories to be adjusted to fair value through the purchase price allocation. The amounts represent $0.0 million, $33.0 million, $0.0 million and $0.0 million of adjustments to the recording of inventory for the year ended December 31, 2011, the seven months ended December 31, 2010, the five months ended May 31, 2010 and the year ended December 31, 2009, respectively. The amounts in the table also represent the fair value of derivative financial instruments as of the date of the acquisition by TPG of Aleris International in 2006 or Aleris International’s emergence from bankruptcy in 2010 that settled in each of the periods presented. These amounts are included in Adjusted EBITDA to reflect the total economic gains or losses associated with these derivatives. Absent adjustment, Adjusted EBITDA would reflect the amounts recorded in the financial statements as realized gains and losses, which represent only the change in value of the derivatives from the date of TPG’s acquisition of Aleris International or Aleris International’s emergence from bankruptcy to settlement. |
| (v) | Includes the write-down of inventories associated with plant closures and gains and losses on the disposal of assets. For the year ended December 31, 2011, also includes $11.9 million of contract termination costs associated with the cancellation of our research and development agreement with Tata Steel. |
102
Table of Contents
For the year ended December 31, 2011, the seven months ended December 31, 2010, the five months ended May 31, 2010 and the year ended December 31, 2009, our reconciliation of Adjusted EBITDA to net income (loss) attributable to Aleris Corporation and net cash provided (used) by operating activities is presented below.
| (Successor) | (Predecessor) | |||||||||||||||||
| (in millions) | For the year ended |
For the seven months ended December 31, 2010 |
For the five months ended May 31, 2010 |
For the year ended |
||||||||||||||
| Adjusted EBITDA |
$ | 331.6 | $ | 162.1 | $ | 102.0 | $ | 81.7 | ||||||||||
| Reorganization items, net |
1.3 | (7.4 | ) | 2,227.3 | (123.1 | ) | ||||||||||||
| Unrealized (losses) gains on derivative financial instruments |
(37.8 | ) | 19.8 | (39.2 | ) | 11.2 | ||||||||||||
| Favorable (unfavorable) metal price lag |
18.9 | (21.0 | ) | 34.6 | 29.5 | |||||||||||||
| Restructuring and impairment (charges) gains |
(4.4 | ) | (12.1 | ) | 0.4 | (862.9 | ) | |||||||||||
| Impact of recording amounts at fair value through fresh-start and purchase accounting |
(3.4 | ) | (24.4 | ) | (1.6 | ) | (2.5 | ) | ||||||||||
| Currency exchange (losses) gains on debt |
(0.7 | ) | 5.8 | (32.0 | ) | 17.0 | ||||||||||||
| Stock-based compensation expense |
(10.1 | ) | (4.9 | ) | (1.3 | ) | (2.1 | ) | ||||||||||
| Start-up expenses |
(10.2 | ) | (2.0 | ) | — | — | ||||||||||||
| Other |
(11.2 | ) | 1.2 | (1.0 | ) | (4.2 | ) | |||||||||||
| EBITDA |
274.0 | 117.1 | 2,289.2 | (855.4 | ) | |||||||||||||
| Interest expense, net |
(46.3 | ) | (7.0 | ) | (73.6 | ) | (225.4 | ) | ||||||||||
| Benefit from (provision for) income taxes |
4.2 | (0.3 | ) | 8.7 | 61.8 | |||||||||||||
| Depreciation and amortization |
(70.3 | ) | (38.4 | ) | (20.2 | ) | (168.4 | ) | ||||||||||
| Net income (loss) attributable to Aleris Corporation |
161.6 | 71.4 | 2,204.1 | (1,187.4 | ) | |||||||||||||
| Net loss attributable to noncontrolling interest |
(0.4 | ) | — | — | — | |||||||||||||
| Net income (loss) |
161.2 | 71.4 | 2,204.1 | (1,187.4 | ) | |||||||||||||
| Depreciation and amortization |
70.3 | 38.4 | 20.2 | 168.4 | ||||||||||||||
| (Benefit from) provision for deferred income taxes |
(33.6 | ) | (4.8 | ) | (11.4 | ) | (54.2 | ) | ||||||||||
| Reorganization items, net of payments |
(4.9 | ) | (26.3 | ) | (2,258.5 | ) | 97.9 | |||||||||||
| Restructuring and impairment charges (gains), net of payments |
0.6 | 8.8 | (5.9 | ) | 817.3 | |||||||||||||
| Stock-based compensation expense |
10.1 | 4.9 | 1.3 | 2.1 | ||||||||||||||
| Unrealized losses (gains) on derivative financial instruments |
37.8 | (19.8 | ) | 39.2 | (11.2 | ) | ||||||||||||
| Currency exchange losses (gains) on debt |
5.4 | — | 25.5 | (14.9 | ) | |||||||||||||
| Amortization of debt issuance costs |
6.3 | 2.5 | 27.8 | 109.1 | ||||||||||||||
| Other non-cash (gains) charges, net |
(8.9 | ) | (15.4 | ) | 18.3 | 1.7 | ||||||||||||
| Change in operating assets and liabilities: |
||||||||||||||||||
| Change in accounts receivable |
(13.0 | ) | 81.3 | (181.5 | ) | 119.5 | ||||||||||||
| Change in inventories |
15.7 | (46.6 | ) | (138.7 | ) | 159.3 | ||||||||||||
| Change in other assets |
(8.5 | ) | 37.0 | (15.2 | ) | (41.7 | ) | |||||||||||
| Change in accounts payable |
(18.4 | ) | 24.8 | 67.4 | (103.6 | ) | ||||||||||||
| Change in accrued liabilities |
46.8 | (37.1 | ) | 33.4 | (5.6 | ) | ||||||||||||
| Net cash provided (used) by operating activities |
$ | 266.9 | $ | 119.1 | $ | (174.0 | ) | $ | 56.7 | |||||||||
103
Table of Contents
Exchange rates
During 2011, the fluctuation of the U.S. dollar against other currencies resulted in unrealized currency translation gains that decreased our equity by $19.2 million. Currency translation adjustments are the result of the process of translating an international entity’s financial statements from the entity’s functional currency to U.S. dollars. Currency translation adjustments accumulate in consolidated equity until the disposition or liquidation of the international entities. We eliminated all of the translation adjustments previously included within consolidated equity as a result of Aleris International’s emergence from bankruptcy and the application of fresh-start accounting on June 1, 2010.
The Euro is the functional currency of substantially all of our European-based operations. In the future, our results of operations will continue to be impacted by the exchange rate between the U.S. dollar and the euro. In addition, we have other operations where the functional currency is not our reporting currency, the U.S. dollar, and our results of operations are impacted by currency fluctuations between the U.S. dollar and such other currencies. The Renminbi is the functional currency of our China operations.
Contractual obligations
We and our subsidiaries are obligated to make future payments under various contracts such as debt agreements, lease agreements and unconditional purchase obligations. The following table summarizes our estimated significant contractual cash obligations and other commercial commitments at December 31, 2011.
| Cash payments due by period | ||||||||||||||||||||
| (in millions) | Total | 2012 | 2013-2014 | 2015-2016 | After 2016 | |||||||||||||||
|
|
||||||||||||||||||||
| Long-term debt obligations |
$ | 612.7 | $ | 6.9 | $ | 2.4 | $ | 10.5 | $ | 592.9 | ||||||||||
| Interest on long-term debt obligations |
302.0 | 49.2 | 97.7 | 91.2 | 63.9 | |||||||||||||||
| Estimated postretirement benefit payments |
45.6 | 4.8 | 9.6 | 9.6 | 21.6 | |||||||||||||||
| Estimated pension benefit payments |
176.4 | 15.5 | 32.8 | 34.3 | 93.8 | |||||||||||||||
| Operating lease obligations |
24.6 | 7.8 | 10.7 | 3.9 | 2.2 | |||||||||||||||
| Estimated payments for asset retirement obligations |
14.4 | 1.9 | 3.4 | 0.6 | 8.5 | |||||||||||||||
| Purchase obligations |
2,205.5 | 1,261.1 | 820.9 | 123.5 | — | |||||||||||||||
| Uncertain tax positions |
19.5 | 19.5 | — | — | — | |||||||||||||||
|
|
|
|
|
|
|
|
|
|
|
|||||||||||
| Total |
$ | 3,400.7 | $ | 1,366.7 | $ | 977.5 | $ | 273.6 | $ | 782.9 | ||||||||||
|
|
||||||||||||||||||||
Our estimated funding for our funded pension plans and other postretirement benefit plans is based on actuarial estimates using benefit assumptions for discount rates, expected long-term rates of return on assets, rates of compensation increases, and health care cost trend rates. For our funded pension plans, estimating funding beyond 2012 will depend upon the performance of the plans’ investments, among other things. As a result, estimating pension funding beyond 2012 is not practicable. Payments for unfunded pension plan benefits and other postretirement benefit payments are estimated through 2020.
Operating lease obligations are payment obligations under leases classified as operating. Most leases are for a period of less than one year, but some extend for up to five years, and are primarily for items used in our manufacturing processes.
104
Table of Contents
Our estimated payments for asset retirement obligations are based on management’s estimates of the timing and extent of payments to be made to fulfill legal or contractual obligations associated with the retirement of certain long-lived assets. Amounts presented represent the future value of expected payments.
Our purchase obligations represent both cancelable and non-cancelable agreements (short-term and long-term) to purchase goods or services that are enforceable and legally binding on us that specify all significant terms, including fixed or minimum quantities to be purchased; fixed, minimum or variable price provisions; and the approximate timing of the transaction. Purchase obligations include the pricing of anticipated metal purchases using contractual metal prices or, where pricing is dependent upon the prevailing LME metal prices at the time of delivery, market metals prices as of December 31, 2011, as well as natural gas and electricity purchases using minimum contractual quantities and either contractual prices or prevailing rates. As a result of the variability in the pricing of many of our metals purchasing obligations, actual amounts paid may vary from the amounts shown above. Purchase obligations also include amounts associated with capital projects, including the construction of our rolling mill in China.
Uncertain tax positions taken or expected to be taken on an income tax return may result in additional payments to taxing jurisdictions. The amount in the preceding table includes interest accrued related to such positions as of December 31, 2011. The completion of an audit and of an appeal in a non-U.S. taxing jurisdiction is expected to result in a $19.4 million payment in 2012. If a taxing jurisdiction agrees with the tax position taken or expected to be taken or the applicable statute of limitations expires, then additional payments will not be necessary.
The ABL Facility carries variable interest rates and variable outstanding amounts for which estimating future interest payments is not practicable. There were no ABL Facility borrowings outstanding as of December 31, 2011.
Environmental contingencies
Our operations, like those of other basic industries, are subject to federal, state, local and international laws, regulations and ordinances. These laws and regulations (1) govern activities or operations that may have adverse environmental effects, such as discharges to air and water, as well as waste handling and disposal practices and (2) impose liability for costs of cleaning up, and certain damages resulting from, spills, disposals or other releases of regulated materials. It can be anticipated that more rigorous environmental laws will be enacted that could require us to make substantial expenditures in addition to those described in this prospectus. See “Business—Environmental.”
From time to time, our operations have resulted, or may result, in certain non-compliance with applicable requirements under such environmental laws. To date, any such non-compliance with such environmental laws have not had a material adverse effect on our financial position or results of operations. See Note 16, “Commitments and contingencies,” to our audited consolidated financial statements included elsewhere in this prospectus.
Critical accounting policies and estimates
The preparation of financial statements in conformity with U.S. GAAP requires our management to make estimates and judgments that affect the reported amounts of assets and liabilities and disclosure of contingent assets and liabilities at the date of the financial statements and the
105
Table of Contents
reported amounts of revenues and expenses during the reporting period. On an ongoing basis, we evaluate our estimates, including those related to the valuation of inventory, property and equipment and intangible assets, allowances related to doubtful accounts, income taxes, pensions and other postretirement benefits and environmental liabilities. Our management bases its estimates on historical experience, actuarial valuations and other assumptions believed to be reasonable under the circumstances. Actual results could differ from those estimates. Our accounting policies are more fully described in Note 2, “Summary of significant accounting policies,” to our audited consolidated financial statements included elsewhere in this prospectus. There have been no significant changes to our critical accounting policies or estimates during the years ended December 31, 2011 or 2010.
The following critical accounting policies and estimates are used to prepare our consolidated financial statements:
Application of fresh-start accounting
Fresh-start accounting results in a new basis of accounting and reflects the allocation of our estimated fair value to our underlying assets and liabilities. Our estimates of fair value are inherently subject to significant uncertainties and contingencies beyond our reasonable control. Accordingly, there can be no assurance that the estimates, assumptions, valuations, appraisals and financial projections will be realized, and actual results could vary materially.
The reorganization value was allocated to our assets in conformity with the procedures specified by ASC 805, “Business Combinations.” Liabilities existing as of the Emergence Date, other than deferred taxes, were recorded at the present value of amounts expected to be paid using appropriate risk adjusted interest rates. Deferred taxes were determined in conformity with applicable income tax accounting standards. Predecessor accumulated depreciation, accumulated amortization, retained deficit, common stock and accumulated other comprehensive loss were eliminated.
For further information on fresh-start accounting, see Note 4, “Fresh-start accounting,” to our audited consolidated financial statements as of December 31, 2011, included elsewhere in this prospectus.
Revenue recognition and shipping and handling costs
Revenues are recognized when title transfers and risk of loss passes to the customer in accordance with the provisions of the Securities and Exchange Commission (“SEC”) Staff Accounting Bulletin No. 104, “Revenue Recognition.” In the case of rolled aluminum product, title and risk of loss do not typically pass until the product reaches the customer, although on certain overseas shipments, title and risk of loss pass upon loading at the port of departure or unloading at the port of entry. For material that is tolled, revenue is recognized upon the performance of the tolling services for customers. For material that is consigned, revenue is not recognized until the product is used by the customer. Shipping and handling costs are included within “Cost of sales” in the Consolidated statements of operations included elsewhere in this prospectus.
106
Table of Contents
Inventories
Our inventories are stated at the lower of cost or market. Cost is determined using either an average cost or specific identification method and includes an allocation of manufacturing labor and overhead costs to work-in-process and finished goods. We review our inventory values on a regular basis to ensure that their carrying values can be realized. In assessing the ultimate realization of inventories, we are required to make judgments as to future demand requirements and compare that with the current or committed inventory levels. As the ultimate realizable value of most of inventories is based upon the price of prime or scrap aluminum, future changes in those prices may lead to the determination that the cost of some or all of our inventory will not be realized and we would then be required to record the appropriate adjustment to inventory values.
As a result of fresh-start accounting, all of our inventories were adjusted from their historical costs to fair value. This resulted in an increase of approximately $33.0 million, which was recognized as additional “Cost of sales” in our audited Consolidated statements of operations included elsewhere in this prospectus, primarily in the second quarter of 2010.
Derivative financial instruments
Derivative contracts are recorded at fair value under ASC 820 using quoted market prices and significant other observable and unobservable inputs. Fair value is defined as the price that would be received to sell an asset or paid to transfer a liability in an orderly transaction between market participants at the measurement date. The fair value hierarchy distinguishes between (1) market participant assumptions developed based on market data obtained from independent sources (observable inputs) and (2) an entity’s own assumptions about market participant assumptions developed based on the best information available in the circumstances (unobservable inputs). The fair value hierarchy consists of three broad levels, which gives the highest priority to unadjusted quoted prices in active markets for identical assets or liabilities (Level 1) and the lowest priority to unobservable inputs (Level 3). The three levels of the fair value hierarchy are described below:
Level 1—Unadjusted quoted prices in active markets that are accessible at the measurement date for identical, unrestricted assets or liabilities.
Level 2—Inputs other than quoted prices included within Level 1 that are observable for the asset or liability, either directly or indirectly, including quoted prices for similar assets or liabilities in active markets; quoted prices for identical or similar assets or liabilities in markets that are not active; inputs other than quoted prices that are observable for the asset or liability (e.g., interest rates); and inputs that are derived principally from or corroborated by observable market data by correlation or other means.
Level 3—Inputs that are both significant to the fair value measurement and unobservable.
We endeavor to utilize the best available information in measuring fair value. To estimate fair value, we apply an industry standard valuation model, which is based on the market approach. Where appropriate, valuations are adjusted for various factors such as liquidity, bid/offer spreads, and credit considerations. Such adjustments are generally based on available market evidence and unobservable inputs. Financial assets and liabilities are classified in their entirety based on the lowest level of input that is significant to the fair value measurement.
107
Table of Contents
Impairment of long-lived assets and amortizable intangible assets
We review the carrying value of property, plant and equipment to be held and used as well as amortizable intangible assets when events or circumstances indicate that their carrying value may not be recoverable. Factors that we consider important that could trigger our testing of the related asset groups for an impairment include current period operating or cash flow losses combined with a history of operating or cash flow losses, a projection or forecast that demonstrates continuing losses, significant adverse changes in the business climate within a particular business or current expectations that a long-lived asset will be sold or otherwise disposed of significantly before the end of its estimated useful life. We consider these factors quarterly and may test more frequently if changes in circumstances or the occurrence of events indicates that a potential impairment exists. To test for impairment, we compare the estimated undiscounted cash flows expected to be generated from the use and disposal of the asset or asset group to its carrying value. An asset group is established by identifying the lowest level of cash flows generated by the group of assets that are largely independent of cash flows of other assets. If cash flows cannot be separately and independently identified for a single asset, we will determine whether an impairment has occurred for the group of assets for which we can identify projected cash flows. If these undiscounted cash flows are less than their respective carrying values, an impairment charge would be recognized to the extent that the carrying values exceed estimated fair values. Although third-party estimates of fair value are utilized when available, the estimation of undiscounted cash flows and fair value requires us to make assumptions regarding future operating results, as well as appropriate discount rates, where necessary. The results of our impairment testing are dependent on these estimates which require significant judgment. The occurrence of certain events, including changes in economic and competitive conditions, could impact cash flows eventually realized and our ability to accurately assess whether an asset is impaired. Subsequent to emergence from bankruptcy, no factors have been identified that required testing our assets for impairment.
Indefinite lived intangible assets
Indefinite-lived intangible assets are related to our trade names and are not amortized. Indefinite-lived intangible assets are tested for impairment as of October 1st of each year and may be tested more frequently if changes in circumstances or the occurrence of events indicates that a potential impairment exists. The annual impairment test is based on a relief from royalty valuation approach. Significant assumptions used under this approach include the royalty rate, weighted average cost of capital and the terminal growth rate. As part of the annual impairment test, the non-amortized intangible assets are reviewed to determine if the indefinite status remains appropriate.
Credit risk
We recognize our allowance for doubtful accounts based on our historical experience of customer write-offs as well as specific provisions for customer receivable balances. In establishing the specific provisions for uncollectible accounts, we make assumptions with respect to the future collectability of amounts currently owed to us. These assumptions are based upon such factors as each customer’s ability to meet and sustain its financial commitments, its current and projected financial condition and the occurrence of changes in its general business, economic or market conditions that could affect its ability to make required payments to us in the future. In addition, we provide reserves for customer rebates, claims, allowances, returns and discounts based on, in
108
Table of Contents
the case of rebates, contractual relationships with customers, and, in the case of claims, allowances, returns and discounts, our historical loss experience and the lag time between the recognition of the sale and the granting of the credit to the customer. Our level of reserves for our customer accounts receivable fluctuates depending upon all of these factors. Significant changes in required reserves may occur in the future if our evaluation of a customer’s ability to pay and assumptions regarding the relevance of historical data prove incorrect.
Environmental and asset retirement obligations
Environmental obligations that are not legal or contractual asset retirement obligations and that relate to existing conditions caused by past operations with no benefit to future operations are expensed while expenditures that extend the life, increase the capacity or improve the safety of an asset or that mitigate or prevent future environmental contamination are capitalized in property, plant and equipment. Our environmental engineers and consultants review and monitor environmental issues at our existing operating sites. This process includes investigation and remedial action selection and implementation, as well as negotiations with other potentially responsible parties and governmental agencies. Based on the results of this process, we provide reserves for environmental liabilities when and if environmental assessment and/or remediation cost are probable and can be reasonably estimated in accordance with ASC 410-30 “Environmental Obligations.” While our accruals are based on management’s current best estimate of the future costs of remedial action, these liabilities can change substantially due to factors such as the nature and extent of contamination, changes in the required remedial actions and technological advancements. Our existing environmental liabilities are not discounted to their present values as the amount and timing of the expenditures are not fixed or reliably determinable.
Asset retirement obligations represent obligations associated with the retirement of tangible long-lived assets. Our asset retirement obligations relate primarily to the requirement to cap our three landfills, as well as costs related to the future removal of asbestos and costs to remove underground storage tanks. The costs associated with such legal obligations are accounted for under the provisions of ASC 410-20 “Asset Retirement Obligations,” which requires that the fair value of a liability for an asset retirement obligation be recognized in the period in which it is incurred and capitalized as part of the carrying amount of the long-lived asset. These fair values are based upon the present value of the future cash flows expected to be incurred to satisfy the obligation. Determining the fair value of asset retirement obligations requires judgment, including estimates of the credit adjusted interest rate and estimates of future cash flows. Estimates of future cash flows are obtained primarily from independent engineering consulting firms. The present value of the obligations is accreted over time while the capitalized cost is depreciated over the useful life of the related asset.
Deferred income taxes
We record deferred income taxes to reflect the net tax effects of temporary differences between the carrying amount of assets and liabilities for financial reporting purposes and the amounts used for income tax purposes. Deferred tax assets are regularly reviewed for recoverability. A valuation allowance is provided to reduce certain deferred tax assets to amounts that, in our estimate, are more likely than not to be realized.
109
Table of Contents
In determining the adequacy of recorded valuation allowances, management assesses our profitability by taking into account the current and forecasted amounts of earnings or losses as well as the forecasted taxable income as a result of the reversal of future taxable temporary differences. We maintain valuation allowances until sufficient positive evidence (for example, cumulative positive earnings and future taxable income) exists to support their reversal. Positive evidence currently exists in the form of forecasted earnings and taxable income in future periods; however, this evidence is of a subjective nature. Alternatively, our recent history of losses and Aleris International’s Chapter 11 bankruptcy reorganization provide objective negative evidence that management believes outweighs the subjective positive evidence. Therefore, we have determined that full valuation allowances for our net deferred tax assets continue to be appropriate in the U.S. and certain of our significant international jurisdictions.
Market risk management using financial instruments
The procurement and processing of aluminum in our industry involves many risks. Some of these risks include changes in metal and fuel prices. We attempt to manage these risks by the use of derivative financial instruments and long-term contracts. While these derivative financial instruments reduce, they do not eliminate these risks.
We do not account for derivative financial instruments as hedges. As a result, all of the related gains and losses on our derivative instruments are reflected in current period earnings.
The counterparties to the financial hedge agreements and futures contracts expose us to losses in the event of non-performance. All credit parties are evaluated for creditworthiness and risk assessment prior to initiating trading activities. In addition, the fair values of our derivative financial instruments include an estimate of the risk associated with non-performance by either ourselves or our counterparties.
Pension and postretirement benefits
Our pension and postretirement benefit costs are accrued based on annual analysis performed by our actuaries. These analysis are based on assumptions such as an assumed discount rate and an expected rate of return on plan assets. Both the discount rate and expected rate of return on plan assets require estimates and projections by management and can fluctuate from period to period. Our objective in selecting a discount rate is to select the best estimate of the rate at which the benefit obligations could be effectively settled. In making this estimate, projected cash flows are developed and matched with a yield curve based on an appropriate universe of high-quality corporate bonds. Assumptions for long-term rates of return on plan assets are based upon historical returns, future expectations for returns for each asset class and the effect of periodic target asset allocation rebalancing. The results are adjusted for the payment of reasonable expenses of the plan from plan assets. The historical long-term return on the plans’ assets exceeded the selected rates and we believe these assumptions are appropriate based upon the mix of the investments and the long-term nature of the plans’ investments.
The weighted average discount rate used to determine the U.S. pension benefit obligation was 4.50% as of December 31, 2011 compared to 5.20% as of December 31, 2010 and 5.75% as of December 31, 2009. The weighted average discount rate used to determine the European pension benefit obligation was 4.90% as of December 31, 2011 compared to 5.40% as of December 31, 2010 and 6.10% as of December 31, 2009. The weighted average discount rate used to determine the other postretirement benefit obligation was 4.30% as of December 31, 2011 compared to 5.20% as of December 31, 2010 and 5.75% as of December 31, 2009. The
110
Table of Contents
weighted average discount rate used to determine the net periodic benefit cost is the rate used to determine the benefit obligation in the previous year.
As of December 31, 2011, an increase in the discount rate of 0.5%, assuming inflation remains unchanged, would result in a decrease of $22.2 million in the pension and other postretirement obligations and a decrease of $0.3 million in the net periodic benefit cost. A decrease in the discount rate of 0.5% as of December 31, 2011, assuming inflation remains unchanged, would result in an increase of $24.3 million in the pension and other postretirement obligations and an increase of $0.2 million in the net periodic benefit cost.
The calculation of the estimate of the expected return on assets and additional discussion regarding pension and other postretirement plans is described in Note 12, “Employee benefit plans,” to our audited consolidated financial statements included elsewhere in this prospectus. The weighted average expected return on assets associated with our U.S. pension benefits was 8.25% for 2011, 8.25% for 2010 and 8.23% for 2009. The weighted average expected return on assets associated with our European pension benefits was 4.20% for 2011, 4.24% for 2010 and 5.23% for 2009. The expected return on assets is a long-term assumption whose accuracy can only be measured over a long period based on past experience. A variation in the expected return on assets by 0.5% as of December 31, 2011 would result in a variation of approximately $0.5 million in the net periodic benefit cost.
Unrecognized actuarial gains and losses subsequent to Aleris International’s emergence from bankruptcy related to changes in our assumptions and actual experiences differing from them will be recognized over the expected remaining service life of the employee group. As of December 31, 2011, the accumulated amount of unrecognized losses on pension and other postretirement benefit plans was $31.6 million, of which $0.7 million of amortization is expected to be recognized in 2012. Previous unrecognized actuarial gains and losses were eliminated in fresh-start accounting.
The actuarial assumptions used to determine pension and other postretirement benefits may differ from actual results due to changing market and economic conditions, higher or lower withdrawal rates or longer or shorter life spans of participants. We do not believe differences in actual experience or changes in assumptions will materially affect our financial position or results of operations.
Stock-based compensation
We use a Black-Scholes option-pricing model to estimate the grant-date fair value of the stock options awarded. Under this valuation method, the estimate of fair value is affected by the assumptions included in the following table. Expected equity volatility was determined based on historical stock prices and implied and stated volatilities of our peer companies. The following table summarizes the significant assumptions used to determine the fair value of the stock options granted during the year ended December 31, 2011 and the seven months ended December 31, 2010:
| Year ended December 31, 2011 |
Seven months ended December 31, 2010 |
|||||||
|
|
||||||||
| Weighted-average expected option life in years |
6.0 | 6.1 | ||||||
| Risk-free interest rate |
1.2% - 1.7% | 2.4% | ||||||
| Equity volatility factor |
50.0% - 58.0% | 59.4% | ||||||
| Dividend yield |
—% | —% | ||||||
|
|
||||||||
For further information on stock-based compensation, see Note 2, “Summary of significant accounting policies,” and Note 13, “Stock-based compensation” to our audited consolidated financial statements included elsewhere in this prospectus.
111
Table of Contents
Off-balance sheet transactions
We had no off-balance sheet arrangements at December 31, 2011.
Recently issued accounting standards updates
In June 2011, the FASB issued ASU 2011-05, “Comprehensive Income (Topic 220), Presentation of Comprehensive Income,” which requires companies to present the total of comprehensive income, the components of net income, and the components of other comprehensive income either in a single continuous statement of comprehensive income or in two separate but consecutive statements. While ASU 2011-05 changes the presentation of comprehensive income, there are no changes to the components that are recognized in net income or other comprehensive income under current accounting guidance. In December 2011, the FASB issued ASU 2011-12, “Comprehensive Income (Topic 220), Deferral of the Effective Date for Amendments to the Presentation of Reclassifications of Items Out of Accumulated Other Comprehensive Income in ASU 2011-05,” to defer the effective date of the specific requirement to present items that are reclassified out of accumulated other comprehensive income to net income alongside their respective components of net income and other comprehensive income. ASU 2011-05 and ASU 2011-12 are effective for interim and annual periods beginning after December 15, 2011, with early adoption permitted. We have elected to early adopt this new guidance and have presented total comprehensive income, the components of net income and the components of other comprehensive income in two separate but consecutive statements included in the consolidated financial statements included elsewhere in this prospectus. The adoption of this new guidance did not have a significant impact on our consolidated financial statements.
Quantitative and qualitative disclosures about market risk
In the ordinary course of our business, we are exposed to earnings and cash flow volatility resulting from changes in the prices of aluminum and, to a lesser extent, hardeners such as zinc and copper, and natural gas, as well as changes in currency and interest rates. For aluminum hedges, we use derivative instruments, such as forwards, futures, options, collars and swaps to manage the effect, both favorable and unfavorable, of such changes. For electricity and some natural gas price exposures, fixed price commitments are used.
Derivative contracts are used primarily to reduce uncertainty and volatility and cover underlying exposures and are held for purposes other than trading. Our commodity and derivative activities are subject to the management, direction and control of our Risk Management Committee, which is composed of our chief financial officer and other officers and employees that the chief executive officer designates. The Risk Management Committee reports to the Audit Committee of our Board of Directors, which has supervisory authority over all of its activities.
We are exposed to losses in the event of non-performance by the counterparties to the derivative contracts discussed below. Although non-performance by counterparties is possible, we do not currently anticipate any nonperformance by any of these parties. Counterparties are evaluated for creditworthiness and risk assessment prior to our initiating contract activities. The counterparties’ creditworthiness is then monitored on an ongoing basis, and credit levels are reviewed to ensure that there is not an inappropriate concentration of credit outstanding to any particular counterparty.
112
Table of Contents
Natural gas hedging
To manage the price exposure for natural gas purchases, we can fix the future price of a portion or all of our natural gas requirements by entering into financial hedge contracts.
We do not consider our natural gas derivatives instruments as hedges for accounting purposes and as a result, changes in the fair value of these derivatives are recorded immediately in our consolidated operating results. Under these contracts, payments are made or received based on the differential between the monthly closing price on the New York Mercantile Exchange (“NYMEX”) and the contractual hedge contract price. We can also enter into call option contracts to manage the exposure to increasing natural gas prices while maintaining the benefit from declining prices. Upon settlement of call option contracts, we receive cash and recognize a related gain if the NYMEX closing price exceeds the strike price of the call option. If the call option strike price exceeds the NYMEX closing price, no amount is received and the option expires. Option contracts require the payment of a premium which is recorded as a realized loss upon settlement or expiration of the option contract. Natural gas cost can also be managed through the use of cost escalators included in some of our long-term supply contracts with customers, which limits exposure to natural gas price risk. As of December 31, 2011 and 2010, we had 2.3 trillion and 7.7 trillion, respectively, of British thermal unit forward buy contracts. We anticipate consuming 8.7 trillion British thermal units of natural gas in our operations in 2012.
Metal hedging
Aluminum ingots, copper and zinc are internationally produced, priced and traded commodities, with the LME being the primary exchange. As part of our efforts to preserve margins, we enter into forward, futures and options contracts. For accounting purposes, we do not consider our metal derivative instruments as hedges and, as a result, changes in the fair value of these derivatives are recorded immediately in our consolidated operating results.
The selling prices of the majority of the orders for our rolled and extruded products are established at the time of order entry or, for certain customers, under long-term contracts. As the related raw materials used to produce these orders can be purchased several months or years after the selling prices are fixed, margins are subject to the risk of changes in the purchase price of the raw materials used for these fixed price sales. In order to manage this transactional exposure, LME future or forward purchase contracts are purchased at the time the selling prices are fixed. As metal is purchased to fill these fixed price sales orders, LME futures or forwards contracts are then sold. We can also use call option contracts, which function in a manner similar to the natural gas call option contracts discussed above, and put option contracts for managing metal price exposures. Option contracts require the payment of a premium which is recorded as a realized loss upon settlement or expiration of the option contract. Upon settlement of a put option contract, we receive cash and recognize a related gain if the LME closing price is less than the strike price of the put option. If the put option strike price is less than the LME closing price, no amount is paid and the option expires. As of December 31, 2011 and 2010, we had 0.2 million and 0.2 million metric tons of aluminum buy and sell forward contracts, respectively.
113
Table of Contents
Fair values and sensitivity analysis
The following table shows the fair values of outstanding derivative contracts at December 31, 2011 and the effect on the fair value of a hypothetical adverse change in the market prices that existed at December 31, 2011.
| Derivative (in millions) |
Fair value |
Impact of price change |
||||||
|
|
||||||||
| Metal |
$ | (12.9 | ) | $ | (11.2 | ) | ||
| Natural gas |
(4.2 | ) | (0.8 | ) | ||||
| Currency |
0.3 | (0.3 | ) | |||||
|
|
||||||||
The following table shows the fair values of outstanding derivative contracts at December 31, 2010 and the effect on the fair value of a hypothetical adverse change in the market prices that existed at December 31, 2010:
| Derivative (in millions) |
Fair value |
Impact of 10% adverse price change |
||||||
|
|
||||||||
| Metal |
$ | 20.8 | $ | (0.3 | ) | |||
| Natural gas |
0.3 | (3.6 | ) | |||||
|
|
||||||||
The disclosures above do not take into account the underlying commitments or anticipated transactions. If the underlying items were included in the analysis, the gains or losses on our derivative instruments would be offset by gains and losses realized on the purchase of the physical commodities. Actual results will be determined by a number of factors outside of our control and could vary significantly from the amounts disclosed. For additional information on derivative financial instruments, see Note 2, “Summary of significant accounting policies,” and Note 14, “Derivative and other financial instruments,” to our audited consolidated financial statements included elsewhere in this prospectus.
Currency exchange risks
The construction of an aluminum rolling mill in China has increased the China Joint Venture’s exposure to fluctuations in the euro as certain of the contracts to purchase equipment are denominated in euros while the source of funding is the U.S. dollar and Renminbi denominated China Loan Facility. Aleris International’s equity contributions are primarily made in euros to mitigate this exposure. In addition, the China Joint Venture has entered into euro call option contracts to manage this exposure if the U.S. dollar weakens while maintaining the benefit if the dollar strengthens. As with all of our other derivative financial instruments, these option contracts are not accounted for as hedges, and as a result, the changes in fair value are recorded immediately in the consolidated statements of operations. These contracts cover periods consistent with known or expected exposures through 2012. As of December 31, 2011, we had euro call option contracts covering a notional amount of $48.5 million.
The financial condition and results of operations of some of our operating entities are reported in various currencies and then translated into U.S. dollars at the applicable exchange rate for inclusion in our consolidated financial statements. As a result, appreciation of the U.S. dollar against these currencies will have a negative impact on reported revenues and operating profit, while depreciation of the U.S. dollar against these currencies will generally have a positive effect
114
Table of Contents
on reported revenues and operating profit. In addition, a portion of the revenues generated by our international operations are denominated in U.S. dollars, while the majority of costs incurred are denominated in local currencies. As a result, appreciation in the U.S. dollar will have a positive impact on earnings while depreciation of the U.S. dollar will have a negative impact on earnings.
Interest rate risks
As of December 31, 2011, approximately 90% of Aleris International’s debt obligations were at fixed rates. Aleris International is subject to interest rate risk related to the ABL Facility and the China Loan Facility, to the extent borrowings are outstanding under these facilities. As of December 31, 2011, Aleris International had no borrowings under the ABL Facility and the China Joint Venture had $56.7 million of borrowings under the China Loan Facility. Due to the fixed-rate nature of the majority of Aleris International’s debt, there would not be a significant impact on interest expense or cash flows from either a 10% increase or decrease in market rates of interest.
115
Table of Contents
Our company
Overview
We are a global leader in the manufacture and sale of aluminum rolled and extruded products, aluminum recycling and specification alloy manufacturing, with locations in North America, Europe and China. We do not smelt aluminum, nor do we participate in other upstream activities, including mining bauxite or refining alumina. Our business model strives to reduce the impact of aluminum price fluctuations on our financial results and protect and stabilize our margins, principally through pass-through pricing (market-based aluminum price plus a conversion fee), tolling arrangements (conversion of customer-owned material) and derivative financial instruments.
We operate 41 production facilities worldwide, with 14 production facilities that provide rolled and extruded aluminum products and 27 recycling and specification alloy manufacturing plants. We are currently constructing our 42nd production facility, a state-of-the-art aluminum rolling mill in China that will produce semi-finished rolled aluminum products, through the China Joint Venture. We possess a combination of low-cost, flexible and technically advanced manufacturing operations supported by an industry-leading research and development platform. Our facilities are strategically located to service our customers, which include a number of the world’s largest companies in the aerospace, automotive and other transportation industries, building and construction, containers and packaging and metal distribution industries. For the year ended December 31, 2011, we generated revenues of $4.8 billion, of which approximately 50% were derived from North America and the remaining 50% were derived from the rest of the world.
Business segments
During the fourth quarter of 2011, we realigned our operating structure into two global business units, Global Rolled and Extruded Products and Global Recycling. This realignment supports our growth strategies and provides the appropriate focus on our global market segments, including aerospace and defense, automotive and heat exchangers, as well as on our regionally based products and customers. Within our two global business units, we now report the following five segments: Rolled Products North America (“RPNA”), Rolled Products Europe (“RPEU”), Extrusions, Recycling and Specification Alloys North America (“RSAA”) and Recycling and Specification Alloys Europe (“RSEU”). These segments are based on the organizational structure that we use to evaluate performance, make decisions on resource allocations and perform business reviews of financial results. See below for a further description of our business segments.
| Global business unit | Segment | Description | ||
|
| ||||
| Global Rolled and Extruded Products | Rolled Products North America | Includes the production of rolled aluminum products in the North American metal distribution, building and construction, transportation and consumer durables end-use industries. We produce aluminum sheet and fabricated products using direct-chill and continuous-cast processes. Substantially all of these aluminum products are manufactured to specific customer requirements. | ||
116
Table of Contents
| Global business unit | Segment | Description | ||
|
| ||||
| Rolled Products Europe | Includes the production of rolled aluminum products in Germany and Belgium. Substantially all of these aluminum products are manufactured to specific customer requirements using direct-chill ingot cast technologies that allow us to use and offer a variety of alloys and products for a number of technically sophisticated applications, including aerospace plate and sheet, brazing sheet (clad aluminum material used for, among other applications, vehicle radiators and HVAC systems), automotive sheet, and heat treated plate for engineering uses, as well as for other uses in the transportation, construction, packaging and metal distribution industries. | |||
| Extrusions | Includes the production of soft and hard alloy extruded aluminum profiles in Germany, Belgium and China. Our extruded products are targeted at high demand end-uses in the automotive, building and construction, electrical, mechanical engineering and other transportation (rail and shipbuilding) industries. In addition, we perform value-added fabrication to most of our extruded products. | |||
| Global Recycling | Recycling and Specification Alloys North America | Includes recycling of aluminum and manufacturing of specification alloys serving customers in North America. Our recycling operations primarily convert aluminum scrap, dross (a by-product of the melting process) and other alloying agents as needed and delivers the recycled metal and specification alloys in molten or ingot form. Our specification alloy operations combine various aluminum scrap types with hardeners and other additives to produce alloys with chemical compositions and specific properties, including increased strength, formability and wear resistance, as specified by customers for their particular applications. Our specification alloy operations typically service customers in the automotive industry. Our other recycling operations service other aluminum producers and manufacturers, generally under tolling arrangements, where we convert customer-owned scrap and dross and return the recycled metal to our customers for a fee. | ||
| Recycling and Specification Alloys Europe | Includes the conversion of aluminum scrap, dross and other alloying agents in Germany, Norway and Wales. We provide recycled metal and specification alloys in molten or ingot form to our customers in the automobile industry. These operations also service other aluminum producers and manufacturers under tolling arrangements. | |||
|
| ||||
117
Table of Contents
In addition to these segments, we disclose corporate and other unallocated amounts, including the start-up operating results of the China Joint Venture. Corporate and unallocated amounts consist primarily of corporate general and administrative expenses, start-up expenses, interest income, interest expense, income taxes, depreciation and amortization, reorganization items, net, certain other gains and losses, certain realized and all unrealized gains and losses from derivative financial instruments, cash and cash equivalents, certain long-lived assets, long-term debt and income taxes receivable and payable.
Our historical financial results have been restated to conform with the current year presentation of the new business segments. See Note 17, “Segment information,” to our audited consolidated financial statements included elsewhere in this prospectus for financial and geographic information about our segments.
The following charts present the percentage of our consolidated revenue by segment and by end-use for the year ended December 31, 2011:
| Revenue by Segment | Revenue by End-Use | |
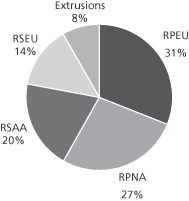
|
| |
Rolled Products North America
Our RPNA segment produces rolled aluminum products using the continuous-casting process at our facilities located in Uhrichsville, Ohio, and Richmond, Virginia, and the conventional, direct-chill rolling ingot casting process at our multi-purpose aluminum rolling mill in Lewisport, Kentucky, one of the largest in North America. We operate coating lines at the Lewisport, Kentucky mill and at our facilities in Ashville, Ohio, Roxboro, North Carolina and Clayton, New Jersey.
We believe that many of our facilities are low cost, flexible and allow us to maximize our use of scrap with proprietary manufacturing processes providing us with a competitive advantage. Our rolling mills have the flexibility to utilize primary or scrap aluminum, which allows us to optimize input costs and maximize margins. Approximately 96% of our revenues are derived utilizing a formula pricing model which allows us to pass through risks from the volatility of aluminum price changes by charging a market-based aluminum price plus a conversion fee and we strive to manage the remaining key commodity risks through our hedging programs.
118
Table of Contents
Our RPNA segment produces rolled aluminum products ranging from thickness (gauge) of 0.002 to 0.249 inches in widths of up to 72 inches. The following table summarizes our RPNA segment’s principal products and end-uses, major customers and competitors:
| Principal end use/product category |
Major customers | Competitors | ||
|
| ||||
| • Building and construction (roofing, rainware, and siding) |
• American Construction Metals, Amerimax Home Products, Kaycan, Ply Gem Industries, Norandex/Reynolds |
• Jupiter Aluminum, JW Aluminum, Quanex | ||
| • Metal distribution |
• Reliance Steel & Aluminum, Ryerson, Thyssen-Krupp, Metals USA, Samuel & Son |
• Alcoa, Novelis, Constellium (Alcan) | ||
| • Transportation equipment (truck trailers and bodies) |
• Great Dane, Utility Trailor, Aluminum Line, Hyundai Translead |
• Alcoa, Quanex, Novelis | ||
| • Consumer durables |
• Brunswick Boat Group, ABB |
• Alcoa, Novelis, Noranda, Skana Aluminum | ||
| • Specialty coil and sheet (cookware, fuel tanks, ventilation, cooling, and lamp bases) |
• Tramontina |
• Alcoa, Constellium (Alcan), Novelis, Skana Aluminum | ||
| • Converter foil, fins and tray materials |
• HFA, Pactiv |
• JW Aluminum, Noranda, Novelis | ||
|
| ||||
The following table presents certain sales volume and other financial information for the year ended December 31, 2011, the seven months ended December 31, 2010, the five months ended May 31, 2010 and the year ended December 31, 2009 for our RPNA segment:
| (Successor) | (Predecessor) | |||||||||||||||||
| (Dollars in millions, metric tons in thousands) |
For the year ended 2011 |
For the seven months 2010 |
For the five months ended |
For the year ended 2009 |
||||||||||||||
| Metric tons invoiced |
370.5 | 213.8 | 156.8 | 309.4 | ||||||||||||||
| Revenues |
$ | 1,346.4 | $ | 699.4 | $ | 507.2 | $ | 893.6 | ||||||||||
| Segment income |
$ | 111.1 | $ | 44.9 | $ | 49.4 | $ | 89.7 | ||||||||||
| Segment Adjusted EBITDA(1) |
$ | 104.9 | $ | 44.5 | $ | 43.6 | $ | 64.3 | ||||||||||
| Total segment assets |
$ | 514.7 | $ | 535.4 | $ | 467.8 | ||||||||||||
| (1) | Segment Adjusted EBITDA is a non-U.S. GAAP financial measure. See “Management’s discussion and analysis of financial condition and results of operations—Our segments” for a definition and discussion of segment Adjusted EBITDA and a reconciliation to segment income. |
Rolled Products Europe
Our RPEU segment consists of two rolled aluminum products manufacturing facilities, located in Germany and Belgium. Our rolling mill in Koblenz, Germany is one of the largest specialized rolling mills in Europe concentrated on aircraft plate and sheet, commercial plate and heat exchanger sheet.
119
Table of Contents
Our rolling mill in Duffel, Belgium is the third largest coil and sheet mill in Europe and a top European supplier of automotive body sheet. We have continued to upgrade our product mix and our ability to supply high-quality, innovative materials, most notably to the aerospace market. We have also developed specialties such as heat-treated, ultra thick aluminum plate and extra wide sheet to meet the requirements of special industrial sectors such as aerospace and automotive. During 2011, we announced plans to construct a $70 million cold mill at the Duffel facility to produce additional volumes of wide auto body sheet. The cold mill will produce the widest auto body sheet currently available in the industry to meet increased demand from auto makers as they address challenging emissions and fuel efficiency requirements.
Our RPEU segment remelts primary ingots, internal scrap, purchased scrap and master alloys to produce rolled aluminum products ranging from thickness (gauge) of 0.00031 to 11.0 inches in widths of up to 138 inches. The following table summarizes our RPEU segment’s principal products and end-uses, major customers and competitors:
| Principal end use/product category |
Major customers | Competitors | ||
|
| ||||
| • Aircraft plate and sheet |
• Airbus, Boeing, Bombardier, Embraer |
• Alcoa, Constellium (Alcan), Kaiser Aluminum | ||
| • Brazing coil and sheet (heat exchanger materials for automotive and general industrial) |
• Behr, Denso, Visteon/Halla, Dana |
• Alcoa, Hydro Aluminum, Novelis, SAPA | ||
| • Commercial plate and sheet (tooling, molding, road transport, shipbuilding, LNG transport and silos), |
• Amari, Amco, Thyssen-Krupp |
• Alcoa, AMAG, Constellium (Alcan), SAPA | ||
| • Automotive body sheet (inner, outer and structural parts) |
• Audi, BMW, Daimler, PSA, Renault, Volvo |
• Constellium (Alcan), Novelis | ||
| • Specialty coil and sheet (cookware, fuel tanks, ventilation, cooling, and lamp bases) |
• Gillette, SAG, Uponor Group |
• Alcoa, Constellium (Alcan), Hydro Aluminum, Novelis | ||
| • Metal distribution |
• Amari, MCB, Thyssen-Krupp |
• Alcoa, Hydro Aluminum, Novelis | ||
| • Foil stock |
• Alcoa, Euramax |
• Constellium (Alcan), Hydro Aluminum, Novelis | ||
|
| ||||
120
Table of Contents
The following table presents certain sales volume and other financial information for the year ended December 31, 2011, the seven months ended December 31, 2010, the five months ended May 31, 2010 and the year ended December 31, 2009 for our RPEU segment:
| (Successor) | (Predecessor) | |||||||||||||||||
| (Dollars in millions, metric tons in thousands) |
For the year ended December 31, 2011 |
For the seven months ended December 31, 2010 |
For the five months ended May 31, 2010 |
For the year ended December 31, 2009 |
||||||||||||||
| Metric tons invoiced |
314.4 | 183.8 | 120.2 | 231.8 | ||||||||||||||
| Revenues |
$ | 1,541.6 | $ | 763.7 | $ | 464.4 | $ | 936.7 | ||||||||||
| Segment income |
$ | 157.6 | $ | 40.4 | $ | 55.1 | $ | 37.2 | ||||||||||
| Segment Adjusted EBITDA(1) |
$ | 151.5 | $ | 75.0 | $ | 29.4 | $ | 32.6 | ||||||||||
| Total segment assets |
$ | 565.1 | $ | 571.1 | $ | 472.9 | ||||||||||||
| (1) | Segment Adjusted EBITDA is a non-U.S. GAAP financial measure. See “Management’s discussion and analysis of financial condition and results of operations—Our segments” for a definition and discussion of segment Adjusted EBITDA and a reconciliation to segment income. |
Extrusions
Our Extrusions segment includes five extrusion facilities located in Germany, Belgium and China. Industrial extrusions serving the automotive, construction and engineering sectors are made in all locations and the production of extrusion systems, including building systems, is concentrated in Vogt, Germany. Large extrusions and project business serving rail and other transportation sectors are concentrated in Bonn, Germany and Tianjin, China. Rods and hard alloys serving the aerospace, automotive, and industrial sectors are produced in Duffel, Belgium. The majority of our produced extrusion profiles are further fabricated to add value and meet performance and design criteria for customers.
Our Extrusions segment produces extruded aluminum products ranging from 0.2 to 350.0 kilograms per meter length. The following is a table of our Extrusions segment’s principal products and end-uses, major customers and competitors:
| Principal end use/product category |
Major customers | Competitors | ||
|
| ||||
| • Automotive and Industrial extrusions (construction, transport, and engineering sectors) |
• Bosch, Siemens |
• Alcoa, Constellium (Alcan), Hydro Aluminum, SAPA | ||
| • Project business extrusions (urban transport systems, high speed trains, mobile bridges for defense purposes and shipbuilding) |
• Alstom, Ansaldo Breda, Bombardier, Siemens, |
• Constellium (Alcan), SAPA | ||
| • Rods and hard alloy extrusions (automotive parts, aircraft, hydraulic and pneumatic systems) |
• Bharat Forge, Bosch, Conti Teves, Daimler, BMW, TRW |
• Alcoa, Constellium (Alcan), Eural, Fuchs, Impol | ||
|
| ||||
121
Table of Contents
The following table presents certain sales volume and other financial information for the year ended December 31, 2011, the seven months ended December 31, 2010, the five months ended May 31, 2010 and the year ended December 31, 2009 for our Extrusions segment:
| (Successor) | (Predecessor) | |||||||||||||||||
| (Dollars in millions, metric tons in thousands) |
For the year ended December 31, 2011 |
For the seven months ended December 31, 2010 |
For the five months ended May 31, 2010 |
For the year ended December 31, 2009 |
||||||||||||||
| Metric tons invoiced |
75.7 | 42.6 | 29.4 | 65.0 | ||||||||||||||
| Revenues |
$ | 410.3 | $ | 214.6 | $ | 132.5 | $ | 342.9 | ||||||||||
| Segment income (loss) |
$ | 10.9 | $ | 5.3 | $ | 2.7 | $ | (1.7 | ) | |||||||||
| Segment Adjusted EBITDA(1) |
$ | 7.9 | $ | 10.4 | $ | 1.1 | $ | 0.6 | ||||||||||
| Total segment assets |
$ | 126.0 | $ | 117.1 | $ | 120.0 | ||||||||||||
| (1) | Segment Adjusted EBITDA is a non-U.S. GAAP financial measure. See “Management’s discussion and analysis of financial condition and results of operations—Our segments” for a definition and discussion of segment Adjusted EBITDA and a reconciliation to segment income (loss). |
Recycling and Specification Alloys North America
Our RSAA segment operations primarily convert aluminum scrap, dross (a by-product of the melting process) and other alloying agents as needed and deliver the recycled metal and specification alloys in molten or ingot form to our customers. We believe the benefits of recycling, which includes substantial energy and capital investment savings related to the cost of smelting primary aluminum, support the long-term growth of this method of aluminum production, especially as concerns over energy use and carbon emissions grow. Our specification alloy operations combine various aluminum scrap types with hardeners and other additives to produce alloys with chemical compositions and specific properties, including increased strength, formability and wear resistance, as specified by customers for their particular applications. Many of our plants in this segment are located near our major customers’ facilities. The close proximity of these plants to our customers’ facilities allows us to provide deliveries of molten aluminum by customized trucks with hot metal crucibles. The molten aluminum is then poured from the crucible into a customer’s furnace, saving the customer the time and expense of remelting ingots. This delivery method lowers our customers’ energy and capital expenses as well as metal melt loss, thereby increasing their productivity. Approximately 61% of the total volumes shipped in 2011 were under tolling arrangements, where we convert customer-owned scrap and dross and return the recycled metal to our customers for a fee. We operate 21 strategically located production plants in North America, with 19 in the United States, one in Canada and one in Mexico.
122
Table of Contents
The following table summarizes our RSAA segment’s principal products and end-uses, major customers and competitors:
| Principal end use/ product category |
Major customers | Competitors | ||
|
| ||||
| • Aluminum Production (containers and packaging, general industrial) |
• Alcoa, Constellium, Hydro Aluminum |
• Scepter, Smelter Service Corporation, Tennessee Aluminum Processors | ||
| • Automotive |
• Chrysler, General Motors, Honda, Nemak, Toyota |
• Audubon Metals, Spectro, Superior Alloys, Timco | ||
|
| ||||
The following table presents certain sales volume and other financial information for the year ended December 31, 2011, the seven months ended December 31, 2010, the five months ended May 31, 2010 and the year ended December 31, 2009 for our RSAA segment:
| (Successor) | (Predecessor) | |||||||||||||||||
| (Dollars in millions, metric tons in thousands) |
For the year ended December 31, 2011 |
For the seven months ended December 31, 2010 |
For the five months ended May 31, 2010 |
For the year ended December 31, 2009 |
||||||||||||||
| Metric tons invoiced |
894.5 | 560.7 | 349.6 | 690.6 | ||||||||||||||
| Revenues |
$ | 983.8 | $ | 540.5 | $ | 373.7 | $ | 564.2 | ||||||||||
| Segment income |
$ | 80.9 | $ | 33.8 | $ | 29.7 | $ | 18.9 | ||||||||||
| Segment Adjusted EBITDA(1) |
$ | 80.9 | $ | 35.7 | $ | 29.7 | $ | 22.5 | ||||||||||
| Total segment assets |
$ | 277.4 | $ | 219.4 | $ | 208.4 | ||||||||||||
| (1) | Segment Adjusted EBITDA is a non-U.S. GAAP financial measure. See “Management’s discussion and analysis of financial condition and results of operations—Our segments” for a definition and discussion of segment Adjusted EBITDA and a reconciliation to segment income. |
Recycling and Specification Alloys Europe
Our RSEU segment consists of seven facilities located in Germany, Norway and Wales. This segment’s facilities operate in a similar manner as those in the RSAA segment with the exception of milling. Our RSEU segment supplies specification alloys to the European automobile industry and serves other European aluminum industries from its plants. Approximately 51% of the volume shipped from this segment in 2011 was through tolling arrangements.
The following table summarizes our RSEU segment’s principal products and end-uses, major customers and competitors:
| Principal end use/product category |
Major customers | Competitors | ||
|
| ||||
| • Aluminum Production (containers and packaging, general industrial) |
• Alcan, Alcoa, Hydro Aluminum, Novelis |
• Trimet | ||
| • Automotive |
• BMW, Daimler, Nemak, Volkswagen |
• AMAG, Oetinger, Raffmetal, Trimet | ||
|
| ||||
123
Table of Contents
The following table presents certain sales volume and other financial information for the year ended December 31, 2011, the seven months ended December 31, 2010, the five months ended May 31, 2010 and the year ended December 31, 2009 for our RSEU segment:
| (Successor) | (Predecessor) | |||||||||||||||||
| (Dollars in millions, metric tons in thousands) |
For the year ended December 31, 2011 |
For the seven months ended December 31, 2010 |
For the five months ended May 31, 2010 |
For the year ended December 31, 2009 |
||||||||||||||
| Metric tons invoiced |
387.2 | 220.3 | 152.0 | 310.6 | ||||||||||||||
| Revenues |
$ | 685.1 | $ | 332.9 | $ | 214.5 | $ | 353.6 | ||||||||||
| Segment income (loss) |
$ | 35.3 | $ | 16.8 | $ | 10.9 | $ | (1.5 | ) | |||||||||
| Segment Adjusted EBITDA(1) |
$ | 35.3 | $ | 20.7 | $ | 10.9 | $ | (4.4 | ) | |||||||||
| Total segment assets |
$ | 169.0 | $ | 158.8 | $ | 114.2 | ||||||||||||
| (1) | Segment Adjusted EBITDA is a non-U.S. GAAP financial measure. See “Management’s discussion and analysis of financial condition and results of operations—Our segments” for a definition and discussion of segment Adjusted EBITDA and a reconciliation to segment income (loss). |
Company history
Aleris International was formed at the end of 2004 through the merger of Commonwealth Industries, Inc. and IMCO Recycling, Inc. Since then Aleris International has grown through a combination of organic growth and strategic acquisitions, the most significant of which was the 2006 acquisition of the downstream aluminum business of Corus Group plc (“Corus Aluminum”). The Corus Aluminum acquisition doubled its size and significantly expanded both its presence in Europe and its ability to manufacture higher value-added products, including aerospace and auto body sheet.
Aleris International was acquired by Texas Pacific Group (“TPG”) in December 2006 and taken private. In 2007, Aleris International sold its zinc business in order to focus on its core aluminum business.
On February 12, 2009, Aleris International, along with certain of its U.S. subsidiaries, filed voluntary petitions for Chapter 11 bankruptcy protection in the United States Bankruptcy Court for the District of Delaware. The bankruptcy filings were the result of a liquidity crisis brought on by the global recession and financial crisis. Aleris International’s ability to respond to the liquidity crisis was constrained by its highly leveraged capital structure, which at filing included $2.7 billion of debt, resulting from the 2006 leveraged buyout of Aleris International. As a result of the severe economic decline, Aleris International experienced sudden and significant volume reductions across each end-use industry it served and a precipitous decline in the LME price of aluminum. These factors reduced the availability of financing under Aleris International’s revolving credit facility and required the posting of cash collateral on aluminum metal hedges. Accordingly, Aleris International sought bankruptcy protection to alleviate liquidity constraints and restructure its operations and financial position. Aleris International emerged from bankruptcy on June 1, 2010 with sufficient liquidity and a capital structure that allows us to pursue our growth strategy. TPG exited our business during this time and Aleris received significant support from new equity investors, led by the majority-owner Oaktree Funds, as well as certain investment funds managed by affiliates of Apollo Management Holdings, L.P. and Sankaty Advisors, LLC.
124
Table of Contents
The Company was formed as a Delaware corporation in 2010 in connection with Aleris International’s reorganization to acquire the reorganized business of Aleris International upon emergence from bankruptcy.
Industry overview
Aluminum is a widely-used, attractive industrial material. Compared to several alternative metals such as steel and copper, aluminum is lightweight, has a high strength-to-weight ratio and is resistant to corrosion. Aluminum can be recycled repeatedly without any material decline in performance or quality. The recycling of aluminum delivers energy and capital investment savings relative to both the cost of producing primary aluminum and many other competing materials. The penetration of aluminum into a wide variety of applications continues to grow. We believe several factors support fundamental long-term growth in aluminum consumption generally and demand for those products we produce specifically, including urbanization in emerging economies, economic recovery in developed economies and an increasing global focus on sustainability.
The following chart illustrates expected global demand for primary aluminum:
The global aluminum industry consists of primary aluminum producers with bauxite mining, alumina refining and aluminum smelting capabilities; aluminum semi-fabricated products manufacturers, including aluminum casters, recyclers, extruders and flat rolled products producers; and integrated companies that are present across multiple stages of the aluminum production chain. The industry is cyclical and is affected by global economic conditions, industry competition and product development.
125
Table of Contents
Primary aluminum prices are determined by worldwide forces of supply and demand and, as a result, are volatile. This volatility has a significant impact on the profitability of primary aluminum producers whose selling prices are typically based upon prevailing LME prices while their costs to manufacture are not highly correlated to LME prices. Aluminum rolled and extruded product prices are generally determined on a metal cost plus conversion fee basis. For the year ended December 31, 2011, approximately 58% of the total metric tons shipped by our global recycling and specification alloy business unit were under tolling arrangements. As a result, the impact of aluminum price changes on the manufacture of these products is significantly less than the impact on primary aluminum producers.
We participate in select segments of the aluminum fabricated products industry, including rolled and extruded products; we also recycle aluminum and produce aluminum specification alloys. We do not smelt aluminum, nor do we participate in other upstream activities, including mining bauxite or refining alumina. Since the majority of our products are sold on a market-based aluminum price plus conversion fee basis or under tolling arrangements, we are less exposed to aluminum price volatility.
Our competitive strengths
We believe that a combination of the following competitive strengths differentiates our business and allows us to maintain and build upon our strong industry position:
Well positioned to benefit from long-term growth in aluminum consumption
As a leader in the manufacture and sale of aluminum rolled and extruded products, as well as in aluminum recycling and specification alloy manufacturing, we believe we are well positioned to participate in the long-term growth in aluminum consumption generally, and demand for those products we produce specifically. We also believe the trend toward aluminum recycling will continue, driven by its lower energy and capital equipment costs as compared to those of primary aluminum producers.
In certain industries, such as automotive, aluminum, because of its strength-to-weight ratio, is the metal of choice for “light-weighting” and increasing fuel efficiency. As a result, aluminum is replacing other materials more rapidly than before. We believe that this trend will accelerate as increased European Union and U.S. regulations relating to reductions in carbon emissions and fuel efficiency, as well as high fuel prices, will force the automotive industry to increase its use of aluminum to “light-weight” vehicles. According to the International Aluminum Institute, global greenhouse gas savings from the use of aluminum for light-weighting vehicles have the potential to double between 2005 and 2020 to 500 million metric tons of carbon dioxide per year.
126
Table of Contents
The following charts illustrate expected global demand for aluminum products:
|
|
North American light vehicle aluminum content as a percent of curb weight
| |
Leading positions in attractive industry segments
We believe we are the number one supplier by volume of recycled aluminum specification alloy material in both the United States and Europe to the automotive industry and also the number two supplier by volume of aluminum automotive sheet to the European automotive industry.
We believe we are the third largest global supplier of aerospace sheet and plate based on capacity. We have benefited from the historical growth trends of the aerospace industry and have diversified into commercial, regional and business jet end-use industries, as well as defense applications. The technical and quality requirements needed to supply the aerospace industry provide a significant competitive advantage. Demand for our aerospace products, which typically trend with aircraft backlog and build rates, continued to recover in 2011. In 2011, the order backlog of Airbus and Boeing, combined, increased 17% from 7,000 planes to 8,200 planes. In line with this trend, our contracted aerospace volumes for 2012 support increased demand from our customers in 2012 to meet higher build rates associated with growing backlogs. Longer term, China is projected to be a key driver of aluminum plate demand for the manufacture of aircraft and other industrial applications. Through the China Joint Venture we are building a state-of-the-art aluminum rolling mill, which we believe will be the first facility in China capable of meeting the exacting standards of the global aerospace industry. As the first mover for these products in this important region, we believe we are well positioned to grow our share of global aerospace plate as well as additional value-added products as we can expand the mill’s capabilities over time.
We are also one of the largest suppliers of aluminum to the building and construction industry in North America. We believe the building and construction industry is at a cyclical low from a volume perspective. We are well-positioned to capture increasing volumes as these industries recover. Additionally, by volume, we believe we are the second largest global supplier of brazing sheet, a technically demanding material that is used in heat exchangers by automotive manufacturers and in
127
Table of Contents
other heat exchanger applications. Aluminum continues to replace brass, copper and other materials in heat exchangers and its growth is being augmented by the increasing prevalence of air conditioners in automobiles.
Global platform with a broad and diverse customer base
Our main end-use industries served are aerospace, automotive and other transportation industries, building and construction, containers and packaging, as well as metal distribution in numerous geographic regions. Our business is not dependent on any one industrial segment or any particular geographic region. Our geographic diversification will be further enhanced by increased exposure to China as a result of the China Joint Venture.
The following charts present the percentage of our consolidated revenue by end-use and by geographic region for the year ended December 31, 2011:
| Revenue by End-Use | Revenue by Geographic Region | |
|
|
| |
Long-term customer relationships
We have long-standing relationships with many of our largest customers, which include the following leading global companies in our key end-use industries.
| Aerospace | Automotive and transportation | |||
|
| ||||
| • Airbus |
• Audi |
• General Motors | ||
| • Boeing |
• BMW |
• Great Dane | ||
| • Embraer |
• Bosch |
• Honda | ||
| • Chrysler |
• Joseph Behr | |||
| • Daimler |
• Visteon | |||
|
| ||||
|
| ||||
| Building and construction | Distribution | Packaging and other | ||
|
| ||||
| • Norandex/Reynolds |
• Reliance Steel & Aluminum |
• Constellium | ||
| • Ply Gem Industries |
• Ryerson |
• Alcoa | ||
| • Thyssen-Krupp |
• Novelis | |||
|
| ||||
We believe these relationships are mutually beneficial, offering us a consistent base of customer demand and allowing us to plan and manage our operations more effectively. Our ten largest
128
Table of Contents
customers were responsible for approximately 27% of our consolidated revenues for the year ended December 31, 2011 and no one customer accounted for more than approximately 5% of those revenues. We have long standing relationships with our customers, including an average of 19 years of service to our top 10 customers. Knowledge gained from long-term customer relationships helps us provide our customers with superior service, including product innovation and just-in-time inventory management.
Industry-leading research, development and technology capabilities
We have industry-leading research, development and technology capabilities. We believe our aerospace and automotive products meet the most technically demanding customer quality and product performance requirements in the industry. Our efforts in research and development and technology allow us to focus on technically demanding processes, products and applications, which create a potential to differentiate us from our competitors by allowing us to supply higher quality value-added products. Because of these capabilities and our reputation for technical excellence, we often participate on the product design teams of our customers. We believe our research and development and technology capabilities will allow us to continue to grow in higher value-added applications that meet the developing needs of our customers.
Broad range of efficient manufacturing capabilities
We possess a broad range of capabilities within our manufacturing operations that allow us to compete effectively in numerous end-use industries and geographies.
| • | Our rolled products businesses compete across a number of end-use industries ranging from the most demanding heat treat aerospace plate and sheet applications to high volume applications such as building and construction and general distribution. These operations benefit from our efficiency, flexibility and technical competence, and include our best-in-class rolling mill in Koblenz, Germany, one of the most technically sophisticated rolling mills in the world, as well as our scrap-based low-cost continuous-cast operations in Uhrichsville, Ohio, both of which we believe are among the lowest cost rolled aluminum production facilities in the world for their targeted industries. |
| • | Our extruded products business produces a wide range of hard and soft alloy extruded aluminum products serving a number of end-use industries. |
| • | Our recycling and specification alloy manufacturing operations rely on a network of facilities that have rotary and reverbatory melting furnaces, which are among the lowest cost and most efficient furnaces in the industry, and supply molten aluminum and cast ingots to some of the largest aluminum and automotive companies in the world. |
Our ability to manufacture a wide range of product offerings across multiple end-use industries and geographies reduces our dependence on any single industry, region or product. Our flexible manufacturing operations allow us to increase or decrease production levels to meet demand. During the recent economic downturn, we adjusted our production levels by temporarily idling our Richmond rolling mill facility and furnaces in our recycling and specification alloy manufacturing operations, restructuring our German extrusion and Duffel, Belgium rolled and extruded products operations, which permanently reduced headcount by over 500 employees, and reducing overhead costs in our German manufacturing operations through Kurzarbeit, a short-term work scheme in which the German Federal Employment Agency subsidizes the wages of employees while employers cut back their working time.
129
Table of Contents
Experienced management team and Board of Directors
Our executive officers and key leaders have a diversity of industry experience, including on average more than 20 years of experience with various manufacturing companies, including managing Aleris when it was a public company prior to its leveraged buyout in 2006. Our management team has expertise in the commercial, technical and management aspects of our business, which provides for focused marketing efforts, quality and cost controls and safety and environmental improvement. Our management team successfully led Aleris International through its emergence from bankruptcy and continues to focus on implementing our business strategies. Our Board of Directors includes current and former executives from Exelon, General Motors and The Mosaic Company who bring extensive experience in operations, finance, governance and corporate strategy. See “Management.”
Our business strategies
We expect to sustain and grow our Company and build on our strong industry position by pursuing the following strategies:
Continue to grow our core business and enhance our product mix
We intend to continue to grow our core business by capturing the full benefits of the economic recovery in our key end-use industries and optimizing our production facilities to ensure we remain one of the lowest cost producers for our product portfolio through targeted technology upgrades and the application of AOS.
Furthermore, we believe we have numerous opportunities to enhance our product mix. Currently, we are:
| • | transitioning many of our transportation customers from direct-chill based products to lower cost scrap-based continuous cast products, thereby providing our customers lower price points while enhancing our operating efficiencies and profitability; |
| • | enhancing our recycling capabilities in North America and Europe to increase flexibility and capacity to leverage lower-cost scrap types and broaden our alloy product offerings; |
| • | leveraging and expanding our rolled products technology to capture fast growing demand in select segments, such as auto body sheet, which we believe will grow as automakers work to meet stringent regulatory requirements on carbon reductions by using aluminum to reduce vehicles’ weight and increase fuel efficiency; |
| • | proactively assessing and managing profitability of our customer and product portfolio to focus on higher value business; and |
| • | targeting research and development efforts towards collaboration with customers to enhance our product offerings. |
We intend to continue to supply higher value alloys targeting aerospace, automotive and other transportation industries. We will seek to extend our lower cost continuous casting operations to produce higher value rolled aluminum products.
130
Table of Contents
Continue to expand in China and other select international regions
We intend to expand our global operations where we see the opportunity to enhance our manufacturing capabilities, grow with existing customers, gain new customers or penetrate higher-growth industries and regions. We believe disciplined expansion focused on these objectives will allow us to achieve attractive returns. Our international expansion has followed these principles and includes:
| • | the formation of the China Joint Venture, which is building a state-of-the-art aluminum rolling plate mill in Zhenjiang City, Jiangsu Province in China to produce value-added plate products for the aerospace, general engineering and other transportation industry segments in China and has designed the mill with the capability to expand into other high value-added products; and |
| • | expanding our existing operations in China by moving our idled extrusion press from Duffel, Belgium to our Tianjin, China extrusion plant, which will position us to continue to capture growth in China and better serve our existing customers with operations in that region. |
We expect demand for aluminum plate in China and other regions will grow, driven by the development and expansion of industries serving aerospace, engineering and other heavy industrial applications. As the first mover for high technology aerospace products in this important region, we believe we are well positioned to grow our share of aerospace and other plate demand.
We intend to continue to pursue global expansion opportunities in a disciplined, deliberate manner. Additionally, we believe that the combination of our efficient furnaces, scrap processing techniques and global customer base provides us with a highly competitive business model that is capable of operating in emerging economies.
Continue to focus on the Aleris Operating System to drive productivity
Our culture focuses on continuous improvement, achievement of synergies and optimal use of capital resources. As such, we have established the AOS, a company-wide ongoing initiative, to align and coordinate all key processes of our operations. AOS is an integrated system of principles, operating practices and tools that engages all employees in the transformation of our core business processes and the relentless pursuit of value creation. We focus on key operating metrics for all of our global businesses and plants and strive to achieve best practices both internally and in comparison with external benchmarks. The AOS initiative utilizes various tools, including Six Sigma and Lean methodologies, to drive sustainable productivity improvements. Our AOS and productivity programs generated approximately $32 million of net cost savings for the year ended December 31, 2011.
We believe there are significant opportunities to further reduce our manufacturing and other costs and improve profitability by continuing to deploy AOS. We believe AOS initiatives will generate productivity gains and enable us to more than offset base inflation within our operations by continuous process improvements.
131
Table of Contents
Limiting our exposure to commodity price fluctuations
We continuously seek to reduce the impact of aluminum price fluctuations on our business by:
| • | using formula pricing in our rolled and extruded products businesses, based on a market-based primary aluminum price plus a conversion fee which effectively passes aluminum costs through to our customers for 88% of our global rolled products sales; |
| • | aligning physical aluminum purchases with aluminum sales; |
| • | hedging fixed price forward sales with the use of financial and commodity derivatives to protect transaction margins, which are margins associated with the sale of products and the conversion fees we earn on such sales; |
| • | hedging uncommitted or open inventory positions to protect our operating results and financial condition from the impact of changing aluminum prices on inventory values; and |
| • | pursuing tolling arrangements that reduce exposure to aluminum and other commodity price fluctuations where customer metal is available and which accounted for approximately 58% of the total metric tons invoiced in our global recycling and specification alloy manufacturing operations for the year ended December 31, 2011. |
These techniques minimize both transactional margin and inventory valuation risk. Additionally, we seek to reduce the effects of copper, zinc, natural gas and electricity price volatility through the use of financial derivatives and forward purchases as well as through price escalators and pass-throughs contained in some of our customer supply agreements.
Selectively pursue strategic transactions
We have grown significantly through the successful completion of 11 strategic acquisitions from 2004 through 2008 targeted at broadening product offerings and geographic presence, diversifying our end-use customer base and increasing our scale and scope. We believe that a number of acquisition opportunities exist in the industries in which we operate. We focus on acquisitions that we expect would increase earnings and from which we typically would expect to be able to realize significant operational efficiencies within 12 to 24 months through the integration process. We prudently evaluate these opportunities as potential enhancements to our existing operating platforms. We also consider strategic alliances, where appropriate, to achieve operational efficiencies or expand our product offerings. In addition, we consider potential divestitures of non-strategic businesses from time to time. We continue to consider strategic alternatives on an ongoing basis, including having discussions concerning potential acquisitions and divestitures that may be material.
Sales and marketing
Global Rolled and Extruded Products
Products manufactured by our RPNA and RPEU segments are sold to end-users, as well as to distributors, principally for use in the aerospace, transportation, automotive, building and construction, electrical, mechanical engineering, metal distribution and packaging industries throughout North America and Europe. The main customers for our extruded products are the
132
Table of Contents
building and construction, transport (automotive, rail and shipbuilding), electrical and mechanical engineering segments. Backlog for these segments as of December 31, 2011 and 2010 were approximately $89.8 million and $78.8 million for RPNA, $283.9 million and $356.3 million for RPEU, and $78.7 million and $97.4 million for Extrusions, respectively.
Sales of rolled and extruded products are made through the segments’ own sales forces, which are strategically located to provide international coverage, and through a broad network of sales offices and agents in North America, major European countries, as well as Asia and Australia. The majority of our customer sales agreements in these segments are for a term of one year or less.
Global Recycling
Principal customers of the RSAA and RSEU operating segments’ operations use recycled aluminum to produce can sheet, building and construction, automotive and other aluminum products. Sales of our products and services are made by the segments’ dedicated sales forces. Customarily, agreements with customers in the aluminum recycling and specification alloy manufacturing industry are short-term (often on a purchase order basis). These agreements usually result from a bidding process in which aluminum producers and metal traders offer to sell materials or to have materials tolled. Consequently, we have historically maintained no significant backlog of orders in these segments.
Competition
The worldwide aluminum industry is highly competitive. Aluminum competes with other materials such as steel, plastic, composite materials and glass for various applications.
Global Rolled and Extruded Products
Our rolled and extruded products businesses compete in the production and sale of rolled aluminum sheet and plate and extruded products. In the sectors in which we compete, the other industry leaders include Alcoa, Constellium (Alcan), Novelis, Quanex, Kaiser Aluminum, Hydro Aluminum, JW Aluminum and Jupiter Aluminum. In addition, we compete with imported products. We compete with other rolled and extruded products suppliers on the basis of quality, price, timeliness of delivery and customer service.
Global Recycling
The principal factors of competition in our recycling business unit are price, metal recovery rates, proximity to customers, molten metal delivery capability, environmental and safety regulatory compliance and other types of services. Freight costs also limit the geographic areas in which we can compete effectively. The global recycling and specification alloy business is highly fragmented and competitive. Our major domestic and international competitors are Scepter, Smelter Service Corporation and Trimet for recycling and Superior Alloys, Audubon Metals, AMAG, Oetinger, Trimet and Raffmetal for specification alloys.
Raw materials and supplies
Global Rolled and Extruded Products
A significant portion of the aluminum metal used by our RPNA segment is purchased aluminum scrap that is acquired from aluminum scrap dealers or brokers. We believe that this segment is
133
Table of Contents
one of the largest users of aluminum scrap (other than beverage can scrap) in North America, and that the volume of its purchases assists it in obtaining scrap at competitive prices. The remaining requirements of this segment are met with purchased primary metal, including metal produced in the United States and internationally.
We rely on a number of European smelters for primary aluminum and rolling slab and billet (alloyed material in a form ready to enter our hot mills or extrusion presses). Due to a shortage of internal slab and billet casting capacity, we contract with smelters and other third parties to provide slab and billet that meet our specifications.
A significant portion of the aluminum slab and billet used by our RPEU and Extrusions segments are supplied by a subsidiary of BaseMet B.V., with the remaining supply coming from a variety of third party primary aluminum suppliers and purchased aluminum scrap acquired from or through aluminum scrap dealers or brokers. In order to help BaseMet B.V. in its ability to meet our supply needs, we have agreed to provide a loan to a subsidiary of BaseMet B.V. Notwithstanding the foregoing, there can be no assurance that the BaseMet B.V. subsidiary will be able to continue to sufficiently meet our supply needs in the future.
Global Recycling
Aluminum scrap and dross represent the largest component of cost of sales for our global recycling business unit. The availability and price of scrap and dross depend on a number of factors outside of our control, including general economic conditions, international demand for these materials and internal recycling activities by primary aluminum producers. Changes in U.S. and worldwide supply and demand for aluminum scrap have had and will continue to have an effect on the prices we pay for these raw materials.
The primary sources of aluminum scrap and dross for our recycling and specification alloy operations include automotive component manufacturers, can stock producers, used beverage cans and aluminum smelters. Many of our aluminum suppliers are also our customers. We also buy aluminum scrap from metal scrap dealers and traders on the open market.
Energy supplies
Our operations are fueled by natural gas and electricity, which represent the third largest component of our cost of sales, after metal and labor costs. We purchase the majority of our natural gas and electricity on a spot-market basis. However, in an effort to acquire the most favorable energy costs, we have secured some of our natural gas and electricity at fixed price commitments. We use forward contracts and options, as well as contractual price escalators, to reduce the risks associated with our natural gas requirements.
Research and development
In connection with our acquisition of Corus Aluminum in 2006, we entered into a research and development agreement with Corus Group Ltd. (and subsequently with its successor, Tata Steel) pursuant to which Tata Steel assisted us in research and development projects on a fee-for-service basis. This agreement was terminated in the third quarter of 2011 to allow this research and development work to take place internally. Excluding $11.9 million of contract termination costs
134
Table of Contents
recorded during the third quarter of 2011, research and development expenses were $16.3 million, $10.6 million, $6.0 million, and $18.2 million for the year ended December 31, 2011, the seven months ended December 31, 2010, the five months ended May 31, 2010 and the year ended December 31, 2009, respectively.
Patents and other intellectual property
We hold patents registered in the United States and other countries relating to our business. In addition to patents, we also possess other intellectual property, including trademarks, tradenames, know-how, developed technology and trade secrets. Although we believe these intellectual property rights are important to the operations of our specific businesses, we do not consider any single patent, trademark, tradename, know-how, developed technology, trade secret or any group of patents, trademarks, tradenames, know-how, developed technology or trade secrets to be material to our business as a whole.
Seasonality
Certain of our rolled and extruded products and recycling and specification alloy end-uses are seasonal. Demand in the rolled and extruded products business is generally stronger in the spring and summer seasons due to higher demand in the building and construction industry. Our recycling business experiences greater demand in the spring season due to stronger automotive and can sheet demand. Such factors typically result in higher operating income in the first half of the year.
Employees
As of December 31, 2011 we had a total of approximately 6,900 employees, which includes approximately 2,100 employees engaged in administrative and supervisory activities and approximately 4,800 employees engaged in manufacturing, production and maintenance functions. In addition, collectively approximately 45% of our U.S. employees and substantially all of our non-U.S. employees are covered by collective bargaining agreements. We believe our labor relations with employees have been satisfactory.
Environmental
Our operations are subject to federal, state, local and foreign environmental laws and regulations, which govern, among other things, air emissions, wastewater discharges, the handling, storage, and disposal of hazardous substances and wastes, the investigation or remediation of contaminated sites, and employee health and safety. These laws can impose joint and several liability for releases or threatened releases of hazardous substances upon statutorily defined parties, including us, regardless of fault or the lawfulness of the original activity or disposal. Given the changing nature of environmental legal requirements, we may be required, from time to time, to install additional pollution control equipment, make process changes, or take other environmental control measures at some of our facilities to meet future requirements.
We have been named as a potentially responsible party in certain proceedings initiated pursuant to the Comprehensive Environmental Response, Compensation, and Liability Act (“Superfund”) and similar state statutes and may be named a potentially responsible party in other similar proceedings in the future. It is not anticipated that the costs incurred in connection with the presently pending proceedings will, individually or in the aggregate, have a material adverse
135
Table of Contents
effect on our financial condition or results of operations. Currently and from time to time, we are a party to notices of violation brought by environmental agencies concerning the laws governing air emissions.
We are performing operations and maintenance at two Superfund sites for matters arising out of past waste disposal activity associated with closed facilities. We are also under orders to perform environmental remediation by agencies in four states and one non-U.S. country at seven sites.
Our aggregate accrual for environmental matters was $36.5 million and $36.2 million at December 31, 2011 and 2010, respectively. Although the outcome of any such matters, to the extent they exceed any applicable accrual, could have a material adverse effect on our consolidated results of operations or cash flows for the applicable period, we currently believe that any such outcome would not have a material adverse effect on our consolidated financial condition, results of operations or cash flows.
The processing of scrap generates solid waste in the form of salt cake and baghouse dust. This material is disposed of at off-site landfills or at permitted landfills at our Morgantown, Kentucky and Wabash, Indiana facilities. If salt cake were ever classified as a hazardous waste in the United States, the costs to manage and dispose of it would increase, which could result in significant increased expenditures.
Our three landfill sites have finite lives and we incur costs related to retiring them. The amounts recognized for landfill asset retirement obligations, as of December 31, 2011 and 2010, were $4.1 million and $4.9 million, respectively, for our Morgantown, Kentucky landfill, $0.7 million and $1.0 million, respectively, for our Wabash, Indiana landfill and $3.5 million and $2.9 million, respectively, for our closed Sapulpa, Oklahoma landfill. The related asset retirement costs for each facility was capitalized as a long-lived asset (asset retirement cost), and is being amortized over the remaining useful lives of the landfills. See Note 2, “Summary of significant accounting policies,” and Note 10, “Asset retirement obligations,” to our audited consolidated financial statements included elsewhere in this prospectus.
Financial information about geographic areas
See Note 17, “Segment information,” to our audited consolidated financial statements included elsewhere in this prospectus. See also “Management’s discussion and analysis of financial condition and results of operations.”
Legal proceedings
We are a party from time to time to what we believe are routine litigation and proceedings considered part of the ordinary course of our business. We believe that the outcome of such existing proceedings would not have a material adverse effect on our financial position or results of operations.
136
Table of Contents
Properties
Our production and manufacturing facilities are listed below by segment.
| Segment | Location | Owned / Leased | ||
|
| ||||
| Rolled Products North America |
Clayton, New Jersey | Owned | ||
| Buckhannon, West Virginia | Owned | |||
| Ashville, Ohio | Owned | |||
| Richmond, Virginia | Owned | |||
| Roxboro, North Carolina | Owned | |||
| Uhrichsville, Ohio(1) | Owned | |||
| Lewisport, Kentucky | Owned | |||
| Rolled Products Europe |
Duffel, Belgium | Owned | ||
| Koblenz, Germany | Owned | |||
| Extrusions |
Duffel, Belgium | Owned | ||
| Tianjin, PRC | Granted Land Rights | |||
| Bitterfeld, Germany | Owned | |||
| Vogt, Germany | Owned | |||
| Bonn, Germany | Owned | |||
| Recycling and Specification Alloys North America |
Morgantown, Kentucky |
Owned | ||
| Sapulpa, Oklahoma | Owned | |||
| Loudon, Tennessee | Owned | |||
| Wabash, Indiana(1) | Owned | |||
| Friendly, West Virginia | Owned | |||
| Post Falls, Idaho | Owned | |||
| Friendly, West Virginia (Bens Run) | Owned | |||
| Cleveland, Ohio | Owned | |||
| Rock Creek, Ohio | Owned | |||
| Elyria, Ohio | Owned | |||
| Hammond, Indiana | Owned | |||
| Macedonia, Ohio | Owned | |||
| Goodyear, Arizona | Leased | |||
| Chicago Heights, Illinois | Owned | |||
| Saginaw, Michigan | Owned | |||
| Coldwater, Michigan(1) | Owned | |||
| Steele, Alabama | Owned | |||
| Monclova, Mexico | Owned | |||
| Mississauga, Canada | Owned | |||
|
| ||||
137
Table of Contents
| Segment | Location | Owned / Leased | ||
|
| ||||
| Recycling and Specification Alloys Europe |
Romsdal, Norway |
Owned | ||
| Raudsand, Norway | Owned | |||
| Swansea, Wales | Leased | |||
| Grevenbroich, Germany | Owned | |||
| Deizisau, Germany | Owned | |||
| Töging, Germany | Owned | |||
|
| ||||
| (1) | Two facilities at this location. |
The average operating rates for our RPNA segment’s facilities for the years ended December 31, 2011, 2010 and 2009 were 88%, 93% and 89%, respectively, of effective capacity. The average operating rates for our RPEU segment’s facilities for the years ended December 31, 2011, 2010 and 2009 were 90%, 90% and 79%, respectively, of effective capacity. The average operating rates for our Extrusions segment’s facilities for the years ended December 31, 2011, 2010 and 2009 were 91%, 88% and 81%, respectively, of effective capacity. The average operating rates for our RSAA segment’s facilities for the years ended December 31, 2011, 2010 and 2009 were 78%, 64% and 49%, respectively, of effective capacity. The average operating rates for our RSEU segment’s facilities for the years ended December 31, 2011, 2010 and 2009 were 86%, 88% and 91%, respectively, of effective capacity.
The rolling mill being constructed by the China Joint Venture is located in Zhenjiang City, Jiangsu Province in China. The China Joint Venture has been granted a 50-year right to occupy the land on which the factory is being constructed.
Our Cleveland, Ohio facility houses our principal executive corporate office, as well as our offices for RPNA and RSAA, and we currently lease approximately 55,291 square feet for those purposes.
Our principal European corporate offices are located in Zurich, Switzerland and currently lease approximately 7,464 square feet.
We believe that our facilities are suitable and adequate for our operations.
138
Table of Contents
The following table sets forth the name, age and position of our directors and executive officers.
| Name | Age | Position | ||
|
| ||||
| Steven J. Demetriou |
53 | Chairman of our Board of Directors and Chief Executive Officer | ||
| Sean M. Stack |
45 | Executive Vice President and Chief Financial Officer | ||
| Roelof IJ. Baan |
55 | Executive Vice President and Chief Executive Officer, Global Rolled and Extruded Products | ||
| K. Alan Dick |
48 | Executive Vice President and Chief Executive Officer, Global Recycling | ||
| Christopher R. Clegg |
54 | Executive Vice President, General Counsel and Secretary | ||
| Thomas W. Weidenkopf |
53 | Executive Vice President, Human Resources and Communications | ||
| Scott A. McKinley |
50 | Senior Vice President and Controller | ||
| Kelly R. Thomas |
42 | Vice President and Treasurer | ||
| Emily Alexander |
36 | Director | ||
| Christopher M. Crane |
53 | Director | ||
| Scott L. Graves |
41 | Director | ||
| Brian Laibow |
34 | Director | ||
| Kenneth Liang |
50 | Director | ||
| Robert O’Leary |
41 | Director | ||
| Lawrence W. Stranghoener |
57 | Director | ||
| G. Richard Wagoner, Jr. |
59 | Director | ||
|
| ||||
The following biographies describe the business experience during at least the past five years of the directors and executive officers listed in the table above. The officers and directors listed above are the officers and directors of each of Aleris Corporation and Aleris International. The Company was formed to acquire the reorganized business of Aleris International upon Aleris International’s emergence from bankruptcy. Any business experience of officers and directors described below with respect to Aleris that predates the Emergence Date refers to business experience with Aleris International.
Steven J. Demetriou—Mr. Demetriou became Chairman of the Board and Chief Executive Officer of Aleris following the merger of Commonwealth Industries, Inc. and IMCO Recycling, Inc. Mr. Demetriou had served as President and Chief Executive Officer of Commonwealth from June 2004 and served as an outside Director of Commonwealth from 2002 until the merger. Mr. Demetriou is the non-executive Chairman of the Board of Foster Wheeler AG, a director of OM Group, Inc. and Kraton Performance Polymers, Inc. and serves on the Board of Advisors for Resilience Capital Partners, a private equity investment group.
Mr. Demetriou has extensive operational and managerial experience with the Company. His day-to-day leadership of the Company as well as his involvement with the Aluminum Association provides an in-depth understanding of the aluminum industry generally and unparalleled experience with the Company’s operations and corporate transactions.
139
Table of Contents
Sean M. Stack—Mr. Stack has served as Executive Vice President and Chief Financial Officer since February 2009. He joined Commonwealth Industries in June 2004 as Vice President and Treasurer and became Senior Vice President and Treasurer in December 2004 upon the merger with IMCO Recycling. During his tenure at Aleris, he held roles of increasing responsibility including Executive Vice President, Corporate Development and Strategy, and Executive Vice President and President, Aleris Europe.
Roelof IJ. Baan—Mr. Baan joined Aleris in 2008 and currently serves as Executive Vice President and Chief Executive Officer, Global Rolled and Extruded Products. He is responsible for all business and operational activities with respect to our Global Rolled and Extruded Products business unit. From 2008 to 2011, Mr. Baan served as our Executive Vice President and Chief Executive Officer Europe and Asia. He was responsible for all business and operational activities for Aleris’s European region headquartered in Zurich, Switzerland. From 2004 until 2007, Mr. Baan worked for Mittal where he most recently served as Executive Vice President and Chief Executive Officer, Mittal Steel Europe, and served on Arcelor Mittal’s Management Committee. Mr. Baan had responsibility for operations in eight countries, including four integrated steel mills and four electric arc steel mills. Since January 1, 2011, Mr. Baan has been a director of Borusan Mannesman, a leading European producer in the steel pipe industry.
K. Alan Dick—Mr. Dick currently serves as our Executive Vice President and Chief Executive Officer, Global Recycling, and is responsible for all business and operational activities with respect to our Global Recycling business unit. From September 2009 through 2011, Mr. Dick served as our Executive Vice President and President for Rolled Products North America. Prior to his present position, Mr. Dick held a variety of roles with increasing responsibility with Aleris including Senior Vice President and General Manager, Rolled Products North America beginning December 2007, Senior Vice President, Global Metals Procurement beginning January 2007 and Vice President, Metals Sourcing beginning 2004.
Christopher R. Clegg—Mr. Clegg has served as the Executive Vice President, General Counsel and Secretary since January 2007. From 2005 to 2007, he was the Company’s Senior Vice President, General Counsel and Secretary. He joined Commonwealth Industries in June 2004 as Vice President, General Counsel and Secretary, and upon the merger with IMCO Recycling he became Senior Vice President, General Counsel and Secretary.
Thomas W. Weidenkopf—Mr. Weidenkopf has served as Executive Vice President Human Resources and Communications since September 2009. From November 2008 until September 2009, he served as an interim Head, Global HR in a consulting capacity. Prior to joining Aleris, Mr. Weidenkopf served as the Senior Vice President, Human Resources and Communications for Honeywell International where he was responsible for leading global human resources strategy and programs for the Company’s 120,000 employees in more than 100 countries.
Scott A. McKinley—Mr. McKinley has served as Senior Vice President and Controller since May 2008. Prior to that, he was Senior Vice President and Treasurer since September 2006. From June 2004 until then, Mr. McKinley served as Vice President and Chief Financial Officer for Lubrizol Corporation’s Specialty Chemicals Segment.
Kelly R. Thomas—Ms. Thomas has served as Vice President and Treasurer with responsibility for global treasury operations, Investor Relations and Risk since September 2011. She previously served as Vice President, Global Risk from September 2010 until September 2011 and as Director, Global Risk from January 2010 until September 2010. From March 2001 until December 2009, Ms. Thomas was employed by Alcoa in positions of increasing responsibility, eventually serving in the position of Vice President, Alcoa Materials Management Europe.
140
Table of Contents
Emily Alexander—Ms. Alexander has served as a director since January 21, 2011. Ms. Alexander serves as a Managing Director in the legal department of Oaktree, with primary responsibilities for the distressed opportunities funds. Prior to joining Oaktree in 2006, Ms. Alexander served as a Vice President and Associate General Counsel at Trust Company of the West. Prior to that, Ms. Alexander spent five years as a corporate associate at Munger, Tolles & Olson LLP.
Ms. Alexander was appointed by the Oaktree Funds to serve as a Director of the Company. Her legal background and legal role at Oaktree provide expertise in corporate governance matters.
Christopher M. Crane—Mr. Crane has served as a director since September 2010. Mr. Crane is president and chief operating officer of Exelon Corporation, since September 2008, a public company and one of the largest electric companies in the United States. He also serves as president and chief operating officer of Exelon Generation, the nation’s largest owner/operator of nuclear power plants, and the holder of one of America’s largest portfolios of electricity generation capacity. Previously he was senior vice president of Exelon and president and chief nuclear officer of the Exelon Nuclear division of Exelon Generation from 2004 to 2007, Chief Operating Officer of Exelon Nuclear from 2003 to 2004 and senior vice president of Exelon Nuclear from 2000 to 2003.
Mr. Crane’s operational and leadership positions with Exelon provide substantial knowledge in the areas of operational oversight, corporate governance and strategic planning. Mr. Crane is an independent director and serves as a member of the Board’s Compensation Committee.
Scott L. Graves—Mr. Graves has served as a Director since June 1, 2010. Mr. Graves serves as a Managing Director and Co-Portfolio Manager in the distressed opportunities group of Oaktree, with primary responsibilities for analysis, portfolio construction and management of the distressed opportunities funds. Prior to joining Oaktree in 2001, Mr. Graves served as a Principal in William E. Simon & Sons’ Private Equity Group where he was responsible for sourcing, structuring, executing and managing corporate leveraged buy-outs and growth capital investments. Before joining William E. Simon & Sons in 1998, Mr. Graves worked at Merrill Lynch & Company in the Mergers and Acquisitions Group, where he focused on leveraged buy-out situations and the valuation of public and private companies. Prior thereto, Mr. Graves worked at Price Waterhouse LLP in the Audit Business Services division. Mr. Graves previously served as a director on the board of directors of Maidenform Brands, Inc., a public company, and served on its audit and compensation committees.
Mr. Graves was appointed by the Oaktree Funds to serve as a Director of the Company. Mr. Graves has significant experience making and managing investments on behalf of Oaktree’s distressed opportunities funds and has been actively involved in the Oaktree Funds’ investment in the Company. In addition to his considerable investment and corporate transactional experience, he has served as a director of a number of public and privately-held companies as well as a member of board audit and compensation committees. Mr. Graves serves as the Chair of the Board’s Compensation Committee and as a member of the Board’s Audit Committee.
Brian Laibow—Mr. Laibow has served as a Director since June 1, 2010. Mr. Laibow serves as a Senior Vice President in the distressed opportunities group of Oaktree, with primary responsibilities for analyzing companies within the metals and mining, food distribution, education, automotive and commercial and residential real estate sectors. Mr. Laibow joined Oaktree in 2006 following graduation from Harvard Business School, where he received an M.B.A. Before attending Harvard, Mr. Laibow worked at Caltius Private Equity, a middle market
141
Table of Contents
LBO firm in Los Angeles. Prior experience includes Director of M&A and Corporate Strategy at EarthLink, Inc., Senior Business Analyst at McKinsey & Company and an investment banking internship at JP Morgan.
Mr. Laibow was appointed by the Oaktree Funds to serve as a Director of the Company. As a member of the Oaktree Funds’ team covering the Company, Mr. Laibow has a solid working knowledge of the Company’s activities and operations and is also very familiar with the metals sector. Mr. Laibow serves as a member of the Board’s Audit Committee.
Kenneth Liang—Mr. Liang has served as a Director since June 1, 2010. Mr. Liang serves as a Managing Director and Head of Restructurings in the distressed opportunities group of Oaktree, with primary responsibilities for restructurings and reorganizations of companies in which the distressed opportunities funds have invested. From Oaktree’s formation in 1995 until June 2001, Mr. Liang was a Managing Director of Oaktree and Oaktree’s General Counsel. Prior to Oaktree, Mr. Liang served as a Senior Vice President at Trust Company of the West with primary legal responsibility for the Special Credits Funds and, before that, as Senior Corporate Counsel at Dole Food Company and as an Associate at the law firm of O’Melveny & Myers.
Mr. Liang was appointed by the Oaktree Funds to serve as a Director of the Company. Mr. Liang has substantial experience with corporate restructurings and reorganizations, including the restructuring of the Company.
Robert O’Leary—Mr. O’Leary has served as a Director since December 7, 2011. Mr. O’Leary serves as a Managing Director and Co-Portfolio Manager in the distressed opportunities group of Oaktree, with primary responsibilities for analysis, portfolio construction and management of distressed opportunities funds. Prior to joining Oaktree in 2002, Mr. O’Leary served as an Associate at McKinsey & Company, where he worked primarily in the Corporate Finance and Strategy practice. Before attending Harvard Business School, Mr. O’Leary worked for two years at Orion Partners, a private equity firm, where he focused on investments in private companies. Prior thereto, he worked at McKinsey & Company as a Business Analyst.
Mr. O’Leary was appointed by the Oaktree Funds to serve as a Director of the Company. Mr. O’Leary has significant experience making and managing investments on behalf of Oaktree’s distressed opportunities funds and has been actively involved in the Oaktree Funds’ investment in the Company.
Lawrence W. Stranghoener—Mr. Stranghoener has served as director since January 21, 2011. Since 2004, Mr. Stranghoener has been executive vice president and chief financial officer of The Mosaic Company, a public global crop nutrient company with approximately $10 billion of sales. Previously he had been executive vice president and chief financial officer for Thrivent Financial. From 1983 to 2000, he held various positions in finance at Honeywell, including vice president and chief financial officer from 1997 to 1999. He also serves on the board of directors for Kennametal Inc., a public company.
Mr. Stranghoener has extensive corporate finance experience, including 15 years of experience as a chief financial officer at several different companies with full responsibility and accountability for all finance, accounting, tax and related functions. Mr. Stranghoener is an independent director and serves as the Chair of the Board’s Audit Committee.
G. Richard Wagoner, Jr.—Mr. Wagoner has served as a director since August 2010. Mr. Wagoner retired from General Motors Corporation, a public company, in August 2009 after a 32-year career. He served as chairman and chief executive officer of General Motors from May 2003
142
Table of Contents
through March 2009 and had been president and chief executive officer since June 2000. Mr. Wagoner is a director of The Washington Post Company and a member of The Business Council and the Mayor of Shanghai’s International Business Leaders Advisory Council.
Mr. Wagoner’s long leadership history with General Motors provides a deep understanding of the operational, governance and strategic matters involved in running a large scale global corporation. Mr. Wagoner is an independent Director and serves as a member of the Board’s Compensation Committee.
Other matters concerning directors and executive officers
Each of the executive officers listed above, other than Mr. Weidenkopf and Ms. Thomas, served as an officer of Aleris International at the time it filed for protection under Chapter 11 of the Bankruptcy Code in February 2009. Further, Mr. Demetriou served as Chairman of the Board at the time Aleris International filed for protection under Chapter 11 of the Bankruptcy Code in February 2009. On June 1, 2009, General Motors Corporation, and its affiliates, filed voluntary petitions in the United States Bankruptcy Court for the Southern District of New York seeking relief under Chapter 11 of the United States Bankruptcy Code. Mr. Wagoner was not an executive officer or director of General Motors Corporation at the time of such filing.
Composition of our Board of Directors
Our Board of Directors consists of nine directors, one of which is our Chief Executive Officer and five of which were appointed by the Oaktree Funds which owns a majority of our outstanding equity. The five directors appointed by the Oaktree Funds are Messrs. Graves, Laibow, Liang and O’Leary and Ms. Alexander. Upon completion of this offering, we expect that our Board of Directors will consist of nine directors. Our bylaws provide that our directors will be elected at the annual meeting of the stockholders and each director will be elected to serve until his or her successor is elected.
Director independence
We are a privately held corporation. In anticipation of this offering, our Board of Directors has determined that each of Messrs. Crane, Stranghoener and Wagoner is an independent director under current NYSE listing standards. The Board has appointed Mr. Wagoner to serve, effective upon completion of this offering, as the lead director of the Board’s independent directors for the purpose of chairing all meetings of the independent directors. Mr. Demetriou would not be considered independent under current NYSE listing standards or those applicable to any particular committee due to his employment relationship with us, and Messrs. Graves, Laibow, Liang and O’Leary and Ms. Alexander may not be considered independent under current NYSE listing standards or those applicable to any particular committee, due to their relationship with the Oaktree Funds, our largest indirect stockholders. As the Oaktree Funds own indirectly a majority of our outstanding equity, under NYSE listing standards, we would qualify as a “controlled company” and, accordingly, be exempt from its requirements to have a majority of independent directors and a corporate governance and compensation committee composed of a majority of independent directors.
Board committees
The Board of Directors of Aleris Corporation (as well as the Board of Directors of Aleris International) has an Audit Committee and a Compensation Committee. Messrs. Stranghoener,
143
Table of Contents
Graves and Laibow are members of each Audit Committee and Mr. Stranghoener serves as Chair of the Audit Committee. Messrs. Graves, Crane and Wagoner are members each Compensation Committee with Mr. Graves as Chair of the Compensation Committee. In anticipation of this offering, the Company has established a nominating and corporate governance committee as described below. In accordance with the applicable rules of the NYSE, we expect to rely on exceptions that allow us to phase in our compliance with the applicable committee independence standards.
Audit committee
Our audit committee consists of Messrs. Stranghoener, Graves and Laibow. Mr. Stranghoener has been appointed Chair of the Audit Committee. In connection with this offering, our Board of Directors has determined that Mr. Stranghoener qualifies as an “audit committee financial expert” as such term is defined in Item 407(d)(5) of Regulation S-K and that each of Mr. Stranghoener and Mr. Wagoner are independent as independence is defined in Rule 10A-3 of the Securities Exchange Act of 1934, as amended (the “Exchange Act”) and under the NYSE listing standards. The composition of the audit committee satisfies the independence requirements of the SEC and the NYSE within the applicable timeframe.
The principal duties and responsibilities of our audit committee are to oversee and monitor the following:
| • | our financial reporting process and internal control system; |
| • | the integrity of our financial statements; |
| • | the independence, qualifications and performance of our independent auditor; |
| • | the performance of our internal audit function; and |
| • | our compliance with legal, ethical and regulatory matters. |
Compensation committee
Our compensation committee consists of Messrs. Crane, Graves and Wagoner. The composition of the compensation committee satisfies the independence requirements of the SEC and the NYSE within the applicable timeframe. The principal duties and responsibilities of the compensation committee are as follows:
| • | to review, evaluation and make recommendations to the full Board of Directors regarding our compensation policies and establish performance-based incentives that support our long-term goals, objectives and interests; |
| • | to review and approve the compensation of our chief executive officer, all employees who report directly to our chief executive officer and other members of our senior management; |
| • | to review and make recommendations to the Board of Directors with respect to our incentive compensation plans and equity-based compensation plans; |
| • | to set and review the compensation of and reimbursement policies for members of the board of directors; |
| • | to provide oversight concerning selection of officers, management succession planning, expense accounts, indemnification and insurance matters, and separation packages; and |
| • | to prepare an annual compensation committee report, provide regular reports to the board, and take such other actions as are necessary and consistent with the governing law and our organizational documents. |
144
Table of Contents
Nominating and corporate governance committee
Upon consummation of this offering, the nominating and corporate governance committee will consist of Messrs. Crane, Graves and Stranghoener. The composition of the nominating and corporate governance committee satisfies the independence requirements of the SEC and the NYSE within the applicable timeframe. The principal duties and responsibilities of the nominating and corporate governance committee will be as follows:
| • | to establish criteria for board and committee membership and recommend to our Board of Directors proposed nominees for election to the Board of Directors and for membership on committees of our Board of Directors; |
| • | to make recommendations regarding proposals submitted by our stockholders; and |
| • | to make recommendations to our Board of Directors regarding board governance matters and practices. |
Codes of conduct
Aleris International maintains and enforces a Code of Ethics that applies to our Chief Executive Officer, Chief Financial Officer, Assistant Chief Financial Officer, Controller, Chief Accounting Officer and Treasurer (the “Senior Officers Code”). The Senior Officers Code was designed to be read and applied in conjunction with our Code of Business Conduct and Ethics (the “Code of Business Conduct”) applicable to all employees. In instances where the Code of Business Conduct is silent or its terms are inconsistent with or conflict with any of the terms of the Senior Officers Code, then the provisions of the Senior Officers Code control and govern in all respects. Both the Senior Officers Code and the Code of Business Conduct are available at our website (www.aleris.com) by clicking on “Corporate Governance” under the “Investor Relations” and “Governance” tabs. Any future changes or amendments to the Senior Officers Code and the Code of Business Conduct, and any waiver of the Senior Officers Code or the Code of Business Conduct that applies to our Chief Executive Officer, Chief Financial Officer or Principal Accounting Officer will be posted to our website at this location.
Related party transactions
Transactions with our directors, executive officers, principal stockholders or affiliates must be at terms that are no less than favorable to us than those available from third parties and must be approved in advance by a majority of disinterested members of the Board of Directors of Aleris International. While not in writing, this is a policy that the Board of Directors of Aleris International follows with respect to related party transactions and any approval with respect to a particular transaction is appropriately evidenced in Aleris International Board of Director proceedings. After consummation of this offering, we expect that the Company’s audit committee will review related party transactions.
Compensation committee interlocks and insider participation
For the period between June 1, 2010 and the establishment of our Compensation Committee, our entire Board at that time performed the functions of a Compensation Committee. Other than Mr. Demetriou, none of our directors has ever been one of our officers or employees. Following
145
Table of Contents
the establishment of our Compensation Committee, Messrs. Graves, Crane and Wagoner serve as the members of our Compensation Committee. During 2011, none of our executive officers served as a member of the board of directors or compensation committee of an entity that has an executive officer serving as a member of our Compensation Committee, and none of our executive officers served as the member of the compensation committee of an entity that has an executive officer serving as a director on our Board.
146
Table of Contents
Compensation discussion and analysis
Philosophy and background
As a global company and industry leader, we maintain a multi-faceted executive compensation program designed to retain and motivate those executives that are essential to our long-term success, to attract highly-qualified, talented executives in a competitive global marketplace in areas to support our growth and strategic business goals, and to align the interests of these executives with the interests of our stockholders. Our compensation philosophy centers on the belief that executive compensation should be directly linked to improvement in corporate performance and the creation of long-term stockholder value.
As part of Aleris International’s restructuring, completed in 2010, the Bankruptcy Court approved the terms of certain elements of the executive compensation program, including the equity incentive plan and executive employment agreements, which became effective June 1, 2010 (the “Emergence Date”), and are described more fully below. Since that time, we have continued to review and approve all aspects of our executives’ compensation. In addition, as part of this ongoing evaluation of our compensation program, certain changes have been approved by our Compensation Committee and ratified by the Board to be effective immediately prior to the effectiveness of this contemplated initial public offering to reflect our status as a new public company following the completion of the contemplated initial public offering described herein. The agreements and plans in place during the 2011 fiscal year, as well as certain changes made for the 2012 fiscal year and those changes that are contemplated in connection with our contemplated initial public offering are described throughout this section, as applicable.
In August 2010, a committee of Aleris International (the “Committee”) was formed and authorized to assume certain compensation program-related duties. In June 2011, a compensation committee of our Board of Directors was formed. For purposes of this discussion, the term Committee refers to the Committee of Aleris International and, beginning in June 2011, the term Committee refers to the Compensation Committee of our Board of Directors. The Committee has responsibility for reviewing, developing, overseeing and approving our executive and senior management compensation plans, policies and programs and awards thereunder. Before the Compensation Committee of our Board of Directors was formed, compensation decisions relating to the Company’s equity compensation plan, including the approval of grants to our named executive officers, were the responsibility of the Board of Directors.
Before the Emergence Date, as part of our restructuring process, our executive compensation programs and policies were extensively reviewed in light of our new company structure, corporate positioning and strategic business plan. During this period of reorganization, a number of cost-reduction measures that had been made by Old AII, Inc. in response to the conditions in the metals industry and general economy that had negatively impacted our financial results were also re-evaluated. As part of this process, compensation programs were reviewed accordingly, with changes implemented as appropriate in coordination with Aleris International’s emergence from bankruptcy, including the cancellation of all outstanding equity compensation holdings, without consideration.
147
Table of Contents
Objectives and design of our executive compensation program
In 2011, the Company continued to emphasize a compensation design focused on implementing our core philosophy by operating a range of programs and incorporating a combination of cash compensation, cash incentive awards based on quarterly and annual performance targets, time-based stock options (some of which include a “premium” exercise price feature) and time-based restricted stock units which vest, in part, each quarter and provide the executives with a growing ownership stake in our Company.
The objectives of our executive compensation package design are to:
| • | attract, retain and motivate key executives and management personnel by providing an appropriate level and mixture of fixed and “at risk” compensation; |
| • | link compensation with performance by providing reasonable incentives to accomplish near term Company-wide (and business unit) successes based on our strategic business plan; and |
| • | reward long-term increased Company value and align the interests of the executives with our stockholders. |
While certain programs and compensation design elements have been updated in conjunction with our growth since the time of our emergence from bankruptcy, these objectives have remained constant. We describe below the various elements of our compensation policies and practices for the last completed fiscal year ended December 31, 2011 for our named executive officers, including:
| • | Steven J. Demetriou (Chairman and Chief Executive Officer); |
| • | Roelof IJ. Baan (Executive Vice President and Chief Executive Officer, Global Rolled & Extruded Products); |
| • | Sean M. Stack (Executive Vice President & Chief Financial Officer); |
| • | Thomas W. Weidenkopf (Executive Vice-President, Human Resources & Communications); |
| • | Christopher R. Clegg (Executive Vice President, Secretary and General Counsel); and |
| • | K. Alan Dick (Executive Vice President and President and Chief Executive Officer, Global Recycling). |
This group of named executive officers has been determined based on compensation earned by our executive officers for the period January 1, 2011 through December 31, 2011. The programs described below provide information with respect to compensation paid to our named executive officers during this period and, where appropriate, describes the compensation program at the time of, and following, Aleris International’s emergence from bankruptcy as well as changes to the compensation with respect to certain of our named executive officers effective in 2012. Where relevant, changes to the current compensation-related agreements and plans being adopted in connection with the contemplated initial public offering, and which will become effective immediately prior to the effectiveness of the contemplated initial public offering, are also discussed.
As of the Emergence Date, we adopted a new equity incentive plan and, together with Aleris International, we entered into a new employment agreement with each of our named executive officers. The new equity plan and new employment agreements replaced the Old AII, Inc. equity
148
Table of Contents
plan and the employment agreements that were in place prior to the Emergence Date. The Board of Directors of Aleris International also implemented changes to the short-term cash bonus program by adjusting the quarterly metrics and targets based on our new Company plan, and pursuant to the Plan of Reorganization, in June 2010, we granted stock options and restricted stock units to each of the named executive officers, as well as certain other members of our Company-wide management team. In fiscal year 2011, our compensation program continued to evolve in order to continue to support the Company’s evolving long-range business goals and growth strategies. Each of our named executive officers’ base compensation amounts were initially set to provide a certain amount of financial security to the named executive officers at levels that are believed to be competitive for similar positions in the marketplace in which we compete for management talent and the short-term cash bonus program was redesigned to meaningfully reward strong Company performance in each fiscal quarter as well as overall annual performance, in order to motivate participants to strive for continued Company growth and productivity. In addition, our named executive officers’ employment agreements and the equity awards granted thereunder provide share ownership opportunities through the grant of stock options and restricted stock units, which vest over time, as more fully described below, and continue be an important element in our ability to retain, motivate and incentivize our named executive officers. Our long-term equity program is considered central to the achievement of our long-range goals, and aligns our named executive officers’ and other management team members’ interests with those of our stockholders.
Aleris International engaged Mercer during its reorganization process in 2010 to provide information regarding the equity incentive plan design and certain compensation comparison market data. In connection with the equity incentive plan, Mercer prepared recommendations on the aggregate number of shares of our common stock authorized for grants under the equity plan as well as specific recommendations regarding the size of the grants made to our key executives, including our named executive officers. In addition, Mercer advised Aleris International on how the values assigned to the three main elements of our compensation packages and the total compensation level, for our key executives, including our named executive officers, compared to the total compensation and elemental breakdown for similar executive positions at companies of roughly our size and scale. This general market data was not focused on a specific peer group or industry, and the Company did not specifically benchmark any element of compensation. However, this market survey information was considered as one factor in determining whether each element of compensation and total compensation for each of our named executive officers was appropriate in fiscal year 2011. In June 2011, the Committee retained the services of Frederic W. Cook & Co., Inc. (“Fred Cook”) as its independent compensation consultant to review and advise on certain aspects of our executive compensation program, to become effective immediately prior to the effectiveness of this contemplated initial public offering. Fred Cook provided information on the competitive pay mix practices, trends, and structures of compensation programs of privately held and public companies, and made recommendations to our Committee relating to various aspects of our executive compensation programs, including assessing and advising on the competitiveness of our programs as compared to companies similar in size and scale, and developing appropriate recommendations for changes with respect to our short-term cash-based incentive program, the equity-based incentive plan, as well as the executives’ employment agreements (each as more fully described below).
149
Table of Contents
Elements of compensation
The main elements of our named executive officers’ compensation include: (a) base salary; (b) short-term cash bonus awards (based in 2011 on quarterly and annual performance targets); and (c) long-term time-based equity awards (including stock options, some of which incorporate premium and super-premium exercise prices, and restricted stock units (“RSUs”)). Consistent with past practice, we generally place an emphasis on long-term equity growth. However, in light of the large equity awards granted in 2010 in connection with the original circumstances of Aleris International’s reorganization, discussed below under the heading “Equity incentive program,” none of our named executive officers, except Mr. Dick, received additional equity-based awards in 2011. Our named executive officers, as well as all other company employees who held restricted stock units granted pursuant to our equity incentive plan, as described below, also received compensation in 2011 through the issuance of the 2011 Stockholder Dividends. Dividend payments were made to RSU grantees with respect to those shares of our common stock that had been issued pursuant to the settlement of vested RSUs prior to the dividend record date, as well as to dividend equivalent rights paid under the terms of an individual’s outstanding (i.e., unvested) RSUs. In 2011, focus was also placed on setting incremental quarterly and annual goals under our cash bonus program in order to reward our employees, including our named executive officers, for steady, sustained achievement of certain financial, operational and individual performance targets.
In setting the appropriate compensation levels for our named executive officers, we have considered a variety of factors including our needs to attract and retain key personnel in both the United States and our strategic markets abroad, how compensation levels compare to manufacturing companies generally in our industry, and the interests of our stockholders. As discussed above, while we did not specifically benchmark our named executive officers’ total compensation goals for fiscal year 2011, nor any particular element of compensation against a specific peer group, 2011 compensation levels were generally compared to market-wide compensation data of companies of our size and scope.
Base salary and cash bonus awards
Upon the Emergence Date, we, together with Aleris International, entered into employment agreements with each of the named executive officers. These employment agreements and certain amendments to be effective immediately prior to the effectiveness of this contemplated initial public offering, are described in greater detail under the headings “Employment agreements” following the “Summary compensation table” and “Potential payments upon termination or change in control—Employment agreements.”
We consider base salary together with the annual cash incentive awards as part of a cash compensation package. Our base salaries are used to provide a predictable level of current income and are designed to assist in attracting and retaining qualified executives. With respect to compensation for the named executive officers, the base salary and target bonus for each named executive officer pursuant to each executive’s employment agreement were initially set in June of 2010 at levels consistent with base salary and target bonus for such executive prior to emergence. Generally, our Committee and Board of Directors believe that this cash compensation amount for each named executive officer aligns the position’s responsibilities with its remuneration and provides competitive levels of cash compensation in the markets in which the Company competes for comparable executive ability and experience.
150
Table of Contents
Base salary
Pursuant to each of our named executive officer’s employment agreements, the amount of each executive’s base salary and target annual bonus is to be reviewed annually and is subject to adjustment by the Board of Directors of Aleris International, which also has the authority to make discretionary cash bonus awards. The annual base salary of Mr. Demetriou, our Chairman and Chief Executive Officer, was originally set in 2010 at $1,000,000 and has not increased since that date. Mr. Baan’s base salary was originally set in 2010 at CHF 950,070 (equivalent to approximately $1,020,375 using a conversion convention discussed below as part of the “Summary compensation table”) and has not increased since that date. The base salary of Mr. Stack was originally set in 2010 at $400,000 and in connection with an assessment of Mr. Stack’s performance and execution of his responsibilities, and an analysis of market data regarding executives in similar positions with companies of similar size and scale, effective in February 2011, Mr. Stack’s base salary was increased by 12.5%, to $450,000. Based on a review at the conclusion of fiscal year 2011, Mr. Stack’s base salary was further adjusted by 3.33% to $465,000, effective as of January 1, 2012. Mr. Weidenkopf’s base salary was originally set in 2010 at $375,000 and has not increased since that date. The base salary of Mr. Clegg was originally set in 2010 at $350,000. In connection with an assessment of Mr. Clegg’s performance and execution of his responsibilities, and a review of relevant market data for executives in similar positions with companies of similar size and scale, effective in February 2011, Mr. Clegg’s base salary was increased by 14.3% to $400,000; Mr. Clegg’s base salary has not changed for fiscal year 2012. Mr. Dick’s base salary was originally set in 2010 at $360,000. After an assessment of Mr. Dick’s performance and execution of his responsibilities, and a review of relevant market data, effective in February 2011, Mr. Dick’s base salary was increased by 18.06% to $425,000. Mr. Dick’s base salary was further increased by 5.88% to $450,000, effective as of January 1, 2012.
Cash bonus awards
In order to focus on certain short-term goals and annual goals, Aleris International maintains the Amended and Restated Aleris International, Inc. 2004 Annual Incentive Plan under a program referred to as the Management Incentive Plan or “MIP,” in which the named executive officers and certain other management team employees participate. Awards under the MIP represent variable compensation linked to organizational performance, which is a significant component of the Company’s total annual compensation package for key employees, including the named executive officers. The program is designed to reward the employee’s participation in the Company’s achievement of critical financial performance and growth objectives.
Beginning in 2009 and continuing in 2010, performance goals and achievement were assessed based on quarterly performance, generally being paid after each quarter’s earnings were determined. For 2011, the Committee modified the MIP to provide both quarterly and annual performance targets and payments, beginning with the first quarter of 2011. For 2012, the Committee has determined that the design feature of quarterly performance assessment will cease and the MIP will utilize only annual performance targets.
Pursuant to the named executive officers’ employment agreements, each named executive officer is eligible to receive a target annual bonus amount under the MIP, expressed as a percentage of base salary, as set forth in the table below. Depending on the performance levels achieved, the named executive officer may receive no bonus or a bonus in an amount up to 200% of the executive’s target bonus amount. Under the construct of the MIP for fiscal year 2011, 40% of the
151
Table of Contents
target bonus opportunity was based on the achievement of the quarterly operational and financial (Company-wide and/or applicable business segments) performance objectives (10% being assigned to each quarter), and 60% of the target opportunity was based on the achievement of annual operational and financial (Company-wide and/or applicable business segments) as well as individual performance objectives. The chart below sets forth, for each named executive officer, the target bonus amount (expressed as both a percentage of the executive’s base salary and a dollar amount). In addition, the chart reflects the allocation breakdown of the target amounts over each of the quarterly and annual performance periods.
| Name | Base ($) |
Target Bonus (% of Base Salary) |
Target ($) |
Target Bonus Allocations | ||||||||||||||||||||
| Per-Quarter Target ($) |
Total Target Q1- Q4 (1) ($) |
Annual Target (1) ($) |
||||||||||||||||||||||
|
|
||||||||||||||||||||||||
| Steven J. Demetriou |
1,000,000 | 100% | 1,000,000 | 100,000 | 400,000 | 600,000 | ||||||||||||||||||
| Roelof IJ. Baan(2) |
1,020,375 | 75% | 765,281 | 76,528 | 306,113 | 459,169 | ||||||||||||||||||
| Sean M. Stack |
450,000 | 75% | 337,500 | 33,750 | 135,000 | 202,500 | ||||||||||||||||||
| Thomas W. Weidenkopf |
375,000 | 75% | 281,250 | 28,125 | 112,500 | 168,750 | ||||||||||||||||||
| Christopher R. Clegg |
400,000 | 75% | 300,000 | 30,000 | 120,000 | 180,000 | ||||||||||||||||||
| K. Alan Dick |
425,000 | 75% | 318,750 | 31,875 | 127,500 | 191,250 | ||||||||||||||||||
|
|
||||||||||||||||||||||||
| (1) | Quarterly performance determined based on Company operational and financial goals. Annual performance determined based on Company (and with respect to Messrs. Baan and Dick, applicable business segments) operational and financial goals as well as the achievement of certain individual goals. |
| (2) | Amounts reported reflect the year-end conversion rate used by the Company (equaling 1.074 US$ to 1 CHF for 2011). |
Achievement of the quarterly goals was determined in the quarter following the quarter to which the relevant performance goals related, and the annual component was determined at the same time as fourth quarter achievement. In 2011, the Company introduced a multi-layered payment approach regarding the quarterly bonus component, so as to maintain a balance between awarding achievement of quarterly goals and keeping focus on the full year results. Under this approach, performance is assessed each quarter in the normal course, and, depending on performance achieved, payment is made to the participant up to the amount of the quarterly target bonus amount. Any payment amount attributable to above-target performance is set aside to be paid at the same time as the annual bonus component, if the annual performance goals are met. Under this approach, a named executive officer may receive payment up to only the target amount for each quarter, and then will receive payment for above-target performance only if the total annual performance results sustain above-target achievement levels. The annual bonus component includes financial and operational goals (Company-wide and/or applicable business segments) as well as an evaluation by the Board of Directors of individual performance. All MIP award recipients, including the named executive officers, must be an employee of the Company on the date that the particular quarterly (or annual) bonus amount is paid in order to be eligible to receive that bonus amount.
For 2011, the MIP performance goals were based mainly on an adjusted EBITDA calculation, determined for individual business units as well as on a Company-wide basis, and other operational measures including a cash flow metric. The specific metrics and weightings of these measures as components of the whole target bonus amount, as well as target achievement levels, are determined and adjusted each performance period to be aligned with our Company business plan. An evaluation of individual performance is also considered when determining the named executive officer’s annual bonus component.
152
Table of Contents
The metrics used to calculate bonus payout amounts are as follows:
| • | Adjusted EBITDA (used for quarterly and annual MIP components) is determined based on the Adjusted EBITDA for the Company and our business units, as the case may be, which is a non-GAAP measure (the components of which are more fully explained under the “Management discussion and analysis of financial condition and results of operations” section of this filing under the heading “EBITDA and Adjusted EBITDA”) as additionally modified for purposes of the MIP only, and subject to review and approval by the Committee, to take into account certain significant variances in LME prices and currency, or certain items that were not anticipated when the targets were set (the “MIP EBITDA”); |
| • | Operating cash flow (used for quarterly components) is a non-GAAP measure calculated as operating cash flow including capital expenditures, modified for purposes of the MIP only, and subject to review and approval by the Committee, to take into account significant variances in LME prices (the “MIP OCF”); and |
| • | Total cash flow (used for the annual component) is a non-GAAP measure calculated as the difference in total cash balance at the beginning and end of the year, modified for purposes of the MIP only, and subject to review and approval by the Committee, to reflect year-end to year-end significant variances in LME prices or certain items that were not anticipated when the targets were set (the “MIP TCF”). |
With respect to the annual bonus component, Company total cash flow, rather than Company operating cash flow was used as the basis for the performance measure because we believe it effectively measures the Company’s overall performance on an annual basis compared to the Company’s original operating plan and better aligns with long-term stockholder interests. In contrast, we believe Company operating cash flow was a better quarterly goal that is more directly correlated to short-term operating performance and more tangible to business units. The resulting MIP EBITDA, MIP OCF, and MIP TCF measures used for the MIP, calculated in the manner described above, are not the same as Adjusted Company EBITDA, Company operating cash flow, or Company total cash flow measures that may be used or reported by the Company in other contexts. In most cases, such variations or items as discussed above had the impact of reducing the level of the MIP EBITDA, MIP OCF, or MIP TCF, as applicable, from what it would have been otherwise which, in turn, reduced bonus payout levels.
Actual bonus payment amounts are calculated by combining the achievement attained for each weighted measure, whereby achievement of 100% of target of each of the individual measures would earn a payout of 100% of the participant’s target bonus opportunity. The payout for 200% of target is achievable for performance significantly greater than the budgeted 2011 Aleris business plan. For corporate employees including Messrs. Demetriou, Stack, Clegg and Weidenkopf, only the Company-wide goals were considered in their bonus calculations. For Messrs. Baan and Dick, bonus calculation considered Europe and RPNA’s business unit performance, respectively, in addition to Company-wide goals in determining their payouts. Generally, the targets are established as challenging, but achievable, milestones.
The Board of Directors of Aleris International believes that the chosen metrics serve as an appropriate metric on which to base bonus decisions because adjusted EBITDA, operating cash flow and total cash flow are metrics commonly used by our primary stockholders, as well as the banking and investing communities generally, with respect to the performance of fundamental business objectives, and, moreover, these metrics appropriately measure our ability to meet
153
Table of Contents
future debt service, capital expenditures and working capital needs. The Board of Directors of Aleris International, or the Committee, for participants other than the named executive officers, has the discretion to decrease awards under the MIP even if incentive targets are achieved.
The specific goals, achievement attained and payments made in each quarter of 2011 are set forth below:
| (in millions, except percentages) | Quarterly and annual payout percentages | |||||||||||||||||||||||||||||||||||||||||||
| Performance targets & results | Corporate execs(3) | Roelof IJ. Baan(3) | K. Alan Dick(3) | |||||||||||||||||||||||||||||||||||||||||
| Threshold |
Target | Max | Results | Payout% | Weighted | Weighted | Weighted | |||||||||||||||||||||||||||||||||||||
| Measure(1) | achieved(2) | Weighting | payout | Weighting | payout | Weighting | payout | |||||||||||||||||||||||||||||||||||||
|
|
||||||||||||||||||||||||||||||||||||||||||||
| Q1—10% of Target opportunity |
|
|||||||||||||||||||||||||||||||||||||||||||
| Company MIP EBITDA |
$ | 58.0 | $ | 70.0 | $ | 84.0 | $ | 78.5 | 161% | 100% | 161% | 40% | 64% | 40% | 64% | |||||||||||||||||||||||||||||
| Europe MIP EBITDA |
$ | 37.0 | $ | 43.0 | $ | 52.0 | $ | 46.9 | 139% | —% | —% | 60% | 83% | —% | —% | |||||||||||||||||||||||||||||
| RPNA MIP EBITDA |
$ | 19.0 | $ | 24.0 | $ | 28.0 | $ | 26.8 | 170% | —% | —% | —% | —% | 60% | 102% | |||||||||||||||||||||||||||||
| Q2—10% of Target opportunity |
|
|||||||||||||||||||||||||||||||||||||||||||
| Company MIP EBITDA |
$ | 80.0 | $ | 92.0 | $ | 108.0 | $ | 93.2 | 105% | 70% | 74% | 28% | 29% | 28% | 29% | |||||||||||||||||||||||||||||
| MIP OCF |
$ | 0.0 | $ | 25.0 | $ | 45.0 | $ | 69.9 | 200% | 30% | 60% | 30% | 60% | 30% | 60% | |||||||||||||||||||||||||||||
| Europe MIP EBITDA |
€ | 35.0 | € | 39.0 | € | 45.0 | € | 37.5 | 72% | —% | —% | 42% | 30% | —% | —% | |||||||||||||||||||||||||||||
| RPNA MIP EBITDA |
$ | 28.5 | $ | 32.5 | $ | 37.5 | $ | 32.5 | 100% | —% | —% | —% | —% | 42% | 42% | |||||||||||||||||||||||||||||
| Q3—10% of Target opportunity |
|
|||||||||||||||||||||||||||||||||||||||||||
| Company MIP EBITDA |
$ | 79.2 | $ | 88.0 | $ | 101.2 | $ | 93.9 | 138% | 70% | 96% | 28% | 39% | 28% | 39% | |||||||||||||||||||||||||||||
| MIP OCF |
$ | 50.0 | $ | 70.0 | $ | 100.0 | $ | 79.9 | 125% | 30% | 37% | 30% | 37% | 30% | 37% | |||||||||||||||||||||||||||||
| Europe MIP EBITDA |
€ | 33.3 | € | 37.0 | € | 42.6 | € | 37.7 | 109% | —% | —% | 42% | 46% | —% | —% | |||||||||||||||||||||||||||||
| RPNA MIP EBITDA |
$ | 27.0 | $ | 30.0 | $ | 34.5 | $ | 31.3 | 122% | —% | —% | —% | —% | 42% | 51% | |||||||||||||||||||||||||||||
| Q4—10% of Target opportunity |
|
|||||||||||||||||||||||||||||||||||||||||||
| Company MIP EBITDA |
$ | 41.3 | $ | 55.0 | $ | 68.8 | $ | 59.0 | 118% | 70% | 83% | 28% | 33% | 28% | 33% | |||||||||||||||||||||||||||||
| MIP OCF |
$ | 30.0 | $ | 40.0 | $ | 50.0 | $ | 49.2 | 190% | 30% | 57% | 30% | 57% | 30% | 57% | |||||||||||||||||||||||||||||
| Europe MIP EBITDA |
€ | 19.9 | € | 26.5 | € | 33.1 | € | 23.5 | 68% | —% | —% | 42% | 29% | —% | —% | |||||||||||||||||||||||||||||
| RPNA MIP EBITDA |
$ | 14.3 | $ | 19.0 | $ | 23.8 | $ | 24.3 | 200% | —% | —% | —% | —% | 42% | 84% | |||||||||||||||||||||||||||||
| Annual—60% of Target opportunity |
|
|||||||||||||||||||||||||||||||||||||||||||
| Company MIP EBITDA |
$ | 235.0 | $ | 285.0 | $ | 342.0 | $ | 325.6 | 171% | 60% | 102% | 24% | 41% | 24% | 41% | |||||||||||||||||||||||||||||
| MIP TCF |
$ | 43.0 | $ | 7.0 | $ | 67.0 | $ | 33.0 | 143% | 20% | 29% | 20% | 29% | 20% | 29% | |||||||||||||||||||||||||||||
| Europe MIP EBITDA |
€ | 99.0 | € | 115.0 | € | 140.0 | € | 140.8 | 200% | —% | —% | 36% | 72% | —% | —% | |||||||||||||||||||||||||||||
| RPNA MIP EBITDA |
$ | 95.0 | $ | 120.0 | $ | 140.0 | $ | 116.7 | 90% | —% | —% | —% | —% | 36% | 32% | |||||||||||||||||||||||||||||
| Individual(4) |
Varies by individual | 100% | 20% | (4 | ) | 20% | 22% | 20% | 18% | |||||||||||||||||||||||||||||||||||
|
|
||||||||||||||||||||||||||||||||||||||||||||
| (1) | MIP EBITDA (corresponding to the Company-wide measure and Europe or RPNA business units, as applicable), MIP OCF and MIP TCF measures, as described above, are used for purposes of the MIP only and are not calculated in the same manner as Company Adjusted EBITDA, operating cash flow or total cash flow measures that may be used or reported by the Company in other contexts. |
| (2) | Interpolated based on performance quartiles and the associated payout percents. |
| (3) | The “Corporate Execs” include Messrs. Demetriou, Stack, Clegg and Weidenkopf. Amounts above target are “set aside” and added to the annual performance component, becoming payable based on the determination of annual performance results. |
| (4) | The individual performance weighting with respect to each of the Corporate Execs was as follows: Mr. Demetriou—22%; Mr. Stack—24%; Mr. Clegg—20%; and Mr. Weidenkopf—21%. Please see the information below with respect to each of our named executive officer’s annual payments. |
154
Table of Contents
Based on the performance levels achieved, as described above, the following quarterly MIP amounts were paid to each of our named executive officers:
| Q1 | Q2 | Q3 | Q4 | |||||||||||||||||||||||||||||||||||||||||||||
| Name | Payout achieved ($) |
Amount paid ($) |
Set aside amount ($) |
Payout achieved ($) |
Amount paid ($) |
Set aside amount ($) |
Payout achieved ($) |
Amount paid ($) |
Set aside amount ($) |
Payout achieved ($) |
Amount paid ($) |
Set aside amount ($) |
||||||||||||||||||||||||||||||||||||
|
|
||||||||||||||||||||||||||||||||||||||||||||||||
| Steven J. Demetriou(1) |
161,000 | 100,000 | 61,000 | 134,000 | 100,000 | 34,000 | 134,000 | 100,000 | 34,000 | 140,000 | 100,000 | 40,000 | ||||||||||||||||||||||||||||||||||||
| Roelof IJ. Baan(2) |
113,261 | 76,528 | 36,733 | 91,834 | 76,528 | 15,306 | 93,364 | 76,528 | 16,836 | 91,069 | 76,528 | 14,541 | ||||||||||||||||||||||||||||||||||||
| Sean M. Stack(1) |
54,338 | 33,750 | 20,588 | 45,225 | 33,750 | 11,475 | 45,225 | 33,750 | 11,475 | 47,250 | 33,750 | 13,500 | ||||||||||||||||||||||||||||||||||||
| Thomas W. Weidenkopf(1) |
45,281 | 28,125 | 17,156 | 37,688 | 28,125 | 9,563 | 37,688 | 28,125 | 9,563 | 39,375 | 28,125 | 11,250 | ||||||||||||||||||||||||||||||||||||
| Christopher R. Clegg(1) |
48,300 | 30,000 | 18,300 | 40,200 | 30,000 | 10,200 | 40,200 | 30,000 | 10,200 | 42,000 | 30,000 | 12,000 | ||||||||||||||||||||||||||||||||||||
| K. Alan Dick(3) |
52,913 | 31,875 | 21,038 | 41,756 | 31,875 | 9,881 | 40,481 | 31,875 | 8,606 | 55,463 | 31,875 | 23,588 | ||||||||||||||||||||||||||||||||||||
|
|
||||||||||||||||||||||||||||||||||||||||||||||||
| (1) | The quarterly MIP payments of Messrs. Demetriou, Stack, Clegg and Weidenkopf generally were based on Company MIP EBITDA and Company MIP OCF. Amounts achieved for performance above the applicable target performance measures were set aside until the end of the year and were contingent upon achievement of annual performance targets. |
| (2) | Mr. Baan’s quarterly MIP payments were generally based on Company MIP EBITDA, Europe MIP EBITDA and MIP OCF. Amounts reported for Mr. Baan reflect the year-end conversion rate used by the Company (equaling 1.074 US$ to 1 CHF for 2011). |
| (3) | Mr. Dick’s quarterly MIP payments were generally based on Company MIP EBITDA, RPNA MIP EBITDA and MIP OCF. |
Since annual performance achievement resulted in the annual performance component being payable, the amounts that had been set aside each quarter also became payable. Therefore, the total 2011 MIP bonus amounts earned by each of our named executive officers are as follows:
| Aggregate | ||||||||||||||||||||||
| Annual payout achieved ($) |
Q1-Q4 amount paid ($) |
Q1-Q4 set aside ($) |
Total MIP award amount ($) |
Aggregate MIP payout % |
||||||||||||||||||
| Name | (x) | (y) | (z) | (x + y + z) | ||||||||||||||||||
|
|
||||||||||||||||||||||
| Steven J. Demetriou |
918,480 | (1) | 400,000 | 169,000 | 1,487,480 | 149% | ||||||||||||||||
| Roelof IJ. Baan |
751,201 | (2) | 306,112 | 83,416 | 1,140,729 | 149% | ||||||||||||||||
| Sean M. Stack |
314,280 | (3) | 135,000 | 57,038 | 506,318 | 150% | ||||||||||||||||
| Thomas W. Weidenkopf |
256,838 | (4) | 112,500 | 47,531 | 416,869 | 148% | ||||||||||||||||
| Christopher R. Clegg |
272,160 | (5) | 120,000 | 50,700 | 442,860 | 148% | ||||||||||||||||
| K. Alan Dick |
228,735 | (6) | 127,500 | 63,113 | 419,348 | 132% | ||||||||||||||||
|
|
||||||||||||||||||||||
| (1) | Mr. Demetriou’s annual payment includes amounts payable in satisfaction of Company MIP EBITDA and MIP TCF, as well as an assessment of his individual performance. Mr. Demetriou’s individual component was evaluated based on a variety of performance goals, including, generally, areas of operational concern, such as safety, AOS, global and strategic Company growth, and capital projects. |
| (2) | Mr. Baan’s annual payment includes amounts payable in satisfaction of Company MIP EBITDA, Europe MIP EBITDA and MIP TCF as well as an assessment of his individual performance. Mr. Baan’s individual component was evaluated based on a variety of performance goals, including, generally, areas of operational concern, such as safety, AOS, research and development, and global and strategic Company growth. Amounts reported for Mr. Baan reflect the year-end conversion rate used by the Company (equaling 1.074 US$ to 1 CHF for 2011). |
| (3) | Mr. Stack’s annual payment includes amounts payable in satisfaction of Company MIP EBITDA and MIP TCF, as well as an assessment of his individual performance. Mr. Stack’s individual component was evaluated based on a variety of performance goals, including, generally, areas of the Company’s financial and risk assessment systems, as well as global and strategic Company growth. |
| (4) | Mr. Weidenkopf’s annual payment includes amounts payable in satisfaction of Company MIP EBITDA and MIP TCF, as well as an assessment of his individual performance. Mr. Weidenkopf’s individual component was evaluated based on a variety of performance goals, including, generally, areas related to the Company’s human resources systems, communications, and support for the Company’s global and strategic growth initiatives. |
| (5) | Mr. Clegg’s annual payment includes amounts payable in satisfaction of Company MIP EBITDA and MIP TCF, as well as an assessment of his individual performance. Mr. Clegg’s individual component was evaluated based on a variety of performance goals, including, generally, areas related to the Company’s legal systems, Company compliance and risk assessment systems, as well as global and strategic Company growth. |
| (6) | Mr. Dick’s annual payment includes amounts payable in satisfaction of Company MIP EBITDA, RPNA MIP EBITDA and MIP TCF, as well as an assessment of his individual performance. Mr. Dick’s individual component was evaluated based on a variety of performance goals, including, generally, areas of operational concern, such as safety, AOS, global and strategic Company growth, training and capital projects. |
155
Table of Contents
The MIP is reviewed each year, and certain program design changes have been adopted for bonuses awarded in connection with 2012 MIP awards including a change to make the full amount of each plan participant’s (including our named executive officers’) bonus opportunity subject to only annual performance targets (instead of having a quarterly and individual performance measures). Additionally, with respect to our named executive officers, the individual performance measures were removed while other plan participants will continue to have individual performance measures. The 2012 MIP performance goals are based 75% on adjusted EBITDA (described above) and 25% on working capital productivity (rather than cash flow) as we believe this performance measure is visible, tangible and closely aligned with the daily accountability of each of our business units, and mitigates the impact of changes in the LME. We calculate our working capital productivity on a trailing annual basis by taking the last twelve months average working capital amount divided by the last twelve months net sales and converting this percentage to days by multiplying it by 365. Additionally, after an assessment of Messrs. Demetriou’s and Baan’s performance and execution of their responsibilities, each of their target and maximum bonus percentages in respect of 2012 MIP awards were increased by 10% to 110% and 220% (with respect to Mr. Demetriou) and 85% and 170% (with respect to Mr. Baan). In addition, in connection with our contemplated initial public offering, the Board of Directors has approved a restatement of the MIP, to be renamed as the Aleris Corporation 2012 Management Incentive Plan, effective immediately prior to the effectiveness of the initial public offering as described herein. A summary of the terms of the amended and restated MIP is set forth below following the compensation tables under the heading “Revised compensation plans.”
Equity incentive program
Under the Old AII, Inc. stock incentive plan in place before June 1, 2010, each of our named executive officers, along with other key management personnel were granted stock options to purchase Old AII, Inc. common stock. These outstanding Old AII, Inc. equity awards were canceled upon our emergence from bankruptcy without consideration to the holders of the awards. Stock options that were canceled for our named executive officers who had participated in the prior stock incentive plan include: 186,887 stock options held by Mr. Demetriou, 48,157 stock options held by Mr. Stack, 33,339 stock options held by Mr. Clegg, and 30,000 stock options held by Mr. Dick. All of these stock options, granted on February 1, 2007, had an exercise price of $100, the fair market value of a share of Old AII, Inc. common stock on the date of grant. Similarly, 80,000 stock options granted to Mr. Baan on May 8, 2008 and 3,534 shares of restricted stock granted to Mr. Baan on April 7, 2008 when he joined the Company, were also canceled without consideration.
As of the Emergence Date, we adopted the Aleris Holding Company 2010 Equity Incentive Plan (“Equity Incentive Plan”) to replace the prior stock incentive plan. The Equity Incentive Plan is designed to attract, retain, incentivize and motivate employees, consultants and non-employee directors of the Company, its subsidiaries and affiliates and to promote the success of our businesses by providing such participating individuals with a proprietary interest in the Company. The Equity Incentive Plan allows for the granting of non-qualified stock options (“stock options”), stock appreciation rights, restricted stock, restricted stock units (“RSUs”) and other stock-based awards. The maximum number of shares of our common stock which may be issued under the Equity Incentive Plan was originally 2,928,810 shares, representing 9% of the shares of our common stock authorized upon emergence, and, of that amount, grants of RSUs are limited to 325,423 shares. The total shares which may be issued under the Equity Incentive Plan has been
156
Table of Contents
increased to 4,660,474 after taking into effect an increase in the number of shares underlying outstanding stock options in order to eliminate the dilution that would have occurred as a result of the 2011 Stockholder Dividends, as discussed below. The Equity Incentive Plan is administered by the Board of Directors, or a committee thereof, and may generally be amended or terminated at any time. Each of our named executive officers received, effective as of June 1, 2010, significant grants of stock options and RSUs, in each case subject to the Equity Incentive Plan and the terms of an applicable award agreement, as part of Aleris International’s emergence from bankruptcy, which were awarded both for their retentive qualities and to provide meaningful incentives related to the Company’s future long-term growth. The Board of Directors approved an amendment and restatement of the Equity Incentive Plan, to be renamed the Aleris Corporation 2012 Equity Incentive Plan and formerly referred to as the 2011 Equity Incentive Plan (the “2012 Equity Incentive Plan”), effective immediately prior to the effectiveness of the contemplated initial public offering. The Board of Directors also approved an increase in the total number of shares of common stock authorized for issuance under the Equity Incentive Plan (as amended and restated) in order to have an available pool of shares authorized for grant of approximately 4% of the Company’s stock at the time of the contemplated initial public offering. Thus, of the total shares authorized under the Equity Incentive Plan, as amended and restated immediately prior to the effectiveness of the contemplated initial public offering, at the time of the contemplated initial public offering shares will be available for future grants and the balance of the number of authorized shares have either been delivered for awards or are subject to outstanding awards. A description of the 2012 Equity Incentive Plan is set forth below under the heading “Revised compensation plans.”
A summary of the terms of the amended and restated Equity Incentive Plan is set forth below following the compensation tables under the heading “Revised compensation plans.”
Stock option grants awarded in June 2010
The June 1, 2010 stock options were granted in three tranches, with increasing exercise prices whereby the first tranche had an exercise price of $29.76 (the June 1, 2010 fair market value on the date of grant, the “FMV Stock Option”), the second tranche had an exercise price of $44.64 (the “Premium Stock Option”), and the third tranche had an exercise price of $59.52 (the “Super-Premium Stock Option”). Since the options generally have no compensatory value until the price of a share of our common stock exceeds the exercise price of the stock option, granting the stock options with these “premium” and “super-premium” exercise prices increases the retention value of the awards. The awards are designed to further align interests of our named executive officers, along with certain other key management personnel who were also granted this type of stock option, to the interests of our stockholders and incentivizes them to focus on increasing our overall value over time. Each tranche of the stock options granted in June 2010 to our named executive officers vests with respect to 6.25% of the underlying shares subject to such tranche on each quarterly anniversary of the Emergence Date, over a period of four years. Vested stock options remain exercisable for a period of ten years, unless there is a Change in Control or the holder of the stock options incurs a termination of employment. For a discussion of the effect on these stock options in the event of a Change in Control and a named executive officer’s termination, please see the section entitled “Potential payments upon termination and change in control—Equity award agreements.” For a description of certain changes to the terms of the stock option award agreements to be effective immediately prior to the effectiveness of the contemplated initial public offering, please see the section entitled “Revised compensation plans.”
157
Table of Contents
The following table sets forth the amount of stock options granted to each named executive officer in June 2010, showing the original number of shares underlying each grant and the number of shares on a post-adjusted basis (following the 2011 Stockholder Dividends):
| FMV stock option | Premium stock option | Super-premium stock option | ||||||||||||||||||||||
| Original grant |
Post- adjustment |
Original grant |
Post- adjustment |
Original grant |
Post- adjustment |
|||||||||||||||||||
| Name | Exercise price of $29.76 |
Exercise price of $21.19 |
Exercise price of $44.64 |
Exercise price of $31.78 |
Exercise price of $59.52 |
Exercise price of $42.38 |
||||||||||||||||||
|
|
||||||||||||||||||||||||
| Steven J. Demetriou |
325,423 | 457,179 | 81,356 | 114,293 | 81,356 | 114,293 | ||||||||||||||||||
| Roelof IJ. Baan |
115,981 | 162,937 | 28,995 | 40,733 | 28,995 | 40,733 | ||||||||||||||||||
| Sean M. Stack |
103,615 | 145,566 | 25,904 | 36,391 | 25,904 | 36,391 | ||||||||||||||||||
| Thomas W. Weidenkopf |
72,504 | 101,858 | 18,126 | 25,463 | 18,126 | 25,463 | ||||||||||||||||||
| Christopher R. Clegg |
72,504 | 101,858 | 18,126 | 25,463 | 18,126 | 25,463 | ||||||||||||||||||
| K. Alan Dick |
72,504 | 101,858 | 18,126 | 25,463 | 18,126 | 25,463 | ||||||||||||||||||
|
|
||||||||||||||||||||||||
Stock option grants awarded in 2011
As we moved further away from Aleris International’s reorganization, the Board of Directors began to only grant stock options with an exercise price equal to the fair market value of a share of common stock on the date of grant. As part of the Company’s and Aleris International’s evaluation of compensation levels conducted in early 2011, Mr. Dick received a grant of 15,000 stock options in February 2011 with an exercise price of $50.41 (the fair market value of a share of our common stock on the date of grant), in order to strengthen the retentive value of his equity compensation. Mr. Dick’s February 2011 stock option grant was ultimately adjusted to 21,071 options with an exercise price of $35.89 following the November stockholder dividend. This stock option grant, reported for the last completed fiscal year in the “Summary compensation table,” vests in two equal installments on December 31, 2012 and December 31, 2014, subject to Mr. Dick’s continued employment. Other than the vesting schedule, the stock options granted in February 2011 are subject to similar terms and conditions as applied to the June 2010 grants and will be amended in a similar manner as the June 2010 grants in connection with the contemplated initial public offering, as described below under the heading “Revised compensation plans.” No grants of stock options were made to any other of our named executive officers in 2011.
Impact of certain stockholder dividends on outstanding stock options
Under the terms of the Equity Incentive Plan, in the event of, among other events, a share dividend or other distribution of securities or other property in respect of shares or other securities (other than ordinary recurring cash dividends), the Board of Directors will promptly make equitable and appropriate adjustments in the number and/or kind of the securities and/or property that are subject to the stock option, and/or exercise price, and/or other terms or conditions of the stock option so as to avoid dilution or enlargement of the benefits or potential benefits represented by the stock option. Appropriate and equitable adjustments to the number of shares that underlies each outstanding stock option and the exercise price applicable to each were made by a special committee of our Board of Directors with respect to the February stockholder dividend and were made by the Committee with respect to each of the June stockholder dividend and November stockholder dividend. The information in the “Summary compensation table” and other tables that follow reporting equity-based compensation matters
158
Table of Contents
following “Compensation discussion and analysis” reflect the number of shares underlying each option and the applicable exercise prices on a post-dividend basis (i.e., taking into account the 2011 Stockholder Dividends). For further information on the stock option adjustments, please see the information under the heading “Outstanding option adjustment” following the “Grants of plan-based awards table.”
RSUs awarded in June 2010
The RSUs granted to each named executive officer in June 2010 also vest with respect to 6.25% of the full amount granted on each quarterly anniversary of the Emergence Date over a period of four years. In connection with the settlement of RSUs each quarter, generally, promptly after each vesting date, shares of our common stock are issued to the named executive officer with respect to the number of RSUs that vested on such date. Any withholding tax due as a result of the RSUs’ vesting will either, at the executive’s election, be paid in cash to the Company by the named executive officer, or by having the Company reduce the number of shares issued to the named executive officer by the number of shares that has a value equal to the amount of the withholding tax. Prior to March 1, 2011 (when their employment agreements were amended), Messrs. Demetriou and Stack could have requested a loan from the Company to cover the amount of the withholding tax, which, if requested, would be in the form of a revolving three-year full recourse, but unsecured, loan at the interest rate of 3.95%. Mr. Demetriou and Mr. Stack each entered into a loan of this nature with the Company in connection with the RSUs that vested on September 1, 2010 and December 1, 2010. However, each of these loans was repaid in full by Mr. Demetriou and Mr. Stack, respectively, prior to March 11, 2011. The award agreements with respect to RSUs for Mr. Demetriou and Mr. Stack have each been amended to eliminate the possibility of future loans. A description of the effect on these RSUs of a change in control and a named executive officer’s termination is below under the heading “Potential payments upon termination and change in control—Equity award agreements.” A description of certain changes to the terms of the RSU award agreements, to be effective immediately prior to the effectiveness of the contemplated initial public offering is below under the heading “Revised compensation plans.”
The following table sets forth the amount of RSUs granted to each named executive officer in June 2010:
| Name | RSUs | |||
|
|
||||
| Steven J. Demetriou |
81,356 | |||
| Roelof IJ. Baan |
28,995 | |||
| Sean M. Stack |
25,904 | |||
| Thomas W. Weidenkopf |
18,126 | |||
| Christopher R. Clegg |
18,126 | |||
| K. Alan Dick |
18,126 | |||
|
|
||||
RSUs awarded in 2011
As part of the Company’s and Aleris International’s evaluation of compensation levels conducted in early 2011, Mr. Dick received a grant of 5,000 RSUs in February 2011 in order to strengthen the retentive value of his equity compensation, which will vest 50% on December 31, 2012 and 50% on December 31, 2014. Other than the vesting schedule, the RSUs granted in February 2011 are
159
Table of Contents
subject to similar terms and conditions as applied to the June 2010 RSU grants and will be amended in a similar manner as the June 2010 RSU grants in connection with the contemplated initial public offering, as described below under the heading “Revised compensation plans.” No grants of RSUs were made to any other of our named executive officers in fiscal year 2011.
Impact of certain stockholder dividends on outstanding RSUs
Generally our named executive officers do not have any rights with respect to the shares underlying their unvested RSUs until each RSU becomes vested and the named executive officer is issued a share of common stock in settlement of the RSU. However, the RSUs granted to each of our named executive officers include a dividend equivalent right, pursuant to which the named executive officer is entitled to receive, for each RSU, a payment equal in amount to any dividend or distribution made with respect to a share of common stock, at the same time as the dividend or distribution is made to our stockholders generally. Pursuant to this dividend equivalent right, in connection with the 2011 Stockholder Dividends, each of our named executive officers, along with all other holders of RSUs, received a cash payment for each unvested RSU in an amount equal to the applicable per share dividend amount that was payable to the holders of our common stock.
Equity awards are subject to clawback provisions
Both the stock options and RSUs, and any shares issued upon exercise or settlement of, as applicable, any such award, as applicable, are subject to a clawback provision in the event any named executive officer materially violates the restrictive covenants in his employment agreement relating to non-competition, non-solicitation or non-disclosure or engaged in fraud or other willful misconduct that contributes materially to any significant financial restatement or material loss. In such case, the Board of Directors may, within six months of learning of the conduct, cancel the stock options or RSUs or require the applicable named executive officer to forfeit to us any shares received in respect of such stock options or RSUs or to repay to us the after-tax value realized on the exercise or sale of such shares. Any such named executive officer will be provided a 15-day cure period, except in cases where his or her conduct was willful or where injury to us and our affiliates cannot be cured.
Retirement, postemployment benefits and deferred compensation
We offer our executive officers, including our named executive officers who reside and work in the United States, the same retirement benefits as other Aleris employees, including participation in the Aleris 401(k) Plan (the “401(k) Plan”) and, for those who qualify as former employees of Commonwealth Industries, Inc., the Aleris Cash Balance Plan (formerly known as the Commonwealth Industries, Inc. Cash Balance Plan) (the “Cash Balance Plan”). In the United States, Aleris International also sponsors a nonqualified deferred compensation program under which certain executives, including the named executive officers, are eligible to elect to save additional salary amounts for their retirement outside of the 401(k) Plan and/or to elect to defer a portion of their compensation and MIP bonus payments. For a further description of the Deferred Compensation Plan and the payments that were made in 2011, please see the sections entitled “Pension benefits as of December 31, 2011” and “Nonqualified deferred compensation.”
Mr. Baan, who is based in Switzerland, does not participate in the 401(k) plan nor the Cash Balance Plan described above. Mr. Baan participates in one of the three forms of the Aleris
160
Table of Contents
Switzerland GmbH Neuhausen am Rhenfall (the “Swiss Pension Plan”), which are maintained in compliance with the regulations imposed by the Occupation Pensions Act in Switzerland. Under the terms of Mr. Baan’s employment agreement, Mr. Baan receives 25% of the amount of his base salary from the Company with respect to his retirement account. Under the Swiss Pension Plan, a cash balance-type benefit is paid upon the retirement of the participant. For a further description of the Swiss Pension Plan, please see the section entitled “Pension benefits as of December 31, 2011.”
Perquisites
We intentionally provide only limited perquisites to the named executive officers in the United States, including providing payment for financial advisory services and an annual medical examination, as well as a tax gross-up for the additional income tax liability as a result of receiving these benefits. Mr. Demetriou additionally receives a club membership for business use, a tax gross-up payment for this benefit, and supplemental life insurance policies. He reimburses us for any personal use of the club. We also make indoor parking spaces available to certain executives at the Cleveland headquarters, including Messrs. Demetriou, Stack, Weidenkopf, Clegg and Dick. We also occasionally invite spouses and family members of certain of our executives, including the named executive officers, to participate in business-related entertainment events arranged by the Company, which sometimes includes the executive’s spouse or guest traveling with the executives on commercial flights or on Company-sponsored aircraft. To the extent any travel or participation in these events by the executive’s spouse or guest results in imputed income to the named executive officer Mr. Demetriou is entitled, and other named executive officers may be entitled (subject to approval by the CEO) to a tax gross-up payment on such imputed income. We believe that these perquisites are less extensive than is typical both for entities with whom we compete and in the general market for executives of industrial companies in the United States, especially in the case of the chief executive officer. Mr. Baan is provided with a car and other perquisites including parking at the Company’s facility in Switzerland, a housing reimbursement, supplemental private medical insurance that provides coverage for him and his dependents and reimbursement for an annual medical examination in the United States. Additionally, effective as of January 2012, Mr. Baan receives a tax gross-up as part of his housing reimbursement.
Change in control and termination arrangements
Each of our named executive officers is subject to certain benefits upon a change in control of the Company (described and defined as a “Change of Control” in the Equity Incentive Plan, referred to herein as a “Change in Control”) and in connection with certain terminations of employment pursuant to their employment agreements and equity award agreements. Under their employment agreements, generally, in the event of an involuntary termination, the named executive officers are eligible for severance benefits. In the event of a Change in Control, pursuant to the stock option and RSU award agreements, a portion of any unvested awards may vest, with the number of accelerated awards depending on the amount of liquidity gained by the Oaktree Funds and the Apollo Funds in the Change in Control transaction. More detailed descriptions of the Change in Control and termination provisions of the employment agreements and stock option and RSU agreements (including certain contemplated amendments) are set forth below under the sections entitled “Potential payments upon termination or change in control” and “Revised compensation plans.”
161
Table of Contents
Summary compensation table for fiscal year 2011
The following table sets forth a summary of compensation with respect to our named executive officers for the fiscal year ended December 31, 2011.
| Year | Salary | Bonus | Stock awards |
Option awards |
Non-equity incentive plan compensation |
Change in pension value and nonqualified deferred compensation earnings |
All other compensation |
Total | ||||||||||||||||||||||||||||
| Name and Principal Position | ($) | ($) | ($)(1) | ($)(2) | ($) | ($)(3) | ($)(4)(5) | ($) | ||||||||||||||||||||||||||||
|
|
||||||||||||||||||||||||||||||||||||
| Steven J. Demetriou |
2011 | 1,000,000 | — | — | — | 1,487,480 | 3,204 | 1,599,425 | 4,090,109 | |||||||||||||||||||||||||||
| Chairman and Chief Executive Officer |
2010 | 1,000,000 | — | 2,256,001 | 6,884,329 | 1,547,500 | 498 | 74,510 | 11,762,838 | |||||||||||||||||||||||||||
| Roelof IJ. Baan |
2011 | 1,020,375 | — | — | — | 1,140,729 | 241,562 | 639,074 | 3,041,740 | |||||||||||||||||||||||||||
| Executive Vice President and Chief Executive Officer, Global Rolled & Extruded Products(6) |
2010 | 913,091 | — | 804,031 | 2,453,572 | 1,099,544 | 228,618 | 416,741 | 5,915,596 | |||||||||||||||||||||||||||
| Sean M. Stack |
2011 | 443,701 | — | — | — | 506,318 | 2,894 | 492,511 | 1,445,424 | |||||||||||||||||||||||||||
| Executive Vice President & Chief Financial Officer(7) |
2010 | 400,000 | — | 718,318 | 2,191,981 | 464,290 | — | 29,599 | 3,804,188 | |||||||||||||||||||||||||||
| Thomas W. Weidenkopf |
2011 | 375,000 | — | — | — | 416,869 | — | 310,790 | 1,102,659 | |||||||||||||||||||||||||||
| Executive Vice President Human Resources & Communications |
2010 | 375,000 | — | 502,634 | 1,533,822 | 435,235 | — | 19,576 | 2,866,267 | |||||||||||||||||||||||||||
| Christopher R. Clegg |
2011 | 393,750 | — | — | — | 442,860 | 3,476 | 330,257 | 1,170,343 | |||||||||||||||||||||||||||
| Executive Vice President, General Counsel and Secretary(7) |
2010 | 350,000 | — | 502,634 | 1,533,822 | 406,219 | 490 | 19,582 | 2,812,747 | |||||||||||||||||||||||||||
| K. Alan Dick |
2011 | 419,583 | 100,000 | 202,200 | 270,528 | 419,347 | 7,639 | 421,066 | 1,840,363 | |||||||||||||||||||||||||||
| Executive Vice President and Chief Executive Officer, Global Recycling(7)(8) |
2010 | 360,000 | 502,634 | 1,533,822 | 320,625 | 294 | 26,234 | 2,743,609 | ||||||||||||||||||||||||||||
|
|
||||||||||||||||||||||||||||||||||||
| (1) | The amounts in this column represent the grant date fair value of the equity award calculated in accordance with FASB ASC Topic 718; however, the grant date fair value amount did not take into account the right of award holders to receive dividends pursuant to dividend equivalent rights with respect to outstanding unvested RSU awards. |
| (2) | The amounts in this column represent the grant date fair value of the equity award calculated in accordance with FASB ASC Topic 718. The fair value of the stock options will likely vary from the actual value the holder may receive on exercise because the actual value depends on the number of options exercised and the market price of our common stock on the date of exercise. Details and assumptions used in calculating the grant date fair value of the stock options may be found in Note 13, “Stock-based compensation,” to the Company’s audited consolidated financial statements included herein. With respect to the stock options granted in 2010 that are reported for the fiscal year ended December 31, 2010 above, as more fully described in “Compensation discussion and analysis,” the options were granted in three tranches, with varying exercise prices. Underlying figures reflect the adjustments in connection with the 2011 Stockholder Dividends, which adjustments did not result in any change to the incremental fair value of the original awards. |
| (3) | Entire amount represents change in the actuarial present value of the executive’s benefit under the Cash Balance Plan or, for Mr. Baan, the Swiss Pension Plan. For additional information see the section entitled “Pension benefits” below. |
162
Table of Contents
| (4) | The Company provides perquisites to its executives. See the section entitled “Perquisites” above. The following table below sets forth certain perquisites for 2011 and certain related additional “other” compensation items, for our named executive officers. Amounts set forth in the table below represent actual costs, other than for parking. A specified number of parking spaces are allocated to the Company in the lease for our Cleveland location. The table sets forth the costs that would have been paid by the named executive officer for the parking spaces. Tax gross-up payments are made to the named executive officers for club membership, annual physicals and financial planning services, as applicable. |
| Name | Annual physical ($) |
Financial planning ($) |
Supplemental ($) |
Parking ($) |
Auto ($) |
Club membership ($) |
Tax ($) |
Spousal travel and entertainment and related tax gross-up (a) ($) |
Housing allowance ($) |
401(k) (b) ($) |
Nonqual. contrib. (c) ($) |
Total ($) |
||||||||||||||||||||||||||||||||||||
|
|
||||||||||||||||||||||||||||||||||||||||||||||||
| Steven J. Demetriou |
— | 10,555 | 22,685 | 1,080 | — | 27,939 | 31,431 | 52,462 | — | 9,800 | 49,700 | 205,652 | ||||||||||||||||||||||||||||||||||||
| Roelof IJ. Baan(d) |
— | — | 14,436 | 2,062 | 44,221 | — | — | 242 | 128,880 | — | — | 189,841 | ||||||||||||||||||||||||||||||||||||
| Sean M. Stack |
— | 16,727 | — | 1,080 | — | — | 8,618 | 724 | — | 9,800 | 14,250 | 51,199 | ||||||||||||||||||||||||||||||||||||
| Thomas W. Weidenkopf |
3,058 | 10,555 | — | 1,080 | — | — | 11,115 | 175 | — | 6,881 | — | 32,864 | ||||||||||||||||||||||||||||||||||||
| Christopher R. Clegg |
— | 10,555 | — | 1,080 | — | — | 8,618 | 175 | — | 9,800 | 13,488 | 43,716 | ||||||||||||||||||||||||||||||||||||
| K. Alan Dick |
1,987 | 10,555 | — | 1,080 | — | — | 10,240 | 7,787 | — | 9,800 | 13,076 | 54,525 | ||||||||||||||||||||||||||||||||||||
|
|
||||||||||||||||||||||||||||||||||||||||||||||||
| (a) | Amounts included in this column represent the incremental cost of our named executive officers’ spouses and guests participating in certain business-related entertainment events and travel in connection with such events. Where a spouse or guest traveled with a named executive officer utilizing a Company-sponsored aircraft on an otherwise scheduled business flight, there was no incremental cost to the Company associated with the spouse’s or guest’s accompaniment. Where a spouse or guest traveled with a named executive officer utilizing commercial flights, the incremental cost has been calculated based on the actual cost to the Company of the ticket or related fees. With respect to entertainment expenses attributed to a named executive officer’s spouse, the incremental cost is calculated based on the cost of meals or individually-purchased event tickets that are attributable to the spouse’s or guest’s attendance. |
| (b) | Amounts included in this column represent matching contributions made to the Aleris 401(k) Plan on behalf of the named executive officers. |
| (c) | Amounts included in this column represent contributions made to the Aleris International, Inc. Deferred Compensation and Retirement Benefit Restoration Plan on behalf of the named executive officers. |
| (d) | For Mr. Baan, amounts have been converted using the year-end conversion rate used by the Company (equaling 1.074 US$ to 1CHF for 2011). The amount listed under “Supplemental Insurance” represents the annual amount paid by the Company for supplemental medical insurance for Mr. Baan and his dependents in Switzerland, the amount listed under “Automobile” represents the annual car allowance and related costs, and the amount included in the “Housing Allowance” column represents the annual housing allowance. |
| (5) | The amounts in this column include, in addition to the amounts set forth in the table in Footnote 4 above: (i) the aggregate of dividend payments made in connection with our 2011 Stockholder Dividends in respect of shares issued to the applicable named executive officer in connection with the vesting of RSU awards prior to the dividend record date, in the amounts of $336,138, $80,765, $104,560, $42,278, $50,893, and $50,893 to Messrs. Demetriou, Baan, Stack, Weidenkopf, Clegg and Dick, respectively, and (ii) the aggregate of the dividend equivalent rights payments made in connection with the 2011 Stockholder Dividends in respect of unvested RSUs that remained outstanding at the time of the dividend record date, in the amounts of $1,057,635, $368,468, $336,752, $235,648, $235,648, and $315,648 to Messrs. Demetriou, Baan, Stack, Weidenkopf, Clegg and Dick, respectively. |
| (6) | To convert compensation values to US$, the year-end conversion rate used by the Company (equaling 1.074 US$ to 1 CHF for 2011), was applied to each payment. |
| (7) | The salary amounts for 2011 reflect the salary increases which became effective in February 2011. |
| (8) | In February 2011, the Company granted Mr. Dick a $300,000 retention bonus, one-third of which vested and was paid on December 31, 2011. The remainder will vest in two equal installments on December 31 of 2012 and 2013, payments of which are conditioned on Mr. Dick’s being employed by the Company on the respective vesting dates. Upon termination by the Company without cause or by Mr. Dick for good reason (as defined in his employment agreement), Mr. Dick is entitled to receive any unvested portion of the retention bonus. |
163
Table of Contents
Grants of plan-based awards for fiscal year 2011
The following table provides information concerning outstanding non-equity incentive plan awards as of December 31, 2011 and equity awards granted under the Equity Incentive Plan for the only named executive officer, Mr. Dick, who received a grant in 2011. Actual payments under the MIP, that have been or are expected to be paid with respect to 2011 performance, are discussed above under the section entitled “Base salary and cash bonus awards” and included in the “Summary compensation table” above.
| Estimated possible payouts under non-equity incentive plan awards |
All other stock awards: number of shares of stock or units (#) |
All other option awards: number of securities underlying options (#)(2) |
Exercise or base price of option awards ($/Sh)(2) |
Grant date fair value of stock and option awards ($) |
||||||||||||||||||||||||||||||
| Name | Type | Grant date |
Threshold ($) |
Target ($) |
Maximum ($) |
|||||||||||||||||||||||||||||
|
|
||||||||||||||||||||||||||||||||||
| Steven J. Demetriou |
MIP | 1,000,000 | 2,000,000 | |||||||||||||||||||||||||||||||
| Roelof IJ. Baan(1) |
MIP | 765,281 | 1,530,562 | |||||||||||||||||||||||||||||||
| Sean M. Stack |
MIP | 337,500 | 675,000 | |||||||||||||||||||||||||||||||
| Thomas W. Weidenkopf |
MIP | 281,250 | 562,500 | |||||||||||||||||||||||||||||||
| Christopher R. Clegg |
MIP | 300,000 | 600,000 | |||||||||||||||||||||||||||||||
| K. Alan Dick |
MIP | 318,750 | 637,500 | |||||||||||||||||||||||||||||||
| FMV Option | 2/2/2011 | 21,071 | 35.89 | 270,528 | ||||||||||||||||||||||||||||||
| RSU | 2/2/2011 | 5,000 | 202,200 | |||||||||||||||||||||||||||||||
|
|
||||||||||||||||||||||||||||||||||
| (1) | To convert compensation values to US$, a year-end conversion rate used by the Company (equaling 1.074 US$ to 1 CHF for 2011) was applied to the estimated possible MIP payouts. |
| (2) | Figures shown in this column reflect cumulative adjustments made as a result of the 2011 Stockholder Dividends. |
Outstanding option adjustment
In light of the 2011 Stockholder Dividends, as noted in “Compensation discussion and analysis,” for the February stockholder dividend, a special committee of the Board of Directors and, for the June and November stockholder dividends, the Committee implemented appropriate and equitable adjustments to the number of shares of our common stock that underlies each outstanding stock option and the exercise price applicable to each in order to avoid a dilutive effect on the outstanding stock options. In this regard the number of shares underlying each stock option that was outstanding on the dividend record date was increased by dividing the number of shares for each outstanding option that was granted before the February stockholder dividend, the June stockholder dividend, or November stockholder dividend, as applicable, by an adjustment ratio, and the exercise price of each option was decreased by multiplying the exercise price that applied before the February stockholder dividend, June stockholder dividend, or November stockholder dividend, as applicable, by the same adjustment ratio. The adjustment ratio was calculated based on the determination by a special committee of the Board of Directors of the fair market value of a share of our common stock immediately before and after the payment of the February stockholder dividend, the June stockholder dividend, and November stockholder dividend, as applicable. This adjustment ratio has been applied to each FMV Stock Option, Premium Stock Option, Super-Premium Stock Option and any other outstanding stock options granted after June 2010 and before the applicable record date in connection with each dividend event. Except with respect to the number of shares underlying outstanding options, no other adjustments were made to the number of shares of common stock available for grant under the Equity Incentive Plan, nor to the number of those shares that may be granted in the form of RSUs in connection with the 2011 Stockholder Dividends.
164
Table of Contents
The following is an example of the adjustments that applied to the FMV Stock Option, Premium Stock Option and Super-Premium Stock Option, assuming an original June 2010 grant of 10,000 FMV Stock Options, 2,000 Premium Stock Options and 2,000 Super-Premium Stock Options:
| Original grant | Post-February dividend adjustment |
Post-June dividend adjustment |
Post-November dividend adjustment |
|||||||||||||||||||||||||||||
| Shares | Exercise price ($) |
Shares | Exercise price ($) |
Shares | Exercise price ($) |
Shares | Exercise price ($) |
|||||||||||||||||||||||||
|
|
||||||||||||||||||||||||||||||||
| FMV Option |
10,000 | 29.76 | 12,352 | 24.10 | 13,111 | 22.70 | 14,047 | 21.19 | ||||||||||||||||||||||||
| Premium Option |
2,000 | 44.64 | 2,470 | 36.14 | 2,621 | 34.05 | 2,808 | 31.78 | ||||||||||||||||||||||||
| Super-Premium Option |
2,000 | 59.52 | 2,470 | 48.19 | 2,621 | 45.40 | 2,808 | 42.38 | ||||||||||||||||||||||||
|
|
||||||||||||||||||||||||||||||||
Employment agreements
As of the Emergence Date, the Company, together with Aleris International, entered into employment agreements with each of our named executive officers. As originally executed, for the U.S.-based executives, including Messrs. Demetriou, Stack, Weidenkopf, Clegg and Dick, the term of these employment agreements commenced upon the Emergence Date and generally terminates on the third anniversary of the Emergence Date, except that each term shall be automatically extended for additional one-year periods unless either the executive or Aleris International provides notice within a specified time period (one year in the event of Aleris International’s election with respect to Mr. Demetriou and six months with respect to the other named executive officers and 90 days in the event of the executive’s election with respect to Mr. Demetriou and 60 days with respect to the other named executive officers) of its intent not to renew. The term of the employment agreement with Mr. Baan (who is based in Switzerland) continues indefinitely until his employment is terminated with at least two months notice, either by Aleris International or by Mr. Baan. The notice period was reduced for all of the executives (other than Mr. Baan) to 30 days as part of amendments to be effective immediately prior to the effectiveness of the contemplated initial public offering. These amendments are more fully described below in the section entitled “Potential payments upon termination or change in control—Employment agreements.” The employment agreements provide for base salary, annual bonus opportunity and the grant of stock options and RSUs, as described herein. The named executive officers are entitled to participate in all employee benefit plans and programs of the Company and Aleris International and in all perquisite and fringe benefits which are from time to time made available to senior employees by the Company and Aleris International. Mr. Demetriou’s perquisites cannot be adversely changed (without his consent) for the three-year period following the Emergence Date from those he was entitled to receive as of the Emergence Date. In addition, Mr. Demetriou and Mr. Stack agreed to purchase certain shares of our common stock upon the Emergence Date and executed a stockholders agreement in this regard, as described below. The employment agreements also set forth the rights and obligations of the named executive officer upon a termination of employment, which provisions have been amended to be effective immediately prior to the effectiveness of the contemplated initial public offering, and are described below under the headings “Potential payments upon termination or change in control” and “Revised compensation plans.”
165
Table of Contents
Stockholders agreement
Prior to the contemplated initial public offering, if and when any of the stock options granted under the Equity Incentive Plan are exercised and when shares are issued pursuant to the settlement of RSUs granted under the Equity Incentive Plan, each participant, including our named executive officers, automatically becomes a party to the Stockholders Agreement. The Stockholders Agreement provides that the holder of shares of common stock may not, except in limited circumstances, transfer any of the shares of common stock that are acquired upon the exercise of stock options or settlement of RSUs. In addition, if (i) the Oaktree Funds propose to transfer more than 2% of their common stock to any person who is not an affiliate of the Oaktree Funds or the Apollo Funds, or (ii) if the Oaktree Funds transfer more than 5% of their common stock to the Apollo Funds and the Apollo Funds in turn transfer such shares to any person who is not an affiliate of the Apollo Funds within 90 days of receiving such shares from the Oaktree Funds, a notice will be issued to provide other stockholders, including the named executive officers, with an opportunity to sell a proportionate number of shares to such person, based on such terms as may be set forth in that notice. Further, if stockholders holding a majority of the outstanding shares of common stock together propose to transfer, in one or a series of transactions, to either (i) a person who is not an affiliate of any of the stockholders in the group proposing such transfer, or (ii) a group that was established to purchase the Company that includes any of the stockholders proposing the transfer or its affiliates, but only if such stockholders proposing the transfer control no more than 10% of the voting securities of such group, the group proposing the transfer will be able to require other stockholders, including the named executive officers, to transfer a proportionate number of their shares of common stock to such person or group. The Stockholders Agreement will terminate upon the consummation of this contemplated initial public offering, and will no longer be applicable to shares issued upon the exercise or vesting of stock options or RSUs, respectively.
166
Table of Contents
Outstanding equity awards as of December 31, 2011
The following table provides information concerning outstanding equity awards for purchase of shares of common stock of the Company as of December 31, 2011 for each of our named executive officers. The number of securities underlying options and exercise prices reported below reflect the cumulative adjustments in connection with the 2011 Stockholder Dividends.
| Option awards | Stock awards | |||||||||||||||||||||||
| Name | Number of securities underlying unexercised options unexercisable(1) |
Number of securities underlying unexercised options exercisable(1) |
Option exercise price ($)(1) |
Grant date fair value of stock and option awards |
Number of shares or units of stock that have not vested(2) |
Market value of shares or units of stock that have not vested ($)(3) |
||||||||||||||||||
|
|
||||||||||||||||||||||||
| Steven J. Demetriou |
171,442 | 285,737(4) | 21.19 | 6/1/2020 | ||||||||||||||||||||
| 42,859 | 71,434(4) | 31.78 | 6/1/2020 | |||||||||||||||||||||
| 42,860 | 71,433(4) | 42.38 | 6/1/2020 | |||||||||||||||||||||
| 50,848(5) | 2,440,704 | |||||||||||||||||||||||
| Roelof IJ. Baan |
61,101 | 101,836(4) | 21.19 | 6/1/2020 | ||||||||||||||||||||
| 15,274 | 25,459(4) | 31.78 | 6/1/2020 | |||||||||||||||||||||
| 15,275 | 25,458(4) | 42.38 | 6/1/2020 | |||||||||||||||||||||
| 18,122(5) | 869,856 | |||||||||||||||||||||||
| Sean M. Stack |
54,587 | 90,979(4) | 21.19 | 6/1/2020 | ||||||||||||||||||||
| 13,647 | 22,744(4) | 31.78 | 6/1/2020 | |||||||||||||||||||||
| 13,647 | 22,744(4) | 42.38 | 6/1/2020 | |||||||||||||||||||||
| 16,190(5) | 777,120 | |||||||||||||||||||||||
| Thomas W. Weidenkopf |
38,196 | 63,662(4) | 21.19 | 6/1/2020 | ||||||||||||||||||||
| 9,549 | 15,914(4) | 31.78 | 6/1/2020 | |||||||||||||||||||||
| 9,549 | 15,914(4) | 42.38 | 6/1/2020 | |||||||||||||||||||||
| 11,329(5) | 543,792 | |||||||||||||||||||||||
| Christopher R. Clegg |
38,196 | 66,362(4) | 21.19 | 6/1/2020 | ||||||||||||||||||||
| 9,549 | 15,914(4) | 31.78 | 6/1/2020 | |||||||||||||||||||||
| 9,549 | 15,914(4) | 42.38 | 6/1/2020 | |||||||||||||||||||||
| 11,329(5) | 543,792 | |||||||||||||||||||||||
| K. Alan Dick |
38,196 | 66,362(4) | 21.19 | 6/1/2020 | ||||||||||||||||||||
| 9,548 | 15,915(4) | 31.78 | 6/1/2020 | |||||||||||||||||||||
| 9,549 | 15,914(4) | 42.38 | 6/1/2020 | |||||||||||||||||||||
| — | 21,071(6) | 35.89 | 2/2/2021 | |||||||||||||||||||||
| 16,329(7) | 783,792 | |||||||||||||||||||||||
|
|
||||||||||||||||||||||||
| (1) | The amounts shown reflect cumulative adjustments made as a result of the 2011 Stockholder Dividends. |
| (2) | The unvested shares reflected in this column are time-based restricted stock units. |
| (3) | The amounts shown in this column are based upon the valuation of one share of our common stock on December 31, 2011, which was $48.00. |
| (4) | The options shown in this column will vest in ten remaining equal quarterly installments on March 1, June 1, September 1 and December 1 of years 2012 through 2014, as applicable. |
| (5) | The restricted stock units shown in this column will vest in ten remaining equal quarterly installments on March 1, June 1, September 1 and December 1 of years 2012 through 2014, as applicable. |
| (6) | The options shown in this column will vest in two equal installments on December 31, 2012 and December 31, 2014. |
| (7) | 5,000 of the restricted stock units shown in this column will vest in two equal installments on December 31, 2012 and December 31, 2014, and 11,329 of the restricted stock units shown in this column will vest in ten remaining equal quarterly installments on March 1, June 1, September 1 and December 1 of years 2012 through 2014, as applicable. |
167
Table of Contents
Option exercises and stock vested January 1-December 31, 2011
| Option awards | Stock awards | |||||||||||||||
| Number of shares acquired on exercise (#) |
Value realized on exercise ($) |
Number of shares acquired on vesting (#) |
Value realized on vesting ($) |
|||||||||||||
|
|
||||||||||||||||
| Steven J. Demetriou |
— | — | 20,339(1) | 980,590 | ||||||||||||
| Roelof IJ. Baan |
— | — | 7,249(2) | 349,489 | ||||||||||||
| Sean M. Stack |
— | — | 6,476(3) | 312,224 | ||||||||||||
| Thomas W. Weidenkopf |
— | — | 4,532(4) | 218,499 | ||||||||||||
| Christopher R. Clegg |
— | — | 4,532(5) | 218,499 | ||||||||||||
| K. Alan Dick |
— | — | 4,532(6) | 218,499 | ||||||||||||
|
|
||||||||||||||||
| (1) | In connection with Mr. Demetriou’s vesting events, 13,659 shares were issued to the executive and 6,680 shares were surrendered to pay taxes associated with such vesting events. |
| (2) | In connection with Mr. Baan’s vesting events, 5,284 shares were issued to the executive and 1,965 shares were surrendered to pay taxes associated with such vesting events. |
| (3) | In connection with Mr. Stack’s vesting events, 4,348 shares were issued to the executive and 2,128 shares were surrendered to pay taxes associated with such vesting events. |
| (4) | In connection with Mr. Weidenkopf’s vesting events, 3,104 shares were issued to the executive and 1,428 shares were surrendered to pay taxes associated with such vesting events. |
| (5) | In connection with Mr. Clegg’s vesting events, 3,446 shares were issued to the executive and 1,086 shares were surrendered to pay taxes associated with such vesting events. |
| (6) | In connection with Mr. Dick’s vesting events, 3,446 shares were issued to the executive and 1,086 shares were surrendered to pay taxes associated with such vesting events. |
Equity compensation plan information
| Plan Category | Number of securities to be issued upon exercise of outstanding options, warrants and rights |
Weighted- average exercise price of outstanding options, warrants and rights |
Number of securities remaining available for future issuance under equity compensation plans (excluding securities reflected in column (a)) |
|||||||||
|
|
||||||||||||
| Equity compensation plans approved by security holders |
(a) | (b) | (c) | |||||||||
| Equity compensation plans not approved by security holders(1)(2) |
3,229,410(3) | $ | 27.98(4) | 465,147 | ||||||||
|
|
|
|||||||||||
| Total |
3,229,410 | $ | 27.98(4) | 465,147 | ||||||||
|
|
||||||||||||
| (1) | Represents Aleris Corporation’s 2010 Equity Incentive Plan, which was approved by the Bankruptcy Court as part of Aleris International’s emergence from bankruptcy on June 1, 2010. |
| (2) | In connection with the 2011 Stockholder Dividends, the number of shares of common stock of Aleris Corporation authorized under the 2010 Equity Incentive Plan was adjusted, in the aggregate, from 2,890,343 to 3,764,557. |
| (3) | Includes 2,974,071 stock options and 210,489 RSUs granted under Aleris Corporation’s 2010 Equity Incentive Plan, as of December 31, 2011. |
| (4) | Weighted average exercise price of 2,974,071 outstanding options. Calculation excludes restricted stock units. |
The Aleris Corporation 2010 Equity Incentive Plan (the “Equity Incentive Plan”) was established to attract, retain, incentivize and motivate officers and employees of, consultants to, and non-employee directors providing services to the Company and its subsidiaries and affiliates and
168
Table of Contents
to promote the success of the Company by providing such participating individuals with a proprietary interest in the performance of the Company.
A description of the 2012 Equity Incentive Plan, which is the amended and restated 2010 Equity Incentive Plan and which will apply to all awards granted to date, is set forth below under the heading “Revised compensation plans.”
Pension benefits as of December 31, 2011
The following table provides information with respect to each pension plan that provides for payments or other benefits at, following, or in connection with retirement. This includes tax-qualified defined benefit plans and supplemental executive retirement plans, but does not include defined contribution plans (whether tax-qualified or not). Values reflect the actuarial present value of the named executive officer’s accumulated benefit under the retirement plans, computed as of December 31, 2011. In making this calculation for Messrs. Demetriou, Stack, Clegg and Dick, we used the same economic assumptions that we use for financial reporting purposes (except that retirement is assumed to occur at age 62). These assumptions include the following: (a) retirement age of 62 (the earliest allowable retirement age under the plan without a reduction in benefits); (b) discount rate of 4.50%; (c) cash balance interest crediting rates of 2.72% for 2011 and 3.50% for periods after 2011; and (d) a lump sum form of payment. See the disclosure below regarding the assumptions made with respect to Mr. Baan’s Swiss pension benefit.
| Name | Plan name | Number of years credited service (#) |
Present value of accumulated benefit ($) |
|||||||||
|
|
||||||||||||
| Steven J. Demetriou |
Cash Balance Plan | 2.6 | 34,077 | |||||||||
| Roelof IJ. Baan |
Swiss Pension Plan | 3.7 | 863,393(1) | |||||||||
| Sean M. Stack |
Cash Balance Plan | 2.6 | 20,114 | |||||||||
| Thomas W. Weidenkopf |
None | N/A | N/A | |||||||||
| Christopher R. Clegg |
Cash Balance Plan | 2.5 | 31,739 | |||||||||
| K. Alan Dick |
Cash Balance Plan | 8.2 | 60,777 | |||||||||
|
|
||||||||||||
| (1) | To convert the present value of accumulated benefit to US$, the year-end conversion rate used by the Company (equaling 1.074 US$ to 1 CHF for 2011) was applied. |
As former Commonwealth Industries, Inc. (a predecessor company to Old AII, Inc.) employees, Messrs. Demetriou, Stack, Clegg and Dick are participants in the Cash Balance Plan, which was previously a plan of that predecessor entity. The Cash Balance Plan is a qualified defined benefit plan under the U.S. Internal Revenue Code of 1986, as amended (the “Internal Revenue Code”). Participants’ benefits are determined on the basis of a notional account. Accounts are credited with pay credits between 3.5% and 8.0% of earnings for each year of credited service based on the participant’s age. Interest is credited based on applicable rates of interest on U.S. Treasury bonds. Compensation and benefits are limited to applicable Internal Revenue Code limits. Pay credits were ceased effective December 31, 2006.
Benefits are available to participants as either an annuity or lump sum with an equivalent value to the participant’s account at the time of distribution. Normal retirement is age 65 and unreduced benefits are available at age 62. Benefits are available at earlier ages as long as the
169
Table of Contents
participant is vested in the plan. Three years of service is required for vesting. Earnings include base pay and annual incentive payments. The value of stock options and other long-term compensation items are not included.
The plan provides grandfathered benefits to certain participants based on a previous plan benefit formula. None of our named executive officers are eligible for these benefits. Benefit accruals in this plan were frozen effective December 31, 2006 for all participants including our applicable named executive officers.
Mr. Baan is not a participant in the Cash Balance Plan. He participates in the Swiss Pension Plan, a plan operated in accordance with applicable Swiss law. The Swiss Pension Plan provides Mr. Baan with a cash-balance type benefit upon his retirement, whereby, at the participant’s normal retirement date at age 65, he is eligible for an annuity based on his account balance at the time. Under the terms of the plan and Mr. Baan’s employment agreement, service credits of 25% of Mr. Baan’s base salary are contributed annually to the Swiss Pension Plan, and all such contributions are paid by the Company, which includes a mandated contribution under Swiss law. Interest credits are also given on the account balance. No further contributions or interest credits are provided after retirement. In order to calculate the present value for Mr. Baan’s accumulated benefit, the following assumptions were applied: interest crediting rates on the mandated and supplemental accounts of 1.5% and 1.75%, respectively, a retirement age of 65 and a discount rate of 2.82%.
Nonqualified deferred compensation
The following table provides information with respect to the Aleris Deferred Compensation and Retirement Benefit Restoration Plan (the “Deferred Compensation Plan”).
| Name | Executive in last FY |
Registrant contributions in last FY ($)(1) |
Aggregate earnings in last FY ($) |
Aggregate distributions |
Aggregate balance at last FYE ($) |
|||||||||||||||
|
|
||||||||||||||||||||
| Steven J. Demetriou |
74,375 | 49,700 | (3,114 | ) | — | 120,961 | ||||||||||||||
| Roelof IJ. Baan(2) |
— | — | — | — | — | |||||||||||||||
| Sean M. Stack |
30,062 | 14,250 | — | — | 44,312 | |||||||||||||||
| Thomas W. Weidenkopf(2) |
— | — | — | — | — | |||||||||||||||
| Christopher R. Clegg |
29,109 | 13,488 | — | — | 42,597 | |||||||||||||||
| K. Alan Dick |
28,595 | 13,076 | (110 | ) | — | 41,562 | ||||||||||||||
|
|
||||||||||||||||||||
| (1) | The full amounts reported as executive contributions, and Registrant contributions have been reported in the “Salary” and “All other compensation” columns in the “Summary compensation table,” respectively. |
| (2) | These named executive officers do not participate in our Deferred Compensation Plan. |
Our named executive officers based in the United States are eligible to participate in the Deferred Compensation Plan that benefits only a select group of United States management employees. The Deferred Compensation Plan uses a hypothetical account for each participant who elects to defer income. The participant selects investment funds from a broad range of options. Earnings and losses on each account are determined based on the performance of the investment funds selected by the participant. A participant may elect to defer a minimum of 10% but not more than 50% of his annual base compensation and between 10-95% of his bonus awarded pursuant to the MIP as compensation deferrals. In addition, the participant may elect to defer between 1-5% of his annual base compensation and between 1-5% of his bonus awarded
170
Table of Contents
pursuant to the MIP as restoration deferrals. With respect to amounts contributed to the plan by the participant as restoration deferrals the Company provides certain matching contributions and employer contributions. Distributions under the Deferred Compensation Plan may be made as a single lump sum, on a fixed date or schedule, or in equal installments over periods of five or ten years, depending on distribution’s triggering event and the participant’s elections, in compliance with the election and timing rules of Internal Revenue Code Section 409A.
Potential payments upon termination or change in control
As discussed in the Compensation discussion and analysis, the named executive officers are eligible for severance benefits under their employment agreements, as described below, in the event of certain termination of employment events. In addition, certain provisions are trigged pursuant to the stock option and RSU award agreements in the event of a Change in Control or termination of employment.
The payments and benefits to which the named executive officers would be entitled in the event of certain termination of employment events, or as a result of a Change in Control, are set forth in the table below, following a description of these payments and benefits, assuming the event occurred on December 31, 2011. For this purpose, we have assumed a value of $48.00 per share of our common stock.
Employment agreements
Under the terms of the employment agreements, the named executive officers’ employment may be terminated at any time by either party, subject to certain notice provisions and severance obligations in the event of certain specified terminations. The payments and benefits upon each termination of employment scenario as described herein (other than accrued benefits) are generally conditioned upon the execution of a general release of claims against the Company and the executive’s compliance with certain restrictive covenants discussed below.
Upon a termination without Cause or for Good Reason (each as defined below):
Mr. Demetriou would receive under his original agreement without regard to amendments that will take effect immediately prior to the effectiveness of the contemplated initial public offering:
| • | accrued benefits; |
| • | any earned annual bonus for the prior year to the extent not yet paid; |
| • | a cash severance payment equal to (a) in the event termination occurs on or prior to the first anniversary of the Emergence Date, two times the sum of his base salary and target bonus, or (b) in the event termination occurs subsequent to the first anniversary of the Emergence Date, the product of (1) the sum of his base salary and the average bonus paid for the two most recent calendar years (provided that for these purposes, Mr. Demetriou will be deemed to have earned an annual bonus of $1,000,000 for each of 2009 and 2010), and (2) the greater of (x) one and (y) a fraction, the numerator of which is the number of days from the date of termination through the expiration date of the then-outstanding term and the denominator of which is 365, in each case, payable in substantially equal installments consistent with Aleris International’s payroll practices over a period of two years following the date of termination; and |
171
Table of Contents
| • | continuation of all medical benefits for (a) in the event termination occurs on or prior to the first anniversary of the Emergence Date, two years, or (b) in the event termination occurs subsequent to the first anniversary of the Emergence Date, the greater of (1) 12 months and (2) the period of time from the date of termination through the expiration date of the then-outstanding term. |
For Mr. Demetriou, the timing of severance payments in connection with an involuntary termination following a Change in Control and the period of severance generally will be amended, to be effective immediately prior to the effectiveness of the contemplated initial public offering, as described below.
Each of the other named executive officers would receive under his original agreement without regard to amendments that will take effect immediately prior to the effectiveness of the initial public offering:
| • | accrued benefits; |
| • | any earned annual bonus for the prior year to the extent not yet paid; |
| • | a cash severance payment equal to 1.5 (or 1.33 for Mr. Baan) times the sum of his base salary and average earned bonus for the two most recent calendar years (provided that for these purposes, the executive will be deemed to have an annual bonus for each of 2008, 2009, and 2010 equal to their target bonus as in effect on the Emergence Date), payable in substantially equal installments consistent with Aleris International’s payroll practices over a period of 18 months (16 months for Mr. Baan) following the date of termination; and |
| • | continuation of all medical benefits for 18 months (16 months for Mr. Baan). |
The timing of severance payments in connection with an involuntary termination following a Change in Control will be amended, to be effective immediately prior to the effectiveness of the contemplated initial public offering, as described below.
Upon a termination by Aleris International for Cause or by the named executive officer without Good Reason, the named executive officer would only receive his or her accrued benefits. Upon a termination due to the named executive officer’s death or disability, the named executive officer (or his or her estate) would receive:
| • | accrued benefits; |
| • | any earned annual bonus for the prior year to the extent not yet paid; and |
| • | a pro-rata bonus determined based on the named executive officer’s target bonus adjusted for the number of days the named executive officer was employed during the calendar year. |
In each of the named executive officer’s employment agreements, “Cause” is defined to mean the occurrence of any of the following, if the executive has not cured such behavior, where applicable, within 30 days after receiving notice from Aleris International:
| • | a material breach of the employment agreement; |
| • | other than as a result of physical or mental illness or injury, continued failure to substantially perform his duties; |
172
Table of Contents
| • | gross negligence or willful misconduct which causes or reasonably should be expected to cause material harm to Aleris International or the Company and its subsidiaries; |
| • | material failure to use best reasonable efforts to follow lawful instructions of the Board of Directors or, for the named executive officers other than Mr. Demetriou, his direct supervisor; or |
| • | an indictment for, or plea of nolo contendere to, a felony involving moral turpitude or other serious crime involving moral turpitude. |
“Good Reason” is defined to mean the occurrence of any of the following, without the named executive officer’s prior written consent, if Aleris International has not cured such behavior within 60 days after receiving notice from the executive:
| • | a material reduction in base salary or annual bonus opportunity; |
| • | a material diminution in position, duties, responsibilities or reporting relationships; |
| • | a material breach by Aleris International or the Company of any material economic obligation under the employment agreement or stock option or RSU award agreements; or |
| • | a change of principal place of employment to a location more than seventy-five miles from such principal place of employment as of the Emergence Date. |
In the original employment agreements, for the U.S.-based executives, if Aleris International elects not to renew the named executive officer’s employment at the end of the then-outstanding term in accordance with the terms of the employment agreement (which requires Aleris International to provide at least 12-months notice to Mr. Demetriou and at least six months notice to the other named executive officers), the named executive officer would be entitled to receive: (i) accrued benefits and (ii) a cash non-renewal payment equal to the sum of the named executive officer’s base salary and average earned bonus for the two most recent calendar years, payable in substantially equal installments consistent with Aleris International’s payroll practices over the twelve month period following the date of termination. In contemplation of this initial public offering, the Board of Directors approved amendments to these notice provisions, to be effective immediately prior to the effectiveness of this contemplated initial public offering and as further described below.
If any named executive officer elects to not renew his employment agreement at the end of the then-outstanding term in accordance with the terms of the employment (which require him to provide 90 days notice in the case of Mr. Demetriou and 60 days notice in the case of the other named executive officers), the named executive officer would be entitled to receive: (i) accrued benefits and (ii) a pro-rata bonus determined based on the bonus he would have received for that year if termination had not occurred and the number of days that the executive was employed during the calendar year. The term of the employment agreement with Mr. Baan (who is based in Switzerland) continues indefinitely until his employment is terminated with at least two months notice, either by the Company or by Mr. Baan. This provision was not amended by the Board of Directors.
Under the employment agreements, each named executive officer agrees to be bound by certain restrictive covenants, including a confidentiality provision. Each employment agreement also obligates the named executive officer to agree to not (i) solicit, hire, or encourage any such person to terminate employment with Aleris International or its affiliates, anyone employed by
173
Table of Contents
Aleris International within six months of such hiring date, for a period of two years for Mr. Demetriou and 18 months for the other named executive officers, in each case, following his termination; (ii) compete with Aleris International for a period of two years for Mr. Demetriou and 18 months for the other named executive officers, in each case, following his termination; and (iii) defame or disparage Aleris International, its affiliates and their respective officers, directors, members and executives.
The Board of Directors has approved amendments to the employment agreements for Messrs. Demetriou, Stack, Clegg, Dick and Weidenkopf effective immediately prior to the effectiveness of this contemplated initial public offering. The amendment to Mr. Demetriou’s employment agreement provides that Mr. Demetriou will receive 24 months of severance payments and benefits after a termination by Aleris International without Cause, or by Mr. Demetriou for Good Reason (as such terms are described in his employment agreement) or on a non-renewal, even if the termination is after the first anniversary of the Emergence Date of his agreement and regardless of the number of months remaining in the term of his employment agreement. Aleris International would be required to provide only a 30-day notice of nonrenewal of the employment agreement, instead of a one year notice. The severance payments would be made in equal installments over the 24-month severance period; however, in the event that such termination occurs in contemplation of a Change in Control or during the 12 months following a Change in Control (as defined in the 2012 Equity Incentive Plan, also becoming effective immediately prior to the effectiveness of this contemplated initial public offering), severance payments will be made in a lump sum to the extent allowable under Section 409A of the Internal Revenue Code. The employment agreements for Messrs. Stack, Clegg, Dick and Weidenkopf will be amended such that the notice period for a non-renewal of the agreement by the Company is shortened from six months to 30 days and the severance benefit the executive is entitled to receive in such event is adjusted to take into account the shortened notice period. Under the amended agreement, each executive would receive 18 months of severance on a nonrenewal, which coincides with the amount of severance he is currently entitled to receive after a termination of employment without Cause or by the executive for Good Reason (as such terms are described in each executive’s employment agreement). The severance payments would be made in equal installments over the 18-month severance period; however, the amendment to the employment agreements for Messrs. Stack, Clegg, Baan, Dick and Weidenkopf, would also state that in the event such termination occurs in contemplation of a Change in Control or during the 12 months following a Change in Control (as defined in the 2012 Equity Incentive Plan), severance payments will be made in a lump sum to the extent allowable under Section 409A of the Internal Revenue Code or would be allowable if Section 409A of the Internal Revenue Code was applicable.
2011 MIP bonus awards
In the event of the executive’s death, disability, or retirement, under the terms of the MIP, the named executive officer becomes entitled to payment of a pro-rata portion of the bonus amount which he would have received as of the date of his death, disability, or retirement, as applicable.
Equity award agreements
Under the Equity Incentive Plan and equity award agreements, upon a Change in Control, each tranche of our named executive officer’s stock options and the RSUs would vest to the extent necessary to make the aggregate percentage of all applicable tranches of the stock options and the RSUs that have become vested as of the date of such Change in Control at least equal to the
174
Table of Contents
percentage by which the Oaktree Funds and the Apollo Funds have reduced their combined common stock interest in the Company. The remaining unvested tranches, if applicable, would continue to vest in accordance with their terms. If the Oaktree Funds and the Apollo Funds’ combined common stock interest in the Company is reduced by 75% or more, then all applicable tranches of the stock option and the RSUs will fully vest. The applicable percentage will be measured by comparing the number of shares held collectively by the Oaktree Funds and the Apollo Funds as of the Emergence Date and still held by them immediately following the Change in Control to the number of shares they held on the Emergence Date (to be adjusted for stock splits, stock dividends and similar events). The Board of Directors has approved an amendment to the equity award agreements to provide that, effective immediately prior to the effectiveness of the contemplated initial public offering, all outstanding awards will be subject to the terms of the 2012 Equity Incentive Plan (which is the amended and restated equity incentive plan that also becomes effective immediately prior to the effectiveness of the contemplated initial public offering).
Upon a voluntary termination of employment by the named executive officer without Good Reason, the named executive officer would forfeit all unvested options and RSUs immediately and would have the lesser of 90 days or the remaining term to exercise all vested options. Upon a termination of employment by Aleris International for Cause, the named executive officer would forfeit all options (whether vested or unvested) and unvested RSUs. Upon a termination of employment by Aleris International without Cause or by the named executive officer for Good Reason (including due to the non-extension of his employment term by Aleris International), each tranche, if applicable, of unvested options and all RSUs would become immediately vested with respect to (i) for Mr. Demetriou, 50% and (ii) for each other named executive officer, 33%, in each case, of the then unvested options that have not previously been vested or remaining RSUs, respectively. The named executive officer would then have six months to exercise all vested options. If the named executive officer’s employment is terminated as a result of death or disability, all unvested options and RSUs would be forfeited immediately and the named executive officer would have the shorter of one year or the length of the remaining term to exercise all vested options.
| Termination by Co. for Cause or by Exec. without Good Reason |
Termination by Co. without Cause or by Exec. for Good Reason |
Death or disability | Change in value of |
|||||||||||||||||||||
| Name | Payment($)(1) | Cash and benefits |
Value of equity acceleration |
Cash and benefits ($)(4) |
Value of equity acceleration ($) |
|||||||||||||||||||
|
|
||||||||||||||||||||||||
| Steven J. Demetriou(5) |
76,923 | 2,891,180 | 6,896,487 | 1,264,403 | — | 13,792,974 | ||||||||||||||||||
| Roelof IJ. Baan(5) |
78,490 | 2,352,501 | 1,622,200 | 1,074,666(6) | — | 4,915,758 | ||||||||||||||||||
| Sean M. Stack(5) |
34,131 | 1,176,239 | 1,449,248 | 439,199 | — | 4,391,660 | ||||||||||||||||||
| Thomas W. Weidenkopf(5) |
28,846 | 1,030,329 | 1,014,081 | 361,340 | — | 3,072,972 | ||||||||||||||||||
| Christopher R. Clegg(5) |
30,288 | 1,041,146 | 1,014,091 | 383,148 | — | 3,073,004 | ||||||||||||||||||
| K. Alan Dick(5) |
32,276 | 1,086,207 | 1,342,850 | 355,998 | — | 4,069,242 | ||||||||||||||||||
|
|
||||||||||||||||||||||||
| (1) | The amounts in this column include only payment of accrued vacation, as of December 31, 2011. |
| (2) | The amount of Cash and Benefits in the event of a termination by Aleris International without Cause or by the Executive for Good Reason (calculated under the terms of each executive’s employment agreement assuming the termination occurred on December 31, 2011) includes the payment of the sum of executive’s base salary and average annual bonus paid in the prior two calendar years (or deemed to be paid as provided in the executive’s employment agreement for 2009 and 2010) multiplied by a multiple (1.4, 1.33, and 1.5 for Mr. Demetriou, Mr. Baan, and each of the other named executive officers, respectively), an estimated value of continued medical benefits for the applicable period and accrued vacation. |
175
Table of Contents
| (3) | Upon termination by Aleris International without Cause or by the Executive for Good Reason, the named executive officers’ remaining unvested options and RSUs will vest, 50% with respect to Mr. Demetriou’s remaining unvested equity awards, and 33% with respect to the remaining unvested equity awards for the other named executive officers, as of the date of such termination (assumed to occur on December 31, 2011). |
| (4) | The amounts in this column include payment of accrued vacation as of December 31, 2011, as well as payment of each executive’s earned but unpaid 2011 MIP bonus amounts. |
| (5) | The Change in Control equity valuation assumes that the Oaktree Funds and the Apollo Funds would reduce their combined common stock interest of the Company by more than 75%, triggering the full vesting of outstanding equity awards. |
| (6) | This figure includes an amount equal to one month of Mr. Baan’s base salary, in addition to those payments described in Footnote 4 above. |
Director compensation
On June 1, 2010, as part of Aleris International’s emergence from bankruptcy, the following individuals were appointed by the Oaktree Funds as our new directors: Kenneth Liang, Scott Graves, Brian Laibow and Ara Abrahamian (together, with Emily Alexander, who joined our Board in January 2011, and Robert O’Leary, who joined our Board in December 2011, collectively referred to as the “Oaktree Directors”). On July 30, 2010, G. Richard Wagoner, Jr. joined the Board of Directors as an “outside” director, meaning that he is not affiliated with our principal stockholders. On September 1, 2010, Christopher M. Crane also joined the Board of Directors as an additional “outside” director. In addition, on January 21, 2011, Lawrence Stranghoener joined the Board of Directors as another “outside” director and Emily Alexander, who is affiliated with the Oaktree Funds, also became a director. On December 7, 2011, Ara Abrahamian resigned from the Board, and Robert O’Leary was appointed by the Oaktree Funds to replace Mr. Abrahamian as an Oaktree Director.
Each of the directors received an equity award as a portion of their compensation for services as a director upon becoming a director, except in the case of Mr. O’ Leary, who was appointed as a director on December 7, 2011 and received an equity grant on January 31, 2012. These equity awards consist of stock options, RSUs and/or restricted stock. In addition to the equity grants, in September 2010, the Board of Directors approved payment of a $50,000 annual cash retainer, payable in equal installments at the end of each calendar quarter with respect to service on our Board of Directors and the Board of Directors of Aleris International for each director except Mr. Wagoner. Mr. Wagoner does not receive a cash retainer because it was determined that his 20,000 restricted stock equity award provides adequate compensation for Mr. Wagoner’s service. This cash retainer level was continued in Fiscal Year 2011 and remains in place for Fiscal Year 2012. On January 21, 2011, our Board of Directors authorized Mr. Stranghoener to receive an additional annual cash payment of $15,000, payable in equal installments at the end of each calendar quarter with respect to service as Chair of our Audit Committee commencing with the first quarter of 2011. For each of the Oaktree Directors, all cash and non-cash compensation paid to the Oaktree Director with respect to their service as one of our directors is turned over to an Oaktree affiliate pursuant to an agreement between the Oaktree Funds and the Oaktree Director as part of his or her employment with the Oaktree Funds.
176
Table of Contents
The following table sets forth a summary of compensation with respect to our directors’ service on our Board of Directors and the Board of Directors of Aleris International for the year ended December 31, 2011.
Director compensation—January 1-December 31, 2011
| Name | Fees earned or paid in cash ($) |
Stock awards ($) |
Option awards ($) |
All other compensation ($)(1) |
Total ($) |
|||||||||||||||
|
|
||||||||||||||||||||
| Kenneth Liang(2) |
$ | 50,000 | — | — | $ | 48,000 | $ | 98,000 | ||||||||||||
| Scott L. Graves(2) |
50,000 | — | — | 48,000 | 98,000 | |||||||||||||||
| Brian Laibow(2) |
50,000 | — | — | 48,000 | 98,000 | |||||||||||||||
| Ara Abrahamian(2) |
50,000 | — | — | 48,000 | 98,000 | |||||||||||||||
| Emily Alexander(2)(3) |
50,000 | 121,320(2) | 270,528(2) | 48,000 | 477,348 | |||||||||||||||
| Robert O’Leary(2)(4) |
— | — | — | — | — | |||||||||||||||
| G. Richard Wagoner, Jr.(5) |
— | — | — | 320,000 | 320,000 | |||||||||||||||
| Christopher M. Crane(6) |
50,000 | — | — | 48,000 | 98,000 | |||||||||||||||
| Lawrence W. Stranghoener(3) |
65,000 | 121,320(2) | 270,528(2) | 47,398 | 487,996 | |||||||||||||||
|
|
||||||||||||||||||||
| (1) | The amounts in this column include: (i) the aggregate of dividend payments made in connection with 2011 Stockholder Dividends in respect of shares issued, to the applicable director, in connection with the vesting of RSU awards prior to the dividend record date, in the amounts of $8,998, $8,998, $8,998, $8,998, $2,397, $320,000, $5,994 and $1,795, to Messrs. Liang, Graves, Laibow, Abrahamian, Alexander, Wagoner, Crane, and Stranghoener, respectively, and (ii) the aggregate of the dividend equivalent rights payments made in connection with the 2011 Stockholder Dividends in respect of unvested RSUs that remained outstanding at the dividend record date, in the amounts of $39,002, $39,002, $39,002, $39,002, $45,603 $42,006, and $45,603, to Messrs. Liang, Graves, Laibow, Abrahamian, Alexander, Crane, and Stranghoener, respectively. |
| (2) | Messrs. Kenneth Liang, Scott Graves, Brian Laibow, Ara Abrahamian and Robert O’Leary, and Ms. Emily Alexander have been appointed to the Board of Directors by the Oaktree Funds. Mr. O’Leary replaced Mr. Abrahamian after Mr. Abrahamian’s resignation, effective December 7, 2011. All remuneration paid to the Oaktree Directors is turned over to an affiliate of Oaktree and is not kept by the individual. Messrs. Liang, Graves, Laibow and Abrahamian, and Ms. Emily Alexander were granted equity awards consisting of RSUs and options. The number of shares underlying each option and the corresponding exercise price were each adjusted, as applicable, in light of the 2011 Stockholder Dividends, which adjustments did not change the fair market value of such awards. Please see “Principal and selling stockholders” for more information. |
| (3) | Ms. Emily Alexander and Mr. Lawrence Stranghoener each received, on January 21, 2011, grants of 3,000 RSUs and stock options to acquire 21,071 shares of common stock, with an exercise price equal to the fair market value of a share of common stock on the date of grant, as adjusted for the 2011 Stockholder Dividends. The restrictions will lapse on the RSUs and the options vest as to six and one-quarter percent (6.25%) of the total RSUs and stock options, on each quarterly anniversary of the date of grant during the four year period following the date of grant. These awards represent the full amount of equity awards that have been awarded to Ms. Alexander and Mr. Stranghoener. Ms. Alexander’s awards are held by an affiliate of Oaktree. |
| (4) | Mr. Robert O’Leary was granted 2,400 RSUs and stock options to acquire 29,500 shares of common stock on January 31, 2012, with an exercise price equal to the fair market value of a share of common stock on the date of grant. The restrictions will lapse on the RSUs and the options vest as to six and one-quarter percent (6.25%) of the total RSUs and stock options, on each quarterly anniversary of the date of appointment during the four year period following his date of appointment to our Board of Directors (December 7, 2011). These awards represent the full amount of equity awards that have been awarded to Mr. O’Leary. |
| (5) | On December 31, 2011, Mr. Wagoner held 20,000 shares of restricted stock, of which 6,250 were vested and 13,750 remained unvested. |
| (6) | On December 31, 2011, Mr. Crane held 2,063 RSUs and 16,856 outstanding stock option awards. |
| (7) | On December 31, 2011, Mr. Stranghoener held 2,438 RSUs and 21,071 outstanding stock option awards. |
With respect to all of the equity awards, the following terms generally apply:
| • | Generally directors do not have any rights with respect to the shares underlying their RSUs, until each RSU becomes vested and the director is issued a share of common stock in settlement of the RSU; however, the RSUs granted to the directors include a dividend equivalent right, pursuant to which the director is entitled to receive, for each RSU, a payment equal in amount |
177
Table of Contents
| to any dividend or distribution made with respect to a share of our common stock, at the same time as the dividend or distribution is made to our stockholders. |
| • | The RSUs will be settled through the issuance of shares of our common stock equal to the number of RSUs that have vested. |
| • | If the stockholders of the Company do not re-elect or reappoint a director to our Board of Directors and the Board of Directors of Aleris International prior to the end of the four-year period, all restrictions will lapse with respect to restricted stock and all RSUs will vest. If board service ceases for any other reason, all unvested restricted shares or RSUs are forfeited. |
| • | In the event of, among other events, an extraordinary distribution, stock dividend, recapitalization, stock split, reorganization, merger, spin-off or other similar transaction, the Board of Directors shall make appropriate and equitable adjustments to the number, exercise price, class and kind of shares or other consideration underlying awards that have been granted under the Equity Incentive Plan, including the stock options and restricted stock awarded to directors. |
| • | Stock options may terminate prior to the scheduled vesting when board service ends. The unvested portion of the stock option will terminate, and the vested portion of the stock option will terminate as follows: (1) if the stockholders of the Company do not re-elect or reappoint the director to the Board of Directors of the Company and Aleris International or the director is removed from service on the Board of Directors of the Company and Aleris International, the stock options will terminate six months after service ends; (2) if the board service ends due to death, the stock option will terminate twelve months after the date of death; and (3) if board service ends for any other reason, the stock option will terminate 90 days after service ends. |
| • | After service ends, the Company has the right, but not the obligation, to purchase any shares acquired by the director upon lapsing of restrictions on restricted stock or restricted stock units or exercise of the stock options. The call right may be exercised, in whole or in part, from time to time and the individual will be paid the fair market value of the shares on the call settlement date. |
| • | If a director is serving on the Board of Directors of the Company at the time of a Change in Control, his or her then restricted shares, RSUs or stock options will vest to the extent necessary to make the cumulative percentage of the award granted that has become vested as of such Change of Control at least equal to the percentage by which the Oaktree Funds and the Apollo Funds have reduced their combined common stock interest in the Company. If the Oaktree Funds’ and the Apollo Funds’ combined common stock interest in the Company is reduced by 75% or more, then all stock options and the RSUs will fully vest. The applicable percentage will be measured by comparing the number of shares acquired by the Oaktree Funds and the Apollo Funds on the Emergence Date and still held by them immediately following the Change in Control to the number of shares of our common stock that they held as of the Emergence Date (to be adjusted for stock splits, stock dividends, and similar events). The Board of Directors has approved an amendment to the applicable award agreements that becomes effective immediately prior to the effectiveness of this contemplated initial public offering stating that outstanding awards would be subject to the terms of the 2012 Equity Incentive Plan. |
178
Table of Contents
Revised compensation plans
Summary of amendments
In connection with this contemplated initial public offering, the Board of Directors has determined that it is desirable to amend and restate the Equity Incentive Plan, to amend and restate the MIP, and amend the stock option and RSU agreements with respect to all outstanding awards, in each case to update certain provisions of these arrangements to reflect the contemplated initial public offering. Each of these changes will be effective immediately prior to the effectiveness of this contemplated initial public offering (which is not guaranteed). The material amendments to the Equity Incentive Plan include the following:
| • | Restating the plan and renaming it the Aleris Corporation 2012 Equity Incentive Plan; |
| • | Increasing the number of shares authorized for issuance to reflect 4% of common stock outstanding; |
| • | Updating the definition of “Initial Investor” so that an Initial Investor (referring to the Oaktree Funds, Apollo and their respective affiliates) ceases to be considered an Initial Investor once its ownership drops below 7.5% of the Voting Securities, and so that the term Initial Investor does not include an affiliate that is a person participating in the metals industry upon completion of this initial public offering, which affects when a Change in Control is triggered; |
| • | Incorporating various provisions and performance criteria related to performance-based awards for future use in compliance with Section 162(m) of the Internal Revenue Code and currently included in the MIP for consistency; |
| • | Modifying provisions regarding the transferability of awards based on public company status; |
| • | Updating certain administrative provisions regarding amendments, termination and administration; and |
| • | Eliminating the ability to provide awards under the plan to consultants. |
With respect to the MIP, the Company will adopt an amended and restated plan, of which the material amendments include the following:
| • | Restating the plan renaming it the Aleris Corporation 2012 Management Incentive Plan; |
| • | Updating the definition of Change of Control to conform to the 2012 Equity Incentive Plan; |
| • | Updating the performance objective metrics that may be used for future bonus awards to conform to the performance-based grant features under the 2012 Equity Incentive Plan; |
| • | Incorporating various provisions related to performance-based awards for future use in compliance with Section 162(m) of the Internal Revenue Code; and |
| • | Providing for pro-rated awards in the event of participant’s death, disability or retirement based on actual performance at end of the relevant performance cycle. |
179
Table of Contents
With respect to the grants of stock options, RSUs and/or restricted stock to the named executive officers, other key employees, and directors (referred to collectively as the “Equity Awards”) the material amendments to the award agreements include the following:
| • | Eliminating the requirement to sign a stockholders agreement when the RSUs and restricted stock vests, or stock options are exercised; |
| • | Providing that the Equity Awards are subject to the 2012 Equity Incentive Plan, including the revised definition of Change in Control; |
| • | Eliminating references that are generally specific to companies that are privately held; and |
| • | With respect to the RSU award agreements for Mr. Demetriou and Mr. Stack, providing for the identical rights as other named executive officers which allow the executive to net settle the RSUs upon vesting. |
Description of 2012 Equity Incentive Plan
The Equity Incentive Plan was established on June 1, 2010 to attract, retain, incentivize and motivate officers and employees of, consultants to, and non-employee directors providing services to the Company and its subsidiaries and affiliates and to promote the success of the Company by providing such participating individuals with a proprietary interest in the performance of the Company. To date, the Company has granted awards of stock options and RSUs pursuant to the Equity Incentive Plan. In connection with this contemplated initial public offering, the Board of Directors intends to adopt, effective immediately prior to the effectiveness of the contemplated initial public offering, the amended and restated Equity Incentive Plan and to rename the plan as the 2012 Equity Incentive Plan. The purpose of the 2012 Equity Incentive Plan has the same purpose as the Equity Incentive Plan, except that consultants will no longer be eligible participants.
Stock subject to 2012 Equity Incentive Plan. Effective immediately prior to the effectiveness of this contemplated initial public offering the Board of Directors has reserved shares of our common stock for issuance under the 2012 Equity Incentive Plan. Of the total authorized shares, shares were authorized for issuance under the 2010 Equity Incentive Plan. In contemplation of this contemplated initial public offering, the Board of Directors approved additional shares being authorized to be available for grants pursuant to the 2012 Equity Incentive Plan. As of the effectiveness of this contemplated initial public offering, approximately shares are available for grants pursuant to the 2012 Equity Incentive Plan.
Administration. The 2012 Equity Incentive Plan is administered by Board of Directors, or at its election, a committee of the Company’s Board of Directors, which is currently the Company’s Compensation Committee. The Committee currently includes two members who are “independent” as defined by applicable New York Stock Exchange and SEC rules, and all members of the current Committee would be considered “nonemployee directors” within the meaning of Rule 16b-3 of the Securities Exchange Act of 1934, as well as “outside directors” within the meaning of Section 162(m) of the Internal Revenue Code with respect to awards intended to qualify under those rules and regulations. The Committee may delegate to the chief executive officer the authority to make awards to participants who are not executive officers of the Company. The Committee may construe and interpret and correct defects, omissions and inconsistencies in the 2012 Equity Incentive Plan and agreements relating thereto. The Committee will have full authority and sole discretion to take all actions it deems necessary or advisable for the administration and operation of the 2012 Equity Incentive Plan, including,
180
Table of Contents
without limitation, the authority and discretion to (i) designate participants; (ii) determine the type or types of awards to be granted to a participant; (iii) determine the number of shares of our common stock to be covered by, or with respect to which payments, rights or other matters are to be calculated in connection with awards; (iv) determine the terms and conditions of any award, including, without limitation, and as applicable, the exercise price, vesting schedules, conditions relating to exercise and termination of the right to exercise; (v) determine whether, to what extent, and under what circumstances awards may be settled or exercised in cash, shares of our common stock or other class of shares or other securities, other awards or other property, or canceled, forfeited or suspended, and the method or methods by which awards may be settled, exercised, canceled, forfeited or suspended; (vi) determine whether, to what extent, and under what circumstances the delivery of cash, shares of our common stock, other securities, other awards, other property and other amounts payable with respect to an award will be deferred, either automatically or at the election of the holder thereof or the Committee; (vii) interpret, construe, administer, reconcile any inconsistency, resolve any ambiguity, correct any defect and/or supply any omission in the provisions of the 2012 Equity Incentive Plan, any agreement relating to an award or any award or any instrument or agreement relating to the 2012 Equity Incentive Plan; (viii) review any decisions or actions made or taken by any Committee in connection with any award or the operation, administration or interpretation of the 2012 Equity Incentive Plan; (ix) accelerate vesting or exercisability of, or otherwise waive any requirements or conditions applicable to, any award; (x) extend the term or any period of exercisability of any award; (xi) modify the purchase price or exercise price under any award; and (xii) otherwise amend an award in whole or in part from time-to-time as the Committee determines to be necessary or appropriate to conform such award to, or as required to satisfy, any legal requirement (including without limitation the provisions of Section 162(m) and 409A of the Internal Revenue Code).
Awards under the 2012 Equity Incentive Plan. Awards under the 2012 Equity Incentive Plan (“Awards”) may consist of non-qualified stock options, restricted stock units, stock appreciation rights, restricted stock (including performance-based restricted stock), performance shares, performance units and other stock-based awards. No Awards may be made under the 2012 Equity Incentive Plan after the tenth anniversary of the adoption of the 2012 Equity Incentive Plan by the Board of Directors. The full number of shares of our common stock authorized under the 2012 Equity Incentive Plan may be used for any type of Award, including stock options.
Option grants. Stock options granted under the 2012 Equity Incentive Plan are non-qualified stock options subject to the terms and conditions determined by the Committee and set forth in the applicable stock option agreement. The exercise price of a non-qualified stock option may not be less than 100% of the fair market value of our common stock at grant and its term may not exceed 10 years from the date of grant. So long as our common stock remains listed on a national securities exchange, “fair market value” is the closing price reported on the primary exchange with which our common stock is listed. The 2012 Equity Incentive Plan does not provide for automatic reload or restoration stock options.
Stock appreciation right. A stock appreciation right is the right to receive the difference, either in cash or in our common stock, between the fair market value of a share of our common stock as of the date of exercise and as of the date of award.
In the case of both stock options and stock appreciation rights, the Committee may provide the awards are subject to vesting requirements, and, if so, the Committee may also determine to waive any vesting requirements to allow for an earlier exercise of the award. Unless otherwise
181
Table of Contents
determined by the Committee, except in certain limited circumstances, no stock option or stock appreciation right may be transferred by the recipient other than by will or the laws of descent and distribution.
Restricted stock and restricted stock units. Restricted stock are shares of our common stock awarded subject to such transferability restrictions and other terms and conditions as the Committee may determine, including purchase price (if any), restriction period, vesting schedule (including whether restrictions lapse upon termination of employment) and requirement of attainment of performance goals. The Committee may, in its discretion, provide for the lapse, acceleration or waiver of any restrictions, in whole or in part. The participant does not have the rights of a stockholder with respect to the shares of restricted stock, unless the Committee determines otherwise at the time of the Award.
Each RSU is the right to receive on the vesting date one share of our common stock or the equivalent cash value (as determined by the Committee). The participant does not have the rights of a stockholder with respect to the RSUs until a share is actually issued upon settlement of the vested RSU. However, at the discretion of the Committee or as provided in the RSU award agreement, RSU award holders may be entitled to certain dividend equivalent rights with respect to each RSU in the event that some types of dividends are paid to the holders of our common stock. RSUs also may be subject to such restrictions and other terms and conditions as the Committee may determine.
Restricted stock awards intended to meet the requirements of Section 162(m) of the Internal Revenue Code are referred to as “performance-based restricted stock,” and will have the material terms described below under “Performance-based compensation.” Unless otherwise provided by the Committee with respect to performance-based restricted stock, two or more performance periods, as described below, may overlap, but no two performance cycles may consist entirely of the same period.
Performance units and performance shares. A performance unit is the right to receive a fixed dollar amount in cash or shares of our common stock based on the attainment at the end of a performance cycle (determined by the Committee) of such performance goals or based on other factors or criteria as the Committee determines. A performance share is the right to receive our common stock or cash of an equivalent value at the end of a specified performance cycle (determined by the Committee), based on the attainment during that performance cycle of such performance goals or based on other factors or criteria as the Committee determines. Unless otherwise determined by the Committee, a participant is not entitled to receive dividends on our common stock covered by a performance share award. Generally, neither performance units nor performance shares may be transferred by the participant. At the end of the applicable performance cycle, the Committee determines the extent to which any pertinent performance goals have been achieved and the percentage of performance units or number of performance shares that have vested. The Committee may, in its discretion, provide for accelerated vesting of performance units and performance shares.
The performance cycle for performance units and for performance shares may be from one to five years, as determined by the Committee. Performance units and performance shares intended to meet the requirements of Section 162(m) of the Internal Revenue Code will have the material terms described below under “Performance-Based Compensation” and unless otherwise provided by the Committee with respect to these performance units or performance shares, two or more performance cycles may overlap, but no two performance cycles may consist entirely of the same period.
182
Table of Contents
Performance-based compensation transition period. Section 162(m) of the Internal Revenue Code generally disallows a federal income tax deduction to any publicly held corporation for compensation paid in excess of $1 million in any taxable year to certain covered employees, but does not disallow a deduction for “performance-based compensation” that is awarded and approved in a manner that complies with the regulations. Prior to this contemplated initial public offering, the Company has not been subject to the terms of Section 162(m) of the Internal Revenue Code. For companies that become publicly held in connection with an initial public offering, the regulations regarding Section 162(m) of the Internal Revenue Code allow for a transitional period, during which time the rules (including those that require disclosure and shareholder approval of certain compensation) do not apply to compensation provided by the new publicly held company. The Company intends to operate the 2012 Equity Incentive Plan in compliance with this transitional rule and intends to seek stockholder approval of the 2012 Equity Incentive Plan and the material terms of the performance goals of Awards of performance-based restricted stock, performance shares and performance units intended to qualify as “performance-based compensation” as well as its Awards of stock options and stock appreciation rights prior to the annual meeting of our stockholders in 2015 (or earlier as may be required in certain circumstances as provided under Section 162(m) of the Internal Revenue Code).
Performance-based compensation. Senior officers, senior management and key employees of the Company and its subsidiaries are eligible to receive Awards of performance-based restricted stock, performance shares and performance units intended to qualify as “performance-based compensation” under Section 162(m) of the Internal Revenue Code.
The performance goals applicable to performance-based restricted stock, and performance shares and performance units intended to qualify as performance-based compensation, will be based on or related to any one or more of the following business criteria: (i) revenue, (ii) earnings per share, (iii) net income per share, (iv) share price, (v) pre-tax profits, (vi) net earnings, (vii) net income, (viii) operating income, (ix) cash flow, (x) earnings before interest, taxes, depreciation and amortization (EBITDA), (xi) sales, (xii) total stockholder return relative to assets, (xiii) total stockholder return relative to peers, (xiv) financial returns (including, without limitation, return on assets, return on equity, return on investment and return on capital employed), (xv) cost reduction targets, (xvi) customer satisfaction, (xvii) customer growth, (xviii) employee satisfaction, (xix) productivity measures, (xx) efficiency measures, (xxi) cost reductions, (xxii) any combination of the foregoing, or (xxiii) prior to the end of the transition period provided under Section 162(m) of the Internal Revenue Code, as described above, such other criteria as the Committee may determine. Performance objectives may be in respect of the performance of the Company, any of its subsidiaries, any of its “divisions” or any combination thereof. For this purpose, a “division” includes the unincorporated operating units, business units, segments or divisions of the Company designated as a division by the Committee. Performance objectives may be absolute or relative (to prior performance of the Company or to the performance of one or more other entities or external indices) and may be expressed in terms of a progression within a specified range.
At the time of the granting of an award, or at any time thereafter, the Committee may provide for the manner in which performance will be measured against the performance goals (or may adjust the performance goals) to reflect losses from discontinued operations, extraordinary, unusual or nonrecurring gains and losses, the cumulative effect of accounting changes, acquisitions or divestitures, core process redesign, structural changes/outsourcing, foreign exchange impacts, the impact of specified corporate transactions, accounting or tax law changes and other extraordinary or nonrecurring events.
183
Table of Contents
The performance goals with respect to a particular performance cycle will be established by the Committee by the earlier of (x) the date on which a quarter of the period or cycle has elapsed or (y) the date which is 90 days after the commencement of the period or cycle, and, in any event, while the performance relating to the performance goals remains substantially uncertain.
Prior to the vesting, payment, settlement or lapsing of any restrictions with respect to any Award of performance-based restricted stock, performance shares or performance units that is intended to constitute Performance-Based Compensation made to a participant who is subject to Section 162(m) of the Internal Revenue Code, the Committee will certify in writing that the applicable performance goals have been satisfied to the extent necessary for the Award to qualify as Performance-Based Compensation. A participant’s award of performance-based restricted stock, performance shares or performance units that is intended to qualify as Performance-Based Compensation may be reduced at any time prior to payment. The Committee is precluded from exercising any discretion with respect to Awards of performance-based restricted stock, performance shares or performance units that are intended to qualify as Performance-Based Compensation to increase the amount of compensation payable that would otherwise be due upon attainment of the performance goal.
Other Stock-based awards and exchanges. The Committee, in its sole discretion, may grant Awards of shares of our common stock or other authorized class or kind of security and Awards that are valued, in whole or in part, by reference to, or are otherwise based on, the Fair Market Value of such shares. These types of stock-based awards will be in such form, and dependent on such conditions, as the Committee will determine, including, without limitation, the right to receive one or more shares (or the equivalent cash value of such shares) upon the completion of a specified period of service, the occurrence of an event and/or the attainment of performance objectives.
Change of Control definition. For purposes of the 2012 Equity Incentive Plan, a Change of Control generally includes: (a) an acquisition by any person or group (as defined in the Exchange Act) of 50% or more of our outstanding common stock entitled to vote generally in the election of Company directors (the “Voting Securities”), except that a transaction by any of our Initial Investors whose ownership exceeds 7.5% of the Voting Securities will not be considered a Change of Control, where the term Initial Investor means the Oaktree Funds and Apollo and their respective affiliates other than an affiliate in the metals industry at the time of the completion of this contemplated initial public offering; (b) a merger, consolidation or similar transaction, or sale, lease or other disposition of substantially all of our assets, where our stockholders immediately prior to the transaction do not beneficially own more than 50% of the Voting Securities of the surviving entity immediately after the transaction; or (c) a change in the majority of our Board of Directors over a period of 36 months or less where the election or nomination of any new directors was not approved by the then current Board of Directors.
Adjustment of shares and Change of Control. In the event of, among other events, an extraordinary distribution, stock dividend, recapitalization, stock split, reorganization, merger, spin-off or other similar transaction, the number and kind of shares, in the aggregate, reserved for issuance under the 2012 Equity Incentive Plan will be adjusted to reflect the event. In addition, the Committee may make adjustments to the number, exercise price, class and kind of shares or other consideration underlying the awards. In the event of a Change of Control (as defined in the 2012 Equity Incentive Plan), unless otherwise prohibited under applicable law or unless specified in an award agreement, the Committee is authorized, but not obligated, with respect to any or all awards, to make adjustments in the terms and conditions of outstanding awards, including, but not limited to, causing the awards, as part of the Change of Control
184
Table of Contents
triggering event, to be continued, substituted or canceled for a cash payment (or a payment in the same form as other stockholders are receiving in the Change of Control triggering event). The Committee may also accelerate the vesting of outstanding awards or may adjust the expiration of any outstanding stock options. With respect to all awards granted to date, a portion of the unvested stock options and RSUs outstanding at the time of the Change of Control may vest. The portion that would vest and become exercisable, in the case of stock options and RSUs, is based on a formula that, after it is applied at the time of the Change of Control event, results in the percentage of the holder’s cumulative stock options and RSUs that are vested and exercisable equaling the percentage by which the Oaktree Funds and Apollo reduced their collective ownership in the Company as part of the Change of Control. If the Oaktree Funds and Apollo collectively reduce their ownership in the Company by 75% or more, then any unvested stock options would vest, and become exercisable, in full.
Clawback. Subject to the terms of an award agreement that may provide otherwise, the Company may cancel any award held by a participant, or require that the participant repay to the Company any gain that may have been realized on the vesting or exercise of such award in the event that the participant violates any non-competition, non-solicitation or non-disclosure covenant or agreement that applies to such participant or if the participant engages in fraud or other misconduct that contributes materially to any financial restatement or material loss.
Amendments or termination. The Board of Directors may amend, modify, alter, suspend, discontinue or terminate the 2012 Equity Incentive Plan or any portion of the 2012 Equity Incentive Plan or any Award at any time, subject to any applicable stockholder approval requirements. Without the approval of the stockholders of the Company, no amendment may be made which would (i) increase the aggregate number of shares of Company common stock that may be issued under the 2012 Equity Incentive Plan or the percentage of shares that may be issued with respect to Awards other than stock options and stock appreciation rights granted in connection with a stock option; (ii) change the definition of participants eligible to receive stock options and Awards under this 2012 Equity Incentive Plan; (iii) decrease the option price of any stock option to less than 100% of the fair market value on the date of grant; (iv) reduce the option price of an outstanding stock option, either by lowering the option price or by canceling an outstanding stock option and granting a replacement stock option with a lower exercise price; or (v) extend the maximum stock option duration beyond ten years from the date of grant. Moreover, no amendment, modification, suspension or termination may be made without the consent of a participant if such action would impair or adversely alter any of the rights of such participant under any Award granted to such participant under the 2012 Equity Incentive Plan.
Description of 2012 Management Incentive Plan
The Board of Directors has approved the restatement of the MIP, renaming the plan the 2012 Management Incentive Plan (the “2012 MIP”) effective immediately prior to the effectiveness of this contemplated initial public offering.
Bonus awards under the 2012 MIP will continue to represent variable compensation linked to organizational performance, which is a significant component of the Company’s total annual compensation package for key employees, including the named executive officers, and is designed to reward the employee’s participation in the Company’s achievement of critical financial performance and growth objectives. The bonuses will be determined on an annual basis. Each bonus recipient, including the named executive officers, must be an employee of the
185
Table of Contents
Company or its subsidiaries on the date the bonus is paid (generally in the quarter following the quarter to which the relevant performance goals related) in order to be eligible to receive that bonus amount.
Administration. The 2012 MIP is administered and interpreted by the Board of Directors or, at its election, a committee of the Company’s Board of Directors, which is currently the Company’s Compensation Committee. The Committee currently includes two members who are “independent” as defined by applicable New York Stock Exchange and SEC rules, and all members of the current Committee would be considered “nonemployee directors” within the meaning of Rule 16b-3 of the Securities Exchange Act of 1934, as well as “outside directors” within the meaning of Section 162(m) of the Internal Revenue Code with respect to Awards intended to qualify under those rules and regulations. The Committee may construe and interpret and correct defects, omissions and inconsistencies in the 2012 MIP and agreements relating thereto. The Committee has the authority to (i) designate employees as participants; (ii) determine the terms and conditions of any award, including the applicable performance objectives; (iii) interpret, construe, administer, reconcile any inconsistency, resolve any ambiguity, correct any defect and/or supply any omission in the provisions of the 2012 MIP, or any award or any instrument or agreement relating to the 2012 MIP; (iv) review any decisions or actions made or taken by any Committee in connection with any award or the operation, administration or interpretation of the 2012 MIP; and (v) otherwise amend an award in whole or in part from time-to-time as the Committee determines to be necessary or appropriate to conform such award to, or as required to satisfy, any legal requirement (including without limitation the provisions of Section 162(m) or Section 409A of the Internal Revenue Code), which amendment may be made retroactively or prospectively. In addition, the chief executive officer has full authority to select the employees who are not Covered Employees (as defined below) or other key executives of the Company or its subsidiaries who will participate in the 2012 MIP.
Eligibility. All employees of the Company or its subsidiaries who hold a position of responsibility participate in the 2012 MIP. Thus, all employees considered executive officers under the Exchange Act (a “Covered Employee”), which would include our named executive officers, will generally be included in the 2012 MIP.
Application of Section 162(m) of the Internal Revenue Code. As described above with respect to any performance-based awards granted pursuant to the 2012 Equity Incentive Plan, the Company intends to operate the 2012 MIP in compliance with the transitional rule provided under Section 162(m) of the Internal Revenue Code and intends to seek stockholder approval of the 2012 MIP prior to the annual meeting of our stockholders in 2015 (or earlier as may be required in certain circumstances as provided under Section 162(m) of the Internal Revenue Code).
Performance cycle. The performance cycle within which performance goals must be satisfied may be one or two calendar quarters or one year, or a combination thereof.
Performance objectives. Performance objectives under the 2012 MIP are performance goals (“Performance Objectives”) expressed in terms of (i) revenue, (ii) earnings per share, (iii) net income per share, (iv) share price, (v) pre-tax profits, (vi) net earnings, (vii) net income, (viii) operating income, (ix) cash flow, (x) earnings before interest, taxes, depreciation and amortization (EBITDA), (xi) sales, (xii) total stockholder return relative to assets, (xiii) total stockholder return relative to peers, (xiv) financial returns (including, without limitation, return on assets, return on equity, return on investment and return on capital employed), (xv) cost reduction targets, (xvi) customer satisfaction, (xvii) customer growth, (xviii) employee satisfaction,
186
Table of Contents
(xix) productivity measures, (xx) efficiency measures, (xxi) cost reductions, (xxii) any combination of the foregoing, or (xxiii) prior to the end of the transition period under Section 162(m) of the Internal Revenue Code, as described above, such other criteria as the Committee may determine. Performance objectives may be in respect of the performance of the Company, any of its subsidiaries, any of its “divisions” or any combination thereof. For this purpose, a division includes the unincorporated operating units, business units, segments or divisions of the Company designated as a division by the Committee. Performance objectives may be absolute or relative (to prior performance of the Company or to the performance of one or more other entities or external indices) and may be expressed in terms of a progression within a specified range.
Setting bonus benchmarks. The Committee will determine the length of the applicable performance cycle, make awards to Covered Employees selected by it and establish for Covered Employees the performance objectives on which the award is based, which may include any one or more individual performance Objectives; business unit, business segment, Division, profit center or product line Performance Objectives; Company-wide Performance Objectives; or any combination thereof, and may be measured either quarterly, semi-annually or annually, on an absolute basis or relative to a pre-established target, in each case as specified by the Committee, and may also establish threshold, target and/or maximum payout levels or percentages, for awards under the 2012 MIP. The Company will notify each participant (including any participants who are not Covered Employees) with respect to that performance cycle of his or her individual threshold, target and/or maximum payout level or percentage, as applicable, and the applicable Performance Objectives for the performance cycle. Such determinations will be established in writing by the Committee by the earlier of the date on which a quarter of a performance cycle has elapsed or ninety (90) days after the commencement of the performance cycle, and in any event while the performance relating to the performance goals remains substantially uncertain and will be communicated to the participants. The Committee may change the performance objectives and performance periods for each subsequent performance cycle.
Determination of award and adjustments. After the end of each performance cycle, the Committee will determine the extent to which the Performance Objectives for that performance cycle have been met. Based on this determination, the Committee will also determine the individual awards for the Covered Employees and the chief executive officer will determine the individual Awards for all employees who are not Covered Employees. At the time of the granting of an award, or at any time thereafter, subject to certain restrictions, the Committee may provide for the manner in which performance will be measured against the performance goals (or may adjust the performance goals) to reflect losses from discontinued operations, extraordinary, unusual or nonrecurring gains and losses, the cumulative effect of accounting changes, acquisitions or divestitures, core process redesign, structural changes/outsourcing, foreign exchange impacts, the impact of specified corporate transactions, accounting or tax law changes and other extraordinary or nonrecurring events. The Performance Objectives for any participant who is a Covered Employee with respect to the performance cycle in question may be reduced (but not increased) by the Committee in its sole discretion. For a participant who is not a Covered Employee, the chief executive officer may adjust the award upwards or downwards to reflect any material change in circumstances during the performance cycle.
Time of payment. Each award made under the 2012 MIP will be paid in a single lump sum as soon as practicable after the close of the applicable performance cycle, but in no event later than 2 1/2 months following the performance cycle for which the award was granted. The Committee,
187
Table of Contents
in its sole discretion, may permit a participant to defer payment of his award under the Aleris International, Inc. Deferred Compensation and Retirement Benefit Restoration Plan, as such plan may be modified from time to time, or any other plan applicable to the participant and in accordance with Section 409A of the Internal Revenue Code.
Maximum awards. The maximum award amount payable to any participant with respect to any calendar year will not exceed 300% of such participant’s base salary for such calendar year and 75% of such participant’s base salary for such calendar quarter. In addition, a total award amount under the 2012 MIP to a participant for any calendar year may not exceed $3,000,000, or $750,000 for a calendar quarter.
Certification. Prior to the payment of any award to a Covered Employee, including named executive officers, the Committee must certify in writing that the applicable performance goal has been satisfied and the amount of such bonus earned.
Employment requirement. No participant has any right to a bonus until the date such bonus is paid. As a condition to receiving payment of a bonus, a participant must be employed by or actively engaged in providing services to the Company on the date such bonus is paid.
Death, disability and retirement. In the case of disability or retirement, the participant, or, in the case of death, a participant’s beneficiaries, will be eligible for an award (or portion thereof) for the performance cycle in which the disability, retirement or death occurs, only if and to the extent the performance objectives have been met in accordance with the 2012 MIP. In this event, the award will be prorated for the portion of the performance cycle the participant was employed, determined at the end of the performance cycle based on actual performance.
Change of Control. In the event of a Change of Control, all awards for the performance cycle in which the Change of Control occurred, and or any prior performance cycle for which awards have not been paid, will be calculated on the basis of the applicable Performance Objectives, after giving effect to any weighting and other criteria in effect prior to the Change of Control. In addition, the Committee may, without approval of the participant, take additional actions with respect to awards including to accelerate the applicable payment date, to adjust awards downwards or upwards (for any participant who is not a Covered Employee), to determine that an award should not be paid, or to make any other adjustments that the Committee determines appropriate to reflect the Change of Control.
Amendment or discontinuance. The Board of Directors, upon recommendation from the Committee, may at any time and from time to time, without the consent of the participants, alter, amend, revise, suspend or discontinue the 2012 MIP in whole or in part; provided that any amendment that modifies any preestablished Performance objectives for a participant who is a Covered Employee (or his or her successor(s), as may be applicable) under this 2012 MIP with respect to any particular performance cycle may only be effected on or prior to the last day allowed under the terms of the 2012 MIP for the establishment of an award by the Committee for such performance cycle. In addition, the Board of Directors will have the power to amend the 2012 MIP in any manner advisable in order for awards granted under the 2012 MIP to qualify as “performance-based compensation” under Section 162(m) of the Internal Revenue Code (including amendments as a result of changes to Section 162(m) of the Internal Revenue Code or the regulations thereunder to permit greater flexibility with respect to awards granted under the 2012 MIP).
188
Table of Contents
Principal and selling stockholders
The following table sets forth information as to the beneficial ownership of our common stock as of February 2, 2012 and after giving effect to the sale of the common stock offered hereby, by (1) the selling stockholders assuming no exercise by the underwriters of their option to purchase shares to cover overallotments; (2) each person or group who is known to us to own beneficially more than 5% of the outstanding shares of our common stock; (3) each director and named executive officer; and (4) all directors and executive officers as a group. The number of shares beneficially owned after this offering included in the table below reflects the for 1 stock split that we will effectuate prior to the consummation of this offering.
Percentage of class beneficially owned is based on 31,029,477 shares of common stock outstanding as of February 2, 2012, together with the applicable options to purchase shares of common stock for each stockholder exercisable on February 2, 2012 or within 60 days thereafter. Shares of common stock issuable upon the exercise of options currently exercisable or exercisable 60 days after February 2, 2012 are deemed outstanding for computing the percentage ownership of the person holding the options, but are not deemed outstanding for computing the percentage of any other person. The amounts and percentages of common stock beneficially owned are reported on the basis of regulations of the SEC governing the determination of beneficial ownership of securities. Under the rules of the SEC, a person is deemed to be a “beneficial owner” of a security if that person has or shares “voting power,” which includes the power to vote or to direct the voting of such security, or “investment power,” which includes the power to dispose of or to direct the disposition of such security. A person is also deemed to be a beneficial owner of any securities of which that person has a right to acquire beneficial ownership within 60 days. Under these rules, more than one person may be deemed to be a beneficial owner of such securities as to which such person has voting or investment power. Except as described in the footnotes below, to our knowledge, each of the persons named in the table below have sole voting and investment power with respect to the shares of common stock beneficially owned, subject to community property laws where applicable.
189
Table of Contents
The selling stockholders are parties to the Stockholders Agreement and the Registration Rights Agreement, as described under “Certain Relationships and Related Party Transactions.” In addition, the selling stockholders hold shares of Aleris International’s redeemable preferred stock and 6% senior subordinated exchangeable notes issued in connection with Aleris International’s emergence from bankruptcy, which are exchangeable for shares of Aleris Corporation common stock under certain circumstances. See “Our reorganization,” “Description of indebtedness—6% senior subordinated exchangeable notes” and “Description of capital stock—Options and exchangeable securities.” The shares reported as beneficially owned prior to this offering in the table below do not reflect the number of shares of common stock issuable upon an exchange of the redeemable preferred stock or the 6% senior subordinated exchangeable notes.
| Shares beneficially owned prior to this offering |
Shares being offered |
Shares beneficially owned after this offering(1) | ||||||||||||
| Name and address of owner(2) | Number of shares beneficially owned(3) |
Percentage owned |
Number of shares being offered |
Number of shares beneficially owned(3) |
Percentage owned | |||||||||
|
| ||||||||||||||
| Oaktree Funds(4) |
17,951,584 | 56.36% | ||||||||||||
| Apollo Funds(5) |
5,490,108 | 17.24% | ||||||||||||
| Sankaty Funds(6) |
3,036,290 | 9.53% | ||||||||||||
| Steven J. Demetriou |
357,959 | 1.14% | ||||||||||||
| Sean M. Stack |
115,733 | * | ||||||||||||
| Roelof IJ. Baan |
117,645 | * | ||||||||||||
| Christopher R. Clegg |
73,686 | * | ||||||||||||
| K. Alan Dick |
73,686 | * | ||||||||||||
| Thomas W. Weidenkopf |
72,874 | * | ||||||||||||
| G. Richard Wagoner, Jr.(7) |
7,500 | * | ||||||||||||
| Christopher M. Crane |
7,446 | * | ||||||||||||
| Lawrence Stranghoener |
6,018 | * | ||||||||||||
| Scott Graves(8) |
— | * | ||||||||||||
| Brian Laibow(8) |
— | * | ||||||||||||
| Robert O’Leary(8) |
— | * | ||||||||||||
| Kenneth Liang(8) |
— | * | ||||||||||||
| Emily Alexander(8) |
— | * | ||||||||||||
| All executive officers and directors as a group (16 persons) |
896,866 | 2.87% | ||||||||||||
|
| ||||||||||||||
| * | Less than 1%. |
| (1) | Reflects the for 1 stock split that we will effectuate prior to the consummation of this offering. |
| (2) | Unless otherwise indicated, the address of each person listed is c/o Aleris Corporation, 25825 Science Park Drive, Suite 400, Cleveland, Ohio 44122-7392. |
| (3) | In accordance with the rules of the SEC described above, the beneficial ownership amounts for the Oaktree Funds, as part of the holdings of OCM FIE, LLC, includes 41,515 are held by OCM FIE, LLC (35,554 of which may be acquired upon exercise of options and 711 of which would be issued on settlement of vesting RSUs, including vested stock options assigned to OCM FIE, LLC (see Note (4) below); the beneficial ownership amounts for Messrs. Demetriou, Stack, Baan, Clegg, Dick, Weidenkopf, Crane and Stranghoener include 305,106 shares, 97,146 shares, 108,737 shares, 67,975 shares, 67,975 shares, 67,975 shares, 6,509 shares and 5,268 shares, respectively, that may be acquired upon the exercise of vested options and options and RSUs vesting within 60 days of February 2, 2012; and the beneficial ownership amount for Mr. Wagoner includes 0 shares of restricted stock subject to vesting (see also Note (7) below). Certain of the Oaktree Funds’ affiliates also hold shares of Aleris International’s redeemable preferred stock and 6% senior subordinated exchangeable notes (see Note (4) below). Each of Aleris International’s redeemable preferred stock and 6% senior subordinated exchangeable notes are exchangeable for shares of Aleris Corporation’s common stock under certain circumstances as described under “Description of capital stock—Options and exchangeable securities.” The shares reported as beneficially owned prior to this offering in the above table do not reflect the number of shares of common stock issuable to the Oaktree Funds upon exchange of the redeemable preferred stock or the 6% senior subordinated exchangeable notes. |
190
Table of Contents
| (4) | Represents all equity interests owned by OCM Opportunities ALS Holdings, L.P., OCM High Yield Plus ALS Holdings, L.P., Oaktree European Credit Opportunities Holdings, Ltd., Oaktree European Credit Opportunities II, Ltd., and OCM FIE, LLC. Of the shares included, 16,655,270 are held by OCM Opportunities ALS Holdings, L.P.; 987,603 are held by OCM High Yield Plus ALS Holdings, L.P.; 195,924 are held by Oaktree European Credit Opportunities Holdings, Ltd.; 71,272 are held by Oaktree European Credit Opportunities II, Ltd.; and 41,515 are held by OCM FIE, LLC (35,554 of which may be acquired upon exercise of options and 711 of which would be issued on settlement of vesting RSUs, including vested stock options assigned to OCM FIE, LLC by Mr. Ara Abrahamian, who previously was a director and resigned from that position, effective as of December 7, 2011, see Note (8) below). Mr. Abrahamian is an officer of Oaktree. As part of his employment with Oaktree and pursuant to the policies of Oaktree, Mr. Abrahamian must hold his vested option on behalf of and for the sole benefit of FIE and has assigned all economic, pecuniary and voting rights to FIE. Mr. Abrahamian disclaims beneficial ownership of these securities, except to the extent of any indirect pecuniary interest therein. The mailing address for the owners listed above is 333 S. Grand Avenue, 28th Floor, Los Angeles, CA 90071. |
Oaktree European Credit Opportunities Holdings, Ltd. also holds 51.5 shares of Aleris International’s redeemable preferred stock and $418,856 aggregate principal amount of Aleris International’s 6% senior subordinated exchangeable notes. OCM High Yield Plus ALS Holdings, L.P. also holds 188 shares of Aleris International’s redeemable preferred stock and $1,535,922 aggregate principal amount of Aleris International’s 6% senior subordinated exchangeable notes. OCM Opportunities ALS Holdings, L.P. also holds 3,176 shares of Aleris International’s redeemable preferred stock and $25,946,763.42 aggregate principal amount of Aleris International’s 6% senior subordinated exchangeable notes. Each of Aleris International’s redeemable preferred stock and 6% senior subordinated exchangeable notes are exchangeable for shares of Aleris Corporation common stock under certain circumstances as described in Note 3, “Reorganization under Chapter 11,” of the audited Consolidated Financial Statements included in this prospectus. The shares reported as beneficially owned in the above table do not reflect the number of shares of common stock issuable to the Oaktree Funds upon exchange of the redeemable preferred stock or Aleris International’s 6% senior subordinated exchangeable notes.
| The | general partner of OCM Opportunities ALS Holdings, L.P. is Oaktree Fund GP, LLC. The managing member of Oaktree Fund GP, LLC is Oaktree Fund GP I, L.P. The general partner of Oaktree Fund GP I, L.P. is Oaktree Capital I, L.P. The general partner of Oaktree Capital I, L.P. is OCM Holdings I, LLC. The managing member of OCM Holdings I, LLC is Oaktree Holdings, LLC. The managing member of Oaktree Holdings, LLC is Oaktree Capital Group, LLC. The holder of a majority of the voting units of Oaktree Capital Group, LLC is Oaktree Capital Group Holdings, L.P. The general partner of Oaktree Capital Group Holdings, L.P. is Oaktree Capital Group Holdings GP, LLC. The members of Oaktree Capital Group Holdings GP, LLC are Kevin Clayton, John Frank, Stephen Kaplan, Bruce Karsh, Larry Keele, David Kirchheimer, Howard Marks and Sheldon Stone. Each of the general partners, managing members, unit holders and members described above disclaims beneficial ownership of any shares of common stock beneficially or of record owned by OCM Opportunities ALS Holdings, L.P., except to the extent of any pecuniary interest therein. The address for all of the entities and individuals identified above is 333 S. Grand Avenue, 28th Floor, Los Angeles, CA 90071. |
| The | general partner of OCM High Yield Plus ALS Holdings, L.P. is Oaktree Fund GP IIA, LLC. The managing member of Oaktree Fund GP IIA, LLC is Oaktree Fund GP II, L.P. The general partner of Oaktree Fund GP II, L.P. is Oaktree Capital II, L.P. The general partner of Oaktree Capital II, L.P. is Oaktree Holdings, Inc. The sole shareholder of Oaktree Holdings, Inc. is Oaktree Capital Group, LLC. The holder of a majority of the voting units of Oaktree Capital Group, LLC is Oaktree Capital Group Holdings, L.P. The general partner of Oaktree Capital Group Holdings, L.P. is Oaktree Capital Group Holdings GP, LLC. The members of Oaktree Capital Group Holdings GP, LLC are Kevin Clayton, John Frank, Stephen Kaplan, Bruce Karsh, Larry Keele, David Kirchheimer, Howard Marks and Sheldon Stone. Each of the general partners, managing members, shareholders, unit holders and members described above disclaims beneficial ownership of any shares of common stock beneficially or of record owned by OCM High Yield Plus ALS Holdings, L.P., except to the extent of any pecuniary interest therein. The address for all of the entities and individuals identified above is 333 S. Grand Avenue, 28th Floor, Los Angeles, CA 90071. |
| The | director of Oaktree European Credit Opportunities Holdings, Ltd. is Oaktree Europe GP, Ltd. Oaktree Europe GP, Ltd. is also the general partner of Oaktree Capital Management (UK) LLP, which is the portfolio manager to Oaktree European Credit Opportunities II, Ltd. The sole shareholder of Oaktree Europe GP, Ltd. is Oaktree Capital Management (Cayman), L.P. The general partner of Oaktree Capital Management (Cayman), L.P. is Oaktree Holdings, Ltd. The sole shareholder of Oaktree Holdings, Ltd. is Oaktree Capital Group, LLC. The holder of a majority of the voting units of Oaktree Capital Group, LLC is Oaktree Capital Group Holdings, L.P. The general partner of Oaktree Capital Group Holdings, L.P. is Oaktree Capital Group Holdings GP, LLC. The members of Oaktree Capital Group Holdings GP, LLC are Kevin Clayton, John Frank, Stephen Kaplan, Bruce Karsh, Larry Keele, David Kirchheimer, Howard Marks and Sheldon Stone. Each of the directors, general partners, managers, shareholders, unit holders and members described above disclaims beneficial ownership of any shares of common stock beneficially or of record owned by each of Oaktree European Credit Opportunities Holdings, Ltd. or Oaktree European Credit Opportunities II, Ltd., except to the extent of any pecuniary interest therein. The address for Oaktree Capital Management (UK) LLP is 27 Knightsbridge, 4th Floor, London SW1X 7LY, United Kingdom, and the address for all other entities and individuals identified above is 333 S. Grand Avenue, 28th Floor, Los Angeles, CA 90071. |
| The | managing member of OCM FIE, LLC is Oaktree Capital Management, L.P. The general partner of Oaktree Capital Management, L.P. is Oaktree Holdings, Inc. The sole shareholder of Oaktree Holdings, Inc. is Oaktree Capital Group, LLC. The holder of a majority of the voting units of Oaktree Capital Group, LLC is Oaktree Capital Group Holdings, L.P. The general partner of Oaktree Capital Group Holdings, L.P. is Oaktree Capital Group Holdings GP, LLC. The members of Oaktree Capital Group Holdings GP, LLC are Kevin Clayton, John Frank, Stephen Kaplan, Bruce Karsh, Larry Keele, David Kirchheimer, Howard Marks and Sheldon Stone. Each of the managing members, general partners, shareholders, unit holders and members described above disclaims beneficial ownership of any shares of common stock beneficially or of record owned by OCM FIE, LLC, except to the extent of any pecuniary interest therein. The address for all of the entities and individuals identified above is 333 S. Grand Avenue, 28th Floor, Los Angeles, CA 90071. |
191
Table of Contents
| (5) | Represents 5,490,108 shares of common stock held of record by Apollo ALS Holdings II, L.P. (“Apollo ALS Holdings”). The shares reported as beneficially owned in the above table do not include the number of shares of common stock issuable upon exchange of (i) the 1,047 shares of Aleris International’s redeemable preferred stock that are held by Apollo ALS Holdings, or (ii) the $8,552,899 of Aleris International’s 6% senior subordinated exchangeable notes that are held by Apollo ALS Holdings. |
| The | general partner of Apollo ALS Holdings is Apollo ALS Holdings II GP, LLC (“Apollo ALS Holdings GP”). The managers of Apollo ALS Holdings GP are Apollo Management VI, L.P. (“Management VI”), Apollo Management VII, L.P. (“Management VII”) and Apollo Credit Opportunity Management, LLC (“ACO Management”). AIF VI Management, LLC (“AIF VI Management”) is the general partner of Management VI, and AIF VII Management, LLC (“AIF VII Management”) is the general partner of Management VII. Apollo Management, L.P. (“Apollo Management”) is the sole member and manager of each of AIF VI Management and AIF VII Management. Apollo Management GP, LLC (“Management GP”) is the general partner of Apollo Management. Apollo Capital Management, L.P. (“Capital Management”) is the sole member and manager of ACO Management, and Apollo Capital Management GP, LLC (“Capital Management GP”) is the general partner of Capital Management. Apollo Management Holdings, L.P. (“Management Holdings”) is the sole member and manager of Management GP and of Capital Management GP. Apollo Management Holdings GP, LLC (“Management Holdings GP”) is the general partner of Management Holdings. Leon Black, Joshua Harris and Marc Rowan are the managers, as well as principal executive officers, of Management Holdings GP, and as such indirectly control voting and disposition of the shares of common stock held by Apollo ALS Holdings. The address of Apollo ALS Holdings and Apollo ALS Holdings GP is One Manhattanville Road, Suite 201, Purchase, New York 10577. The address of each of Management VI, Management VII, ACO Management, AIF VI Management, AIF VII Management, Apollo Management, Management GP, Capital Management, Capital Management GP, Management Holdings and Management Holdings GP, and Messrs. Black, Harris and Rowan, is 9 West 57th Street, 43rd Floor, New York, New York 10019. |
| (6) | Represents all equity interests of 111 Capital, L.P., Castle Hill III CLO, Ltd., Loan Funding XI, LLC, Nash Point CLO, Prospect Harbor Credit Partners, L.P., Race Point II CLO, Limited, Race Point III CLO, Race Point IV CLO, Ltd., Sankaty Credit Opportunities (Offshore Master) IV, L.P., Sankaty Credit Opportunities II L.P., Sankaty Credit Opportunities III, L.P., Sankaty Credit Opportunities IV, L.P., Sankaty High Yield Partners III, L.P., Sankaty Special Situations I, L.P., Sankaty Credit Opportunities, L.P., Sankaty High Yield Partners II, L.P., SR Group, LLC, SSS Funding II, LLC (collectively, the “Sankaty Funds”). The mailing address of the Sankaty Funds is c/o Sankaty Advisors, LLC, John Hancock Tower, 200 Clarendon Street, Boston, MA, 02116. |
| In | addition, investment funds (the “Sankaty Funds”), managed or advised by Sankaty Advisors, LLC, a Delaware limited liability company (“Sankaty Advisors”), hold in the aggregate, 537.5 shares of Aleris International’s redeemable preferred stock and $4,392.86 aggregate principal amount of Aleris International’s 6% senior subordinated exchangeable notes, each of which are based on June 1, 2011 accruals, and are exchangeable for shares of Aleris Corporation common stock under certain circumstances as described in Note 3, “Reorganization under Chapter 11,” of the audited Consolidated Financial Statements included in this prospectus. The shares reported as beneficially owned in the above table do not reflect the number of shares of common stock issuable to the Sankaty Funds upon exchange of the redeemable preferred stock or Aleris International’s 6% senior subordinated exchangeable notes. |
| Sankaty | Advisors, is the collateral manager to Castle Hill III CLO, Limited, a Delaware limited liability company (“CH III”), Chatham Light CLO, Limited, a Cayman Islands exempted company (“CL”), Nash Point, CLO, an Irish public unlimited company (“NP”), Race Point II CLO, Limited, a Cayman Islands exempted company (“RP II), Race Point III CLO, an Irish public unlimited company (“RP III”), and Race Point IV CLO, Limited, a Cayman Islands exempted company (“RP IV”). Mr. Lavine is the manager of Sankaty Advisors. By virtue of these relationships, Mr. Lavine may be deemed to have voting and dispositive power with respect to the shares of common and preferred stock held by each of CH III, CL, NP, RP II, RP III, and RP IV. Mr. Lavine and Sankaty Advisors disclaims beneficial ownership of such securities except to the extent of its pecuniary interest therein. |
| 111 | Capital Investors, LLC, a Delaware limited liability company (“111 Capital Investors”), is the general partner of 111. Sankaty Credit Opportunities Investors, LLC, a Delaware limited liability company (“SCOI”), is the sole general partner of Sankaty Credit Opportunities, L.P., a Delaware limited partnership (“COPs”). Sankaty Credit Opportunities Investors II, LLC, a Delaware limited liability company (“SCOI II”), is the sole general partner of Sankaty Credit Opportunities II, L.P., a Delaware limited partnership (“COPs II”). Sankaty Credit Opportunities Investors III, LLC, a Delaware limited liability company (“SCOI III”), is the sole general partner of Sankaty Credit Opportunities III, L.P., a Delaware limited partnership (“COPs III”). Sankaty Credit Opportunities Investors IV, LLC, a Delaware limited liability company (“SCOI IV”), is the sole general partner of Sankaty Credit Opportunities IV, L.P., a Delaware limited partnership (“COPs IV”). Prospect Harbor Investors, LLC, a Delaware limited liability company (“PHI”), is the sole general partner of Prospect Harbor Credit Partners, L.P., a Delaware limited partnership (“PRO”), which is the sole member of Prospect Funding I, LLC. Sankaty Special Situations Investors I, LLC, a Delaware limited liability company (“SSS I Investors”), is the general partner of Sankaty Special Situations I, L.P., a Delaware limited partnership (“SSS I”), which is the sole member of SSS Funding II, LLC (“SSSF II”). Sankaty Credit Member, LLC, a Delaware limited liability company (“SCM”), is the managing member of 111 Capital Investors, SCOI, SCOI II, SCOI III, SCOI IV, PHI and SSS I Investors. Mr. Lavine is the managing member of SCM. By virtue of these relationships, Mr. Lavine may be deemed to share voting and dispositive power with respect to the shares of common and preferred stock held by 111, COPs, COPs II, COPs III, COPs IV, Prospect Harbor, PFI, SSS and SSSF II. Mr. Lavine and each of the entities noted above disclaims beneficial ownership of such securities except to the extent of its pecuniary interest therein. |
| Sankaty | Credit Opportunities Investors (Offshore) IV, L.P., a Cayman Islands exempted limited partnership (“SCOIO IV”), is the sole general partner of Sankaty Credit Opportunities (Offshore) IV, L.P., a Cayman Islands exempted limited partnership (“COPs IV Offshore”). Sankaty Credit Member (Offshore), Ltd., a Cayman Islands exempted limited partnership (“SCMO”) is the sole general partner of SCOIO IV. Mr. Lavine is the sole director of SCMO. By virtue of these relationships, Mr. Lavine may be deemed to share voting and dispositive power with respect to the shares of common and preferred stock held by COPs IV Offshore. Mr. Lavine and each of the entities noted above disclaims beneficial ownership of such securities except to the extent of its pecuniary interest therein. |
192
Table of Contents
| Sankaty | High Yield Asset Investors II, LLC, a Delaware limited liability company (“SHYA II”), is the general partner of Sankaty High Yield Partners II, LLC, a Delaware limited liability company (“Sankaty II”). Sankaty Investors II, LLC, a Delaware limited liability company (“SI II”), is the managing member of SHYA II. Mr. Lavine is the managing member of SI II. By virtue of these relationships, Mr. Lavine may be deemed to share voting and dispositive power with respect to the shares of common and preferred stock held by Sankaty II. Mr. Lavine and each of the entities noted above disclaims beneficial ownership of such securities except to the extent of its pecuniary interest therein. |
| Sankaty | High Yield Asset Investors III, LLC, a Delaware limited liability company (“SHYA III”), is the general partner of Sankaty High Yield Partners III, LLC, a Delaware limited liability company (“Sankaty III”). Sankaty Investors III, LLC, a Delaware limited liability company (“SI III”), is the managing member of SHYA III. Mr. Lavine is the managing member of SI III. By virtue of these relationships, Mr. Lavine may be deemed to share voting and dispositive power with respect to the shares of common and preferred stock held by Sankaty III. Mr. Lavine and each of the entities noted above disclaims beneficial ownership of such securities except to the extent of its pecuniary interest therein. |
| Sankaty | Advisors is the sole member of SR Group, LLC, a Delaware limited liability company (“SR”). Mr. Lavine as the manager of Sankaty Advisors may be deemed to share voting and dispositive power with respect to the shares of common and preferred stock held by SR. Mr. Lavine and Sankaty Advisors disclaim beneficial ownership of such securities except to the extent of its pecuniary interest therein. |
| The | business address of each of the entities above is c/o Sankaty Advisors, LLC, John Hancock Tower, 200 Clarendon Street, Boston, MA, 02116. |
| (7) | Mr. Wagoner was granted 20,000 shares of restricted stock on July 30, 2010, pursuant to which Mr. Wagoner has voting rights as a stockholder only to the extent that shares have vested. As of February 2, 2012 and within 60 days thereafter, Mr. Wagoner will have become vested in 7,500 shares and will have voting rights therein. |
| (8) | Each of Ms. Emily Alexander and Messrs. Scott Graves, Brian Laibow, Kenneth Liang, and Robert O’Leary, by virtue of being an authorized officer of Oaktree Fund GP I, L.P., Oaktree Fund GP II, L.P., Oaktree Capital Management, L.P., and, in the case of Ms. Alexander only, Oaktree Capital Management (Cayman), L.P., may be deemed to have or share beneficial ownership of shares beneficially owned by the Oaktree Funds. Each of Ms. Alexander, Mr. Graves, Mr. Laibow, Mr. Liang, and Mr. O’Leary expressly disclaims beneficial ownership of such shares, except to the extent of his or her direct pecuniary interest therein. See Note (4) above. |
| With | respect to the less than 1% of shares held directly by each of Ms. Alexander, Mr. Graves, Mr. Laibow, Mr. Liang and Mr. O’Leary, these shares are held for the benefit of OCM FIE, LLC (“FIE”), a wholly owned subsidiary of Oaktree. Each of Ms. Alexander, Mr. Graves, Mr. Laibow, Mr. Liang and Mr. O’Leary are officers of one or more Oaktree entities. As part of his or her employment with Oaktree and pursuant to the policies of Oaktree Capital Management, L.P., each of Ms. Alexander, Mr. Graves, Mr. Laibow, Mr. Liang and Mr. O’Leary must hold these shares on behalf of and for the sole benefit of FIE and has assigned all economic, pecuniary and voting rights to FIE. Each of Ms. Alexander, Mr. Graves, Mr. Laibow, Mr. Liang and Mr. O’Leary disclaims beneficial ownership of these securities, except to the extent of any indirect pecuniary interest therein. |
193
Table of Contents
Certain relationships and related party transactions
Stockholders agreement
In connection with Aleris International’s emergence from bankruptcy, the Company entered into a stockholders agreement with the Investors and each other holder of the Company’s common stock (together with the Investors, the “Stockholders”) that provides for, among other things,
| • | a right of the Oaktree Funds to designate a certain number of directors to our board of directors; |
| • | certain limitations on the transfer of the Company’s common stock, including limitations on transfers to competitors or affiliates of competitors of Aleris; |
| • | information rights for the Investors with respect to financial statements of the Company and its subsidiaries; |
| • | the ability of a Stockholder to “tag-along” their shares of the Company’s common stock to sales by the Oaktree Funds or under certain limited circumstances the Apollo Funds to a non-affiliated third party entity, and the ability of Stockholders to “drag-along” the Company’s common stock held by the other Stockholders under certain circumstances; and |
| • | the right of certain Stockholders to purchase a pro rata portion of new securities offered by the Company in certain circumstances. |
The Stockholders Agreement will terminate upon the consummation of this offering.
Registration rights agreement
On June 1, 2010, the Company entered into a registration rights agreement with the Oaktree Funds, the Apollo Funds and holders of at least 5% of the Company’s outstanding common stock pursuant to which the Investors and other 10% Stockholders have certain demand registration rights with respect to the Company’s common stock. Under this agreement, the Company agreed to assume the fees and expenses (other than underwriting discounts and commissions) associated with registration. The registration rights agreement also contains customary provisions with respect to registration proceedings, underwritten offerings and indemnity and contribution rights. There are no cash penalties under the Registration Rights Agreement. For additional information, see “Description of capital stock—Registration rights agreement.”
Loans to certain executive officers
The Company entered into a loan agreement with Mr. Demetriou, the Company’s Chairman and Chief Executive Officer on each of September 1, 2010 and December 1, 2010 with respect to loans in the principal amounts of $79,761.99 and $88,946.32, respectively, and a loan agreement with Mr. Stack, the Company’s Executive Vice-President and Chief Financial Officer, on each of September 1, 2010 and December 1, 2010 with respect to loans in the principal amounts of $25,400.21 and $28,319.39, respectively. Each of these loans was made with approval of the Board of Directors of Aleris Corporation pursuant to the terms of the executive’s award agreement with respect to RSUs granted under the 2010 Equity Plan (the “RSU Award Agreement”), after a request for such loan from Mr. Demetriou and Mr. Stack, as applicable. Under the terms of their respective RSU Award Agreements, prior to March 1, 2011, each of
194
Table of Contents
Mr. Demetriou and Mr. Stack had the right to request a loan from the Company quarterly in order to cover the amount of withholding tax that became due in connection with the vesting and settlement of RSUs that quarter. Each loan was in the form of a revolving three-year full recourse, but unsecured loan at the interest rate of 3.95%. Mr. Demetriou has repaid both loans in full, paying an aggregate of $168,708.31 in principal and $2,638.74 in interest. Mr. Stack also has repaid both loans in full, paying $53,719.60 in principal and $828.46 in interest. RSU Award Agreements for Mr. Demetriou and Mr. Stack have each been amended to eliminate future loans. For more information on the underlying RSU awards, see “Compensation discussion and analysis—Elements of compensation.”
195
Table of Contents
ABL Facility
In connection with Aleris International’s emergence from bankruptcy, Aleris International entered into the ABL Facility, an asset backed multi-currency revolving credit facility. On June 30, 2011 Aleris International amended and restated the ABL Facility. The new ABL Facility is a $600.0 million revolving credit facility which permits multi-currency borrowings up to $600.0 million by our U.S. subsidiaries, up to $240.0 million by Aleris Switzerland GmbH (a wholly owned Swiss subsidiary), and $15.0 million by Aleris Specification Alloy Products Canada Company (a wholly owned Canadian subsidiary). Aleris International and certain of its U.S. and international subsidiaries are borrowers under the ABL Facility. The availability of funds to the borrowers located in each jurisdiction is subject to a borrowing base for that jurisdiction and the jurisdictions in which certain subsidiaries of such borrowers are located, calculated on the basis of a predetermined percentage of the value of selected accounts receivable and U.S., Canadian and certain European inventory, less certain ineligible accounts receivable and inventory. The level of our borrowing base and availability under the ABL Facility fluctuates with the underlying LME price of aluminum which impacts both accounts receivable and inventory values included in our borrowing base. Non-U.S. borrowers also have the ability to borrow under the ABL Facility based on excess availability under the borrowing base applicable to the U.S. borrowers, subject to certain sublimits. The ABL Facility provides for the issuance of up to $75.0 million of letters of credit as well as borrowings on same-day notice, referred to as swingline loans, that are available in U.S. dollars, Canadian dollars, Euros and certain other currencies. As of December 31, 2011, we estimate that our borrowing base would have supported borrowings in excess of $428.9 million. After giving effect to the outstanding letters of credit of $39.1 million, we had $389.8 million available for borrowing as of December 31, 2011.
Borrowings under the ABL Facility bear interest at a rate equal to the following, plus an applicable margin ranging from 0.75% to 2.50%:
| • | in the case of borrowings in U.S. dollars, a LIBOR Rate or a base rate determined by reference to the higher of (1) Bank of America’s prime lending rate, (2) the overnight federal funds rate plus 0.5% or (3) a Eurodollar rate determined by Bank of America plus 1.0%; |
| • | in the case of borrowings in Euros, a euro LIBOR rate determined by Bank of America; and |
| • | in the case of borrowings in Canadian dollars, a Canadian prime rate. |
As of December 31, 2011 and 2010, Aleris International had no amounts outstanding under the ABL Facility.
In addition to paying interest on any outstanding principal under the ABL Facility, we are required to pay a commitment fee in respect of unutilized commitments of 0.50% if the average utilization is less than 33% for any applicable period, 0.375% if the average utilization is between 33% and 67% for any applicable period, and 0.25% if the average utilization is greater than 67% for any applicable period. We must also pay customary letters of credit fees and agency fees.
The ABL Facility is subject to mandatory prepayment with (i) 100% of the net cash proceeds of certain asset sales, subject to certain reinvestment rights; (ii) 100% of the net cash proceeds from issuance of debt, other than debt permitted under the ABL Facility; and (iii) 100% of net cash proceeds from certain insurance and condemnation payments, subject to certain reinvestment rights.
196
Table of Contents
In addition, if at any time outstanding loans, unreimbursed letter of credit drawings and undrawn letters of credit under the ABL Facility exceed the applicable borrowing base in effect at such time, Aleris International is required to repay outstanding loans or cash collateralize letters of credit in an aggregate amount equal to such excess, with no reduction of the commitment amount. If the amount available under the ABL Facility is less than (x) $50.0 million and (y) 15.0% of the total commitments under the ABL Facility or an event of default is continuing, Aleris International is required to repay outstanding loans with the cash we are required to deposit in collection accounts maintained with the agent under the ABL Facility.
Aleris International may voluntarily reduce the unutilized portion of the commitment amount and repay outstanding loans at any time upon three business days prior written notice without premium or penalty other than customary “breakage” costs with respect to Eurodollar, euro LIBOR and EURIBOR loans.
There is no scheduled amortization under the ABL Facility. The principal amount outstanding will be due and payable in full at maturity on June 29, 2016, unless extended pursuant to the credit agreement.
The ABL Facility is secured, subject to certain exceptions (including appropriate limitations in light of U.S. federal income tax considerations on guaranties and pledges of assets by foreign subsidiaries, and certain pledges of such foreign subsidiaries’ stock, in each case to support loans to Aleris International or its domestic subsidiaries), by a first-priority security interest in substantially all of Aleris International’s current assets and related intangible assets located in the U.S., substantially all of the current assets and related intangible assets of substantially all of our wholly owned domestic subsidiaries located in the U.S., substantially all of the current assets and related intangible assets of the Canadian Borrower located in Canada and substantially all of the current assets (other than inventory located outside of the United Kingdom) and related intangibles of Aleris Recycling (Swansea) Ltd., of Aleris Switzerland GmbH and certain of its subsidiaries. The borrowers’ obligations under the ABL Facility are guaranteed by certain of our existing and future direct and indirect subsidiaries.
The ABL Facility contains a number of covenants that, among other things and subject to certain exceptions, restrict Aleris International’s ability and the ability of Aleris International’s subsidiaries to:
| • | incur additional indebtedness; |
| • | pay dividends on our common stock and make other restricted payments; |
| • | make investments and acquisitions; |
| • | engage in transactions with our affiliates; |
| • | sell assets; |
| • | merge; and |
| • | create liens. |
Although the credit agreement governing the ABL Facility generally does not require us to comply with any financial ratio maintenance covenants, if the amount available under the ABL Facility is less than the greater of (x) $45.0 million or (y) 12.5% of the lesser of (i) the total commitments or (ii) the borrowing base under the ABL Facility at any time, a minimum fixed charge coverage ratio (as defined in the credit agreement) of at least 1.0 to 1.0 will apply. The credit agreement also contains certain customary affirmative covenants and events of default. Aleris International was in compliance with all of the covenants set forth in the credit agreement as of December 31, 2011.
197
Table of Contents
6% Senior Subordinated Exchangeable Notes
On the Emergence Date, Aleris International issued $45.0 million aggregate principal amount of 6% senior subordinated exchangeable notes to the participants of the rights offering. The Exchangeable Notes are scheduled to mature on June 1, 2020. The Exchangeable Notes have exchange rights, at the holder’s option, after June 1, 2013, and are exchangeable for the Company’s common stock at a rate equivalent to 47.20 shares of the Company’s common stock per $1,000 principal amount of Exchangeable Notes (after adjustment for the payments of the 2011 Stockholder Dividends), subject to further adjustment. The Exchangeable Notes may be redeemed at Aleris International’s option at specified redemption prices on or after June 1, 2013 or upon a fundamental change of the Company. A fundamental change is the occurrence of (i) the acquisition of more than 50% of the total voting power of all shares of capital stock of the Company, other than an acquisition by Oaktree or Apollo or a group including either Oaktree or Apollo, (ii) consummation of any share exchange, consolidation or merger of the Company or any sale, lease or other transfer of all or substantially all of the consolidated assets of the Company and its subsidiaries, taken as a whole, to any person other than to the Company or one or more of its subsidiaries, Oaktree or Apollo or a group including either Oaktree or Apollo; provided, however, that the occurrence of any transaction where the holders of the Company’s voting capital stock immediately prior to such transaction have, directly or indirectly, more than 50% of the aggregate voting power of all shares of capital stock of the continuing or surviving corporation or transferee entitled to vote generally in the election of directors immediately after such an event shall not give rise to such redemption.
The Exchangeable Notes are unsecured, senior subordinated obligations of Aleris International and rank (i) junior to all of its existing and future senior indebtedness, including the ABL Facility; (ii) equally to all of its existing and future senior subordinated indebtedness; and (iii) senior to all of its existing and future subordinated indebtedness.
7 5/8% Senior Notes due 2018
On February 9, 2011, Aleris International issued $500.0 million of its Senior Notes under an indenture with U.S. Bank National Association, as trustee. The notes are unconditionally guaranteed on a senior unsecured basis by each of Aleris International’s restricted subsidiaries that is a domestic subsidiary and that guarantees Aleris International’s obligations under its ABL Facility. Interest on the Senior Notes is payable in cash semi-annually in arrears on February 15 and August 15 of each year. Interest on the Senior Notes will accrue from the most recent date to which interest has been paid. The Senior Notes mature on February 15, 2018. Aleris International used the net proceeds from the sale of the Senior Notes to pay cash dividends of approximately $300.0 million, $100.0 million and $100.0 million to the Company on February 28, 2011, June 30, 2011 and November 10, 2011, respectively, which were then paid as a dividend, pro rata, to the Company’s stockholders.
China Loan Facility
In March 2011, the China Joint Venture entered into the China Loan Facility, a non-recourse multi-currency secured revolving and term loan facility with the Bank of China Limited, Zhenjiang Jingkou Sub-Branch. The China Loan Facility originally consisted of a $100.0 million term loan, a RMB 532.0 million term loan (or equivalent to approximately $83.7 million) and a combined USD/RMB revolving credit facility up to an aggregate amount equivalent to $35.0 million. In December 2011, the agreement was subsequently amended and now consists of a $30.0 million
198
Table of Contents
term loan facility, a RMB 997.5 million term loan facility (or equivalent to approximately $157.0 million) and a RMB 232.8 million (or equivalent to approximately $36.6 million) revolving credit facility. The interest on the term USD facility is six month USD LIBOR plus 5.0% and the interest rate on the term RMB facility and the revolving credit facility is 110% of the base rate applicable to any loan denominated in RMB of the same tenor, as announced by the People’s Bank of China. As of December 31, 2011, $56.7 million was drawn under the term loan facility. Draws on the revolving facility begin in 2013. The final maturity date for all borrowings under the China Loan Facility is May 21, 2021. The China Joint Venture is an unrestricted subsidiary under the indenture governing the Senior Notes.
199
Table of Contents
The following is a description of the material terms of our amended and restated certificate of incorporation and amended and restated bylaws as each is anticipated to be in effect upon the consummation of this offering. We also refer you to our amended and restated certificate of incorporation and amended and restated bylaws, copies of which are filed as exhibits to the registration statement of which this prospectus forms a part.
Authorized capital
At the time of the consummation of this offering, our authorized capital stock will consist of:
| • | shares of common stock, par value $.01 per share, of which shares were issued and outstanding as of , 2012, and; |
| • | shares of preferred stock, of which no shares are issued and outstanding. |
As of March 1, 2012, there were 158 holders of record of our common stock. Immediately following the consummation of this offering, there are expected to be shares of common stock issued and outstanding and shares of preferred stock outstanding.
Common stock
Voting rights. Holders of common stock are entitled to one vote per share on all matters to be voted upon by the stockholders. The affirmative vote of a plurality of the shares of our common stock present, in person or by proxy, will decide the election of any directors. The holders of common stock do not have cumulative voting rights in the election of directors.
Dividend rights. Holders of common stock are entitled to receive ratably dividends if, as and when dividends are declared from time to time by our Board of Directors out of funds legally available for that purpose, after payment of dividends required to be paid on outstanding preferred stock, as described below, if any. Under Delaware law, we can only pay dividends either out of “surplus” or out of the current or the immediately preceding year’s net profits. Surplus is defined as the excess, if any, at any given time, of the total assets of a corporation over its total liabilities and statutory capital. The value of a corporation’s assets can be measured in a number of ways and may not necessarily equal their book value.
Liquidation rights. Upon liquidation, dissolution or winding up, the holders of common stock are entitled to receive ratably the assets available for distribution to the stockholders after payment of liabilities and accrued but unpaid dividends and liquidation preferences on any outstanding preferred stock.
Other matters. The common stock has no preemptive or conversion rights. There are no redemption or sinking fund provisions applicable to the common stock. All outstanding shares of our common stock are fully paid and non-assessable, and the shares of our common stock offered in this offering, upon payment and delivery in accordance with the underwriting agreement, will be fully paid and non-assessable.
200
Table of Contents
Preferred stock
Pursuant to our amended and restated certificate of incorporation, shares of preferred stock will be issuable from time to time, in one or more series, with the designations of the series, the voting rights (if any) of the shares of the series, the powers, preferences and relative, participation, optional or other special rights, if any, and any qualifications, limitations or restrictions thereof as our Board of Directors from time to time may adopt by resolution, subject to certain limitations. Each series will consist of that number of shares as will be stated and expressed in the certificate of designations providing for the issuance of the stock of the series. All shares of any one series of preferred stock will be identical.
Options and exchangeable securities
After taking into effect adjustments to the number of shares of the Company’s common stock authorized under the 2012 Equity Incentive Plan and in connection with the 2011 Stockholder Dividends, we have an aggregate of 4,660,474 shares of our common stock authorized for issuance as equity awards under the Company’s 2012 Equity Incentive Plan, of which 3,000,062 shares are issuable pursuant to outstanding options (1,234,950 shares of which are exercisable), 211,700 shares are issuable pursuant to outstanding restricted stock units and 20,000 shares are shares of restricted stock.
In addition, Aleris International has $45.0 million aggregate principal amount of 6% senior subordinated exchangeable notes outstanding. These notes are exchangeable at the holder’s option into shares of our common stock (i) at any time after June 1, 2013, (ii) at any time after June 1, 2011 upon the consummation of a primary initial public offering by the Company for a specified time, and (iii) at any time after June 1, 2011 upon the occurrence of certain fundamental changes affecting the Company. These notes are exchangeable for our common stock at a rate of 47.20 shares of our common stock per $1,000 principal amount of notes (after adjustment for the payments of the 2011 Stockholder Dividends), subject to further adjustment.
As of December 31, 2011, Aleris International also has $5.4 million aggregate liquidation amount of redeemable preferred stock issued and outstanding, which reflects the issuance of $5.0 million aggregate liquidation amount of redeemable preferred stock upon Aleris International’s emergence from bankruptcy and the accrual of dividends. Shares of the redeemable preferred stock are exchangeable at the holder’s option into shares of our common stock (i) at any time after June 1, 2013, (ii) at any time after June 1, 2011 upon the consummation of an initial public offering by the Company for a specified time, and (iii) at any time after June 1, 2011 upon the occurrence of certain fundamental changes affecting the Company. The redeemable preferred stock is exchangeable for our common stock on a current per share dollar exchange rate of approximately $23.30 per share (rounded for convenience of disclosure and after adjustment for the payments of the 2011 Stockholder Dividends), subject to further adjustment.
Composition of Board of Directors; election and removal of directors
In accordance with our amended and restated certificate of incorporation and our amended and restated bylaws, the number of directors comprising our Board of Directors will be determined from time to time by our Board of Directors, and only a majority of the Board of Directors may fix the number of directors. Upon the closing of this offering, it is anticipated that we will have
201
Table of Contents
nine directors. Each director is to hold office until his or her successor is duly elected and qualified or until his or her earlier death, resignation or removal. At any meeting of our Board of Directors, except as otherwise required by law, a majority of the total number of directors then in office will constitute a quorum for all purposes.
Our amended and restated certificate of incorporation will provide that our Board of Directors is divided into three classes of directors, with the classes to be as nearly equal in number as possible. As a result, approximately one third of our Board of Directors will be elected each year. The classification of directors has the effect of making it more difficult for stockholders to change the composition of our board.
Special meetings of stockholders
Our amended and restated bylaws will provide that special meetings of the stockholders may be called only by the Board of Directors and the chairman of our Board of Directors.
Provisions of our amended and restated certificate of incorporation and our amended and restated bylaws that may have an anti-takeover effect
Certain provisions in our amended and restated certificate of incorporation and amended and restated bylaws summarized below may be deemed to have an anti-takeover effect and may delay, deter or prevent a tender offer or takeover attempt that a stockholder might consider to be in its best interests, including attempts that might result in a premium being paid over the market price for the shares held by stockholders.
Written consent of stockholders
Our amended and restated certificate of incorporation and restated bylaws will provide that any action required or permitted to be taken by our stockholders must be taken at a duly called meeting of stockholders and not by written consent.
Preferred stock
Our amended and restated certificate of incorporation will contain provisions that permit our Board of Directors to issue, without any further vote or action by the stockholders, shares of preferred stock in one or more series and, with respect to each such series, to fix the number of shares constituting the series and the designation of the series, the voting rights (if any) of the shares of the series, and the powers, preferences and relative, participation, optional and other special rights, if any, and any qualifications, limitations or restrictions, of the shares of such series. See “—Preferred stock.”
Classified board; number of directors
Our amended and restated certificate of incorporation will provide that our Board of Directors is divided into three classes of directors, with the classes to be as nearly equal in number as possible. Our amended and restated certificate of incorporation will also provide that the number of directors on our board may be fixed only by the majority of our Board of Directors, as described above in “Composition of Board of Directors; election and removal of directors.”
202
Table of Contents
Removal of directors, vacancies
Our stockholders will be able to remove directors only for cause and only by the affirmative vote of the holders of a majority of the outstanding shares of our capital stock entitled to vote in the election of directors. Vacancies on our Board of Directors may be filled only by a majority of our Board of Directors.
No cumulative voting
Our amended and restated certificate of incorporation will provide that stockholders do not have the right to cumulative votes in the election of directors. Cumulative voting rights would have been available to the holders of our common stock if our amended and restated articles of incorporation had not negated cumulative voting.
Advance notice requirements for stockholder proposals and director nominations
Our amended and restated bylaws will provide that stockholders seeking to nominate candidates for election as directors or to bring business before an annual meeting of stockholders must provide timely notice of their proposal in writing to the corporate secretary.
Generally, to be timely, a stockholder’s notice must be received at our principal executive offices not less than 60 days nor more than 120 days prior to the first anniversary date of the previous year’s annual meeting. Our amended and restated bylaws will also specify requirements as to the form and content of a stockholder’s notice. These provisions may impede stockholders’ ability to bring matters before an annual meeting of stockholders or make nominations for directors at an annual meeting of stockholders.
Supermajority voting requirement for amendment of certificate of incorporation
Our amended and restated certificate of incorporation will provide that it can be amended only with the affirmative vote of the holders of 66 2/3% of the shares then entitled to vote thereon.
Supermajority voting requirement for amendment of bylaws
Our amended and restated bylaws will provide that they can be amended only with the affirmative vote of the holders of 66 2/3% of the shares then entitled to vote thereon or by the vote of a majority of the Board of Directors.
All the foregoing proposed provisions of our amended and restated certificate of incorporation and amended and restated bylaws could discourage potential acquisition proposals and could delay or prevent a change in control. These provisions are intended to enhance the likelihood of continuity and stability in the composition of the Board of Directors and in the policies formulated by the Board of Directors and to discourage certain types of transactions that may involve an actual or threatened change of control. These provisions are designed to reduce our vulnerability to an unsolicited acquisition proposal. The provisions also are intended to discourage certain tactics that may be used in proxy fights. These same provisions may delay, deter or prevent a tender offer or takeover attempt that a stockholder might consider to be in its best interest. In addition, such provisions could have the effect of discouraging others from making tender offers for our shares and, as a consequence, they also may inhibit fluctuations in the market price of our common stock that could result from actual or rumored takeover attempts. Such provisions also may have the effect of preventing changes in our management.
203
Table of Contents
Section 203 of the DGCL
Upon the closing of this offering we will elect not to be subject to Section 203 of the DGCL, which would have imposed additional requirements regarding certain mergers and other business combinations. Section 203 of the DGCL provides that a corporation may not engage in a business combination with any interested stockholder for a period of three years following the time that such stockholder became an interested stockholder unless:
| • | prior to such time the board of directors of the corporation approved either the business combination or transaction which resulted in the stockholder becoming an interested stockholder; |
| • | upon consummation of the transaction which resulted in the stockholder becoming an interested stockholder, the interested stockholder owned at least 85% of the voting stock of the corporation outstanding at the time the transaction commenced, excluding shares owned by persons who are directors and also officers and employee stock plans in which participants do not have the right to determine confidentially whether shares held subject to the plan will be tendered in a tender or exchange offer; or |
| • | at or subsequent to such time, the business combination is approved by the board of directors and authorized at an annual or special meeting of stockholders, and not by written consent, by the affirmative vote of 66 2/3% of the outstanding voting stock which is not owned by the interested stockholder. |
Under Section 203 of the DGCL, an “interested stockholder” is any person (other than the corporation and any direct or indirect majority-owned subsidiary) who owns 15% or more of the outstanding voting stock of the corporation or is an affiliate or associate of the corporation and was the owner of 15% or more of the outstanding voting stock of the corporation at any time within the three-year period immediately prior to the date of determination, and the affiliates and associates of such person.
Corporate opportunity
Our amended and restated certificate of incorporation will provide that no officer or director of us who is also an officer, director, employee, managing director or other affiliate of the Oaktree Funds will be liable to us or our stockholders for breach of any fiduciary duty by reason of the fact that any such individual directs a corporate opportunity to the Oaktree Funds instead of us, or does not communicate information regarding a corporate opportunity to us that the officer, director, employee, managing director or other affiliate has directed to the Oaktree Funds.
Limitation of liability and indemnification
Our amended and restated certificate of incorporation will provide that no director will be personally liable for monetary damages for breach of any fiduciary duty as a director, except with respect to liability
| • | for any breach of the director’s duty of loyalty to us or our stockholders; |
| • | for acts or omissions not in good faith or that involve intentional misconduct or a knowing violation of law; |
204
Table of Contents
| • | under Section 174 of the DGCL (governing distributions to stockholders); or |
| • | for any transaction from which the director derived any improper personal benefit. |
However, if the DGCL is amended to authorize corporate action further eliminating or limiting the personal liability of directors, then the liability of our directors will be eliminated or limited to the fullest extent permitted by the DGCL, as so amended. The modification or repeal of this provision of our amended and restated certificate of incorporation will not adversely affect any right or protection of a director existing at the time of such modification or repeal. Our amended and restated certificate of incorporation will provide that we will, to the fullest extent from time to time permitted by law, indemnify our directors and officers against all liabilities and expenses in any suit or proceeding, arising out of their status as an officer or director or their activities in these capacities. We will also indemnify any person who, at our request, is or was serving as a director, officer or employee of another corporation, partnership, joint venture, trust or other enterprise. We may, by action of our Board of Directors, provide indemnification to our employees and agents within the same scope and effect as the foregoing indemnification of directors and officers.
The right to be indemnified will include the right of an officer or a director to be paid expenses in advance of the final disposition of any proceeding, provided that, if required by law, we receive an undertaking to repay such amount if it will be determined that he or she is not entitled to be indemnified. Our Board of Directors may take such action as it deems necessary to carry out these indemnification provisions, including adopting procedures for determining and enforcing indemnification rights and purchasing insurance policies. Our Board of Directors may also adopt bylaws, resolutions or contracts implementing indemnification arrangements as may be permitted by law. Neither the amendment or repeal of these indemnification provisions, nor the adoption of any provision of our amended and restated certificate of incorporation inconsistent with these indemnification provisions, will eliminate or reduce any rights to indemnification relating to their status or any activities prior to such amendment, repeal or adoption. We believe these provisions will assist in attracting and retaining qualified individuals to serve as directors.
Registration rights agreement
On the Emergence Date, we entered into a registration rights agreement with the Oaktree Funds, the Apollo Funds and holders of at least 5% of our outstanding common stock (the “Registration Rights Agreement”) pursuant to which the parties are entitled to certain demand and short-form, piggyback and shelf registration rights. The following description of the terms of the Registration Rights Agreement is intended as a summary only and is qualified in its entirety by reference to the Registration Rights Agreement filed as an exhibit to the registration statement of which this prospectus is a part.
Demand and short-form registration rights
After the closing of this offering, the Investors, and, after the one-year anniversary of the closing of this offering, certain other holders of at least 10% of our common stock (the “Other 10% Stockholders” and, together with the Investors, the “Significant Investor Holders”) can request that we register a specified number of their shares under the Securities Act, subject to certain restrictions. We are not obligated to effect more than three demand registrations for the
205
Table of Contents
Oaktree Funds, two demand registrations for the Apollo Funds, one demand registration for the Sankaty Funds and one demand registration of each of the Other 10% Stockholders. There may be certain other situations, as described in the Registration Rights Agreement, in which we will not be obligated to effect one or more demand registrations. In addition, following the closing of this offering, these holders of our common stock will be entitled to certain short-form registration rights. The Significant Investor Holders may make an unlimited number of requests for short-form registration, subject to among other conditions, minimum aggregate offering size requirements.
We may, but not more than three times for a period of up to 90 days in the aggregate in any consecutive 12 month period, postpone the filing of a registration statement or withdraw a previously filed registration statement, either in connection with a demand registration or short-form registration, if our board of directors determines that such registration would materially interfere with any material transactions or any negotiations, discussions or pending proposals involving the Company or any of its subsidiaries or would require the disclosure of non-public material information, the disclosure of which would be expected to materially and adversely affect the Company.
Piggyback registration rights
After the closing of this offering, if we determine to file a registration statement with respect to an offering for our own account (other than a registration statement on Form S-4 or S-8) or for the account of any other stockholder of the Company other than the Significant Investor Holders, then each of the Investors and the other 5% Stockholders are entitled to notice of the registration and have the right, subject to limitations that the underwriters may impose on the number of shares included in the registration, to include their shares in such registration. Stockholders of more than 5% of our outstanding common stock also have piggyback rights with respect to demand or short-form registrations, under certain circumstances.
Shelf registrations
When we become and for so long as we are eligible to use Form S-3 under the Securities Act, the Oaktree Funds, Apollo Funds, and any Other 10% Stockholder will have the right to request that we register some or all of their shares on a Form S-3 in an offering on a delayed or continuous basis pursuant to Rule 415 under the Securities Act. Upon becoming a well-known seasoned issuer, as defined in Rule 405 of the Securities Act, we are required to file an automatic shelf registration statement and register for sale all shares that remain eligible for registration.
Expenses of registration, limitations and indemnification
We will assume the fees and expenses (other than underwriting discounts and commissions) associated with any registration, including legal fees of one counsel and one local counsel. There are no cash penalties under the Registration Rights Agreement. The aforementioned registration rights are subject to certain conditions and limitations, including holdback agreements and the right of underwriters to limit the number of shares included in the registration statement. The Registration Rights Agreement also contains indemnification provisions.
206
Table of Contents
Listing
Our common stock has been approved for listing on the New York Stock Exchange under the symbol “ARS.”
Transfer agent and registrar
The transfer agent and registrar for our common stock is Computershare Trust Company, N.A.
207
Table of Contents
Shares eligible for future sale
Prior to this offering, there has not been a public market for our common stock, and we cannot predict what effect, if any, market sales of shares of common stock or the availability of shares of common stock for sale will have on the market price of our common stock prevailing from time to time. Nevertheless, sales of substantial amounts of common stock, including shares issued upon the exercise of outstanding options, in the public market, or the perception that such sales could occur, could materially and adversely affect the market price of our common stock and could impair our future ability to raise capital through the sale of our equity or equity-related securities at a time and price that we deem appropriate.
Upon the completion of this offering, we will have an aggregate of approximately shares of common stock outstanding, assuming no exercise of the underwriters’ over-allotment option. This excludes (i) 4,660,474 shares of common stock authorized for issuance as equity awards under our equity incentive plan, of which 3,000,062 shares are issuable pursuant to outstanding options (1,234,950 shares of which are exercisable), 211,700 shares are issuable pursuant to outstanding restricted stock units and 20,000 shares of restricted stock, (ii) shares of our common stock that would be issuable upon the exchange of shares of Aleris International’s redeemable preferred stock (subject, pursuant to the terms of the redeemable preferred stock, to anti-dilution adjustments summarized below), and (iii) shares of our common stock that would be issuable upon the exchange of Aleris International’s 6% senior subordinated exchangeable notes (subject, pursuant to the terms of the 6% senior subordinated exchangeable notes, to anti-dilution adjustments summarized below). The redeemable preferred stock and the 6% senior subordinated exchangeable notes are subject to customary anti-dilution provisions which adjust the number of shares of common stock issuable upon exchange of such securities upon the following events: (i) stock dividends, distributions, splits, subdivisions, combinations or reclassifications; (ii) issuance or sale of shares of common stock or securities convertible into or exchangeable for common stock, without consideration or at a consideration per share that is below market; (iii) other dividends or distributions other than stock; (iv) other similar dilutive events; or (v) extraordinary corporate transactions such as mergers, consolidations, sales of assets, tenders or exchange offers, transactions or events in which all or substantially all of the Company’s common stock is converted or exchanged for stock, other securities, cash or assets. Of the outstanding shares, the shares sold in this offering will be freely tradable without restriction or further registration under the Securities Act, except that any shares held by our affiliates, as that term is defined under Rule 144 of the Securities Act, may be sold only in compliance with the limitations described below. The remaining shares of common stock outstanding prior to this offering will be deemed restricted securities, as defined under Rule 144. Restricted securities may be sold in the public market only if registered or if they qualify for an exemption from registration under Rule 144 or Rule 701 under the Securities Act, which we summarize below.
Rule 144
In general, under Rule 144 as in effect on the date of this prospectus, a person who is not one of our affiliates at any time during the three months preceding a sale, and who has beneficially owned shares of our common stock for at least six months, would be entitled to sell an unlimited number of shares of our common stock provided current public information about us is available and, after owning such shares for at least one year, would be entitled to sell an unlimited
208
Table of Contents
number of shares of our common stock without restriction. Our affiliates who have beneficially owned shares of our common stock for at least six months are entitled to sell within any three-month period a number of shares that does not exceed the greater of:
| • | 1% of the number of shares of our common stock then outstanding, which will equal approximately shares immediately after this offering; or |
| • | the average weekly trading volume of our common stock on the NYSE during the four calendar weeks preceding the filing of a notice on Form 144 with respect to the sale. |
Sales under Rule 144 by our affiliates are also subject to manner of sale provisions and notice requirements and to the availability of current public information about us.
Rule 701
Rule 701 under the Securities Act, as in effect on the date of this prospectus, permits resales of shares in reliance upon Rule 144 but without compliance with certain restrictions of Rule 144, including the holding period requirement. Most of our employees, executive officers or directors who purchase shares or are granted RSUs under a written compensation plan or contract may be entitled to rely on the resale provisions of Rule 701, but all holders of Rule 701 shares are required to wait until 90 days after the date of this prospectus before selling their shares. However, substantially all Rule 701 shares are subject to lock-up agreements as described below and will become eligible for sale upon the expiration of the restrictions set forth in those agreements.
Lock-up agreements
In connection with this offering, we, our executive officers and directors, the selling stockholders and certain of our existing stockholders have agreed with the underwriters, subject to certain exceptions, not to sell, dispose of or hedge any of our common stock or securities convertible into or exchangeable for shares of common stock, during the period ending 180 days after the date of this prospectus, except with the prior written consent of the representative of the underwriters.
The 180-day restricted period described in the preceding paragraph will be automatically extended if:
| • | during the last 17 days of the 180-day restricted period we issue an earnings release or material news or a material event relating to us occurs; or |
| • | prior to the expiration of the 180-day restricted period, we announce that we will release earnings results or become aware that material news or a material event will occur during the 16-day period beginning on the last day of the 180-day period, in which case the restrictions described in this paragraph will continue to apply until the expiration of the 18-day period beginning on the issuance of the earnings release or the occurrence of the material news or material event. See “Underwriting.” |
Registration on Form S-8
We intend to file a registration statement on Form S-8 under the Securities Act to register shares of common stock issuable under our Equity Incentive Plan. As a result, shares issued pursuant to
209
Table of Contents
such stock incentive plan, including upon exercise of stock options, will be eligible for resale in the public market without restriction, subject to the Rule 144 limitations applicable to affiliates. 4,660,474 shares of common stock are authorized for issuance as equity awards under our equity incentive plan, of which 3,000,062 shares are issuable pursuant to outstanding options (1,234,950 shares of which are exercisable), 211,700 shares are issuable pursuant to outstanding restricted stock units and 20,000 shares of restricted stock.
Registration rights
As described above in “Description of capital stock—Registration rights agreement,” the Company entered into a registration rights agreement with the Oaktree Funds, the Apollo Funds and holders of at least 5% of the Company’s outstanding common stock pursuant to which the Investors and other 10% Stockholders have the right, subject to various conditions and limitations, to demand the filing of a registration statement covering their shares of our common stock, subject to the lock-up arrangement described above. By exercising their registration rights and causing a large number of shares to be registered and sold in the public market, these holders could cause the price of our common stock to significantly decline.
210
Table of Contents
Material U.S. federal income and estate tax considerations
for non-U.S. holders
The following is a summary of the material U.S. federal income and estate tax consequences of the acquisition, ownership and disposition of our common stock by a non-U.S. holder. As used in this summary (except as modified for U.S. federal estate tax purposes), the term “non-U.S. holder” means a beneficial owner of our common stock that is not, for United States federal income tax purposes:
| • | an individual who is a citizen or resident of the United States or a former citizen or resident of the United States subject to taxation as an expatriate; |
| • | a corporation (or other entity classified as a corporation for these purposes) created or organized in or under the laws of the United States or of any political subdivision of the United States; |
| • | a partnership (including any entity or arrangement classified as a partnership for these purposes); |
| • | an estate whose income is includible in gross income for U.S. federal income tax purposes regardless of its source; or |
| • | a trust, if (1) a U.S. court is able to exercise primary supervision over the trust’s administration and one or more “United States persons” (within the meaning of the U.S. Internal Revenue Code) has the authority to control all of the trust’s substantial decisions, or (2) the trust has a valid election in effect under applicable U.S. Treasury regulations to be treated as a “United States person.” |
If a partnership or other pass-through entity (including an entity or arrangement treated as a partnership or other type of pass-through entity for U.S federal income tax purposes) owns our common stock, the tax treatment of a partner or beneficial owner of the partnership or other pass-through entity may depend upon the status of the partner or beneficial owner, the activities of the partnership or entity and certain determinations made at the partner or beneficial owner level. Partners and beneficial owners in partnerships or other pass-through entities that own our common stock should consult their own tax advisors as to the particular U.S. federal income and estate tax consequences applicable to them.
This summary does not discuss all of the aspects of U.S. federal income and estate taxation that may be relevant to a non-U.S. holder in light of the non-U.S. holder’s particular investment or other circumstances. In addition, this summary only addresses a non-U.S. holder that holds our common stock as a capital asset (generally, investment property) and does not address:
| • | special U.S. federal income tax rules that may apply to particular non-U.S. holders, such as financial institutions, insurance companies, tax-exempt organizations, and dealers and traders in stocks, securities or currencies; |
| • | non-U.S. holders holding our common stock as part of a conversion, constructive sale, wash sale or other integrated transaction or a hedge, straddle or synthetic security; |
| • | any U.S. state and local or non-U.S. or other tax consequences; or |
| • | the U.S. federal income or estate tax consequences for the beneficial owners of a non-U.S. holder. |
211
Table of Contents
This summary is based on provisions of the U.S. Internal Revenue Code of 1986, as amended, applicable U.S. Treasury regulations and administrative and judicial interpretations, all as in effect or in existence on the date of this prospectus. Subsequent developments in U.S. federal income or estate tax law, including changes in law or differing interpretations, which may be applied retroactively, could have a material effect on the U.S. federal income and estate tax consequences of purchasing, owning and disposing of our common stock as set forth in this summary. Each non-U.S. holder should consult a tax advisor regarding the U.S. federal, state, local and non-U.S. income and other tax consequences of acquiring, holding and disposing of our common stock.
Dividends
In the event that we pay dividends on our common stock that are not effectively connected with a non-U.S. holder’s conduct of a trade or business in the United States, a U.S. federal withholding tax at a rate of 30%, or a lower rate under an applicable income tax treaty, will be withheld from the gross amount of the dividends paid to such non-U.S. holder. Non-U.S. holders should consult their own tax advisors regarding their entitlement to benefits under a relevant income tax treaty.
In order to claim the benefit of an applicable income tax treaty, a non-U.S. holder will be required to provide a properly executed U.S. Internal Revenue Service Form W-8BEN (or other applicable form) in accordance with the applicable certification and disclosure requirements. Special rules apply to partnerships and other pass-through entities and these certification and disclosure requirements also may apply to beneficial owners of partnerships and other pass-through entities that hold our common stock. A non-U.S. holder that is eligible for a reduced rate of U.S. federal withholding tax under an income tax treaty may obtain a refund of any excess amounts withheld by timely filing an appropriate claim for a refund with the U.S. Internal Revenue Service. Non-U.S. holders should consult their own tax advisors regarding their entitlement to benefits under a relevant income tax treaty and the manner of claiming the benefits.
Dividends that are effectively connected with a non-U.S. holder’s conduct of a trade or business in the United States and, if required by an applicable income tax treaty, are attributable to a permanent establishment maintained by the non-U.S. holder in the United States, generally will be taxed on a net income basis at the regular graduated rates and in the manner applicable to United States persons. The U.S. federal withholding tax discussed above will not apply to dividends that are effectively connected with a non-U.S. holder’s conduct of a trade or business in the United States if the non-U.S. holder provides a properly executed U.S. Internal Revenue Service Form W-8ECI (or other applicable form) in accordance with the applicable certification and disclosure requirements. In addition, a “branch profits tax” may be imposed at a 30% rate, or a lower rate under an applicable income tax treaty, on dividends received by a foreign corporation that are effectively connected with the conduct of a trade or business in the United States.
Gain on disposition of our common stock
A non-U.S. holder generally will not be taxed on any gain recognized on a disposition of our common stock unless:
| • | the gain is effectively connected with the non-U.S. holder’s conduct of a trade or business in the United States and, if required by an applicable income tax treaty, is attributable to a permanent establishment maintained by the non-U.S. holder in the United States; in these |
212
Table of Contents
| cases, the gain generally will be taxed on a net income basis at the regular graduated rates and in the manner applicable to United States persons (unless an applicable income tax treaty provides otherwise) and, if the non-U.S. holder is a foreign corporation, the “branch profits tax” described above may also apply; |
| • | the non-U.S. holder is an individual who holds our common stock as a capital asset, is present in the United States for more than 182 days in the taxable year of the disposition and meets other requirements (in which case, except as otherwise provided by an applicable income tax treaty, the gain, which may be offset by U.S. source capital losses recognized in the same taxable year, generally will be subject to a flat 30% U.S. federal income tax, even though the non-U.S. holder is not considered a resident alien under the U.S. Internal Revenue Code); or |
| • | we are or have been a “U.S. real property holding corporation” for U.S. federal income tax purposes at any time during the shorter of the five-year period ending on the date of disposition or the period that the non-U.S. holder held our common stock (the “Applicable Period”). |
Generally, a corporation is a “U.S. real property holding corporation” if the fair market value of its “U.S. real property interests” equals or exceeds 50% of the sum of the fair market value of its worldwide real property interests plus its other assets used or held for use in a trade or business. The tax relating to stock in a U.S. real property holding corporation generally will not apply to a non-U.S. holder whose holdings, direct and indirect, at all times during the Applicable Period, constituted 5% or less of our common stock, provided that our common stock was regularly traded on an established securities market. We believe that we are not currently, and we do not anticipate becoming in the future, a U.S. real property holding corporation.
Federal estate tax
Our common stock that is owned or treated as owned by an individual who is not a U.S. citizen or resident of the United States (as specially defined for U.S. federal estate tax purposes) at the time of death will be included in the individual’s gross estate for U.S. federal estate tax purposes, unless an applicable estate tax or other treaty provides otherwise and, therefore, may be subject to U.S. federal estate tax.
Information reporting and backup withholding
Dividends paid to a non-U.S. holder may be subject to U.S. information reporting and backup withholding. A non-U.S. holder will be exempt from backup withholding if the non-U.S. holder provides a properly executed U.S. Internal Revenue Service Form W-8BEN or otherwise meets documentary evidence requirements for establishing its status as a non-U.S. holder or otherwise establishes an exemption.
The gross proceeds from the disposition of our common stock may be subject to U.S. information reporting and backup withholding. If a non-U.S. holder sells our common stock outside the United States through a non-U.S. office of a non-U.S. broker and the sales proceeds are paid to the non-U.S. holder outside the United States, then the U.S. backup withholding and information reporting requirements generally will not apply to that payment. However, U.S. information reporting, but not U.S. backup withholding, will apply to a payment of sales proceeds, even if that payment is made outside the United States, if a non-U.S. holder sells our common stock through a non-U.S. office of a broker that is a United States person or has certain enumerated
213
Table of Contents
connections with the United States, unless the broker has documentary evidence in its files that the non-U.S. holder is not a United States person and certain other conditions are met or the non-U.S. holder otherwise establishes an exemption.
If a non-U.S. holder receives payments of the proceeds of a sale of our common stock to or through a U.S. office of a broker, the payment is subject to both U.S. backup withholding and information reporting unless the non-U.S. holder provides a properly executed U.S. Internal Revenue Service Form W-8BEN certifying that the non-U.S. holder is not a “United States person” or the non-U.S. holder otherwise establishes an exemption. The amount of any backup withholding from a payment to a non-U.S. holder will be allowed as a credit against the non-U.S. holder’s U.S. federal income tax liability and may entitle the non-U.S. holder to a refund, provided that the required information is timely furnished to the Internal Revenue Service.
Recent legislation
Recent legislation generally imposes withholding at a rate of 30% on payments to certain foreign entities (including financial intermediaries), after December 31, 2013, of dividends on and, after December 31, 2014, the gross proceeds of dispositions of U.S. common stock, unless various U.S. information reporting and due diligence requirements (generally relating to ownership by U.S. persons of interests in or accounts with those entities) have been satisfied. Non-U.S. holders should consult their tax advisers regarding the possible implications of this legislation on their investment in our common stock.
214
Table of Contents
We and the selling stockholders are offering the shares of common stock described in this prospectus through a number of underwriters. J.P. Morgan Securities LLC, Barclays Capital Inc., Deutsche Bank Securities Inc., Merrill Lynch, Pierce, Fenner & Smith Incorporated and Goldman, Sachs & Co. are the joint book-running managers and representatives of the underwriters. We and the selling stockholders have entered into an underwriting agreement with the underwriters. Subject to the terms and conditions of the underwriting agreement, we and the selling stockholders have agreed to sell to the underwriters and each underwriter named below has severally agreed to purchase, at the public offering price less the underwriting discounts and commissions set forth on the cover page of this prospectus, the number of shares of common stock set forth opposite its name in the following table:
| Underwriter | Number of shares | |
|
| ||
| J.P. Morgan Securities LLC |
||
| Barclays Capital Inc. |
||
| Deutsche Bank Securities Inc. |
||
| Merrill Lynch, Pierce, Fenner & Smith Incorporated. |
||
| Goldman, Sachs & Co. |
||
| KeyBanc Capital Markets Inc. |
||
| Credit Suisse Securities (USA) LLC |
||
| Moelis & Company LLC |
||
| Morgan Stanley & Co. LLC |
||
| UBS Securities LLC |
||
| Davenport & Company LLC |
||
| Total |
||
|
| ||
The underwriting agreement provides that if the underwriters take any of the shares presented in the table above, then they must take all of the shares. No underwriter is obligated to take any shares allocated to a defaulting underwriter except under limited circumstances. The underwriting agreement provides that the obligations of the underwriters are subject to certain conditions precedent, including the absence of any material adverse change in our business and the receipt of certain certificates, opinions and letters from us, our counsel and our independent auditors.
The underwriters are offering the shares of common stock, subject to the prior sale of shares, and when, as and if such shares are delivered to and accepted by them. The underwriters will initially offer to sell shares to the public at the initial public offering price shown on the front cover page of this prospectus. The underwriters may sell shares to securities dealers at a discount of up to $ per share from the initial public offering price. After the initial public offering, the representatives may vary the public offering price and other selling terms.
If the underwriters sell more shares than the total number shown in the table above, the underwriters have the option to buy up to an additional shares of common stock from us to cover such sales. They may exercise this option during the 30-day period from the date of this prospectus. If any shares are purchased under this option, the underwriters will purchase shares in approximately the same proportion as shown in the table above. If any additional shares of common stock are purchased, the underwriters will offer the additional shares on the same terms as those on which the initial shares are being offered.
215
Table of Contents
The underwriting fee is equal to the public offering price per share of common stock less the amount paid by the underwriters to us and the selling stockholders per share of common stock, The underwriting fee is $ per share. The following table shows the per share and total underwriting discounts and commissions that we will pay to the underwriters. These amounts are shown assuming both no exercise and full exercise of the underwriters’ option to purchase additional shares.
| Paid by the company | ||||||||
| Without over- allotment exercise |
With full over- allotment exercise |
|||||||
|
|
||||||||
| Per Share |
$ | $ | ||||||
| Total |
$ | $ | ||||||
|
|
||||||||
We estimate that our total expenses for this offering, including registration, filing and listing fees, printing fees and legal and accounting expenses, but excluding the underwriting discounts and commissions, will be approximately $ .
The underwriters have advised us that they may make short sales of our common stock in connection with this offering, resulting in the sale by the underwriters of a greater number of shares than they are required to purchase pursuant to the underwriting agreement. The short position resulting from those short sales will be deemed a “covered” short position to the extent that it does not exceed the shares subject to the underwriters’ over-allotment option and will be deemed a “naked” short position to the extent that it exceeds that number. A naked short position is more likely to be created if the underwriters are concerned that there may be downward pressure on the trading price of the common stock in the open market that could adversely affect investors who purchase shares in this offering. The underwriters may reduce or close out their covered short position either by exercising the over-allotment option or by purchasing shares in the open market. In determining which of these alternatives to pursue, the underwriters will consider the price at which shares are available for purchase in the open market as compared to the price at which they may purchase shares through the over-allotment option. Any “naked” short position will be closed out by purchasing shares in the open market. Similar to the other stabilizing transactions described below, open market purchases made by the underwriters to cover all or a portion of their short position may have the effect of preventing or retarding a decline in the market price of our common stock following this offering. As a result, our common stock may trade at a price that is higher than the price that otherwise might prevail in the open market.
The underwriters have advised us that, pursuant to Regulation M under the Exchange Act, they may engage in transactions, including stabilizing bids or the imposition of penalty bids, that may have the effect of stabilizing or maintaining the market price of the shares of common stock at a level above that which might otherwise prevail in the open market. A “stabilizing bid” is a bid for or the purchase of shares of common stock on behalf of the underwriters for the purpose of fixing or maintaining the price of the common stock. A “penalty bid” is an arrangement permitting the underwriters to claim the selling concession otherwise accruing to an underwriter or syndicate member in connection with the offering if the common stock originally sold by that underwriter or syndicate member is purchased by the underwriters in the open market pursuant to a stabilizing bid or to cover all or part of a syndicate short position. The underwriters have advised us that stabilizing bids and open market purchases may be effected on the NYSE, in the over-the-counter market or otherwise and, if commenced, may be discontinued at any time.
216
Table of Contents
One or more of the underwriters may facilitate the marketing of this offering online directly or through one of its affiliates. In those cases, prospective investors may view offering terms and a prospectus online and, depending upon the particular underwriter, place orders online or through their financial advisor.
We and the selling stockholders have agreed to indemnify the underwriters against certain liabilities, including liabilities under the Securities Act.
We, our executive officers and directors, the selling stockholders and certain of our existing stockholders have agreed that, during the period beginning from the date of this prospectus and continuing to and including the date 180 days after the date of this prospectus, none of them will, directly or indirectly, offer, sell, offer to sell, contract to sell or otherwise dispose of any shares of our common stock, other than in this offering without the prior written consent of J.P. Morgan Securities LLC, except in limited circumstances.
We may issue shares of common stock for the benefit of our employees, directors and officers upon the exercise of options granted under benefit plans described in this prospectus provided that, during the term of the lock-up, we will not file a registration statement covering shares of our common stock issuable upon exercise of options outstanding on the date we enter into the underwriting agreement.
The underwriters have informed us that they do not intend sales to discretionary accounts to exceed 5% of the total number of shares of our common stock offered by them.
Our common stock has been approved for listing on the New York Stock Exchange under the symbol “ARS.” The underwriters intend to sell shares of our common stock so as to meet the distribution requirements of this listing.
There has been no public market for the common stock prior to this offering. We and the underwriters negotiated the initial public offering price. In determining the initial public offering price, we and the underwriters considered a number of factors in addition to prevailing market conditions, including:
| • | the information set forth in this prospectus and otherwise available to the underwriters; |
| • | the history of and prospects for our industry; |
| • | an assessment of our management; |
| • | our present operations; |
| • | our historical results of operations; |
| • | the trend of our operating results; |
| • | our earnings prospects; |
| • | the general condition of the securities markets at the time of this offering; |
| • | the recent market prices of, and demand for, publicly traded common stock of generally comparable companies; and |
| • | other factors deemed relevant by the underwriters and us. |
217
Table of Contents
We and the underwriters considered these and other relevant factors in relation to the price of similar securities of generally comparable companies. Neither we nor the underwriters can assure investors that an active trading market will develop for the common stock, or that the common stock will trade in the public market at or above the initial public offering price.
European Economic Area
In relation to each member state of the European Economic Area which has implemented the Prospectus Directive (each, a “Relevant Member State”), including each Relevant Member State that has implemented the 2010 PD Amending Directive with regard to persons to whom an offer of securities is addressed and the denomination per unit of the offer of securities (each, an “Early Implementing Member State”), with effect from and including the date on which the Prospectus Directive is implemented in that Relevant Member State (the “Relevant Implementation Date”), no offer of shares which are the subject of the offering contemplated by this prospectus will be made to the public in that Relevant Member State (other than offers (the “Permitted Public Offers”) where a prospectus will be published in relation to the shares that has been approved by the competent authority in a Relevant Member State or, where appropriate, approved in another Relevant Member State and notified to the competent authority in that Relevant Member State, all in accordance with the Prospectus Directive), except that with effect from and including that Relevant Implementation Date, offers of shares may be made to the public in that Relevant Member State at any time:
| (a) | to “qualified investors” as defined in the Prospectus Directive, including: |
| (i) | (in the case of Relevant Member States other than Early Implementing Member States), legal entities which are authorized or regulated to operate in the financial markets or, if not so authorized or regulated, whose corporate purpose is solely to invest in securities, or any legal entity which has two or more of (A) an average of at least 250 employees during the last financial year; (B) a total balance sheet of more than €43,000,000 and (C) an annual turnover of more than €50,000,000 as shown in its last annual or consolidated accounts; or |
| (ii) | (in the case of Early Implementing Member States), persons or entities that are described in points (1) to (4) of Section I of Annex II to Directive 2004/39/EC, and those who are treated on request as professional clients in accordance with Annex II to Directive 2004/39/EC, or recognized as eligible counterparties in accordance with Article 24 of Directive 2004/39/EC unless they have requested that they be treated as non-professional clients; or |
| (b) | to fewer than 100 (or, in the case of Early Implementing Member States, 150) natural or legal persons (other than “qualified investors” as defined in the Prospectus Directive), as permitted in the Prospectus Directive, subject to obtaining the prior consent of the representatives for any such offer; or |
| (c) | in any other circumstances falling within Article 3(2) of the Prospectus Directive, provided that no such offer of shares shall result in a requirement for the publication by the Company or any underwriter of a prospectus pursuant to Article 3 of the Prospectus Directive or of a supplement to a prospectus pursuant to Article 16 of the Prospectus Directive. |
218
Table of Contents
Any person making or intending to make any offer within the European Economic Area of shares which are the subject of the offering contemplated in this prospectus should only do so in circumstances in which no obligation arises for the Company or any of the underwriters to produce a prospectus for such offer. Neither the Company nor the underwriters have authorized, nor do they authorize, the making of any offer of shares through any financial intermediary, other than offers made by the underwriters which constitute the final offering of shares contemplated in this prospectus.
Each person in a Relevant Member State (other than a Relevant Member State where there is a Permitted Public Offer) who initially acquires any shares or to whom any offer is made will be deemed to have represented, warranted and agreed to and with each underwriter and the Company that: (a) it is a “qualified investor” within the meaning of the law in that Relevant Member State implementing Article 2(1)(e) of the Prospectus Directive and (b) in the case of any shares acquired by it as a financial intermediary, as that term is used in Article 3(2) of the Prospectus Directive, (i) the shares acquired by it in the offering have not been acquired on behalf of, nor have they been acquired with a view to their offer or resale to, persons in any Relevant Member State other than “qualified investors” as defined in the Prospectus Directive, or in circumstances in which the prior consent of the representatives has been given to the offer or resale or (ii) where shares have been acquired by it on behalf of persons in any Relevant Member State other than qualified investors, the offer of those shares to it is not treated under the Prospectus Directive as having been made to such persons.
For the purpose of the above provisions, the expression “an offer to the public” in relation to any shares in any Relevant Member State means the communication in any form and by any means of sufficient information on the terms of the offer of any shares to be offered so as to enable an investor to decide to purchase any shares, as the same may be varied in the Relevant Member State by any measure implementing the Prospectus Directive in the Relevant Member State and the expression “Prospectus Directive” means Directive 2003/71 EC (including the 2010 PD Amending Directive, in the case of Early Implementing Member States) and includes any relevant implementing measure in each Relevant Member State and the expression “2010 PD Amending Directive” means Directive 2010/73/EU.
United Kingdom
Each underwriter has represented and agreed that:
| (a) | (i) it is a person whose ordinary activities involve it in acquiring, holding, managing or disposing of investments (as principal or agent) for the purposes of its business and (ii) it has not offered or sold and will not offer or sell the shares other than to persons whose ordinary activities involve them in acquiring, holding, managing or disposing of investments (as principal or as agent) for the purposes of their businesses or who it is reasonable to expect will acquire, hold, manage or dispose of investments (as principal or agent) for the purposes of their businesses where the issue of the shares would otherwise constitute a contravention of Section 19 of the FSMA by the Issuer; |
| (b) | it has only communicated or caused to be communicated and will only communicate or cause to be communicated an invitation or inducement to engage in investment activity (within the meaning of Section 21 of the FSMA) received by it in connection with the issue or sale of the shares in circumstances in which Section 21(1) of the FSMA does not apply to the Issuer or the Guarantors; and |
219
Table of Contents
| (c) | it has complied and will comply with all applicable provisions of the FSMA with respect to anything done by it in relation to the shares in, from or otherwise involving the United Kingdom. |
France
Neither this prospectus nor any other offering material relating to the shares described in this prospectus has been submitted to the clearance procedures of the Autorité des Marchés Financiers or of the competent authority of another member state of the European Economic Area and notified to the Autorité des Marchés Financiers. The shares have not been offered or sold and will not be offered or sold, directly or indirectly, to the public in France. Neither this prospectus nor any other offering material relating to the shares has been or will be:
| • | released, issued, distributed or caused to be released, issued or distributed to the public in France; or |
| • | used in connection with any offer for subscription or sale of the shares to the public in France. |
| • | such offers, sales and distributions will be made in France only: |
| • | to qualified investors (investisseurs qualifiés) and/or to a restricted circle of investors (cercle restreint d’investisseurs), in each case investing for their own account, all as defined in, and in accordance with articles L.411-2, D.411-1, D.411-2, D.734-1, D.744-1, D.754-1 and D.764-1 of the French Code monétaire et financier; |
| • | to investment services providers authorized to engage in portfolio management on behalf of third parties; or |
| • | in a transaction that, in accordance with article L.411-2-II-1°-or-2°-or 3° of the French Code monétaire et financier and article 211-2 of the General Regulations (Règlement Général) of the Autorité des Marchés Financiers, does not constitute a public offer (appel public à l’épargne). |
The shares may be resold directly or indirectly, only in compliance with articles L.411-1, L.411-2, L.412-1 and L.621-8 through L.621-8-3 of the French Code monétaire et financier.
Hong Kong
The shares may not be offered or sold by means of any document other than (i) in circumstances which do not constitute an offer to the public within the meaning of the Companies Ordinance (Cap.32, Laws of Hong Kong), or (ii) to “professional investors” within the meaning of the Securities and Futures Ordinance (Cap.571, Laws of Hong Kong) and any rules made thereunder, or (iii) in other circumstances which do not result in the document being a “prospectus” within the meaning of the Companies Ordinance (Cap.32, Laws of Hong Kong), and no advertisement, invitation or document relating to the shares may be issued or may be in the possession of any person for the purpose of issue (in each case whether in Hong Kong or elsewhere), which is directed at, or the contents of which are likely to be accessed or read by, the public in Hong Kong (except if permitted to do so under the laws of Hong Kong) other than with respect to shares which are or are intended to be disposed of only to persons outside Hong Kong or only to “professional investors” within the meaning of the Securities and Futures Ordinance (Cap. 571, Laws of Hong Kong) and any rules made thereunder.
220
Table of Contents
Singapore
This prospectus has not been registered as a prospectus with the Monetary Authority of Singapore. Accordingly, this prospectus and any other document or material in connection with the offer or sale, or invitation for subscription or purchase, of the shares may not be circulated or distributed, nor may the shares be offered or sold, or be made the subject of an invitation for subscription or purchase, whether directly or indirectly, to persons in Singapore other than (i) to an institutional investor under Section 274 of the Securities and Futures Act, Chapter 289 of Singapore (the “SFA”), (ii) to a relevant person, or any person pursuant to Section 275(1A), and in accordance with the conditions, specified in Section 275 of the SFA or (iii) otherwise pursuant to, and in accordance with the conditions of, any other applicable provision of the SFA.
Where the shares are subscribed or purchased under Section 275 by a relevant person which is: (a) a corporation (which is not an accredited investor) the sole business of which is to hold investments and the entire share capital of which is owned by one or more individuals, each of whom is an accredited investor; or (b) a trust (where the trustee is not an accredited investor) whose sole purpose is to hold investments and each beneficiary is an accredited investor, shares, debentures and units of shares and debentures of that corporation or the beneficiaries’ rights and interest in that trust shall not be transferable for 6 months after that corporation or that trust has acquired the shares under Section 275 except: (1) to an institutional investor under Section 274 of the SFA or to a relevant person, or any person pursuant to Section 275(1A), and in accordance with the conditions, specified in Section 275 of the SFA; (2) where no consideration is given for the transfer; or (3) by operation of law.
Japan
The shares offered in this prospectus have not been registered under the Financial Instruments and Exchange Law of Japan. The shares have not been offered or sold and will not be offered or sold, directly or indirectly, in Japan or to or for the account of any resident of Japan, (which term as used herein means any person resident in Japan, including any corporation or other entity organized under the laws of Japan) or to others for re-offering or resale, directly or indirectly, in Japan or to a resident of Japan, except (i) pursuant to an exemption from the registration requirements of the Securities and Exchange Law and (ii) in compliance with any other applicable requirements of the Financial Instruments and Exchange Law and any other applicable laws, regulations and ministerial guidelines of Japan.
Switzerland
This document as well as any other material relating to the shares which are the subject of the offering contemplated by this Prospectus (the “Shares”) do not constitute an issue prospectus pursuant to Article 652a of the Swiss Code of Obligations. The Shares will not be listed on the SWX Swiss Exchange and, therefore, the documents relating to the Shares, including, but not limited to, this document, do not claim to comply with the disclosure standards of the listing rules of SWX Swiss Exchange and corresponding prospectus schemes annexed to the listing rules of the SWX Swiss Exchange.
The Shares are being offered in Switzerland by way of a private placement, i.e. to a small number of selected investors only, without any public offer and only to investors who do not purchase the Shares with the intention to distribute them to the public. The investors will be individually approached by the Company from time to time.
221
Table of Contents
This document as well as any other material relating to the Shares is personal and confidential and do not constitute an offer to any other person. This document may only be used by those investors to whom it has been handed out in connection with the offering described herein and may neither directly nor indirectly be distributed or made available to other persons without express consent of the Company. It may not be used in connection with any other offer and shall in particular not be copied and/or distributed to the public in (or from) Switzerland.
Dubai International Financial Centre
This document relates to an exempt offer in accordance with the Offered Securities Rules of the Dubai Financial Services Authority. This document is intended for distribution only to persons of a type specified in those rules. It must not be delivered to, or relied on by, any other person. The Dubai Financial Services Authority has no responsibility for reviewing or verifying any documents in connection with exempt offers. The Dubai Financial Services Authority has not approved this document nor taken steps to verify the information set out in it, and has no responsibility for it. The shares which are the subject of the offering contemplated by this Prospectus (the “Shares”) may be illiquid and/or subject to restrictions on their resale.
Prospective purchasers of the Shares offered should conduct their own due diligence on the Shares. If you do not understand the contents of this document you should consult an authorised financial adviser.
Stamp taxes
Purchasers of the common stock offered by this prospectus may be required to pay stamp taxes and other charges under the laws and practices of the country of purchase, in addition to the offering price listed on the cover page of this prospectus. Accordingly, we urge you to consult a tax advisor with respect to whether you may be required to pay those taxes or charges, as well as any other tax consequences that may arise under the laws of the country of purchase.
Electronic Offer, Sale and Distribution of Shares
In connection with the offering, certain of the underwriters or securities dealers may distribute prospectuses by electronic means, such as e-mail. In addition, certain of the underwriters may facilitate Internet distribution for this offering to certain of its Internet subscription customers. Certain of the underwriters may allocate a limited number of shares for sale to its online brokerage customers. An electronic prospectus is available on the Internet website maintained by certain of the underwriters. Other than the prospectus in electronic format, the information on certain of the underwriters’ websites is not part of this prospectus.
Other relationships
The underwriters and their respective affiliates are full service financial institutions engaged in various activities, which may include securities trading, commercial and investment banking, financial advisory, investment management, investment research, principal investment, hedging, financing and brokerage activities. In the ordinary course of their various business activities, the underwriters and their respective affiliates make or hold a broad array of investments and actively trade debt and equity securities (or related derivative securities) and financial instruments (including bank loans) as well as serve as counterparties to certain derivative and
222
Table of Contents
hedging arrangements for their own account and for the accounts of their customers, and such investment and securities activities may involve securities and/or instruments of the issuer or contracts with the issuer or its affiliates.
From time to time in the ordinary course of their respective businesses, certain of the underwriters and their affiliates perform various financial advisory, investment banking and commercial banking services for us and our affiliates. Certain underwriters or their affiliates are agents and/or lenders under Aleris International, Inc.’s $500 million asset backed credit facility dated June 1, 2010, including Bank of America, N.A., an affiliate of Merrill Lynch, Pierce, Fenner & Smith Incorporated, as administrative agent and collateral agent, Barclays Capital, Deutsche Bank AG New York Branch, an affiliate of Deutsche Bank Securities Inc. and UBS Securities LLC as co-documentation agents, and Bank of America, N.A., Deutsche Bank AG New York Branch, an affiliate of Deutsche Bank Securities Inc., and JPMorgan Chase Bank, N.A., an affiliate of J.P. Morgan Securities LLC, as co-collateral agents. Certain of the underwriters or their affiliates acted as initial purchasers in the sale of Aleris International, Inc.’s $500 million of 7 5/8% Senior Notes on February 9, 2011. Merrill Lynch, Pierce, Fenner & Smith Incorporated and an affiliate of Merrill Lynch, Pierce, Fenner & Smith Incorporated collectively own less than 2% of the equity securities of the Company.
223
Table of Contents
Certain legal matters in connection with the offering will be passed on for us by Fried, Frank, Harris, Shriver & Jacobson LLP, New York, New York. Certain legal matters in connection with the offering will be passed upon for the selling stockholders by . Certain legal matters in connection with the offering will be passed upon for the underwriters by Cahill Gordon & Reindel LLP, New York, New York.
The consolidated financial statements of Aleris Corporation as of December 31, 2011 and 2010 (Successor) and for the year ended December 31, 2011 (Successor), seven-month period ended December 31, 2010 (Successor), five-month period ended May 31, 2010 (Predecessor) and year ended December 31, 2009 (Predecessor), appearing in this Prospectus and Registration Statement, have been audited by Ernst & Young LLP, independent registered public accounting firm, as set forth in their report thereon appearing elsewhere herein, and are included in reliance upon such report given on the authority of such firm as experts in accounting and auditing.
Where you can find more information
We have filed with the SEC a registration statement on Form S-1 under the Securities Act relating to the common stock that includes important business and financial information about us that is not included in or delivered with this prospectus. If we have made references in this prospectus to any contracts, agreements or other documents and also filed any of those contracts, agreements or other documents as exhibits to the registration statement, you should read the relevant exhibit for a more complete understanding of the document or the matter involved.
As a result of this offering, we will become subject to the information and reporting requirements of the Exchange Act, as amended, and, in accordance therewith, will file periodic reports, proxy statements and other information with the SEC. We will file annual, quarterly and special reports and other information with the SEC. Our filings with the SEC will be available to the public on the SEC’s website at www.sec.gov. Those filings will also be available to the public free of charge on our corporate website at www.aleris.com. The information contained on our corporate website or any other website that we may maintain, as well as future filings with the SEC, are not and will not be part of this prospectus, any prospectus supplement or the registration statement of which this prospectus is a part. You may also read and copy, at SEC prescribed rates, any document we file with the SEC, including the registration statement (and its exhibits) of which this prospectus is a part, at the SEC’s Public Reference Room located at 100 F Street, N.E., Washington, D.C. 20549. You can call the SEC at 1-800-SEC-0330 to obtain information on the operation of the Public Reference Room.
224
Table of Contents
Index to consolidated financial statements
| Index | Page Number | |
| F-2 | ||
| Consolidated balance sheet as of December 31, 2011 (Successor) and December 31, 2010 (Successor) |
F-3 | |
F-4 | ||
F-5 | ||
F-6 | ||
F-7 | ||
| F-8 | ||
F-1
Table of Contents
Report of Independent Registered Public Accounting Firm
The Board of Directors and Stockholders of
Aleris Corporation
We have audited the accompanying consolidated balance sheet of Aleris Corporation (the Company) as of December 31, 2011 and 2010 (Successor), and the related consolidated statements of operations, comprehensive income (loss), changes in stockholders’ equity (deficit) and redeemable noncontrolling interest, and cash flows for the year ended December 31, 2011 (Successor), seven-month period ended December 31, 2010 (Successor), five-month period ended May 31, 2010 (Predecessor) and year ended December 31, 2009 (Predecessor). These financial statements are the responsibility of the Company’s management. Our responsibility is to express an opinion on these financial statements based on our audits.
We conducted our audits in accordance with the standards of the Public Company Accounting Oversight Board (United States). Those standards require that we plan and perform the audit to obtain reasonable assurance about whether the financial statements are free of material misstatement. An audit includes examining, on a test basis, evidence supporting the amounts and disclosures in the financial statements. An audit also includes assessing the accounting principles used and significant estimates made by management, as well as evaluating the overall financial statement presentation. We believe that our audits provide a reasonable basis for our opinion.
In our opinion, the financial statements referred to above present fairly, in all material respects, the consolidated financial position of Aleris Corporation at December 31, 2011 and 2010 (Successor), and the consolidated results of its operations and its cash flows for the year ended December 31, 2011 (Successor), seven-month period ended December 31, 2010 (Successor), five-month period ended May 31, 2010 (Predecessor) and year ended December 31, 2009 (Predecessor), in conformity with U.S. generally accepted accounting principles.
As discussed in Notes 3 and 4 to the consolidated financial statements, on May 13, 2010, the Bankruptcy Court entered an order confirming the plan of reorganization, which became effective on June 1, 2010. Accordingly, the accompanying consolidated financial statements have been prepared in conformity with Accounting Standards Codification 852-10, Reorganizations, for the Successor Company as a new entity with assets, liabilities and a capital structure having carrying amounts not comparable with prior periods.
/s/ Ernst & Young LLP
Cleveland, Ohio
February 29, 2012
F-2
Table of Contents
Consolidated balance sheet
(in millions, except share and per share data)
| (Successor) | ||||||||
| December 31, 2011 |
December 31, 2010 |
|||||||
|
|
||||||||
| ASSETS |
||||||||
| Current Assets |
||||||||
| Cash and cash equivalents |
$ | 231.4 | $ | 113.5 | ||||
| Accounts receivable (net of allowances of $8.7 at December 31, 2011 and 2010) |
401.1 | 393.4 | ||||||
| Inventories |
585.7 | 613.6 | ||||||
| Deferred income taxes |
6.0 | 1.6 | ||||||
| Current derivative financial instruments |
0.8 | 17.4 | ||||||
| Prepaid expenses and other current assets |
22.2 | 23.8 | ||||||
|
|
|
|||||||
| Total Current Assets |
1,247.2 | 1,163.3 | ||||||
| Property, plant and equipment, net |
670.5 | 510.0 | ||||||
| Intangible assets, net |
47.7 | 49.7 | ||||||
| Long-term derivative financial instruments |
0.2 | 9.3 | ||||||
| Deferred income taxes |
33.9 | 13.9 | ||||||
| Other long-term assets |
38.1 | 33.5 | ||||||
|
|
|
|||||||
| Total Assets |
$ | 2,037.6 | $ | 1,779.7 | ||||
|
|
|
|||||||
| LIABILITIES AND STOCKHOLDERS’ EQUITY |
||||||||
| Current Liabilities |
||||||||
| Accounts payable |
$ | 287.4 | $ | 283.6 | ||||
| Accrued liabilities |
233.1 | 165.2 | ||||||
| Deferred income taxes |
6.2 | 13.8 | ||||||
| Current portion of long-term debt |
6.9 | 5.3 | ||||||
|
|
|
|||||||
| Total Current Liabilities |
533.6 | 467.9 | ||||||
| Long-term debt |
595.1 | 45.1 | ||||||
| Deferred income taxes |
5.1 | 8.7 | ||||||
| Accrued pension benefits |
206.2 | 184.5 | ||||||
| Accrued postretirement benefits |
52.9 | 48.5 | ||||||
| Other long-term liabilities |
78.6 | 82.0 | ||||||
|
|
|
|||||||
| Total Long-Term Liabilities |
937.9 | 368.8 | ||||||
| Redeemable noncontrolling interest |
5.4 | 5.2 | ||||||
| Stockholders’ Equity |
||||||||
| Common stock; par value $.01; 45,000,000 shares authorized and 31,031,871 and 30,969,440 shares issued at December 31, 2011 and 2010 |
0.3 | 0.3 | ||||||
| Preferred stock; par value $.01; 1,000,000 shares authorized; none issued |
— | — | ||||||
| Additional paid-in capital |
563.4 | 839.6 | ||||||
| Retained earnings |
19.7 | 71.2 | ||||||
| Accumulated other comprehensive (loss) income |
(29.0 | ) | 26.7 | |||||
|
|
|
|||||||
| Total Aleris Corporation Equity |
554.4 | 937.8 | ||||||
| Noncontrolling interest |
6.3 | — | ||||||
|
|
|
|||||||
| Total Equity |
560.7 | 937.8 | ||||||
|
|
|
|||||||
| Total Liabilities and Equity |
$ | 2,037.6 | $ | 1,779.7 | ||||
|
|
||||||||
See Notes to consolidated financial statements.
F-3
Table of Contents
Consolidated statements of operations
(in millions, except per share data)
| (Successor) | (Predecessor) | |||||||||||||||||||
| For the year ended |
For the seven months ended December 31, 2010 |
For the five months ended May 31, 2010 |
For the year ended |
|||||||||||||||||
| Revenues |
$ | 4,826.4 | $ | 2,474.1 | $ | 1,643.0 | $ | 2,996.8 | ||||||||||||
| Cost of sales |
4,354.3 | 2,251.8 | 1,455.8 | 2,820.4 | ||||||||||||||||
| Gross profit |
472.1 | 222.3 | 187.2 | 176.4 | ||||||||||||||||
| Selling, general and administrative expenses |
274.3 | 140.0 | 84.2 | 243.6 | ||||||||||||||||
| Restructuring and impairment charges (gains) |
4.4 | 12.1 | (0.4 | ) | 862.9 | |||||||||||||||
| (Gains) losses on derivative financial instruments |
— | (6.2 | ) | 28.6 | (17.0 | ) | ||||||||||||||
| Other operating (income) expense, net |
(2.4 | ) | (2.1 | ) | 0.4 | (2.1 | ) | |||||||||||||
| Operating income (loss) |
195.8 | 78.5 | 74.4 | (911.0 | ) | |||||||||||||||
| Interest expense, net |
46.3 | 7.0 | 73.6 | 225.4 | ||||||||||||||||
| Reorganization items, net |
(1.3 | ) | 7.4 | (2,227.3 | ) | 123.1 | ||||||||||||||
| Other (income) expense, net |
(6.2 | ) | (7.6 | ) | 32.7 | (10.3 | ) | |||||||||||||
| Income (loss) before income taxes |
157.0 | 71.7 | 2,195.4 | (1,249.2 | ) | |||||||||||||||
| (Benefit from) provision for income taxes |
(4.2 | ) | 0.3 | (8.7 | ) | (61.8 | ) | |||||||||||||
| Net income (loss) |
161.2 | 71.4 | 2,204.1 | (1,187.4 | ) | |||||||||||||||
| Net loss attributable to noncontrolling interest |
(0.4 | ) | — | — | — | |||||||||||||||
| Net income (loss) attributable to Aleris Corporation |
$ | 161.6 | $ | 71.4 | $ | 2,204.1 | $ | (1,187.4 | ) | |||||||||||
| Net income available to common stockholders |
$ | 161.2 | $ | 70.5 | ||||||||||||||||
| Basic earnings per share |
$ | 5.20 | $ | 2.28 | ||||||||||||||||
| Diluted earnings per share |
$ | 4.91 | $ | 2.21 | ||||||||||||||||
| Dividend declared per common share |
$ | 16.00 | $ | — | ||||||||||||||||
| Pro forma basic earnings per share (unaudited) |
$ | $ | ||||||||||||||||||
| Pro forma diluted earnings per share (unaudited) |
$ | $ | ||||||||||||||||||
See Notes to consolidated financial statements.
F-4
Table of Contents
Consolidated statements of comprehensive income (loss)
(in millions)
| (Successor) | (Predecessor) | |||||||||||||||||||
| For the year ended December 31, 2011 |
For the seven months ended December 31, 2010 |
For the
five months ended May 31, 2010 |
For the year ended December 31, 2009 |
|||||||||||||||||
| Aleris Corporation |
Noncontrolling interest |
Aleris Corporation |
Aleris Corporation |
Aleris Corporation |
||||||||||||||||
| Net income (loss) |
$ | 161.6 | $ | (0.4 | ) | $ | 71.4 | $ | 2,204.1 | $ | (1,187.4 | ) | ||||||||
| Other comprehensive (loss) income, before tax: |
||||||||||||||||||||
| Currency translation adjustments |
(19.2 | ) | 0.2 | 21.0 | 44.2 | 5.0 | ||||||||||||||
| Pension and other postretirement liability adjustments |
(39.9 | ) | — | 8.3 | (1.8 | ) | (1.1 | ) | ||||||||||||
| Liquidation of Canada LP |
— | — | — | — | 23.7 | |||||||||||||||
| Other comprehensive (loss) income, before tax |
(59.1 | ) | 0.2 | 29.3 | 42.4 | 27.6 | ||||||||||||||
| Income tax (benefit) expense related to items of other comprehensive (loss) income |
(3.4 | ) | — | 2.6 | — | 3.1 | ||||||||||||||
| Other comprehensive (loss) income, net of tax |
(55.7 | ) | 0.2 | 26.7 | 42.4 | 24.5 | ||||||||||||||
| Comprehensive income (loss) |
$ | 105.9 | $ | (0.2 | ) | $ | 98.1 | $ | 2,246.5 | $ | (1,162.9 | ) | ||||||||
See Notes to consolidated financial statements.
F-5
Table of Contents
Consolidated statements of cash flows
(in millions)
| (Successor) | (Predecessor) | |||||||||||||||
| For the year ended |
For the seven months ended December 31, 2010 |
For the five months ended May 31, 2010 |
For the year ended |
|||||||||||||
|
|
||||||||||||||||
| Operating activities |
||||||||||||||||
| Net income (loss) |
$ | 161.2 | $ | 71.4 | $ | 2,204.1 | $ | (1,187.4 | ) | |||||||
| Adjustments to reconcile net income (loss) to net cash provided (used) by operating activities: |
||||||||||||||||
| Depreciation and amortization |
70.3 | 38.4 | 20.2 | 168.4 | ||||||||||||
| Benefit from deferred income taxes |
(33.6 | ) | (4.8 | ) | (11.4 | ) | (54.2 | ) | ||||||||
| Reorganization items: |
||||||||||||||||
| (Gains) charges |
(1.3 | ) | 7.4 | (2,227.3 | ) | 123.1 | ||||||||||
| Payments, net of cash received |
(3.6 | ) | (33.7 | ) | (31.2 | ) | (25.2 | ) | ||||||||
| Restructuring and impairment charges (gains): |
||||||||||||||||
| Charges (gains) |
4.4 | 12.1 | (0.4 | ) | 862.9 | |||||||||||
| Payments |
(3.8 | ) | (3.3 | ) | (5.5 | ) | (45.6 | ) | ||||||||
| Stock-based compensation expense |
10.1 | 4.9 | 1.3 | 2.1 | ||||||||||||
| Unrealized losses (gains) on derivative financial instruments |
37.8 | (19.8 | ) | 39.2 | (11.2 | ) | ||||||||||
| Currency exchange losses (gains) on debt |
5.4 | — | 25.5 | (14.9 | ) | |||||||||||
| Amortization of debt issuance costs |
6.3 | 2.5 | 27.8 | 109.1 | ||||||||||||
| Other non-cash (gains) charges, net |
(8.9 | ) | (15.4 | ) | 18.3 | 1.7 | ||||||||||
| Changes in operating assets and liabilities: |
||||||||||||||||
| Change in accounts receivable |
(13.0 | ) | 81.3 | (181.5 | ) | 119.5 | ||||||||||
| Change in inventories |
15.7 | (46.6 | ) | (138.7 | ) | 159.3 | ||||||||||
| Change in other assets |
(8.5 | ) | 37.0 | (15.2 | ) | (41.7 | ) | |||||||||
| Change in accounts payable |
(18.4 | ) | 24.8 | 67.4 | (103.6 | ) | ||||||||||
| Change in accrued liabilities |
46.8 | (37.1 | ) | 33.4 | (5.6 | ) | ||||||||||
| Net cash provided (used) by operating activities |
266.9 | 119.1 | (174.0 | ) | 56.7 | |||||||||||
| Investing activities |
||||||||||||||||
| Proceeds from the sale of businesses |
— | 19.9 | — | — | ||||||||||||
| Payments for property, plant and equipment |
(204.6 | ) | (46.5 | ) | (16.0 | ) | (68.6 | ) | ||||||||
| Proceeds from the sale of property, plant and equipment |
7.7 | 0.4 | 0.3 | 8.1 | ||||||||||||
| Other |
(0.4 | ) | — | — | 0.7 | |||||||||||
| Net cash used by investing activities |
(197.3 | ) | (26.2 | ) | (15.7 | ) | (59.8 | ) | ||||||||
| Financing activities |
||||||||||||||||
| Proceeds from ABL Facility |
— | 70.8 | 80.0 | — | ||||||||||||
| Payments on ABL Facility |
— | (152.6 | ) | — | — | |||||||||||
| Proceeds from issuance of Senior Notes, net of discount of $10.0 |
490.0 | — | — | — | ||||||||||||
| Proceeds from China Loan Facility |
56.7 | — | — | — | ||||||||||||
| Net proceeds from (payments on) other long-term debt |
1.1 | (1.0 | ) | (1.3 | ) | (8.8 | ) | |||||||||
| Proceeds from issuance of common stock, net of issuance costs of $22.5 |
— | 1.2 | 541.1 | — | ||||||||||||
| Proceeds from issuance of Preferred Stock |
— | — | 5.0 | — | ||||||||||||
| Proceeds from Exchangeable Notes, net of issuance costs of $1.2 |
— | — | 43.8 | — | ||||||||||||
| Proceeds from DIP ABL Facility |
— | — | 895.3 | 1,263.2 | ||||||||||||
| Payments on DIP ABL Facility |
— | — | (1,112.5 | ) | (1,306.0 | ) | ||||||||||
| Proceeds from DIP Term Facility |
— | — | 34.8 | — | ||||||||||||
| Payments on DIP Term Facility |
— | — | (244.7 | ) | 201.6 | |||||||||||
| Debt issuance costs |
(4.4 | ) | (1.1 | ) | (54.2 | ) | (89.5 | ) | ||||||||
| Contributions from noncontrolling interests |
7.6 | — | — | — | ||||||||||||
| Dividends paid |
(500.0 | ) | — | — | — | |||||||||||
| Other |
2.7 | (0.9 | ) | 0.2 | 0.3 | |||||||||||
| Net cash provided (used) by financing activities |
53.7 | (83.6 | ) | 187.5 | 60.8 | |||||||||||
| Effect of exchange rate differences on cash and cash equivalents |
(5.4 | ) | 5.3 | (7.8 | ) | 2.7 | ||||||||||
| Net increase (decrease) in cash and cash equivalents |
117.9 | 14.6 | (10.0 | ) | 60.4 | |||||||||||
| Cash and cash equivalents at beginning of period |
113.5 | 98.9 | 108.9 | 48.5 | ||||||||||||
| Cash and cash equivalents at end of period |
$ | 231.4 | $ | 113.5 | $ | 98.9 | $ | 108.9 | ||||||||
See Notes to consolidated financial statements.
F-6
Table of Contents
Consolidated statements of changes in stockholders’ equity (deficit) and redeemable noncontrolling interest
(in millions)
| Common stock | Additional paid-in capital |
Retained earnings (deficit) |
Accumulated other comprehensive income (loss) |
Total Aleris Corporation equity (deficit) |
Noncontrolling interest |
Total equity (deficit) |
Redeemable noncontrolling interest |
|||||||||||||||||||||||||
|
|
||||||||||||||||||||||||||||||||
| Balance at January 1, 2009 (Predecessor) |
$ | — | $ | 855.8 | $ | (1,876.0 | ) | $ | 0.5 | $ | (1,019.7 | ) | $ | — | $ | (1,019.7 | ) | $ | — | |||||||||||||
| Net loss |
— | — | (1,187.4 | ) | — | (1,187.4 | ) | — | (1,187.4 | ) | — | |||||||||||||||||||||
| Other comprehensive income |
— | — | — | 24.5 | 24.5 | — | 24.5 | — | ||||||||||||||||||||||||
| Stock-based compensation expense |
— | 2.1 | — | — | 2.1 | — | 2.1 | — | ||||||||||||||||||||||||
| Other |
— | — | 0.1 | — | 0.1 | — | 0.1 | — | ||||||||||||||||||||||||
|
|
|
|||||||||||||||||||||||||||||||
| Balance at December 31, 2009 (Predecessor) |
$ | — | $ | 857.9 | $ | (3,063.3 | ) | $ | 25.0 | $ | (2,180.4 | ) | $ | — | $ | (2,180.4 | ) | $ | — | |||||||||||||
| Net income |
— | — | 2,204.1 | — | 2,204.1 | — | 2,204.1 | — | ||||||||||||||||||||||||
| Other comprehensive income |
— | — | — | 42.4 | 42.4 | — | 42.4 | — | ||||||||||||||||||||||||
| Stock-based compensation expense |
— | 1.3 | — | — | 1.3 | — | 1.3 | — | ||||||||||||||||||||||||
| Reorganization and fresh-start accounting |
— | (859.2 | ) | 859.2 | (67.4 | ) | (67.4 | ) | — | (67.4 | ) | — | ||||||||||||||||||||
|
|
|
|||||||||||||||||||||||||||||||
| Balance at June 1, 2010 (Predecessor) |
$ | — | $ | — | $ | — | $ | — | $ | — | $ | — | $ | — | $ | — | ||||||||||||||||
|
|
|
|||||||||||||||||||||||||||||||
| Issuance of Common Stock in connection with emergence from Chapter 11 |
0.3 | 833.3 | — | — | 833.6 | — | 833.6 | — | ||||||||||||||||||||||||
| Issuance of redeemable preferred stock in connection with emergence from Chapter 11 |
— | — | — | — | — | — | — | 5.0 | ||||||||||||||||||||||||
|
|
|
|||||||||||||||||||||||||||||||
| Balance at June 1, 2010 (Successor) |
$ | 0.3 | $ | 833.3 | $ | — | $ | — | $ | 833.6 | $ | — | $ | 833.6 | $ | 5.0 | ||||||||||||||||
| Net income |
— | — | 71.4 | — | 71.4 | — | 71.4 | — | ||||||||||||||||||||||||
| Other comprehensive income |
— | — | — | 26.7 | 26.7 | — | 26.7 | — | ||||||||||||||||||||||||
| Stock-based compensation expense |
— | 4.9 | — | — | 4.9 | — | 4.9 | — | ||||||||||||||||||||||||
| Issuance of Common Stock |
— | 1.2 | — | — | 1.2 | — | 1.2 | — | ||||||||||||||||||||||||
| Other |
— | 0.2 | (0.2 | ) | — | — | — | — | 0.2 | |||||||||||||||||||||||
|
|
|
|||||||||||||||||||||||||||||||
| Balance at December 31, 2010 (Successor) |
$ | 0.3 | $ | 839.6 | $ | 71.2 | $ | 26.7 | $ | 937.8 | $ | — | $ | 937.8 | $ | 5.2 | ||||||||||||||||
| Net income (loss) |
— | — | 161.6 | — | 161.6 | (0.4 | ) | 161.2 | — | |||||||||||||||||||||||
| Other comprehensive (loss) income |
— | — | — | (55.7 | ) | (55.7 | ) | 0.2 | (55.5 | ) | — | |||||||||||||||||||||
| Contributions from noncontrolling interests |
— | — | — | — | — | 7.6 | 7.6 | — | ||||||||||||||||||||||||
| Distributions to noncontrolling interests |
— | — | — | — | — | (1.2 | ) | (1.2 | ) | — | ||||||||||||||||||||||
| Stock-based compensation expense |
— | 10.1 | — | — | 10.1 | — | 10.1 | — | ||||||||||||||||||||||||
| Dividends paid |
— | (287.2 | ) | (212.8 | ) | — | (500.0 | ) | — | (500.0 | ) | (0.2 | ) | |||||||||||||||||||
| Excess tax benefit from stock-based compensation arrangements |
— | 1.6 | — | — | 1.6 | — | 1.6 | — | ||||||||||||||||||||||||
| Other |
— | (0.7 | ) | (0.3 | ) | — | (1.0 | ) | 0.1 | (0.9 | ) | 0.4 | ||||||||||||||||||||
|
|
|
|||||||||||||||||||||||||||||||
| Balance at December 31, 2011 (Successor) |
$ | 0.3 | $ | 563.4 | $ | 19.7 | $ | (29.0 | ) | $ | 554.4 | $ | 6.3 | $ | 560.7 | $ | 5.4 | |||||||||||||||
|
|
||||||||||||||||||||||||||||||||
See Notes to consolidated financial statements.
F-7
Table of Contents
Notes to consolidated financial statements
(in millions, except share and per share data)
1. Basis of presentation
Nature of operations
Aleris Corporation and all of its subsidiaries (collectively, except where the context otherwise requires, referred to as “Aleris,” “we,” “our,” “us,” and the “Company” or similar terms) is a Delaware corporation with its principle executive offices located in Cleveland, Ohio. The principal business of the Company involves the production of aluminum rolled and extruded products as well as the recycling of aluminum and specification alloy manufacturing. We produce aluminum sheet and fabricated products using direct-chill and continuous cast processes. Our aluminum sheet products are sold to customers and distributors serving the aerospace, automotive and other transportation industries, building and construction, containers and packaging and metal distribution industries. Our extruded products are targeted at high demand end-uses in the automotive, building and construction, electrical, mechanical engineering and other transportation (rail and shipbuilding) industries. In addition, we perform value-added fabrication to most of our extruded products. Our aluminum recycling operations consist primarily of purchasing scrap aluminum on the open market, recycling and selling it in molten or ingot form. In addition, these operations recycle customer-owned aluminum scrap for a fee (tolling). Our recycling customers are some of the world’s largest aluminum, steel and automotive companies.
Basis of presentation
The accompanying Consolidated Financial Statements have been prepared in conformity with accounting principles generally accepted in the United States of America. The accompanying Consolidated Financial Statements include the accounts of Aleris and all of its subsidiaries.
The Company (formerly known as Aleris Holding Company) was formed on December 18, 2009 in the State of Delaware in order to acquire the assets and operations of the entity formerly known as Aleris International, Inc. (the “Predecessor”) through the Predecessor’s plan of reorganization. On June 1, 2010 (the “Effective Date”), the Predecessor and most of its wholly owned U.S. subsidiaries and Aleris Deutschland Holding GmbH, a wholly owned German subsidiary, (collectively, “the Debtors”) emerged from bankruptcy proceedings under Chapter 11 of the United States Bankruptcy Code. Pursuant to the First Amended Joint Plan of Reorganization as modified (the “Plan”), the Predecessor transferred all of its assets to subsidiaries of Intermediate Co., a newly formed entity that is wholly owned by the Company and which was subsequently renamed Aleris International, Inc. In exchange for the acquired assets, Aleris International, Inc. contributed shares of our common stock and the Exchangeable Notes (defined in Note 3, “Reorganization under Chapter 11”) to the Predecessor. These instruments were then distributed or sold pursuant to the Plan. See the “Post-emergence capital structure and rights offering” section within Note 3, “Reorganization under Chapter 11.” The Predecessor then changed its name to “Old AII, Inc.” and was dissolved.
For purposes of these Consolidated Financial Statements, the Company has been considered the “Successor” to the Predecessor by virtue of the fact that the Company’s only operations and all of its assets are those of Aleris International, Inc., the direct acquirer of the Predecessor. As a result,
F-8
Table of Contents
Aleris Corporation
Notes to consolidated financial statements (continued)
(in millions, except share and per share data)
the Company’s financial results are presented alongside those of the Predecessor herein. In accordance with the provisions of Financial Accounting Standards Board Accounting Standards Codification (“ASC”) 852, “Reorganizations,” we applied fresh-start accounting upon emergence from the Debtors’ Chapter 11 bankruptcy cases and became a new entity for financial reporting purposes as of June 1, 2010. As a result, the Consolidated Financial Statements of the Successor subsequent to emergence from Chapter 11 are not comparable to the Consolidated Financial Statements of the Predecessor for the reporting entity prior to emergence from Chapter 11.
In addition, ASC 852 requires that financial statements, for periods including and subsequent to a Chapter 11 bankruptcy filing, distinguish between transactions and events that are directly associated with the reorganization proceedings and the ongoing operations of the business, as well as additional disclosures. The “Company,” “Aleris Corporation,” “we,” “our” or similar terms when used in reference to the period subsequent to the emergence from Chapter 11 bankruptcy proceedings, refers to the Successor, and when used in reference to periods prior to the emergence from Chapter 11, refers to the Predecessor.
The consolidated financial statements for the year ended December 31, 2009 and the five months ended May 31, 2010 have been presented to reflect the financial results of the Old AII, Inc. The results of the bankruptcy proceedings and reorganization have been presented as results of the Predecessor. The financial statements for the seven months ended December 31, 2010 and the year ended December 31, 2011 have been presented to reflect the financial results of Aleris Corporation subsequent to the bankruptcy proceedings and reorganization, and have been presented as results of the Successor.
Management evaluated all activity of the Company through February 29, 2012 (the date the Consolidated Financial Statements were available to be issued) and concluded that no subsequent events have occurred that would require recognition in the Consolidated Financial Statements or disclosure in the Notes to the Consolidated Financial Statements.
2. Summary of significant accounting policies
Use of accounting estimates
The Consolidated Financial Statements are prepared in conformity with accounting principles generally accepted in the United States of America and require management to make estimates and assumptions that affect the reported amounts of assets and liabilities, the disclosure of contingent assets and liabilities at the date of the financial statements and the reported amounts of revenues and expenses during the reporting period. Actual results could differ from those estimates. Our most significant estimates relate to the valuation of derivatives, property, plant and equipment, intangible assets, the assumptions used to estimate the fair value of share-based payments, pension and postretirement benefit obligations, workers’ compensation, medical and environmental liabilities, deferred tax asset valuation allowances, reserves for uncertain tax positions and allowances for uncollectible accounts receivable.
F-9
Table of Contents
Aleris Corporation
Notes to consolidated financial statements (continued)
(in millions, except share and per share data)
Principles of consolidation
The accompanying Consolidated Financial Statements include the accounts of the Company and our majority owned subsidiaries. All significant intercompany accounts and transactions have been eliminated upon consolidation. On October 19, 2010, Aleris International, Inc. signed a joint venture agreement with Zhenjiang Dingsheng Aluminum Industries Joint-Stock Co., Ltd. and subsequently broke ground for the construction of an aluminum rolling mill in Zhenjiang City, Jiangsu Province in China that will produce semi-finished rolled aluminum products. Aleris International, Inc. is an 81% owner in the venture (the “China Joint Venture”) and, as a result, we have included the operating results and financial condition of this entity in the Consolidated Financial Statements.
Business combinations
All business combinations are accounted for using the acquisition method as prescribed by ASC 805, “Business Combinations.” The purchase price paid is allocated to the assets acquired and liabilities assumed based on their estimated fair values. Any excess purchase price over the fair value of the net assets acquired is recorded as goodwill.
Revenue recognition and shipping and handling costs
Revenues are recognized when title transfers and risk of loss passes to the customer in accordance with the provisions of the Securities and Exchange Commission (“SEC”) Staff Accounting Bulletin (“SAB”) No. 104, “Revenue Recognition.” In the case of rolled aluminum product, title and risk of loss do not typically pass until the product reaches the customer, although on certain overseas shipments, title and risk of loss pass upon loading at the port of departure or unloading at the port of entry. For material that is tolled, revenue is recognized upon the performance of the tolling services for customers. For material that is consigned, revenue is not recognized until the product is used by the customer. Shipping and handling costs are included within “Cost of sales” in the Consolidated statements of operations.
Cash equivalents
All highly liquid investments with a maturity of three months or less when purchased are considered cash equivalents. The carrying amount of cash equivalents approximates fair value because of the short maturity of those instruments.
F-10
Table of Contents
Aleris Corporation
Notes to consolidated financial statements (continued)
(in millions, except share and per share data)
Accounts receivable allowances and credit risk
We extend credit to our customers based on an evaluation of their financial condition; generally, collateral is not required. Substantially all of the accounts receivable associated with our European operations are insured against loss by third party credit insurers. We maintain an allowance against our accounts receivable for the estimated probable losses on uncollectible accounts and sales returns and allowances. The valuation reserve is based upon our historical loss experience, current economic conditions within the industries we serve as well as our determination of the specific risk related to certain customers. Accounts receivable are charged off against the reserve when, in management’s estimation, further collection efforts would not result in a reasonable likelihood of receipt, or, if later, as proscribed by statutory regulations. As a result of the application of fresh-start accounting, on the Effective Date all of our accounts receivable were adjusted from their historical amounts to fair value and all related allowances were eliminated. The movement of the accounts receivable allowances is as follows:
| (Successor) | (Predecessor) | |||||||||||||||||
| For the year ended |
For the seven months ended December 31, 2010 |
For the five months ended May 31, 2010 |
For the year ended |
|||||||||||||||
| Balance at beginning of |
$ | 8.7 | $ | — | $ | 16.7 | $ | 25.2 | ||||||||||
| Expenses for |
57.6 | 40.2 | 20.5 | 28.8 | ||||||||||||||
| Receivables written off |
(57.6 | ) | (31.5 | ) | (23.1 | ) | (37.3 | ) | ||||||||||
| Balance at end of the |
$ | 8.7 | $ | 8.7 | $ | 14.1 | $ | 16.7 | ||||||||||
Concentration of credit risk with respect to trade accounts receivable is limited due to the large number of customers in various industry segments comprising our customer base. No single customer accounted for more than 10% of consolidated revenues during the year ended December 31, 2011, the seven months ended December 31, 2010, the five months ended May 31, 2010, or the year ended December 31, 2009.
Inventories
Our inventories are stated at the lower of cost or net realizable value. Cost is determined primarily on the average cost or specific identification method and includes material, labor and overhead related to the manufacturing process. As a result of the application of fresh-start accounting, on the Effective Date our inventories were adjusted from their historical costs to fair
F-11
Table of Contents
Aleris Corporation
Notes to consolidated financial statements (continued)
(in millions, except share and per share data)
value. This resulted in an increase of approximately $33.0 which has been recognized as additional cost of sales in the seven months ended December 31, 2010. For further information regarding the application of fresh-start accounting, see Note 4, “Fresh-start accounting.” The cost of inventories acquired in business combinations are recorded at fair value in accordance with ASC 805.
Property, plant and equipment
Property, plant and equipment is stated at cost, net of asset impairments. As a result of the application of fresh-start accounting, all of our property, plant and equipment was adjusted to fair value on the Effective Date. For further information regarding the application of fresh-start accounting, see Note 4, “Fresh-start accounting.” The cost of property, plant and equipment acquired in material business combinations represents the fair value of the acquired assets at the time of acquisition.
The fair value of asset retirement obligations is capitalized to the related long-lived asset at the time the obligation is incurred and is depreciated over the remaining useful life of the related asset. Major renewals and improvements that extend an asset’s useful life are capitalized to property, plant and equipment. Major repair and maintenance projects, including the relining of our furnaces and reconditioning of our rolling mills, are expensed over periods not exceeding 18 months while normal maintenance and repairs are expensed as incurred. Depreciation is primarily computed using the straight-line method over the estimated useful lives of the related assets, as follows:
| Buildings and improvements |
5 - 33 years | |||
| Production equipment and machinery |
2 - 25 years | |||
| Office furniture, equipment and other |
3 - 10 years | |||
|
|
||||
The construction costs of landfills used to store by-products of the recycling process are depreciated as space in the landfills is used based on the unit of production method. Additionally, used space in the landfill is determined periodically either by aerial photography or engineering estimates.
Interest is capitalized in connection with major construction projects. Capitalized interest costs are as follows:
| (Successor) | (Predecessor) | |||||||||||||||||
| For the year ended |
For the seven months ended December 31, 2010 |
For the five months ended May 31, 2010 |
For the year ended |
|||||||||||||||
| Capitalized interest |
$ | 2.0 | $ | 0.1 | $ | 0.2 | $ | 0.7 | ||||||||||
Intangible assets
Intangible assets are primarily related to trade names, technology and customer relationships. As a result of the application of fresh-start accounting, our intangible assets were recorded at fair
F-12
Table of Contents
Aleris Corporation
Notes to consolidated financial statements (continued)
(in millions, except share and per share data)
value on the Effective Date. Acquired intangible assets are recorded at their estimated fair value in the allocation of the purchase price paid. Intangibles with indefinite useful lives are not amortized and intangibles with finite useful lives are amortized over their estimated useful lives, ranging from 15 to 25 years. See Note 8, “Other intangible assets,” for additional information.
Impairment of property, plant, equipment and finite-lived intangible assets
We review our long-lived assets for impairment when changes in circumstances indicate that the carrying amount may not be recoverable. Once an impairment indicator has been identified, the asset impairment test is a two-step process. The first step consists of determining whether the sum of the estimated undiscounted future cash flows attributable to the specific asset being tested is less than its carrying value. Estimated future cash flows used to test for recoverability include only the future cash flows that are directly associated with and are expected to arise as a direct result of the use and eventual disposition of the relevant asset. If the carrying value of the asset exceeds the future undiscounted cash flows expected from the asset, a second step is performed to compute the extent of the impairment. Impairment charges are determined as the amount by which the carrying value of the asset exceeds the estimated fair value of the asset.
As outlined in ASC 820, “Fair Value Measurements and Disclosures,” the fair value measurement of our long-lived assets assumes the highest and best use of the asset by market participants, considering the use of the asset that is physically possible, legally permissible, and financially feasible at the measurement date. Highest and best use is determined based on the use of the asset by market participants, even if the intended use of the asset by the Company is different. The highest and best use of an asset establishes the valuation premise. The valuation premise is used to measure the fair value of an asset. ASC 820-10-35-10 states that the valuation premise of an asset is either of the following:
| • | In-use: The highest and best use of the asset is in-use if the asset would provide maximum value to market participants principally through its use in combination with other assets as a group (as installed or otherwise configured for use). |
| • | In-exchange: The highest and best use of the asset is in-exchange if the asset would provide maximum value to market participants principally on a stand-alone basis. |
Once a premise is selected, the approaches considered in the estimation of the fair values of the Company’s long-lived assets tested for impairment, which represent level 3 measurements within the fair value hierarchy, include the following:
| • | Income approach: The income approach measures the value of an asset by estimating the present value of its future economic benefits. These benefits include earnings, cost savings, tax deductions, and proceeds from disposition. Value indications are developed using this technique by discounting expected cash flows to their present value at a rate of return that incorporates the risk-free rate for the use of funds, the expected rate of inflation, and the risk associated with the asset. |
F-13
Table of Contents
Aleris Corporation
Notes to consolidated financial statements (continued)
(in millions, except share and per share data)
| • | Sales comparison approach: The sales comparison approach takes into account arm’s-length exchange prices in actual transactions, through an analysis of recent sales of comparable property and of asking prices for assets currently offered for sale. This process involves comparison and correlation between the subject asset and other comparable assets. Adjustments are then made to reflect differences in location, time and terms of sale, and physical and functional characteristics between the subject asset and the comparable assets to indicate a fair value of the subject asset. |
| • | Cost approach: The cost approach uses the concept of replacement cost as an indicator of value. The premise of this approach is that a prudent investor would typically pay no more for an asset than the amount for which the asset could be replaced. Adjustments are then made to reflect the losses in value resulting from physical deterioration and functional and economic obsolescence. In applying the cost approach to the valuation of tangible assets, the Company typically starts with either an estimate of the cost of reproduction new or an estimate of replacement cost new. Additional adjustments are necessary to account for other forms of depreciation resulting from physical deterioration, functional obsolescence (inefficiencies or inadequacies of the property itself when compared to a more efficient or less costly replacement properties), and economic obsolescence. Economic obsolescence is the loss in value or usefulness of a property caused by factors external to the property, such as increased costs of raw materials, labor, or utilities (without offsetting increases in product prices); reduced demand for the product; increased competition; environmental or other regulations; inflation or high interest rates or similar factors. |
During 2011, no indicators of impairment were identified in accordance with ASC 360, “Property, Plant, and Equipment.” In the fourth quarter of 2009, several indicators of impairment were identified including the finalization of the forecast model developed by the Company and its financial advisors to determine the initial plan of reorganization value. The results of the forecast identified a deficiency in the fair value of the business as a whole compared to its carrying value, and therefore, we determined that the associated long-lived assets were required to be tested for impairment. These impairment tests resulted in the Company recording impairment charges totaling $672.4 related to property, plant and equipment and $29.9 related to finite-lived intangible assets in the Rolled Products Europe (“RPEU”), Extrusions, Recycling and Specification Alloys Europe (“RSEU”) and Recycling and Specification Alloys North America (“RSAA”) operating segments in the fourth quarter of 2009. No impairments were necessary for the Rolled Products North America (“RPNA”) segment as the undiscounted cash flows exceeded the carrying amount of this asset group. We conducted our analysis under the premise of fair value in-exchange. An analysis of the earnings capability of the related assets for RPEU, Extrusions, RSAA and RSEU indicated that there would not be sufficient cash flows available to justify investment in the assets under a fair value in-use premise. See Note 5, “Restructuring and impairment charges,” for additional information.
F-14
Table of Contents
Aleris Corporation
Notes to consolidated financial statements (continued)
(in millions, except share and per share data)
Indefinite-lived intangible assets
Indefinite-lived intangible assets are tested for impairment as of October 1st of each year and may be tested more frequently if changes in circumstances or the occurrence of events indicates that a potential impairment exists. The application of fresh-start accounting eliminated all of our goodwill on the Effective Date.
Under ASC 350, “Intangibles—Goodwill and Other,” intangible assets determined to have indefinite lives are not amortized, but are tested for impairment at least annually. As part of the annual impairment test, the non-amortized intangible assets are reviewed to determine if the indefinite status remains appropriate. Based on the annual test performed as of October 1, 2011, no impairments relating to our indefinite lived intangible assets were necessary.
In the fourth quarter of 2009, based on the estimated fair values of assets and liabilities as of October 1, 2009, we recorded impairment charges totaling $40.4 related to goodwill and $26.5 related to other indefinite-lived intangible assets. In addition, we recorded impairment charges totaling $19.2 related to indefinite-lived intangible assets in the first quarter of 2009. See Note 5, “Restructuring and impairment charges,” for additional information.
Deferred financing costs
The costs related to the issuance of debt are capitalized and amortized over the terms of the related debt agreements as interest expense using the effective interest method.
Research and development
In connection with our acquisition of the downstream business of Corus Group plc (“Corus Aluminum”) in 2006, we entered into a research and development agreement with Corus Group plc (and subsequently with its successor, Tata Steel) pursuant to which Tata Steel assisted us in research and development projects on a fee-for-service basis. This agreement was terminated in the third quarter of 2011. Excluding $11.9 of contract termination costs recorded in “Selling, general and administrative expenses” in the Consolidated statements of operations during the third quarter of 2011, research and development expenses were $16.3, $10.6, $6.0 and $18.2 for the year ended December 31, 2011, the seven months ended December 31, 2010, the five months ended May 31, 2010 and the year ended December 31, 2009, respectively.
Stock-based compensation
We recognize compensation expense for stock options, restricted stock units and restricted shares under the provisions of ASC 718, “Compensation—Stock Compensation,” using the non-substantive vesting period approach, in which the expense (net of estimated forfeitures) is recognized ratably over the requisite service period based on the grant date fair value. The fair value of each new stock option is estimated on the date of grant using a Black-Scholes model. Determining the fair value of stock options at the grant date requires judgment, including estimates for the average risk-free interest rate, dividend yield, volatility, annual forfeiture rate, and exercise behavior. The fair value of Aleris Corporation restricted stock units and restricted
F-15
Table of Contents
Aleris Corporation
Notes to consolidated financial statements (continued)
(in millions, except share and per share data)
shares are based on the estimated fair value of Aleris Corporation common stock on the date of grant. The fair value of Aleris Corporation common stock is estimated based upon a present value technique using discounted cash flows, forecasted over a five-year period with residual growth rates thereafter and a market comparable approach. From these two approaches, the comparable public company analysis is weighted at 50% and the discounted cash flow analysis is weighted at 50%.
The discounted cash flow analysis is based on our projected financial information which includes a variety of estimates and assumptions. While we consider such estimates and assumptions reasonable, they are inherently subject to uncertainties and a wide variety of significant business, economic and competitive risks, many of which are beyond our control and may not materialize. Changes in these estimates and assumptions may have a significant effect on the determination of the fair value of Aleris Corporation common stock.
The discounted cash flow analysis is based on production volume projections developed by internal forecasts, as well as commercial, wage and benefit and inflation assumptions. The discounted cash flow analysis includes the sum of (i) the present value of the projected unlevered cash flows through December 31, 2016 (the “Projection Period”); and (ii) the present value of a terminal value, which represents the estimate of value attributable to periods beyond the Projection Period. All cash flows are discounted using a weighted-average cost of capital (“WACC”) percentage ranging from 12.0% to 13.0%. To calculate the terminal value, a perpetuity growth rate approach is used. A growth rate of three percent is used and was determined based on research of long-term aluminum demand growth rates. Other significant assumptions include future capital expenditures and changes in working capital requirements.
The comparable public company analysis identifies a group of comparable companies giving consideration to, among other relevant characteristics, similar lines of business, business risks, growth prospects, business maturity, market presence, and size and scale of operations. The analysis compares the public market implied fair value for each comparable public company to its projected net sales, earnings before interest and taxes (“EBIT”) and earnings before interest, taxes, depreciation and amortization (“EBITDA”). The calculated range of multiples for the comparable companies is used to estimate a range of 4.5x to 10.5x, 3.5x to 7.0x and .30x to .50x, which is applied to our projected EBIT, EBITDA and net sales, respectively, to determine a range of fair values.
Total stock-based compensation expense included in “Selling, general and administrative expenses” in the Consolidated statements of operations for the year ended December 31, 2011, the seven months ended December 31, 2010, the five months ended May 31, 2010 and the year ended December 31, 2009 was $10.1, $4.9, $1.3 and $2.1, respectively.
Derivatives and hedging
We are engaged in activities that expose us to various market risks, including changes in the prices of primary aluminum, aluminum alloys, scrap aluminum, copper, zinc and natural gas, as well as changes in currency and interest rates. Certain of these financial exposures are managed
F-16
Table of Contents
Aleris Corporation
Notes to consolidated financial statements (continued)
(in millions, except share and per share data)
as an integral part of our risk management program, which seeks to reduce the potentially adverse effects that the volatility of the markets may have on operating results. We do not hold or issue derivative financial instruments for trading purposes. We maintain a natural gas pricing strategy to minimize significant fluctuations in earnings caused by the volatility of gas prices. We also manage our exposure to currency fluctuations for certain contracts to purchase equipment for our China Joint Venture that are denominated in euros while our source of funding is the U.S. dollar and Renminbi denominated China Loan Facility, as defined in Note 11, “Long-term debt.” Our metal pricing strategy is designed to minimize significant, unanticipated fluctuations in earnings caused by the volatility of aluminum prices. Prior to the Chapter 11 Petitions (defined below), we maintained a currency hedging strategy to reduce the impact of fluctuations in currency rates related to purchases and sales of aluminum to be made in currencies other than our functional currencies. From time to time, we would also enter into interest rate swaps or similar agreements to manage exposure to fluctuations in interest rates on our long-term debt.
Generally, we enter into master netting arrangements with our counterparties and offset net derivative positions with the same counterparties against amounts recognized for the right to reclaim cash collateral or the obligation to return cash collateral under those arrangements in our Consolidated balance sheet. For classification purposes, we record the net fair value of all positions expected to settle in less than one year with these counterparties as a net current asset or liability and all long-term positions as a net long-term asset or liability. At December 31, 2011 and 2010, we had posted cash collateral totaling approximately $0.5 and $3.6, respectively, of which $0.3 and $3.6, respectively, related to counterparties in a net asset position and, therefore, was recorded within “Prepaid expenses and other current assets” on the Consolidated balance sheet.
The fair values of our derivative financial instruments are recognized as assets or liabilities at the balance sheet date. Fair values for our metal and natural gas derivative instruments are determined based on the differences between contractual and forward rates of identical hedge positions as of the balance sheet date. Our currency derivative instruments are valued utilizing observable or market-corroborated inputs such as exchange rates, volatility and forward yield curves. In accordance with the requirements of ASC 820, we have included an estimate of the risk associated with non-performance by either ourselves or our counterparties in developing these fair values. See Note 14, “Derivative and other financial instruments,” for additional information.
The Company does not currently account for its derivative financial instruments as hedges. The changes in fair value of derivative financial instruments that are not accounted for as hedges and the associated gains and losses realized upon settlement are recorded in “(Gains) losses on derivative financial instruments” in the Consolidated statements of operations. All realized gains and losses are included within “Net cash provided (used) by operating activities” in the Consolidated statements of cash flows.
We are exposed to losses in the event of non-performance by counterparties to derivative contracts. Counterparties are evaluated for creditworthiness and a risk assessment is completed prior to our initiating contract activities. The counterparties’ creditworthiness is then monitored on an ongoing basis, and credit levels are reviewed to ensure there is not an inappropriate
F-17
Table of Contents
Aleris Corporation
Notes to consolidated financial statements (continued)
(in millions, except share and per share data)
concentration of credit outstanding to any particular counterparty. Although non-performance by counterparties is possible, we do not currently anticipate non-performance by any of these parties. At December 31, 2011, substantially all of our derivative financial instruments are maintained with seven counterparties. We have the right to require cash collateral from our counterparties based on the fair value of the underlying derivative financial instruments.
Currency translation
The majority of our international subsidiaries use the local currency as their functional currency. We translate substantially all of the amounts included in our Consolidated statements of operations from our international subsidiaries into U.S. dollars at average monthly exchange rates, which we believe are representative of the actual exchange rates on the dates of the transactions. Impairments of long-lived assets evaluated as of a specific date are translated into U.S. dollars using exchange rates corresponding to the evaluation date. Adjustments resulting from the translation of the assets and liabilities of our international operations into U.S. dollars at the balance sheet date exchange rates are reflected as a separate component of stockholders’ equity. Current intercompany accounts and transactional gains and (losses) associated with receivables, payables and debt denominated in currencies other than the functional currency are included within “Other (income) expense, net” in the Consolidated statements of operations. Currency translation adjustments accumulate in consolidated equity until the disposition or liquidation of the international entities. On the Effective Date, the application of fresh-start accounting eliminated all currency translation adjustments accumulated in equity. The translation of accounts receivables, payables and debt denominated in currencies other than the functional currencies resulted in transactional (gains) losses of $(2.1), $(4.3), $33.2 and $13.0, for the year ended December 31, 2011, the seven months ended December 31, 2010, the five months ended May 31, 2010, and the year ended December 31, 2009, respectively. In addition, in 2009 the liquidation of Aleris Aluminum Canada S.E.C./Aleris Aluminum Canada, L.P. (“Canada LP”) resulted in $4.1 of translation gains being eliminated from other comprehensive income and recorded as a gain in “Reorganization items, net” in the Consolidated statements of operations.
Income taxes
We account for income taxes using the asset and liability method, whereby deferred income taxes reflect the tax effect of temporary differences between the carrying amount of assets and liabilities for financial reporting purposes and the amounts used for income tax purposes. In valuing deferred tax assets, we use judgment in determining if it is more likely than not that some portion or all of a deferred tax asset will not be realized and the amount of the required valuation allowance.
Tax benefits from uncertain tax positions are recognized in the financial statements when it is more likely than not that the position is sustainable, based solely on its technical merits and considerations of the relevant taxing authority, widely understood practices and precedents. We recognize interest and penalties related to uncertain tax positions within the “(Benefit from) provision for income taxes” in the Consolidated Statements of Operations.
F-18
Table of Contents
Aleris Corporation
Notes to consolidated financial statements (continued)
(in millions, except share and per share data)
Environmental and asset retirement obligations
Environmental obligations that are not legal or contractual asset retirement obligations and that relate to existing conditions caused by past operations with no benefit to future operations are expensed while expenditures that extend the life, increase the capacity or improve the safety of an asset or that mitigate or prevent future environmental contamination are capitalized in property, plant and equipment. Obligations are recorded when their incurrence is probable and the associated costs can be reasonably estimated in accordance with ASC 410-30, “Environmental Obligations.” While our accruals are based on management’s current best estimate of the future costs of remedial action, these liabilities can change substantially due to factors such as the nature and extent of contamination, changes in the required remedial actions and technological advancements. Our existing environmental liabilities are not discounted to their present values as the amount and timing of the expenditures are not fixed or reliably determinable.
Asset retirement obligations represent obligations associated with the retirement of tangible long-lived assets. Our asset retirement obligations relate primarily to the requirement to cap our three landfills, as well as costs related to the future removal of asbestos and costs to remove underground storage tanks. The costs associated with such legal obligations are accounted for under the provisions of ASC 410-20, “Asset Retirement Obligations,” which requires that the fair value of a liability for an asset retirement obligation be recognized in the period in which it is incurred and capitalized as part of the carrying amount of the long-lived asset. These fair values are based upon the present value of the future cash flows expected to be incurred to satisfy the obligation. Determining the fair value of asset retirement obligations requires judgment, including estimates of the credit adjusted interest rate and estimates of future cash flows. Estimates of future cash flows are obtained primarily from engineering consulting firms. The present value of the obligations is accreted over time while the capitalized cost is depreciated over the useful life of the related asset. As a result of the application of fresh-start accounting, all of our asset retirement obligations were adjusted to fair value on the Effective Date.
Retirement, early retirement and postemployment benefits
Our defined benefit pension and other postretirement benefit plans are accounted for in accordance with ASC 715, “Compensation—Retirement Benefits.”
Pension and postretirement benefit obligations are actuarially calculated using management’s best estimates of assumptions which include the expected return on plan assets, the rate at which plan liabilities may be effectively settled (discount rate), health care cost trend rates and rates of compensation increases.
Benefits provided to employees after employment but prior to retirement are accounted for under ASC 712, “Compensation—Nonretirement Postemployment Benefits.” Such postemployment benefits include severance and medical continuation benefits that are offered pursuant to an ongoing benefit arrangement and do not represent a one-time benefit termination arrangement. Under ASC 712, liabilities for postemployment benefits are recorded at the time the obligations are probable of being incurred and can be reasonably estimated. This is
F-19
Table of Contents
Aleris Corporation
Notes to consolidated financial statements (continued)
(in millions, except share and per share data)
typically at the time a triggering event occurs, such as the decision by management to close a facility. Benefits related to the relocation of employees and certain other termination benefits are accounted for under ASC 420, “Exit or Disposal Cost Obligations,” and are expensed over the required service period.
General guarantees and indemnifications
It is common in long-term processing agreements for us to agree to indemnify customers for tort liabilities that arise out of, or relate to, the processing of their material. Additionally, we typically indemnify such parties for certain environmental liabilities that arise out of or relate to the processing of their material.
In our equipment financing agreements, we typically indemnify the financing parties, trustees acting on their behalf and other related parties against liabilities that arise from the manufacture, design, ownership, financing, use, operation and maintenance of the equipment and for tort liability, whether or not these liabilities arise out of or relate to the negligence of these indemnified parties, except for their gross negligence or willful misconduct.
We expect that we would be covered by insurance (subject to deductibles) for most tort liabilities and related indemnities described above with respect to equipment we lease and material we process.
Although we cannot estimate the potential amount of future payments under the foregoing indemnities and agreements, we are not aware of any events or actions that will require payment.
New accounting pronouncement
In June 2011, the FASB issued ASU 2011-05, “Comprehensive Income (Topic 220), Presentation of Comprehensive Income,” which requires companies to present the total of comprehensive income, the components of net income, and the components of other comprehensive income either in a single continuous statement of comprehensive income or in two separate but consecutive statements. While ASU 2011-05 changes the presentation of comprehensive income, there are no changes to the components that are recognized in net income or other comprehensive income under current accounting guidance. In December 2011, the FASB issued ASU 2011-12, “Comprehensive Income (Topic 220), Deferral of the Effective Date for Amendments to the Presentation of Reclassifications of Items Out of Accumulated Other Comprehensive Income in ASU 2011-05,” to defer the effective date of the specific requirement to present items that are reclassified out of accumulated other comprehensive income to net income alongside their respective components of net income and other comprehensive income. ASU 2011-05 and ASU 2011-12 are effective for interim and annual periods beginning after December 15, 2011, with early adoption permitted. We have elected to early adopt this new guidance and have presented total comprehensive income, the components of net income and the components of other comprehensive income in two separate but consecutive statements included in these Consolidated Financial Statements. The adoption of this new guidance did not have a significant impact on our consolidated financial statements.
F-20
Table of Contents
Aleris Corporation
Notes to consolidated financial statements (continued)
(in millions, except share and per share data)
3. Reorganization under chapter 11
In the year prior to the U.S. Debtors (as defined below) filing for protection under Chapter 11 on February 12, 2009 (the “Petition Date”), each of our major end-use industries experienced significant declines in demand due to the global recession and financial crisis. Specifically, the North American building and construction industries, U.S. and European automotive and transportation industries, and general industrial activity experienced demand declines. Because of major cutbacks in these sectors, the aluminum industry and the Predecessor were subjected to a significant economic downturn characterized by a marked decrease in demand. In addition, many users of aluminum rolled and extruded products had significant inventory on hand when the economic decline occurred, which intensified the impact of the volume declines as the customer base had to de-stock inventory levels to adjust to lower demand levels. Decreased demand, coupled with a surplus of aluminum supply across the industry, increased the Predecessor’s exposure to commodity price fluctuations, adversely affected hedging positions, reduced profitability in a changing metals price environment, and subjected earnings to greater volatility from period to period. Much of the decrease in demand was attributable to customer shutdowns and/or large-scale cutbacks, particularly in the residential construction and automotive sectors.
All of these factors, coupled with a highly leveraged capital structure, which required the payment of a substantial amount of interest and principal on prepetition credit facilities, contributed to a severe loss of liquidity prior to the Petition Date for the U.S. Debtors. In the six months prior to the Petition Date, the borrowing base under the prepetition ABL facility declined by over 50%. As a result, the amount outstanding under the prepetition ABL facility (including outstanding letters of credit) exceeded the borrowing base. This “overadvance” position prohibited the Predecessor from funding our working capital needs through draws under the prepetition ABL facility. The Debtors were required to repay amounts outstanding under the prepetition ABL facility so that the outstanding amounts no longer exceeded the borrowing base. Without access to additional financing, the Predecessor did not have liquidity sufficient to repay the overadvance and continue funding its operations.
Due to these factors, the Predecessor decided to seek Chapter 11 bankruptcy protection to restructure its operations and financial position. On the Petition Date, the Predecessor and most of its wholly owned U.S. subsidiaries (collectively, the “U.S. Debtors”) filed voluntary petitions for relief under Chapter 11 (collectively, the “Chapter 11 Petitions”) of the Bankruptcy Code in the United States Bankruptcy Court, District of Delaware (the “Bankruptcy Court”) and Aleris Deutschland Holding GmbH (“ADH”), a wholly owned German subsidiary, filed a voluntary petition on February 5, 2010. The cases of the U.S. Debtors and ADH (collectively, the “Debtors”) (the “Bankruptcy Cases”) have been jointly administered under Aleris International, Inc., Case No. 09-10478 (BLS). Certain of our U.S. subsidiaries and all of our international operations (with the exception of ADH) were not part of the Chapter 11 filings.
On February 5, 2010, the Debtors filed a joint plan of reorganization in the Bankruptcy Cases and a related Disclosure Statement for the Plan of Aleris International, Inc. and its Debtors (the “Disclosure Statement”) with the Bankruptcy Court. On March 12, 2010, the Bankruptcy Court
F-21
Table of Contents
Aleris Corporation
Notes to consolidated financial statements (continued)
(in millions, except share and per share data)
approved the Disclosure Statement and authorized the Debtors to begin soliciting votes from their creditors to accept or reject the Plan. On May 13, 2010, the Bankruptcy Court entered an order confirming the Plan. On the Effective Date, the Debtors consummated the reorganization contemplated by the Plan and emerged from Chapter 11.
Post-emergence capital structure and rights offering
Following the Effective Date, our capital structure consisted of the following:
| • | ABL Facility—A $500.0 revolving credit facility (the “ABL Facility”), subsequently amended and restated to, among other things, increase to $600.0 on June 30, 2011. We incurred fees totaling $16.2 associated with the ABL Facility. These costs have been capitalized and reported in “Other long-term assets” and are being amortized to “Interest expense, net” over the term of the facility. See Note 11, “Long-term debt,” for further discussion. |
| • | Senior Subordinated Exchangeable Notes—$45.0 aggregate principal amount of 6.0% notes (the “Exchangeable Notes”) issued by Aleris International, Inc. See Note 11, “Long-term debt” for further discussion. |
| • | Redeemable Preferred Stock—5,000 shares of Aleris International, Inc. Series A exchangeable preferred stock (the “Redeemable Preferred Stock”) with a liquidation preference of one thousand dollars per share and a par value of $0.01 per share. The Redeemable Preferred Stock accrues dividends at 8.0% per annum (payable semi-annually on January 15 and July 15 if and when declared by the Board of Directors). All shares of Redeemable Preferred Stock were issued on the Effective Date to the Backstop Parties (as defined below) in exchange for $5.0. The Redeemable Preferred Stock is subject to mandatory redemption on the fifth anniversary of the Effective Date, or June 1, 2015, and is exchangeable, at the holder’s option, at any time after June 1, 2013 but prior to redemption, into our common stock on an initial per share dollar exchange ratio of $32.74 per share ($23.30 at December 31, 2011), subject to adjustment. The Redeemable Preferred Stock can also be exchanged immediately prior to an initial public offering or upon the occurrence of a fundamental change. The Redeemable Preferred Stock is classified as temporary equity because its terms include a mandatory redemption feature on a fixed date for a fixed price. |
| • | Common Stock—A single class of common stock, par value $0.01 per share, 45,000,000 shares authorized, 30,877,371 shares issued (the “Common Stock”). |
| • | Preferred Stock—A single class of preferred stock, par value $0.01 per share, 1,000,000 shares authorized, none issued (the “Preferred Stock”). |
The Bankruptcy Court confirmed $297.6 as the equity value of the Predecessor before giving effect to any value ascribed to the rights offering (the “Plan Value”). The Plan provided for three classes of creditors to whom Plan Value would be distributed—the U.S. Roll-Up Term Loan Claims, the European Roll-Up Term Loan Claims, and the European Term Loan Claims (collectively the “Term Loan Participants”). Under the terms of the Plan, Term Loan Participants had the right to
F-22
Table of Contents
Aleris Corporation
Notes to consolidated financial statements (continued)
(in millions, except share and per share data)
elect to receive (a) cash equal to their pro rata share of the portion of the Plan Value allocable to their class or (b) (i) an amount of Common Stock equivalent to such creditor’s pro rata share of the Plan Value allocable to its class and (ii) subscription rights to participate in the rights offering. On the Effective Date, $5.1 was paid to Term Loan Participants that elected to receive cash, and 9,828,196 shares of Common Stock were issued in satisfaction of the residual Plan Value of $292.5, representing an issuance price of $29.76 per share.
Under the terms of the Plan, the Predecessor also effectuated a rights offering whereby certain participants were entitled, via their subscription rights, to purchase Common Stock at a discount of 10% to the Plan Value issuance share price and Exchangeable Notes. On the Effective Date, 21,049,175 shares of Common Stock were sold at $26.78 per share resulting in cash proceeds of $563.6. In conjunction with the rights offering, three of the Debtors’ largest lenders, Oaktree Capital Management, L.P., on behalf of its affiliated investment funds, certain investment funds managed by affiliates of Apollo Management Holdings, L.P., and Sankaty Advisors, LLC, on behalf of the investment funds advised by it (collectively, the “Backstop Parties”), entered into an equity commitment agreement, pursuant to which the Backstop Parties agreed to backstop the rights offering. The Backstop Parties received a fee of $23.7 of which $22.5 and $1.2 has been accounted for as an issuance discount against the Common Stock and Exchangeable Notes, respectively.
On the Effective Date and immediately prior to emergence, we contributed the shares to be sold in the rights offering and the shares to be issued to the Term Loan Participants to the Successor in exchange for 100 shares of Aleris International, Inc. common stock.
Satisfaction of DIP agreement
To fund its global operations during the restructuring, the Predecessor secured $1,075.0 of debtor-in-possession financing (“DIP Financing”) consisting of (a) a $500.0 equivalent term loan credit agreement ($448.3 plus €40.4) (the “DIP Term Facility”) and (b) a $575.0 asset-backed revolving credit agreement (the “DIP ABL Facility,” together with the DIP Term Facility, the “DIP Credit Facilities”). The DIP Credit Facilities were used to fund the Company’s normal operating and working capital requirements, including employee wages and benefits, supplier payments, and other operating expenses during the reorganization process. On the Effective Date, amounts outstanding under the DIP Credit Facilities totaling $575.5, including accrued interest, were repaid by the Predecessor using proceeds from the rights offering, borrowings from the ABL Facility and available cash.
Cancellation of certain prepetition obligations
Under the Plan, the Predecessor equity, and certain debt and other obligations were cancelled, extinguished and adjusted as follows:
| • | The Predecessor common and preferred stock were extinguished, and no distributions were made to the Predecessor’s stockholder; |
F-23
Table of Contents
Aleris Corporation
Notes to consolidated financial statements (continued)
(in millions, except share and per share data)
| • | Creditors of the U.S. Debtors whose aggregate allowed general unsecured claim was less than ten thousand dollars and certain creditors who elected to be included in this class were grouped into a convenience class and each received 50% of their allowed claim (with a claim limitation not to exceed ten thousand dollars) or $2.8 in the aggregate, subject to adjustment for the resolution of disputed claims; |
| • | Creditors of the U.S. Debtors with general unsecured claims in excess of ten thousand dollars (who did not elect to participate in the convenience class) are entitled to receive their pro rata share of $16.5; and |
| • | Creditors of the U.S. Debtors with allowed other secured claims received 100% of their claim amount. |
For further information regarding the resolution of certain of the Company’s other prepetition liabilities in accordance with the Plan, see Note 4, “Fresh-start accounting.”
4. Fresh-start accounting
As discussed in Note 3, “Reorganization under Chapter 11,” the Debtors emerged from Chapter 11 on June 1, 2010. The Successor applied fresh-start accounting because (i) the reorganization value of the Predecessor’s assets immediately prior to the confirmation of the Plan was less than the total of all postpetition liabilities and allowed claims and (ii) the holder of the Predecessor’s existing voting shares immediately prior to the confirmation of the Plan received less than 50% of the voting shares of the emerging entity. U.S. GAAP requires the application of fresh-start accounting as of the Plan confirmation date, or as of a later date when all material conditions precedent to the Plan’s becoming effective are resolved. This occurred on June 1, 2010 with the execution of the ABL Facility.
Reorganization value
ASC 852 provides for, among other things, a determination of the value to be assigned to the emerging company as of the Effective Date (the “Reorganization Value”). The Disclosure Statement included a range of enterprise values from $925.0 to $1,195.0. The range of values considered by the Bankruptcy Court was determined using comparable public company trading multiples and discounted cash flow valuation methodologies. From these two approaches, the comparable public company analysis produced a range of enterprise values from $935.0 to $1,123.0 and was weighted at 40% and the discounted cash flow analysis produced a range of enterprise values from $919.0 to $1,244.0 and was weighted at 60%. The comparable public company analysis was given less weight due to a lack of directly comparable companies. After negotiations between the debtors, creditors and the Backstop Parties, an enterprise value of approximately $1,012.5 was agreed-upon by the required majority of creditors and approved by the Bankruptcy Court. This value, after deductions as defined in the Plan (primarily the repayment of the DIP credit facilities and associated expenses), established the Plan Value which was distributed to the Term Loan Participants in cash or shares of our common stock in settlement of their secured claims. See Note 3, “Reorganization under Chapter 11.” Plan Value
F-24
Table of Contents
Aleris Corporation
Notes to consolidated financial statements (continued)
(in millions, except share and per share data)
plus the fair value of the securities sold in the rights offering, the Redeemable Preferred Stock issued, amounts borrowed under the ABL Facility upon emergence and other emergence date indebtedness of non-filing subsidiaries comprised the Reorganization Value, which totaled $966.8. See “Fresh-start accounting” below.
The comparable public company analysis identified a group of comparable companies giving consideration to, among other relevant characteristics, similar lines of business, business risks, growth prospects, business maturity, market presence, and size and scale of operations. The analysis compared the public market implied reorganization value for each comparable public company to its projected EBITDA. The calculated range of multiples for the comparable companies was used to estimate a range of 4.5x to 8.0x which was applied to our projected EBITDA to determine a range of reorganization values.
The discounted cash flow analysis was based on our projected financial information which includes a variety of estimates and assumptions. While we consider such estimates and assumptions reasonable, they are inherently subject to uncertainties and a wide variety of significant business, economic and competitive risks, many of which are beyond our control and may not materialize. Changes in these estimates and assumptions may have had a significant effect on the determination of the Reorganization Value.
The discounted cash flow analysis was based on production volume projections developed by both third-party and internal forecasts, as well as commercial, wage and benefit and inflation assumptions. The discounted cash flow analysis includes the sum of (i) the present value of the projected unlevered cash flows through December 31, 2014 (the “Projection Period”); and (ii) the present value of a terminal value, which represents the estimate of value attributable to periods beyond the Projection Period. All cash flows were discounted using a WACC percentage ranging from 11.5% to 14.0%. To calculate the terminal value, a perpetuity growth rate approach and an exit multiple approach were used. Growth rates ranging from 0% to 2% were used in the perpetuity growth rate approach and were determined based on research of long-term aluminum demand growth rates. Exit multiples ranging from 4.0x to 5.0x were applied to the Company’s projected EBITDA in the exit multiples approach. The range of multiples was based on historical trading multiples of comparable companies. Other significant assumptions include future capital expenditures and changes in working capital requirements. Our estimate of Reorganization Value assumes the achievement of the future financial results contemplated in our forecasts, and there can be no assurance that we will realize that value. The estimates and assumptions used are subject to significant uncertainties, many of which are beyond our control, and there is no assurance that anticipated results will be achieved.
Tax implications arising from bankruptcy emergence
Under the Plan, the assets of the Predecessor in the United States were acquired by the Successor in a taxable transaction. As a result, the Successor established a new tax basis in the acquired assets located in the United States equal to the fair market value at the Emergence Date. None of the U.S. tax attributes of the Predecessor transfer to the Successor. Cancellation of indebtedness
F-25
Table of Contents
Aleris Corporation
Notes to consolidated financial statements (continued)
(in millions, except share and per share data)
income (“CODI”) is recognized by the Predecessor upon the discharge of its outstanding indebtedness for an amount of consideration that is less than its adjusted issue price. The Internal Revenue Code of 1986, as amended, provides that a debtor in a bankruptcy case may exclude CODI from taxable income but must reduce certain of its tax attributes by the amount of any CODI realized as a result of the consummation of a plan of reorganization. The amount of CODI realized by a taxpayer is the adjusted issue price of any indebtedness discharged less the sum of (i) the amount of cash paid, (ii) the issue price of any new indebtedness issued and (iii) the fair market value of any other consideration, including equity, issued. As a result of emergence, the tax attributes of the Predecessor were reduced to zero as an offset against the CODI.
Fresh-start accounting
Fresh-start accounting results in a new basis of accounting and reflects the allocation of Reorganization Value to the estimated fair value of the Company’s underlying assets and liabilities. Our estimates of fair value are inherently subject to significant uncertainties and contingencies beyond our reasonable control. Accordingly, there can be no assurance that the estimates, assumptions, valuations, appraisals and financial projections will be realized, and actual results could vary materially.
Reorganization Value was allocated to the assets in conformity with the procedures specified by ASC 805. Liabilities existing as of the Effective Date, other than deferred taxes, were recorded at the present value of amounts expected to be paid using appropriate risk-adjusted interest rates. Deferred taxes were determined in conformity with applicable income tax accounting standards. Predecessor accumulated depreciation, accumulated amortization, retained deficit and accumulated other comprehensive income were eliminated.
F-26
Table of Contents
Aleris Corporation
Notes to consolidated financial statements (continued)
(in millions, except share and per share data)
Adjustments recorded to the Predecessor balance sheet as of June 1, 2010, resulting from the consummation of the Plan and the application of fresh-start accounting, are summarized below:
| Predecessor June 1, 2010 |
Plan of reorganization adjustments(a) |
Fresh-start accounting adjustments(p) |
Successor June 1, 2010 |
|||||||||||||
|
|
||||||||||||||||
| ASSETS | ||||||||||||||||
| Current assets |
||||||||||||||||
| Cash and cash equivalents |
$ | 60.2 | $ | 38.7 | (b) | $ | — | $ | 98.9 | |||||||
| Accounts receivable, net |
468.4 | — | — | 468.4 | ||||||||||||
| Inventories |
522.2 | — | 22.7 | 544.9 | ||||||||||||
| Deferred income taxes |
9.6 | (9.6 | )(c) | — | — | |||||||||||
| Current derivative financial instruments |
6.3 | — | — | 6.3 | ||||||||||||
| Prepaid expenses and other current assets |
53.2 | (7.6 | )(d) | (0.8 | ) | 44.8 | ||||||||||
|
|
|
|||||||||||||||
| Total current assets |
1,119.9 | 21.5 | 21.9 | 1,163.3 | ||||||||||||
| Property, plant and equipment |
465.0 | — | 12.2 | 477.2 | ||||||||||||
| Goodwill |
37.8 | — | (37.8 | ) | — | |||||||||||
| Intangible assets, net |
25.9 | — | 25.1 | 51.0 | ||||||||||||
| Long-term derivative financial instruments |
3.4 | — | — | 3.4 | ||||||||||||
| Deferred income taxes |
24.8 | (14.6 | )(c) | — | 10.2 | |||||||||||
| Other long-term assets |
20.8 | 15.6 | (e) | 0.2 | 36.6 | |||||||||||
|
|
|
|||||||||||||||
| Total assets |
$ | 1,697.6 | $ | 22.5 | $ | 21.6 | $ | 1,741.7 | ||||||||
|
|
|
|||||||||||||||
| LIABILITIES AND STOCKHOLDERS’ (DEFICIT) EQUITY | ||||||||||||||||
| Current liabilities |
||||||||||||||||
| Accounts payable |
$ | 248.1 | $ | — | $ | — | $ | 248.1 | ||||||||
| Accrued liabilities |
177.1 | 13.2 | (f) | (0.8 | ) | 189.5 | ||||||||||
| Deferred income taxes |
25.2 | (14.7 | )(c) | — | 10.5 | |||||||||||
| Current portion of long-term debt |
5.4 | — | — | 5.4 | ||||||||||||
| Debt in default |
5.0 | (5.0 | )(g) | — | — | |||||||||||
| Debtor-in-possession financing |
573.0 | (573.0 | )(g) | — | — | |||||||||||
|
|
|
|||||||||||||||
| Total current liabilities |
1,033.8 | (579.5 | ) | (0.8 | ) | 453.5 | ||||||||||
| Long-term debt |
1.7 | 123.8 | (h) | — | 125.5 | |||||||||||
| Deferred income taxes |
26.8 | (21.1 | )(c) | — | 5.7 | |||||||||||
| Accrued pension benefits |
165.1 | (4.8 | )(i) | 25.0 | 185.3 | |||||||||||
| Accrued postretirement benefits |
44.8 | — | 2.7 | 47.5 | ||||||||||||
| Other long-term liabilities |
84.7 | 0.4 | (j) | 0.5 | 85.6 | |||||||||||
|
|
|
|||||||||||||||
| Total long-term liabilities |
323.1 | 98.3 | 28.2 | 449.6 | ||||||||||||
| Liabilities subject to compromise |
2,530.1 | (2,530.1 | )(k) | — | — | |||||||||||
| Successor redeemable preferred stock |
— | 5.0 | (l) | — | 5.0 | |||||||||||
| Stockholders’ (deficit) equity |
||||||||||||||||
| Successor common stock |
— | — | — | — | ||||||||||||
| Successor additional paid-in capital |
— | 833.6 | (m) | — | 833.6 | |||||||||||
| Predecessor common and preferred stock |
— | — | — | — | ||||||||||||
| Predecessor additional paid-in capital |
859.2 | — | (859.2 | )(n) | — | |||||||||||
| Retained deficit |
(3,116.0 | ) | 2,195.2 | (o) | 920.8 | — | ||||||||||
| Accumulated other comprehensive income |
67.4 | — | (67.4 | ) | — | |||||||||||
|
|
|
|||||||||||||||
| Total stockholders’ (deficit) equity |
(2,189.4 | ) | 3,028.8 | (5.8 | ) | 833.6 | ||||||||||
|
|
|
|||||||||||||||
| Total liabilities and stockholders’ (deficit) equity |
$ | 1,697.6 | $ | 22.5 | $ | 21.6 | $ | 1,741.7 | ||||||||
|
|
||||||||||||||||
F-27
Table of Contents
Aleris Corporation
Notes to consolidated financial statements (continued)
(in millions, except share and per share data)
| a. | The “Plan of reorganization adjustments” column includes amounts recorded as of the Effective Date for the consummation of the Plan, including the settlement of liabilities subject to compromise, the satisfaction of the DIP obligations, the write-off of debt issuance costs related to the DIP Credit Facilities, the execution of the ABL Facility, the issuance of the Exchangeable Notes and related cash payments and receipts, the issuance of Preferred Stock and Common Stock and the adjustment of deferred taxes in the U.S. |
| b. | The “Cash and cash equivalents” adjustment reflects the net cash received as of the Effective Date. The significant sources and uses of cash are as follows: |
| Sources | ||||
|
|
||||
| Rights offering proceeds |
$ | 608.6 | ||
| Issuance of Preferred Stock |
5.0 | |||
| Amounts borrowed under the ABL Facility |
80.0 | |||
|
|
|
|||
| Total Sources |
$ | 693.6 | ||
|
|
||||
| Uses | ||||
|
|
||||
| Repayment of the DIP Credit Facilities, including accrued interest of $2.5 |
$ | 575.5 | ||
| Claims payments to Term Loan Participants that elected to receive cash |
5.1 | |||
| Other claims payments |
6.4 | |||
| Fees and expenses |
63.1 | |||
| Payment of past due contributions to the Debtor’s pension plans |
4.8 | |||
|
|
|
|||
| Total Uses |
$ | 654.9 | ||
|
|
|
|||
| Net cash received |
$ | 38.7 | ||
|
|
||||
| c. | The adjustments to “Deferred income taxes” adjust the deferred tax position in the U.S. from a net deferred tax liability to a net deferred tax asset with a full valuation allowance. The net deferred tax liability resulted from taxable temporary differences related to assets with an indefinite useful life which, in accordance with ASC 740, “Income Taxes,” cannot be predicted to reverse in a period so as to result in the recognition of deferred tax assets. The change in the book and tax basis on the Effective Date of the assets with an indefinite useful life eliminated these taxable temporary differences (see “Tax implications arising from bankruptcy emergence” section above). |
| d. | The “Prepaid expenses and other current assets” adjustment is comprised of the write-off of $7.6 of unamortized debt issuance costs related to the satisfaction of the DIP Credit Facilities. |
| e. | The adjustment to “Other long-term assets” primarily represents the capitalization of debt issuance costs related to the ABL Facility. |
| f. | The adjustment to “Accrued liabilities” includes $19.9, $9.5 and $6.8 for allowed claims, professional and other fees, and assumed liabilities, respectively, all of which were incurred on the Effective Date and for which payment will subsequently be disbursed. These increases were partially offset by $20.5 and $2.5 of professional and other fees and accrued interest associated with the DIP Credit Facilities, respectively, that were paid on the Effective Date. |
| g. | The “Debtor-in-possession financing” adjustment reflects the payment of the DIP Credit Facilities. The “Debt in default” adjustment reflects the discharge of certain long-term debt, which was offset by an assumed liability of $5.0 to settle a letter of credit that had secured this long-term debt. |
| h. | The “Long-term debt” adjustment reflects the borrowing of $80.0 and $45.0 associated with the initial draw on the ABL Facility and the issuance of the Exchangeable Notes, respectively. Debt issuance costs totaling $1.2 were incurred related to the Exchangeable Notes and are recorded as a discount adjustment to “Long-term debt” as these costs were paid to the holders of the Exchangeable Notes. |
| i. | The “Accrued pension benefits” adjustment reflects the payment by the Company of all past due contributions to our pension plans. See Note 12, “Employee benefit plans.” |
| j. | The “Other long-term liabilities” adjustment of $0.4 reflects the reclassification of certain warranty liabilities from “Liabilities subject to compromise.” These liabilities were not discharged upon emergence from bankruptcy and have been assumed by the Company. |
F-28
Table of Contents
Aleris Corporation
Notes to consolidated financial statements (continued)
(in millions, except share and per share data)
| k. | The adjustment to “Liabilities subject to compromise” reflects the settlement, discharge or assumption of liabilities subject to compromise, including the following: |
|
|
||||
| Total liabilities subject to compromise |
$ | 2,530.1 | ||
| Less assumed liabilities previously classified as subject to compromise and transferred to: |
||||
| Accrued Liabilities |
(1.8 | ) | ||
| Other long-term liabilities |
(0.4 | ) | ||
|
|
|
|||
| Total liabilities subject to compromise assumed |
(2.2 | ) | ||
|
|
|
|||
| Total liabilities subject to compromise settled or discharged |
2,527.9 | |||
| Less: |
||||
| Cash paid upon emergence to settle claims |
(11.5 | ) | ||
| Cash paid or to be paid to settle claims |
(19.9 | ) | ||
| Issuance of Common Stock to settle claims of the Term Loan Participants |
(292.5 | ) | ||
|
|
|
|||
| Gain on settlement or discharge of liabilities subject to compromise |
$ | 2,204.0 | ||
|
|
||||
| l. | The adjustment is comprised of the issuance of $5.0 of Redeemable Preferred Stock by Aleris International, Inc. to third party investors. |
| m. | The adjustment to Successor equity represents the fair value of the shares of common stock contributed to the Successor in exchange for 100 shares of Aleris International, Inc. Common Stock. The fair value of the shares consists of $541.1 of net proceeds raised by the Predecessor in the rights offering and $292.5 of residual Plan Value (which represents the fair value of the common stock issued to settle claims of the Term Loan Participants). A reconciliation of the court approved Plan Value to the Reorganization Value and to the fair value of the Successor equity balance as of the Effective Date is as follows: |
|
|
||||
| Plan Value, less $5.1 paid to Term Loan Participants |
$ | 292.5 | ||
| Amount raised in the rights offering from: |
||||
| Common Stock |
541.1 | |||
| Exchangeable Notes, net of discount of $1.2 |
43.8 | |||
|
|
|
|||
| Total amount raised in the rights offering |
584.9 | |||
| Amounts borrowed under the ABL Facility |
80.0 | |||
| Predecessor debt of non-filing subsidiary |
4.4 | |||
| Issuance of Preferred Stock |
5.0 | |||
|
|
|
|||
| Reorganization Value |
966.8 | |||
| Less: |
||||
| Amounts borrowed under the ABL Facility |
(80.0 | ) | ||
| Issuance of the Exchangeable Notes |
(43.8 | ) | ||
| Predecessor debt of non-filing subsidiary |
(4.4 | ) | ||
| Issuance of Preferred Stock |
(5.0 | ) | ||
|
|
|
|||
| Fair value of Successor equity |
$ | 833.6 | ||
|
|
||||
| n. | The Predecessor “Additional paid-in capital” adjustment reflects the cancellation of the Predecessor’s equity. |
| o. | This adjustment reflects the cumulative impact of the reorganization adjustments discussed above and summarized below: |
|
|
||||
| Gain on settlement or discharge of liabilities subject to compromise (see k., above) |
$ | (2,204.0 | ) | |
| Deferred income taxes adjustment (see c., above) |
(11.6 | ) | ||
| Fees and expenses incurred on the Effective Date |
12.8 | |||
| Write-off of Predecessor unamortized debt issuance costs (see d., above) |
7.6 | |||
|
|
|
|||
| $ | (2,195.2 | ) | ||
|
|
||||
F-29
Table of Contents
Aleris Corporation
Notes to consolidated financial statements (continued)
(in millions, except share and per share data)
| p. | The fresh-start accounting amounts reflect the required adjustment of certain assets and liabilities to fair value or other measures as specified by ASC 805. Significant adjustments are summarized below: |
|
|
||||
| Inventory adjustment(q) |
$ | 22.7 | ||
| Prepaid expenses and other current assets |
(0.8 | ) | ||
| Property, plant and equipment adjustment(r) |
12.2 | |||
| Elimination of Predecessor company goodwill |
(37.8 | ) | ||
| Intangible asset adjustment(s) |
25.1 | |||
| Other long-term assets |
0.2 | |||
| Accrued liabilities |
0.8 | |||
| Accrued pension benefits(t) |
(25.0 | ) | ||
| Accrued postretirement benefits |
(2.7 | ) | ||
| Other long-term liabilities |
(0.5 | ) | ||
| Elimination of Predecessor accumulated other comprehensive income |
67.4 | |||
| Elimination of Predecessor additional paid-in capital |
859.2 | |||
|
|
|
|||
| Fresh-start accounting adjustments |
$ | 920.8 | ||
|
|
||||
| q. | Inventory—We recorded inventory at its fair value, which was determined as follows: |
| • | Raw materials were valued at estimated current replacement costs; |
| • | Work-in-process was valued at the estimated finished goods selling price once completed less estimated completion costs and a reasonable profit allowance for completion, selling effort and shipping costs; and |
| • | Finished goods were valued at the estimated selling price less a reasonable profit allowance for selling effort and shipping costs. |
| r. | We recorded “Property, plant and equipment” at its fair value of $477.2. As outlined in ASC 820, the fair value measurement of our long-lived assets assumes the highest and best use of the asset by market participants, considering the use of the asset that is physically possible, legally permissible and financially feasible at the measurement date. Highest and best use is determined based on the use of the asset by market participants, even if the intended use of the asset by the Company is different. Our estimation of fair value represents level 3 measurements within the fair value hierarchy. |
The components of “Property, plant and equipment” as of June 1, 2010 are as follows:
| (Successor) | (Predecessor) | |||||||||
| Land |
$ | 111.1 | $ | 110.5 | ||||||
| Buildings and improvements |
71.9 | 117.4 | ||||||||
| Production equipment and machinery |
268.4 | 311.9 | ||||||||
| Office furniture, equipment and other |
25.8 | 47.1 | ||||||||
| Total Property, plant and equipment |
477.2 | 586.9 | ||||||||
| Accumulated depreciation |
— | (121.9 | ) | |||||||
| Total Property, plant and equipment, net |
$ | 477.2 | $ | 465.0 | ||||||
| s. | Intangible assets were recorded at fair value in accordance with ASC 820 and represent level 3 measurements within the fair value hierarchy. The following is a summary of the approaches used to determine the fair value of our significant intangible assets: |
| • | We recorded $5.9 for the fair value of developed technology. The relief from royalty method was used to calculate the fair value of developed technology. The significant assumptions used included: |
| • | Forecasted revenue associated with the developed technology; |
| • | Royalty rates based on licensing arrangements for similar technologies and obsolescence factors by technology category; |
| • | Discount rates ranging from 19.0% to 21.0% based on our overall cost of equity adjusted for perceived business risks related to these developed technologies; and |
| • | Estimated economic life of 25 years. |
| • | The relief from royalty method was also used to calculate the fair value of our trade names which totaled $16.8. The significant assumptions used in this method included: |
| • | Forecasted revenue for each trade name; |
| • | Royalty rates based on licensing arrangements for the use of trademarks in the Company’s industry and related industries; |
| • | Discount rates ranging from 19.0% to 21.0% based on our overall cost of equity adjusted for perceived business risks related to these intangible assets; and |
F-30
Table of Contents
Aleris Corporation
Notes to consolidated financial statements (continued)
(in millions, except share and per share data)
| • | Indefinite economic lives for our trade names. |
| • | An excess earnings approach was used to calculate the fair value of our customer relationships which totaled $28.3. The significant assumptions used in this approach included: |
| • | Forecasted revenue; |
| • | Customer retention rates; |
| • | Profit margins; |
| • | Discount rates ranging from 22.0% to 24.0% based on our overall cost of equity adjusted for perceived business risks related to these customer relationships; and |
| • | Estimated economic lives ranging from 15 to 20 years. |
| t. | We recorded “Accrued pension benefits” of $185.3, an increase of $25.0 compared to the amounts recorded by the Predecessor, based on actuarial measurements as of the Effective Date. The weighted-average discount rate utilized to measure the plans on the Effective Date was 5.6% and 5.0% for the U.S. and European plans, respectively. |
Liabilities subject to compromise
Certain prepetition liabilities were subject to compromise under the Plan and were reported by the Predecessor at amounts allowed or expected to be allowed by the Bankruptcy Court. Certain of these claims were resolved and satisfied as of the Effective Date, while others have been or will be resolved in periods subsequent to emergence from Chapter 11. Although the final allowed amount of certain disputed general unsecured claims (Class 5 claims) has not yet been determined, our liability associated with these disputed claims was discharged upon our emergence from Chapter 11. Future dispositions with respect to certain allowed Class 5 claims will be satisfied out of our reserve for outstanding claims recorded in “Accrued liabilities” established for that purpose, which totaled $1.5 and $3.7 at December 31, 2011 and 2010, respectively. Accordingly, the future resolution of these disputed claims will not have an impact on our post-emergence financial condition, results of operations or cash flows. Although the Successor does maintain reserves for certain agreed-upon administrative claims, if disputed administrative claims are settled for more than the amounts currently reserved, the Successor is obligated to fund those claims pursuant to the Plan. As the Bankruptcy Court will determine the resolution of these disputes subsequent to, in certain cases, future hearings, management is unable to estimate a range of potential losses, if any, related to these claims. Any future claims allowed by the Court will be recorded within “Reorganization items, net” in the Consolidated Statements of Operations.
F-31
Table of Contents
Aleris Corporation
Notes to consolidated financial statements (continued)
(in millions, except share and per share data)
A summary of liabilities subject to compromise reflected in the Predecessor Consolidated balance sheet as of June 1, 2010, is shown below:
| (Predecessor) June 1, 2010 |
||||
|
|
||||
| Accounts payable |
$ | 102.9 | ||
| Accrued liabilities |
12.4 | |||
| Derivative financial instruments |
98.9 | |||
| Roll-up loans, net of discount of $1.7 |
569.4 | |||
| 2006 Senior notes, net of discount of $14.5 |
583.5 | |||
| 2006 Senior subordinated notes, net of discount of $13.6 |
385.4 | |||
| 2007 senior notes, net of discount of $6.8 |
98.6 | |||
| Term loan facility, net of discount of $13.7 |
633.2 | |||
| Interest payable |
26.3 | |||
| Other liabilities |
19.5 | |||
|
|
|
|||
| Total liabilities subject to compromise |
$ | 2,530.1 | ||
|
|
||||
Reorganization items, net
Professional advisory fees and other costs directly associated with our reorganization are reported as reorganization items pursuant to ASC 852. Reorganization items also include provisions and adjustments to record the carrying value of certain prepetition liabilities at their estimated allowable claim amounts as well as the impact of the liquidation of Canada LP in 2009. Fresh-start accounting adjustments reflect the pre-tax impact of the application of fresh-start accounting.
The “Reorganization items, net” in the Consolidated statement of operations consisted of the following items:
| (Successor) | (Predecessor) | |||||||||||||||||
| For the year ended |
For the seven months ended December 31, 2010 |
For the five months ended May 31, 2010 |
For the year ended |
|||||||||||||||
| Gain on settlement of liabilities subject to compromise |
$ | — | $ | — | $ | (2,204.0 | ) | $ | (1.8 | ) | ||||||||
| Fresh-start accounting |
— | — | (61.6 | ) | — | |||||||||||||
| Professional fees and expenses |
1.5 | 5.5 | 34.3 | 38.0 | ||||||||||||||
| Write-off of debt issuance costs |
— | — | 7.6 | 6.8 | ||||||||||||||
| U.S. Trustee fees |
— | 0.4 | 0.6 | 0.7 | ||||||||||||||
| Derivative financial instruments valuation adjustment |
— | — | — | 88.1 | ||||||||||||||
| Liquidation of Canada LP |
(2.4 | ) | — | (5.1 | ) | (8.7 | ) | |||||||||||
| Other |
(0.4 | ) | 1.5 | 0.9 | — | |||||||||||||
| Total Reorganization Items, net |
$ | (1.3 | ) | $ | 7.4 | $ | (2,227.3 | ) | $ | 123.1 | ||||||||
F-32
Table of Contents
Aleris Corporation
Notes to consolidated financial statements (continued)
(in millions, except share and per share data)
5. Restructuring and impairment charges
2011 Charges
During the year ended December 31, 2011, we recorded $4.4 of cash restructuring charges for employee severance and benefit costs, including $3.1 related to the Company’s reduction in force initiatives implemented at our Bonn, Germany facility. No further charges are anticipated related to this restructuring program.
The following table presents a reconciliation of the beginning and ending balances of the restructuring liability:
| Employee severance and benefit costs |
Exit costs | Total | ||||||||||
|
|
||||||||||||
| Balance at January 1, 2009 (Predecessor) |
$ | 17.8 | $ | 6.4 | $ | 24.2 | ||||||
| Charges recorded in the statement of operations |
36.8 | 4.9 | 41.7 | |||||||||
| Amounts recorded in purchase accounting |
(0.1 | ) | (0.3 | ) | (0.4 | ) | ||||||
| Cash payments |
(41.7 | ) | (3.9 | ) | (45.6 | ) | ||||||
| Non-cash utilization |
(0.4 | ) | (0.2 | ) | (0.6 | ) | ||||||
| Liquidation of Canada LP |
(0.5 | ) | (5.8 | ) | (6.3 | ) | ||||||
| Currency translation |
2.2 | (0.6 | ) | 1.6 | ||||||||
|
|
|
|||||||||||
| Balance at December 31, 2009 (Predecessor) |
$ | 14.1 | $ | 0.5 | $ | 14.6 | ||||||
| Charges recorded in the statement of operations |
0.2 | — | 0.2 | |||||||||
| Cash payments |
(5.0 | ) | (0.5 | ) | (5.5 | ) | ||||||
| Fresh-start accounting adjustment |
2.0 | — | 2.0 | |||||||||
| Currency translation |
(1.3 | ) | — | (1.3 | ) | |||||||
|
|
|
|||||||||||
| Balance at June 1, 2010 (Successor) |
$ | 10.0 | $ | — | $ | 10.0 | ||||||
| Charges recorded in the statement of operations |
12.1 | — | 12.1 | |||||||||
| Cash payments |
(3.3 | ) | — | (3.3 | ) | |||||||
| Currency translation |
0.7 | — | 0.7 | |||||||||
|
|
|
|||||||||||
| Balance at December 31, 2010 (Successor) |
$ | 19.5 | $ | — | $ | 19.5 | ||||||
| Charges recorded in the statement of operations |
4.4 | 4.4 | ||||||||||
| Cash payments |
(3.8 | ) | (3.8 | ) | ||||||||
| Currency translation |
(1.1 | ) | (1.1 | ) | ||||||||
|
|
|
|||||||||||
| Balance at December 31, 2011 (Successor) |
$ | 19.0 | $ | — | $ | 19.0 | ||||||
|
|
||||||||||||
2010 charges
During the seven months ended December 31, 2010, we recorded $12.1 of cash restructuring charges, including $11.1 related to the Company’s reduction in force initiatives at our Duffel, Belgium facility and $1.0 of restructuring charges primarily related to employee termination benefits associated with work force reductions at our Bonn, Germany facility initiated in 2010.
F-33
Table of Contents
Aleris Corporation
Notes to consolidated financial statements (continued)
(in millions, except share and per share data)
Payments totaling $0.3 were made during the seven months ended December 31, 2010 related to the Bonn work force reduction. As of December 31, 2011, no further charges are anticipated related to this restructuring program.
During 2009, we expanded and finalized our workforce reduction at our Duffel, Belgium facility which eliminated approximately 400 positions. During 2010, certain previously terminated individuals associated with the reduction in workforce initiative implemented at our Duffel, Belgium facility filed unfair dismissal employment suits in a Belgian labor court requesting additional severance payments. In connection with these pending suits, we evaluated the individual facts and circumstances and concluded that it is probable that the Company will be required to pay additional severance amounts to some of the former employees. As of December 31, 2011, a reserve totaling $9.0 remains for these additional severance amounts as well as related interest and legal fees.
During the five months ended May 31, 2010, we recorded $1.3 of cash restructuring charges and $1.7 of non-cash gains. The activity primarily resulted from the following restructuring items:
| • | Certain of our postretirement benefit plans were amended to eliminate retiree medical benefits for salaried employees/retirees. As a result of these amendments, gains of $1.1 and $1.0 were recorded associated with our RPNA and RPEU segments, respectively. |
| • | We recorded $0.8 of costs associated with environmental remediation efforts required at our Rockport, Indiana facility within our RPNA segment. |
2009 Charges
During the year ended December 31, 2009, we recorded non-cash impairment charges totaling $672.4, $45.7, $40.4 and $29.9 related to our long-lived assets, indefinite-lived intangible assets, goodwill and finite-lived intangibles, respectively. We also recorded $41.7 and $32.8 of other cash and non-cash charges, respectively, associated with plant closures and other restructuring initiatives during the year ended December 31, 2009. Included within these amounts are $33.5 and $24.3 of cash and non-cash restructuring charges recorded in 2009 related to restructuring activities initiated in 2008, the majority of which relates to the Duffel restructuring discussed above.
2009 Impairments
In 2009, we recorded impairment charges totaling $40.4 related to goodwill and $45.7 related to other indefinite-lived intangible assets. These impairments, which have been included within the operating results of the Corporate segment, consisted of goodwill impairment related to the RSAA operating segment and trade name impairments totaling $31.7 and $14.0 related to the RSAA and RPNA operating segments, respectively. We also recorded impairment charges associated with certain technology, customer contract and supply contract intangible assets totaling $29.9 in 2009. The impairments consisted of $22.8, $1.4 and $5.7 associated with our RPEU, RSEU and RSAA segments, respectively. These impairments are also described in Note 2, “Summary of Significant Accounting Policies.”
F-34
Table of Contents
Aleris Corporation
Notes to consolidated financial statements (continued)
(in millions, except share and per share data)
In accordance with ASC 360, several indicators of impairment were identified in the fourth quarter of 2009 including the finalization of the forecast model developed by the Company and its financial advisors to determine the initial Plan value. The results of the forecast identified a deficiency in the fair value of the business as a whole compared to its carrying value, and therefore, we determined that the associated long-lived assets were required to be tested for impairment. These impairment tests resulted in the Company recording impairment charges totaling $672.4 related to property, plant and equipment and $29.9 related to finite-lived intangible assets in the RSAA, RPEU, Extrusions and RSEU operating segments. No impairments were necessary for the RPNA segment as the undiscounted cash flows exceeded the carrying amount of this asset group. We conducted our analysis under the premise of fair value in-exchange. An analysis of the earnings capability of the related assets indicated that there would not be sufficient cash flows available to justify investment in the assets under a fair value in-use premise. These impairments are also described in Note 2, “Summary of Significant Accounting Policies.”
The 2009 impairments were primarily a result of the continued adverse climate for our business, including the erosion of the capital, credit, commodities, automobile and housing markets as well as the global economy.
2009 restructuring activities
During 2009, we closed our RPNA segment headquarters in Louisville, Kentucky and sold our Terre Haute, Indiana facility. We recorded cash restructuring charges totaling $2.2 primarily related to severance costs and recorded asset impairment charges totaling $3.5 relating to property, plant and equipment. We based the determination of the impairments of these assets on the undiscounted cash flows expected to be realized from the affected assets and recorded the related assets at fair value. Other work force reductions across the RPNA operations resulted in the recording of $2.4 of employee termination benefits.
6. Inventories
The components of our “Inventories” as of December 31, 2011 and 2010 are as follows:
| (Successor) | ||||||||
| December 31, | ||||||||
| 2011 | 2010 | |||||||
|
|
||||||||
| Finished goods |
$ | 175.6 | $ | 183.3 | ||||
| Raw materials |
226.5 | 227.2 | ||||||
| Work in process |
162.5 | 184.1 | ||||||
| Supplies |
21.1 | 19.0 | ||||||
|
|
|
|||||||
| Total |
$ | 585.7 | $ | 613.6 | ||||
|
|
||||||||
F-35
Table of Contents
Aleris Corporation
Notes to consolidated financial statements (continued)
(in millions, except share and per share data)
7. Property, plant and equipment
The components of our consolidated property, plant and equipment are as follows:
| (Successor) | ||||||||
| December 31, | ||||||||
| 2011 | 2010 | |||||||
|
|
||||||||
| Land |
$ | 131.1 | $ | 117.6 | ||||
| Buildings and improvements |
88.9 | 75.6 | ||||||
| Production equipment and machinery |
375.9 | 301.6 | ||||||
| Office furniture, equipment and other |
176.5 | 52.1 | ||||||
|
|
|
|||||||
| 772.4 | 546.9 | |||||||
| Accumulated depreciation |
(101.9 | ) | (36.9 | ) | ||||
|
|
|
|||||||
| $ | 670.5 | $ | 510.0 | |||||
|
|
||||||||
Our depreciation expense, including amortization of capital leases, and repair and maintenance expense was as follows:
| (Successor) | (Predecessor) | |||||||||||||||
| For the year ended |
For the seven months ended December 31, 2010 |
For the five months ended May 31, 2010 |
For the year ended December 31, 2009 |
|||||||||||||
|
|
||||||||||||||||
| Depreciation expense included in SG&A |
$ | 4.2 | $ | 3.3 | $ | 1.4 | $ | 10.4 | ||||||||
| Depreciation expense included in cost of sales |
64.0 | 33.8 | 18.3 | 143.9 | ||||||||||||
| Repair and maintenance expense |
114.7 | 68.2 | 37.6 | 76.0 | ||||||||||||
|
|
||||||||||||||||
8. Other intangible assets
The following table details our intangible assets as of December 31, 2011 and 2010:
| (Successor) | (Successor) | |||||||||||||||||||||||||
| December 31, 2011 | December 31, 2010 | |||||||||||||||||||||||||
| Gross carrying amount |
Accumulated amortization |
Net amount |
Average life |
Gross carrying amount |
Accumulated amortization |
Net amount |
||||||||||||||||||||
| Trade names |
$ | 16.8 | $ | — | $ | 16.8 | Indefinite | $ | 16.8 | $ | — | $ | 16.8 | |||||||||||||
| Technology |
5.9 | (0.4 | ) | 5.5 | 25 years | 5.9 | (0.1 | ) | 5.8 | |||||||||||||||||
| Customer relationships |
28.3 | (2.9 | ) | 25.4 | 15 years | 28.3 | (1.2 | ) | 27.1 | |||||||||||||||||
|
|
|
|
|
|||||||||||||||||||||||
| Total |
$ | 51.0 | $ | (3.3 | ) | $ | 47.7 | 17 years | $ | 51.0 | $ | (1.3 | ) | $ | 49.7 | |||||||||||
F-36
Table of Contents
Aleris Corporation
Notes to consolidated financial statements (continued)
(in millions, except share and per share data)
The following table presents amortization expense, which has been classified within “Selling, general and administrative expense” in the Consolidated statement of operations:
| (Successor) | (Predecessor) | |||||||||||||||
| For the year ended December 31, 2011 |
For the seven months ended December 31, 2010 |
For the five months ended May 31, 2010 |
For the year ended December 31, 2009 |
|||||||||||||
|
|
||||||||||||||||
| Amortization expense |
$ | 2.1 | $ | 1.3 | $ | 0.5 | $ | 14.1 | ||||||||
|
|
||||||||||||||||
The following table presents estimated amortization expense for the next five years:
|
|
||||
| 2012 |
$ | 2.1 | ||
| 2013 |
2.1 | |||
| 2014 |
2.1 | |||
| 2015 |
2.1 | |||
| 2016 |
2.1 | |||
|
|
|
|||
| Total |
$ | 10.5 | ||
|
|
||||
9. Accrued liabilities
Accrued liabilities at December 31, 2011 and 2010 consisted of the following:
| (Successor) | ||||||||
| December 31, | ||||||||
| 2011 | 2010 | |||||||
|
|
||||||||
| Employee-related costs |
$ | 67.8 | $ | 50.0 | ||||
| Accrued professional fees |
13.2 | 12.0 | ||||||
| Toll liability |
27.0 | 24.5 | ||||||
| Accrued taxes |
30.2 | 17.3 | ||||||
| Accrued interest |
15.2 | 1.8 | ||||||
| Accrued restructuring |
13.6 | 13.4 | ||||||
| Accrued capital expenditures |
15.1 | 9.5 | ||||||
| Derivative financial instruments |
14.1 | 5.6 | ||||||
| Other liabilities |
36.9 | 31.1 | ||||||
|
|
|
|||||||
| $ | 233.1 | $ | 165.2 | |||||
|
|
||||||||
10. Asset retirement obligations
Our asset retirement obligations consist of legal obligations associated with the closure of our active landfills as well as costs to remove asbestos and underground storage tanks and other legal or contractual obligations associated with the ultimate closure of our manufacturing facilities. As a result of the application of fresh-start accounting, on the Effective Date all of our other asset retirement obligations were adjusted from their historical amounts to fair value resulting in a $1.3 reduction in our reserve.
F-37
Table of Contents
Aleris Corporation
Notes to consolidated financial statements (continued)
(in millions, except share and per share data)
The changes in the carrying amount of asset retirement obligations for the year ended December 31, 2011, the seven months ended December 31, 2010, the five months ended May 31, 2010 and the year ended December 31, 2009 are as follows:
| (Successor) | (Predecessor) | |||||||||||||||
| For the year ended December 31, 2011 |
For the seven months ended December 31, 2010 |
For the five months ended May 31, 2010 |
For the year ended December 31, 2009 |
|||||||||||||
|
|
||||||||||||||||
| Balance at the beginning of the period |
$ | 12.9 | $ | 14.9 | $ | 17.4 | $ | 17.6 | ||||||||
| Revisions and liabilities incurred |
1.3 | (0.2 | ) | (0.4 | ) | 1.6 | ||||||||||
| Accretion expense |
0.5 | 0.4 | 0.2 | 0.8 | ||||||||||||
| Payments |
(1.0 | ) | (2.3 | ) | (0.6 | ) | (2.6 | ) | ||||||||
| Translation and other charges |
— | 0.1 | (0.4 | ) | — | |||||||||||
|
|
|
|||||||||||||||
| Balance at the end of the period |
$ | 13.7 | $ | 12.9 | $ | 16.2 | $ | 17.4 | ||||||||
|
|
||||||||||||||||
11. Long-term debt
Our debt is summarized as follows:
| (Successor) | ||||||||
| December 31, | ||||||||
| 2011 | 2010 | |||||||
|
|
||||||||
| ABL Facility |
$ | — | $ | — | ||||
| Senior Notes, net of discount of $8.8 |
491.2 | — | ||||||
| Exchangeable notes, net of discount of $0.9 |
44.1 | 44.1 | ||||||
| China Loan Facility, net of discount of $1.0 |
55.9 | — | ||||||
| Other |
10.8 | 6.3 | ||||||
|
|
|
|||||||
| Total debt |
602.0 | 50.4 | ||||||
| Less: Current portion of long-term debt |
6.9 | 5.3 | ||||||
|
|
|
|||||||
| Total long-term debt |
$ | 595.1 | $ | 45.1 | ||||
|
|
||||||||
Maturities of long-term debt
Scheduled maturities of our long-term debt (including capital leases) subsequent to December 31, 2011 are as follows:
|
|
||||
| 2012 |
$ | 6.9 | ||
| 2013 |
1.3 | |||
| 2014 |
1.1 | |||
| 2015 |
0.7 | |||
| 2016 |
9.8 | |||
| After 2016 |
592.9 | |||
|
|
|
|||
| Total |
$ | 612.7 | ||
|
|
||||
F-38
Table of Contents
Aleris Corporation
Notes to consolidated financial statements (continued)
(in millions, except share and per share data)
ABL Facility
In connection with the Debtors’ emergence from bankruptcy, Aleris International, Inc. entered into an asset backed multi-currency revolving credit facility. On June 30, 2011 Aleris International, Inc. amended and restated the ABL Facility. The amended and restated ABL Facility is a $600.0 revolving credit facility which permits multi-currency borrowings up to $600.0 by our U.S. subsidiaries, up to $240.0 by Aleris Switzerland GmbH (a wholly owned Swiss subsidiary), and $15.0 by Aleris Specification Alloy Products Canada Company (a wholly owned Canadian subsidiary). Aleris International, Inc. and certain of its U.S. and international subsidiaries are borrowers under this ABL Facility. The availability of funds to the borrowers located in each jurisdiction is subject to a borrowing base for that jurisdiction, and the jurisdictions in which certain subsidiaries of such borrowers are located, calculated on the basis of a predetermined percentage of the value of selected accounts receivable and U.S., Canadian and certain European inventory, less certain ineligible accounts receivable and inventory. The level of our borrowing base and availability under the ABL Facility fluctuates with the underlying London Metal Exchange (“LME”) price of aluminum which impacts both accounts receivable and inventory values included in our borrowing base. Non-U.S. borrowers also have the ability to borrow under this ABL Facility based on excess availability under the borrowing base applicable to the U.S. borrowers, subject to certain sublimits. The ABL Facility provides for the issuance of up to $75.0 of letters of credit as well as borrowings on same-day notice, referred to as swingline loans that are available in U.S. dollars, Canadian dollars, Euros, and certain other currencies. As of December 31, 2011, we estimate that our borrowing base would have supported borrowings up to $428.9. After giving effect to outstanding letters of credit of $39.1, we had $389.8 available for borrowing as of December 31, 2011.
Borrowings under the ABL Facility bear interest at a rate equal to the following, plus an applicable margin ranging from 0.75% to 2.50%:
| • | in the case of borrowings in U.S. dollars, a LIBOR rate or a base rate determined by reference to the higher of (1) Bank of America’s prime lending rate, (2) the overnight federal funds rate plus 0.5% or (3) a Eurodollar rate determined by Bank of America plus 1.0%; |
| • | in the case of borrowings in Euros, a euro LIBOR rate determined by Bank of America; and |
| • | in the case of borrowings in Canadian dollars, a Canadian prime rate. |
As of December 31, 2011 and 2010, we had no amounts outstanding under the ABL Facility.
In addition to paying interest on any outstanding principal under the ABL Facility, we are required to pay a commitment fee in respect of unutilized commitments of 0.50% if the average utilization is less than 33% for any applicable period, 0.375% if the average utilization is between 33% and 67% for any applicable period, and 0.25% if the average utilization is greater than 67% for any applicable period. We must also pay customary letters of credit fees and agency fees.
The ABL Facility is subject to mandatory prepayment with (i) 100% of the net cash proceeds of certain asset sales, subject to certain reinvestment rights; (ii) 100% of the net cash proceeds from
F-39
Table of Contents
Aleris Corporation
Notes to consolidated financial statements (continued)
(in millions, except share and per share data)
issuance of debt, other than debt permitted under the ABL Facility; and (iii) 100% of net cash proceeds from certain insurance and condemnation payments, subject to certain reinvestment rights.
In addition, if at any time outstanding loans, unreimbursed letter of credit drawings and undrawn letters of credit under the ABL Facility exceed the applicable borrowing base in effect at such time, the Company is required to repay outstanding loans or cash collateralize letters of credit in an aggregate amount equal to such excess, with no reduction of the commitment amount. If the amount available under the ABL Facility is less than the greater of (x) $50.0 and (y) 15.0% of the lesser of the total commitments or the borrowing base under the ABL Facility or an event of default is continuing, we are required to repay outstanding loans with the cash we are required to deposit in collection accounts maintained with the agent under the ABL Facility.
We may voluntarily reduce the unutilized portion of the commitment amount and repay outstanding loans at any time upon three business days prior written notice without premium or penalty other than customary “breakage” costs with respect to Eurodollar, euro LIBOR and EURIBOR loans.
There is no scheduled amortization under the ABL Facility. The principal amount outstanding will be due and payable in full at maturity, on June 29, 2016 unless extended pursuant to the credit agreement.
The ABL Facility is secured, subject to certain exceptions (including appropriate limitations in light of U.S. federal income tax considerations on guaranties and pledges of assets by foreign subsidiaries, and certain pledges of such foreign subsidiaries’ stock, in each case to support loans to us or our domestic subsidiaries), by a first-priority security interest in substantially all of our current assets and related intangible assets located in the U.S., substantially all of the current assets and related intangible assets of substantially all of our wholly owned domestic subsidiaries located in the U.S., substantially all of the current assets and related intangible assets of the Canadian Borrower located in Canada and substantially all of the current assets (other than inventory located outside the United Kingdom) and related intangibles of Aleris Recycling (Swansea) Ltd. and Aleris Switzerland GmbH and certain of its subsidiaries. The borrowers’ obligations under the ABL Facility are guaranteed by certain of our existing and future direct and indirect subsidiaries.
The ABL Facility contains a number of covenants that, among other things and subject to certain exceptions, restrict our ability and the ability of our subsidiaries to:
| • | incur additional indebtedness; |
| • | pay dividends on our common stock and make other restricted payments; |
| • | make investments and acquisitions; |
| • | engage in transactions with our affiliates; |
| • | sell assets; |
| • | merge; and |
| • | create liens. |
F-40
Table of Contents
Aleris Corporation
Notes to consolidated financial statements (continued)
(in millions, except share and per share data)
Although the credit agreement governing the ABL Facility generally does not require us to comply with any financial ratio maintenance covenants, if the amount available under the ABL Facility is less than the greater of (x) $45.0 or (y) 12.5% of the lesser of (i) the total commitments or (ii) the borrowing base under the ABL Facility at any time, a minimum fixed charge coverage ratio (as defined in the credit agreement) of at least 1.0 to 1.0 will apply. The credit agreement also contains certain customary affirmative covenants and events of default. We were in compliance with all of the covenants set forth in the credit agreement as of December 31, 2011.
Senior Notes
On February 9, 2011, Aleris International, Inc. issued $500.0 aggregate original principal amount of 7 5/8% Senior Notes due 2018 (the “Senior Notes”) under an indenture (the “Indenture”) with U.S. Bank National Association, as trustee. Interest on the Senior Notes is payable in cash semi-annually in arrears on February 15th and August 15th of each year. The Senior Notes mature on February 15, 2018.
The Senior Notes are jointly and severally, irrevocably and unconditionally guaranteed on a senior unsecured basis, by each direct and indirect restricted subsidiary that is a domestic subsidiary and that guarantees our obligations under the ABL Facility, as primary obligor and not merely as surety. The Senior Notes and the guarantees thereof are our unsecured senior obligations and rank (i) equally in right of payment to all of our existing and future debt and other obligations that are not, by their terms, expressly subordinated in right of payment to the Senior Notes; (ii) effectively subordinated in right of payment to all of our existing and future secured debt (including any borrowings under the ABL Facility), to the extent of the value of the assets securing such debt; (iii) structurally subordinated to all existing and future debt and other obligations, including trade payables, of each of our subsidiaries that is not a guarantor of the Senior Notes; and (iv) senior in right of payment to our existing and future debt and other obligations that are, by their terms, expressly subordinated in right of payment to the Senior Notes, including our exchangeable notes.
We are not required to make any mandatory redemption or sinking fund payments with respect to the Senior Notes other than as set forth in the Indenture relating to certain tax matters, but under certain circumstances, we may be required to offer to purchase Senior Notes as described below. We may from time to time acquire Senior Notes by means other than redemption, whether by tender offer, in open market purchases, through negotiated transactions or otherwise, in accordance with applicable securities laws.
From and after February 15, 2014, we may redeem the Senior Notes, in whole or in part, upon not less than 30 nor more than 60 days’ prior notice at a redemption price equal to 105.7% of the principal amount, declining annually to 100.0% of the principal amount on February 15, 2017, plus accrued and unpaid interest, and Additional Interest (as defined in the Indenture), if any, thereon to the applicable redemption date.
Prior to February 15, 2013, we may, at our option, subject to certain conditions, redeem up to 35% of the original aggregate principal amount of the Senior Notes at a redemption price of
F-41
Table of Contents
Aleris Corporation
Notes to consolidated financial statements (continued)
(in millions, except share and per share data)
107.6% of the aggregate principal amount thereof, plus accrued and unpaid interest, and Additional Interest, if any, thereon to the redemption date, (plus the aggregate principal amount of any additional notes issued after the issue date) with the net cash proceeds of one or more equity offerings of ours or any direct or indirect parent of ours to the extent such proceeds are contributed to us provided that at least 65% of the sum of the aggregate principal amount of Senior Notes originally issued under the Indenture and the aggregate principal amount of any additional notes issued under the Indenture after the issue date remain outstanding immediately after the occurrence of each such redemption and each such redemption occurs within 180 days of the date of closing of each equity offering. Prior to February 15, 2013, we also may, but not more than one time during each twelve month period, redeem, in the aggregate, up to 10% of the sum of the original principal amount of the Senior Notes (and the original principal amount of any additional notes) issued under the Indenture at a redemption price equal to 103% of the aggregate principal amount thereof, plus accrued and unpaid interest, and Additional Interest, if any, thereon to the applicable redemption date. At any time prior to February 15, 2014, we may redeem all or a part of the Senior Notes, upon not less than 30 nor more than 60 days’ prior notice, at a redemption price equal to 100% of the principal amount of Senior Notes redeemed plus an applicable premium, as provided in the Indenture, as of, and accrued and unpaid interest and Additional Interest, if any, to the redemption date.
Upon the occurrence of a change in control (as defined in the Indenture), each holder of the Senior Notes has the right to require us to repurchase some or all of such holder’s Senior Notes at a price in cash equal to 101% of the aggregate principal amount thereof plus accrued and unpaid interest and Additional Interest, if any, to the purchase date.
If we or our restricted subsidiaries engage in an asset sale (as defined in the Indenture), we generally must either invest the net cash proceeds from such sales in our business within a specified period of time, permanently reduce senior debt, permanently reduce senior subordinated debt, permanently reduce debt of a restricted subsidiary that is not a subsidiary guarantor or make an offer to purchase a principal amount of the notes equal to the net cash proceeds, subject to certain exceptions. The purchase price of the notes will be 100% of their principal amount, plus accrued and unpaid interest.
The Indenture contains covenants that limit our ability and certain of our subsidiaries’ ability to:
| • | incur additional debt; |
| • | pay dividends or distributions on our capital stock or redeem, repurchase or retire our capital stock or subordinated debt; |
| • | issue preferred stock of restricted subsidiaries; |
| • | make certain investments; |
| • | create liens on our or our subsidiary guarantors’ assets to secure debt; |
| • | enter into sale and leaseback transactions; |
F-42
Table of Contents
Aleris Corporation
Notes to consolidated financial statements (continued)
(in millions, except share and per share data)
| • | create restrictions on the payment of dividends or other amounts to us from our restricted subsidiaries that are not guarantors of the notes; |
| • | enter into transactions with affiliates; |
| • | merge or consolidate with another company; and |
| • | sell assets, including capital stock of our subsidiaries. |
These covenants are subject to a number of important limitations and exceptions.
The Indenture also provides for events of default, which, if any of them occurs, would permit or require the principal, premium, if any, interest and any other monetary obligations on all outstanding Senior Notes to be due and payable immediately. We were in compliance with all covenants set forth in the Indenture as of December 31, 2011.
Aleris International, Inc. used the net proceeds from the sale of the Senior Notes to pay us cash dividends of approximately $500.0, which was then paid as a dividend, pro rata, to our stockholders.
On October 14, 2011, we exchanged the Senior Notes for $500.0 of new 7 5/8% Senior Notes due 2018 that have been registered under the Securities Act of 1933, as amended. The notes issued in the exchange offer are substantially identical to the Senior Notes, except that the new notes have been registered under the federal securities laws, are not subject to transfer restrictions, are not entitled to certain registration rights and will not provide for the payment of additional interest under circumstances relating to the timing of the exchange offer.
Exchangeable Notes
On the Effective Date, Aleris International, Inc. issued $45.0 aggregate principal amount of 6.0% senior subordinated exchangeable notes. The exchangeable notes are scheduled to mature on June 1, 2020. The exchangeable notes have exchange rights at the holder’s option, after June 1, 2013, and are exchangeable for common stock at a rate equivalent to 47.20 shares of common stock per $1,000 principal amount of exchangeable notes (after adjustment for the payment of the dividends in 2011), subject to further adjustment. The exchangeable notes may be redeemed at the Company’s option at specified redemption prices on or after June 1, 2013 or upon a fundamental change.
The Exchangeable Notes are our unsecured, senior subordinated obligations and rank (i) junior to all of our existing and future senior indebtedness, including the ABL Facility; (ii) equally to all of our existing and future senior subordinated indebtedness; and (iii) senior to all of our existing and future subordinated indebtedness.
China Loan Facility
In March 2011, our China Joint Venture entered into the China Loan Facility, a non-recourse multi-currency secured revolving and term loan facility with the Bank of China Limited, Zhenjiang Jingkou Sub-Branch. The China Loan Facility originally consisted of a $100.0 term loan, a RMB
F-43
Table of Contents
Aleris Corporation
Notes to consolidated financial statements (continued)
(in millions, except share and per share data)
532.0 term loan (or equivalent to $83.7) and a combined USD/RMB revolving credit facility up to an aggregate amount equivalent to $35.0. In December 2011, the agreement was amended and now consists of a $30.0 term loan facility, a RMB 997.5 term loan facility (or equivalent to approximately $157.0) and a RMB 232.8 (or equivalent to approximately $36.6) revolving credit facility. The interest on the term USD facility is six month USD LIBOR plus 5.0% and the interest rate on the term RMB facility and the revolving credit facility is 110% of the base rate applicable to any loan denominated in RMB of the same tenor, as announced by the People’s Bank of China. As of December 31, 2011, $56.7 was drawn under the term loan facility. Draws on the revolving facility begin in 2013. The final maturity date for all borrowings under the China Loan Facility is May 21, 2021. Our China Joint Venture is an unrestricted subsidiary under the indenture governing the Senior Notes.
The China Loan Facility contains certain customary covenants and events of default. The China Loan Facility requires the China Joint Venture to, among other things, maintain a certain ratio of outstanding term loans to invested equity capital. In addition, among other things and subject to certain exceptions, the China Joint Venture is restricted in its ability to:
| • | repay loans extended by the China Joint Venture’s shareholders prior to repaying loans under the China Loan Facility or make the China Loan Facility junior to any other debts incurred of the same class for the project; |
| • | distribute any dividend or bonus to shareholders if its pre-tax profit is insufficient to cover a loss or not used to discharge principal, interest and expenses; |
| • | dispose of any assets in a manner that will materially impair its ability to repay debts; |
| • | provide guarantees to third parties above a certain threshold that use assets that are financed by the China Loan Facility; |
| • | permit any individual investor or key management personnel changes that result in a material adverse effect; |
| • | use any proceeds from the China Loan Facility for any purpose other than as set forth therein; and |
| • | enter into additional financing to expand or increase the production capacity of the project. |
We were in compliance with all of the covenants set forth in the China Loan Facility as of December 31, 2011.
12. Employee benefit plans
Defined contribution pension plans
The Company’s defined contribution plans cover substantially all U.S. employees not covered under collective bargaining agreements and certain employees covered by collective bargaining agreements. The plans provide both profit sharing and employer matching contributions as well
F-44
Table of Contents
Aleris Corporation
Notes to consolidated financial statements (continued)
(in millions, except share and per share data)
as an age-based and salary-based contribution. Effective January 1, 2009, the plan for employees not covered under collective bargaining agreements was amended to suspend the age and salary contribution and on April 1, 2009, this same plan was amended to suspend profit sharing and matching contributions. Effective July 1, 2010 and January 1, 2011, the plan was amended to reinstate the matching contribution provision and the age-based and salary-based contributions, respectively.
Our match of employees’ contributions under our defined contribution plans for the year ended December 31, 2011, the seven months ended December 31, 2010, the five months ended May 31, 2010 and the year ended December 31, 2009 are as follows:
| (Successor) | (Predecessor) | |||||||||||||||||
| For the year ended |
For the seven months ended December 31, 2010 |
For the five months ended May 31, 2010 |
For the year ended |
|||||||||||||||
| Company match of employee contributions |
$ | 3.9 | $ | 1.5 | $ | 0.3 | $ | 1.4 | ||||||||||
Defined benefit pension plans
Our U.S. defined benefit pension plans cover certain salaried and non-salaried employees at our corporate headquarters and within our RPNA segment. The plan benefits are based on age, years of service and employees’ eligible compensation during employment for all employees not covered under a collective bargaining agreement and on stated amounts based on job grade and years of service prior to retirement for non-salaried employees covered under a collective bargaining agreement.
The Plan provided that a condition precedent to the entry of the confirmation order was the termination of our U.S. pension benefits. The Debtors, with the consent of the Backstop Parties, waived this condition precedent and assumed these benefit plans on May 13, 2010. On the Effective Date, we made $4.8 of contributions for past due amounts to satisfy the minimum funding requirements.
Our German subsidiaries sponsor various defined benefit pension plans for their employees. These plans are based on final pay and service, but some senior officers are entitled to receive enhanced pension benefits. Benefit payments are financed, in part, by contributions to a relief fund which establishes a life insurance contract to secure future pension payments; however, the plans are substantially unfunded plans under German law. The unfunded accrued pension costs are covered under a pension insurance association under German law if we are unable to fulfill our obligations.
F-45
Table of Contents
Aleris Corporation
Notes to consolidated financial statements (continued)
(in millions, except share and per share data)
The components of the net periodic benefit expense for the year ended December 31, 2011, the seven months ended December 31, 2010, the five months ended May 31, 2010 and the year ended December 31, 2009 are as follows:
| U.S. pension benefits | ||||||||||||||||||
| (Successor) | (Predecessor) | |||||||||||||||||
| For the year ended |
For the seven months ended December 31, 2010 |
For the five months ended May 31, 2010 |
For the year ended |
|||||||||||||||
| Service cost |
$ | 2.6 | $ | 1.3 | $ | 0.9 | $ | 1.9 | ||||||||||
| Interest cost |
7.5 | 4.7 | 3.3 | 7.9 | ||||||||||||||
| Amortization of net loss |
— | — | 0.9 | 1.7 | ||||||||||||||
| Amortization of prior service cost |
— | — | — | 0.1 | ||||||||||||||
| Expected return on plan assets |
(8.0 | ) | (4.2 | ) | (3.0 | ) | (6.6 | ) | ||||||||||
| Curtailment loss |
— | — | — | 0.4 | ||||||||||||||
| Net periodic benefit cost |
$ | 2.1 | $ | 1.8 | $ | 2.1 | $ | 5.4 | ||||||||||
| European pension benefits | ||||||||||||||||||
| (Successor) | (Predecessor) | |||||||||||||||||
| For the year ended |
For the seven months ended December 31, 2010 |
For the five May 31, 2010 |
For the year ended |
|||||||||||||||
| Service cost |
$ | 2.5 | $ | 1.5 | $ | 0.9 | $ | 2.6 | ||||||||||
| Interest cost |
7.7 | 4.2 | 3.2 | 8.7 | ||||||||||||||
| Amortization of net gain |
— | — | (0.6 | ) | (0.6 | ) | ||||||||||||
| Amortization of prior service cost |
— | — | 0.1 | 0.2 | ||||||||||||||
| Expected return on plan assets |
(0.1 | ) | (0.1 | ) | — | (0.1 | ) | |||||||||||
| Curtailment gain |
— | — | — | (0.1 | ) | |||||||||||||
| Net periodic benefit cost |
$ | 10.1 | $ | 5.6 | $ | 3.6 | $ | 10.7 | ||||||||||
F-46
Table of Contents
Aleris Corporation
Notes to consolidated financial statements (continued)
(in millions, except share and per share data)
As a result of the application of fresh-start accounting, on the Effective Date all of our pension benefit obligations were adjusted from their historical amounts to fair value resulting in a $25.0 increase in our benefit obligation. The changes in projected benefit obligations and plan assets during the year ended December 31, 2011, the seven months ended December 31, 2010 and the five months ended May 31, 2010, using a period-end measurement date, are as follows:
| U.S. pension benefits | ||||||||||||||
| (Successor) | (Predecessor) | |||||||||||||
| For the year ended December 31, 2011 |
For the seven months ended |
For the five months ended May 31, 2010 |
||||||||||||
| Change in projected benefit obligations |
||||||||||||||
| Projected benefit obligation at beginning of period |
$ | 149.9 | $ | 145.4 | $ | 142.5 | ||||||||
| Plan amendments |
0.9 | — | — | |||||||||||
| Service cost |
2.6 | 1.3 | 0.9 | |||||||||||
| Interest cost |
7.5 | 4.7 | 3.3 | |||||||||||
| Actuarial loss (gain) |
14.4 | 6.0 | (3.2 | ) | ||||||||||
| Expenses paid |
(1.0 | ) | (0.8 | ) | (0.2 | ) | ||||||||
| Benefits paid |
(9.3 | ) | (6.7 | ) | (2.9 | ) | ||||||||
| Projected benefit obligation at end of period |
$ | 165.0 | $ | 149.9 | $ | 140.4 | ||||||||
| Change in plan assets |
||||||||||||||
| Fair value of plan assets at beginning of period |
$ | 97.0 | $ | 82.3 | $ | 85.6 | ||||||||
| Employer contributions |
12.1 | 9.9 | — | |||||||||||
| Actual return (loss) on plan assets |
0.8 | 12.3 | (0.2 | ) | ||||||||||
| Expenses paid |
(1.0 | ) | (0.8 | ) | (0.2 | ) | ||||||||
| Benefits paid |
(9.3 | ) | (6.7 | ) | (2.9 | ) | ||||||||
| Fair value of plan assets at end of period |
$ | 99.6 | $ | 97.0 | $ | 82.3 | ||||||||
| Net amount recognized |
$ | (65.4 | ) | $ | (52.9 | ) | $ | (58.1 | ) | |||||
F-47
Table of Contents
Aleris Corporation
Notes to consolidated financial statements (continued)
(in millions, except share and per share data)
| European pension benefits | ||||||||||||||
| (Successor) | (Predecessor) | |||||||||||||
| For the year ended |
For the seven months ended December 31, 2010 |
For the five months ended May 31, 2010 |
||||||||||||
| Change in projected benefit obligations |
||||||||||||||
| Projected benefit obligation at beginning of period |
$ | 139.9 | $ | 134.3 | $ | 131.5 | ||||||||
| Service cost |
2.5 | 1.5 | 0.9 | |||||||||||
| Interest cost |
7.7 | 4.2 | 3.2 | |||||||||||
| Actuarial loss (gain) |
11.2 | (8.3 | ) | 1.1 | ||||||||||
| Benefits paid |
(6.5 | ) | (3.5 | ) | (2.3 | ) | ||||||||
| Translation and other |
(5.6 | ) | 11.7 | (20.1 | ) | |||||||||
| Projected benefit obligation at end of period |
$ | 149.2 | $ | 139.9 | $ | 114.3 | ||||||||
| Change in plan assets |
||||||||||||||
| Fair value of plan assets at beginning of period |
$ | 2.5 | $ | 2.1 | $ | 2.2 | ||||||||
| Employer contributions |
7.1 | 3.9 | 2.5 | |||||||||||
| Actual loss on plan assets |
(0.1 | ) | (0.1 | ) | — | |||||||||
| Benefits paid |
(6.5 | ) | (3.5 | ) | (2.3 | ) | ||||||||
| Translation and other |
(0.1 | ) | 0.1 | (0.3 | ) | |||||||||
| Fair value of plan assets at end of period |
$ | 2.9 | $ | 2.5 | $ | 2.1 | ||||||||
| Net amount recognized |
$ | (146.3 | ) | $ | (137.4 | ) | $ | (112.2 | ) | |||||
F-48
Table of Contents
Aleris Corporation
Notes to consolidated financial statements (continued)
(in millions, except share and per share data)
The following table provides the amounts recognized in the Consolidated balance sheet as of December 31, 2011 and 2010:
| U.S. pension benefits | European pension benefits | |||||||||||||||
| (Successor) | (Successor) | |||||||||||||||
| December 31, | December 31, | |||||||||||||||
| 2011 | 2010 | 2011 | 2010 | |||||||||||||
|
|
||||||||||||||||
| Accrued liabilities |
$ | — | $ | — | $ | 5.5 | $ | 5.8 | ||||||||
| Accrued pension benefits |
65.4 | 52.9 | 140.8 | 131.6 | ||||||||||||
|
|
|
|||||||||||||||
| Net amount recognized |
$ | 65.4 | $ | 52.9 | $ | 146.3 | $ | 137.4 | ||||||||
|
|
|
|||||||||||||||
| Amounts recognized in other comprehensive income (before tax) consist of: |
||||||||||||||||
| Net actuarial loss (gain) |
$ | 19.6 | $ | (2.2 | ) | $ | 2.7 | $ | (8.1 | ) | ||||||
| Net prior service cost |
0.9 | — | — | — | ||||||||||||
|
|
|
|||||||||||||||
| $ | 20.5 | $ | (2.2 | ) | $ | 2.7 | $ | (8.1 | ) | |||||||
|
|
|
|||||||||||||||
| Amortization expected to be recognized during next fiscal year (before tax): |
||||||||||||||||
| Amortization of net loss |
$ | (0.3 | ) | $ | — | $ | — | $ | — | |||||||
| Amortization of prior service cost |
(0.1 | ) | — | — | — | |||||||||||
|
|
|
|||||||||||||||
| $ | (0.4 | ) | $ | — | $ | — | $ | — | ||||||||
|
|
|
|||||||||||||||
| Additional information |
||||||||||||||||
| Accumulated benefit obligation for all defined benefit pension plans |
$ | 165.0 | $ | 149.9 | $ | 143.7 | $ | 134.8 | ||||||||
| For defined benefit pension plans with projected benefit obligations in excess of plan assets: |
||||||||||||||||
| Aggregate projected benefit obligation |
165.0 | 149.9 | 149.2 | 139.9 | ||||||||||||
| Aggregate fair value of plan assets |
99.6 | 97.0 | 2.9 | 2.5 | ||||||||||||
| For defined benefit pension plans with accumulated benefit obligations in excess of plan assets: |
||||||||||||||||
| Aggregate accumulated benefit obligation |
165.0 | 149.9 | 143.7 | 134.8 | ||||||||||||
| Aggregate fair value of plan assets |
99.6 | 97.0 | 2.9 | 2.5 | ||||||||||||
| Projected employer contributions for 2012 |
15.3 | 6.9 | ||||||||||||||
|
|
||||||||||||||||
Plan assumptions—We are required to make assumptions regarding such variables as the expected long-term rate of return on plan assets and the discount rate applied to determine service cost and interest cost. Our objective in selecting a discount rate is to select the best estimate of the rate at which the benefit obligations could be effectively settled. In making this estimate, projected cash flows are developed and matched with a yield curve based on an appropriate universe of high-quality corporate bonds.
F-49
Table of Contents
Aleris Corporation
Notes to consolidated financial statements (continued)
(in millions, except share and per share data)
Assumptions for long-term rates of return on plan assets are based upon historical returns, future expectations for returns for each asset class and the effect of periodic target asset allocation rebalancing. The results are adjusted for the payment of reasonable expenses of the plan from plan assets. We believe these assumptions are appropriate based upon the mix of the investments and the long-term nature of the plans’ investments.
The weighted average assumptions used to determine benefit obligations are as follows:
| U.S. pension benefits | ||||||||||||
| (Successor) | ||||||||||||
| As of December 31, 2011 |
As of December 31, 2010 |
As of June 1, 2010 |
||||||||||
|
|
|
|
|
|
|
|
||||||
| Discount rate |
4.50% | 5.20% | 5.61% | |||||||||
|
|
||||||||||||
| European pension benefits | ||||||||||||
| (Successor) | ||||||||||||
| As of December 31, 2011 |
As of December 31, 2010 |
As of June 1, 2010 |
||||||||||
|
|
||||||||||||
| Discount rate |
4.90% | 5.40% | 5.00% | |||||||||
| Rate of compensation increases, if applicable |
3.00 | 3.00 | 3.00 | |||||||||
|
|
||||||||||||
The weighted average assumptions used to determine the net periodic benefit cost for the year ended December 31, 2011, the seven months ended December 31, 2010, the five months ended May 31, 2010 and the year ended December 31, 2009 are as follows:
| U.S. pension benefits | ||||||||||||||||
| (Successor) | (Predecessor) | |||||||||||||||
| For the year ended |
For the seven months ended December 31, 2010 |
For the five months ended May 31, 2010 |
For the year ended |
|||||||||||||
| Discount rate |
5.20% | 5.61% | 5.75% | 6.25% | ||||||||||||
| Expected return on plan assets |
8.25 | 8.25 | 8.25 | 8.23 | ||||||||||||
| European pension benefits | ||||||||||||||||
| (Successor) | (Predecessor) | |||||||||||||||
| For the year ended |
For the seven months ended December 31, 2010 |
For the five months ended May 31, 2010 |
For the year ended |
|||||||||||||
| Discount rate |
5.40% | 5.00% | 6.10% | 5.75% | ||||||||||||
| Expected return on plan assets |
4.20 | 4.15 | 4.32 | 5.23 | ||||||||||||
| Rate of compensation increase |
3.00 | 3.00 | 3.00 | 3.01 | ||||||||||||
F-50
Table of Contents
Aleris Corporation
Notes to consolidated financial statements (continued)
(in millions, except share and per share data)
Plan assets—The weighted average plan asset allocations at December 31, 2011 and December 31, 2010 and the target allocations are as follows:
| Percentage of plan assets | ||||||||||||
| (Successor) | ||||||||||||
| 2011 | 2010 | Target allocation | ||||||||||
|
|
||||||||||||
| Cash |
22% | —% | —% | |||||||||
| Equity |
40 | 67 | 60 | |||||||||
| Fixed income |
35 | 19 | 25 | |||||||||
| Real estate |
— | 11 | 12 | |||||||||
| Other |
3 | 3 | 3 | |||||||||
|
|
|
|||||||||||
| Total |
100% | 100% | 100% | |||||||||
|
|
||||||||||||
The principal objectives underlying the investment of the pension plans’ assets are to ensure that the Company can properly fund benefit obligations as they become due under a broad range of potential economic and financial scenarios, maximize the long-term investment return with an acceptable level of risk based on such obligations, and broadly diversify investments across and within the capital markets to protect asset values against adverse movements in any one market. The Company’s strategy balances the requirement to maximize returns using potentially higher return generating assets, such as equity securities, with the need to control the risk versus the benefit obligations with less volatile assets, such as fixed-income securities. At December 31, 2011, a significant portion of the U.S. pension plan assets were temporarily invested in cash as funds were in the process of being transferred to, and invested by, a new trustee. The investment of the U.S. pension plan assets will become finalized in 2012 following the target allocations shown above.
Investment practices must comply with the requirements of ERISA and any other applicable laws and regulations. The use of derivative instruments is permitted where appropriate and necessary for achieving overall investment policy objectives. Currently, the use of derivative instruments is not significant when compared to the overall investment portfolio.
The fair values of the Company’s pension plan assets at December 31, 2011 by asset class are as follows:
| Fair value measurements at December 31, 2011 using: | ||||||||||||||||
| Asset class: | Fair value | Quoted prices in active markets for identical assets (Level 1) |
Significant observable inputs (Level 2) |
Significant (Level 3) |
||||||||||||
|
|
||||||||||||||||
| Cash |
$ | 22.2 | $ | 22.2 | $ | — | $ | — | ||||||||
| Registered investment companies: |
||||||||||||||||
| Large U.S. equity |
13.2 | 13.2 | — | — | ||||||||||||
| Small / Mid U.S. equity |
9.4 | 9.4 | — | — | ||||||||||||
| International equity |
9.8 | 9.8 | — | — | ||||||||||||
| Fixed income |
35.9 | 35.9 | — | — | ||||||||||||
| Limited partnership interests |
9.1 | — | — | 9.1 | ||||||||||||
| Other |
2.9 | — | 2.9 | — | ||||||||||||
|
|
|
|||||||||||||||
| Total |
$ | 102.5 | $ | 90.5 | $ | 2.9 | $ | 9.1 | ||||||||
|
|
||||||||||||||||
F-51
Table of Contents
Aleris Corporation
Notes to consolidated financial statements (continued)
(in millions, except share and per share data)
The fair values of the Company’s pension plan assets at December 31, 2010 by asset class are as follows:
| Fair value measurements at December 31, 2010 using: | ||||||||||||||||
| Asset class: | Fair value | Quoted prices in active markets for identical assets (Level 1) |
Significant observable inputs (Level 2) |
Significant (Level 3) |
||||||||||||
|
|
||||||||||||||||
| Pooled separate accounts: |
||||||||||||||||
| Large U.S. equity |
$ | 28.7 | $ | — | $ | 28.7 | $ | — | ||||||||
| Small / Mid U.S. equity |
4.8 | — | 4.8 | — | ||||||||||||
| International equity |
17.2 | — | 17.2 | — | ||||||||||||
| Fixed income |
17.6 | — | 6.9 | 10.7 | ||||||||||||
| Registered investment companies: |
||||||||||||||||
| Small / Mid U.S. equity |
7.2 | 7.2 | — | — | ||||||||||||
| Fixed income |
12.3 | 12.3 | — | — | ||||||||||||
| Limited partnership interests |
9.2 | — | — | 9.2 | ||||||||||||
| Other |
2.5 | — | 2.5 | — | ||||||||||||
|
|
|
|||||||||||||||
| Total |
$ | 99.5 | $ | 19.5 | $ | 60.1 | $ | 19.9 | ||||||||
|
|
||||||||||||||||
The table below summarizes the activity in our pension plan assets classified within Level 3 of the fair value hierarchy. The determination to classify a pension plan asset within Level 3 is based upon the significance of the unobservable inputs to the overall fair value measurement. Level 3 pension plan assets typically include, in addition to the unobservable or Level 3 components, observable components, including current quoted market prices, which are validated to external sources. At December 31, 2010, certain of our pension plan assets were invested in various pooled separate accounts. There were no redemption restrictions on those investments, except for the Principal U.S. Property Separate Account (included in the fixed income class of pooled separate accounts shown in the table above). There were no unfunded commitments related to investments in pooled separate accounts at December 31, 2010. The Principal U.S. Property Separate Account invests mainly in commercial real estate and includes mortgage loans which are backed by the associated properties. Through March 25, 2011, this investment had a temporary withdrawal limitation related to past turmoil in the credit markets. However, with the release of these restrictions, this pension plan asset was transferred from Level 3 to Level 2 within the fair value hierarchy as of March 25, 2011. Additionally, this investment was sold in December 2011.
| Insurance company pooled separate account - fixed income |
Limited partnership interests |
|||||||
|
|
||||||||
| Balance at January 1, 2010 (Predecessor) |
$ | 8.1 | $ | 9.3 | ||||
| Actual return on plan assets |
0.2 | (0.1 | ) | |||||
|
|
|
|||||||
| Balance at June 1, 2010 (Successor) |
8.3 | 9.2 | ||||||
| Purchases |
1.3 | — | ||||||
| Actual return on plan assets |
1.1 | — | ||||||
|
|
|
|||||||
| Balance at December 31, 2010 (Successor) |
10.7 | 9.2 | ||||||
| Transfers to Level 2 |
(11.0 | ) | ||||||
| Actual return on plan assets |
0.3 | (0.1 | ) | |||||
|
|
|
|||||||
| Balance at December 31, 2011 (Successor) |
$ | — | $ | 9.1 | ||||
| Total 2011 losses attributable to assets held at December 31, 2011 |
$ | — | $ | (0.1 | ) | |||
|
|
||||||||
F-52
Table of Contents
Aleris Corporation
Notes to consolidated financial statements (continued)
(in millions, except share and per share data)
The following section describes the valuation methodologies used to measure the fair value of pension plan assets. There have been no changes in the methodologies used at December 31, 2011 and 2010.
| • | Registered investment companies—Valued at net asset value (“NAV”) of shares at year-end based on quoted market prices. |
| • | Pooled separate accounts—Valued at the NAV of units held at year-end, which has been determined by dividing the fund’s net assets at fair value by its units outstanding at the valuation date. |
| • | Limited partnership interests—Valued based on the unit values of the fund which are determined by dividing the fund’s net assets at fair value by its units outstanding at the valuation date (as estimated by the issuers). The fair value of limited partnership interests is based upon the general partner’s own assumptions about the assumptions a market participant would use in pricing the assets and liabilities of the partnership. |
Plan contributions. Our funding policy for funded pensions is to make annual contributions based on advice from our actuaries and the evaluation of our cash position, but not less than minimum statutory requirements. Contributions for unfunded plans were equal to benefit payments. As a result of the Chapter 11 Petitions, contributions to our U.S. pension plans were suspended; however, upon emergence all past due contributions were made.
Expected future benefit payments—The following benefit payments for our pension plans, which reflect expected future service, as appropriate, are expected to be paid for the periods indicated:
| 2012 |
$ | 15.5 | ||
| 2013 |
16.6 | |||
| 2014 |
16.2 | |||
| 2015 |
17.0 | |||
| 2016 |
17.3 | |||
| 2017 - 2021 |
93.8 | |||
|
|
||||
Other postretirement benefit plans
We maintain health care and life insurance benefit plans covering certain corporate and RPNA segment employees. As a result of the application of fresh-start accounting, on the Effective Date all of our other postretirement benefit obligations were adjusted from their historical amounts to fair value resulting in a $2.7 increase in our benefit obligation. We accrue the cost of postretirement benefits within the covered employees’ active service periods. During the five months ended May 31, 2010, certain of our postretirement benefit plans were amended and a gain totaling $2.1 was recorded.
F-53
Table of Contents
Aleris Corporation
Notes to consolidated financial statements (continued)
(in millions, except share and per share data)
The financial status of the plans at December 31, 2011, December 31, 2010 and May 31, 2010, using a period-end measurement date, is as follows:
| (Successor) | (Predecessor) | |||||||||||||
| For the year ended |
For the seven months ended December 31, 2010 |
For the five months ended May 31, 2010 |
||||||||||||
| Change in benefit obligations |
||||||||||||||
| Benefit obligation at beginning of period |
$ | 53.0 | $ | 51.9 | $ | 52.6 | ||||||||
| Service cost |
0.2 | 0.1 | 0.1 | |||||||||||
| Interest cost |
2.6 | 1.7 | 1.2 | |||||||||||
| Benefits paid |
(5.5 | ) | (3.0 | ) | (2.6 | ) | ||||||||
| Employee contributions |
0.5 | 0.3 | 0.1 | |||||||||||
| Plan curtailment gains |
— | — | (2.6 | ) | ||||||||||
| Medicare subsidies received |
0.3 | — | 0.2 | |||||||||||
| Actuarial loss |
6.4 | 2.0 | 0.3 | |||||||||||
| Translation and other |
— | — | (0.1 | ) | ||||||||||
| Benefit obligation at end of period |
$ | 57.5 | $ | 53.0 | $ | 49.2 | ||||||||
| Change in plan assets |
||||||||||||||
| Fair value of plan assets at beginning of period |
$ | — | $ | — | $ | — | ||||||||
| Employer contributions |
4.7 | 2.7 | 2.3 | |||||||||||
| Employee contributions |
0.5 | 0.3 | 0.1 | |||||||||||
| Medicare subsidies |
0.3 | — | 0.2 | |||||||||||
| Benefits paid |
(5.5 | ) | (3.0 | ) | (2.6 | ) | ||||||||
| Fair value of plan assets at end of period |
$ | — | $ | — | $ | — | ||||||||
| Net amount recognized |
$ | (57.5 | ) | $ | (53.0 | ) | $ | (49.2 | ) | |||||
F-54
Table of Contents
Aleris Corporation
Notes to consolidated financial statements (continued)
(in millions, except share and per share data)
The following table provides the amounts recognized in the Consolidated balance sheet as of December 31, 2011 and 2010:
| (Successor) | ||||||||
| December 31, | ||||||||
| 2011 | 2010 | |||||||
|
|
||||||||
| Accrued liabilities |
$ | 4.6 | $ | 4.5 | ||||
| Accrued postretirement benefits |
52.9 | 48.5 | ||||||
|
|
|
|||||||
| Net amount recognized |
$ | 57.5 | $ | 53.0 | ||||
|
|
|
|||||||
| Amounts recognized in other comprehensive income (before tax) consist of: |
||||||||
| Net actuarial loss |
$ | 8.4 | $ | 2.0 | ||||
|
|
|
|||||||
| $ | 8.4 | $ | 2.0 | |||||
|
|
|
|||||||
| Amortization expected to be recognized during next fiscal year (before tax): |
||||||||
| Amortization of net loss |
$ | (0.3 | ) | $ | — | |||
|
|
|
|||||||
| $ | (0.3 | ) | $ | — | ||||
|
|
|
|||||||
| Additional information: |
||||||||
| For plans with benefit obligations in excess of plan assets: |
||||||||
| Aggregate benefit obligation |
$ | 57.5 | $ | 53.0 | ||||
| Aggregate fair value of plan assets |
— | — | ||||||
|
|
||||||||
The components of net postretirement benefit expense for the year ended December 31, 2011, the seven months ended December 31, 2010, the five months ended May 31, 2010 and the year ended December 31, 2009 are as follows:
| (Successor) | (Predecessor) | |||||||||||||||||
| For the year ended |
For the seven months ended December 31, 2010 |
For the five months ended May 31, 2010 |
For the year ended |
|||||||||||||||
| Service cost |
$ | 0.2 | $ | 0.1 | $ | 0.1 | $ | 0.5 | ||||||||||
| Interest cost |
2.6 | 1.7 | 1.2 | 2.9 | ||||||||||||||
| Amortization of prior service credit |
— | — | (0.1 | ) | (0.2 | ) | ||||||||||||
| Amortization of net loss |
— | — | 0.2 | 0.1 | ||||||||||||||
| Curtailment recognized |
— | — | — | (1.0 | ) | |||||||||||||
| Plan amendments |
— | — | (2.1 | ) | — | |||||||||||||
| Net postretirement benefit expense |
$ | 2.8 | $ | 1.8 | $ | (0.7 | ) | $ | 2.3 | |||||||||
Plan assumptions—We are required to make an assumption regarding the discount rate applied to determine service cost and interest cost. Our objective in selecting a discount rate is to select the best estimate of the rate at which the benefit obligations could be effectively settled. In making this estimate, projected cash flows are developed and are then matched with a yield curve based on an appropriate universe of high-quality corporate bonds.
F-55
Table of Contents
Aleris Corporation
Notes to consolidated financial statements (continued)
(in millions, except share and per share data)
The weighted average assumptions used to determine net postretirement benefit expense and benefit obligations are as follows:
| (Successor) | (Predecessor) | |||||||||||||||||
| For the year ended December 31, 2011 |
For the seven months ended December 31, 2010 |
For the five months ended May 31, 2010 |
For the year ended December 31, 2009 |
|||||||||||||||
| Discount rate used to determine expense |
5.20% | 5.61% | 5.75% | 6.25% | ||||||||||||||
| Discount rate used to determine end of period benefit obligations |
4.30 | 5.20 | 5.61 | 5.75 | ||||||||||||||
| Health care cost trend rate assumed for next year |
7.70% | 7.90% | 8.10% | 8.10% | ||||||||||||||
| Ultimate trend rate |
4.50% | 4.50% | 4.50% | 4.50% | ||||||||||||||
| Year rate reaches ultimate trend rate |
2027 | 2027 | 2027 | 2027 | ||||||||||||||
Assumed health care cost trend rates have an effect on the amounts reported for postretirement benefit plans. A one-percentage change in assumed health care cost trend rates would have the following effects:
| 1% increase | 1% decrease | |||||||
|
|
||||||||
| Effect on total service and interest components |
$ | 0.1 | $ | (0.1 | ) | |||
| Effect on postretirement benefit obligations |
2.9 | (2.5 | ) | |||||
|
|
||||||||
Plan contributions—Our policy for the plan is to make contributions equal to the benefits paid during the year.
Expected future benefit payments—The following benefit payments are expected to be paid for the periods indicated:
| Gross benefit payment | Net of Medicare Part D subsidy | |||||||
|
|
||||||||
| 2012 |
$ | 4.8 | $ | 4.5 | ||||
| 2013 |
4.8 | 4.5 | ||||||
| 2014 |
4.8 | 4.6 | ||||||
| 2015 |
4.8 | 4.6 | ||||||
| 2016 |
4.8 | 4.5 | ||||||
| 2017 - 2021 |
21.6 | 20.8 | ||||||
|
|
||||||||
Early retirement plans
Our Belgian and German subsidiaries sponsor various unfunded early retirement benefit plans. The obligations under these plans at December 31, 2011 and 2010 total $17.7 and $20.8, respectively, of which $5.7, the estimated payments under these plans for the year ending December 31, 2012, has been classified as a current liability at December 31, 2011.
F-56
Table of Contents
Aleris Corporation
Notes to consolidated financial statements (continued)
(in millions, except share and per share data)
13. Stock-based compensation
Successor stock-based compensation plan
As contemplated by the Plan, on June 1, 2010 the Board of Directors approved the Aleris Corporation 2010 Equity Incentive Plan (the “2010 Equity Plan”). Subsequent to emergence, stock options, restricted stock units and restricted shares have been granted under the 2010 Equity Plan to certain members of senior management of the Company and other nonemployee directors. The options have been granted in one to three tranches with varying exercise prices ranging from $21.19 to $60.09 (after adjustment for the dividends described below). Substantially all stock options, regardless of the tranche, have a ten-year life and generally vest quarterly over four years. The restricted stock units and restricted shares also generally vest quarterly over four years. A portion of each tranche of stock options, as well as a portion of the restricted stock units and restricted shares, may vest upon a change in control event should the event occur prior to full vesting of these awards, depending on the amount of vesting that has already occurred at the time of the event in comparison to the change in the Backstop Parties’ overall level of the ownership that results from the event.
On February 28, 2011, June 30, 2011 and November 10, 2011, the Board of Directors paid a $9.60, $3.20 and $3.20 dividend per share to our stockholders as of February 17, 2011, June 21, 2011 and October 28, 2011, respectively. As provided in the 2010 Equity Plan, the Board approved the necessary actions to effectuate an option adjustment to (i) increase the number of shares underlying each option outstanding as of February 17, 2011, June 21, 2011 and October 28, 2011, and (ii) proportionately decrease the exercise price of each option to reflect the dilutive impact of the dividends paid. The option adjustments did not result in incremental compensation costs. All stock option activity shown below has been adjusted to reflect the option adjustments approved by the Board.
During the year ended December 31, 2011 and the seven months ended December 31, 2010, we recorded $10.1 and $4.9 of compensation expense, respectively, associated with these options, restricted stock units and restricted shares. During the year ended December 31, 2011, $1.6 of excess tax benefits were recognized associated with the Company’s share-based payment arrangements.
F-57
Table of Contents
Aleris Corporation
Notes to consolidated financial statements (continued)
(in millions, except share and per share data)
During the seven months ended December 31, 2010, 2,848,707 options were granted with a weighted average exercise price and weighted average grant date fair value of $26.92 and $10.25 (after adjustment for dividends), respectively. A summary of stock option activity for the year ended December 31, 2011 is as follows:
| Service-based options | Options | Weighted average exercise price per option |
Weighted average |
Weighted average grant date fair value |
||||||||||||
|
|
||||||||||||||||
| Outstanding at January 1, 2011 (Successor) |
2,825,358 | $ | 26.92 | $ | 10.25 | |||||||||||
| Granted |
205,408 | 42.32 | 18.90 | |||||||||||||
| Expired |
(1,754 | ) | 24.36 | 10.38 | ||||||||||||
| Forfeited |
(54,941 | ) | 27.66 | 10.87 | ||||||||||||
|
|
|
|||||||||||||||
| Outstanding at December 31, 2011 (Successor) |
2,974,071 | $ | 27.98 | 8.5 | $ | 10.84 | ||||||||||
|
|
|
|||||||||||||||
| Options vested and expected to vest at December 31, 2011 |
2,815,959 | $ | 27.77 | 8.5 | $ | 10.72 | ||||||||||
| Options exercisable at December 31, 2011 |
1,058,380 | $ | 27.03 | 8.5 | $ | 10.30 | ||||||||||
|
|
||||||||||||||||
Summarized information on options outstanding at December 31, 2011 is as follows:
| Tranche | ||||||||||||
| 1 | 2 | 3 | ||||||||||
|
|
||||||||||||
| Range of exercise price |
$ | 21.19 - $44.80 | $ | 31.78 - $45.08 | $ | 42.38 - $60.09 | ||||||
| Number outstanding |
2,062,797 | 455,637 | 455,637 | |||||||||
| Weighted-average remaining contractual life, in years |
8.55 | 8.44 | 8.44 | |||||||||
| Weighted-average exercise price |
$ | 23.77 | $ | 32.15 | $ | 42.87 | ||||||
| Number exercisable |
715,360 | 171,508 | 171,512 | |||||||||
| Weighted-average exercise price |
$ | 22.06 | $ | 32.05 | $ | 42.74 | ||||||
|
|
||||||||||||
Because the Company does not have historical stock option exercise experience, which would provide a reasonable basis upon which to estimate the expected life of the stock options granted during the year ended December 31, 2011 and the seven months ended December 31, 2010, the Company has elected to use the simplified method to estimate the expected life of the stock options granted, as allowed by SEC SAB No. 107 and the continued acceptance of the simplified method indicated in SEC SAB No. 110.
At December 31, 2011, there was $25.0 of compensation expense that is expected to be recorded over the next four years pertaining to the stock options, restricted stock units and restricted shares.
The Black-Scholes method was used to estimate the fair value of the stock options granted. Under this method, the estimate of fair value is affected by the assumptions included in the following table. Expected equity volatility was determined based on historical stock prices and
F-58
Table of Contents
Aleris Corporation
Notes to consolidated financial statements (continued)
(in millions, except share and per share data)
implied and stated volatilities of our peer companies. The following table summarizes the significant assumptions used to determine the fair value of the stock options granted during the year ended December 31, 2011 and the seven months ended December 31, 2010:
| Year ended December 31, 2011 |
Seven months ended December 31, 2010 |
|||||||
|
|
||||||||
| Weighted-average expected option life in years |
6.0 | 6.1 | ||||||
| Risk-free interest rate |
1.2% - 1.7% | 2.4% | ||||||
| Equity volatility factor |
50.0% - 58.0% | 59.4% | ||||||
| Dividend yield |
—% | —% | ||||||
|
|
||||||||
During the seven months ended December 31, 2010, 324,177 of restricted stock units and restricted shares were granted with a weighted average grant date fair value of $29.22. A summary of restricted stock units and restricted shares activity for the year ended December 31, 2011 is as follows:
| Restricted stock units and restricted shares | Shares | Weighted average grant date fair value |
||||||
|
|
||||||||
| Outstanding at January 1, 2011 (Successor) |
283,971 | $ | 29.22 | |||||
| Granted |
27,000 | 48.84 | ||||||
| Vested |
(82,357 | ) | 31.44 | |||||
| Forfeited |
(4,375 | ) | 35.09 | |||||
|
|
|
|||||||
| Outstanding at December 31, 2011 (Successor) |
224,239 | $ | 32.99 | |||||
|
|
||||||||
Predecessor stock-based compensation plan
During the five months ended May 31, 2010 and the year ended December 31, 2009, we recorded compensation expense associated with options granted under the Predecessor’s stock-based incentive plan of $1.3 and $2.1, respectively. Stock-based compensation expense was recognized by the Debtors until the underlying awards were canceled upon emergence. At that time, all previously recognized expense was reversed and credited to “Reorganization items, net” in the Consolidated statements of operations.
14. Derivative and other financial instruments
We use forward contracts and options, as well as contractual price escalators, to reduce the risks associated with our aluminum, natural gas and other supply requirements and certain currency exposures. Generally, we enter into master netting arrangements with our counterparties and offset net derivative positions with the same counterparties against amounts recognized for the right to reclaim cash collateral or the obligation to return cash collateral under those arrangements in our Consolidated balance sheet. For classification purposes, we record the net fair value of all the positions expected to settle in less than one year with these counterparties as a net current asset or liability and all long-term positions as a net long-term asset or liability. At
F-59
Table of Contents
Aleris Corporation
Notes to consolidated financial statements (continued)
(in millions, except share and per share data)
December 31, 2011 and 2010, we had posted cash collateral totaling approximately $0.5 and $3.6, respectively, of which $0.3 and $3.6, respectively, related to counterparties in a net asset position and, therefore, was recorded within “Prepaid expenses and other current assets” on the Consolidated balance sheet. The amounts shown in the table below represent the fair value of individual contracts, regardless of the net position presented in the Consolidated balance sheet:
| Fair value of derivatives as of December 31, | ||||||||||||||||
| (Successor) | ||||||||||||||||
| 2011 | 2010 | |||||||||||||||
| Derivatives by type | Asset | Liability | Asset | Liability | ||||||||||||
|
|
||||||||||||||||
| Metal |
$ | 20.8 | $ | (33.7 | ) | $ | 44.1 | $ | (23.3 | ) | ||||||
| Natural gas |
— | (4.2 | ) | 0.9 | (0.6 | ) | ||||||||||
| Currency |
0.3 | — | — | — | ||||||||||||
|
|
|
|||||||||||||||
| Total |
21.1 | (37.9 | ) | 45.0 | (23.9 | ) | ||||||||||
| Effect of counterparty netting |
(20.1 | ) | 20.1 | (18.3 | ) | 18.3 | ||||||||||
| Effect of cash collateral |
— | 0.2 | — | — | ||||||||||||
|
|
|
|||||||||||||||
| Net derivatives as classified in the balance sheet |
$ | 1.0 | $ | (17.6 | ) | $ | 26.7 | $ | (5.6 | ) | ||||||
|
|
||||||||||||||||
The fair values of our derivative financial instruments at December 31, 2011 and December 31, 2010 are recorded on the Consolidated balance sheet as follows:
| (Successor) | ||||||||||
| December 31, | ||||||||||
| Asset derivatives | Balance sheet location | 2011 | 2010 | |||||||
|
|
||||||||||
| Metal |
Current derivative financial instruments | $ | 0.5 | $ | 17.2 | |||||
| Long-term derivative financial instruments | 0.2 | 9.4 | ||||||||
| Natural gas |
Current derivative financial instruments | — | 0.2 | |||||||
| Long-term derivative financial instruments | — | (0.1 | ) | |||||||
| Currency |
Current derivative financial instruments | 0.3 | — | |||||||
|
|
|
|||||||||
| Total |
$ | 1.0 | $ | 26.7 | ||||||
|
|
||||||||||
| (Successor) | ||||||||||
| December 31, | ||||||||||
| Liability derivatives | Balance sheet location | 2011 | 2010 | |||||||
|
|
||||||||||
| Metal |
Accrued liabilities | $ | 10.1 | $ | 5.8 | |||||
| Other long-term liabilities | 3.5 | — | ||||||||
| Natural gas |
Accrued liabilities | 4.0 | (0.2 | ) | ||||||
|
|
|
|||||||||
| Total |
$ | 17.6 | $ | 5.6 | ||||||
|
|
||||||||||
Derivative contracts are recorded at fair value under ASC 820 using quoted market prices and significant other observable and unobservable inputs. Fair value is defined as the price that would be received to sell an asset or paid to transfer a liability in an orderly transaction between
F-60
Table of Contents
Aleris Corporation
Notes to consolidated financial statements (continued)
(in millions, except share and per share data)
market participants at the measurement date. The fair value hierarchy distinguishes between (1) market participant assumptions developed based on market data obtained from independent sources (observable inputs) and (2) an entity’s own assumptions about market participant assumptions developed based on the best information available in the circumstances (unobservable inputs). The fair value hierarchy consists of three broad levels, which gives the highest priority to unadjusted quoted prices in active markets for identical assets or liabilities (Level 1) and the lowest priority to unobservable inputs (Level 3). The three levels of the fair value hierarchy are described below:
Level 1—Unadjusted quoted prices in active markets that are accessible at the measurement date for identical, unrestricted assets or liabilities.
Level 2—Inputs other than quoted prices included within Level 1 that are observable for the asset or liability, either directly or indirectly, including quoted prices for similar assets or liabilities in active markets; quoted prices for identical or similar assets or liabilities in markets that are not active; inputs other than quoted prices that are observable for the asset or liability (e.g., interest rates); and inputs that are derived principally from or corroborated by observable market data by correlation or other means.
Level 3—Inputs that are both significant to the fair value measurement and unobservable.
We endeavor to utilize the best available information in measuring fair value. Where appropriate, valuations are adjusted for various factors such as liquidity, bid/offer spreads, and credit considerations. Such adjustments are generally based on available market evidence and unobservable inputs. Financial assets and liabilities are classified in their entirety based on the lowest level of input that is significant to the fair value measurement. The following tables set forth our financial assets and liabilities that are accounted for at fair value on a recurring basis as of December 31, 2011 and 2010 and the level in the fair value hierarchy:
| Fair value measurements at December 31, 2011 using: | ||||||||||||||||
| Description | Total carrying value in the consolidated balance sheet |
Quoted prices in active markets for identical assets (Level 1) |
Significant (Level 2) |
Significant (Level 3) |
||||||||||||
|
|
||||||||||||||||
| Derivative assets |
$ | 21.1 | $ | — | $ | 21.1 | $ | — | ||||||||
| Derivative liabilities |
(37.9 | ) | — | (37.9 | ) | — | ||||||||||
|
|
|
|||||||||||||||
| Net derivative liabilities |
$ | (16.8 | ) | $ | — | $ | (16.8 | ) | $ | — | ||||||
|
|
||||||||||||||||
| Fair value measurements at December 31, 2010 using: | ||||||||||||||||
| Description | Total carrying value in the consolidated balance sheet |
Quoted prices in active markets for identical assets (Level 1) |
Significant (Level 2) |
Significant (Level 3) |
||||||||||||
|
|
||||||||||||||||
| Derivative assets |
$ | 45.0 | $ | — | $ | 45.0 | $ | — | ||||||||
| Derivative liabilities |
(23.9 | ) | — | (23.9 | ) | — | ||||||||||
|
|
|
|||||||||||||||
| Net derivative assets |
$ | 21.1 | $ | — | $ | 21.1 | $ | — | ||||||||
|
|
||||||||||||||||
F-61
Table of Contents
Aleris Corporation
Notes to consolidated financial statements (continued)
(in millions, except share and per share data)
Both realized and unrealized gains and losses on those derivative financial instruments are included within “(Gains) losses on derivative financial instruments” in the Consolidated statements of operations. Realized (gains) losses on derivative financial instruments totaled the following during the year ended December 31, 2011, the seven months ended December 31, 2010, the five months ended May 31, 2010 and the year ended December 31, 2009:
| Realized (gains) losses on derivative financial instruments | ||||||||||||||||||
| (Successor) | (Predecessor) | |||||||||||||||||
| For the year ended |
For the seven months ended December 31, 2010 |
For the five months ended May 31, 2010 |
For the year ended |
|||||||||||||||
| Metal |
$ | (41.9 | ) | $ | 11.5 | $ | (11.8 | ) | $ | (12.8 | ) | |||||||
| Natural gas |
3.8 | 2.1 | 1.2 | 9.8 | ||||||||||||||
| Currency |
0.3 | — | — | (2.8 | ) | |||||||||||||
Metal hedging
The selling prices of the majority of the orders for our rolled and extruded products are established at the time of order entry or, for certain customers, under long-term contracts. As the related raw materials used to produce these orders are purchased several months or years after the selling prices are fixed, margins are subject to the risk of changes in the purchase price of the raw materials used for these fixed price sales. In order to manage this transactional exposure, London Metal Exchange (“LME”) future or forward purchase contracts are purchased at the time the selling prices are fixed. As metal is purchased to fill these fixed price sales orders, LME futures or forward contracts are then sold. We can also use call option contracts, which function in a manner similar to the natural gas option contracts discussed below, and put option contracts for managing metal price exposures. Upon settlement of a put option contract, we receive cash and recognize a related gain if the LME closing price is less than the strike price of the put option. If the put option strike price is less than the LME closing price, no amount is paid and the option expires. As of December 31, 2011 and 2010, we had 0.2 and 0.2 metric tons of aluminum buy and sell forward contracts, respectively.
Natural gas hedging
To manage our price exposure for natural gas purchases, we fix the future price of a portion of our natural gas requirements by entering into financial hedge agreements. Under these contracts, payments are made or received based on the differential between the monthly closing price on the New York Mercantile Exchange (“NYMEX”) and the contractual hedge price. We also enter into call option contracts to manage the exposure to increasing prices while maintaining our ability to benefit from declining prices. Upon settlement of call option contracts, we receive cash and recognize a related gain if the NYMEX closing price exceeds the strike price of the call option. If the call option strike price exceeds the NYMEX price, no amount is received and the option expires. Option contracts require the payment of a premium which is recorded as a realized loss upon settlement or expiration of the option contract. Natural gas cost can also be
F-62
Table of Contents
Aleris Corporation
Notes to consolidated financial statements (continued)
(in millions, except share and per share data)
managed through the use of cost escalators included in some of our long-term supply contracts with customers, which limits exposure to natural gas price risk. As of December 31, 2011 and 2010, we had 2.3 trillion and 7.7 trillion, respectively, of British thermal unit forward buy contracts.
Currency exchange hedging
The construction of an aluminum rolling mill in China has increased our China Joint Venture’s exposure to fluctuations in the euro as certain of the contracts to purchase equipment are denominated in euros while our China Joint Venture’s source of funding is the U.S. dollar and Renminbi denominated China Loan Facility. Our equity contributions are primarily made in euros to mitigate this exposure. In addition, our China Joint Venture has entered into euro call option contracts to manage this exposure if the U.S. dollar weakens while maintaining the benefit if the dollar strengthens. As with all of our other derivative financial instruments, these option contracts are not accounted for as hedges and, as a result, the changes in fair value are recorded immediately in the Consolidated statements of operations. These contracts cover periods consistent with known or expected exposures through 2012. As of December 31, 2011, we had euro call option contracts covering a notional amount of $48.5.
Credit risk
We are exposed to losses in the event of non-performance by the counterparties to the derivative financial instruments discussed above; however, we do not anticipate any non-performance by the counterparties. The counterparties are evaluated for creditworthiness and risk assessment prior to initiating trading activities with the brokers.
Other financial instruments
The carrying amount and fair values of our other financial instruments at December 31, 2011 and 2010 are as follows:
| (Successor) | ||||||||||||||||
| December 31, | ||||||||||||||||
| 2011 | 2010 | |||||||||||||||
| Carrying amount |
Fair value | Carrying amount |
Fair value | |||||||||||||
|
|
||||||||||||||||
| Cash and cash equivalents |
$ | 231.4 | $ | 231.4 | $ | 113.5 | $ | 113.5 | ||||||||
| ABL Facility |
— | — | — | — | ||||||||||||
| Exchangeable Notes |
44.1 | 107.4 | 44.1 | 75.2 | ||||||||||||
| Senior Notes |
491.2 | 490.0 | — | — | ||||||||||||
| China Loan Facility |
55.9 | 56.9 | — | — | ||||||||||||
|
|
||||||||||||||||
The fair value of our Exchangeable Notes was estimated using a binomial lattice pricing model based on the fair value of our common stock, a risk-free interest rate of 1.7% and expected
F-63
Table of Contents
Aleris Corporation
Notes to consolidated financial statements (continued)
(in millions, except share and per share data)
equity volatility of 50%. Expected equity volatility was determined based on historical stock prices and implied and stated volatilities of our peer companies. The fair value of the Senior Notes was estimated using market quotations. The fair value of our accounts receivable, accounts payable and accrued liabilities approximate carrying value. The fair value of our China Loan Facility approximates the aggregate principal balance outstanding.
15. Income taxes
The income (loss) before income taxes was as follows:
| (Successor) | (Predecessor) | |||||||||||||||||
| For the year ended |
For the seven months ended December 31, 2010 |
For the five months ended May 31, 2010 |
For the year ended |
|||||||||||||||
| U.S. |
$ | 3.4 | $ | (13.8 | ) | $ | 814.7 | $ | (551.7 | ) | ||||||||
| International |
153.6 | 85.5 | 1,380.7 | (697.5 | ) | |||||||||||||
| Total |
$ | 157.0 | $ | 71.7 | $ | 2,195.4 | $ | (1,249.2 | ) | |||||||||
The (benefit from) provision for income taxes was as follows:
| (Successor) | (Predecessor) | |||||||||||||||||
| For the year ended |
For the seven months ended December 31, 2010 |
For the five months ended May 31, 2010 |
For the year ended |
|||||||||||||||
| Current: |
||||||||||||||||||
| Federal |
$ | 2.5 | $ | 3.3 | $ | (0.8 | ) | $ | 0.4 | |||||||||
| State |
1.2 | 1.0 | (0.1 | ) | (4.6 | ) | ||||||||||||
| International |
25.7 | 0.8 | 3.6 | (3.4 | ) | |||||||||||||
| $ | 29.4 | $ | 5.1 | $ | 2.7 | $ | (7.6 | ) | ||||||||||
| Deferred: |
||||||||||||||||||
| Federal |
$ | 0.4 | $ | 0.2 | $ | (10.7 | ) | $ | (19.7 | ) | ||||||||
| State |
(0.2 | ) | 0.3 | (1.2 | ) | (2.4 | ) | |||||||||||
| International |
(33.8 | ) | (5.3 | ) | 0.5 | (32.1 | ) | |||||||||||
| $ | (33.6 | ) | $ | (4.8 | ) | $ | (11.4 | ) | $ | (54.2 | ) | |||||||
| (Benefit from) provision for income taxes |
$ | (4.2 | ) | $ | 0.3 | $ | (8.7 | ) | $ | (61.8 | ) | |||||||
F-64
Table of Contents
Aleris Corporation
Notes to consolidated financial statements (continued)
(in millions, except share and per share data)
The income tax (benefit) expense, computed by applying the federal statutory tax rate to the income (loss) before income taxes, differed from the (benefit from) provision for income taxes as follows:
| (Successor) | (Predecessor) | |||||||||||||||||
| For the year ended |
For the seven months ended December 31, 2010 |
For the five months ended May 31, 2010 |
For the year ended |
|||||||||||||||
|
|
||||||||||||||||||
| Income tax expense (benefit) at the federal statutory rate |
$ | 55.0 | $ | 25.1 | $ | 768.4 | $ | (437.2 | ) | |||||||||
| Foreign income tax rate differences |
(53.4 | ) | 3.4 | (438.1 | ) | 38.7 | ||||||||||||
| State income taxes, net |
0.9 | 0.6 | 42.4 | (20.0 | ) | |||||||||||||
| Tax on deemed dividend of foreign earnings, net of foreign tax credit |
18.5 | — | — | 26.9 | ||||||||||||||
| Foreign intercompany debt revaluation |
6.1 | — | — | — | ||||||||||||||
| Goodwill impairment |
— | — | — | 11.2 | ||||||||||||||
| Other, net |
0.2 | (0.1 | ) | 3.9 | — | |||||||||||||
| Change in uncertain tax position |
6.3 | 0.7 | (0.6 | ) | 1.8 | |||||||||||||
| Plan of reorganization adjustment |
— | — | (671.6 | ) | — | |||||||||||||
| Fresh start accounting adjustment |
— | — | 483.3 | — | ||||||||||||||
| Change in valuation allowance |
(37.8 | ) | (29.4 | ) | (196.4 | ) | 316.8 | |||||||||||
|
|
|
|||||||||||||||||
| (Benefit from) provision for income taxes |
$ | (4.2 | ) | $ | 0.3 | $ | (8.7 | ) | $ | (61.8 | ) | |||||||
|
|
||||||||||||||||||
Deferred income taxes reflect the net tax effects of temporary differences between the carrying amounts of assets and liabilities for financial reporting purposes and the amounts used for income tax purposes.
F-65
Table of Contents
Aleris Corporation
Notes to consolidated financial statements (continued)
(in millions, except share and per share data)
Significant components of our deferred tax liabilities and assets are as follows:
| (Successor) | ||||||||
| December 31, | ||||||||
| 2011 | 2010 | |||||||
|
|
||||||||
| Deferred tax liabilities |
||||||||
| Property, plant and equipment and intangible assets |
$ | 21.9 | $ | — | ||||
| Derivative financial instruments |
7.7 | 6.2 | ||||||
| Exchange gain |
0.4 | 3.8 | ||||||
| Prepaid expenses |
1.1 | 1.5 | ||||||
| Inventories |
6.2 | 4.6 | ||||||
| Other |
7.6 | 21.6 | ||||||
|
|
|
|||||||
| Total deferred tax liabilities |
$ | 44.9 | $ | 37.7 | ||||
| Deferred tax assets |
||||||||
| Net operating loss carryforwards |
$ | 203.3 | $ | 190.9 | ||||
| Property, plant and equipment and intangible assets |
115.1 | 134.2 | ||||||
| Tax credit carryforwards |
11.9 | 14.3 | ||||||
| Accrued liabilities |
25.8 | 13.6 | ||||||
| Accrued pension benefits |
36.9 | 28.5 | ||||||
| Accrued postretirement benefits |
22.5 | 20.0 | ||||||
| Derivative financial instruments |
2.3 | 5.2 | ||||||
| Inventories |
5.9 | 1.9 | ||||||
| Other |
14.4 | 21.5 | ||||||
|
|
|
|||||||
| $ | 438.1 | $ | 430.1 | |||||
| Valuation allowance |
(364.6 | ) | (399.4 | ) | ||||
|
|
|
|||||||
| Total deferred tax assets |
$ | 73.5 | $ | 30.7 | ||||
|
|
|
|||||||
| Net deferred tax assets (liabilities) |
$ | 28.6 | $ | (7.0 | ) | |||
|
|
||||||||
At December 31, 2011 and 2010, we had valuation allowances of $364.6 and $399.4, respectively, to reduce certain deferred tax assets to amounts that are more likely than not to be realized. Of the total 2011 and 2010 valuation allowance, $244.3 and $267.1 relate primarily to net operating losses and future tax deductions for depreciation in non-U.S. tax jurisdictions, $109.1 and $120.9 relate primarily to the U.S. federal effects of amortization, pension and postretirement benefits and $11.2 and $11.4 relate primarily to the state effects of amortization, pension and postretirement benefits, respectively. The net reduction in the valuation allowance is primarily attributable to the recognition of the net deferred tax assets in Germany and the decrease in the underlying net deferred tax assets in the U.S. resulting from bonus depreciation. We will maintain full valuation allowances against our net deferred tax assets in the U.S. and other applicable jurisdictions until sufficient positive evidence exists to reduce or eliminate the valuation allowance.
F-66
Table of Contents
Aleris Corporation
Notes to consolidated financial statements (continued)
(in millions, except share and per share data)
The valuation allowances recognized relate to certain net deferred tax assets in the U.S. and non-U.S. tax jurisdictions. The following table summarizes the change in the valuation allowances:
| (Successor) | (Predecessor) | |||||||||||||||||
| For the year ended |
For the seven months ended |
For the five months ended May 31, 2010 |
For the year ended |
|||||||||||||||
| Balance at beginning of |
$ | 399.4 | $ | 405.1 | $ | 648.4 | $ | 312.6 | ||||||||||
| (Reversals) additions |
(37.8 | ) | (29.4 | ) | 20.9 | 316.9 | ||||||||||||
| Accumulated other |
11.0 | — | — | 4.6 | ||||||||||||||
| Currency translation |
(8.0 | ) | 23.7 | (46.9 | ) | 14.3 | ||||||||||||
| Balance at end of the |
$ | 364.6 | $ | 399.4 | $ | 622.4 | $ | 648.4 | ||||||||||
In June 2010, as a result of the plan of reorganization, adjustments were required to valuation allowances, which resulted in a net decrease in valuation allowances of $217.3. The net decrease was primarily the result of U.S. federal and state tax attribute reductions related to debt cancellation income and differences between fresh-start reporting fair value and tax bases of assets and liabilities at entities with valuation allowances.
At December 31, 2011, we had approximately $685.6 of unused net operating loss carryforwards associated with non-U.S. tax jurisdictions, of which $554.6 can be carried forward indefinitely. The remaining net operating loss carryforwards may be carried forward from 5 to 20 years. At December 31, 2011, there were no U.S. federal net operating loss carryforwards. The tax benefits associated with state net operating loss carryforwards at December 31, 2011 were $0.7. The Predecessor’s U.S. federal and state net operating loss carryforwards were decreased by the attribute reduction required in Internal Revenue Code section 108. This reduction relates to the cancellation of indebtedness income resulting from the emergence from Chapter 11. The net operating losses in Germany, in the amount of $103.5, were eliminated as a result of the change of ownership upon emergence from Chapter 11.
At December 31, 2011 and 2010, we had $0.9 and $0.7, respectively, of unused state tax credit carryforwards for which a full valuation allowance has been provided.
Substantially all of the $37.8 of undistributed earnings of our non-U.S. investments are considered permanently reinvested and, accordingly, no additional U.S. income taxes or non-U.S. withholding taxes have been provided. It is not practicable to calculate the deferred taxes associated with the remittance of these earnings.
F-67
Table of Contents
Aleris Corporation
Notes to consolidated financial statements (continued)
(in millions, except share and per share data)
Aleris Corporation and its subsidiaries file income tax returns in the U.S. federal jurisdiction, and various state and foreign jurisdictions.
The following table summarizes the change in uncertain tax positions:
| (Successor) | (Predecessor) | |||||||||||||
| For the year ended |
For the seven months ended |
For the five months ended May 31, 2010 |
||||||||||||
| Balance at beginning of the period |
$ | 12.5 | $ | 10.7 | $ | 13.3 | ||||||||
| Additions based on tax positions related to |
— | 0.7 | 0.7 | |||||||||||
| Additions for tax positions of prior years |
8.9 | 1.1 | — | |||||||||||
| Reductions for tax positions of prior |
(2.7 | ) | — | (3.3 | ) | |||||||||
| Settlements |
(1.1 | ) | — | — | ||||||||||
| Balance at end of period |
$ | 17.6 | $ | 12.5 | $ | 10.7 | ||||||||
We recognize interest and penalties related to uncertain tax positions within the “(Benefit from) provision for income taxes” in the Consolidated statements of operations. Interest of $1.9 and $0.8 was accrued on the uncertain tax positions as of December 31, 2011 and December 31, 2010, respectively. Total interest of $1.3, $0.0, $0.1 and $0.4 was recognized as part of the (benefit from) provision for income taxes for the year ended December 31, 2011, the seven months ended December 31, 2010, the five months ended May 31, 2010 and the year ended December 31, 2009, respectively. Accrued penalties are not significant.
The 2005 through 2010 tax years remain open to examination. We have continuing responsibility for the open tax years for the Predecessor’s non-filing foreign subsidiaries. A non-U.S. taxing jurisdiction commenced an examination in the fourth quarter of 2009 that is anticipated to be completed within six months of the reporting date. We anticipate adjustments to various intercompany charges and depreciation lives that will result in a decrease in the reserve of $15.8. Additionally, we are appealing the German government’s position with regard to net operating loss carryforwards available for use in the year of our change of ownership that occurred upon emergence from Chapter 11. A successful appeal will result in a decrease in the reserve of $1.8.
16. Commitments and contingencies
Operating leases
We lease various types of equipment and property, primarily office space at various locations and the equipment utilized in our operations. The future minimum lease payments required under operating leases that have initial or remaining non-cancelable lease terms in excess of one year as of December 31, 2011, are as follows:
| 2012 | 2013 | 2014 | 2015 | 2016 | Thereafter | |||||||||||||||||||
|
|
||||||||||||||||||||||||
| Operating leases |
$ | 7.8 | $ | 6.8 | $ | 3.9 | $ | 2.2 | $ | 1.7 | $ | 2.2 | ||||||||||||
|
|
||||||||||||||||||||||||
F-68
Table of Contents
Aleris Corporation
Notes to consolidated financial statements (continued)
(in millions, except share and per share data)
Rental expense for the year ended December 31, 2011, the seven months ended December 31, 2010, the five months ended May 31, 2010, and the year ended December 31, 2009 was $18.5, $10.4, $7.3 and $16.2, respectively.
Purchase obligations
Our non-cancelable purchase obligations are principally for materials, such as metals and fluxes used in our manufacturing operations, natural gas and other services. Our purchase obligations are long-term agreements to purchase goods or services that are enforceable and legally binding on us that specify all significant terms, including fixed or minimum quantities to be purchased; fixed, minimum or variable price provisions; and the approximate timing of the transaction. Purchase obligations include the pricing of anticipated metal purchases using contractual metal prices or, where pricing is dependent upon the prevailing LME metal prices at the time of delivery, market metals prices as of December 31, 2011, as well as natural gas and electricity purchases using minimum contractual quantities and either contractual prices or prevailing rates. As a result of the variability in the pricing of many of our metals purchase obligations, actual amounts paid may vary from the amounts shown below. As of December 31,2011, amounts due under long-term non-cancelable purchase obligations are as follows:
| 2012 | 2013 | 2014 | 2015 | 2016 | After 2016 | |||||||||||||||||||
|
|
||||||||||||||||||||||||
| Purchase obligations |
$ | 484.3 | $ | 479.4 | $ | 341.6 | $ | 114.5 | $ | 9.0 | $ | — | ||||||||||||
|
|
||||||||||||||||||||||||
Amounts purchased under long-term purchase obligations during the year ended December 31, 2011, the seven months ended December 31, 2010, the five months ended May 31, 2010 and the year ended December 31, 2009 approximated previously projected amounts.
Employees
Approximately 45% of our U.S. employees and substantially all of our non-U.S. employees are covered by collective bargaining agreements.
Environmental proceedings
Our operations are subject to environmental laws and regulations governing air emissions, wastewater discharges, the handling, disposal and remediation of hazardous substances and wastes and employee health and safety. These laws can impose joint and several liabilities for releases or threatened releases of hazardous substances upon statutorily defined parties, including us, regardless of fault or the lawfulness of the original activity or disposal. Given the changing nature of environmental legal requirements, we may be required, from time to time, to take environmental control measures at some of our facilities to meet future requirements.
We have been named as a potentially responsible party in certain proceedings initiated pursuant to the Comprehensive Environmental Response, Compensation, and Liability Act and similar stated statutes and may be named a potentially responsible party in other similar proceedings in
F-69
Table of Contents
Aleris Corporation
Notes to consolidated financial statements (continued)
(in millions, except share and per share data)
the future. It is not anticipated that the costs incurred in connection with the presently pending proceedings will, individually or in the aggregate, have a material adverse effect on our financial position or results of operations.
We are performing operations and maintenance at two Superfund sites for matters arising out of past waste disposal activity associated with closed facilities. We are also under orders to perform environmental remediation by agencies in four states and one non-U.S. country at seven sites.
Our reserves for environmental remediation liabilities totaled $36.5 and $36.2 at December 31, 2011 and 2010, respectively, and have been classified as “Other long-term liabilities” and “Accrued liabilities” in the Consolidated balance sheet. Of the environmental liabilities recorded at December 31, 2011, $6.9 is indemnified by Corus Group Ltd. These amounts are in addition to our asset retirement obligations discussed in Note 10, “Asset retirement obligations,” and represent the most probable costs of remedial actions. We estimate the costs related to currently identified remedial actions will be paid out primarily over the next ten years.
The changes in our accruals for environmental liabilities are as follows:
| (Successor) | (Predecessor) | |||||||||||||||
| For the year ended |
For the seven months ended December 31, 2010 |
For the five months ended May 31, 2010 |
For the year ended |
|||||||||||||
| Balance at the beginning of the period |
$ | 36.2 | $ | 35.9 | $ | 42.3 | $ | 47.0 | ||||||||
| Revisions and liabilities incurred |
0.7 | (0.4 | ) | 2.2 | 0.7 | |||||||||||
| Payments |
(0.2 | ) | (0.4 | ) | (0.2 | ) | (0.6 | ) | ||||||||
| Liquidation of Canada LP |
— | — | — | (4.8 | ) | |||||||||||
| Translation and other charges |
(0.2 | ) | 1.1 | (0.8 | ) | — | ||||||||||
| Balance at the end of the period |
$ | 36.5 | $ | 36.2 | $ | 43.5 | $ | 42.3 | ||||||||
Pursuant to the Plan, $7.6 of environmental liabilities at sites where we have been named the primary responsible party but which are owned by a third party were discharged and written off through the Plan of Reorganization adjustments.
Legal proceedings
We are party to routine litigation and proceedings as part of the ordinary course of business and do not believe that the outcome of any existing proceedings would have a material adverse effect on our financial position, results of operations or cash flows. We have established accruals for those loss contingencies, including litigation and environmental contingencies, for which it has been determined that a loss is probable; none of such loss contingencies is material. For those
F-70
Table of Contents
Aleris Corporation
Notes to consolidated financial statements (continued)
(in millions, except share and per share data)
loss contingencies, including litigation and environmental contingencies, which have been determined to be reasonably possible, an estimate of the possible loss or range of loss cannot be determined because the claims, amount claimed, facts or legal status are not sufficiently developed or advanced in order to make such a determination. While we cannot estimate the loss or range of loss at this time, we do not believe that the outcome of any of these existing proceedings would be material.
17. Segment information
During the fourth quarter of 2011, the Company realigned its operating structure into two global business units, Global Rolled and Extruded Products and Global Recycling. The Company believes this realignment supports its growth strategies and provides the appropriate focus on its global markets, including aerospace and defense, automotive and heat exchangers, as well as on its regionally based products and customers. The Company’s management and operating structure, including the manner in which results are reviewed by the chief operating decision maker, were significantly changed in the fourth quarter to account for this change. In addition, the Company’s financial systems were updated to make discrete financial information available for the new operating segments discussed below during the fourth quarter of 2011.
These global business units are divided into five operating segments based on the organizational structure that is used by the Company’s chief operating decision maker to evaluate performance, make decisions on resource allocation and for which discrete financial information is available.
Prior to the realignment, the Company operated its business in the following segments: Rolled Products North America; Recycling and Specification Alloys North America; and Europe. After the realignment, the Company’s operating segments (each of which is considered a reportable segment) are:
| • | Rolled Products North America (“RPNA”); |
| • | Rolled Products Europe (“RPEU”); |
| • | Extrusions; |
| • | Recycling and Specification Alloys North America (“RSAA”); and |
| • | Recycling and Specification Alloys Europe (“RSEU”). |
The prior period amounts presented have been restated to conform to the current year presentation of the new reportable segments.
Currently the China Joint Venture incurs only start-up expenses, which are not included in management’s definition of segment performance, as defined below.
Rolled Products North America
Our RPNA segment produces rolled products for a wide variety of applications, including building and construction, distribution, transportation, and other uses in the consumer durables general industrial segments. Except for depot sales, which are for standard size products, substantially all of our rolled aluminum products in the United States are manufactured to specific customer
F-71
Table of Contents
Aleris Corporation
Notes to consolidated financial statements (continued)
(in millions, except share and per share data)
requirements, using direct-chill and continuous ingot cast technologies that allow us to use and offer a variety of alloys and products for a number of end-uses. Specifically, those products are integrated into, among other things, building panels, truck trailers, gutters, appliances, and recreational vehicles.
Rolled Products Europe
Our RPEU segment produces rolled products for a wide variety of technically sophisticated applications, including aerospace plate and sheet, brazing sheet (clad aluminum material used for, among other things, vehicle radiators and HVAC systems), automotive sheet, and heat treated plate for engineering uses, as well as for other uses in the transportation, construction, and packaging industries. Substantially all of our rolled aluminum products in Europe are manufactured to specific customer requirements using direct-chill ingot cast technologies that allow us to use and offer a variety of alloys and products for a number of technically demanding end-uses.
Extrusions
Our Extrusions segment is a leading producer of soft and hard alloy extruded aluminum profiles targeted at high demand end-uses. Our extruded aluminum products are used for the automotive, building and construction, electrical, mechanical engineering and other transportation (rail and shipbuilding) industries. Industrial extrusions are made in all locations and the production of extrusion systems, including building systems, is concentrated in Vogt, Germany. The extrusion plant in Bonn operates one of the largest extrusion presses in the world, which is mainly used for long and wide sections for railway, shipbuilding and other applications. In addition, we perform value-added fabrication to most of our extruded products.
Recycling and Specification Alloys North America
Our RSAA segment includes aluminum melting, processing and recycling activities, as well as our specification alloy manufacturing business, located in North America. This segment’s recycling operations convert scrap and dross (a by-product of melting aluminum) and combine these materials with other alloy agents as needed to produce recycled aluminum generally for customers serving end-uses related to consumer packaging, steel, transportation and construction. The segment’s specification alloy operations combine various aluminum scrap types with hardeners and other additives to produce alloys and chemical compositions with specific properties (including increased strength, formability and wear resistance) as specified by customers for their particular applications. Our specification alloy operations typically deliver recycled and specification alloy products in molten or ingot form to customers principally in the U.S. automotive industry. A portion of this segment’s products are sold through tolling arrangements, in which we convert customer-owned scrap and dross and return the recycled metal in ingot or molten form to our customers for a fee.
F-72
Table of Contents
Aleris Corporation
Notes to consolidated financial statements (continued)
(in millions, except share and per share data)
Recycling and Specification Alloys Europe
Our RSEU segment is a leading European recycler of aluminum scrap and magnesium. Our recycling operations primarily convert aluminum scrap, dross (a by-product of the melting process) and other alloying agents as needed and deliver the recycled metal and specification alloys in molten or ingot form to our customers. Our European operations supply specification alloys to the European automobile industry and serve other European aluminum industries from its plants. Our recycling operations typically service other aluminum producers and manufacturers, generally under tolling arrangements, where we convert customer-owned scrap and dross and return the recycled metal to our customers for a fee.
Measurement of segment income or loss and segment assets
The accounting policies of the reportable segments are the same as those described in the summary of significant accounting policies. Our measure of the profitability of our operating segments is referred to as segment income. In the fourth quarter of 2011, the Company changed its definition of segment income to reflect how management currently measures segment performance and to more closely align segment operating performance metrics with the operating performance metrics defined in the ABL Facility. Specifically, segment income now excludes depreciation and amortization, inventory impairment charges, gains and losses on asset sales, and certain other gains and losses. In addition, certain former regional expenses are now considered corporate expenses while others are now considered global functional expenses and allocated to all segments. The prior period amounts presented have been restated to conform to the 2011 presentation. Segment income includes gross profits, segment specific realized gains and losses on derivative financial instruments, segment specific other expense (income) and segment specific selling, general and administrative (“SG&A”) expense, and an allocation of certain regional and global functional SG&A expenses. Segment income excludes provisions for income taxes, restructuring and impairment charges (gains), interest, depreciation and amortization, unrealized and certain realized gains (losses) on derivative financial instruments, corporate general and administrative costs, start-up expenses, gains and losses on asset sales, currency exchange gains (losses) on debt, losses on intercompany receivables, reorganization items, net and certain other gains and losses. Intersegment sales and transfers are recorded at market value. Consolidated cash, long-term debt, net capitalized debt costs, deferred tax assets and assets related to our headquarters offices are not allocated to the reportable segments.
F-73
Table of Contents
Aleris Corporation
Notes to consolidated financial statements (continued)
(in millions, except share and per share data)
Reportable segment information
The following table shows our revenues and segment income (loss):
| Intersegment | ||||||||||||||||||||||||||||
| RPNA | RPEU | Extrusions | RSAA | RSEU | revenues | Total | ||||||||||||||||||||||
|
|
||||||||||||||||||||||||||||
| Year Ended December 31, 2011 (Successor) |
||||||||||||||||||||||||||||
| Revenues to external customers |
$ | 1,344.6 | $ | 1,460.1 | $ | 398.7 | $ | 978.6 | $ | 644.4 | $ | 4,826.4 | ||||||||||||||||
| Inter-segment revenues |
1.8 | 81.5 | 11.6 | 5.2 | 40.7 | $ | (140.8 | ) | — | |||||||||||||||||||
|
|
|
|||||||||||||||||||||||||||
| Total revenues |
1,346.4 | 1,541.6 | 410.3 | 983.8 | 685.1 | (140.8 | ) | 4,826.4 | ||||||||||||||||||||
| Segment income |
111.1 | 157.6 | 10.9 | 80.9 | 35.3 | 395.8 | ||||||||||||||||||||||
| Segment assets |
514.7 | 565.1 | 126.0 | 277.4 | 169.0 | 1,652.2 | ||||||||||||||||||||||
| Payments for property, plant and equipment |
35.1 | 19.3 | 12.7 | 34.1 | 15.8 | 117.0 | ||||||||||||||||||||||
| Seven Months Ended December 31, 2010 (Successor) |
||||||||||||||||||||||||||||
| Revenues to external customers |
$ | 697.9 | $ | 726.4 | $ | 204.0 | $ | 534.4 | $ | 311.4 | $ | 2,474.1 | ||||||||||||||||
| Inter-segment revenues |
1.5 | 37.3 | 10.6 | 6.1 | 21.5 | $ | (77.0 | ) | $ | — | ||||||||||||||||||
|
|
|
|||||||||||||||||||||||||||
| Total revenues |
$ | 699.4 | $ | 763.7 | $ | 214.6 | $ | 540.5 | $ | 332.9 | (77.0 | ) | $ | 2,474.1 | ||||||||||||||
| Segment income |
44.9 | 40.4 | 5.3 | 33.8 | 16.8 | 141.2 | ||||||||||||||||||||||
| Segment assets |
535.4 | 571.1 | 117.1 | 219.4 | 158.8 | 1,601.8 | ||||||||||||||||||||||
| Payments for property, plant and equipment |
14.1 | 12.0 | 5.0 | 8.8 | 3.3 | 43.2 | ||||||||||||||||||||||
| Five Months Ended May 31, 2010 (Predecessor) |
||||||||||||||||||||||||||||
| Revenues to external customers |
$ | 506.4 | $ | 438.6 | $ | 131.4 | $ | 367.8 | $ | 198.8 | $ | 1,643.0 | ||||||||||||||||
| Inter-segment revenues |
0.8 | 25.8 | 1.1 | 5.9 | 15.7 | $ | (49.3 | ) | — | |||||||||||||||||||
|
|
|
|||||||||||||||||||||||||||
| Total revenues |
507.2 | 464.4 | 132.5 | 373.7 | 214.5 | (49.3 | ) | 1,643.0 | ||||||||||||||||||||
| Segment income |
49.4 | 55.1 | 2.7 | 29.7 | 10.9 | 147.8 | ||||||||||||||||||||||
| Payments for property, plant and equipment |
6.0 | 1.3 | 2.4 | 5.2 | 0.5 | 15.4 | ||||||||||||||||||||||
| Year Ended December 31, 2009 (Predecessor) |
||||||||||||||||||||||||||||
| Revenues to external customers |
$ | 885.5 | $ | 886.0 | $ | 340.5 | $ | 554.7 | $ | 330.1 | $ | 2,996.8 | ||||||||||||||||
| Inter-segment revenues |
8.1 | 50.7 | 2.4 | 9.5 | 23.5 | $ | (94.2 | ) | — | |||||||||||||||||||
|
|
|
|||||||||||||||||||||||||||
| Total revenues |
893.6 | 936.7 | 342.9 | 564.2 | 353.6 | (94.2 | ) | 2,996.8 | ||||||||||||||||||||
| Segment income (loss) |
89.7 | 37.2 | (1.7 | ) | 18.9 | (1.5 | ) | 142.6 | ||||||||||||||||||||
| Payments for property, plant and equipment |
9.4 | 37.4 | 12.3 | 5.4 | 1.6 | 66.1 | ||||||||||||||||||||||
|
|
||||||||||||||||||||||||||||
F-74
Table of Contents
Aleris Corporation
Notes to consolidated financial statements (continued)
(in millions, except share and per share data)
Reconciliations of total reportable segment disclosures to our Consolidated Financial Statements are as follows:
| (Successor) | (Predecessor) | |||||||||||||||
| For the year ended |
For the seven months ended December 31, 2010 |
For the five 2010 |
For the 2009 |
|||||||||||||
| Profits |
||||||||||||||||
| Total segment income |
$ | 395.8 | $ | 141.2 | $ | 147.8 | $ | 142.6 | ||||||||
| Unallocated amounts: |
||||||||||||||||
| Depreciation and amortization |
(70.3 | ) | (38.4 | ) | (20.2 | ) | (168.4 | ) | ||||||||
| Corporate general and administrative expenses, excluding depreciation, amortization and start-up expenses |
(72.7 | ) | (28.1 | ) | (14.6 | ) | (42.3 | ) | ||||||||
| Restructuring and impairment (charges) gains |
(4.4 | ) | (12.1 | ) | 0.4 | (862.9 | ) | |||||||||
| Interest expense, net |
(46.3 | ) | (7.0 | ) | (73.6 | ) | (225.4 | ) | ||||||||
| Unallocated (losses) gains on derivative financial instruments |
(37.9 | ) | 18.8 | (38.9 | ) | 16.9 | ||||||||||
| Reorganization items, net |
1.3 | (7.4 | ) | 2,227.3 | (123.1 | ) | ||||||||||
| Currency exchange (losses) gains on debt |
(1.2 | ) | 3.0 | (32.0 | ) | 14.0 | ||||||||||
| Start-up expenses |
(10.2 | ) | (2.0 | ) | — | — | ||||||||||
| Other income (expense), net |
2.9 | 3.7 | (0.8 | ) | (0.6 | ) | ||||||||||
| Income (loss) before income taxes |
$ | 157.0 | $ | 71.7 | $ | 2,195.4 | $ | (1,249.2 | ) | |||||||
| Payments for property, plant and equipment |
||||||||||||||||
| Total payments for property, plant and equipment for reportable segments |
$ | 117.0 | $ | 43.2 | $ | 15.4 | $ | 66.1 | ||||||||
| Other payments for property, plant and equipment |
87.6 | 3.3 | 0.6 | 2.5 | ||||||||||||
| Total consolidated payments for property, plant and equipment |
$ | 204.6 | $ | 46.5 | $ | 16.0 | $ | 68.6 | ||||||||
| Assets |
||||||||||||||||
| Total assets for reportable segments |
$ | 1,652.2 | $ | 1,601.8 | ||||||||||||
| Unallocated assets |
385.4 | 177.9 | ||||||||||||||
| Total consolidated assets |
$ | 2,037.6 | $ | 1,779.7 | ||||||||||||
F-75
Table of Contents
Aleris Corporation
Notes to consolidated financial statements (continued)
(in millions, except share and per share data)
Geographic information
The following table sets forth the geographic breakout of our revenues (based on customer location) and long-lived assets (net of accumulated depreciation and amortization):
| (Successor) | (Predecessor) | |||||||||||||||||
| For the year ended |
For the seven months ended December 31, 2010 |
For the five months ended May 31, 2010 |
For the year ended |
|||||||||||||||
| Revenues |
||||||||||||||||||
| United States |
$ | 2,154.2 | $ | 1,080.7 | $ | 786.5 | $ | 1,192.6 | ||||||||||
| International: |
||||||||||||||||||
| Asia |
181.4 | 96.0 | 50.2 | 127.4 | ||||||||||||||
| Europe |
2,160.1 | 1,066.6 | 659.5 | 1,356.6 | ||||||||||||||
| Mexico, Canada and South America |
291.9 | 227.1 | 143.8 | 309.8 | ||||||||||||||
| Other |
38.8 | 3.7 | 3.0 | 10.4 | ||||||||||||||
| Total international revenues |
2,672.2 | 1,393.4 | 856.5 | 1,804.2 | ||||||||||||||
| Consolidated revenues |
$ | 4,826.4 | $ | 2,474.1 | $ | 1,643.0 | $ | 2,996.8 | ||||||||||
| (Successor) | ||||||||
| December 31, | ||||||||
| 2011 | 2010 | |||||||
|
|
||||||||
| Long-lived tangible assets |
||||||||
| United States |
$ | 311.3 | $ | 275.1 | ||||
| International: |
||||||||
| Asia |
94.1 | 1.6 | ||||||
| Europe |
247.0 | 215.5 | ||||||
| Mexico, Canada and South America |
18.1 | 17.8 | ||||||
|
|
|
|||||||
| Total international |
359.2 | 234.9 | ||||||
|
|
|
|||||||
| Consolidated total |
$ | 670.5 | $ | 510.0 | ||||
|
|
||||||||
F-76
Table of Contents
Aleris Corporation
Notes to consolidated financial statements (continued)
(in millions, except share and per share data)
18. Other comprehensive income
The following table presents the components of “Accumulated other comprehensive (loss) income” in the Consolidated balance sheet which are items that change equity during the reporting period, but are not included in earnings.
| Total | Currency translation |
Pension and other postretirement |
||||||||||
|
|
||||||||||||
| Predecessor |
||||||||||||
| Balance at January 1, 2009 |
$ | 0.5 | $ | 34.8 | $ | (34.3 | ) | |||||
| Current year currency translation adjustments |
5.0 | 5.0 | — | |||||||||
| Amortization of net actuarial loss and prior service cost |
1.3 | — | 1.3 | |||||||||
| Recognition of net actuarial losses |
(3.2 | ) | — | (3.2 | ) | |||||||
| Effect of exchange rates |
0.8 | — | 0.8 | |||||||||
| Liquidation of Canada LP |
23.7 | 4.1 | 19.6 | |||||||||
| Deferred tax on pension and other postretirement liability adjustment |
(3.1 | ) | — | (3.1 | ) | |||||||
|
|
|
|||||||||||
| Balance at December 31, 2009 |
$ | 25.0 | $ | 43.9 | $ | (18.9 | ) | |||||
| Current year currency translation adjustments |
44.2 | 44.2 | — | |||||||||
| Amortization of net actuarial loss and prior service cost |
0.5 | — | 0.5 | |||||||||
| Effect of exchange rates |
(2.3 | ) | — | (2.3 | ) | |||||||
| Fresh-start accounting adjustments |
(67.4 | ) | (88.1 | ) | 20.7 | |||||||
|
|
|
|||||||||||
| Balance at June 1, 2010 |
$ | — | $ | — | $ | — | ||||||
|
|
|
|||||||||||
| Successor |
||||||||||||
| Balance at June 1, 2010 |
$ | — | $ | — | $ | — | ||||||
| Current year currency translation adjustments |
21.0 | 21.0 | — | |||||||||
| Recognition of net actuarial gains |
8.2 | — | 8.2 | |||||||||
| Effect of exchange rates |
0.1 | — | 0.1 | |||||||||
| Deferred tax on pension and other postretirement liability adjustment |
(2.6 | ) | — | (2.6 | ) | |||||||
|
|
|
|||||||||||
| Balance at December 31, 2010 |
$ | 26.7 | $ | 21.0 | $ | 5.7 | ||||||
| Current year currency translation adjustments |
(19.2 | ) | (19.2 | ) | — | |||||||
| Recognition of net actuarial losses |
(39.5 | ) | — | (39.5 | ) | |||||||
| Recognition of prior service cost |
(0.9 | ) | — | (0.9 | ) | |||||||
| Effect of exchange rates |
0.5 | — | 0.5 | |||||||||
| Deferred tax on pension and other postretirement liability adjustment |
3.4 | — | 3.4 | |||||||||
|
|
|
|||||||||||
| Balance at December 31, 2011 |
$ | (29.0 | ) | $ | 1.8 | $ | (30.8 | ) | ||||
|
|
||||||||||||
F-77
Table of Contents
Aleris Corporation
Notes to consolidated financial statements (continued)
(in millions, except share and per share data)
19. Supplemental information
Supplemental cash flow information and contractual interest are as follows:
| (Successor) | (Predecessor) | |||||||||||||||||
| For the year ended |
For the seven months ended December 31, 2010 |
For the five months ended May 31, 2010 |
For the year ended |
|||||||||||||||
| Cash payments (receipts) for: |
||||||||||||||||||
| Interest |
$ | 28.3 | $ | 0.3 | $ | 28.7 | $ | 59.9 | ||||||||||
| Income taxes |
14.9 | — | (6.0 | ) | 5.3 | |||||||||||||
| Contractual interest |
N/A | N/A | 129.9 | 332.0 | ||||||||||||||
| Non-cash financing activity associated with lease contracts |
3.3 | — | 0.3 | 2.7 | ||||||||||||||
F-78
Table of Contents
Aleris Corporation
Notes to consolidated financial statements (continued)
(in millions, except share and per share data)
20. Earnings per share
Basic earnings per share was computed using the two-class method by dividing net income available to common stockholders, after deducting undistributed earnings allocated to participating securities, by the average number of common shares outstanding during the period. Pursuant to the two-class method, all earnings, whether distributed or undistributed, are allocated to common stock and participating securities based on their respective rights to receive dividends. Unvested share-based payment awards that contain nonforfeitable rights to dividends or dividend equivalents (whether paid or unpaid) are considered participating securities. The Company’s restricted stock units and restricted shares have nonforfeitable rights to dividends during the vesting period on a basis equivalent to the dividends paid to holders of the Company’s common stock, and, therefore, meet the definition of a participating security. No undistributed earnings have been allocated to the participating securities for the year ended December 31, 2011 earnings per share calculations as cash dividends paid during the period exceeded our earnings. Diluted earnings per share was computed by giving effect to all potentially dilutive securities that were outstanding. The following table summarizes basic and diluted earnings per share:
| (Successor) | ||||||||
| For the year ended | For the seven months ended |
|||||||
| (in millions, except per share data) | December 31, 2011 | December 31, 2010 | ||||||
|
|
||||||||
| Net income attributable to Aleris Corporation |
$ | 161.6 | $ | 71.4 | ||||
| Less: Preferred stock dividend (paid or unpaid) |
(0.4 | ) | (0.2 | ) | ||||
| Less: Undistributed earnings allocated to participating securities |
— | (0.7 | ) | |||||
|
|
|
|||||||
| Net income available to common stockholders—Basic |
161.2 | 70.5 | ||||||
| Add: Interest on Exchangeable Notes |
1.8 | 1.2 | ||||||
| Add: Preferred stock dividend (paid or unpaid) |
0.4 | 0.2 | ||||||
| Add: Undistributed earnings allocated to participating securities |
— | 0.7 | ||||||
| Less: Undistributed earnings reallocated to participating securities |
— | (0.7 | ) | |||||
|
|
|
|||||||
| Net income available to common stockholders—Diluted |
$ | 163.4 | $ | 71.9 | ||||
|
|
|
|||||||
| Average shares of common stock outstanding |
31.0 | 30.9 | ||||||
| Dilutive effect of: |
||||||||
| Stock options |
0.6 | — | ||||||
| Restricted stock units and restricted shares |
0.1 | — | ||||||
| Redeemable preferred stock |
0.1 | 0.2 | ||||||
| Exchangeable Notes |
1.5 | 1.5 | ||||||
|
|
|
|||||||
| Average dilutive shares of common stock outstanding |
33.3 | 32.6 | ||||||
|
|
|
|||||||
| Basic earnings per share |
$ | 5.20 | $ | 2.28 | ||||
| Diluted earnings per share |
$ | 4.91 | $ | 2.21 | ||||
|
|
||||||||
F-79
Table of Contents
Aleris Corporation
Notes to consolidated financial statements (continued)
(in millions, except share and per share data)
The effect of certain stock options and restricted stock units were excluded from the computations of the weighted average dilutive shares outstanding as inclusion would have resulted in antidilution. Additionally, restricted stock units and restricted shares were excluded from the computation of weighted average dilutive shares outstanding for the seven months ended December 31, 2010 as they are considered participating securities. A summary of these stock options, restricted stock units and restricted shares as of December 31, 2011 and 2010 is shown below:
| (Successor) | ||||||||
| (in millions, except per share data) | For the year ended December 31, 2011 |
For the seven months ended |
||||||
|
|
||||||||
| Number of stock options |
0.1 | 2.0 | ||||||
| Weighted average exercise price |
$ | 46.99 | $ | 37.82 | ||||
| Restricted stock units and restricted shares |
— | 0.3 | ||||||
| Weighted average grant date fair value |
$ | 50.30 | $ | 29.22 | ||||
|
|
||||||||
Unaudited pro forma earnings per share
On , 2012, our Board of Directors approved an amended and restated certificate of incorporation providing for a for one stock split to occur immediately prior to the closing of our contemplated initial public offering. The total number of authorized shares will increase to shares upon the effectuation of the stock split; however, the par value of our common stock will not be adjusted. The stock split will not occur prior to the effectiveness of our Registration Statement on Form S-1, and, therefore, the information provided in the consolidated financial statements and related notes thereto has not been adjusted to reflect the stock split.
F-80
Table of Contents
Aleris Corporation
Notes to consolidated financial statements (continued)
(in millions, except share and per share data)
The following table sets forth the computation of our pro forma basic and diluted earnings per share for the year ended December 31, 2011 and the seven months ended December 31, 2010, which gives effect to (1) the for one stock split that will occur immediately prior to the closing of our contemplated initial public offering, and (2) the number of shares issued in our contemplated initial public offering whose proceeds would be required to fund dividends paid in 2011 in accordance with SEC SAB Topic 1:B:3:
| (Successor) | ||||||||
| For the year ended | For the seven months ended |
|||||||
| (in millions, except per share data) | December 31, 2011 (unaudited) |
December 31, 2010 (unaudited) |
||||||
|
|
||||||||
| Net income attributable to Aleris Corporation |
$ | 161.6 | $ | 71.4 | ||||
| Less: Preferred stock dividend (paid or unpaid) |
(0.4 | ) | (0.2 | ) | ||||
| Less: Undistributed earnings allocated to participating securities |
— | (0.7 | ) | |||||
|
|
|
|||||||
| Net income available to common stockholders—Basic |
161.2 | 70.5 | ||||||
| Add: Interest on Exchangeable Notes |
1.8 | 1.2 | ||||||
| Add: Preferred stock dividend (paid or unpaid) |
0.4 | 0.2 | ||||||
| Add: Undistributed earnings allocated to participating securities |
— | 0.7 | ||||||
| Less: Undistributed earnings reallocated to participating securities |
— | (0.7 | ) | |||||
|
|
|
|||||||
| Net income available to common stockholders—Diluted |
$ | 163.4 | $ | 71.9 | ||||
|
|
|
|||||||
| Basic shares: |
||||||||
| Average shares used to compute basic earnings per share |
||||||||
| Pro forma adjustment to reflect the number of shares issued in our contemplated initial public offering whose proceeds would be required to fund dividends paid* |
— | |||||||
|
|
|
|||||||
| Average shares used to compute pro forma basic earnings per share |
||||||||
| Diluted shares: |
||||||||
| Average shares used to compute pro forma basic earnings per share |
||||||||
| Dilutive effect of: |
||||||||
| Stock options |
||||||||
| Restricted stock units and restricted shares |
||||||||
| Redeemable preferred stock |
||||||||
| Exchangeable Notes |
||||||||
|
|
|
|||||||
| Average shares used to compute pro forma diluted earnings per share |
||||||||
| Pro forma basic earnings per share |
$ | $ | ||||||
| Pro forma diluted earnings per share |
$ | $ | ||||||
| * Adjustment cannot be quantified until price range for initial public offering has been determined. |
||||||||
|
|
||||||||
F-81
Table of Contents
Aleris Corporation
Notes to consolidated financial statements (continued)
(in millions, except share and per share data)
21. Stockholders’ equity
The following table shows changes in the number of our outstanding common shares:
| Outstanding common shares |
||||
| Balance at June 1, 2010 (Successor) |
— | |||
| Original issuance of Common Stock |
30,877,371 | |||
| Employee Common Stock purchases |
28,563 | |||
| Issuance of Common Stock to employees for services |
7,621 | |||
| Issuance associated with vested restricted stock units |
35,885 | |||
| Issuance associated with restricted shares |
20,000 | |||
|
|
|
|||
| Balance at December 31, 2010 (Successor) |
30,969,440 | |||
| Issuance of Common Stock to employees for services |
3,842 | |||
| Issuance associated with vested restricted stock units |
58,589 | |||
|
|
|
|||
| Balance at December 31, 2011 (Successor) |
31,031,871 | |||
|
|
||||
F-82
Table of Contents
Through and including , 2012 (the 25th day after the date of this prospectus), all dealers effecting transactions in these securities, whether or not participating in this offering, may be required to deliver a prospectus. This is in addition to the dealers’ obligation to deliver a prospectus when acting as underwriters and with respect to their unsold allotments or subscriptions.
shares
Common stock
Prospectus
Joint Book-Running Managers
| J.P. Morgan | Barclays Capital | Deutsche Bank Securities |
| BofA Merrill Lynch | Goldman, Sachs & Co. | |||
Co-Managers
| KeyBanc Capital Markets | ||||||||||||
| Credit Suisse | ||||||||||||
| Moelis & Company | ||||||||||||
| Morgan Stanley | ||||||||||||
| UBS Investment Bank | ||||||||||||
| Davenport & Company LLC | ||||||||||||
Table of Contents
Part II
Information not required in prospectus
Item 13. Other expenses of issuance and distribution
The following table sets forth the costs and expenses, other than underwriting discounts and commissions, payable solely by the Registrant in connection with the offer and sale of the securities being registered. All amounts are estimates except the registration fee.
| SEC registration fee |
$ | 11,610 | ||
| FINRA filing fee |
$ | 10,000 | ||
| New York Stock Exchange listing fee |
* | |||
| Blue Sky fees and expenses |
* | |||
| Transfer agent’s fee |
* | |||
| Printing and engraving expenses |
* | |||
| Legal fees and expenses |
* | |||
| Accounting fees and expenses |
* | |||
| Miscellaneous |
* | |||
| Total |
* | |||
|
|
||||
| * | To be filed by amendment |
Item 14. Indemnification of directors and officers
Section 145(a) of the General Corporation Law of the State of Delaware (the “DGCL”) grants each corporation organized thereunder the power to indemnify any person who was or is a party or is threatened to be made a party to any threatened, pending or completed action, suit or proceeding, whether civil, criminal, administrative or investigative (other than an action by or in the right of the corporation) by reason of the fact that the person is or was a director, officer, employee or agent of the corporation, or is or was serving at the request of the corporation as a director, officer, employee or agent of another corporation, partnership, joint venture, trust or other enterprise, against expenses (including attorneys’ fees), judgments, fines and amounts paid in settlement actually and reasonably incurred by the person in connection with such action, suit or proceeding if the person acted in good faith and in a manner the person reasonably believed to be in or not opposed to the best interests of the corporation, and, with respect to any criminal action or proceeding, had no reasonable cause to believe the person’s conduct was unlawful.
Section 145(b) of the DGCL grants each corporation organized thereunder the power to indemnify any person who was or is a party or is threatened to be made a party to any threatened, pending or completed action or suit by or in the right of the corporation to procure a judgment in its favor by reason of the fact that the person is or was a director, officer, employee or agent of the corporation, or is or was serving at the request of the corporation as a director, officer, employee or agent of another corporation, partnership, joint venture, trust or other enterprise against expenses (including attorneys’ fees) actually and reasonably incurred by the person in connection with the defense or settlement of such action or suit if the person acted in good faith and in a manner the person reasonably believed to be in or not opposed to the best interests of the corporation and except that no indemnification shall be made pursuant to Section 145(b) of the DGCL in respect of any claim, issue or matter as to which such person shall have been adjudged to be liable to the corporation unless and only to the extent that the
II-1
Table of Contents
Delaware Court of Chancery or the court in which such action or suit was brought shall determine upon application that, despite the adjudication of liability but in view of all the circumstances of the case, such person is fairly and reasonably entitled to indemnity for such expenses which the Court of Chancery or such other court shall deem proper.
In addition, pursuant to Section 145 of the DGCL, Aleris generally has the power to indemnify its current and former directors, officers, employees and agents against expenses and liabilities that they incur in connection with any suit to which they are, or are threatened to be made, a party by reason of their serving in such positions so long as they acted in good faith and in a manner they reasonably believed to be in, or not opposed to, the best interests of Aleris, and with respect to any criminal action, they had no reasonable cause to believe their conduct was unlawful. The statute expressly provides that the power to indemnify or advance expenses authorized thereby is not exclusive of any rights granted under any bylaw, agreement, vote of shareholders or disinterested directors, or otherwise, both as to action in such person’s official capacity and as to action in another capacity while holding such office. Delaware corporations also have the power to purchase and maintain insurance for such directors and officers.
Section 102(b)(7) of the DGCL enables a corporation in its certificate of incorporation or an amendment thereto to eliminate or limit the personal liability of a director to the corporation or its stockholders of monetary damages for violations of the directors’ fiduciary duty of care, except (i) for any breach of the directors’ duty of loyalty to the corporation or its stockholders, (ii) for acts or omissions not in good faith or that involve intentional misconduct or a knowing violation of law, (iii) pursuant to Section 174 of the DGCL (providing for liability of directors for unlawful payment of dividends or unlawful stock purchases or redemptions) or (iv) for any transaction from which a director derived an improper personal benefit. Aleris’s amended and restated bylaws indemnify the directors and officers to the full extent of the DGCL and also allow the Board of Directors to indemnify all other employees. Such right of indemnification is not exclusive of any right to which such officer or director may be entitled as a matter of law and shall extend and apply to the estates of deceased officers and directors.
Item 15. Recent sales of unregistered securities.
In connection with Aleris International’s emergence from bankruptcy, on June 1, 2010, the effective date of Aleris International’s plan of reorganization, we issued equity securities comprised of 30,905,934 shares of our common stock, 1,143,797 options (equal to 1,606,868 options after adjustment to reflect the 2011 Stockholder Dividends) to purchase shares of our common stock and 190,633 restricted stock units (“RSUs”). These issuances are described below.
Of the 30,905,934 shares of common stock issued on June 1, 2010,
| • | we issued 9,828,196 shares of common stock to certain creditors of the Predecessor, who elected to receive shares of our common stock in exchange for their claims under the Plan in reliance on the exemption from registration under the Securities Act afforded by Section 1145 of the Bankruptcy Code; |
| • | we issued 21,049,175 shares of common stock pursuant to the rights offering conducted under to certain participants via their subscription rights for an aggregate cash proceeds of $563.6 million in reliance on the exemption from registration under the Securities Act afforded by Section 4(2) of the Securities Act; |
II-2
Table of Contents
| • | we issued 28,563 shares of common stock to two of our executive officers in reliance on the exemptions from registration under the Securities Act afforded by Section 4(2) of the Securities Act promulgated thereunder. |
Effective June 1, 2010, we issued (1) options to purchase 1,143,797 shares of our common stock (equal to 1,606,868 shares after adjustment to reflect the 2011 Stockholder Dividends), in the aggregate, to our named executive officers and (2) 190,633 RSUs, in the aggregate, to our named executive officers, in both cases pursuant to the Company’s Equity Incentive Plan and in reliance on the exemption from registration under the Securities Act afforded by Rule 701 promulgated thereunder.
On June 11, 2010 we issued (1) options to purchase 770,263 shares of our common stock (equal to 1,081,725 shares after adjustment for those awards outstanding as of the record dates in connection with the 2011 Stockholder Dividends), in the aggregate, to our executive officers, other than our named executive officers, and other employees and (2) 92,544 RSUs, in the aggregate, to our executive officers, other than our named executive officers, and other employees, in both cases pursuant to the Company’s Equity Incentive Plan and in reliance on the exemption from registration under the Securities Act afforded by Rule 701 promulgated thereunder.
Since June 11, 2010, we have issued (1) options to purchase 189,800 shares of our common stock (equal to 218,029 shares after adjustment for those awards outstanding as of the record dates in connection with the 2011 Stockholder Dividends), in the aggregate, to certain of our employees and (2) 24,000 RSUs to certain of our employees, in all cases pursuant to the Company’s Equity Incentive Plan and in reliance on the exemption from registration under the Securities Act afforded by Rule 701 promulgated thereunder.
On July 30, 2010, we issued 20,000 shares of restricted stock pursuant to the Company’s Equity Incentive Plan to one of our directors in reliance on the exemptions from registration under the Securities Act afforded by Section 4(2) promulgated thereunder.
On September 7, 2010 we issued (1) options to purchase 12,000 shares of our common stock (equal to 16,856 shares after adjustment to reflect the 2011 Stockholder Dividends) and (2) 3,000 RSUs to one of our directors, in both cases pursuant to the Company’s Equity Incentive Plan and in reliance on the exemption from registration under the Securities Act afforded by Section 4(2) promulgated thereunder.
On November 1, 2010, we issued (1) options to purchase 48,000 shares of our common stock (equal to 67,424 shares after adjustment to reflect the 2011 Stockholder Dividends), in the aggregate, to four of our directors and (2) 12,000 RSUs, in the aggregate, to the same four of our directors, in both cases pursuant to the Company’s Equity Incentive Plan and in reliance on the exemption from registration under the Securities Act afforded by Section 4(2) promulgated thereunder.
On January 21, 2011, we issued (1) options to purchase 30,000 shares of our common stock (equal to 42,142 shares after adjustment to reflect the 2011 Stockholder Dividends), in the aggregate, to two of our directors and (2) 6,000 RSUs, in the aggregate, to the same two of our directors, in both cases pursuant to the Company’s Equity Incentive Plan and in reliance on the exemption from registration under the Securities Act afforded by Section 4(2) promulgated thereunder.
On February 2, 2011, we issued (1) options to purchase 15,000 shares of our common stock (equal to 21,071 shares after adjustment to reflect the 2011 Stockholder Dividends) and (2) 5,000 RSUs
II-3
Table of Contents
to one of our named executive officers, in both cases pursuant to the Company’s Equity Incentive Plan and in reliance on the exemption from registration under the Securities Act afforded by Rule 701 promulgated thereunder.
On January 31, 2012, we issued (1) options to purchase 29,500 shares of our common stock and (2) 2,400 RSUs to one of our directors, in both cases pursuant to the Company’s Equity Incentive Plan, as amended, and in reliance on the exemption from registration under the Securities Act afforded by Section 4(2) promulgated thereunder.
II-4
Table of Contents
Item 16. Exhibits and financial statement schedules.
(a) Exhibits
| Exhibit number |
Description | |||
|
|
| |||
| 1.1 | * | Form of Underwriting Agreement. | ||
| 2.1 | First Amended Joint Plan of Reorganization of Aleris International, Inc. and its Affiliated Debtors, as modified, Mar. 19, 2010 (filed as Exhibit 2.1 to Aleris International, Inc.’s Registration Statement on Form S-4 (File No. 333-173180), and incorporated herein by reference). | |||
| 3.1 | * | Form of Amended and Restated Certificate of Incorporation of Aleris Corporation. | ||
| 3.2 | * | Form of Amended and Restated Bylaws of Aleris Corporation. | ||
| 4.1 | Specimen Certificate of Common Stock, par value $0.01 per share, of Aleris Corporation (filed as Exhibit 4.1 to Aleris Corporation’s Amendment No. 2 to Registration Statement on Form S-1 (File No. 333-173721), and incorporated herein by reference). | |||
| 4.2 | Indenture, dated as of February 9, 2011, by and among Aleris International, Inc., the guarantors named therein, and U.S. Bank National Association, as trustee (filed as Exhibit 4.1 to Aleris International, Inc.’s Registration Statement on Form S-4 (File No. 333-173180), and incorporated herein by reference). | |||
| 4.3 | Registration Rights Agreement, dated as of February 9, 2011, by and among Aleris International, Inc., the guarantors named therein, and Merrill, Lynch, Pierce, Fenner & Smith Incorporated, Barclays Capital Inc., Deutsche Bank Securities Inc., J.P. Morgan Securities LLC, UBS Securities LLC, KeyBanc Capital Markets Inc., and Moelis & Company LLC, as Initial Purchasers (filed as Exhibit 4.2 to Aleris International, Inc.’s Registration Statement on Form S-4 (File No. 333-173180), and incorporated herein by reference). | |||
| 4.4 | Form of 7 5/8% Senior Notes due 2018 (included in Exhibit 4.2). | |||
| 4.5 | Stockholders Agreement, dated June 1, 2010 between Aleris Holding Company and the stockholders of Aleris Holding Company named therein (filed as Exhibit 10.9 to Aleris International, Inc.’s Registration Statement on Form S-4 (File No. 333-173180), and incorporated herein by reference). | |||
| 4.6 | Registration Rights Agreement, dated June 1, 2010 among Aleris Holding Company and the parties listed therein (filed as Exhibit 10.31 to Aleris International, Inc.’s Registration Statement on Form S-4 (File No. 333-173180), and incorporated herein by reference). | |||
| 5.1 | * | Opinion of Fried, Frank, Harris, Shriver & Jacobson LLP. | ||
| 10.1 | Amended and Restated Credit Agreement dated June 30, 2011 among Aleris International, Inc., each subsidiary of Aleris International, Inc. a party thereto, the lenders party thereto from time to time, Bank of America, N.A. as Administrative Agent, J.P. Morgan Securities LLC as Syndication Agent, RBS Business Capital as a Senior Managing Agent, Bank of America, N.A., Deutsche Bank AG New York Branch and JPMorgan Chase Bank, N.A. as Co-Collateral Agents, Barclays Capital, Deutsche Bank AG New York Branch and UBS Securities LLC as Co-Documentation Agents (filed as Exhibit 10.1 to Aleris International, Inc.’s Amendment No. 4 to Registration Statement on Form S-4 (File No. 333-173180), and incorporated herein by reference). | |||
|
|
| |||
II-5
Table of Contents
| Exhibit number |
Description | |||
|
|
| |||
| 10.2 | U.S. Security Agreement, dated as of June 1, 2010, by and among Aleris International, Inc. and certain of its subsidiaries, as assignors, and Bank of America, as administrative agent, relating to the Credit Agreement (filed as Exhibit 10.3 to Aleris International, Inc.’s Amendment No. 1 to Registration Statement on Form S-4 (File No. 333-173180), and incorporated herein by reference). | |||
| 10.3 | Facility Agreement, dated as of March 29, 2011, between Aleris Dingsheng Aluminum (Zhenjiang) Co., Ltd., as borrower, and Bank of China Limited, Zhenjiang Jingkou Sub-branch, as lender (filed as Exhibit 10.4 to Aleris International, Inc.’s Amendment No. 1 to Registration Statement on Form S-4 (File No. 333-173180), and incorporated herein by reference). | |||
| 10.3.1 | Amendment Agreement to the Facility Agreement, dated May 18, 2011, by and between Aleris Dingsheng Aluminum (Zhenjiang) Co. Ltd., as Borrower, and Bank of China Limited, Zhenjiang Jingkou Sub-Branch, as Lender (English translation) (filed as Exhibit 10.3.1 to Aleris International, Inc.’s Annual Report on Form 10-K (File No. 333-173180), and incorporated herein by reference). | |||
| 10.3.2 | Amendment No. 2 to the Facility Agreement, dated December 28, 2011, by and between Aleris Dingsheng Aluminum (Zhenjiang) Co. Ltd., as Borrower, and Bank of China Limited, Zhenjiang Jingkou Sub-Branch, as Lender (English translation) (filed as Exhibit 10.3.1 to Aleris International, Inc.’s Annual Report on Form 10-K (File No. 333-173180), and incorporated herein by reference). | |||
| 10.4 | † | Employment Agreement dated as of June 1, 2010 by and among the Company, Aleris Holding Company and Steven J. Demetriou (filed as Exhibit 10.5 to Aleris International, Inc.’s Registration Statement on Form S-4 (File No. 333-173180), and incorporated herein by reference). | ||
| 10.4.1 | † | Amendment 2 to Employment Agreement by and among Aleris Corporation and Steven J. Demetriou (filed as Exhibit 10.4.1 to Aleris International, Inc.’s Amendment No. 3 to Registration Statement on Form S-4 (File No. 333-173180), and incorporated herein by reference). | ||
| 10.5 | † | Employment Agreement dated as of June 1, 2010 by and among Aleris International, Inc., the Company and Sean M. Stack (filed as Exhibit 10.6 to Aleris International, Inc.’s Registration Statement on Form S-4 (File No. 333-173180), and incorporated herein by reference). | ||
| 10.5.1 | † | Amendment 2 to Employment Agreement by and among Aleris Corporation and Sean M. Stack (filed as Exhibit 10.5.1 to Aleris International, Inc.’s Amendment No. 3 to Registration Statement on Form S-4 (File No. 333-173180), and incorporated herein by reference). | ||
| 10.6 | † | Form of Employment Agreement dated as of June 1, 2010 by and among Aleris International, Inc., the Company and each of Christopher R. Clegg, Thomas W. Weidenkopf and K. Alan Dick (filed as Exhibit 10.7 to Aleris International, Inc.’s Registration Statement on Form S-4 (File No. 333-173180), and incorporated herein by reference). | ||
|
|
| |||
II-6
Table of Contents
| Exhibit number |
Description | |||
|
|
| |||
| 10.6.1† | Form of Amendment of Form of Employment Agreement by and among Aleris Corporation and each of Christopher R. Clegg, Thomas W. Weidenkopf and K. Alan Dick (filed as Exhibit 10.6.1 to Aleris International, Inc.’s Amendment No. 3 to Registration Statement on Form S-4 (File No. 333-173180), and incorporated herein by reference). | |||
| 10.7† | Form of Aleris Corporation 2012 Equity Incentive Plan (filed as Exhibit 10.7 to Aleris International, Inc.’s Amendment No. 3 to Registration Statement on Form S-4 (File No. 333-173180), and incorporated herein by reference). | |||
| 10.8† | Aleris Holding Company 2010 Equity Incentive Plan Stock Option Agreement dated June 1, 2010 between Aleris Holding Company and Steven J. Demetriou (filed as Exhibit 10.10 to Aleris International, Inc.’s Registration Statement on Form S-4 (File No. 333-173180), and incorporated herein by reference). | |||
| 10.8.1† | Amendment 1 to the Aleris Corporation 2010 Equity Incentive Plan Stock Option Agreement between Aleris Corporation and Steven J. Demetriou (filed as Exhibit 10.9.1 to Aleris International, Inc.’s Amendment No. 3 to Registration Statement on Form S-4 (File No. 333-173180), and incorporated herein by reference). | |||
| 10.8.2† | Amendment 2 to the Aleris Corporation 2010 Equity Incentive Plan Stock Option Agreement between Aleris Corporation and Steven J. Demetriou (filed as Exhibit 10.9.2 to Aleris International, Inc.’s Amendment No. 3 to Registration Statement on Form S-4 (File No. 333-173180), and incorporated herein by reference). | |||
| 10.9† | Form of Aleris Holding Company 2010 Equity Incentive Plan Stock Option Agreement, dated as of June 1, 2010 between Aleris Holding Company and each of Sean M. Stack, Christopher R. Clegg, Thomas W. Weidenkopf and K. Alan Dick (filed as Exhibit 10.11 to Aleris International, Inc.’s Registration Statement on Form S-4 (File No. 333-173180), and incorporated herein by reference). | |||
| 10.9.1† | Form of Amendment 1 to the Aleris Corporation 2010 Equity Incentive Plan Stock Option Agreement between Aleris Corporation and each of Sean M. Stack, Christopher R. Clegg, Thomas W. Weidenkopf, and K. Alan Dick (filed as Exhibit 10.10.1 to Aleris International, Inc.’s Amendment No. 3 to Registration Statement on Form S-4 (File No. 333-173180), and incorporated herein by reference). | |||
| 10.9.2† | Form of Amendment 2 to the Aleris Corporation 2010 Equity Incentive Plan Stock Option Agreement between Aleris Corporation and each of Sean M. Stack, Christopher R. Clegg, Thomas W. Weidenkopf, and K. Alan Dick (filed as Exhibit 10.10.2 to Aleris International, Inc.’s Amendment No. 3 to Registration Statement on Form S-4 (File No. 333-173180), and incorporated herein by reference). | |||
| 10.10† | Aleris Holding Company 2010 Equity Incentive Plan Stock Option Agreement dated February 2, 2011 between Aleris Holding Company and K. Alan Dick (filed as Exhibit 10.12 to Aleris International, Inc.’s Registration Statement on Form S-4 (File No. 333-173180), and incorporated herein by reference). | |||
| 10.10.1† | Amendment 1 to the Aleris Corporation 2010 Equity Incentive Plan Stock Option Agreement (dated February 2, 2011) between Aleris Corporation and K. Alan Dick (filed as Exhibit 10.11.1 to Aleris International, Inc.’s Amendment No. 3 to Registration Statement on Form S-4 (File No. 333-173180), and incorporated herein by reference). | |||
|
|
| |||
II-7
Table of Contents
| Exhibit number |
Description | |||
|
|
| |||
| 10.10.2† | Amendment 2 to the Aleris Corporation 2010 Equity Incentive Plan Stock Option Agreement (dated February 2, 2011) between Aleris Corporation and K. Alan Dick (filed as Exhibit 10.11.2 to Aleris International, Inc.’s Amendment No. 3 to Registration Statement on Form S-4 (File No. 333-173180), and incorporated herein by reference). | |||
| 10.11† | Form of Aleris Holding Company 2010 Equity Incentive Plan Stock Option Award Agreement dated June 11, 2010 with Management Team Members, including with each of Terrance J. Hogan, Scott A. McKinley, Michael J. Hobey and Ralf Zimmermann (filed as Exhibit 10.13 to Aleris International, Inc.’s Registration Statement on Form S-4 (File No. 333-173180), and incorporated herein by reference). | |||
| 10.11.1† | Form of Amendment 1 to the Aleris Corporation 2010 Equity Incentive Plan Stock Option Award Agreement by and among Aleris Corporation and Management Team Members, including each of Terrance J. Hogan, Scott A. McKinley, Michael J. Hobey, and Ralf Zimmermann (filed as Exhibit 10.12.1 to Aleris International, Inc.’s Amendment No. 3 to Registration Statement on Form S-4 (File No. 333-173180), and incorporated herein by reference). | |||
| 10.11.2† | Form of Amendment 2 to the Aleris Corporation 2010 Equity Incentive Plan Stock Option Award Agreement by and among Aleris Corporation and Management Team Members, including each of Terrance J. Hogan, Scott A. McKinley, Michael J. Hobey, and Ralf Zimmermann (filed as Exhibit 10.12.2 to Aleris International, Inc.’s Amendment No. 3 to Registration Statement on Form S-4 (File No. 333-173180), and incorporated herein by reference). | |||
| 10.12† | Aleris Holding Company 2010 Equity Incentive Plan Restricted Stock Unit Agreement dated June 1, 2010 between Aleris Holding Company and Steven J. Demetriou (filed as Exhibit 10.14 to Aleris International, Inc.’s Registration Statement on Form S-4 (File No. 333-173180), and incorporated herein by reference). | |||
| 10.12.1† | Amendment 2 to the Aleris Corporation 2010 Equity Incentive Plan Restricted Stock Unit Agreement between Aleris Corporation and Steven J. Demetriou (filed as Exhibit 10.13.1 to Aleris International, Inc.’s Amendment No. 3 to Registration Statement on Form S-4 (File No. 333-173180), and incorporated herein by reference). | |||
| 10.13† | Aleris Holding Company 2010 Equity Incentive Plan Restricted Stock Unit Agreement, dated as of June 1, 2010 between Aleris Holding Company and Sean M. Stack (filed as Exhibit 10.15 to Aleris International, Inc.’s Registration Statement on Form S-4 (File No. 333-173180), and incorporated herein by reference). | |||
| 10.13.1† | Amendment 2 to the Aleris Corporation 2010 Equity Incentive Plan Restricted Stock Unit Agreement between Aleris Corporation and Sean M. Stack (filed as Exhibit 10.14.1 to Aleris International, Inc.’s Amendment No. 3 to Registration Statement on Form S-4 (File No. 333-173180), and incorporated herein by reference). | |||
| 10.14† | Form of Aleris Holding Company 2010 Equity Incentive Plan Restricted Stock Unit Agreement, dated as of June 1, 2010 between Aleris Holding Company and each of Christopher R. Clegg, Thomas W. Weidenkopf, and K. Alan Dick (filed as Exhibit 10.16 to Aleris International, Inc.’s Registration Statement on Form S-4 (File No. 333-173180), and incorporated herein by reference). | |||
|
|
| |||
II-8
Table of Contents
| Exhibit number |
Description | |||
|
|
| |||
| 10.14.1† | Form of Amendment 1 to the Aleris Corporation 2010 Equity Incentive Plan Restricted Stock Unit Agreement between Aleris Corporation and each of Christopher R. Clegg, Thomas W. Weidenkopf and K. Alan Dick (filed as Exhibit 10.15.1 to Aleris International, Inc.’s Amendment No. 3 to Registration Statement on Form S-4 (File No. 333-173180), and incorporated herein by reference). | |||
| 10.15† | Aleris Holding Company 2010 Equity Incentive Plan Restricted Stock Unit Agreement, dated as of June 1, 2010 between Aleris Holding Company and K. Alan Dick (filed as Exhibit 10.17 to Aleris International, Inc.’s Registration Statement on Form S-4 (File No. 333-173180), and incorporated herein by reference). | |||
| 10.15.1† | Amendment 1 to the Aleris Corporation 2010 Equity Incentive Plan Restricted Stock Unit Agreement (dated February 2, 2011) between Aleris Corporation and K. Alan Dick (filed as Exhibit 10.16.1 to Aleris International, Inc.’s Amendment No. 3 to Registration Statement on Form S-4 (File No. 333-173180), and incorporated herein by reference). | |||
| 10.16† | Form of Aleris Holding Company 2010 Equity Incentive Plan Restricted Stock Unit Agreement, dated as of June 11, 2010 with Management Team members, including with each of Terrance J. Hogan, Scott A. McKinley, Michael J. Hobey and Ralf Zimmermann (filed as Exhibit 10.18 to Aleris International, Inc.’s Registration Statement on Form S-4 (File No. 333-173180), and incorporated herein by reference). | |||
| 10.16.1† | Form of Amendment 1 to the Aleris Corporation 2010 Equity Incentive Plan Restricted Stock Unit Award Agreement by and among Aleris Corporation and Management Team Members, including each of Terrance J. Hogan, Scott A. McKinley, Michael J. Hobey, and Ralf Zimmermann (filed as Exhibit 10.17.1 to Aleris International, Inc.’s Amendment No. 3 to Registration Statement on Form S-4 (File No. 333-173180), and incorporated herein by reference). | |||
| 10.17† | Aleris International, Inc. Deferred Compensation and Retirement Benefit Restoration Plan, effective January 1, 2009 (filed as Exhibit 10.19 to Aleris International, Inc.’s Registration Statement on Form S-4 (File No. 333-173180), and incorporated herein by reference). | |||
| 10.18† | Aleris Cash Balance Plan, as amended and restated as of June 1, 2010 (filed as Exhibit 10.20 to Aleris International, Inc.’s Registration Statement on Form S-4 (File No. 333-173180), and incorporated herein by reference). | |||
| 10.19† | Form of Aleris Corporation 2012 Management Incentive Plan (filed as Exhibit 10.20.1 to Aleris International, Inc.’s Amendment No. 3 to Registration Statement on Form S-4 (File No. 333-173180), and incorporated herein by reference). | |||
| 10.20† | Aleris Switzerland GmbH, Neuhausen am Rheinfall, effective as of April 1, 2008, with respect to pension benefits for Roelof IJ. Baan (filed as Exhibit 10.22 to Aleris International, Inc.’s Registration Statement on Form S-4 (File No. 333-173180), and incorporated herein by reference). | |||
| 10.21† | Form of Aleris Holding Company 2010 Equity Incentive Plan Director Stock Option Award Agreement with each of Scott L. Graves, Brian Laibow, Ara Abrahamian, and Kenneth Liang (filed as Exhibit 10.23 to Aleris International, Inc.’s Registration Statement on Form S-4 (File No. 333-173180), and incorporated herein by reference). | |||
|
|
| |||
II-9
Table of Contents
| Exhibit number |
Description | |||
|
|
| |||
| 10.21.1† | Form of Amendment 1 to the Aleris Corporation 2010 Equity Incentive Plan Director Stock Option Award Agreement with each of Scott L. Graves, Brian Laibow, Ara Abrahamian, and Kenneth Liang (filed as Exhibit 10.22.1 to Aleris International, Inc.’s Amendment No. 3 to Registration Statement on Form S-4 (File No. 333-173180), and incorporated herein by reference). | |||
| 10.21.2† | Form of Amendment 2 to the Aleris Corporation 2010 Equity Incentive Plan Director Stock Option Award Agreement with each of Scott L. Graves, Brian Laibow, Ara Abrahamian, and Kenneth Liang (filed as Exhibit 10.22.2 to Aleris International, Inc.’s Amendment No. 3 to Registration Statement on Form S-4 (File No. 333-173180), and incorporated herein by reference). | |||
| 10.22† | Form of Aleris Holding Company 2010 Equity Incentive Plan Director Restricted Stock Unit Award Agreement with each of Scott L. Graves, Brian Laibow, Ara Abrahamian, and Kenneth Liang (filed as Exhibit 10.24 to Aleris International, Inc.’s Registration Statement on Form S-4 (File No. 333-173180), and incorporated herein by reference). | |||
| 10.22.1† | Form of Amendment 1 to the Aleris Corporation 2010 Equity Incentive Plan Director Restricted Stock Unit Award Agreement with each of Scott L. Graves, Brian Laibow, Ara Abrahamian, and Kenneth Liang (filed as Exhibit 10.23.1 to Aleris International, Inc.’s Amendment No. 3 to Registration Statement on Form S-4 (File No. 333-173180), and incorporated herein by reference). | |||
| 10.23† | Form of Aleris Holding Company 2010 Equity Incentive Plan Director Stock Option Award Agreement with each of Christopher M. Crane, Lawrence Stranghoener, and Emily Alexander (filed as Exhibit 10.25 to Aleris International, Inc.’s Registration Statement on Form S-4 (File No. 333-173180), and incorporated herein by reference). | |||
| 10.23.1† | Form of Amendment 1 to the Aleris Corporation 2010 Equity Incentive Plan Director Stock Option Award Agreement with each of Christopher M. Crane, Lawrence Stranghoener, and Emily Alexander (filed as Exhibit 10.24.1 to Aleris International, Inc.’s Amendment No. 3 to Registration Statement on Form S-4 (File No. 333-173180), and incorporated herein by reference). | |||
| 10.23.2† | Form of Amendment 2 to the Aleris Corporation 2010 Equity Incentive Plan Director Stock Option Award Agreement with each of Christopher M. Crane, Lawrence Stranghoener, and Emily Alexander (filed as Exhibit 10.24.2 to Aleris International, Inc.’s Amendment No. 3 to Registration Statement on Form S-4 (File No. 333-173180), and incorporated herein by reference). | |||
| 10.24† | Form of Aleris Holding Company 2010 Equity Incentive Plan Director Restricted Stock Unit Award Agreement with each of Christopher M. Crane, Lawrence Stranghoener, and Emily Alexander (filed as Exhibit 10.26 to Aleris International, Inc.’s Registration Statement on Form S-4 (File No. 333-173180), and incorporated herein by reference). | |||
| 10.24.1† | Form of Amendment 1 to the Aleris Corporation 2010 Equity Incentive Plan Director Restricted Stock Unit Award Agreement with each of Christopher M. Crane, Lawrence Stranghoener, and Emily Alexander (filed as Exhibit 10.25.1 to Aleris International, Inc.’s Amendment No. 3 to Registration Statement on Form S-4 (File No. 333-173180), and incorporated herein by reference). | |||
|
|
| |||
II-10
Table of Contents
| Exhibit number |
Description | |||
|
|
| |||
| 10.25† | Aleris Holding Company 2010 Equity Incentive Plan Director Restricted Stock Award Agreement with G. Richard Wagoner, Jr. (filed as Exhibit 10.27 to Aleris International, Inc.’s Registration Statement on Form S-4 (File No. 333-173180), and incorporated herein by reference). | |||
| 10.25.1† | Amendment 1 to the Aleris Corporation 2010 Equity Incentive Plan Director Restricted Stock Award Agreement with G. Richard Wagoner, Jr. (filed as Exhibit 10.26.1 to Aleris International, Inc.’s Amendment No. 3 to Registration Statement on Form S-4 (File No. 333-173180), and incorporated herein by reference). | |||
| 10.26† | Employment Agreement dated as of June 1, 2010 by and among Aleris Switzerland GmbH and Roelof IJ. Baan (filed as Exhibit 10.28 to Aleris International, Inc.’s Registration Statement on Form S-4 (File No. 333-173180), and incorporated herein by reference). | |||
| 10.26.1† | Amendment 1 to Employment Agreement by and among Aleris Switzerland GmbH and Roelof IJ. Baan (filed as Exhibit 10.27.1 to Aleris International, Inc.’s Amendment No. 4 to Registration Statement on Form S-4 (File No. 333-173180), and incorporated herein by reference). | |||
| 10.27† | Aleris Holding Company 2010 Equity Incentive Plan Stock Option Agreement dated as of June 1, 2010 between Aleris Holding Company and Roelof IJ. Baan (filed as Exhibit 10.29 to Aleris International, Inc.’s Registration Statement on Form S-4 (File No. 333-173180), and incorporated herein by reference). | |||
| 10.27.1† | Amendment 1 to the Aleris Corporation 2010 Equity Incentive Plan Stock Option Agreement between Aleris Corporation and Roelof IJ. Baan (filed as Exhibit 10.28.1 to Aleris International, Inc.’s Amendment No. 3 to Registration Statement on Form S-4 (File No. 333-173180), and incorporated herein by reference). | |||
| 10.27.2† | Amendment 2 to the Aleris Corporation 2010 Equity Incentive Plan Stock Option Agreement between Aleris Corporation and Roelof IJ. Baan (filed as Exhibit 10.28.2 to Aleris International, Inc.’s Amendment No. 3 to Registration Statement on Form S-4 (File No. 333-173180), and incorporated herein by reference). | |||
| 10.28† | Aleris Holding Company 2010 Equity Incentive Plan Restricted Stock Unit Agreement as of June 1, 2010 between Aleris Holding Company and Roelof IJ. Baan (filed as Exhibit 10.30 to Aleris International, Inc.’s Registration Statement on Form S-4 (File No. 333-173180), and incorporated herein by reference). | |||
| 10.28.1† | Amendment 1 to the Aleris Corporation 2010 Equity Incentive Plan Restricted Stock Unit Agreement between Aleris Corporation and Roelof IJ. Baan (filed as Exhibit 10.30.1 to Aleris International, Inc.’s Amendment No. 3 to Registration Statement on Form S-4 (File No. 333-173180), and incorporated herein by reference). | |||
| 10.29† | Letter Agreement dated April 5, 2011 between Aleris International, Inc. and Steven J. Demetriou amending Mr. Demetriou’s Employment Agreement filed as Exhibit 10.2 to Aleris International, Inc.’s Quarterly Report on Form 10-Q (File No. 333-173180) filed May 13, 2011, and incorporated herein by reference). | |||
| 10.30† | Letter Agreement dated April 5, 2011 between Aleris International, Inc. and Sean M. Stack amending Mr. Stack’s Employment Agreement filed as Exhibit 10.3 to Aleris International, Inc.’s Quarterly Report on Form 10-Q (File No. 333-173180) filed May 13, 2011, and incorporated herein by reference). | |||
|
|
| |||
II-11
Table of Contents
| Exhibit number |
Description | |
|
| ||
| 10.31 | Consulting Services and Non-Competition Agreement dated June 1, 2010 between Aleris International, Inc. and Dale V. Kesler (filed as Exhibit 10.34 to Aleris International Inc.’s Amendment No. 1 to Registration Statement on Form S-4 (File No. 333-173180) and incorporated herein by reference). | |
| 10.32† | Form of Aleris Corporation 2010 Equity Incentive Plan Director Restricted Stock Unit Award Agreement and Amendment 1, thereto (filed as Exhibit 99.1 to Aleris International, Inc.’s Amendment No. 1 to the Current Report on Form 8-K filed on February 6, 2012 (File No. 333-173180), and incorporated herein by reference). | |
| 10.33† | Form of Aleris Corporation 2010 Equity Incentive Plan Director Stock Option Award Agreement and Amendment 1, thereto (filed as Exhibit 99.2 to Aleris International, Inc.’s Amendment No. 1 to the Current Report on Form 8-K filed on February 6, 2012 (File No. 333-173180), and incorporated herein by reference). | |
| 10.34† | Form of Aleris Corporation 2010 Equity Incentive Plan Executive Officer and/or Management Team Member Restricted Stock Unit Award Agreement and Amendment 1, thereto (filed as Exhibit 10.3.4 to Aleris International, Inc.’s Annual Report on Form 10-K filed on February 29, 2012 (File No. 333-173180), and incorporated herein by reference). | |
| 10.35† | Form of Aleris Corporation 2010 Equity Incentive Plan Executive Officer and/or Management Team Member Stock Option Award Agreement and Amendment 1, thereto (filed as Exhibit 10.3.5 to Aleris International, Inc.’s Annual Report on Form 10-K filed on February 29, 2012 (File No. 333-173180), and incorporated herein by reference). | |
| 10.36† | Form of Aleris Corporation 2010 Equity Incentive Plan Stock Option Award Agreement Amendment (regarding equitable dividend adjustments) (filed as Exhibit 10.3.6 to Aleris International, Inc.’s Annual Report on Form 10-K filed on February 29, 2012 (File No. 333-173180), and incorporated herein by reference). | |
| 21.1 | List of Subsidiaries of Aleris Corporation as of March 1, 2012. | |
| 23.1* | Consent of Fried, Frank, Harris, Shriver & Jacobson LLP (included in the opinion filed as Exhibit 5.1). | |
| 23.2 | Consent of Ernst & Young LLP. | |
| 24.1 | Power of Attorney (included on signature page to Aleris Corporation’s Registration Statement on Form S-1) (File No. 333-173721). | |
| 24.2 | Power of Attorney of Robert O’Leary (included on signature page hereto). | |
|
| ||
| † | Management contract or compensatory plan or arrangement |
| * | To be filed by amendment |
(b) Financial Statement Schedules
We have omitted financial statement schedules because they are not required or are not applicable, or the required information is shown in the Consolidated Financial Statements or the notes to the Consolidated Financial Statements included elsewhere in this prospectus.
II-12
Table of Contents
Item 17. Undertakings.
The undersigned registrant hereby undertakes that:
(1) For purposes of determining any liability under the Securities Act of 1933, as amended, the information omitted from the form of prospectus filed as part of this Registration Statement in reliance upon Rule 430A and contained in a form of prospectus filed by the Registrant pursuant to Rule 424(b)(1) or (4) or 497(h) under the Securities Act shall be deemed to be part of this Registration Statement as of the time it was declared effective.
(2) For the purpose of determining any liability under the Securities Act of 1933, as amended, each post-effective amendment that contains a form of prospectus shall be deemed to be a new registration statement relating to the securities offered therein, and the offering of such securities at that time shall be deemed to be the initial bona fide offering thereof.
The undersigned registrant hereby undertakes to provide to the underwriter at the closing specified in the underwriting agreements, certificates in such denominations and registered in such names as required by the underwriter to permit prompt delivery to each purchaser.
Insofar as indemnification for liabilities arising under the Securities Act of 1933, as amended, may be permitted to directors, officers and controlling persons of the registrant pursuant to the foregoing provisions, or otherwise, the registrant has been advised that in the opinion of the Securities and Exchange Commission such indemnification is against public policy as expressed in the Act and is, therefore, unenforceable. In the event that a claim for indemnification against such liabilities (other than the payment by the registrant of expenses incurred or paid by a director, officer or controlling person of the registrant in the successful defense of any action, suit or proceeding) is asserted by such director, officer or controlling person in connection with the securities being registered, the registrant will, unless in the opinion of its counsel the matter has been settled by controlling precedent, submit to a court of appropriate jurisdiction the question whether such indemnification by it is against public policy as expressed in the Act and will be governed by the final adjudication of such issue.
II-13
Table of Contents
Signatures
Pursuant to the requirements of the Securities Act, the registrant has duly caused this registration statement to be signed on its behalf by the undersigned, thereunto duly authorized in the City of Cleveland, State of Ohio, on the 8th day of March, 2012.
| ALERIS CORPORATION | ||
| By: |
/S/ SEAN M. STACK | |
| Sean M. Stack | ||
| Executive Vice President and Chief Financial Officer | ||
Power of attorney
KNOW ALL MEN BY THESE PRESENTS, that Robert O’Leary whose signature appears below constitutes and appoints Christopher R. Clegg and Sean M. Stack, and each of them, his true and lawful attorneys-in-fact and agents with full powers of substitution and resubstitution, for him and in his name, place and stead, in any and all capacities, to sign any or all amendments to this registration statement, including post-effective amendments, and to file the same, with all exhibits thereto, and other documents in connection therewith, with the Securities and Exchange Commission, granting unto said attorneys-in-fact and agents, and each of them, full power and authority to do and perform each and every act and thing requisite and necessary to be done in and about the premises, as fully to all intents and purposes as he might or could do in person, and hereby ratifies and confirms all his said attorneys-in-fact and agents, or any of them, or his substitute or substitutes may lawfully do or cause to be done by virtue thereof.
Pursuant to the requirements of the Securities Act of 1933, as amended, this registration statement has been signed by the following persons in the capacities and on the dates indicated.
| Signature | Title | Date | ||
|
| ||||
| * Steven J. Demetriou |
Chairman of the Board, Chief Executive Officer and Director (Principal Executive Officer) | March 8, 2012 | ||
| /S/ SEAN M. STACK Sean M. Stack |
Executive Vice President and Chief Financial Officer (Principal Financial Officer) | March 8, 2012 | ||
| * Scott A. McKinley |
Senior Vice President and Controller | March 8, 2012 | ||
| * Scott L. Graves |
Director | March 8, 2012 | ||
| * Brian Laibow |
Director | March 8, 2012 | ||
| /S/ ROBERT O’LEARY Robert O’Leary |
Director | March 8, 2012 | ||
|
| ||||
II-14
Table of Contents
| Signature | Title | Date | ||
|
| ||||
| * Kenneth Liang |
Director | March 8, 2012 | ||
| * Christopher M. Crane |
Director | March 8, 2012 | ||
| * G. Richard Wagoner, Jr. |
Director | March 8, 2012 | ||
| * Lawrence W. Stranghoener |
Director | March 8, 2012 | ||
| * Emily Alexander |
Director | March 8, 2012 | ||
| *By: |
/S/ SEAN M. STACK | |||
| Sean M. Stack As Attorney-in-Fact | ||||
II-15
Table of Contents
Exhibit index
| Exhibit number |
Description | |||
|
|
| |||
| 1.1 | * | Form of Underwriting Agreement. | ||
| 2.1 | First Amended Joint Plan of Reorganization of Aleris International, Inc. and its Affiliated Debtors, as modified, Mar. 19, 2010 (filed as Exhibit 2.1 to Aleris International, Inc.’s Registration Statement on Form S-4 (File No. 333-173180), and incorporated herein by reference). | |||
| 3.1 | * | Form of Amended and Restated Certificate of Incorporation of Aleris Corporation. | ||
| 3.2 | * | Form of Amended and Restated Bylaws of Aleris Corporation. | ||
| 4.1 | Specimen Certificate of Common Stock, par value $0.01 per share, of Aleris Corporation (filed as Exhibit 4.1 to Aleris Corporation’s Amendment No. 2 to Registration Statement on Form S-1 (File No. 333-173721), and incorporated herein by reference). | |||
| 4.2 | Indenture, dated as of February 9, 2011, by and among Aleris International, Inc., the guarantors named therein, and U.S. Bank National Association, as trustee (filed as Exhibit 4.1 to Aleris International, Inc.’s Registration Statement on Form S-4 (File No. 333-173180), and incorporated herein by reference). | |||
| 4.3 | Registration Rights Agreement, dated as of February 9, 2011, by and among Aleris International, Inc., the guarantors named therein, and Merrill, Lynch, Pierce, Fenner & Smith Incorporated, Barclays Capital Inc., Deutsche Bank Securities Inc., J.P. Morgan Securities LLC, UBS Securities LLC, KeyBanc Capital Markets Inc., and Moelis & Company LLC, as Initial Purchasers (filed as Exhibit 4.2 to Aleris International, Inc.’s Registration Statement on Form S-4 (File No. 333-173180), and incorporated herein by reference). | |||
| 4.4 | Form of 7 5/8% Senior Notes due 2018 (included in Exhibit 4.2). | |||
| 4.5 | Stockholders Agreement, dated June 1, 2010 between Aleris Holding Company and the stockholders of Aleris Holding Company named therein (filed as Exhibit 10.9 to Aleris International, Inc.’s Registration Statement on Form S-4 (File No. 333-173180), and incorporated herein by reference). | |||
| 4.6 | Registration Rights Agreement, dated June 1, 2010 among Aleris Holding Company and the parties listed therein (filed as Exhibit 10.31 to Aleris International, Inc.’s Registration Statement on Form S-4 (File No. 333-173180), and incorporated herein by reference). | |||
| 5.1 | * | Opinion of Fried, Frank, Harris, Shriver & Jacobson LLP. | ||
| 10.1 | Amended and Restated Credit Agreement dated June 30, 2011 among Aleris International, Inc., each subsidiary of Aleris International, Inc. a party thereto, the lenders party thereto from time to time, Bank of America, N.A. as Administrative Agent, J.P. Morgan Securities LLC as Syndication Agent, RBS Business Capital as a Senior Managing Agent, Bank of America, N.A., Deutsche Bank AG New York Branch and JPMorgan Chase Bank, N.A. as Co-Collateral Agents, Barclays Capital, Deutsche Bank AG New York Branch and UBS Securities LLC as Co-Documentation Agents (filed as Exhibit 10.1 to Aleris International, Inc.’s Amendment No. 4 to Registration Statement on Form S-4 (File No. 333-173180), and incorporated herein by reference). | |||
|
|
| |||
II-16
Table of Contents
| Exhibit number |
Description | |||
|
|
| |||
| 10.2 | U.S. Security Agreement, dated as of June 1, 2010, by and among Aleris International, Inc. and certain of its subsidiaries, as assignors, and Bank of America, as administrative agent, relating to the Credit Agreement (filed as Exhibit 10.3 to Aleris International, Inc.’s Amendment No. 1 to Registration Statement on Form S-4 (File No. 333-173180), and incorporated herein by reference). | |||
| 10.3 | Facility Agreement, dated as of March 29, 2011, between Aleris Dingsheng Aluminum (Zhenjiang) Co., Ltd., as borrower, and Bank of China Limited, Zhenjiang Jingkou Sub-branch, as lender (filed as Exhibit 10.4 to Aleris International, Inc.’s Amendment No. 1 to Registration Statement on Form S-4 (File No. 333-173180), and incorporated herein by reference). | |||
| 10.3.1 | Amendment Agreement to the Facility Agreement, dated May 18, 2011, by and between Aleris Dingsheng Aluminum (Zhenjiang) Co. Ltd., as Borrower, and Bank of China Limited, Zhenjiang Jingkou Sub-Branch, as Lender (English translation) (filed as Exhibit 10.3.1 to Aleris International, Inc.’s Annual Report on Form 10-K (File No. 333-173180), and incorporated herein by reference). | |||
| 10.3.2 | Amendment No. 2 to the Facility Agreement, dated December 28, 2011, by and between Aleris Dingsheng Aluminum (Zhenjiang) Co. Ltd., as Borrower, and Bank of China Limited, Zhenjiang Jingkou Sub-Branch, as Lender (English translation) (filed as Exhibit 10.3.1 to Aleris International, Inc.’s Annual Report on Form 10-K (File No. 333-173180), and incorporated herein by reference). | |||
| 10.4† | Employment Agreement dated as of June 1, 2010 by and among the Company, Aleris Holding Company and Steven J. Demetriou (filed as Exhibit 10.5 to Aleris International, Inc.’s Registration Statement on Form S-4 (File No. 333-173180), and incorporated herein by reference). | |||
| 10.4.1† | Amendment 2 to Employment Agreement by and among Aleris Corporation and Steven J. Demetriou (filed as Exhibit 10.4.1 to Aleris International, Inc.’s Amendment No. 3 to Registration Statement on Form S-4 (File No. 333-173180), and incorporated herein by reference). | |||
| 10.5† | Employment Agreement dated as of June 1, 2010 by and among Aleris International, Inc., the Company and Sean M. Stack (filed as Exhibit 10.6 to Aleris International, Inc.’s Registration Statement on Form S-4 (File No. 333-173180), and incorporated herein by reference). | |||
| 10.5.1† | Amendment 2 to Employment Agreement by and among Aleris Corporation and Sean M. Stack (filed as Exhibit 10.5.1 to Aleris International, Inc.’s Amendment No. 3 to Registration Statement on Form S-4 (File No. 333-173180), and incorporated herein by reference). | |||
| 10.6† | Form of Employment Agreement dated as of June 1, 2010 by and among Aleris International, Inc., the Company and each of Christopher R. Clegg, Thomas W. Weidenkopf and K. Alan Dick (filed as Exhibit 10.7 to Aleris International, Inc.’s Registration Statement on Form S-4 (File No. 333-173180), and incorporated herein by reference). | |||
|
|
| |||
II-17
Table of Contents
| Exhibit number |
Description | |||
|
|
| |||
| 10.6.1† | Form of Amendment of Form of Employment Agreement by and among Aleris Corporation and each of Christopher R. Clegg, Thomas W. Weidenkopf and K. Alan Dick (filed as Exhibit 10.6.1 to Aleris International, Inc.’s Amendment No. 3 to Registration Statement on Form S-4 (File No. 333-173180), and incorporated herein by reference). | |||
| 10.7† | Form of Aleris Corporation 2012 Equity Incentive Plan (filed as Exhibit 10.7 to Aleris International, Inc.’s Amendment No. 3 to Registration Statement on Form S-4 (File No. 333-173180), and incorporated herein by reference). | |||
| 10.8† | Aleris Holding Company 2010 Equity Incentive Plan Stock Option Agreement dated June 1, 2010 between Aleris Holding Company and Steven J. Demetriou (filed as Exhibit 10.10 to Aleris International, Inc.’s Registration Statement on Form S-4 (File No. 333-173180), and incorporated herein by reference). | |||
| 10.8.1† | Amendment 1 to the Aleris Corporation 2010 Equity Incentive Plan Stock Option Agreement between Aleris Corporation and Steven J. Demetriou (filed as Exhibit 10.9.1 to Aleris International, Inc.’s Amendment No. 3 to Registration Statement on Form S-4 (File No. 333-173180), and incorporated herein by reference). | |||
| 10.8.2† | Amendment 2 to the Aleris Corporation 2010 Equity Incentive Plan Stock Option Agreement between Aleris Corporation and Steven J. Demetriou (filed as Exhibit 10.9.2 to Aleris International, Inc.’s Amendment No. 3 to Registration Statement on Form S-4 (File No. 333-173180), and incorporated herein by reference). | |||
| 10.9† | Form of Aleris Holding Company 2010 Equity Incentive Plan Stock Option Agreement, dated as of June 1, 2010 between Aleris Holding Company and each of Sean M. Stack, Christopher R. Clegg, Thomas W. Weidenkopf and K. Alan Dick (filed as Exhibit 10.11 to Aleris International, Inc.’s Registration Statement on Form S-4 (File No. 333-173180), and incorporated herein by reference). | |||
| 10.9.1† | Form of Amendment 1 to the Aleris Corporation 2010 Equity Incentive Plan Stock Option Agreement between Aleris Corporation and each of Sean M. Stack, Christopher R. Clegg, Thomas W. Weidenkopf, and K. Alan Dick (filed as Exhibit 10.10.1 to Aleris International, Inc.’s Amendment No. 3 to Registration Statement on Form S-4 (File No. 333-173180), and incorporated herein by reference). | |||
| 10.9.2† | Form of Amendment 2 to the Aleris Corporation 2010 Equity Incentive Plan Stock Option Agreement between Aleris Corporation and each of Sean M. Stack, Christopher R. Clegg, Thomas W. Weidenkopf, and K. Alan Dick (filed as Exhibit 10.10.2 to Aleris International, Inc.’s Amendment No. 3 to Registration Statement on Form S-4 (File No. 333-173180), and incorporated herein by reference). | |||
| 10.10† | Aleris Holding Company 2010 Equity Incentive Plan Stock Option Agreement dated February 2, 2011 between Aleris Holding Company and K. Alan Dick (filed as Exhibit 10.12 to Aleris International, Inc.’s Registration Statement on Form S-4 (File No. 333-173180), and incorporated herein by reference). | |||
| 10.10.1† | Amendment 1 to the Aleris Corporation 2010 Equity Incentive Plan Stock Option Agreement (dated February 2, 2011) between Aleris Corporation and K. Alan Dick (filed as Exhibit 10.11.1 to Aleris International, Inc.’s Amendment No. 3 to Registration Statement on Form S-4 (File No. 333-173180), and incorporated herein by reference). | |||
|
|
| |||
II-18
Table of Contents
| Exhibit number |
Description | |||
|
|
| |||
| 10.10.2† | Amendment 2 to the Aleris Corporation 2010 Equity Incentive Plan Stock Option Agreement (dated February 2, 2011) between Aleris Corporation and K. Alan Dick (filed as Exhibit 10.11.2 to Aleris International, Inc.’s Amendment No. 3 to Registration Statement on Form S-4 (File No. 333-173180), and incorporated herein by reference). | |||
| 10.11† | Form of Aleris Holding Company 2010 Equity Incentive Plan Stock Option Award Agreement dated June 11, 2010 with Management Team Members, including with each of Terrance J. Hogan, Scott A. McKinley, Michael J. Hobey and Ralf Zimmermann (filed as Exhibit 10.13 to Aleris International, Inc.’s Registration Statement on Form S-4 (File No. 333-173180), and incorporated herein by reference). | |||
| 10.11.1† | Form of Amendment 1 to the Aleris Corporation 2010 Equity Incentive Plan Stock Option Award Agreement by and among Aleris Corporation and Management Team Members, including each of Terrance J. Hogan, Scott A. McKinley, Michael J. Hobey, and Ralf Zimmermann (filed as Exhibit 10.12.1 to Aleris International, Inc.’s Amendment No. 3 to Registration Statement on Form S-4 (File No. 333-173180), and incorporated herein by reference). | |||
| 10.11.2† | Form of Amendment 2 to the Aleris Corporation 2010 Equity Incentive Plan Stock Option Award Agreement by and among Aleris Corporation and Management Team Members, including each of Terrance J. Hogan, Scott A. McKinley, Michael J. Hobey, and Ralf Zimmermann (filed as Exhibit 10.12.2 to Aleris International, Inc.’s Amendment No. 3 to Registration Statement on Form S-4 (File No. 333-173180), and incorporated herein by reference). | |||
| 10.12† | Aleris Holding Company 2010 Equity Incentive Plan Restricted Stock Unit Agreement dated June 1, 2010 between Aleris Holding Company and Steven J. Demetriou (filed as Exhibit 10.14 to Aleris International, Inc.’s Registration Statement on Form S-4 (File No. 333-173180), and incorporated herein by reference). | |||
| 10.12.1† | Amendment 2 to the Aleris Corporation 2010 Equity Incentive Plan Restricted Stock Unit Agreement between Aleris Corporation and Steven J. Demetriou (filed as Exhibit 10.13.1 to Aleris International, Inc.’s Amendment No. 3 to Registration Statement on Form S-4 (File No. 333-173180), and incorporated herein by reference). | |||
| 10.13† | Aleris Holding Company 2010 Equity Incentive Plan Restricted Stock Unit Agreement, dated as of June 1, 2010 between Aleris Holding Company and Sean M. Stack (filed as Exhibit 10.15 to Aleris International, Inc.’s Registration Statement on Form S-4 (File No. 333-173180), and incorporated herein by reference). | |||
| 10.13.1† | Amendment 2 to the Aleris Corporation 2010 Equity Incentive Plan Restricted Stock Unit Agreement between Aleris Corporation and Sean M. Stack (filed as Exhibit 10.14.1 to Aleris International, Inc.’s Amendment No. 3 to Registration Statement on Form S-4 (File No. 333-173180), and incorporated herein by reference). | |||
| 10.14† | Form of Aleris Holding Company 2010 Equity Incentive Plan Restricted Stock Unit Agreement, dated as of June 1, 2010 between Aleris Holding Company and each of Christopher R. Clegg, Thomas W. Weidenkopf, and K. Alan Dick (filed as Exhibit 10.16 to Aleris International, Inc.’s Registration Statement on Form S-4 (File No. 333-173180), and incorporated herein by reference). | |||
|
|
| |||
II-19
Table of Contents
| Exhibit number |
Description | |||
|
|
| |||
| 10.14.1† | Form of Amendment 1 to the Aleris Corporation 2010 Equity Incentive Plan Restricted Stock Unit Agreement between Aleris Corporation and each of Christopher R. Clegg, Thomas W. Weidenkopf and K. Alan Dick (filed as Exhibit 10.15.1 to Aleris International, Inc.’s Amendment No. 3 to Registration Statement on Form S-4 (File No. 333-173180), and incorporated herein by reference). | |||
| 10.15† | Aleris Holding Company 2010 Equity Incentive Plan Restricted Stock Unit Agreement, dated as of June 1, 2010 between Aleris Holding Company and K. Alan Dick (filed as Exhibit 10.17 to Aleris International, Inc.’s Registration Statement on Form S-4 (File No. 333-173180), and incorporated herein by reference). | |||
| 10.15.1† | Amendment 1 to the Aleris Corporation 2010 Equity Incentive Plan Restricted Stock Unit Agreement (dated February 2, 2011) between Aleris Corporation and K. Alan Dick (filed as Exhibit 10.16.1 to Aleris International, Inc.’s Amendment No. 3 to Registration Statement on Form S-4 (File No. 333-173180), and incorporated herein by reference). | |||
| 10.16† | Form of Aleris Holding Company 2010 Equity Incentive Plan Restricted Stock Unit Agreement, dated as of June 11, 2010 with Management Team members, including with each of Terrance J. Hogan, Scott A. McKinley, Michael J. Hobey and Ralf Zimmermann (filed as Exhibit 10.18 to Aleris International, Inc.’s Registration Statement on Form S-4 (File No. 333-173180), and incorporated herein by reference). | |||
| 10.16.1† | Form of Amendment 1 to the Aleris Corporation 2010 Equity Incentive Plan Restricted Stock Unit Award Agreement by and among Aleris Corporation and Management Team Members, including each of Terrance J. Hogan, Scott A. McKinley, Michael J. Hobey, and Ralf Zimmermann (filed as Exhibit 10.17.1 to Aleris International, Inc.’s Amendment No. 3 to Registration Statement on Form S-4 (File No. 333-173180), and incorporated herein by reference). | |||
| 10.17† | Aleris International, Inc. Deferred Compensation and Retirement Benefit Restoration Plan, effective January 1, 2009 (filed as Exhibit 10.19 to Aleris International, Inc.’s Registration Statement on Form S-4 (File No. 333-173180), and incorporated herein by reference). | |||
| 10.18† | Aleris Cash Balance Plan, as amended and restated as of June 1, 2010 (filed as Exhibit 10.20 to Aleris International, Inc.’s Registration Statement on Form S-4 (File No. 333-173180), and incorporated herein by reference). | |||
| 10.19† | Form of Aleris Corporation 2012 Management Incentive Plan (filed as Exhibit 10.20.1 to Aleris International, Inc.’s Amendment No. 3 to Registration Statement on Form S-4 (File No. 333-173180), and incorporated herein by reference). | |||
| 10.20† | Aleris Switzerland GmbH, Neuhausen am Rheinfall, effective as of April 1, 2008, with respect to pension benefits for Roelof IJ. Baan (filed as Exhibit 10.22 to Aleris International, Inc.’s Registration Statement on Form S-4 (File No. 333-173180), and incorporated herein by reference). | |||
| 10.21† | Form of Aleris Holding Company 2010 Equity Incentive Plan Director Stock Option Award Agreement with each of Scott L. Graves, Brian Laibow, Ara Abrahamian, and Kenneth Liang (filed as Exhibit 10.23 to Aleris International, Inc.’s Registration Statement on Form S-4 (File No. 333-173180), and incorporated herein by reference). | |||
|
|
| |||
II-20
Table of Contents
| Exhibit number |
Description | |||
|
|
| |||
| 10.21.1† | Form of Amendment 1 to the Aleris Corporation 2010 Equity Incentive Plan Director Stock Option Award Agreement with each of Scott L. Graves, Brian Laibow, Ara Abrahamian, and Kenneth Liang (filed as Exhibit 10.22.1 to Aleris International, Inc.’s Amendment No. 3 to Registration Statement on Form S-4 (File No. 333-173180), and incorporated herein by reference). | |||
| 10.21.2† | Form of Amendment 2 to the Aleris Corporation 2010 Equity Incentive Plan Director Stock Option Award Agreement with each of Scott L. Graves, Brian Laibow, Ara Abrahamian, and Kenneth Liang (filed as Exhibit 10.22.2 to Aleris International, Inc.’s Amendment No. 3 to Registration Statement on Form S-4 (File No. 333-173180), and incorporated herein by reference). | |||
| 10.22† | Form of Aleris Holding Company 2010 Equity Incentive Plan Director Restricted Stock Unit Award Agreement with each of Scott L. Graves, Brian Laibow, Ara Abrahamian, and Kenneth Liang (filed as Exhibit 10.24 to Aleris International, Inc.’s Registration Statement on Form S-4 (File No. 333-173180), and incorporated herein by reference). | |||
| 10.22.1† | Form of Amendment 1 to the Aleris Corporation 2010 Equity Incentive Plan Director Restricted Stock Unit Award Agreement with each of Scott L. Graves, Brian Laibow, Ara Abrahamian, and Kenneth Liang (filed as Exhibit 10.23.1 to Aleris International, Inc.’s Amendment No. 3 to Registration Statement on Form S-4 (File No. 333-173180), and incorporated herein by reference). | |||
| 10.23† | Form of Aleris Holding Company 2010 Equity Incentive Plan Director Stock Option Award Agreement with each of Christopher M. Crane, Lawrence Stranghoener, and Emily Alexander (filed as Exhibit 10.25 to Aleris International, Inc.’s Registration Statement on Form S-4 (File No. 333-173180), and incorporated herein by reference). | |||
| 10.23.1† | Form of Amendment 1 to the Aleris Corporation 2010 Equity Incentive Plan Director Stock Option Award Agreement with each of Christopher M. Crane, Lawrence Stranghoener, and Emily Alexander (filed as Exhibit 10.24.1 to Aleris International, Inc.’s Amendment No. 3 to Registration Statement on Form S-4 (File No. 333-173180), and incorporated herein by reference). | |||
| 10.23.2† | Form of Amendment 2 to the Aleris Corporation 2010 Equity Incentive Plan Director Stock Option Award Agreement with each of Christopher M. Crane, Lawrence Stranghoener, and Emily Alexander (filed as Exhibit 10.24.2 to Aleris International, Inc.’s Amendment No. 3 to Registration Statement on Form S-4 (File No. 333-173180), and incorporated herein by reference). | |||
| 10.24† | Form of Aleris Holding Company 2010 Equity Incentive Plan Director Restricted Stock Unit Award Agreement with each of Christopher M. Crane, Lawrence Stranghoener, and Emily Alexander (filed as Exhibit 10.26 to Aleris International, Inc.’s Registration Statement on Form S-4 (File No. 333-173180), and incorporated herein by reference). | |||
| 10.24.1† | Form of Amendment 1 to the Aleris Corporation 2010 Equity Incentive Plan Director Restricted Stock Unit Award Agreement with each of Christopher M. Crane, Lawrence Stranghoener, and Emily Alexander (filed as Exhibit 10.25.1 to Aleris International, Inc.’s Amendment No. 3 to Registration Statement on Form S-4 (File No. 333-173180), and incorporated herein by reference). | |||
|
|
| |||
II-21
Table of Contents
| Exhibit number |
Description | |||
|
|
| |||
| 10.25† | Aleris Holding Company 2010 Equity Incentive Plan Director Restricted Stock Award Agreement with G. Richard Wagoner, Jr. (filed as Exhibit 10.27 to Aleris International, Inc.’s Registration Statement on Form S-4 (File No. 333-173180), and incorporated herein by reference). | |||
| 10.25.1† | Amendment 1 to the Aleris Corporation 2010 Equity Incentive Plan Director Restricted Stock Award Agreement with G. Richard Wagoner, Jr. (filed as Exhibit 10.26.1 to Aleris International, Inc.’s Amendment No. 3 to Registration Statement on Form S-4 (File No. 333-173180), and incorporated herein by reference). | |||
| 10.26† | Employment Agreement dated as of June 1, 2010 by and among Aleris Switzerland GmbH and Roelof IJ. Baan (filed as Exhibit 10.28 to Aleris International, Inc.’s Registration Statement on Form S-4 (File No. 333-173180), and incorporated herein by reference). | |||
| 10.26.1† | Amendment 1 to Employment Agreement by and among Aleris Switzerland GmbH and Roelof IJ. Baan (filed as Exhibit 10.27.1 to Aleris International, Inc.’s Amendment No. 4 to Registration Statement on Form S-4 (File No. 333-173180), and incorporated herein by reference). | |||
| 10.27† | Aleris Holding Company 2010 Equity Incentive Plan Stock Option Agreement dated as of June 1, 2010 between Aleris Holding Company and Roelof IJ. Baan (filed as Exhibit 10.29 to Aleris International, Inc.’s Registration Statement on Form S-4 (File No. 333-173180), and incorporated herein by reference). | |||
| 10.27.1† | Amendment 1 to the Aleris Corporation 2010 Equity Incentive Plan Stock Option Agreement between Aleris Corporation and Roelof IJ. Baan (filed as Exhibit 10.28.1 to Aleris International, Inc.’s Amendment No. 3 to Registration Statement on Form S-4 (File No. 333-173180), and incorporated herein by reference). | |||
| 10.27.2† | Amendment 2 to the Aleris Corporation 2010 Equity Incentive Plan Stock Option Agreement between Aleris Corporation and Roelof IJ. Baan (filed as Exhibit 10.28.2 to Aleris International, Inc.’s Amendment No. 3 to Registration Statement on Form S-4 (File No. 333-173180), and incorporated herein by reference). | |||
| 10.28† | Aleris Holding Company 2010 Equity Incentive Plan Restricted Stock Unit Agreement as of June 1, 2010 between Aleris Holding Company and Roelof IJ. Baan (filed as Exhibit 10.30 to Aleris International, Inc.’s Registration Statement on Form S-4 (File No. 333-173180), and incorporated herein by reference). | |||
| 10.28.1† | Amendment 1 to the Aleris Corporation 2010 Equity Incentive Plan Restricted Stock Unit Agreement between Aleris Corporation and Roelof IJ. Baan (filed as Exhibit 10.30.1 to Aleris International, Inc.’s Amendment No. 3 to Registration Statement on Form S-4 (File No. 333-173180), and incorporated herein by reference). | |||
| 10.29† | Letter Agreement dated April 5, 2011 between Aleris International, Inc. and Steven J. Demetriou amending Mr. Demetriou’s Employment Agreement filed as Exhibit 10.2 to Aleris International, Inc.’s Quarterly Report on Form 10-Q (File No. 333-173180) filed May 13, 2011, and incorporated herein by reference). | |||
| 10.30† | Letter Agreement dated April 5, 2011 between Aleris International, Inc. and Sean M. Stack amending Mr. Stack’s Employment Agreement filed as Exhibit 10.3 to Aleris International, Inc.’s Quarterly Report on Form 10-Q (File No. 333-173180) filed May 13, 2011, and incorporated herein by reference). | |||
|
|
| |||
II-22
Table of Contents
| Exhibit number |
Description | |||
|
|
| |||
| 10.31 | Consulting Services and Non-Competition Agreement dated June 1, 2010 between Aleris International, Inc. and Dale V. Kesler (filed as Exhibit 10.34 to Aleris International Inc.’s Amendment No. 1 to Registration Statement on Form S-4 (File No. 333-173180) and incorporated herein by reference). | |||
| 10.32 | † | Form of Aleris Corporation 2010 Equity Incentive Plan Director Restricted Stock Unit Award Agreement and Amendment 1, thereto (filed as Exhibit 99.1 to Aleris International, Inc.’s Amendment No. 1 to the Current Report on Form 8-K filed on February 6, 2012 (File No. 333-173180), and incorporated herein by reference). | ||
| 10.33 | † | Form of Aleris Corporation 2010 Equity Incentive Plan Director Stock Option Award Agreement and Amendment 1, thereto (filed as Exhibit 99.2 to Aleris International, Inc.’s Amendment No. 1 to the Current Report on Form 8-K filed on February 6, 2012 (File No. 333-173180), and incorporated herein by reference). | ||
| 10.34 | † | Form of Aleris Corporation 2010 Equity Incentive Plan Executive Officer and/or Management Team Member Restricted Stock Unit Award Agreement and Amendment 1, thereto (filed as Exhibit 10.3.4 to Aleris International, Inc.’s Annual Report on Form 10-K filed on February 29, 2012 (File No. 333-173180), and incorporated herein by reference). | ||
| 10.35 | † | Form of Aleris Corporation 2010 Equity Incentive Plan Executive Officer and/or Management Team Member Stock Option Award Agreement and Amendment 1, thereto (filed as Exhibit 10.3.5 to Aleris International, Inc.’s Annual Report on Form 10-K filed on February 29, 2012 (File No. 333-173180), and incorporated herein by reference). | ||
| 10.36 | † | Form of Aleris Corporation 2010 Equity Incentive Plan Stock Option Award Agreement Amendment (regarding equitable dividend adjustments) (filed as Exhibit 10.3.6 to Aleris International, Inc.’s Annual Report on Form 10-K filed on February 29, 2012 (File No. 333-173180), and incorporated herein by reference). | ||
| 21.1 | List of Subsidiaries of Aleris Corporation as of March 1, 2012. | |||
| 23.1 | * | Consent of Fried, Frank, Harris, Shriver & Jacobson LLP (included in the opinion filed as Exhibit 5.1). | ||
| 23.2 | Consent of Ernst & Young LLP. | |||
| 24.1 | Power of Attorney (included on signature page to Aleris Corporation’s Registration Statement on Form S-1) (File No. 333-173721). | |||
| 24.2 | Power of Attorney of Robert O’Leary (included on signature page hereto). | |||
|
|
| |||
| † | Management contract or compensatory plan or arrangement |
| * | To be filed by amendment |
II-23