Attached files
| file | filename |
|---|---|
| 8-K - FORM 8-K - STRATEGIC HOTELS & RESORTS, INC | d311361d8k.htm |
 1
Investor Presentation
March 2012
Exhibit 99.1 |
 2
I.
BEE’s Unique Value Proposition
II.
Company Overview
III.
Industry Update
IV.
Operating Trends
V.
Financial Overview
Agenda |
 3
The only pure play high-end lodging REIT
High-end outperforms the industry in a recovery
Industry leading asset management expertise
Assets are in pristine condition
Embedded organic growth through revenue growth and ROI opportunities
Replacement cost, excluding land, approximately $700,000 per key
Historically
low
supply
growth
environment,
particularly
in
BEE
markets
Balance sheet positioned for growth
BEE’s Unique Value Proposition
The best investment proposition in the lodging space |
 4
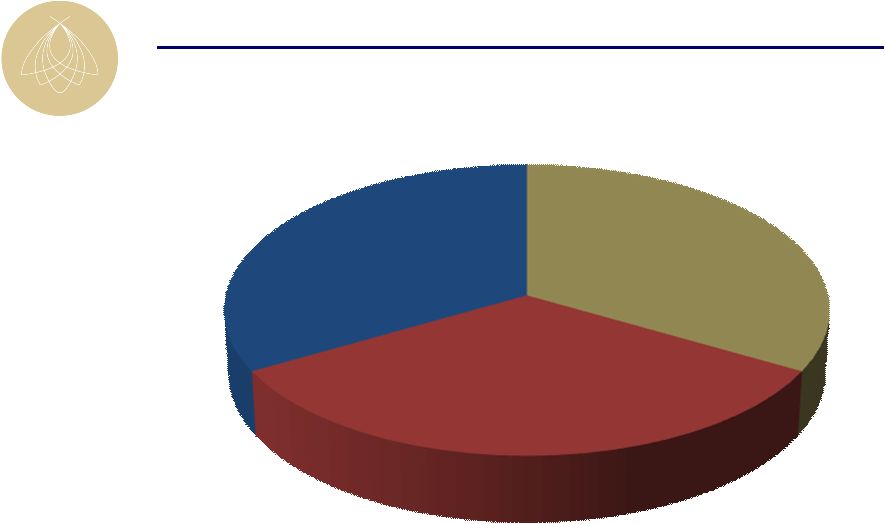
BEE’s Unique Value Proposition
Proven Investment Track
Record
Industry Leading Asset
Management
High-end, Unique &
Irreplaceable Hotel & Resort
Portfolio |
 5
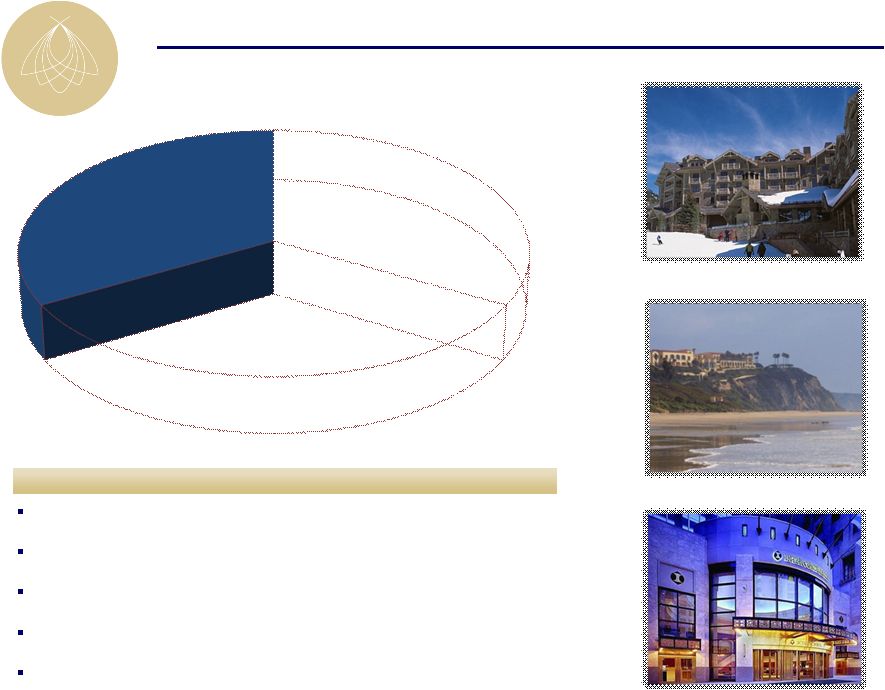
BEE’s Unique Value Proposition
Four Seasons Jackson Hole
Ritz-Carlton Laguna Niguel
InterContinental Chicago
Best portfolio in public markets
Locations in high barrier to entry markets
City-center and resort destinations
World-class amenities
No new supply in BEE’s markets
Highlights
High-end, Unique &
Irreplaceable Hotel & Resort
Portfolio |
 6
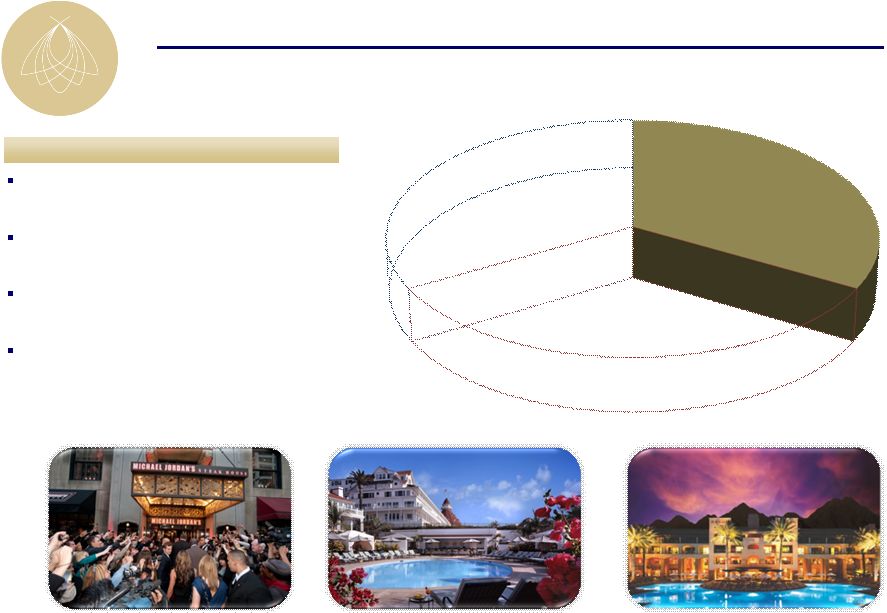
BEE’s Unique Value Proposition
Execution of complex and accretive
restructurings
Assessment and development of ROI
projects
Recent success in acquiring hotels through
off-market transactions
Maximized proceeds through well-timed
asset sales
Highlights
Michael Jordan’s Steak House
Grand Opening
Hotel del Coronado
Fairmont Scottsdale Princess
Proven Investment Track
Record |
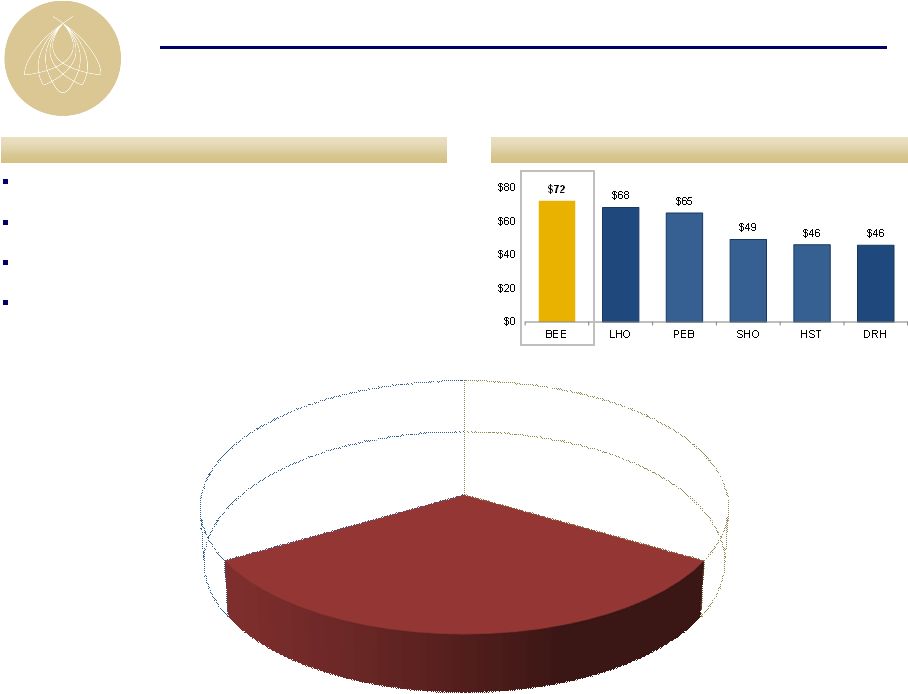 7
BEE’s Unique Value Proposition
EBITDA Per Available Room
Sustained market share penetration and revenue growth
Implemented cost cutting initiatives in advance of downturn
Maintained fixed cost reductions in recovery
Rigorous oversight of brand managers
Highlights
Industry Leading Asset
Management |
 8
I.
BEE’s Unique Value Proposition
II.
Company Overview
Agenda |
 9
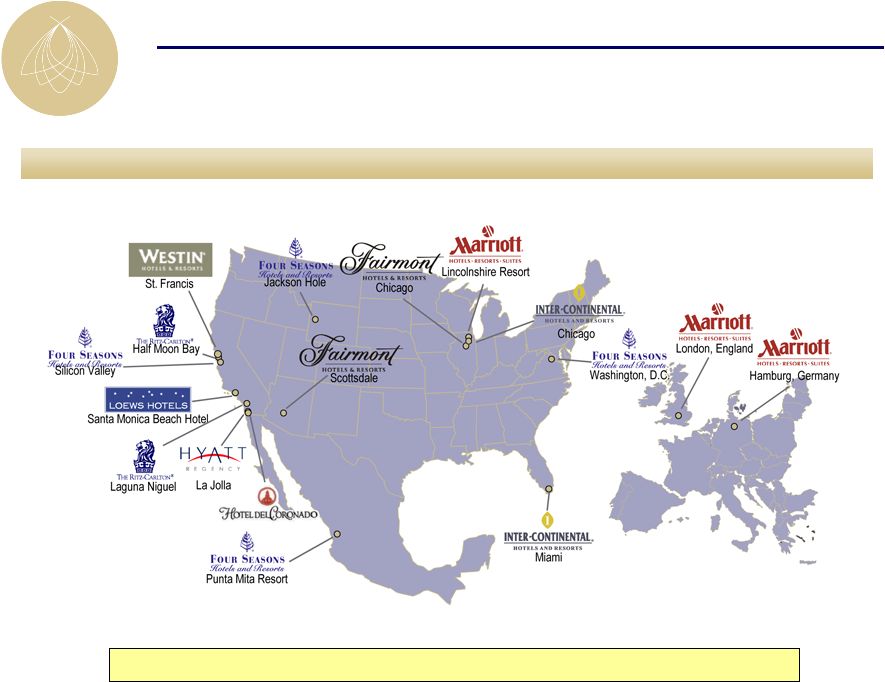
17 hotels and resorts with 7,762 rooms
Top-Tier Market Exposure
Assets located in primary gateway cities and high barrier to entry markets
|
 10
InterContinental Miami –
Guestroom renovation
InterContinental Chicago –
Michael Jordan’s Steak House
Four Seasons Washington, D.C –
Retail outlet renovation
Marriott Lincolnshire –
Lobby renovation
Westin St. Francis –
Michael Mina Steakhouse conversion
Four Seasons Washington, D.C. –
Lobby renovation, 11-room
expansion, new restaurant, 63-room and suite renovation
Westin St. Francis –
Clock Bar
Fairmont Chicago –
ENO wine tasting room, lobby renovation,
guestroom renovation, new spa and fitness center
Four Seasons Punta Mita –
New lobby bar
Ritz-Carlton Half Moon Bay –
ENO wine tasting room,
restaurant and lounge renovation, suite renovation
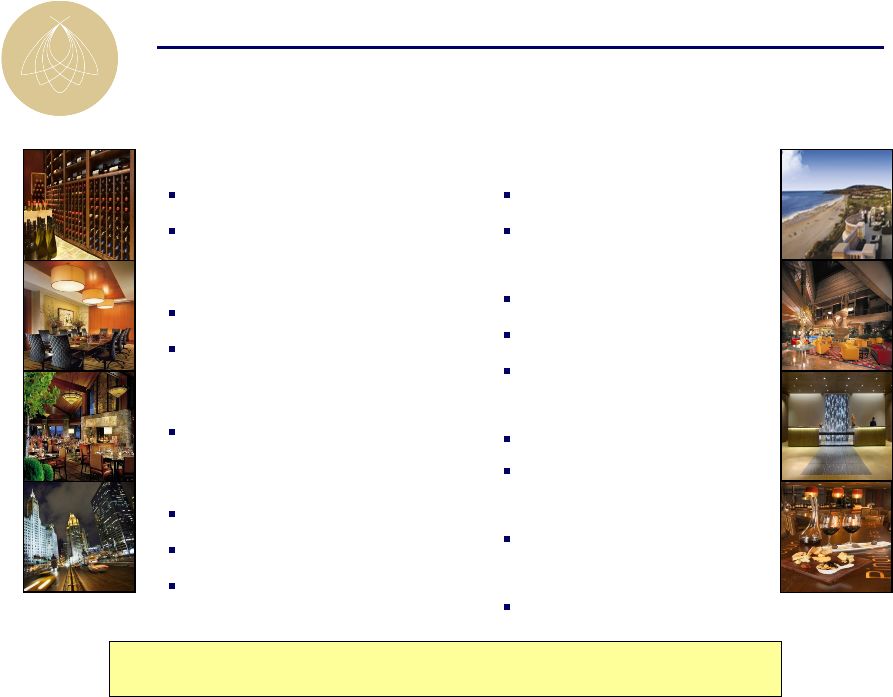
Portfolio Well-Positioned To Enhance Cash Flow Growth
Fairmont Chicago Lobby
Four Seasons Washington, D.C.
Lobby
Westin St. Francis Michael Mina
Bourbon Steak
InterContinental Miami Guestroom |
 11
Four Seasons Washington, D.C.
ENO Wine Room
Retail space optimization
Four Seasons Silicon Valley
Quattro patio renovation
Meeting room renovation
Four Seasons Jackson Hole
Restaurant re-concept
InterContinental Chicago
North tower guestroom renovation
Meeting space expansion
Michigan Ave. frontage optimization
Potential Capital Projects in the Pipeline
Significant
ROI
capital
investment
opportunities
within
existing
portfolio;
rigorous
analysis
and
approval
process
for
each
project
Ritz-Carlton Laguna Niguel
35-room fire pit addition
Pool deck upgrades
InterContinental Miami
Public space revitalization
Meeting space expansion
Pool deck refurbishment
Fairmont Chicago
Meeting space renovation
Restaurant re-concept
Westin St. Francis
ENO wine room
Loews Santa Monica
Exterior / interior upgrade |
 12
I.
BEE’s Unique Value Proposition
II.
Company Overview
III.
Industry Update
Agenda |
 13
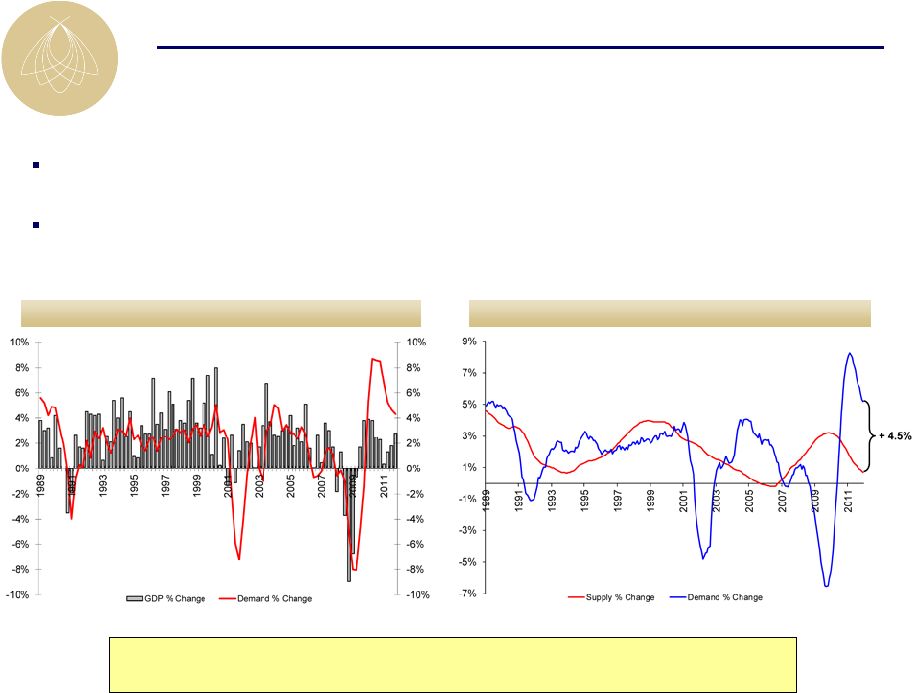
Total U.S. supply and demand change (TTM)
Lodging demand historically correlates with GDP (~80%) but potential exists for
near-term disconnect, particularly at the high-end
Supply growth remains historically low and development pipeline indicates muted
supply going forward Lodging Outlook
Demand growth exceeds supply growth by 450 bps which should result in
significant ADR growth as recovery continues; lower correlation to GDP
Source: Smith Travel Research
GDP and lodging demand change (TTM) |
 14
Source: Smith Travel Research
Note: Data represents trends within the United States
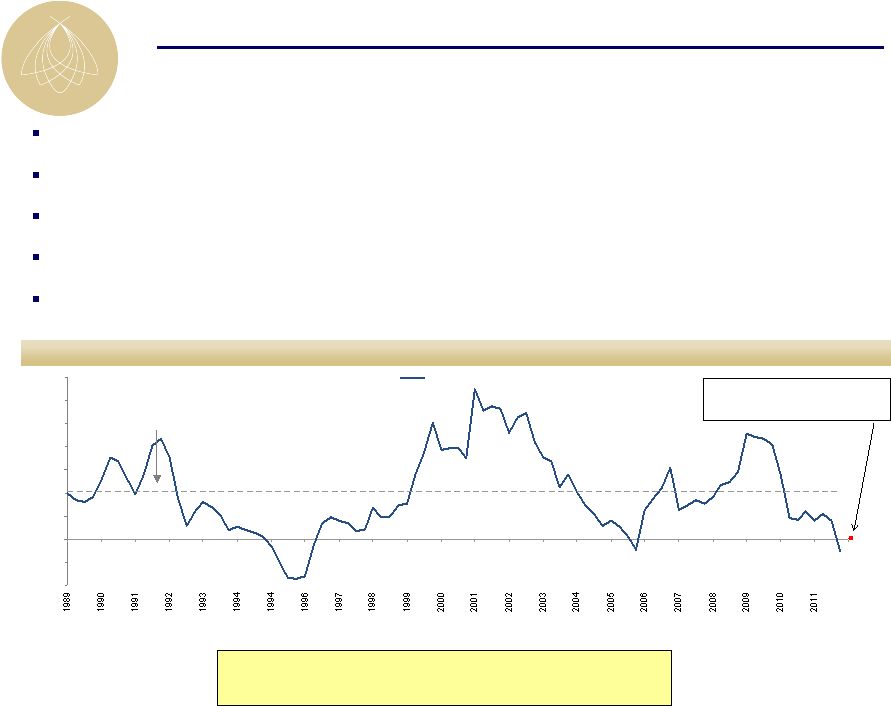
Luxury supply growth was lower leading into this downturn than past downturns
Projects in planning or under construction have decreased significantly
No new competitive luxury or upper-upscale supply projected in BEE
markets 1-2 years estimated time to permit; 3 years estimated time to
build a luxury hotel Economic proposition of hotel construction doubtful with
replacement cost estimated at over $700,000 per key
Quarterly luxury supply YoY % change
(4%)
(2%)
0%
2%
4%
6%
8%
10%
12%
14%
YoY % supply growth
1988 –
Q2 2011
Average: 4.1%
Favorable Supply Outlook
Zero supply growth environment and no new
supply growth likely until after 2015
Supply Growth in
BEE Markets = 0.0% |
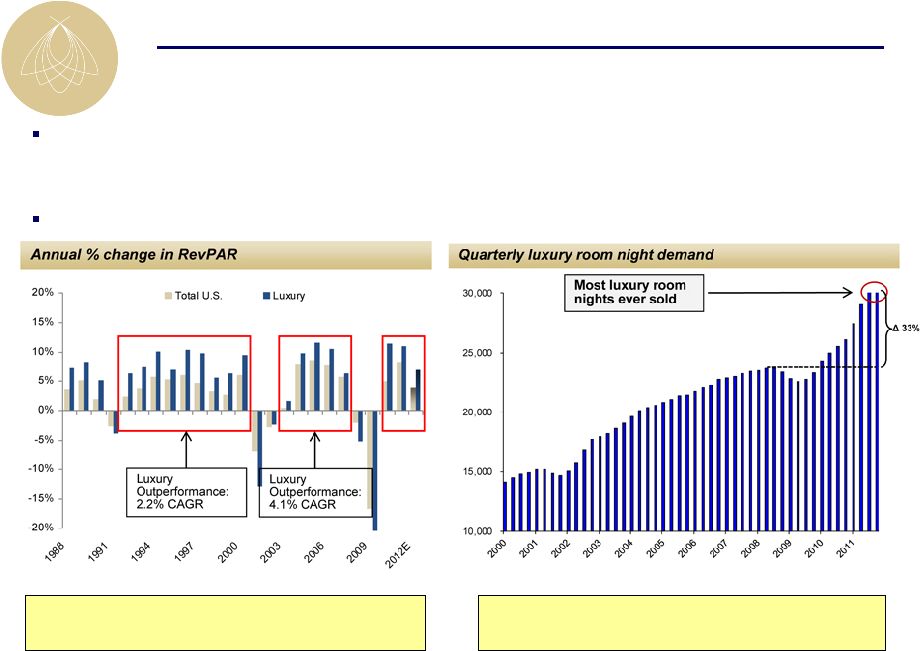 15
Source: Smith Travel Research and PWC
Luxury
hotels
have
experienced
prolonged
RevPAR
growth
following
past
industry
downturns
–
1992
–
2000:
9
consecutive
years
of
annual
luxury
RevPAR
growth
totaling
109%
or
8.5%
annually
–
2002
–
2007:
5
consecutive
years
of
annual
luxury
RevPAR
growth
totaling
48%
or
8.2%
annually
Overall luxury room nights sold is at an all-time high; 33% higher than
2007 Luxury Hotels Outperform in a Recovery
Luxury room night demand currently at all-
time high
Luxury outperformed Total U.S. 2.0% -
4.0% in previous two downturns
Source: Smith Travel Research |
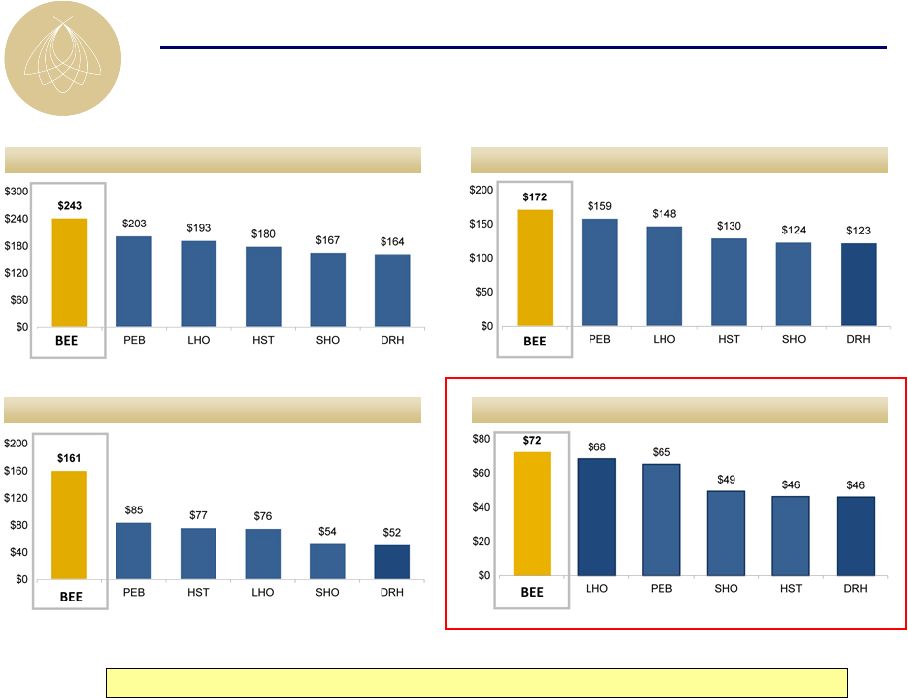 16
EBITDA Per Available Room
Non –
Rooms Revenue Per Available Room
RevPAR
ADR
Note: All metrics represent full-year 2011 results
BEE portfolio reflects Total United States portfolio as of 12/31/2011.
Source: Public filings
BEE Positioning Compared to Peers
BEE delivers industry leading results |
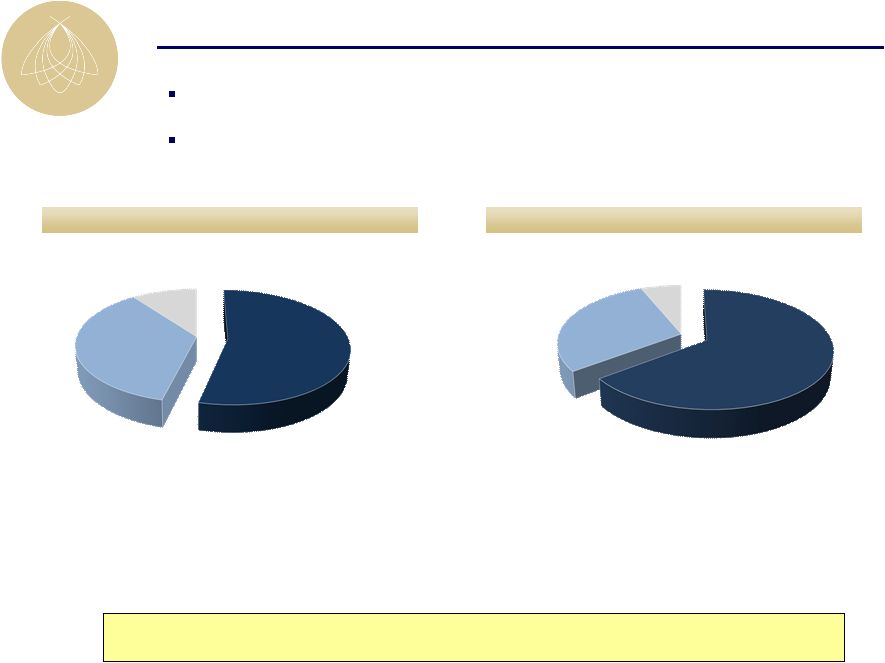 17
54%
36%
10%
65%
29%
6%
BEE Revenue Mix Compared to Peers
BEE revenue driven more heavily by non-rooms revenue relative to peers,
maximizing yield per square foot from our hotels
Rooms
Food & Beverage
Other
BEE Total Revenue Mix
Peers Total Revenue Mix
BEE Total RevPAR is key top-line performance metric
BEE focus on maximizing yield per square foot
Rooms
Food & Beverage
Other
Note: All metrics represent the full-year 2011. BEE portfolio reflects
the North America Same Store portfolio. Peers include: DRH, HST, LHO, PEB,
SHO Source: Public filings |
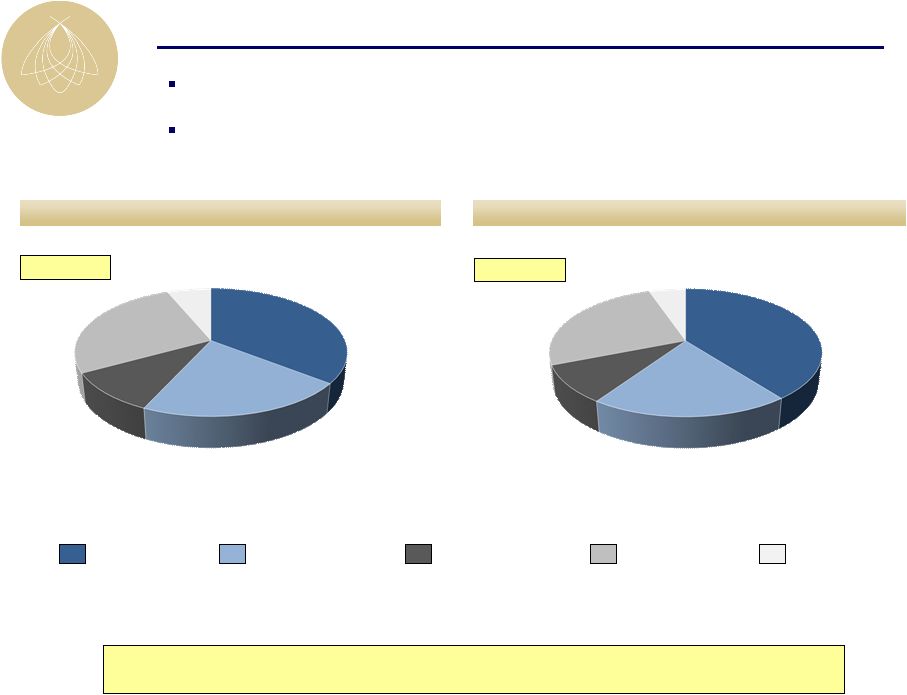 18
36%
21%
10%
27%
6%
40%
20%
9%
26%
5%
BEE Revenue Mix
BEE
total
revenue
driven
heavily
by
group
business
and
ancillary
group
spend;
still
significant
capacity
to
grow
group
business
43% Group
40% Group
57% Transient
60% Transient
Note: Statistics represent the full year 2011. Portfolio reflects the North
America Same Store portfolio. BEE Occupied Room Nights Mix
BEE Room Revenue Mix
Targeted mix of business ~50%/50% group/transient
Group business typically yields higher non-rooms revenue than transient
business Transient - Other
Transient - Negotiated
Group - Association
Group - Corporate
Group - Other |
 19
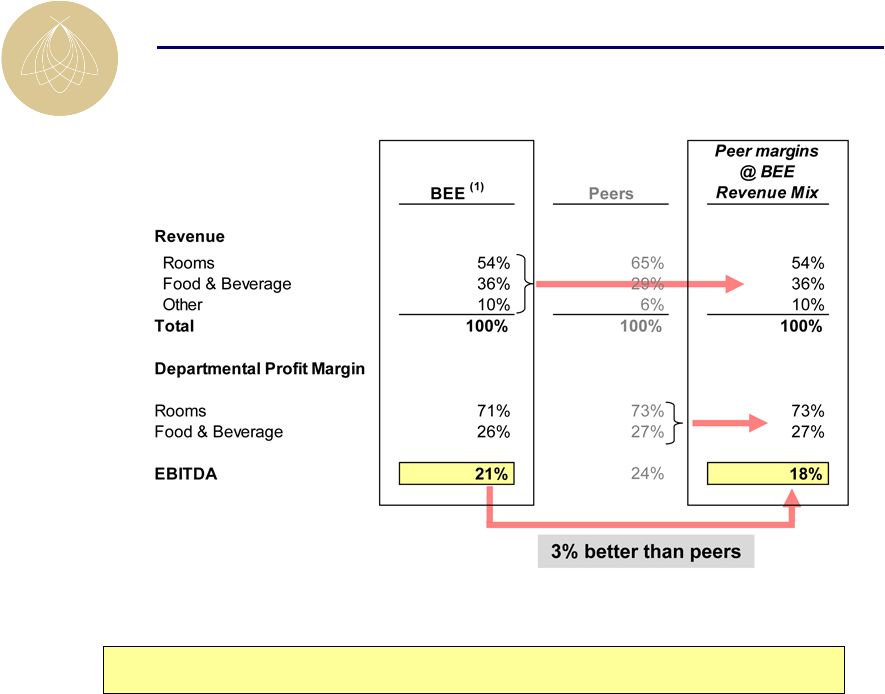
Industry Leading Operating Margins
BEE’s
margins
significantly
outperform
when
adjusted
for
same
revenue
mix
(1) Portfolio includes all North American hotels owned for the full year
2011 Peers include: DRH, HST, LHO, PEB, & SHO
Source: Public filings |
 20
I.
BEE’s Unique Value Proposition
II.
Company Overview
III.
Industry Update
IV.
Operating Trends
Agenda |
 21
0
200,000
400,000
600,000
800,000
1,000,000
1,200,000
2007
2008
2009
2010
2011
2012*
Definite through January
Production in the year
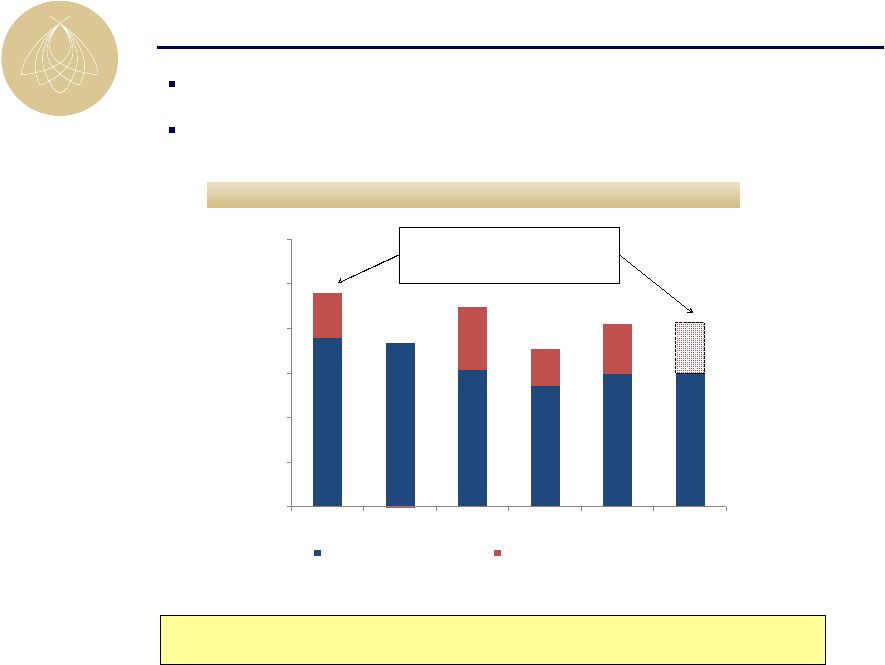
Group Booking Outlook
Year-Over-Year Group Pace
*2012 production in the year assumes the same production as in 2011
Group pace remains the most reliable forward looking indicator
Booking window has shortened forcing more reliance on room nights booked ITYFTY
(“in-the-year-for-the-year”)
Group room nights on the books for 2012 are up 1% compared to same
time last year; ADR up 3% compared to 2011 rate
Assuming similar production
as 2011, group room nights
would be down 14% to peak |
 22
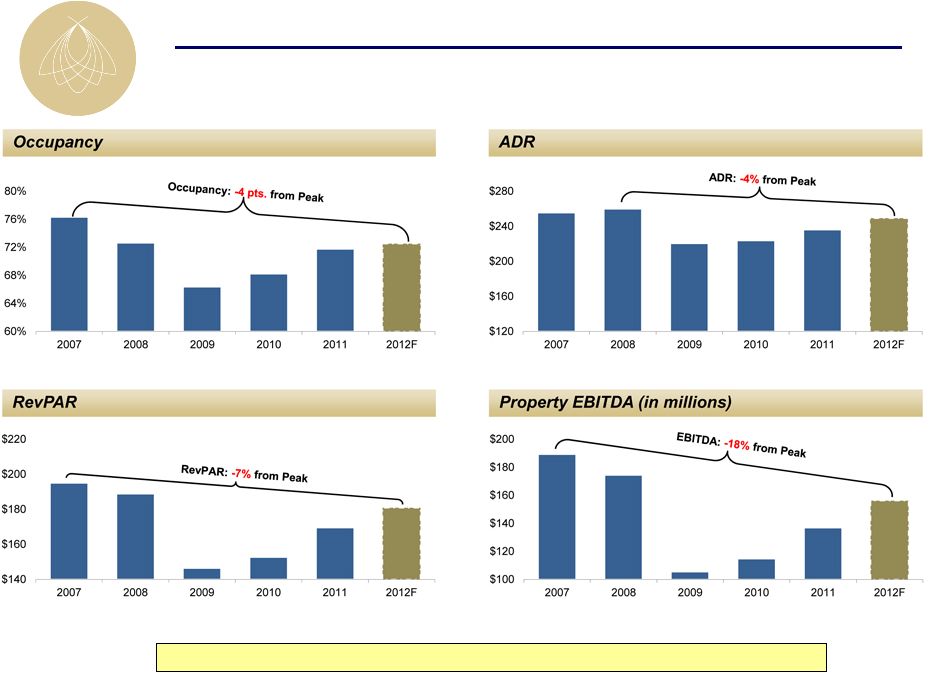
Embedded Portfolio Growth
Operating performance improving; still below peak
Note:
Same
store
North
America
portfolio,
excludes:
Hotel
del
Coronado,
Fairmont
Scottsdale
Princess,
Four
Seasons
Jackson
Hole,
Four
Seasons
Silicon
Valley
2012
forecast
assumes
midpoint
of
guidance
range |
 23
I.
BEE’s Unique Value Proposition
II.
Company Overview
III.
Industry Update
IV.
Operating Trends
V.
Financial Overview
Agenda |
 24
(EBITDA in millions)
(a) Excludes
Fairmont
Scottsdale
Princess,
Four
Seasons
Jackson
Hole,
Four
Seasons
Silicon
Valley,
and
Hotel
del
Coronado
(b) 2010 results exclude $4.9mm of real estate tax refunds and no adjustment
for cancellation fees (c) 2011 Comparable FFO excludes a $10.7mm
one-time gain relating to the successful preferred equity tender 2011
Results 2010 Actual
2011 Actual
Operations
(Same Store N.A. Portfolio)
(a)
ADR
$223
5.8%
$236
RevPAR
$153
11.0%
$170
Total RevPAR
$287
9.6%
$314
EBITDA Margins
(b)
18.7%
240 bps
21.1%
Corporate Results
Comparable EBITDA
$132.0
17.2%
$154.8
Comparable FFO / share
(c)
$0.05
180.0%
$0.14 |
 25
2012 Guidance
(EBITDA in millions)
(a)
Portfolio excludes Fairmont Scottsdale Princess, Four Seasons Jackson Hole, Four
Seasons Silicon Valley, and Hotel del Coronado 2011 Actual
2012 Guidance
Operations
(Same Store N.A. Portfolio)
(a)
RevPAR
$170
6%-8%
$180-$183
Total RevPAR
$314
5%-7%
$330-$336
EBITDA Margins
21.1%
100 - 175bps
22.1%-22.9%
Corporate Results
Comparable EBITDA
$155
7%-16%
$165-$180
Comparable FFO / share
$0.14
55%-115%
$0.22-$0.30 |
 26
($ in millions)
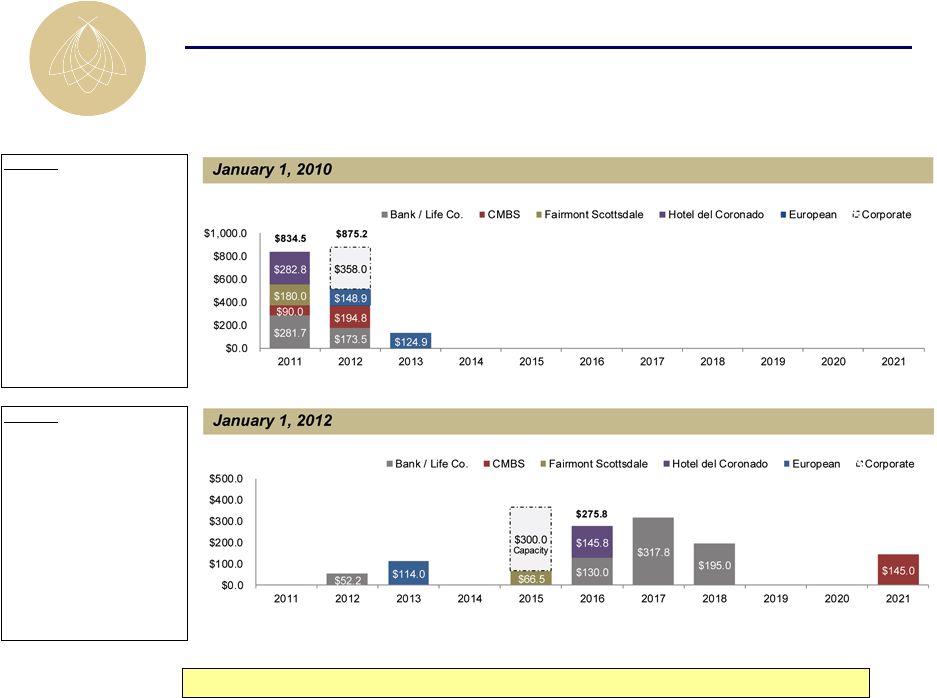
Note: Assumes full extension periods for all loans.
BEE’s balance sheet is structured for growth
Strong Recapitalized Balance Sheet
Key Stats
Net Debt/EBITDA
14.3x
Net Debt+Pref /EBITDA
17.4x
Net Debt/TEV
76.9%
Avg. Maturity (yrs)
3.4
Unencumbered assets
0
Corporate liquidity (MM)
$105.0
Mix of Debt
Bank Debt
17.8%
Life Insurance Co.
25.6%
CMBS
56.6%
Key Stats
Net Debt/EBITDA
7.4x
Net Debt+Pref /EBITDA
9.3x
Net Debt/TEV
46.8%
Avg. Maturity (yrs)
5.2
Unencumbered assets
2
Corporate liquidity (MM)
$260.0
Mix of Debt
Bank Debt
38.0%
Life Insurance Co.
31.5%
CMBS
30.5% |
 27
BEE’s Unique Value Proposition
The best investment proposition in the lodging space
The only pure play high-end lodging REIT
High-end outperforms the industry in a recovery
Industry leading asset management expertise
Assets are in pristine condition
Embedded organic growth from revenue growth and ROI opportunities
Replacement cost, excluding land, approximately $700,000 per key
Historically
low
supply
growth
environment,
particularly
in
BEE
markets
Balance sheet positioned for growth |
 28
Except for historical information, the matters discussed in this
press release are forward-looking statements subject to
certain risks and uncertainties. Actual results could differ materially from the
Company's projections and forward-looking statements are not guarantees
of future performance. These forward looking statements are identified by
looking their use
of terms and phrases such as “anticipate,”
“believe,”
“could,”
“estimate,”
“expect,”
“intend,”
“may,”
“plan,”
“predict,”
“project,”
“should,”
“will,”
“continue”
and other similar terms and phrases, including references to assumptions and
forecasts of future results.
Factors that may contribute to these differences include, but are not limited to
the following: ability to obtain, refinance or restructure debt or comply
with covenants contained in our debt facilities; volatility in equity or
debt markets; availability of capital; rising interest rates and
operating costs; rising insurance premiums; cash available for
capital expenditures; competition; demand for hotel rooms in our
current and proposed market areas; economic conditions
generally and in the real estate market specifically, including deterioration of
economic conditions and the extent of its effect on business and leisure
travel and the lodging industry; ability to dispose of existing properties in a manner
consistent with our disposition strategy; delays in construction
and development; the failure of closing conditions to be
satisfied; risks related to natural disasters; the effect of threats of terrorism
and increased security precautions on travel patterns and hotel bookings;
the outbreak of hostilities and international political instability; legislative or regulatory
changes, including changes to laws governing the taxation of REITs; and changes in
generally accepted accounting principles, policies and guidelines
applicable to REITs. Certain of these risks and uncertainties are described in greater
detail in our filings with the Securities and Exchange Commission. Although we
believe our current expectations to be based upon reasonable assumptions,
we can give no assurance that our expectations will be attained or that
actual results will not differ materially. We undertake no obligation to
update any forward-looking statement to conform the statement to
actual results or changes in our expectations.
Disclaimer |
 29
Non-GAAP to GAAP Reconciliations
Reconciliation of Net Debt + Preferred Equity / EBITDA
($ in 000s)
YE 2009
(a)
YE 2011
(b)
Preferred equity capitalization
$370,236
$289,102
Consolidated debt
1,658,745
1,050,385
Pro rata share of unconsolidated debt
282,825
212,275
Pro rata share of consolidated debt
(107,065)
(45,548)
Cash and cash equivalents
(116,310)
(72,013)
Net Debt + Preferreds
$2,088,431
$1,434,201
Comparable EBITDA
$119,953
$154,790
Net Debt + Preferreds / EBITDA
17.4x
9.3x
(a) All figures taken from year-end 2009 financial statements.
(b) All figures taken from year-end 2011 financial statements.
Reconciliation of Net Debt / EBITDA
($ in 000s)
YE 2009
(a)
YE 2011
(b)
Consolidated debt
$1,658,745
$1,050,385
Pro rata share of unconsolidated debt
282,825
212,275
Pro rata share of consolidated debt
(107,065)
(45,548)
Cash and cash equivalents
(116,310)
(72,013)
Net Debt
$1,718,195
$1,145,099
Comparable EBITDA
$119,953
$154,790
Net Debt / EBITDA
14.3x
7.4x
(a) All figures taken from year-end 2009 financial statements.
(b) All figures taken from year-end 2011 financial statements.
Reconciliation of Net Debt / TEV
($ in 000s)
YE 2009
(a)
YE 2011
(b)
Consolidated Debt
$1,658,745
$1,050,385
Pro rata share of unconsolidated debt
282,825
212,275
Pro rata share of consolidated debt
(107,065)
(45,548)
Cash and cash equivalents
(116,310)
(72,013)
Net Debt
$1,718,195
$1,145,099
Market Capitalization
$144,966
$1,014,092
Total Debt
1,834,505
1,217,112
Preferred Equity
370,236
289,102
Cash and cash equivalents
(116,310)
(72,013)
Total Enterprise Value
$2,233,397
$2,448,293
Net Debt / Enterprise Value
76.9%
46.8%
(a) All figures taken from year-end 2009 financial statements.
(b) All figures taken from year-end 2011 financial statements.
|
 30
Non-GAAP to GAAP Reconciliations
2011
2010
2011
2010
Net loss attributable to SHR common shareholders
(15,917)
$
(134,835)
$
(23,688)
$
(261,937)
$
Depreciation and amortization - continuing operations
25,840
32,406
112,062
130,601
Depreciation and amortization - discontinued operations
-
567
-
5,980
Interest expense - continuing operations
19,299
17,797
86,447
86,285
Interest expense - discontinued operations
-
1,990
-
9,706
Income taxes - continuing operations
691
1,112
970
1,408
Income taxes - discontinued operations
-
(260)
379
476
Noncontrolling interests
(99)
(808)
(29)
(1,687)
Adjustments from consolidated affiliates
(1,302)
(2,013)
(6,733)
(7,609)
Adjustments from unconsolidated affiliates
6,928
3,673
23,221
15,563
Preferred shareholder dividends
(4,682)
7,722
18,482
30,886
EBITDA
30,758
(72,649)
211,111
9,672
Realized portion of deferred gain on
sale-leaseback - continuing operations (66)
(53)
(217)
(207)
Realized portion of deferred gain on
sale-leaseback - discontinued operations -
(1,144)
(1,214)
(4,465)
Gain on sale of assets - continuing operations
-
-
(2,640)
-
Gain on sale of assets
- discontinued operations (357)
(28,476)
(101,287)
(29,713)
Impairment losses and other charges
-
141,858
-
141,858
Loss on early extinguishment of debt - continuing operations
-
-
1,237
925
Loss on early extinguishment of
debt - discontinued operations -
95
-
95
Loss on early
termination of derivative financial instruments -
-
29,242
18,263
Gain on extinguishment of debt of unconsolidated
affiliate -
(11,025)
-
(11,025)
Foreign currency exchange loss - continuing operations (a)
79
16
2
1,410
Foreign currency exchange loss (gain) -
discontinued operations (a) -
98
(51)
(7,392)
Adjustment for Value Creation Plan
9,529
5,743
18,607
12,614
Comparable EBITDA
39,943
$
34,463
$
154,790
$
132,035
$
(a)
Foreign currency exchange gains or losses applicable to
third-party and inter-company debt and certain balance sheet items held by
foreign subsidiaries.
December 31,
December 31,
Reconciliation of Net Loss Attributable to SHR Common Shareholders to
EBITDA and Comparable EBITDA (in thousands)
Three Months Ended
Years Ended |
 31
Non-GAAP to GAAP Reconciliations
2011
2010
2011
2010
Net loss attributable to SHR common shareholders
(15,917)
$
(134,835)
$
(23,688)
$
(261,937)
$
Depreciation and amortization - continuing operations
25,840
32,406
112,062
130,601
Depreciation and amortization - discontinued
operations -
567
-
5,980
Corporate depreciation
(273)
(303)
(1,141)
(1,217)
Gain on sale of assets - continuing
operations -
-
(2,640)
-
Gain on sale of
assets - discontinued operations (357)
(28,476)
(101,287)
(29,713)
Realized portion of deferred gain on sale-leaseback
- continuing operations (66)
(53)
(217)
(207)
Realized portion of
deferred gain on sale-leaseback - discontinued operations
-
(1,144)
(1,214)
(4,465)
Deferred tax expense on realized portion of
deferred gain on sale-leasebacks -
357
379
1,393
Noncontrolling interests
adjustments (135)
(222)
(575)
(1,159)
Adjustments from consolidated affiliates
(664)
(1,335)
(4,486)
(5,979)
Adjustments from unconsolidated
affiliates 3,740
1,874
11,763
7,973
FFO
12,168
(131,164)
(11,044)
(158,730)
Redeemable noncontrolling interests
36
(586)
546
(528)
FFO - Fully
Diluted 12,204
(131,750)
(10,498)
(159,258)
Impairment losses and other charges
-
141,858
-
141,858
Non-cash mark to market of interest rate swaps -
continuing operations (1,696)
(535)
(2,183)
9,014
Non-cash mark to market of
interest rate swaps - discontinued operations -
(204)
-
25
Loss on early extinguishment of debt - continuing operations
-
-
1,237
925
Loss on early
extinguishment of debt - discontinued operations -
95
-
95
Loss on early termination of derivative financial instruments
-
-
29,242
18,263
Gain on extinguishment of debt of
unconsolidated affiliate -
(11,025)
-
(11,025)
Foreign currency exchange loss - continuing
operations (a) 79
16
2
1,410
Foreign currency exchange loss
(gain), net of tax - discontinued operations (a) -
95
(51)
(7,421)
Adjustment for Value Creation Plan
9,529
5,743
18,607
12,614
Comparable FFO
20,116
$
4,293
$
36,356
$
6,500
$
Comparable FFO per diluted share
0.11
$
0.03
$
0.20
$
0.05
$
Weighted average diluted
shares 188,340
151,663
179,319
122,933
(a)
Foreign currency exchange gains or losses applicable to
third-party and inter-company debt and certain balance sheet items held by foreign
subsidiaries.
Reconciliation of Net Loss Attributable to SHR Common Shareholders to
(in thousands, except per share data)
December 31,
December 31,
Three Months Ended
Years Ended
Funds From Operations (FFO), FFO - Fully Diluted and Comparable
FFO |
 32
Non-GAAP to GAAP Reconciliations
Operational Guidance
Low Range
High Range
North American same store Total RevPAR growth (a)
5.0%
7.0%
North American same store RevPAR growth (a)
6.0%
8.0%
(a) Includes North American hotels which are consolidated in our
financial results, but excludes the Four Seasons Jackson Hole and Four
Seasons Silicon Valley hotels, which were acquired in 2011.
Comparable EBITDA Guidance
Low Range
High Range
Net loss attributable to common shareholders
(86.7)
$
(71.8)
$
Depreciation and amortization
111.2
111.2
Interest expense
86.0
86.0
Income taxes
1.0
1.0
Noncontrolling
interests (0.3)
(0.2)
Adjustments from consolidated
affiliates (4.2)
(4.2)
Adjustments from unconsolidated
affiliates 28.8
28.8
Preferred shareholder
dividends 24.2
24.2
Realized portion of deferred gain
on sale-leasebacks (0.2)
(0.2)
Adjustment for Value Creation
Plan 5.2
5.2
Comparable
EBITDA 165.0
$
180.0
$
Comparable FFO Guidance
Low Range
High Range
Net loss attributable to common shareholders
(86.7)
$
(71.8)
$
Depreciation and amortization
109.9
109.9
Realized portion of deferred gain on
sale-leasebacks (0.2)
(0.2)
Noncontrolling interests
(0.3)
(0.2)
Adjustments from consolidated
affiliates (1.2)
(1.2)
Adjustments from unconsolidated
affiliates 15.6
15.6
Adjustment for Value Creation
Plan 5.2
5.2
Comparable
FFO 42.3
$
57.3
$
Comparable FFO per diluted share
0.22
$
0.30
$
December 31, 2012
Year Ended
December 31, 2012
Year Ended
2012 Guidance
(in millions, except per share data)
Year Ended
December 31, 2012 |
 •* * * * * * * * * * * * *
*
*
*
*
*
*
*
*
*
*
•* * * * * * * * * * * *
* * * * * * * * * * * * * |