Attached files
| file | filename |
|---|---|
| 8-K - 8-K - REGIONS FINANCIAL CORP | d308746d8k.htm |
 2012 CITI FINANCIAL
SERVICES CONFERENCE
March 7, 2012
Grayson Hall
Chief Executive Officer
Exhibit 99.1 |
 2
INVESTMENT THESIS
Improved Credit Profile
•
Aggressive risk management initiatives
•
Significant reduction in higher risk loan portfolios
•
Continued improvement in credit quality metrics
Strong Funding Profile
and Capital Position
•
Continued growth in low cost core deposit base
•
Loan to deposit ratio well below historical and peer levels
•
Best in class liquidity position and attractive funding profile
•
Capital levels are solid and in line with Basel III regulatory requirements
Attractive
Market Presence
•
Leading Southeastern depository franchise with favorable demographics
•
Leading brand favorability
•
Top share in core markets
Comprehensive
Product Offering
•
Balanced business mix
•
Momentum in C&I and consumer offerings
•
Focused on core banking business post sale of Morgan Keegan
•
Sustainable and improving core profitability
•
Opportunity for outperformance
•
Significant credit leverage remaining
Profitability |
 3
AGGRESSIVE RISK MANAGEMENT INITIATIVES
•
New
General
Counsel,
Chief
Risk
Officer
and
Chief
Credit
Officer
in
place
•
Strengthened Board of Directors by addition of 4 new members in the last 2
years •
Substantial reduction in highest risk credit exposures
•
Continued focus on risk / portfolio diversification
•
Capital planning and loss modeling capabilities substantially enhanced
•
Capital levels are solid and in excess of Basel III requirements
•
Sale of Morgan Keegan further reduces risk profile
3 |
 4
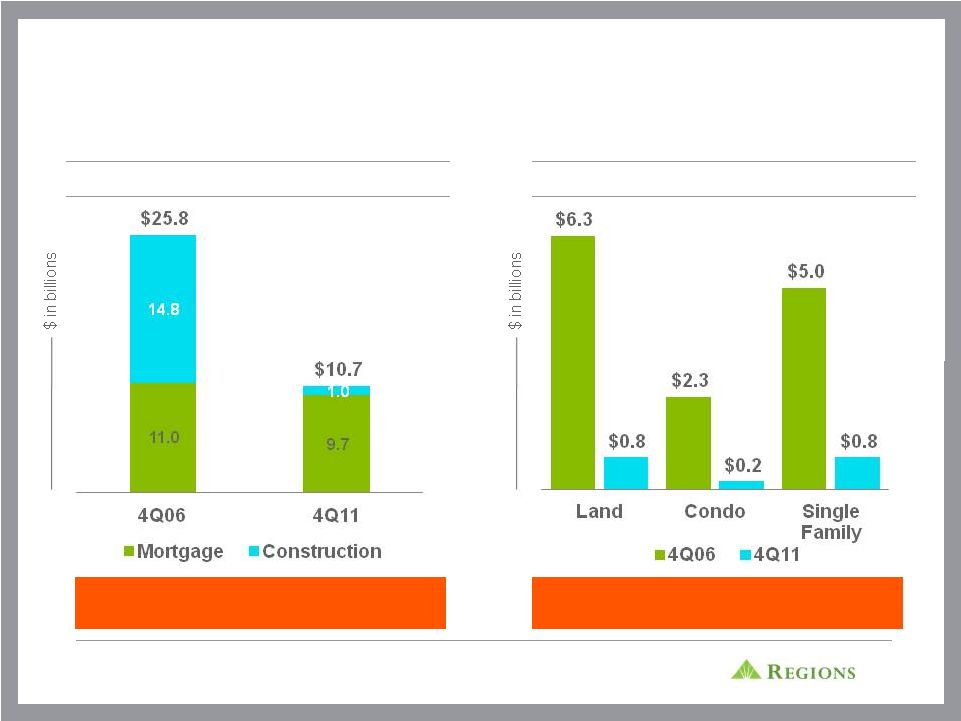
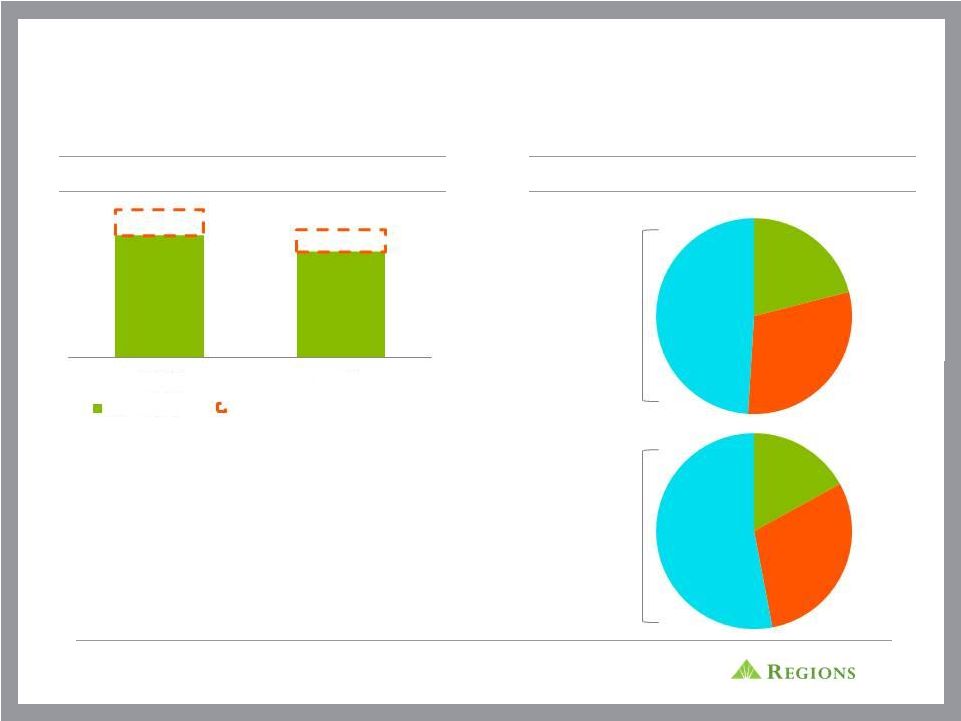
SIGNIFICANT REDUCTION IN HIGH RISK LOAN
PORTFOLIOS
Total Investor Real Estate
Higher Risk Investor Real Estate Portfolio
Reduced Investor Real Estate
$15.1 B or 59% over 5 years
Reduced High Risk Portfolios
$11.8 B or 87% over 5 years |
 5
CONTINUED IMPROVEMENT IN CREDIT QUALITY METRICS
Total NPAs (including HFS)
NPLs Gross Migration
NPL Balances Paying Current and as Agreed
NCO’s / Avg Loans
24% Decline in Total NPAs*
41% Decline*
11 bps Increase*
106 bps Decline*
* Year-over-year change
$3,918
$3,933
$3,602
$3,391
$2,996
81%
81%
87%
87%
92%
60%
65%
70%
75%
80%
85%
90%
95%
4Q10
1Q11
2Q11
3Q11
4Q11
NPAs (including HFS)
ALLL / NPAs
$948
$730
$555
$755
$561
4Q10
1Q11
2Q11
3Q11
4Q11
37%
38%
42%
45%
48%
4Q10
1Q11
2Q11
3Q11
4Q11
3.22%
2.37%
2.71%
2.52%
2.16%
4Q10
1Q11
2Q11
3Q11
4Q11 |
 6
STRONG FUNDING PROFILE AND LIQUIDITY POSITION
Deposit Profile*
Core Deposits as a % of Total Funding
Liquidity Coverage Ratio **
Cost of Deposits
1.35%
0.49%
Low Cost Deposits*
$67.1B
$76.2B
% Low Cost Deposits*
68%
80%
Loans* / Deposits*
Source: SNL Financial -
Peers include BAC, BBT, CMA, FITB, KEY, MTB, PNC, STI, USB, WFC
•
** Liquidity Coverage Ratio as of 4Q11 Data provided by Barclay’s Capital
based on the their models using publicly available 24%
30%
16%
20%
4%
5%
24%
25%
32%
20%
2009
2011
Interest Free
Time
Money Market
Savings
Interest Bearing
89%
85%
Regions
Peer Median
101%
107%
92%
88%
81%
110%
111%
92%
95%
90%
2007
2008
2009
2010
2011
Regions
Peer Median
108%
72%
Regions
Peer Median
information and dual deposit run-off assumptions
Based
on
full
year
ending
balances |
 7
STRONG CAPITAL LEVELS
(1)
(2)
1
Non-GAAP
–
see
appendix
page
23
for
reconciliation
2
Non-GAAP
-
Subject
to
change
as
interpretation
of
Basel
III
rules
is
ongoing
and
dependent
on
guidance
from
Basel
and
regulators; see appendix page 24 for reconciliation
7.9%
7.9%
7.9%
8.2%
8.5%
7.7%
12.4%
12.5%
12.6%
12.8%
13.3%
11.4%
4Q10
1Q11
2Q11
3Q11
4Q11
4Q11 Basel III
Tier 1 Common
Tier 1 Capital |
 8
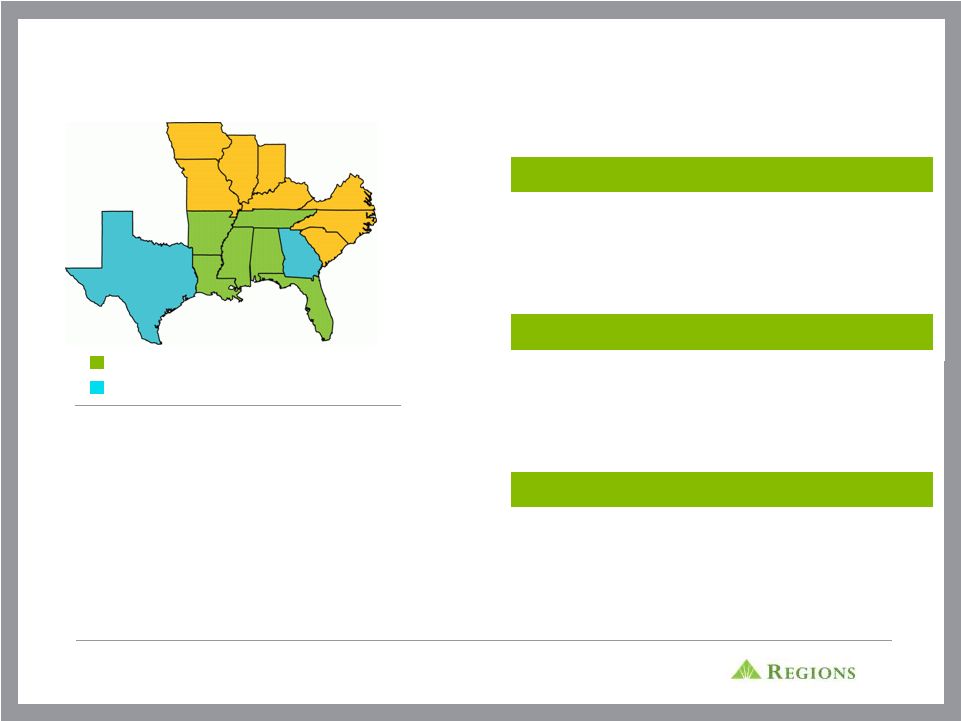
FRANCHISE OVERVIEW
•
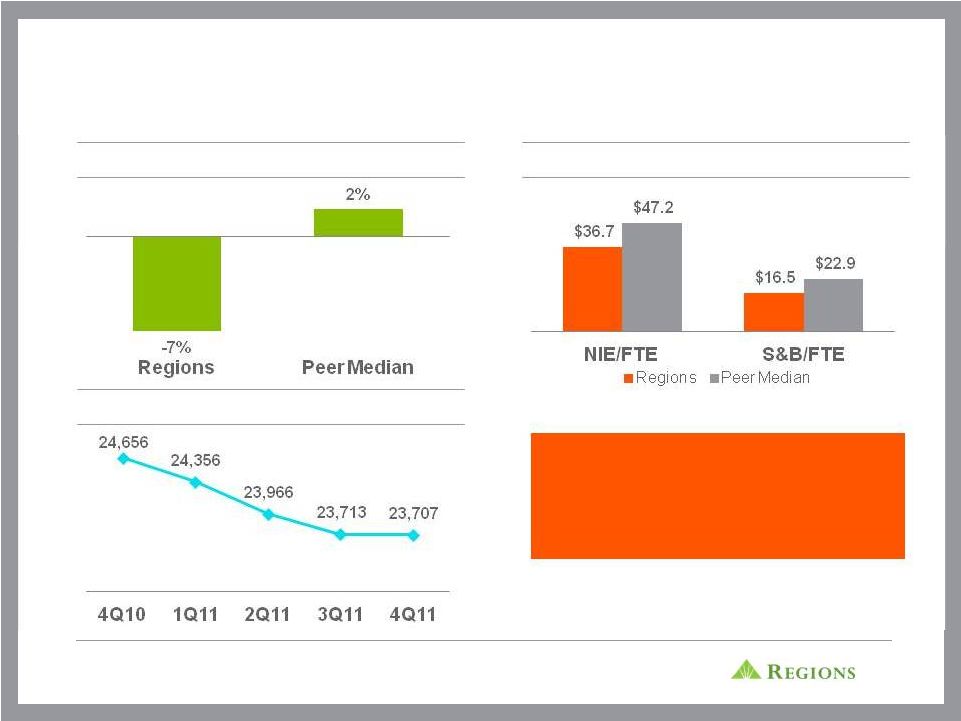
Associates: 23,707*
•
Assets: $127B
•
Loans: $78B
•
Deposits: $96B
•
Branches: 1,726
•
Insurance Offices: 30
•
ATMs: 2,083
•
Market Cap: $7.4B**
* Excludes Morgan Keegan associates
**As of March 2, 2012
Ranked 5th or Better in Market Share
Targeted Growth Areas
Business Services
›
Small and mid-sized C&I lending
›
Commercial Real Estate
›
Equipment Finance
Consumer Services
›
Mortgage
›
Home Equity
›
Credit Card
›
Direct Lending
›
Indirect Auto
Wealth Management
›
Private Banking
›
Insurance
›
Trust Services |
 9
Top 10 MSAs
Deposits
Market
Share
Market
Rank
’10-’15
Population
Growth
Birmingham, AL
$11.0
37.6%
1
Nashville, TN
$6.6
17.3%
1
Miami, FL
$4.8
3.1%
7
Tampa, FL
$4.4
8.7%
4
Memphis, TN
$3.8
16.8%
2
Atlanta, GA
$3.4
3.0%
6
St. Louis, MO
$3.0
4.7%
4
Jackson, MS
$2.8
25.5%
2
New Orleans, LA
$2.4
8.3%
4
Mobile, AL
$2.3
38.2%
1
($ in billions)
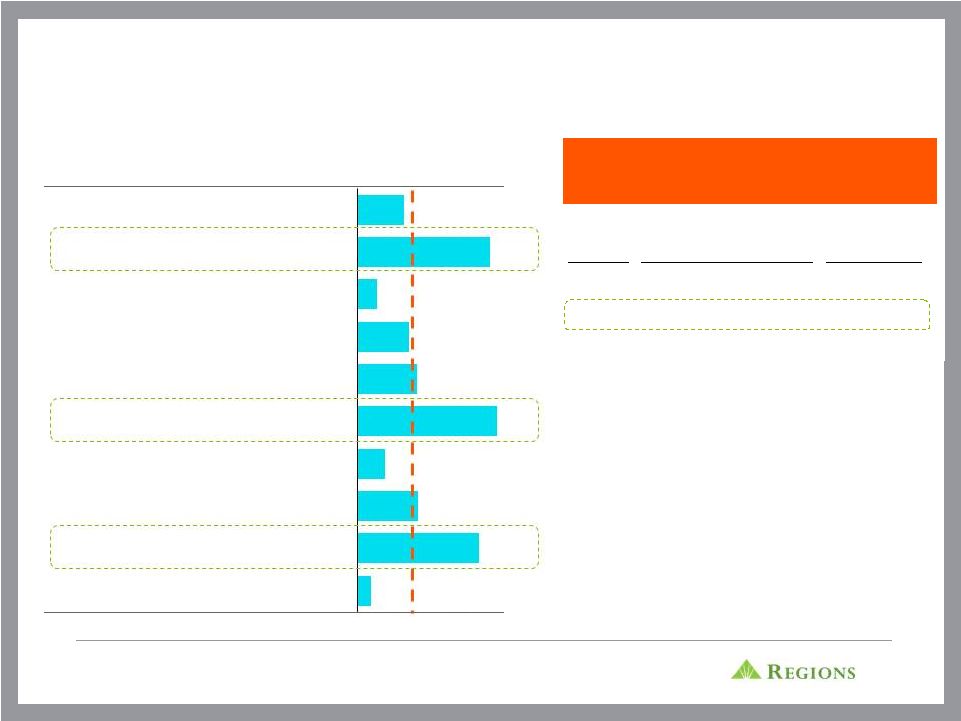
National Average: 3.9%
REGIONS’
FOOTPRINT IS CHARACTERIZED BY EITHER HIGH
MARKET SHARE, HIGH GROWTH MARKETS OR BOTH
Source: SNL Financial
Note: Core Markets include AL, FL, LA, MS, AR, TN
Weighted Average Deposit Market
Share in Regions’
Core Markets
Rank
Name
Market
Share
1
Bank of America
11.5%
2
Regions
9.8%
3
Wells Fargo
9.4%
4
SunTrust
6.9%
5
JPMorgan Chase
3.3%
6
BB&T
2.5%
7
Capital One
2.3%
8
First Horizon
2.0%
9
Hancock
1.9%
10
PNC
1.4%
1.0%
8.8%
4.4%
2.0%
10.1
%
4.3%
3.7%
1.4%
9.6%
3.4% |
 10
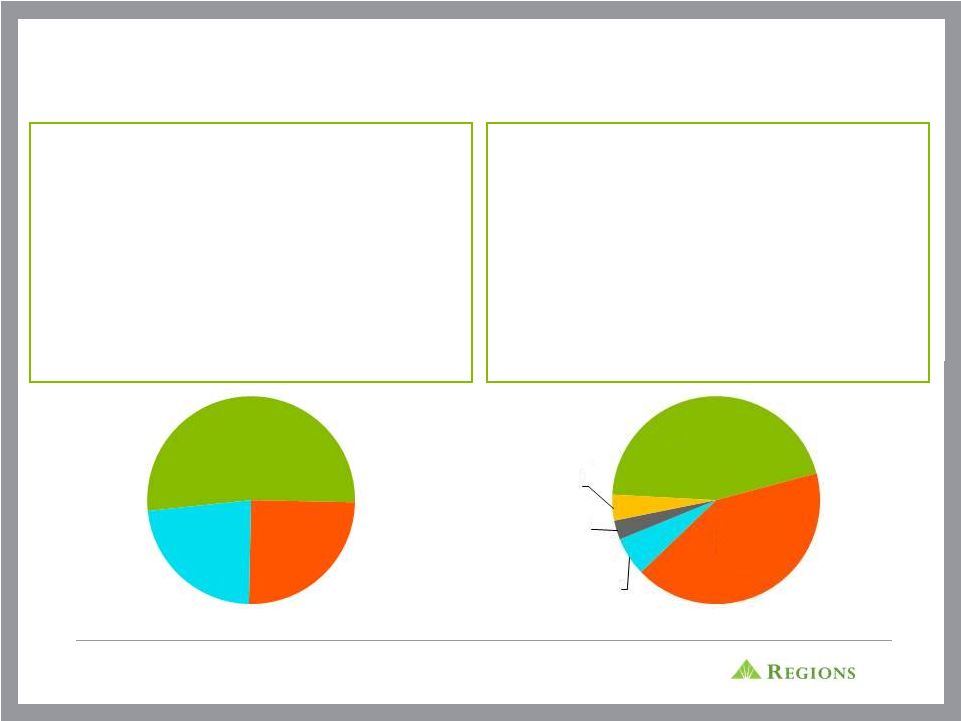
RENEWED FOCUS ON C&I AND CONSUMER LENDING
BUSINESS SERVICES
•
60% of Total Loan Portfolio
•
Focused on middle market and small business
•
Represents over 80% of Business Services Revenue
•
Broad based middle-market commercial loan growth across
footprint and industries
•
Driven by specialized industries, including healthcare,
franchise restaurant, energy, as well as technology and
defense
4Q11 Business Services Loans: $47B
4Q11 Consumer Services Loans: $31B
* Includes commercial real estate owner occupied loans
C&I
52%
CRE*
25%
IRE
23%
1st Mort
45%
Home
Equity
42%
Indirect
6%
Credit
Card
3%
Other
4%
CONSUMER SERVICES
•
40% of Total Loan Portfolio
•
Consumer loan growth will be fueled by new businesses as
well as growth in existing businesses
•
Mortgage loan production grew 18% QoQ
•
Non-real estate consumer portfolio has increased 45% since
2010
•
$1B Regions-branded credit card portfolio repurchased in 2011
•
Indirect auto lending grew 16% YoY |
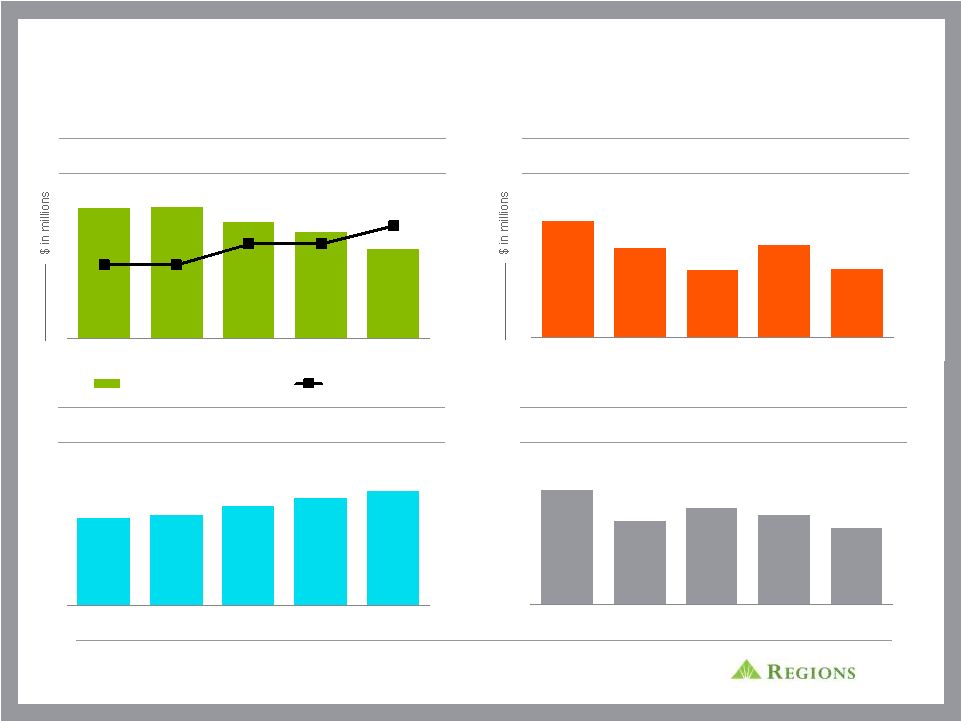
 11
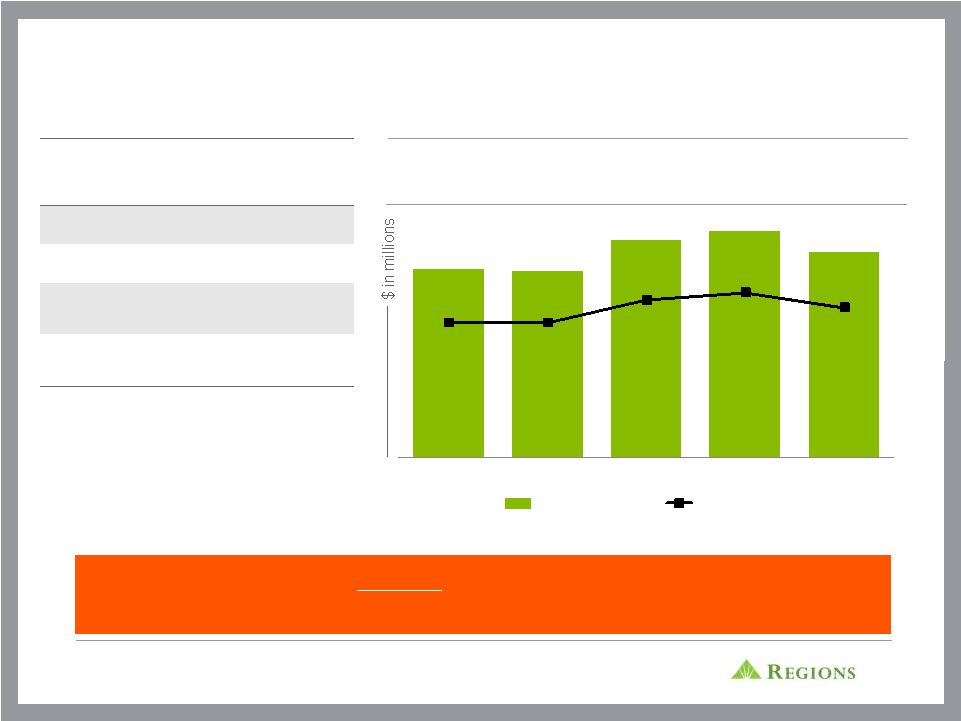
$430
$424
$496
$516
$468
1.8%
1.8%
2.1%
2.2%
2.0%
0.0%
0.5%
1.0%
1.5%
2.0%
2.5%
3.0%
3.5%
4Q10
1Q11
2Q11
3Q11
4Q11
PPI
PPI / RWA
2011 FINANCIAL HIGHLIGHTS
Adjusted Pre-tax Pre-provision Income from Continuing
Operations
(2)
Loan
Loss
Provision
$682
$482
$398
$355
$295
(1)
Non-GAAP -
Excludes goodwill impairment charge of $253M in 4Q11 and excludes regulatory
charge of $75M in 2Q10 offset by $16M
related
tax
benefit
in
2Q11
–
See GAAP to non-GAAP reconciliation on slide 21
(2)
Non-GAAP, see GAAP to Non-GAAP reconciliation on slide 22
(3)
Source: SNL Financial; Company Reports Peer banks include BAC, BBT, CMA,
FITB, KEY, MTB, PNC, STI, USB, WFC Regions experienced the highest
full year 2011 vs. 2010 PPI growth
versus all peers
(2)
(2)
(2)
2011 Financial Results
Net Loss
($429)MM
EPS
($0.34)
Income from continuing
operations
(1)
$211MM
EPS from continuing
operations
(1)
$0.17 |
 12
MIX AND COST OF DEPOSITS PROVIDES FURTHER
OPPORTUNITY TO LOWER DEPOSIT COSTS AND IMPROVE
MARGIN
Deposit Cost Opportunity Gap
•
Regions has additional room to reduce deposit
costs, most significantly through profitably re-pricing
maturing CDs
•
$11.7B of higher cost CDs maturing in 2012 at
1.46%
•
1H12
-
$7B
at
1.02%
and
2H12
-
$4.7B
at
2.09%
•
Funding costs declined 31 basis points from 4Q10
Deposit Mix Compared to Peers*
Regions
Peer
Average
* Average basis for 4Q11
Source: SNL Financial: Peer banks include BAC, BBT, CMA, FITB, KEY, MTB, PNC, STI,
USB, WFC 38 bps
33 bps
8 bps
7 bps
3Q11
4Q11
Peer Median
Regions Opportunity Gap
Time
21%
NIB
30%
Other
49%
Time
17%
NIB
30%
Other
53% |
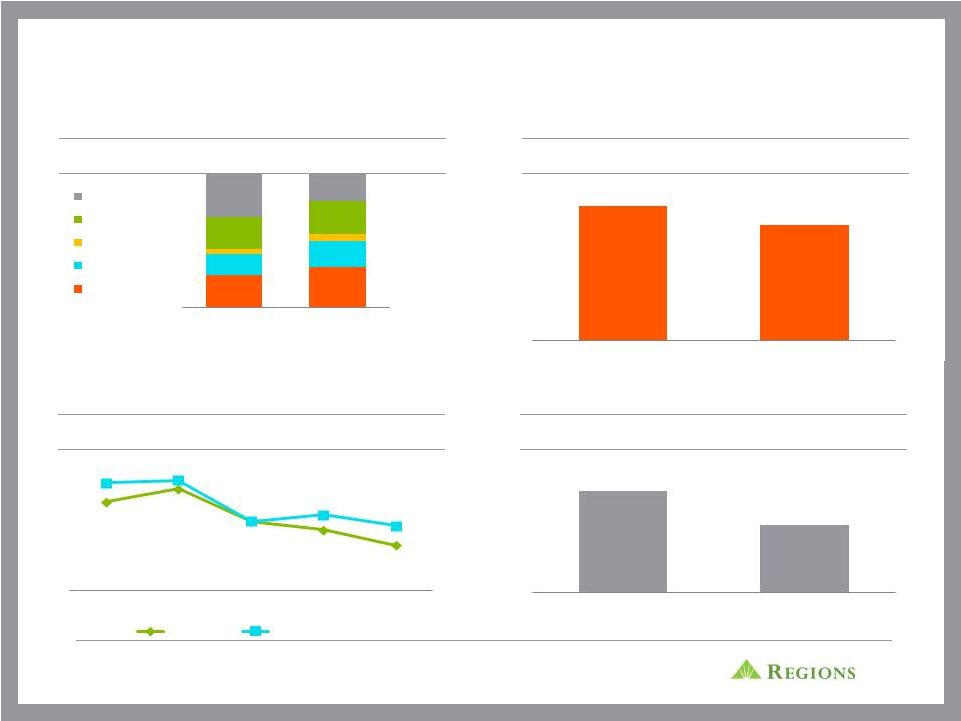
 13
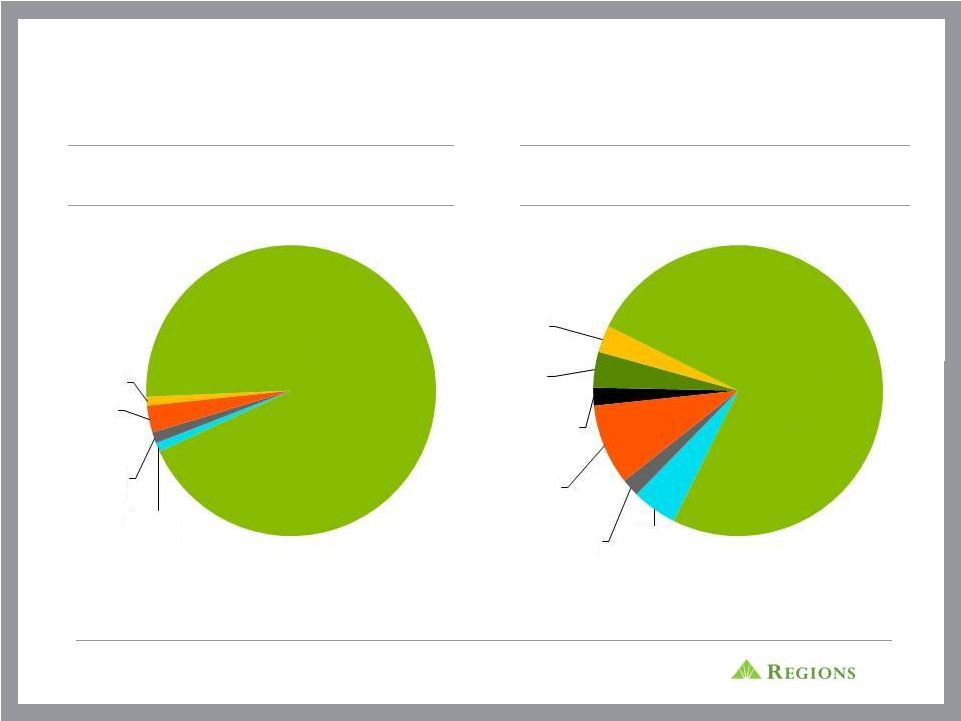
CONSERVATIVE INVESTMENT PORTFOLIO VS. PEERS
Regions Securities Portfolio Components*
Peer Average Securities Portfolio
Components *
*As of 12/31/2011
Source: FFIEC Call Report Data: Peer banks include BAC, BBT, CMA, FITB, KEY, MTB,
PNC, STI, USB, WFC Agency
Debt
1%
Agency
MBS
94%
Agency
CMBS
1%
Private
CMBS
1%
Other
3%
Treasuries
2%
Munis
4%
Agency
Debt
3%
Agency
MBS
75%
Private
MBS
5%
Private
CMBS
2%
Other
9% |
 14
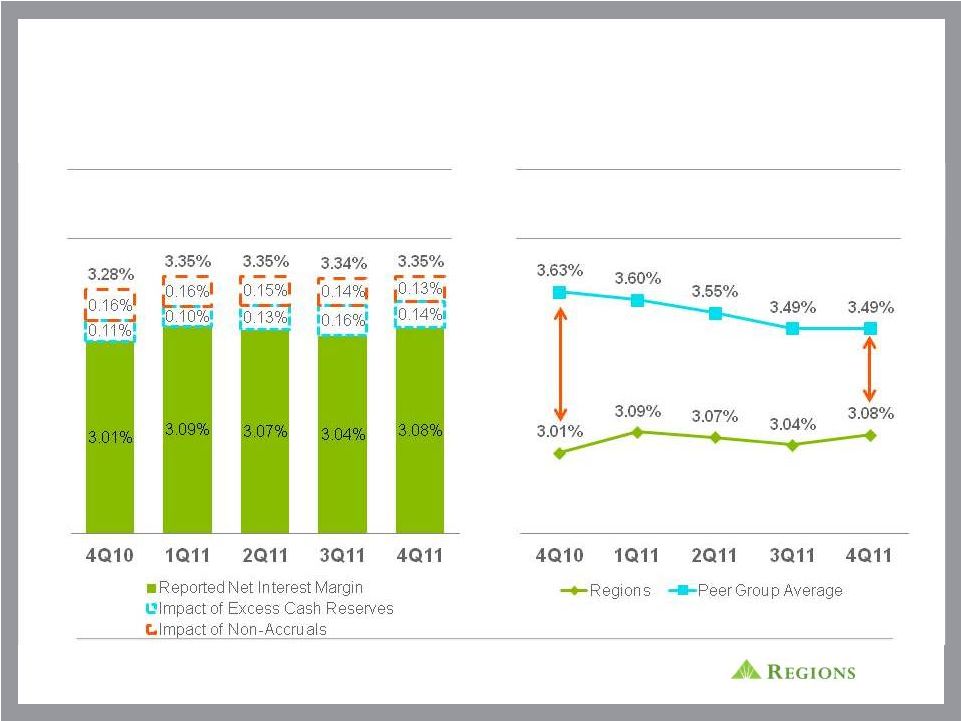
FUNDING MIX AND DEPLOYMENT OF CASH
RESERVES EXPECTED TO RESULT IN ADDITIONAL
IMPROVEMENT TO NIM*
Impact of Excess Cash Reserves & Non-
Accruals on NIM*
Regions has closed a portion of its gap vs.
peers in the last 5 quarters
69bps
41bps
* From continuing operations
Source: SNL Financial: Peer banks include BAC, BBT, CMA, FITB, KEY, MTB, PNC, STI,
USB, WFC |
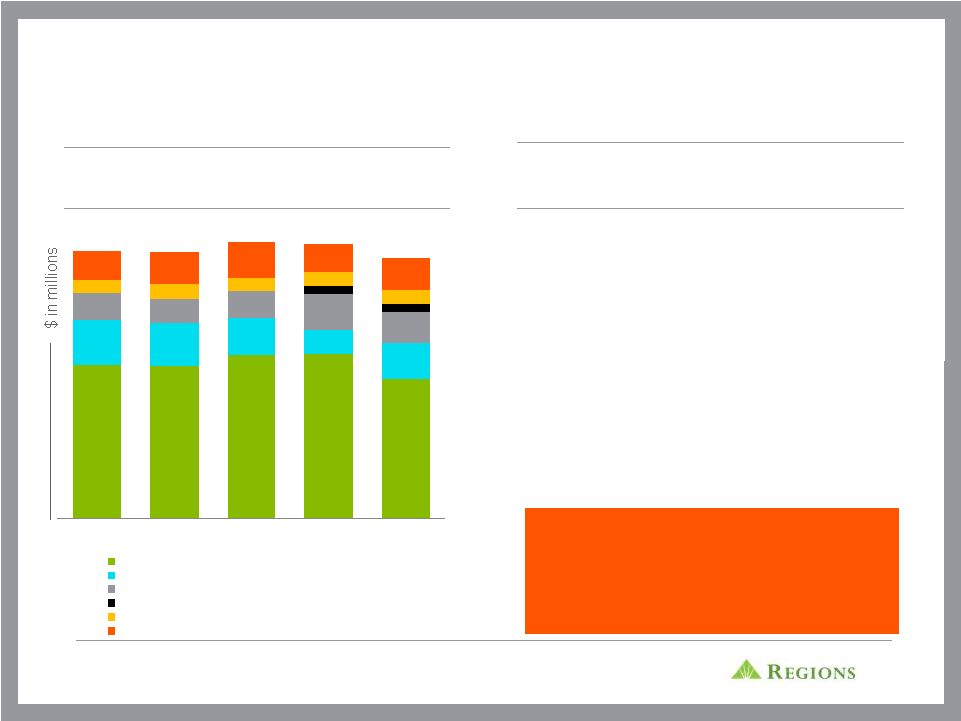 15
ABILITY TO ADAPT OUR BUSINESS MODEL HELPS
MITIGATE NEW LEGISLATION
•
Ongoing restructuring of our
accounts from free to fee-eligible
•
Increased hurdle to obtain free
checking
•
Cross-sell new revenue initiatives
•
Now Banking Suite of products
(expedited bill pay, check cashing,
reloadable prepaid debit card and
money transfer services)
Factors Offsetting Debit Interchange
Legislation
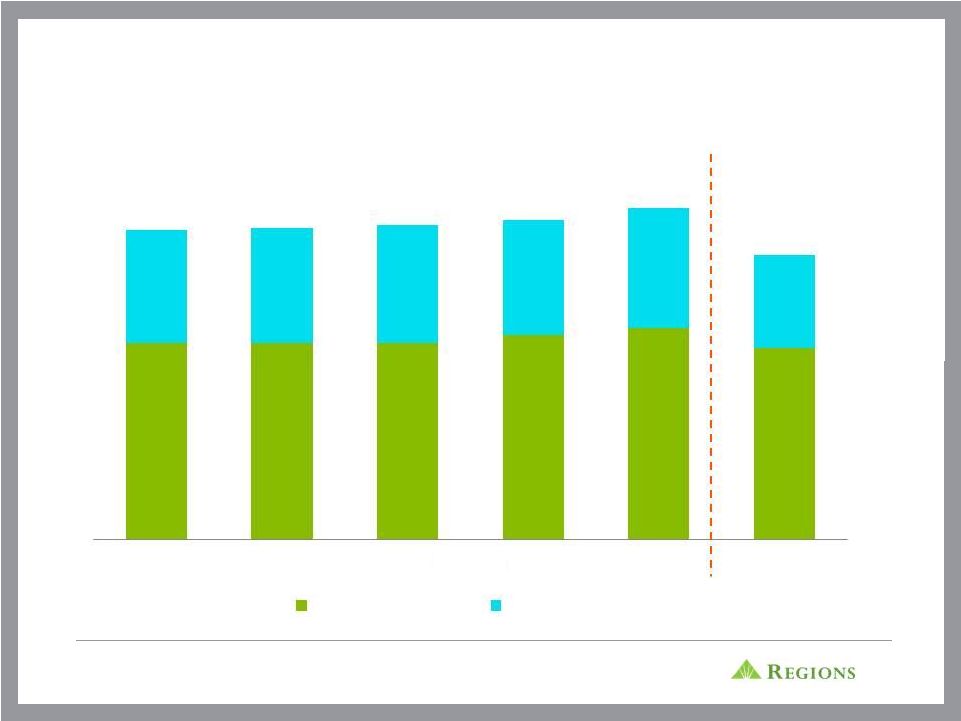
Total 2011 service charges were
relatively stable despite the negative
impact of Regulation E and debit
interchange legislation
Fee Income by Quarter *
* From continuing operations
290
287
308
310
263
83
81
70
44
68
51
45
50
68
57
15
16
25
28
25
27
26
53
60
66
52
60
$502
$501
$519
$516
$490
4Q10
1Q11
2Q11
3Q11
4Q11
Service charges
Capital Markets, Investment Income & Trust
Mortgage Income
Credit Card Income
Insurance Income
Other |
 16
EXPENSE CONTROL CONTINUES TO BE A FOCUS
Expenses Per FTE
(1)
Non-GAAP from continuing operations excluding goodwill impairment; see GAAP to
Non-GAAP reconciliation on slide 22 (2)
Excludes Morgan Keegan Associates
Source: SNL Financial; Peers include BAC, BBT, CMA, FITB, KEY, MTB, PNC, STI, USB,
WFC Regions has the lowest expenses per
FTE of all peers
(1)
(1)
Non-Interest
Expense
(1)
–
4Q11
vs.
4Q10
Headcount
–
Bank
Associates
(2) |
 17
OPPORTUNITY FOR OUTPERFORMANCE
REVENUE
EXPENSES
CREDIT
•
Tangible opportunity to close peer margin gap
•
Continued momentum in C&I and Consumer lending
•
Real estate expertise intact
•
Durbin mitigation efforts underway
•
Ongoing expense initiatives
•
Branch rationalization
•
Removed Morgan Keegan overhead / cost structure
•
Anticipating reduced credit related / OREO expenses
•
Solid reserve position
•
Reduced provisions with continued credit improvement
•
$11.7B of deposit repricing
•
Lower liquidity costs
•
Level of
non-accruals
|
 18
INVESTMENT THESIS
Improved Credit Profile
•
Aggressive risk management initiatives
•
Significant reduction in higher risk loan portfolios
•
Continued improvement in credit quality metrics
Strong Funding Profile
and Capital Position
•
Continued growth in low cost core deposit base
•
Loan to deposit ratio well below historical and peer levels
•
Best in class liquidity position and attractive funding profile
•
Capital levels are solid and in line with Basel III regulatory requirements
Attractive
Market Presence
•
Leading Southeastern depository franchise with favorable demographics
•
Leading brand favorability
•
Top share in core markets
Comprehensive
Product Offering
•
Balanced business mix
•
Momentum in C&I and consumer offerings
•
Focused on core banking business post sale of Morgan Keegan
•
Sustainable and improving core profitability
•
Opportunity for outperformance
•
Significant credit leverage remaining
Profitability
|
 19
APPENDIX |
 20
FORWARD-LOOKING STATEMENTS
This
presentation
may
include
forward-looking
statements
which
reflect
Regions’
current
views
with
respect
to
future
events
and
financial
performance.
The
Private
Securities
Litigation
Reform
Act
of
1995
(“the
Act”)
provides
a
“safe
harbor”
for
forward-looking
statements
which
are
identified
as
such
and
are
accompanied
by
the
identification
of
important
factors
that
could
cause
actual
results
to
differ
materially
from
the
forward-
looking
statements.
For
these
statements,
we,
together
with
our
subsidiaries,
claim
the
protection
afforded
by
the
safe
harbor
in
the
Act.
Forward-looking
statements
are
not
based
on
historical
information,
but
rather
are
related
to
future
operations,
strategies,
financial
results
or
other
developments.
Forward-looking
statements
are
based
on
management’s
expectations
as
well
as
certain
assumptions
and
estimates
made
by,
and
information
available
to,
management
at
the
time
the
statements
are
made.
Those
statements
are
based
on
general
assumptions
and
are
subject
to
various
risks,
uncertainties
and
other
factors
that
may
cause
actual
results to differ materially from the views, beliefs and projections expressed in
such statements. These risks, uncertainties and other factors include, but are not limited to, those described below:
›
The Dodd-Frank Wall Street Reform and Consumer Protection Act (the
“Dodd-Frank Act”)became law on July 21, 2010, and a number of legislative, regulatory and tax proposals remain pending. Additionally, the
U.S.
Treasury
and
federal
banking
regulators
continue
to
implement,
but
are
also
beginning
to
wind
down,
a
number
of
programs
to
address
capital
and
liquidity
in
the
banking
system.
Proposed
rules,
including
those that are part of the Basel III process, could require banking institutions to
increase levels of capital. All of the foregoing may have significant effects on Regions and the financial services industry, the
exact nature of which cannot be determined at this time.
›
Regions'
ability
to
mitigate
the
impact
of
the
Dodd-Frank
Act
on
debit
interchange
fees
through
revenue
enhancements
and
other
revenue
measures,
which
will
depend
on
various
factors,
including
the
acceptance by our customers of modified fee structures for Regions' products and
services. ›
The impact of compensation and other restrictions imposed under the Troubled Asset
Relief Program (“TARP”) until Regions repays the outstanding preferred stock and warrant issued under the TARP, including
restrictions
on
Regions’
ability
to
attract
and
retain
talented
executives
and
associates.
›
Possible additional loan losses, impairment of goodwill and other intangibles, and
adjustment of valuation allowances on deferred tax assets and the impact on earnings and capital.
›
Possible changes in interest rates may increase funding costs and reduce earning
asset yields, thus reducing margins. Increases in benchmark interest rates would also increase debt service requirements for
customers whose terms include a variable interest rate, which may negatively impact
the ability of borrowers to pay as contractually obligated. ›
Possible changes in general economic and business conditions in the United States in
general and in the communities Regions serves in particular, including any prolonging or worsening of the current
unfavorable economic conditions including unemployment levels.
›
Possible changes in the creditworthiness of customers and the possible impairment of
the collectability of loans. ›
Possible
changes
in
trade,
monetary
and
fiscal
policies,
laws
and
regulations
and
other
activities
of
governments,
agencies,
and
similar
organizations,
may
have
an
adverse
effect
on
business.
›
The current stresses in the financial and real estate markets, including possible
continued deterioration in property values. ›
Regions' ability to manage fluctuations in the value of assets and liabilities and
off-balance sheet exposure so as to maintain sufficient capital and liquidity to support Regions' business.
›
Regions' ability to expand into new markets and to maintain profit margins in the
face of competitive pressures. ›
Regions' ability to develop competitive new products and services in a timely manner
and the acceptance of such products and services by Regions' customers and potential customers.
›
Regions' ability to keep pace with technological changes.
›
Regions' ability to effectively manage credit risk, interest rate risk, market risk,
operational risk, legal risk, liquidity risk, and regulatory and compliance risk.
›
Regions’
ability to ensure adequate capitalization which is impacted by inherent
uncertainties in forecasting credit losses. ›
The cost and other effects of material contingencies, including litigation
contingencies, and any adverse judicial, administrative or arbitral rulings or proceedings.
›
The effects of increased competition from both banks and non-banks.
›
The effects of geopolitical instability and risks such as terrorist attacks.
›
Possible changes in consumer and business spending and saving habits could affect
Regions' ability to increase assets and to attract deposits. ›
The effects of weather and natural disasters such as floods, droughts, wind,
tornados and hurricanes, and the effects of man-made disasters.
›
Possible downgrades in ratings issued by rating agencies.
›
Potential
dilution
of
holders
of
shares
of
Regions’
common
stock
resulting
from
the
U.S.
Treasury’s
investment
in
TARP.
›
Possible
changes
in
the
speed
of
loan
prepayments
by
Regions’
customers
and
loan
origination
or
sales
volumes.
›
Possible acceleration of prepayments on mortgage-backed securities due to low
interest rates and the related acceleration of premium amortization on those securities.
›
The effects of problems encountered by larger or similar financial institutions that
adversely affect Regions or the banking industry generally. ›
Regions’
ability to receive dividends from its subsidiaries.
›
The
effects
of
the
failure
of
any
component
of
Regions’
business
infrastructure
which
is
provided
by
a
third
party.
›
Changes in accounting policies or procedures as may be required by the Financial
Accounting Standards Board or other regulatory agencies. ›
With regard to the sale of Morgan Keegan:
the possibility that regulatory and other approvals and conditions to the
transaction are not received on a timely basis or at all; the possibility that modifications to the terms of the transaction may be
required in order to obtain or satisfy such approvals or conditions; changes in the
anticipated timing for closing the transaction; business disruption during the pendency of or following the transaction;
diversion
of
management
time
on
transaction-related
issues;
reputational
risks
and
the
reaction
of
customers
and
counterparties
to
the
transaction
›
The
effects
of
any
damage
to
Regions’
reputation
resulting
from
developments
related
to
any
of
the
items
identified
above.
›
The
foregoing
list
of
factors
is
not
exhaustive.
For
discussion
of
these
and
other
factors
that
may
cause
actual
results
to
differ
from
expectations,
look
under
the
captions
“Forward-Looking
Statements”
and
“Risk
Factors”
in Regions’
Annual Report on Form 10-K for the year ended December 31, 2011.
›
The words "believe," "expect," "anticipate,"
"project," and similar expressions often signify forward-looking statements. You should not place undue reliance on any forward-looking statements, which speak only
as
of
the
date
made.
We
assume
no
obligation
to
update
or
revise
any
forward-looking
statements
that
are
made
from
time
to
time. |
 21
NON-GAAP RECONCILIATION: NET INCOME / (LOSS) AND
EARNINGS PER SHARE
1
There are no preferred shares allocable to discontinued operations.
2
In the second quarter of 2010, Regions recorded a $200 million charge to account for
a probable, reasonably estimable loss related to a pending settlement of regulatory matters. At that time,
Regions assumed that the entire charge would be non-deductible for income tax
purposes. $75 million of the regulatory charge relates to continuing operations. The settlement was finalized
during the second quarter of 2011. At the time of settlement, Regions had better
information related to tax implications. Approximately $125 million of the settlement charge will be deductible
for
federal income tax purposes. Accordingly, during the second quarter of 2011, Regions
adjusted federal income taxes to account for the impact of the deduction. The adjustment reduced Regions'
provision for income taxes by approximately $44 million for the second quarter of
2011, of which approximately $17 million relates to continuing operations.
2011
2010
4Q11
3Q11
2Q11
1Q11
4Q10
Net income (loss) (GAAP)
(215)
$
(539)
$
(548)
$
155
$
109
$
69
$
89
$
Preferred dividends and accretion (GAAP)
(214)
(224)
(54)
(54)
(54)
(52)
(53)
Net income (loss) available to common shareholders (GAAP)
(429)
$
(763)
$
(602)
$
101
$
55
$
17
$
36
$
Income (loss) from discontinued operations, net of tax (GAAP)
(1)
(404)
(71)
(467)
14
30
19
22
Income (loss) from continuing operations available to common shareholders
(GAAP) (25)
$
(692)
$
(135)
$
87
$
25
$
(2)
$
14
$
Goodwill impairment from continuing operations (non-deductible)
253
-
253
-
-
-
-
Regulatory charge and related tax benefit from continuing operations
(2)
(17)
75
-
-
(17)
-
-
Income (loss) from continuing operations available to common shareholders,
excluding goodwill impairment and regulatory charge and related tax benefit
(non-GAAP) 211
$
(617)
$
118
$
87
$
8
$
(2)
$
14
$
GAAP to non-GAAP EPS Reconciliation
Earnings (loss) per share as reported (GAAP)
($0.34)
($0.62)
($0.48)
$0.08
$0.04
$0.01
$0.03
Earnings (loss) per share from discontinued operations (GAAP)
($0.32)
($0.06)
($0.37)
$0.01
$0.02
$0.01
$0.02
Earnings (loss) per share from continuing operations (GAAP)
($0.02)
($0.56)
($0.11)
$0.07
$0.02
($0.00)
$0.01
Goodwill impairment and related regulatory charge net of tax benefit from
continuing operations
($0.19)
($0.06)
($0.20)
$0.00
$0.01
$0.00
$0.00
Adjusted earnings per share from continuing operations, excluding goodwill
impairment and regulatory charge (non-GAAP)
$0.17
($0.50)
$0.09
$0.07
$0.01
($0.00)
$0.01
Year Ended December 31
As of and for Quarter Ended
The tables below and on the next slide present computations of earnings (loss) and certain other
financial measures, excluding goodwill impairment and regulatory charge and related tax benefit
(non-GAAP). The goodwill impairment charge and the regulatory charge and related tax benefit are included in financial results presented in accordance with generally accepted
accounting principles (GAAP). A table also presents computations of full year and quarterly
pre-tax pre-provision income (non-GAAP). Non-interest expense (GAAP) is presented excluding
certain adjustments to arrive at adjusted non-interest expense (non-GAAP). Regions believes
that the exclusion of the goodwill impairment and the regulatory charge and related tax benefit
in expressing earnings (loss) and certain other financial measures, including "earnings (loss) per
common share, excluding goodwill impairment and regulatory charge and related tax benefit“
provides a meaningful base for period-to-period comparisons, which management believes will assist investors in analyzing the operating results of the Company and predicting
future performance. These non-GAAP financial measures are also used by management to assess
the performance of Regions' business because management does not consider the goodwill
impairment and regulatory charge and related tax benefit to be relevant to ongoing operating results. Management and the Board of Directors utilize these non-GAAP financial
measures for the following purposes: preparation of Regions' operating budgets; monthly financial
performance reporting; monthly close-out "flash" reporting of consolidated results
(management only); and presentations to investors of company performance. Management uses these
measures to monitor performance and believes these measures provide meaningful information to
investors. |
 22
NON-GAAP RECONCILIATION: PRE-TAX PRE-PROVISION
INCOME AND RISK WEIGHTED ASSETS
The Pre-Tax Pre-Provision Income from Continuing Operations table presents
computations of pre-tax pre-provision income from continuing operations excluding certain
adjustments
(non-GAAP).
Regions
believes
that
the
exclusion
of
these
adjustments
provides
a
meaningful
base
for
period-to-period
comparisons,which
management
believes
will
assist
investors
in
analyzing
the
operating
results
of
the
Company
and
predicting
future
performance.
These
non-GAAP
financial
measures
are
also
used
by
management to
assess
the
performance
of
Regions'
business.
It
is
possible
that
the activities related to the adjustments may recur; however, management does not
consider the activities related to the adjustments to be indications of
ongoing operations. Regions believes that presentation of these non-GAAP financial measures will permit investors to assess the
performance of the Company on the same basis as that applied by management.
Non-GAAP financial measures have inherent limitations, are not required to be uniformly
applied and are not audited. Although these non-GAAP financial measures are
frequently used by stakeholders in the evaluation of a company, they have limitations as
analytical
tools,
and
should
not
be
considered
in
isolation,
or
as
a
substitute
for
analyses
of
results
as
reported
under
GAAP.
In
particular,
a
measure
of
income
that
excludes
certain adjustments does not represent the amount that effectively accrues directly
to stockholders. (1)
After
tax
amounts
for
leveraged
lease
terminations
gains
are
$2.8
million
for
12/31/11,
$5.4
million
for
9/30/11
and
$3.2
million
for
12/31/10.
($ amounts in millions)
12/31/11
9/30/11
6/30/11
3/31/11
12/31/10
(135)
$
87
$
25
$
(2)
$
14
$
54
54
54
52
53
18
17
(34)
(29)
44
(63)
158
45
21
111
295
355
398
482
682
232
513
443
503
793
253
-
-
-
-
485
513
443
503
793
Other Adjustments:
Securities (gains) losses, net
(7)
1
(24)
(82)
(333)
Loss (gain) on sale of mortgage loans
-
-
-
3
(26)
Leveraged lease termination (gains) losses, net
(1)
(10)
2
-
-
(59)
Loss on early extinguishment of debt
-
-
-
-
55
Securities impairment, net
2
-
-
-
-
Branch consolidation and equipment costs
(2)
-
77
-
-
Total other adjustments
(17)
3
53
(79)
(363)
468
$
516
$
496
$
424
$
430
$
Risk-weighted assets (regulatory)
91,449
92,786
93,865
93,929
94,966
Adjusted Pre-tax Pre-provision Income / RWA (non-GAAP)
2.0%
2.2%
2.1%
1.8%
1.8%
Continuing Operations
Non-interest expense (GAAP)
1,124
$
850
$
956
$
932
$
990
$
Adjustments:
Regulatory charge
-
$
-
$
-
-
-
Loss on early extinguishment of debt
-
-
-
-
(55)
Securities impairment, net
(2)
-
-
-
-
Branch consolidation and property and equipment charges
2
-
(77)
-
-
Goodwill impairment
(253)
-
-
-
-
Adjusted non-interest expense (non-GAAP)
871
$
850
$
879
$
932
$
935
$
Pre-tax pre-provision income from continuing operations, excluding goodwill
impairment (non-GAAP)
Adjusted Pre-tax Pre-provision Income from continuing operations
(non-GAAP) Preferred dividends (GAAP)
Income tax expense (benefit) (GAAP)
Income (loss) from continuing operations before income taxes (GAAP)
Provision for loan losses (GAAP)
Pre-tax pre-provision income from continuing operations
(non-GAAP) Goodwill impairment
Quarter Ended
Income (loss) from continuing operations available to common shareholders
(GAAP) |
 23
NON-GAAP RECONCILIATION: TIER 1 COMMON
The following table provides a reconciliation of stockholder’s equity to
"Tier 1 common equity" (non-GAAP). Traditionally, the Federal Reserve and
other banking regulatory bodies have assessed a bank's capital adequacy based on
Tier 1 capital, the calculation of which is codified in federal banking
regulations. In connection with the Company's Comprehensive Capital
Assessment and Review ("CCAR"), these regulators are supplementing their
assessment of the capital adequacy of a bank based on a variation of Tier 1
capital, known as Tier 1 common equity. While not codified, analysts and
banking
regulators
have
assessed
Regions'
capital
adequacy
using
the
Tier
1
common
equity
measure.
Because
and
Tier
1
common
equity
is
not
formally defined by GAAP or codified in the federal banking regulations, this
measure is considered to be non-GAAP and other entities may calculate it
differently than Regions' disclosed calculations. Since analysts and banking
regulators may assess Regions' capital adequacy using TIer 1 common equity,
we believe that it is useful to provide investors the ability to assess Regions' capital adequacy on these same bases.
Tier 1 common equity is often expressed as a percentage of risk-weighted
assets. Under the risk-based capital framework, a company's balance sheet
assets and credit equivalent amounts of off-balance sheet items are assigned to
one of four broad risk categories. The aggregated dollar amount in
each category is then multiplied by the risk-weighted category. The
resulting weighted values from each of the four categories are added together and
this sum is the risk-weighted assets total that, as adjusted, comprises the
denominator of certain risk-based capital ratios. Tier 1 capital is then divided
by this denominator (risk-weighted assets) to determine the Tier 1 capital
ratio. Adjustments are made to Tier 1 capital to arrive at Tier 1 common
equity. Tier 1 common equity is also divided by the risk-weighted assets
to determine the Tier 1 common equity ratio. The amounts disclosed as risk-
weighted assets are calculated consistent with banking regulatory
requirements. ($ amounts in millions)
12/31/11
9/30/11
6/30/11
3/31/11
12/31/10
TIER 1 COMMON RISK-BASED RATIO CONSOLIDATED
-
Stockholders' equity (GAAP)
16,499
$
17,263
$
16,888
$
16,619
$
16,734
$
Accumulated other comprehensive (income) loss
69
(92)
177
387
260
Non-qualifying goodwill and intangibles
(4,900)
(5,649)
(5,668)
(5,686)
(5,706)
Disallowed deferred tax assets
(432)
(506)
(498)
(463)
(424)
Disallowed servicing assets
(35)
(35)
(35)
(28)
(27)
Qualifying non-controlling interests
92
92
92
92
92
Qualifying trust preferred securities
846
846
846
846
846
Tier 1 capital (regulatory)
12,139
$
11,919
$
11,802
$
11,767
$
11,775
$
Qualifying non-controlling interests
(92)
(92)
(92)
(92)
(92)
Qualifying trust preferred securities
(846)
(846)
(846)
(846)
(846)
Preferred stock
(3,419)
(3,409)
(3,399)
(3,389)
(3,380)
Tier 1 common equity (non-GAAP)
7,782
$
7,572
$
7,465
$
7,440
$
7,457
$
Risk-weighted assets (regulatory)
91,449
92,786
93,865
93,929
94,966
Tier 1 common risk-based ratio (non-GAAP)
8.5%
8.2%
7.9%
7.9%
7.9%
As of and for Quarter Ended |
 24
NON-GAAP RECONCILIATION: BASEL III
(1)
Under
Basel
III,
regulatory
capital
must
be
reduced
by
purchased
credit
card
relationship
intangible
assets.
These
assets
are
partially allowed in Basel I capital.
(2)
Regions continues to develop systems and internal controls to precisely calculate
risk-weighted assets as required by Basel III. The amount included
above is a reasonable approximation, based on our understanding of the requirements.
The
following
table
provides
calculations
of
Tier
1
capital
and
Tier
1
common,
based
on
Regions’
current
understanding
of
Basel
III
requirements. Regions currently calculates its risk-based capital ratios
under guidelines adopted by the Federal Reserve based on the 1988 Capital
Accord (“Basel I”) of the Basel Committee on Banking Supervision (the “Basel Committee”). In December 2010, the Basel
Committee
released
its
final
framework
for
Basel
III,
which
will
strengthen
international
capital
and
liquidity
regulation.
When
implemented
by
U.S.
bank
regulatory
agencies
and
fully
phased-in,
Basel
III
will
change
capital
requirements
and
place
greater
emphasis
on
common
equity. Implementation of Basel III will begin on January 1, 2013, and will
be phased in over a multi-year period. The U.S. bank regulatory
agencies have not yet finalized regulations governing the implementation of Basel
III. Accordingly, the calculations provided below are estimates, based
on Regions’ current understanding of the framework, including the
Company’s reading of the requirements, and informal feedback
received
through
the
regulatory
process.
Regions’
understanding
of
the
framework
is
evolving
and
will
likely
change
as
the
regulations
are
finalized.
Because
the
Basel
III
implementation
regulations
are
not
formally
defined
by
GAAP
and
have
not
yet
been
finalized and codified, these measures are considered to be non-GAAP financial
measures, and other entities may calculate them differently
from
Regions’
disclosed
calculations.
Since
analysts
and
banking
regulators
may
assess
Regions’
capital
adequacy
using
the
Basel
III
framework,
we
believe
that
it
is
useful
to
provide
investors
the
ability
to
assess
Regions’
capital
adequacy
on
the
same
basis.
($ amounts in millions)
12/31/11
Stockholders'
equity
(GAAP)
16,499
$
Non-qualifying goodwill and intangibles
(1)
(5,065)
Adjustments, including other comprehensive income related to cash flow hedges,
disallowed deferred tax assets, threshold deductions and other
adjustments (854)
10,580
$
Qualifying non-controlling interests
4
Basel III Tier 1 Capital (non-GAAP)
10,584
$
Basel III Tier 1 Capital (non-GAAP)
10,584
$
Preferred Stock
(3,419)
Qualifying non-controlling interests
(4)
Basel III Tier 1 Common (non-GAAP)
7,161
$
Basel I risk-weighted assets
91,449
Basel
III
risk-weighted
assets
(2)
92,935
Minimum
Basel III Tier 1 Capital Ratio
11.4%
8.5%
Basel III Tier 1 Common Ratio
7.7%
7.0% |
 |