Attached files
Morgan Stanley Utilities Conference
NEW YORK, NY • MARCH 8, 2012

1
Safe Harbor Statement/Regulation G Information
Some of the statements contained in today’s presentation with respect to Pepco Holdings, Pepco, Delmarva Power and Atlantic City Electric, and each of their respective
subsidiaries, are forward-looking statements within the meaning of the U.S. federal securities laws and are subject to the safe harbor created thereby and by the Private
Securities Litigation Reform Act of 1995. These statements include declarations regarding each reporting company’s intents, beliefs and current expectations. You can
generally identify forward-looking statements by terminology such as “may,” “might,” “will,” “should,” “could,” “expects,” “intends,” “assumes,” “seeks to,” “plans,” “anticipates,”
“believes,” “projects,” “estimates,” “predicts,” “potential,” “future,” “goal,” “objective,” or “continue”, the negative or other variations of such terms, or comparable terminology, or
by discussions of strategy that involve risks and uncertainties. Forward-looking statements involve estimates, assumptions, known and unknown risks, uncertainties and other
factors that may cause one or more reporting company’s actual results, levels of activity, performance or achievements to be materially different from any future results, levels
of activity, performance or achievements expressed or implied by such forward-looking statements. Therefore, forward-looking statements are not guarantees or assurances of
future performance, and actual results could differ materially from those indicated by the forward-looking statements. These forward-looking statements are qualified in their
entirety by, and should be read together with, the risk factors included in the “Risk Factors” section of each reporting company’s annual report on Form 10-K for the year ended
December 31, 2011 (as amended) and other SEC filings, and investors should refer to this risk factor section. The forward-looking statements contained herein are also
qualified in their entirety by reference to, and should be read together with, the following important factors, which are difficult to predict, contain uncertainties, are beyond each
reporting company’s control and may cause actual results to differ materially from those contained in forward-looking statements: changes in governmental policies and
regulatory actions affecting the energy industry, including allowed rates of return, industry and rate structure, acquisition and disposal of assets and facilities, operation and
construction of transmission and distribution facilities, and the recovery of purchased power expenses; the outcome of pending and future rate cases, including the possible
disallowance of costs and expenses; the expenditures necessary to comply with regulatory requirements, including regulatory orders, and to implement reliability enhancement,
emergency response and customer service improvement programs; possible fines, penalties or other sanctions assessed by regulatory authorities against Pepco Holdings’
regulated utilities; weather conditions affecting usage and emergency restoration costs; population growth rates and changes in demographic patterns; changes in customer
energy demand due to conservation measures and the use of more energy-efficient products; general economic conditions, including the impact of an economic downturn or
recession on energy usage; changes in and compliance with environmental and safety laws and policies; changes in tax rates or policies or in rates of inflation; changes in
accounting standards or practices; changes in project costs; unanticipated changes in operating expenses and capital expenditures; the ability to obtain funding in the capital
markets on favorable terms; rules and regulations imposed by, and decisions of, Federal and/or state regulatory commissions, PJM, the North American Electric Reliability
Corporation and other applicable electric reliability organizations; legal and administrative proceedings (whether civil or criminal) and settlements that influence each reporting
company’s business and profitability; pace of entry into new markets; volatility in customer demand for electricity and natural gas; interest rate fluctuations and the impact of
credit and capital market conditions on the ability of a reporting company to obtain funding on favorable terms; and effects of geopolitical events, including the threat of
domestic terrorism or cyber attacks. Any forward-looking statements speak only as to the date of this presentation and each reporting company undertakes no obligation to
update any forward-looking statements to reflect events or circumstances after the date on which such statements are made or to reflect the occurrence of unanticipated
events. New factors emerge from time to time, and it is not possible for a reporting company to predict all such factors, nor can any reporting company assess the impact of any
such factor on such reporting company’s business or the extent to which any factor, or combination of factors, may cause results to differ materially from those contained in any
forward-looking statement. The foregoing factors should not be construed as exhaustive.
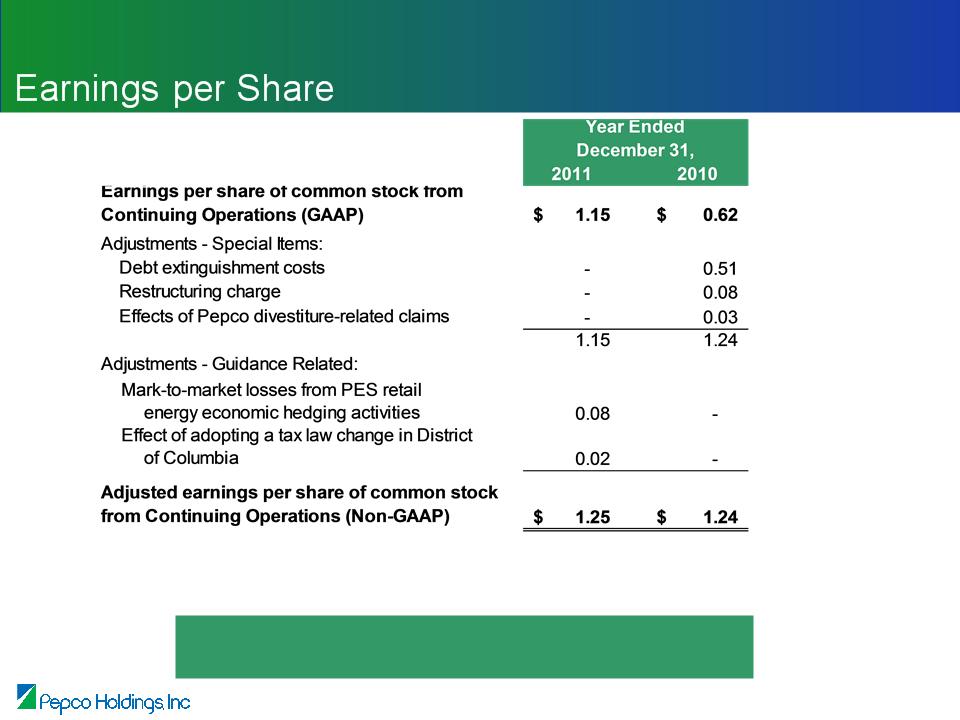
PHI discloses net income from continuing operations and related per share data (both as historical information and earnings guidance) excluding certain items (non-GAAP
financial information) because management believes that these items are not representative of PHI’s ongoing business operations. Management uses this information, and
believes that such information is useful to investors, in evaluating PHI’s period-over-period performance. The inclusion of this disclosure is intended to complement, and should
not be considered as an alternative to, PHI’s reported net income from continuing operations and related per share data in accordance with accounting principles generally
accepted in the United States (GAAP).
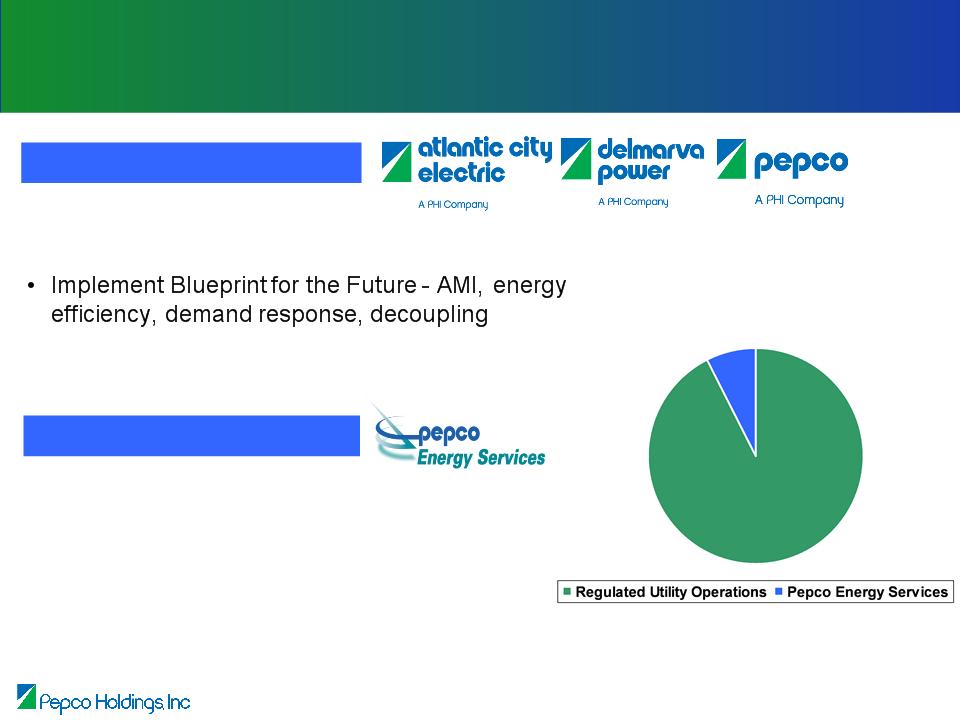
PHI’s Strategic Focus
• Invest in T&D infrastructure
• Focused on reliability and operational excellence
• Achieve reasonable regulatory outcomes
Power Delivery
Pepco Energy Services
• Build profitable market share and increase
earnings contribution from energy services
earnings contribution from energy services
Note: See Safe Harbor Statement at the beginning of today’s presentation.
2
Operating Income Business Mix
Forecasted 2012 - 2016
5 - 10 %
90 - 95%
Power Delivery - Growth Opportunity
Note: See Safe Harbor Statement at the beginning of today’s presentation.
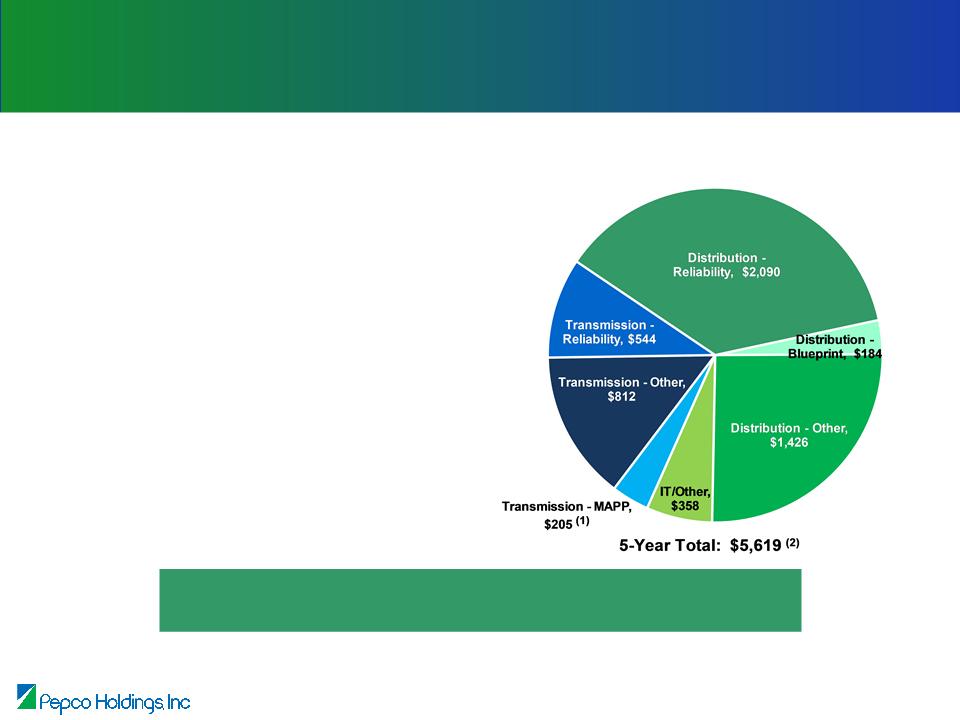
(1) Assumes Mid-Atlantic Power Pathway (MAPP) in-service date of 2020.
(2) Net of anticipated reimbursement of $53 million pursuant to awards from the U.S. DOE under the ARRA.
Capital Expenditures - 2012 - 2016 Forecast
(Millions of Dollars)
• 2010 year-end rate base of $5.1 billion
– Distribution - $3.9 billion (77%)
– Transmission - $1.2 billion (23%)
• Five-year capital expenditure forecast
of $5.6 billion
of $5.6 billion
– Distribution - $4.1 billion (73%)
– Transmission - $1.5 billion (27%)
Robust five-year capital expenditure forecast provides
opportunity for long-term earnings growth
opportunity for long-term earnings growth
3

Reliability Enhancement Plan -
Improving System Reliability is a Top Priority
• Our progress in Pepco’s service territory since 2010*:
– Tree Trimming - Trimmed along nearly 3,500 miles of power lines
to remove limbs that threatened our equipment
to remove limbs that threatened our equipment
– Cable Replacement - Replaced or upgraded more than 340 miles
of underground cable
of underground cable
– Selective Undergrounding - Identified overhead lines for potential
undergrounding
undergrounding
– Distribution Automation - Added 125 automated switches that will
reroute power more effectively during outages
reroute power more effectively during outages
– Customer Communications - Added call center staff and more
than doubled phone lines
than doubled phone lines
– Technology-Based Improvements - Implemented technology on
mobile devices to view online outage maps and enable customers to
report outages
mobile devices to view online outage maps and enable customers to
report outages
• System reliability has improved over the past year
– Improved reliability statistics in 2011 for Pepco customers serviced
by upgraded power lines:
by upgraded power lines:
• 39% reduction in the average number of power outages
• 56% reduction in the average outage duration
– Benefits of reliability initiatives demonstrated during Hurricane Irene
* Reliability Enhancement Plan introduced fall of 2010. Data as of 12/31/11
4
5
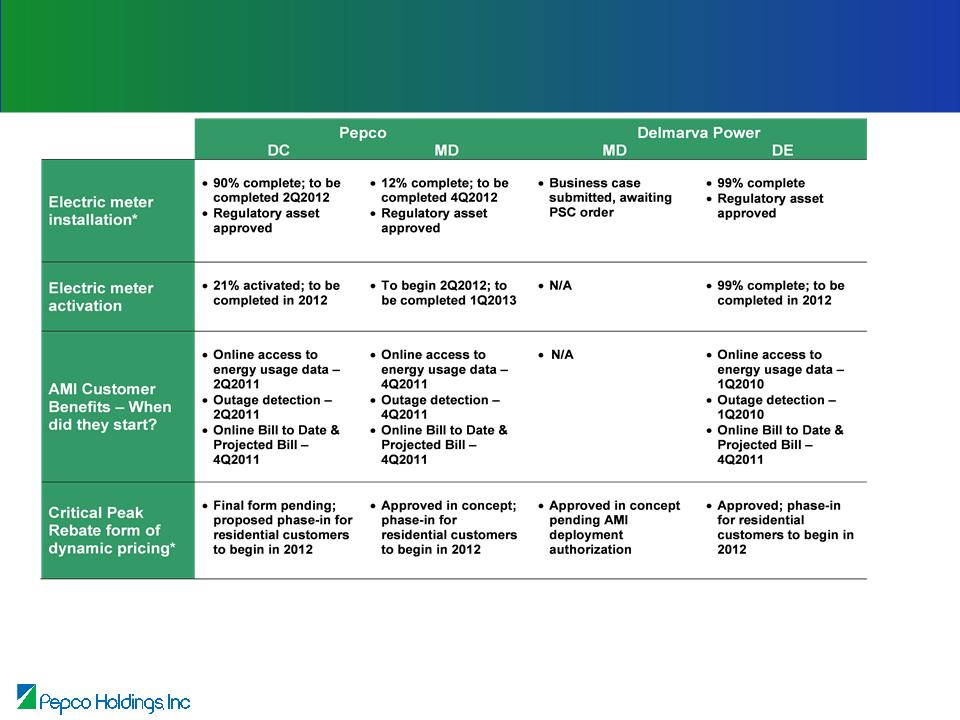
Advanced Metering Infrastructure -
Status by Jurisdiction
Status by Jurisdiction
Note: See Safe Harbor Statement at the beginning of today’s presentation.
* Deferred in New Jersey
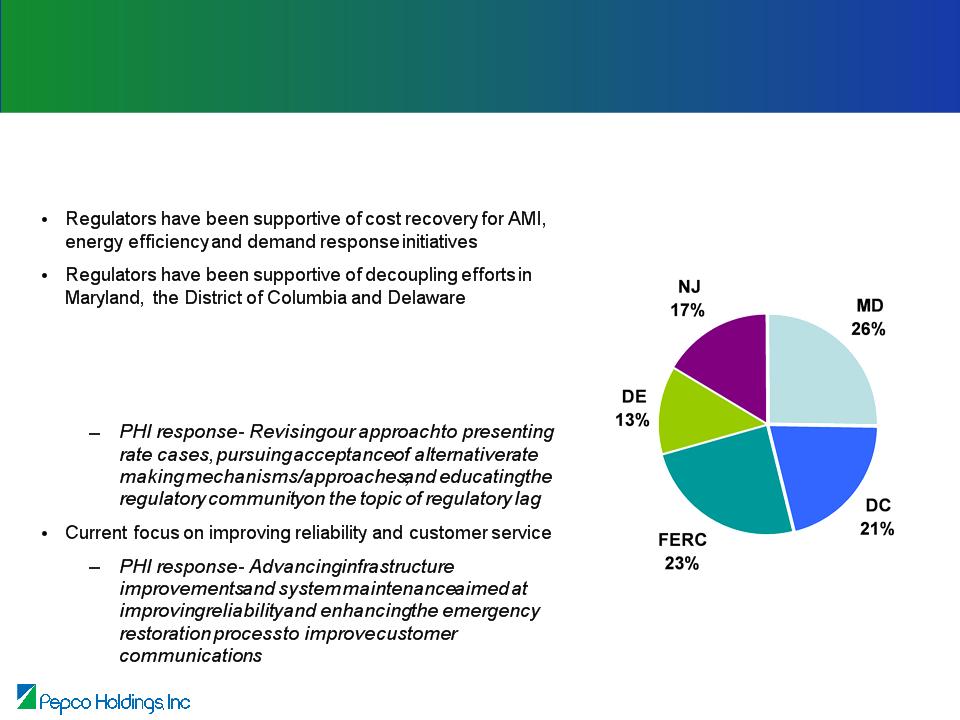
Diverse Regulatory Environment
Strengths
• Recent distribution rate case decisions have generally
reflected adherence to key ratemaking precedents
reflected adherence to key ratemaking precedents
• Formula rates in place at FERC
Challenges
• Regulatory lag in distribution business
Regulatory Diversity
Rate Base*
* Based on year-end 2010 rate base.
6
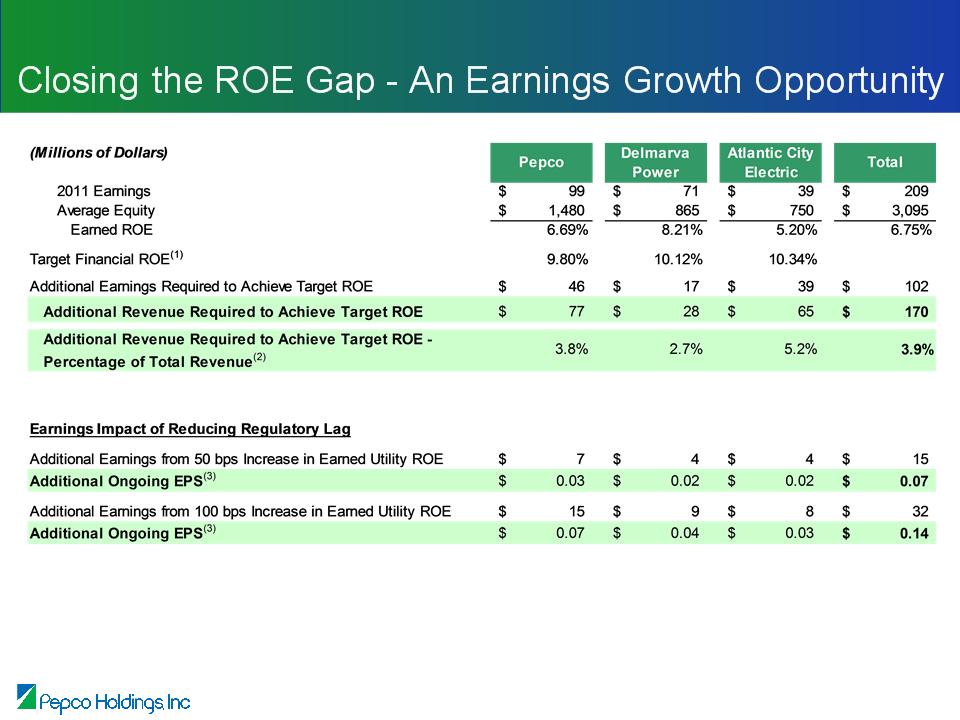
(1) Target Financial ROE reflects estimated weighted average authorized return on equity based on the estimated
2011 rate base. Target Financial ROEs are reduced by 25 basis points to allow for the historical differences
between “financial” and “regulatory” cost of service.
2011 rate base. Target Financial ROEs are reduced by 25 basis points to allow for the historical differences
between “financial” and “regulatory” cost of service.
(2) Excludes “Other Electric and Gas” revenue
(3) Based on 2011 weighted average common shares outstanding
7
Note: See Safe Harbor Statement at the beginning of today’s presentation.

• Filed distribution base rate cases in each of our electric jurisdictions in 2011 requesting
an annual increase in revenue of $247 million in total:
an annual increase in revenue of $247 million in total:
• Filed in each of our electric jurisdictions in 2011 proposals for adopting two
mechanisms to reduce regulatory lag:
mechanisms to reduce regulatory lag:
– Reliability Investment Recovery Mechanism* - provides full and timely recovery of future capital
investments related to distribution system reliability
investments related to distribution system reliability
– Fully forecasted test years
Distribution Rate Cases - The Current Cycle
|
Jurisdiction/Company
|
Requested Revenue
Requirement Increase (millions) |
Requested
Return on Equity |
Initial File
Date |
Expected
Timing of Decision |
|
DC - Pepco
|
$42.5
|
10.75%
|
7/8/11
|
Q2-2012
|
|
NJ - ACE
|
$79.5
|
10.75%
|
8/5/11
|
TBD
|
|
DE - DPL
|
$31.8
|
10.75%
|
12/2/11
|
Q3-2012
|
|
MD - DPL
|
$25.2
|
10.75%
|
12/9/11
|
Q3-2012
|
|
MD - Pepco
|
$68.4
|
10.75%
|
12/16/11
|
Q3-2012
|
* Referred to as the Infrastructure Investment Program in NJ
Note: See Safe Harbor Statement at the beginning of today’s presentation.
8

9
Distribution Rate Cases - Pending
Pepco - District of Columbia
Pepco - District of Columbia
Note: See Safe Harbor Statement at the beginning of today’s presentation.
Regulatory lag mitigation measures proposed:
• Reliability Investment Recovery Mechanism (RIM)
• Fully forecasted test years
(1) Current filed position as of October 29, 2011
(2) Intervenors revenue requirements are as follows: Washington Metropolitan Area Transit Authority (WMATA)
$33.9M based on 9.9% ROE; Apartment and Office Building Association (AOBA) $25.3M based on 9.2% ROE;
Office of People’s Counsel (OPC) $8.8M based on 9.0% ROE.
$33.9M based on 9.9% ROE; Apartment and Office Building Association (AOBA) $25.3M based on 9.2% ROE;
Office of People’s Counsel (OPC) $8.8M based on 9.0% ROE.
Drivers of requested increase:
•Rate base growth/reliability investments
•Increase in operating expenses
•Investment in Advanced Metering Infrastructure (AMI)
•Customer service enhancements
•Increase in authorized ROE
•Under-earning currently authorized returns

Distribution Rate Cases - Pending
Atlantic City Electric - New Jersey
Atlantic City Electric - New Jersey
Drivers of requested increase:
• Rate base growth/reliability investments
• Increase in operating expenses
• Recovery of Hurricane Irene restoration expenses
• Increase in authorized ROE
• Under-earning currently authorized returns
* Current filed position as of February 23, 2012.
Regulatory lag mitigation measure proposed in a separate
filing made October 18, 2011:
filing made October 18, 2011:
• Request the continuance and expansion of the recently
completed Infrastructure Investment Program (IIP)
completed Infrastructure Investment Program (IIP)
• Allows recovery of non-revenue generating infrastructure
investment through a special rate outside of a base rate
filing
investment through a special rate outside of a base rate
filing
• Under the IIP, Atlantic City Electric proposes to recover
reliability-related capital expenditures of $63 million, $94
million and $81 million, in 2012, 2013 and 2014,
respectively
reliability-related capital expenditures of $63 million, $94
million and $81 million, in 2012, 2013 and 2014,
respectively
Note: See Safe Harbor Statement at the beginning of today’s presentation.
10
11
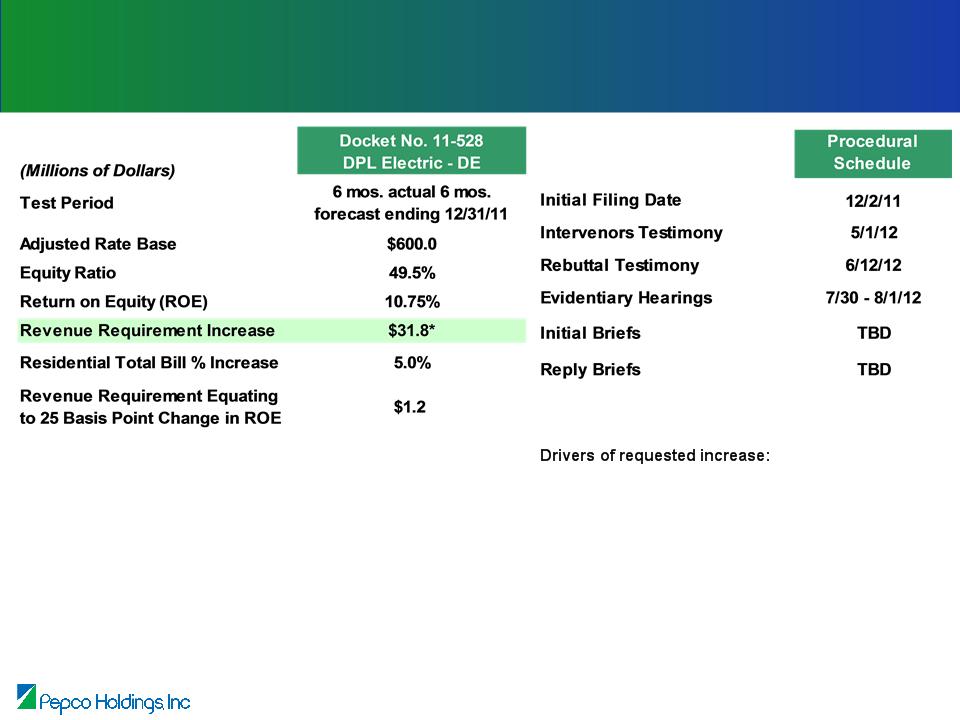
Distribution Rate Cases - Pending
Delmarva Power - Delaware Electric
Delmarva Power - Delaware Electric
Note: See Safe Harbor Statement at the beginning of today’s presentation.
• Rate base growth/reliability investments
• Increase in operating expenses
• Recovery of Hurricane Irene restoration expenses
• Customer service enhancements
• Increase in authorized ROE
• Under-earning currently authorized returns
Two regulatory lag mitigation measures proposed in filing:
•Reliability Investment Recovery Mechanism (RIM)
•Fully forecasted test periods
* As permitted by Delaware law, Delmarva Power implemented an interim rate increase of $2.5 million on
January 31, 2012, subject to refund.
January 31, 2012, subject to refund.

12
Distribution Rate Cases - Pending
Delmarva Power - Maryland
Delmarva Power - Maryland
Note: See Safe Harbor Statement at the beginning of today’s presentation.
• Rate base growth/reliability investments
• Increase in operating expenses
• Recovery of Hurricane Irene restoration expenses
• Customer service enhancements
• Increase in authorized ROE
• Under-earning currently authorized returns
Regulatory lag mitigation measures proposed in filing:
•Reliability Investment Recovery Mechanism (RIM)
•Fully forecasted test years
13
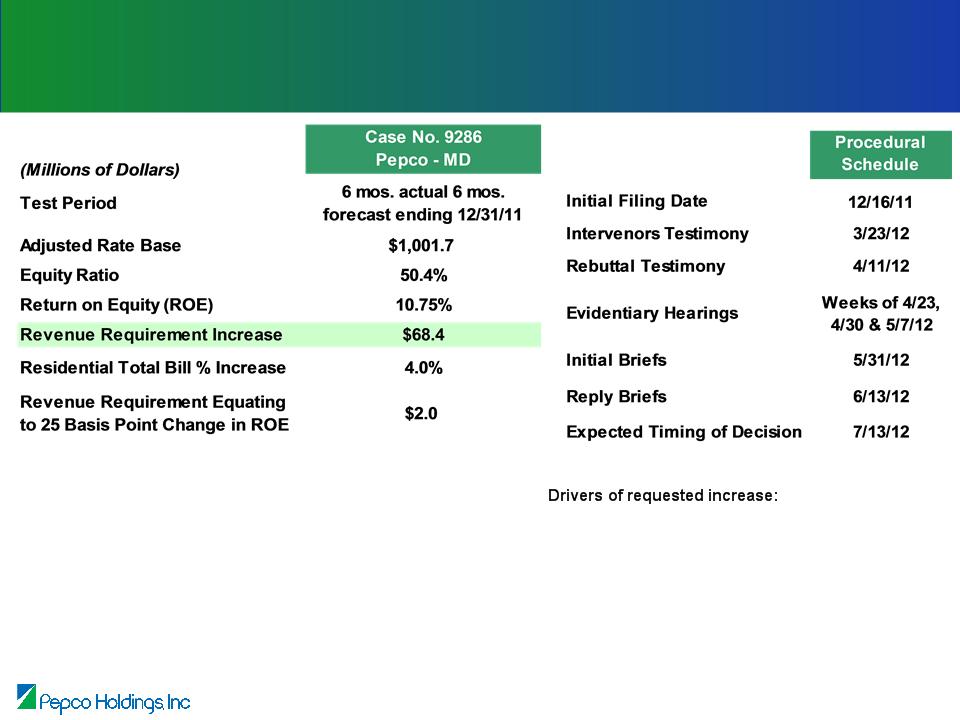
Distribution Rate Cases - Pending
Pepco - Maryland
Pepco - Maryland
Note: See Safe Harbor Statement at the beginning of today’s presentation.
• Rate base growth/reliability investments
• Increase in operating expenses
• Recovery of Hurricane Irene restoration expenses
• Customer service enhancements
• Increase in authorized ROE
• Under-earning currently authorized returns
Regulatory lag mitigation measures proposed in filing:
•Reliability Investment Recovery Mechanism (RIM)
•Fully forecasted test years

Pepco Energy Services
• Provider of retail energy services to large
government and institutional customers
government and institutional customers
• Energy Efficiency - leading developer of energy
efficiency projects; $1 billion of energy efficiency
projects completed since 1995
efficiency projects; $1 billion of energy efficiency
projects completed since 1995
• Combined Heat and Power (CHP)/Thermal -
develop, operate, and maintain CHP and thermal
energy plants
develop, operate, and maintain CHP and thermal
energy plants
• Renewable Energy - own and operate 12 MW of
renewable energy facilities
renewable energy facilities
• W.A. Chester - primarily underground high
voltage transmission construction for utilities
voltage transmission construction for utilities
• Energy Supply
– PES will substantially wind down the retail energy supply business by early 2013
– PES also owns two peaking power plants that are scheduled to retire in 2012
Note: See Safe Harbor Statement at the beginning of today’s presentation.
14
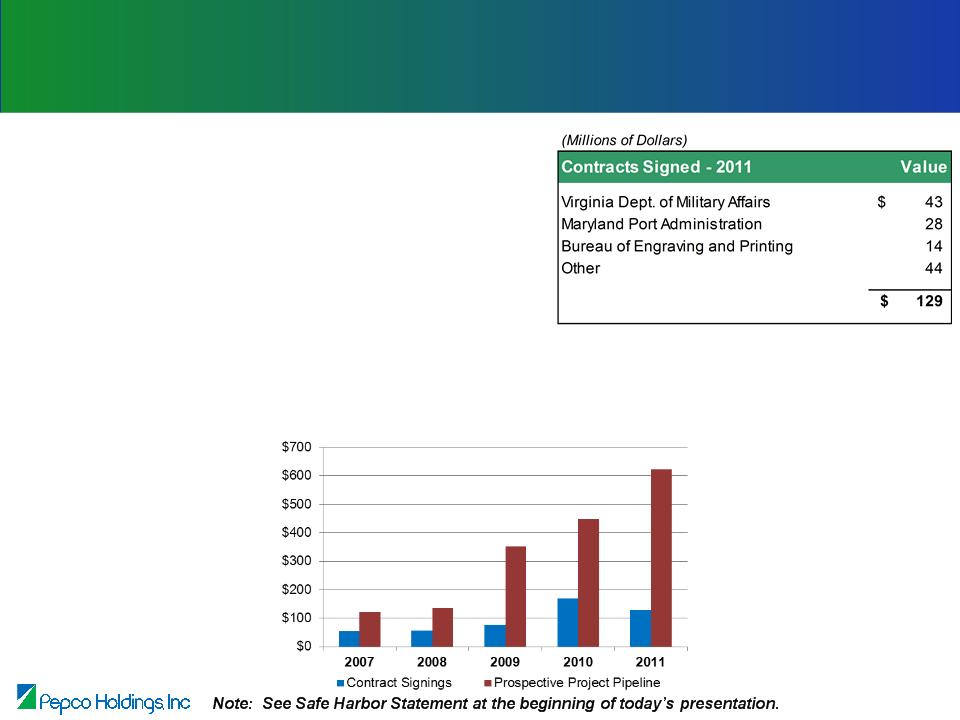
Pepco Energy Services -
Business Development and Marketing Update
Business Development and Marketing Update
• PES has signed $47 million of new energy efficiency
contacts in the fourth quarter of 2011 ($129 million in
2011)
contacts in the fourth quarter of 2011 ($129 million in
2011)
• Project development pipeline has grown to $622
million, up 38% since January 1, 2011
million, up 38% since January 1, 2011
• PES continues to grow its business development staff
• Economic environment slowed contract signings with
state and local governments in 2011
state and local governments in 2011
15
Contracts Signed and
Prospective Project Pipeline
(Millions of Dollars)

16
2012 Earnings Guidance
Earnings Per Share
$1.15 - $1.30
$1.25
The guidance range excludes:
• The results of discontinued operations and the impact of any special, unusual or extraordinary items
• The after tax net mark-to-market effects of economic hedging activities associated with the retail energy
supply business at Pepco Energy Services
supply business at Pepco Energy Services
The guidance range assumes/includes:
• Normal weather conditions
* See Appendix for reconciliation of GAAP earnings to adjusted earnings.
Note: See Regulation G Information at the beginning of today’s presentation.
17
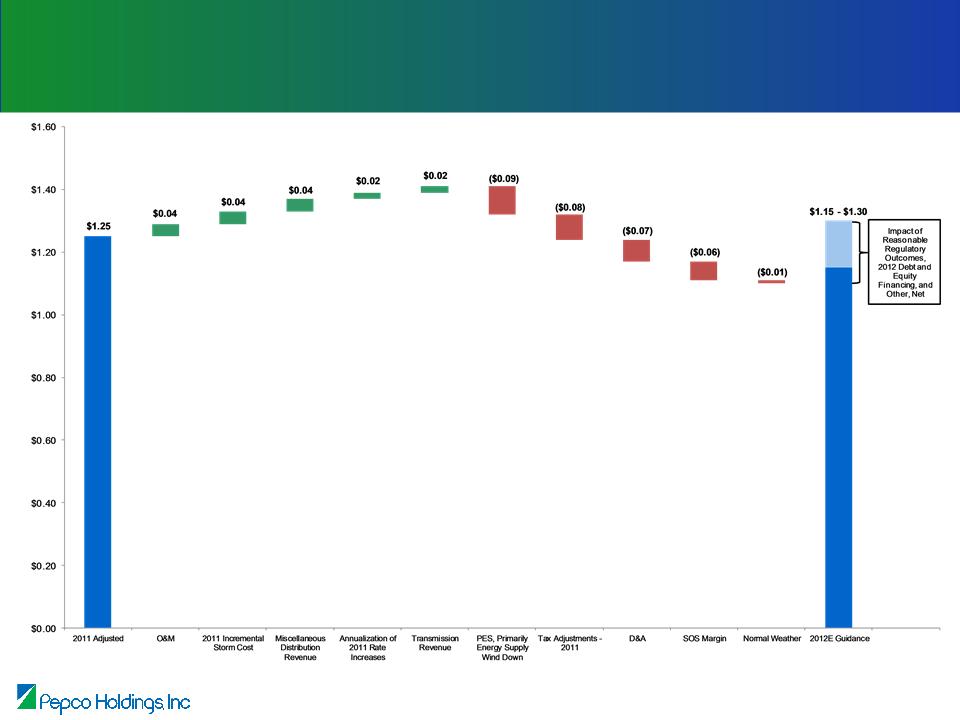
2012 Earnings Guidance (continued)
Earnings Per Share - 2011 Adjusted vs. 2012 Guidance
Note: See Regulation G Information at the beginning of today’s presentation.
*
* See Appendix for reconciliation of GAAP earnings to adjusted earnings.

Stable Dividend, Attractive Yield
• Indicated annual dividend of $1.08 per share supported by regulated utility
earnings
earnings
• Current dividend yield is 19% higher than the average dividend yield for
companies in the S&P 500 Electric Utilities
companies in the S&P 500 Electric Utilities
Attractive Dividend Yield
18
Note: See Safe Harbor Statement at the beginning of today’s presentation.

• Stable Earnings Base - Derived primarily from regulated utility business
• Long-term Earnings Growth - Driven by T&D utility infrastructure
investments and reasonable regulatory outcomes
investments and reasonable regulatory outcomes
• Financial Strength - Strong balance sheet, ample liquidity, solid
investment grade credit ratings
investment grade credit ratings
• Stable Dividend - Attractive current yield
• Experienced Team - Delivering on commitments
Investment Highlights
PHI - Well Positioned to Deliver Value
Note: See Safe Harbor Statement at the beginning of today’s presentation.
19

Appendix
21
2011 Earnings Per Share Guidance Range
$1.15 - $1.25
Note: See Regulation G Information at the beginning of today’s presentation.

22
Earnings Per Share Variance -
Twelve Months Ended December 31
Twelve Months Ended December 31
(1) The 2010 weighted average number of basic and diluted shares outstanding was 224 million.
(2) See prior slide for reconciliation of GAAP earnings to adjusted earnings.
(3) The effect of weather compared to the 20-year average weather is estimated to have increased earnings by $0.01 per share.
(4) The 2011 weighted average number of basic and diluted shares outstanding was 226 million.
Note: See Regulation G Information at the beginning of today’s presentation.

23
Capital Expenditures Forecast
Note: See Safe Harbor Statement at the beginning of today’s presentation.
(1) Reflects the remaining anticipated reimbursement pursuant to awards from the U.S. DOE under the ARRA.
(2) Installation of AMI in New Jersey is contingent on regulatory approval ($9 million in 2015, $92 million in 2016).
(3) Assumes MAPP in-service date of 2020.
24
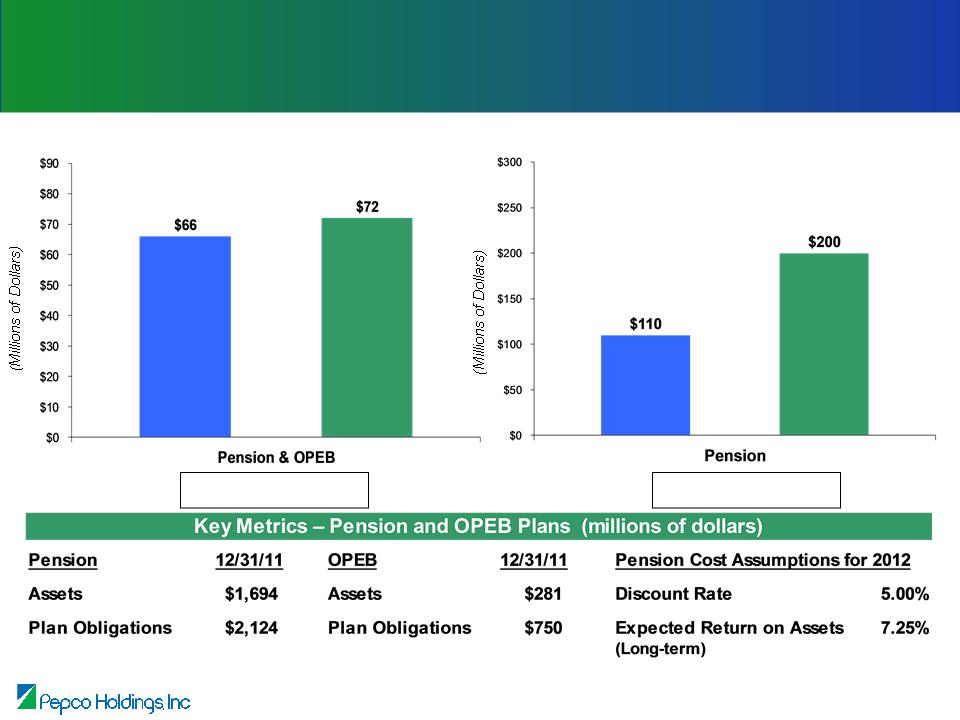
Pension and OPEB Impacts
Net Pension & OPEB Pre-Tax Expense (O&M)
Pension Cash Contributions
■ 2011A ■ 2012E
Note: See Safe Harbor Statement at the beginning of today’s presentation.
■ 2011A ■ 2012A

25
Reliability Standards - Maryland
• Following working group process and rule making hearings, Commission approved draft
rules establishing requirements for:
rules establishing requirements for:
– Service interruption duration and frequency standards
– Service restoration
– Poorest performing feeder and device activation standards
– Downed wire response
– Customer communications
– Vegetation management
– Equipment inspection
– Major Outage Event Plan
• First measurement period begins as soon as the regulations are adopted (expected to be
no later than July 1, 2012)
no later than July 1, 2012)
Maryland (PSC - RM43) - Rule making proceeding applying to all electric utilities in the state to
establish comprehensive reliability and service standards
establish comprehensive reliability and service standards

26
Reliability Standards - District of Columbia
• New rules require improvement in reliability performance (outage frequency and duration) on
an annual basis beginning in 2013 and continuing through 2020
an annual basis beginning in 2013 and continuing through 2020
• Revision to rules adopted by Commission in February 2012 to address certain issues raised
by Pepco in an application for reconsideration:
by Pepco in an application for reconsideration:
– Method to calculate reliability was revised to a manner reflecting District of Columbia-only data
– After June 2015, Pepco may petition the Commission to re-evaluate reliability standards for 2016-
2020 to address feasibility and cost issues
2020 to address feasibility and cost issues
District of Columbia - New reliability standards adopted in July 2011, further technical revisions
adopted February 2012
adopted February 2012

27
• Equity investment as of December 31, 2011 of $1.3 billion
• Annual tax benefits of $51 million
• Annual net earnings of $21 million
• Current Status:
– IRS audit settlement approved in November 2010 for the 2001/2002 periods; disallowed
net losses on the cross-border energy leases
net losses on the cross-border energy leases
– Paid $74 million of taxes, $1 million of penalties and $28 million of interest associated
with the 2001/2002 audit in 2011
with the 2001/2002 audit in 2011
– Filed a claim for refund of tax payment, interest and penalties with the IRS in July 2011
– Since the claim for refund was not approved by the IRS within the statutory six-month
period, complaints were filed in the U.S. Court of Federal Claims against the IRS in
January 2012 to resolve the issue and recover the tax payment, interest and penalties
period, complaints were filed in the U.S. Court of Federal Claims against the IRS in
January 2012 to resolve the issue and recover the tax payment, interest and penalties
– Absent a settlement, litigation will likely take several years to resolve
Cross-Border Energy Lease Status
Note: See Safe Harbor Statement at the beginning of today’s presentation.