Attached files
| file | filename |
|---|---|
| 8-K - FORM 8-K - Chesapeake Lodging Trust | d311629d8k.htm |
 Investor
Presentation March 2012
Exhibit 99.1 |
 Disclaimer
1
We make forward-looking statements in this presentation that are subject to risks and
uncertainties. These forward-looking statements include information about possible or assumed future results
of our business, financial condition, liquidity, results of operations, plans and objectives.
When we use the words “believe,” “expect,” “anticipate,” “estimate,” “plan,” “continue,” “intend,” “should,”
“may” or similar expressions, we intend to identify forward-looking statements.
Statements regarding the following subjects, among others, may be forward-looking by their nature: our business
and investment strategy, including our ability to identify suitable properties to acquire; our
forecasted operating results; completion of any pending transactions; projected capital expenditures; our
ability to obtain adequate debt or equity financing to complete acquisitions and to maintain
future financing arrangements; market trends in our industry, interest rates, real estate values, the debt
securities markets or the general economy; our expected leverage levels; our expectations
regarding future distributions to shareholders; and our expectations for economic trends and recoveries,
and the impact of those on the lodging industry generally and the market segments in which we
operate, in particular. The forward-looking statements are based on our
beliefs, assumptions and expectations of our future performance, taking into account all information currently available to us. You should not place
undue reliance on these forward-looking statements. These beliefs, assumptions and
expectations can change as a result of many possible events or factors, not all of which are known to us. If a
change occurs, our business, financial condition, liquidity and results of operations may vary
materially from those expressed in our forward-looking statements. Additionally, the following factors
could cause actual results to vary from our forward-looking statements:
changes in our business or investment strategy;
availability to us, and the terms of, capital for use in our future growth;
our ability to reach agreement with prospective sellers and acquire additional hotels on
favorable terms or at all; the extent to which the general U.S. or international
economy recovers, and the resultant effect on our industry and the market segments in which we operate;
the degree and nature of our competition;
availability of and our ability to retain qualified personnel;
our ability to maintain our qualification as a REIT;
general volatility of the capital markets and the market price of our common shares;
actions and initiatives of the U.S. government, changes to U.S. government policies and
the execution and impact of these actions, initiatives and policies; changes in
interest rates; and the other factors discussed in our Form 10-K filed with
the Securities and Exchange Commission on February 24, 2012, including those set forth under the sections titled “Risk factors” and
“Management’s discussion and analysis of financial condition and results of
operations.” Any forward-looking statement speaks only as of the date
on which it is made. Except as required by law, we are not obligated to, and do not intend to, publicly update or revise any forward-looking
statements, whether as a result of new information, future events or otherwise.
This presentation contains statistics and other data that has been obtained or compiled
from information made available by third-party service providers. |
 2
What Makes Us Different
Focused and disciplined acquisition strategy has built a portfolio with a significant
discount to replacement cost and strong current yields
Newly built or “like new”
hotels (renovated by previous owner) will drive upside
performance without meaningful execution risk
Additional growth from value-add, ROI projects in key hotels
Intense asset management with predominantly independent management
companies will continue to drive RevPAR gains and margin expansion
Well-located, urban portfolio will significantly outperform industry with EBITDA
concentration in the strongest U.S. markets with very limited new supply on the
horizon
Significant free cash flow from combination of strong balance sheet with modest
leverage and high-yielding assets translates into a meaningful and reliable dividend
|
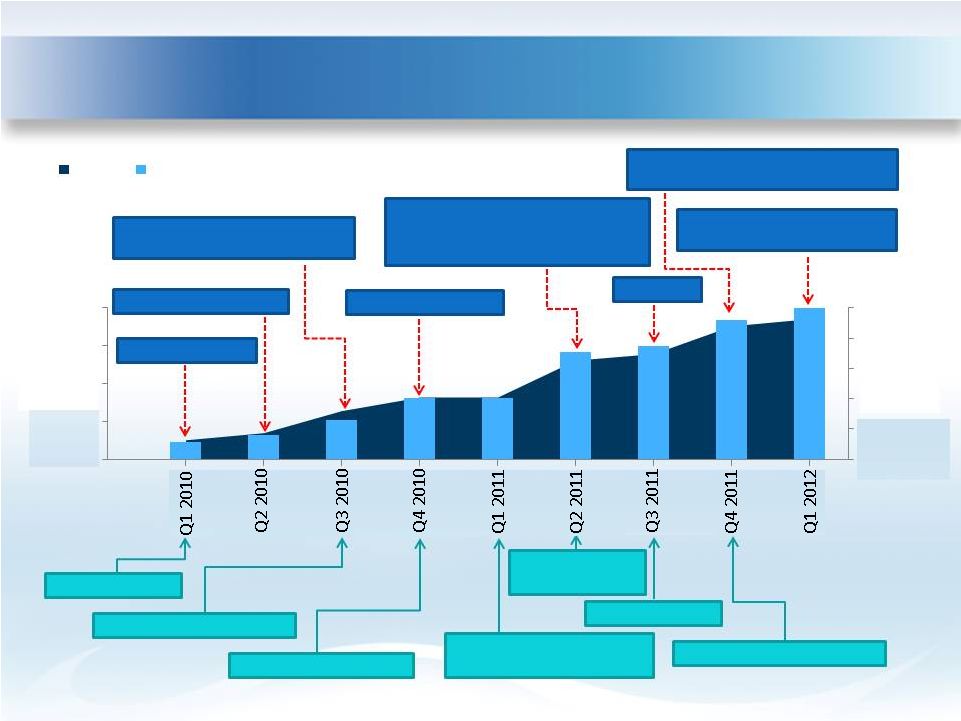 What We’ve
Done 3
$0
$200
$400
$600
$800
$1,000
0
1,000
2,000
3,000
4,000
Rooms
Invested Capital (Millions)
Hyatt Regency Boston
Hilton Checkers Los Angeles
Le Meridien
San Francisco
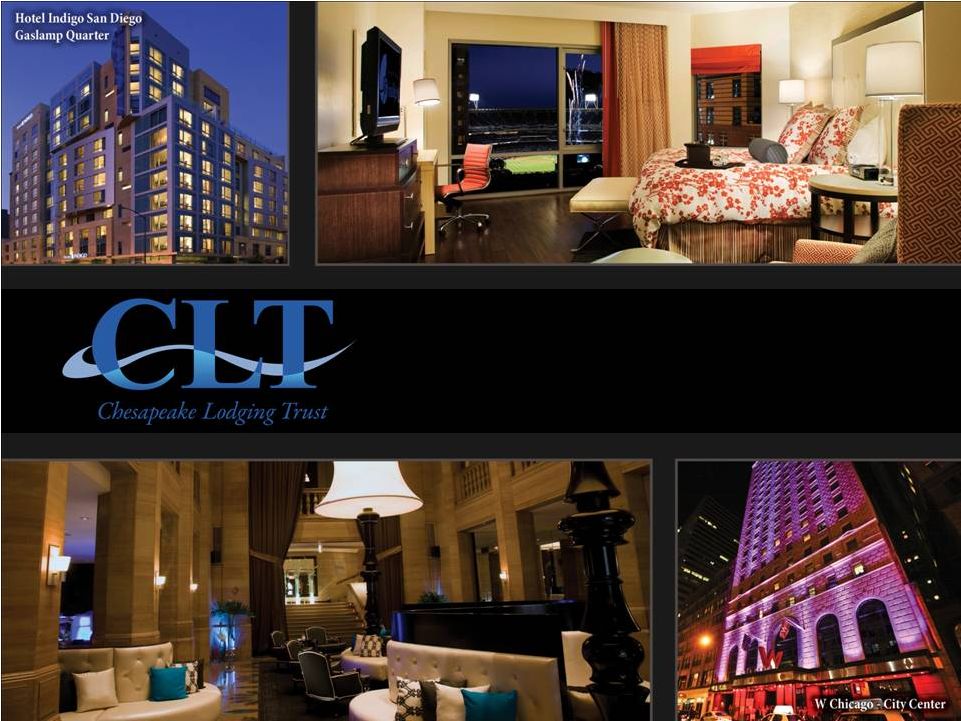
W
Chicago
-
City
Center
Homewood Suites Seattle Convention Center
Hotel Indigo San Diego Gaslamp Quarter
Courtyard Washington Capitol Hill/Navy Yard
Hotel
Adagio
Denver Marriott City Center
Holiday
Inn
New
York
City
Midtown
-
31
Street
st
IPO $169.4MM Net
Equity Raise $140.4MM Net
Secured Credit Facility $115.0MM
Amended Credit Facility
$150.0MM
Equity Raise $229.8MM Net
Amended Credit Facility $200.0MM
CMBS Loan $37.5MM
CMBS Loan $95.0MM
Term Loan $130.0MM
Boston Marriott Newton
Courtyard Anaheim at Disneyland Resort
Hyatt Place New York Midtown
South (Under Contract) |
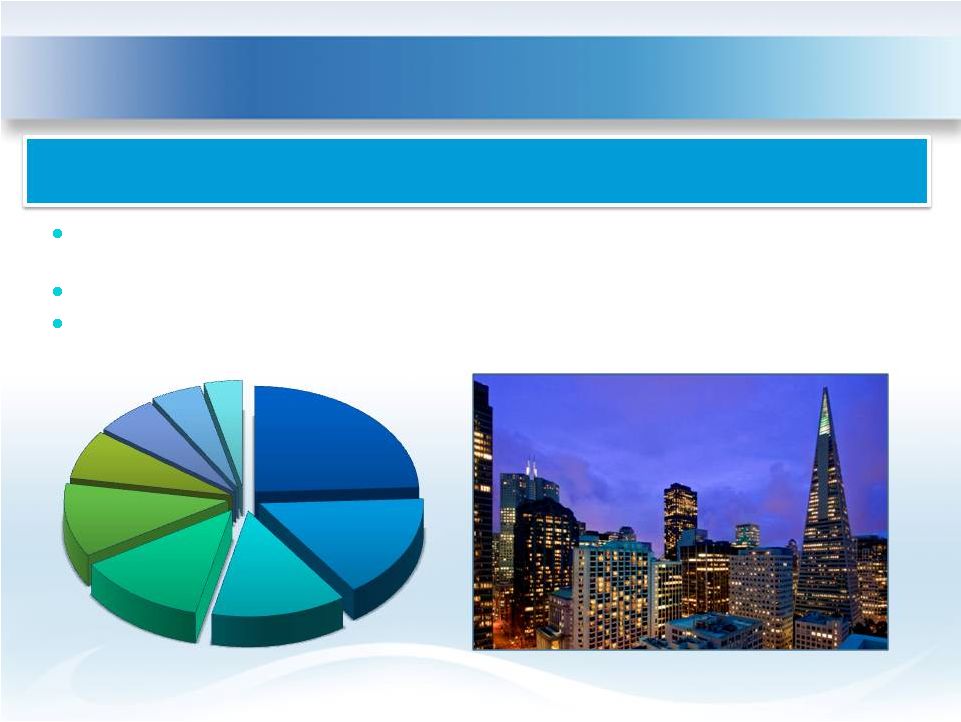
 Portfolio
Overview – Segmentation
4
Geographic
Boston
25%
San Francisco
14%
Denver
17%
Los Angeles
9%
NYC
8%
San Diego
6%
DC
6%
Seattle
5%
Chicago
10%
Marriott
38%
Starwood
20%
Hyatt
18%
Hilton
10%
IHG
9%
Independent
5%
Brand
Marriott
16%
Evolution
14%
Hyatt
13%
TPG
12%
Crestline
11%
HEI
10%
Starwood
10%
RHG
8%
IHG
6%
Management
Group
27%
Transient
69%
Contract
4%
Customer
Note: Geographic, brand and management segmentation based on room count and includes
CLT’s prospective acquisition of the Hyatt Place New York Midtown South. Customer
segmentation is based on room nights sold for the year ended December 31, 2011 for the 11 hotels as if owned for the
full
year
(excludes
Holiday
Inn
New
York
City
Midtown
–
31 Street
and
Hyatt
Place
New
York
Midtown
South).
st |
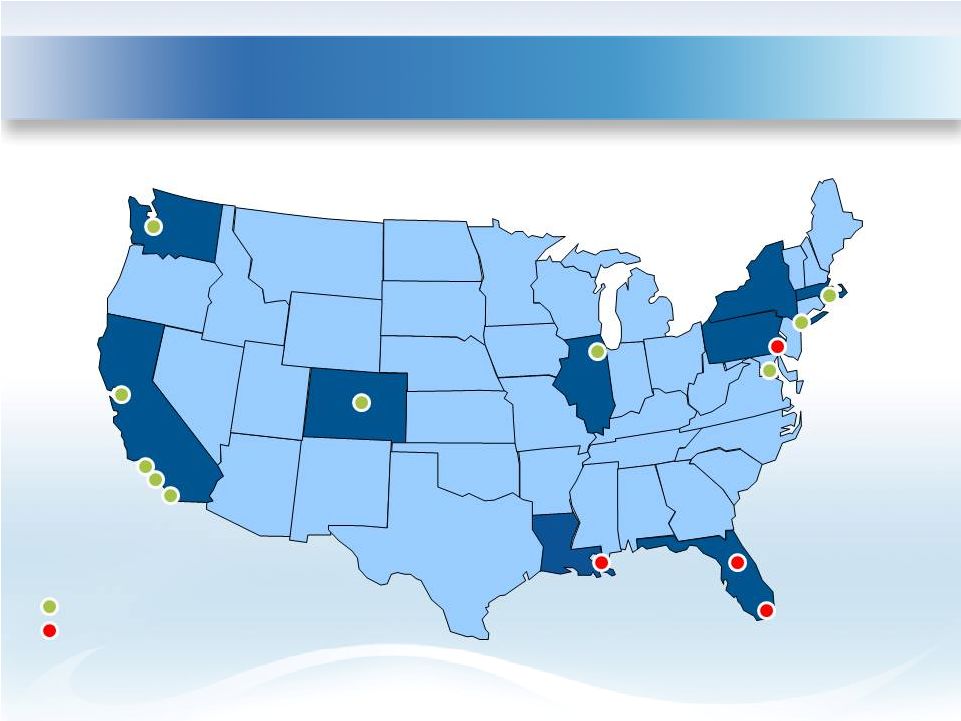 Portfolio
Overview – Top 15 Markets
5
Los Angeles
Seattle
San Francisco
San Diego
Denver
Chicago
DC
New York
Boston
Anaheim
Philadelphia
Orlando
Miami
New Orleans
CLT Top 15 Market
Other Top 15 Market
Note: Oahu Island, HI not shown. |
 Portfolio
Overview – Summary
6
______________________________
(1)
2011 Pro Forma
EBITDA
Yield
includes
operating
results
for
the
year
ended
December
31,
2011
as
if
owned
for
the
full
period.
For
the
Holiday
Inn
New
York City
Midtown –
31
Street and Hyatt Place New York Midtown South, 2011 Pro Forma EBITDA Yield is based on
projected first year EBITDA. (2)
Estimated replacement cost of the portfolio is $355,000 -
$375,000 per key.
st
Price
Price Per Key
2011 Pro Forma
Hotel
Location
Interest
Rooms
(Millions)
(Thousands)
EBITDA Yield
(1)
Hyatt Regency Boston
Boston, MA
Fee Simple
502
$112.0
$223.0
11.0%
Hilton Checkers Los Angeles
Los Angeles, CA
Fee Simple
188
46.0
245.0
8.5%
Boston Marriott Newton
Newton, MA
Fee Simple
430
77.3
180.0
10.0%
Courtyard Anaheim at Disneyland Resort
Anaheim, CA
Fee Simple
153
25.0
163.0
9.2%
Le Meridien San Francisco
San Francisco, CA
Fee Simple
360
143.0
397.0
7.2%
Homewood Suites Seattle Convention Center
Seattle, WA
Fee Simple
195
53.0
272.0
7.7%
W Chicago -
City Center
Chicago, IL
Fee Simple
368
128.8
350.0
7.2%
Hotel Indigo San Diego Gaslamp Quarter
San Diego, CA
Fee Simple
210
55.5
264.0
5.6%
Courtyard Washington Capitol Hill / Navy Yard
Washington, DC
Fee Simple
204
68.0
333.0
7.4%
Hotel Adagio
San Francisco, CA
Fee Simple
171
42.3
247.0
6.9%
Denver Marriott City Center
Denver, CO
Fee Simple/Ground Lease
613
119.0
194.0
8.8%
Holiday
Inn
New
York
City
Midtown-31
Street
st
New York, NY
Fee Simple
122
52.2
428.0
8.2%
Hyatt Place New York Midtown South
New York, NY
Fee Simple
185
76.2
412.0
8.8%
Portfolio
(2)
3,701
$998.2
$269.7
8.3% |
 Portfolio
Overview – Markets
Geographically diversified among the top producing markets in the country with over
50% of EBITDA concentrated in the top 5 markets
Urban locations minimize supply risk and offer numerous demand generators
Gateway markets provide balanced customer mix of domestic and international
travelers, corporate business and convention and group business
Strategically located properties in the strongest performing and
most desirable downtown
areas in the top U.S. markets
7
Le Meridien San Francisco
Note: Market
segmentation
based
on
pro
forma
EBITDA
for
the
year
ended
December
31,
2011,
which
includes
actual
operating
results
for
11
hotels
as
if
owned
for
the
full
year
and
projected
first
year
EBITDA
for
the
Holiday
Inn
New
York
City
Midtown
–
31
st
Street
and
Hyatt
Place
New York Midtown South.
Boston
24%
San Francisco
16%
NYC
13%
Denver
13%
Chicago
11%
Los Angeles
8%
DC
6%
Seattle
5%
San Diego
4% |
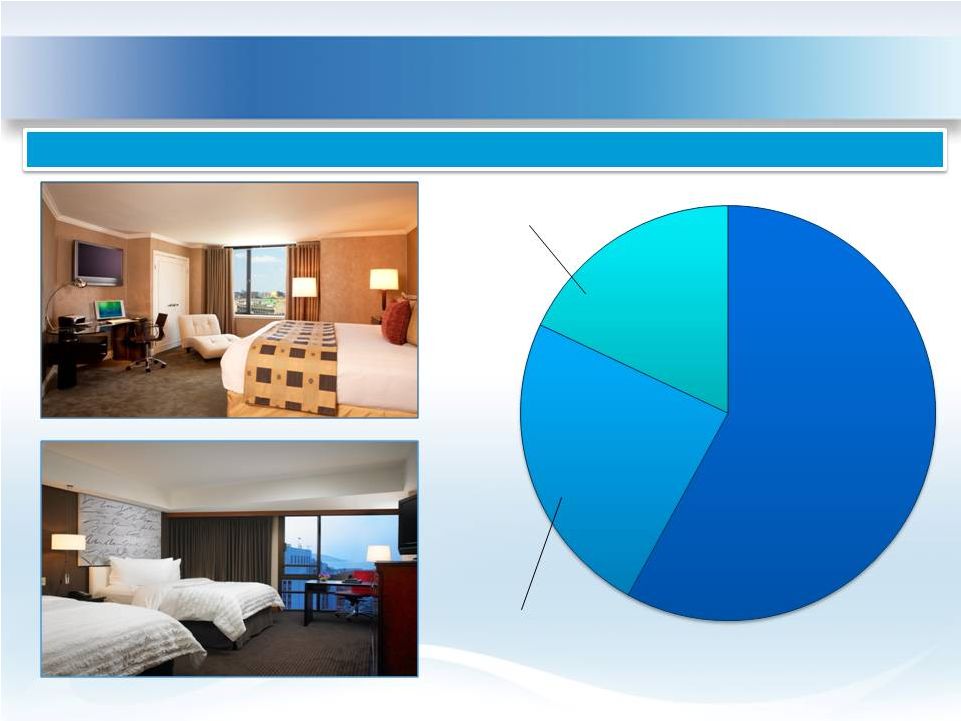
 Portfolio
Overview – Asset Quality
CLT’s assets are new construction or have
already been renovated to “like new”
product
Superior quality, well-maintained assets
mitigate downside risk
Substantial prior owner capital investment
positions assets for growth and eliminates
execution risk
24% of the portfolio is ground up
construction completed within the last six
years
8
W Chicago -
City Center
Hotel Indigo San Diego Gaslamp Quarter |
 Portfolio
Overview – Asset Quality
9
Hyatt Regency Boston
Le Meridien San Francisco
W Chicago -
City Center
Boston Marriott Newton
Denver Marriott City Center
Le Meridien San Francisco
Homewood Suites Seattle
Hilton Checkers Los Angeles
Courtyard Anaheim at Disneyland Resort
Hotel Indigo San Diego Gaslamp Quarter
Courtyard Washington Capitol Hill/Navy Yard
Holiday
Inn
New
York
City
Midtown-31
Street
Hyatt Place New York Midtown South
Note:
Based on room count.
58%
24%
18%
Prior Owner
Renovation
New Construction
Under
Renovation
Hotel Adagio (Full Repositioning)
Hyatt Regency Boston (Lobby & Bar)
st
82% of CLT’s portfolio is new or recently renovated “like new”
prior to acquisition |
      Portfolio Overview
– Prior Owner Invested Capital
CLT’s portfolio benefits from recent capital investment and renovations completed by
previous owners, providing attractive upside with minimal near-term capital needs
and operational disruption
10
Hotel
Prior Owner
Invested Capital
(Millions)
Scope
Completion
W Chicago - City Center
$30.8
Guestrooms and 4-pipe HVAC system, lobby,
restaurant, lounge, meeting space and public
spaces
2010
Boston Marriott Newton
22.0
Guestrooms and 4-pipe HVAC system, lobby,
restaurant, lounge, meeting space and exterior
2010
Denver Marriott City Center
13.7
Guestrooms, meeting space and public space
2010
Le Meridien San Francisco
9.9
Guestrooms, lobby and lounge
2009
Homewood Suites Seattle
Convention Center
9.2
Conversion to Homewood Suites brand,
guestrooms and public space
2008
Hilton Checkers Los Angeles
4.0
Guestrooms, meeting space, public space,
restaurant and lounge
2009
Total
$89.6
$41,600/Key of Prior Owner Invested Capital |
 Portfolio
Overview – Internal Growth Drivers
11
Several projects have been identified throughout the portfolio to drive incremental
growth and continued outperformance of the industry
______________________________
(1)
$8.5 million is expected to be funded through existing furniture, fixtures and equipment
(FF&E) or property improvement (PIP) reserves held by our hotel operators and
lenders. Hotel
Projects
Capital (Millions)
(1)
Est. Completion
Hotel Adagio
Renovation and repositioning
1,000 SF of additional meeting space
$6.9
Q3 2012
W Chicago -
City Center
21
st
and 22
nd
floor renovations
35 additional guestrooms
7.8
Q4 2012
Hyatt Regency Boston
Lobby, lobby lounge, presidential suite and meeting
space
renovation
4 additional guestrooms
3.8
Q1 2012
Le Meridien San Francisco
Lobby repositioning including expanded bar operation
3.6
Q3 2012
Denver Marriott City Center
Restaurant, lobby lounge and meeting space renovation
5,000 SF of additional meeting space
3.0
Q3 2012
Hilton Checkers Los Angeles
Presidential suite renovation, relocation of fitness center
and creation of the hotel's premiere penthouse suite
3 additional guestrooms
0.9
Q3 2012
Hotel Indigo Gaslamp Quarter
Creation of rooftop bar
0.5
Q2 2012
Holiday Inn New York City
Midtown-31
st
Street
Creation of rooftop bar
0.4
Q2 2012
Total
$26.9 |
 Hotel Adagio
Repositioning 12
Full repositioning of the Hotel Adagio including redesigned guestrooms, lobby, lounge,
restaurant and meeting space with a Q3 2012 expected completion date
Strong value creation from developing additional meeting space and shrinking the $40
per night rate gap with the market leader |
 W Chicago
– City Center Rooms Expansion
13
Conversion of the
vacant 21 and 22
floors to 35 new
guestrooms at an
estimated $220,000
per key cost with a
Q4 2012 expected
completion date
New guestrooms
will be significantly
larger than the
existing standard
rooms, commanding
rate premiums and
delivering an IRR of
approximately 20%
st
nd |
 Value-Add
Capital Projects 14
Hotel Indigo San Diego Gaslamp
Quarter –
Rooftop bar
Holiday Inn New York City Midtown-31
st
Street –
Rooftop bar |
 Hyatt
Regency Boston – Lobby, lobby lounge,
presidential suite and meeting space
renovation and four new guestrooms
Value-Add Capital Projects
15
Le Meridien San Francisco –
Lobby and lobby lounge
expansion and repositioning |
 Portfolio
Overview – Peer Comparison
16
78.1%
77.6%
77.6%
76.4%
75.2%
74.3%
72.6%
72.1%
72.0%
2011 Occupancy
$228
$203
$193
$180
$179
$175
$167
$164
$129
2011 ADR
Source:
Based
on
most
recent
company
press
releases
and
SEC
filings;
CLT
Portfolio
is
pro
forma
actual
for
11
hotels
as
if
owned
for
the
full
year
(excludes
Holiday
Inn
New
York
City
Midtown-31
st
Street
and
Hyatt
Place
New
York
Midtown
South);
and
CLT
Full
Service
is
pro
forma
actual
for
the
eight
full
service
hotels
as
if
owned
for
the
full
year
(excludes
Holiday
Inn
New
York
City
Midtown-31
st
Street). |
 Portfolio
Overview – Peer Comparison
17
$166
$159
$148
$139
$136
$130
$124
$123
$93
2011 RevPAR
12.7%
10.6%
10.3%
9.1%
7.2%
6.3%
6.2%
6.1%
5.2%
2011 RevPAR Change
Source:
Based
on
most
recent
company
press
releases
and
SEC
filings;
CLT
Portfolio
is
pro
forma
actual
for
11
hotels
as
if
owned
for
the
full
year
(excludes
Holiday
Inn
New
York
City
Midtown-31
st
Street
and
Hyatt
Place
New
York
Midtown
South);
and
CLT
Full
Service
is
pro
forma
actual
for
the
eight
full
service
hotels
as
if
owned
for
the
full
year
(excludes
Holiday
Inn
New
York
City
Midtown-31
st
Street). |
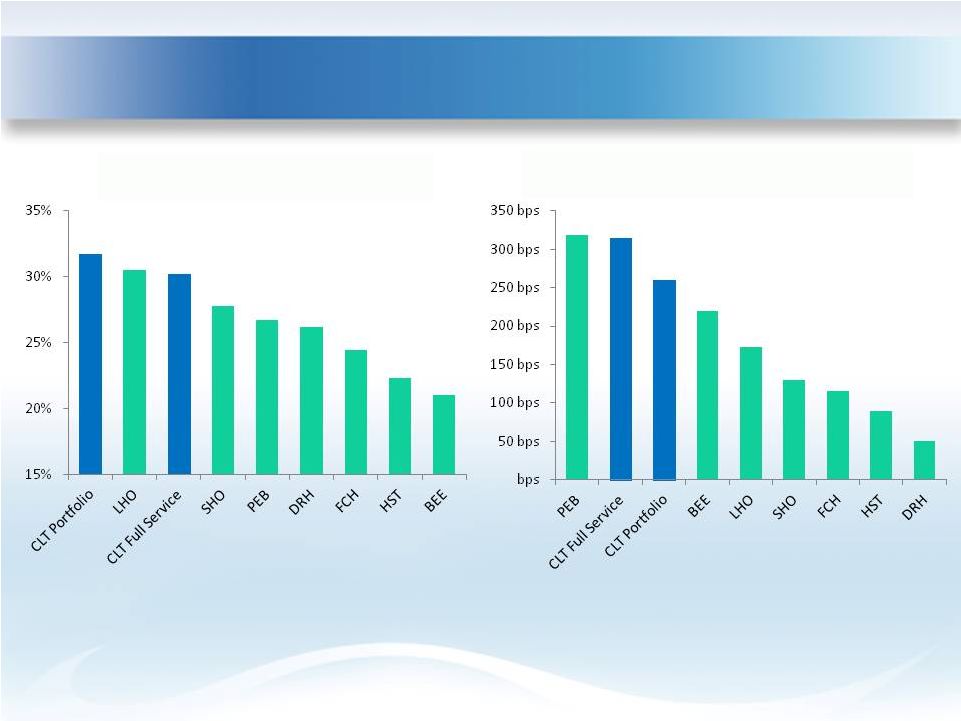 Portfolio
Overview – Peer Comparison
18
Source:
Based
on
most
recent
company
press
releases
and
SEC
filings;
CLT
Portfolio
is
pro
forma
actual
for
11
hotels
as
if
owned
for
the
full
year
(excludes
Holiday
Inn
New
York
City
Midtown-31
st
Street
and
Hyatt
Place
New
York
Midtown
South);
and
CLT
Full
Service
is
pro
forma
actual
for
the
eight
full
service
hotels
as
if
owned
for
the
full
year
(excludes
Holiday
Inn
New
York
City
Midtown-31
st
Street).
31.7%
30.5%
30.2%
27.8%
26.7%
26.2%
24.4%
22.3%
21.0%
2011 Hotel EBITDA Margin
318
315
260
220
173
130
116
90
51
2011 Hotel EBITDA Margin Change |
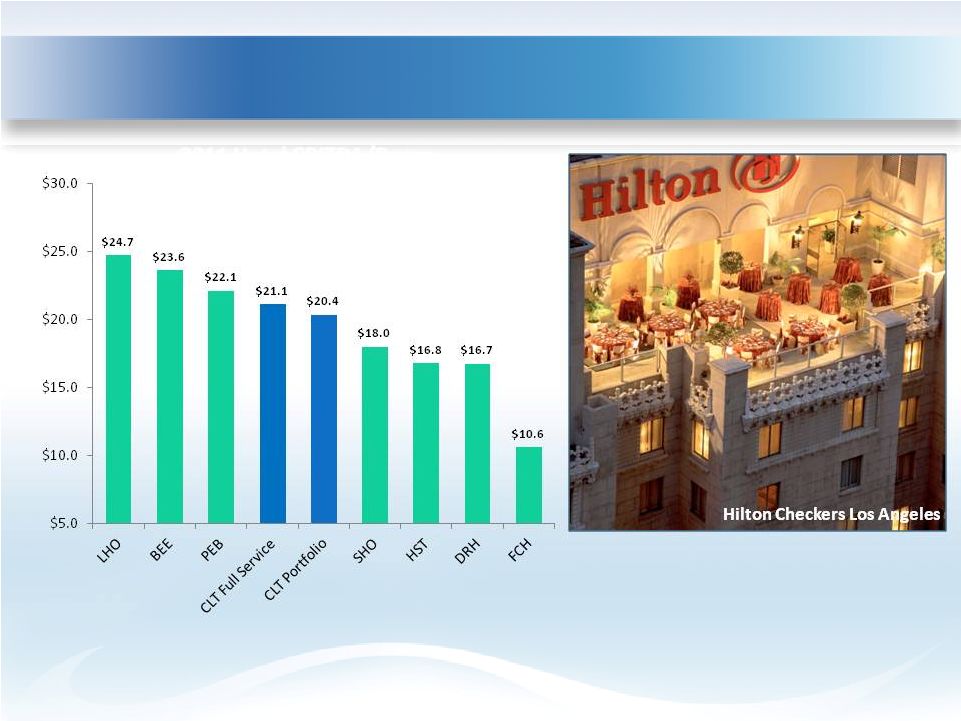 Portfolio
Overview – Peer Comparison
19
Source:
Based
on
most
recent
company
press
releases
and
SEC
filings;
CLT
Portfolio
is
pro
forma
actual
for
11
hotels
as
if
owned
for
the
full
year
(excludes
Holiday
Inn
New
York
City
Midtown-31
st
Street
and
Hyatt
Place
New
York
Midtown
South);
and
CLT
Full
Service
is
pro
forma
actual
for
the
eight
full
service
hotels
as
if
owned
for
the
full
year
(excludes
Holiday
Inn
New
York
City
Midtown-31
st
Street).
2011 Hotel EBITDA/Room
(Thousands) |
 Acquisition
Strategy 20
Market
Asset
Brand
Return
Urban, Central Business District/Downtown locations in the top 15 MSAs
with high barriers-to-entry and superb positioning proximate to the
market’s strongest demand generators
Current focus markets are Miami, Chicago and Los Angeles where CLT has
limited or no exposure
Upper-upscale, full-service hotels that are either new construction or have
been renovated to “like new”
condition
Under positioned or branded assets with material upside through capital
investment will be cautiously targeted
On a limited basis, premium select-service hotels in Central Business
District/Downtown or unique locations
Longstanding and deep partnerships with the world’s most recognized and
respected brands including: Hyatt Hotels, Marriott International, Starwood
Hotels & Resorts Worldwide, Hilton Worldwide and InterContinental Hotels
Group
Investment focus on generating immediate returns for shareholders with
strong in-place cash-on-cash yields, below replacement cost pricing,
conservative cash flow growth expectations producing 5-year, unleveraged
IRRs in the 10%-11% range utilizing responsible exit cap rates and significant
remaining upside |
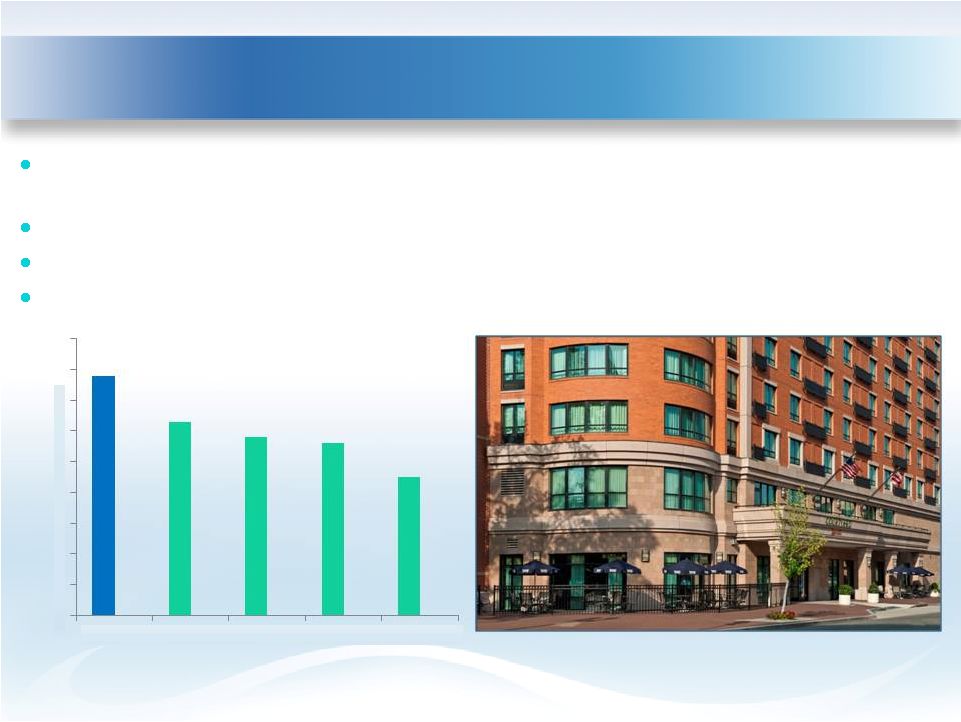
 Long-Term
Debt 21
Clean balance sheet with no legacy issues
Prudent use of leverage that fits with
lodging industry’s cyclical and volatile
nature and debt structure is designed to
provide capacity and flexibility
Appropriate use of debt based on the
following considerations:
Balance mix of short-term vs. long-term to
stagger maturities
Proper mix of fixed vs. variable rate debt
given current interest rate environment
Expectations/timing regarding stabilization
of hotel cash flows
Lowest average cost of borrowing
compared to publicly traded lodging REIT
peers
Denver Marriott City Center |
 Long-Term
Debt 22
(1)
Leverage and Fixed Charge Coverage are calculated as defined under our revolving credit
facility. As of 12/31/2011
(1)
Leverage
43%
Fixed Charge Coverage
3.1x
Weighted Avg. Rate
4.5%
$0.0
$0.0
$275.0
$0.0
$131.7
$0.0
$0
$100
$200
$300
2012
2013
2014
2015
2016
2017
Debt Maturities
(Millions)
Floating
Rate Debt
36%
Fixed
Rate Debt
64%
Debt Structure
Weighted Avg. Rate
5.0%
Weighted Avg. Rate
3.6% |
 Long-Term
Debt – Peer Comparison
23
Low leveraged company with the lowest cost of borrowing among peers
Note:
Weighted average cost of borrowing includes cost of debt and preferred equity.
Source:
Most recent company SEC filings and R.W. Baird. Trailing 12 month fixed charge coverage as of
December 31, 2011. Trailing 12 Month Fixed Charge
Coverage
Weighted Average Cost of
Borrowing |
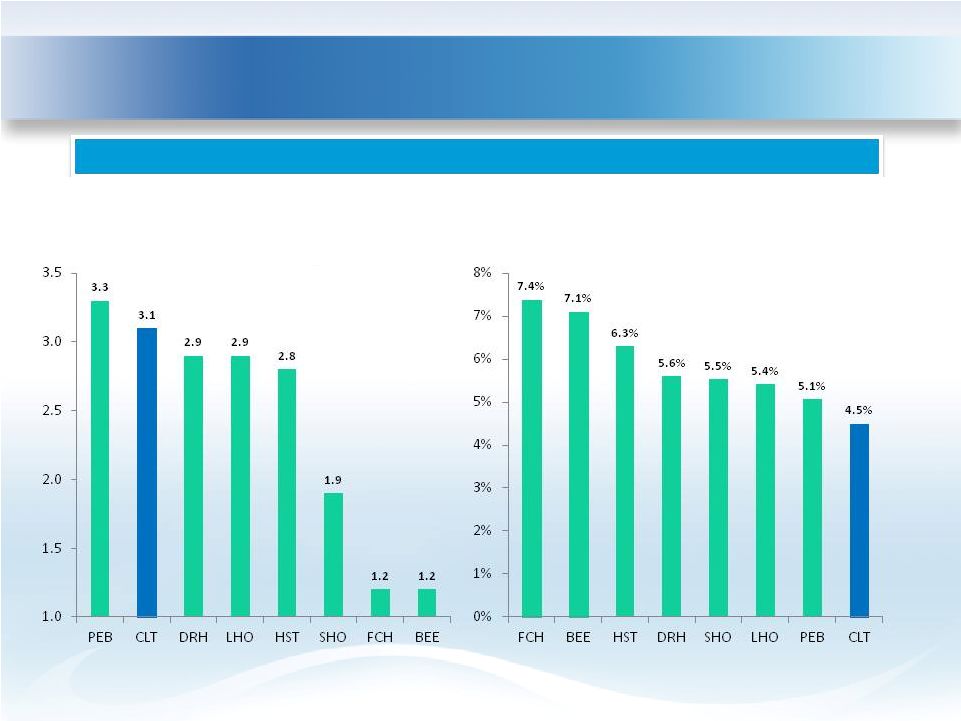
 Dividend
– Overview
24
Acquisition of hotels with strong going-in yields has allowed CLT to distribute
significant free cash flows to shareholders and pay a recurring and consistent
dividend Increased dividend by 10% to $0.22 per share in Q1 2012 (5% annualized
yield) One of the highest dividend yields amongst lodging REITs
Well covered dividend and targeted 70% -
75% payout of cash available for distribution
Source:
Based
on
most
recent
company
press
releases
and
SEC
filings;
CLT
is
based
on
2011
Pro
Forma
AFFO
(see
Exhibit
1
to
this
presentation
for
reconciliation of this non-GAAP financial measure). AFFO Yield is calculated as AFFO as a
percentage of market capitalization as of March 1, 2012. Courtyard Washington Capitol
Hill / Navy Yard 7.8%
6.3%
5.8%
5.6%
4.5%
0%
1%
2%
3%
4%
5%
6%
7%
8%
9%
CLT
DRH
HST
LHO
PEB
2011 AFFO Yield |
 st
2012 Outlook
25
___________________________________
(1)
2011 Pro Forma includes actual operating results for 11 of the 12 hotels owned as of December
31, 2011 as if owned for the full year and includes projected first year
results
for
the
Holiday
Inn
New
York
City
Midtown
-
31
Street.
(2)
See Exhibit 1 to this presentation for reconciliation of non-GAAP financial
measures. (Millions, except per share)
2011
2011
2012
Actual
Pro Forma
(1)
Guidance
Pro Forma RevPAR Change
9.1%
6.5% - 8.5%
Total Revenue
$172.2
$233.3
$251.9 - $256.9
Adjusted Hotel EBITDA
(2)
$56.0
$74.7
$82.3 - $85.6
Adjusted Hotel EBITDA Margin
(2)
32.5%
32.0%
32.7% - 33.3%
AFFO
(2)
$32.7
$44.5
$49.6 - $52.5
AFFO/Share
$1.11
$1.40
$1.55 - $1.64 |
 Favorable
Valuation 26
____________________________
(1)
Enterprise value based on pro forma debt and market capitalization as of March 1, 2012.
Based on current multiples of primary peers, CLT’s 2012 guidance implies approximate
trading value of $21.00 to $23.00 per share
CLT’s approximate 9% 2012 EBITDA yield on hotel investments represents a significant
discount to current transaction cap rates
CLT’s current valuation
(1)
indicates the portfolio is trading at approximately $280,000
per key, or only a 4% premium over its cost basis of $270,000 per key
CLT’s current valuation
(1)
indicates the portfolio is trading at a 21% to 25% discount to
estimated replacement cost of $355,000 to $375,000 per key
CLT currently trading at favorable valuation relative to peers amidst strong expected
performance and attractive acquisitions to date |
 27
What Makes Us Different
Well-located, urban portfolio will significantly outperform industry with EBITDA
concentration in the strongest U.S. markets with very limited new supply on the
horizon
Newly built or “like new”
hotels (renovated by previous owner) will drive upside
performance without meaningful execution risk
Additional growth from value-add, ROI projects in key hotels
Intense asset management with predominantly independent management
companies will continue to drive RevPAR gains and margin expansion
Focused and disciplined acquisition strategy has built a portfolio with a significant
discount to replacement cost and strong current yields
Significant free cash flow from combination of strong balance sheet with modest
leverage and high-yielding assets translates into a meaningful and reliable dividend
|
 28
|
 29
Exhibit 1 –
Non-GAAP Financial Measure Reconciliation
___________________________________
(1)
2011 Pro Forma includes actual operating results for 11 of the 12 hotels owned as of December
31, 2011 as if owned for the full year and includes projected first year
results
for
the
Holiday
Inn
New
York
City
Midtown
-
31
Street.
(2)
Includes non-cash amortization of ground lease asset, deferred franchise costs, and
unfavorable contract liability. (3)
Includes non-cash amortization of ground lease asset, deferred franchise costs,
unfavorable contract liability, and air rights contract. Note: Amounts
in
millions,
except
per
share
amounts,
and
may
not
sum
due
to
rounding.
Margins
and
per
share
amounts
are
calculated
on
amounts
before
rounding.
2011 Pro
2012 Guidance
2011 Actual
Forma
(1)
Low
High
ADJUSTED
HOTEL
EBITDA
AND
ADJUSTED
HOTEL
EBITDA
MARGIN:
Total revenue
$ 172.2
$
233.2
$ 251.9
$
256.9 Less:
Total hotel operating expenses
116.1
158.5
169.3
171.0
Hotel EBITDA
56.1
74.7
82.6
85.9
Less:
Non-cash
amortization
(2)
(0.1)
-
(0.3)
(0.3)
Adjusted Hotel EBITDA
$
56.0
$
74.7
$
82.3
$
85.6 Adjusted Hotel EBITDA Margin
32.5%
32.0%
32.7%
33.3%
AFFO:
Net income available to common shareholders
$
8.8
$
11.2
$
19.2
$
22.1 Add:
Depreciation and amortization
18.4
27.7
27.7
27.7
FFO available to common shareholders
27.2
38.9
46.9
49.7
Add:
Hotel acquisition costs
5.1
5.1
2.5
2.5
Non-cash
amortization
(3)
0.5
0.5
0.2
0.2
AFFO available to common shareholders
$
32.7
$
44.5
$
49.6
$
52.5 AFFO per diluted common share
$
1.11
$
1.40
$
1.55
$
1.64 Weighted-average number of diluted common shares outstanding
29.4
31.8
31.9
31.9
st |