Attached files
Table of Contents
UNITED STATES SECURITIES AND EXCHANGE COMMISSION
Washington, D.C. 20549
FORM 10-K
| x | ANNUAL REPORT PURSUANT TO SECTION 13 OR 15(d) OF THE SECURITIES EXCHANGE ACT OF 1934 |
For the fiscal year ended December 31, 2011
or
| ¨ | TRANSITION REPORT PURSUANT TO SECTION 13 OR 15(d) OF THE SECURITIES EXCHANGE ACT OF 1934 |
For the transition period from to
Commission File Number 000-50857
Volterra Semiconductor Corporation
(Exact name of registrant as specified in its charter)
| Delaware | 94-3251865 | |
| (State or other jurisdiction of incorporation or organization) | (I.R.S. Employer Identification No.) |
47467 Fremont Blvd.
Fremont, CA 94538
(Address of principal executive offices, including zip code)
(510) 743-1200
(Registrant’s telephone number, including area code)
Securities registered pursuant to Section 12(b) of the Act:
| Title of Each Class |
Name of Each Exchange on Which Registered | |
| Common Stock, $0.001 par value per share | Nasdaq Global Select Market |
Securities registered pursuant to Section 12(g) of the Act:
None
Indicate by check mark whether the registrant is a well-known seasoned issuer, as defined in Rule 405 of the Securities Act. Yes ¨ No x
Indicate by check mark whether the registrant is not required to file reports pursuant to Section 13 or Section 15(d) of the Act. Yes ¨ No x
Indicate by check mark whether the registrant (1) has filed all reports required to be filed by Section 13 or 15(d) of the Securities Exchange Act of 1934 during the preceding 12 months (or for such shorter period that the registrant was required to file such reports) and (2) has been subject to such filing requirements for the past 90 days. Yes x No ¨
Indicate by check mark whether the registrant has submitted electronically and posted on its corporate Web site, if any, every Interactive Data File required to be submitted and posted pursuant to Regulation S-T during the preceding 12 months (or such shorter period that the registrant was required to submit and post such files). Yes x No ¨
Indicate by check mark if disclosure of delinquent filers pursuant to Item 405 of Regulation S-K is not contained herein, and will not be contained, to the best of registrant’s knowledge, in definitive proxy or information statements incorporated by reference in Part III of this Form 10-K or any amendment to this Form 10-K. ¨
Indicate by check mark whether the registrant is a large accelerated filer, an accelerated filer, a non-accelerated filer, or a smaller reporting company. (See definition of “large accelerated filer,” “accelerated filer,” and “smaller reporting company” in Rule 12b-2 of the Exchange Act).
| Large accelerated filer ¨ |
Accelerated filer x |
Non-accelerated filer ¨ |
Smaller reporting company ¨ | |||
| (Do not check if a smaller reporting company) |
Indicate by check mark whether the registrant is a shell company (as defined in Rule 12b-2 of the Exchange Act. Yes ¨ No x
The aggregate market value of the voting stock held by non-affiliates of the registrant based upon the closing price of the common stock listed on the Nasdaq Global Select Market on June 30, 2011, the last business day of the registrant’s most recently completed second quarter, was $410,305,139 based on a closing price of $24.66 per share. Shares of the registrant’s common stock held by current executive officers and directors and by each person known by the registrant to own 5% or more of the outstanding common stock have been excluded from this computation in that such persons may be deemed to be affiliates of the registrant. Share ownership information for certain persons known by the registrant to own greater than 5% of the outstanding common stock for purposes of the preceding calculation is based solely on information on Schedule 13G filed with the Commission. This determination of affiliate status is not a conclusive determination for other purposes.
As of January 31, 2012, there were 25,072,011 shares of the registrant’s common stock outstanding.
DOCUMENTS INCORPORATED BY REFERENCE
Portions of the registrant’s definitive Proxy Statement for the 2012 Annual Meeting of Stockholders to be filed with the Securities and Exchange Commission pursuant to Regulation 14A not later than 120 days after the end of the fiscal year covered by this Form 10-K, are incorporated by reference in Part III, Items 10-14 of this Form 10-K.
Table of Contents
VOLTERRA SEMICONDUCTOR CORPORATION
ANNUAL REPORT ON FORM 10-K
FOR THE FISCAL YEAR ENDED DECEMBER 31, 2011
Table of Contents
Cautionary Note Regarding Forward-Looking Statements
This annual report on Form 10-K contains forward-looking statements that involve many risks and uncertainties. These statements relate to future events and our future performance and are based on current expectations, estimates, forecasts and projections about the industries in which we operate and the beliefs and assumptions of our management. In some cases, you can identify forward-looking statements by terms such as “would,” “could,” “may,” “will,” “should,” “expect,” “intend,” “plan,” “anticipate,” “believe,” “estimate,” “predict,” “potential,” “target,” “seek,” or “continue,” the negative of these terms, or other variations of such terms. In addition, any statements that refer to projections of our future financial performance, our anticipated growth and trends in our business and other characterizations of future events or circumstances, are forward-looking statements. These statements are only predictions based upon assumptions made that are believed to be reasonable at the time, and are subject to risk and uncertainties. Therefore, actual events or results may differ materially and adversely from those expressed in any forward-looking statement. In evaluating these statements, you should specifically consider the risks described under Item 1A “Risk Factors” and elsewhere in this Form 10-K. These factors may cause our actual results to differ materially from any forward-looking statements. Except as required by law, we undertake no obligation to publicly update or revise any forward-looking statements, whether as a result of new information, future events or otherwise.
| Item 1. | Business |
We design, develop, and market proprietary, high-performance analog and mixed-signal power management semiconductors for the computing, storage, networking, and consumer markets. Our products are integrated voltage regulator semiconductors, integrated power protection and distribution semiconductors, and scalable voltage regulator semiconductor chipsets that transform, regulate, deliver, and monitor the power consumed by digital semiconductors. Through our proprietary power system architecture and mixed-signal design techniques, we have integrated power, analog, and digital circuits onto a single complementary metal oxide silicon, or CMOS, semiconductor, thereby eliminating the need for a large number of discrete components required by conventional power management solutions.
Analog and Mixed-Signal Semiconductor Market
Semiconductor components are the building blocks of electronic systems. Semiconductors are generally classified as either “digital” or “analog.” Digital semiconductors, such as microprocessors, graphics processors, digital signal processors, and memory, are used to process and store data in a binary format, using electrical signals to represent the binary digits, “1” and “0.” Analog semiconductors, such as voltage regulators and temperature sensors, monitor, regulate, or transform physical properties, including voltage, current, temperature, pressure, weight, light, sound or speed, using electrical signals that have a continuous range of values. Electronic systems rely on analog semiconductors to provide the interface between digital semiconductors and the physical world. Mixed-signal semiconductors combine elements of both analog and digital semiconductors, but are generally classified as analog semiconductors because of their analog content.
The market for analog and mixed-signal semiconductors differs from the digital semiconductor market in several significant respects. Digital semiconductors provide processing functions in electronic systems and are therefore often optimized for a particular application or market. Analog and mixed-signal semiconductors are often used in a wider variety of applications and markets where different users have unique requirements regarding performance specifications such as size, speed, accuracy, and efficiency. As a result, the analog and mixed-signal semiconductor market is highly fragmented, providing smaller companies an opportunity to compete successfully against larger suppliers in many market segments. Analog and mixed-signal semiconductors also generally have longer product life cycles than digital semiconductors. The market for digital semiconductors is usually characterized by rapid design cycles and shorter product life cycles. In addition, while digital semiconductors typically gain the performance benefit of leading-edge manufacturing process
1
Table of Contents
technologies, analog and mixed-signal semiconductor companies typically benefit from lower capital requirements through the use of more mature manufacturing process technologies that provide higher yields and generally more favorable manufacturing costs. Analog and mixed-signal semiconductor design has traditionally been more dependent on individual design engineers with specialized training and experience to design complex and proprietary analog and mixed-signal semiconductors to give a company and its products a competitive advantage.
Moore’s Law, which refers to the observation that the number of transistors per semiconductor doubles every 18 months, is facilitating the development of faster and more complex digital semiconductors at prices which allow their proliferation in a broad variety of electronic systems. As digital semiconductors become more advanced, the analog and mixed-signal semiconductors that interface with them must also operate with greater speed, accuracy, and efficiency. These factors, coupled with growth in the electronic equipment markets, are driving growth in the analog and mixed-signal semiconductor market.
Power Management Semiconductor Market
Every digital semiconductor requires power to operate. This power is delivered by one or more analog semiconductors known as power management semiconductors. These power management semiconductors transform, regulate, and monitor power throughout electronic systems. Advances in digital semiconductors require power management solutions with greater speed, accuracy, and efficiency. In addition, the demand for smaller electronic devices is driving the need for power management solutions that deliver increased performance but are smaller in size. At the same time, the increased complexity of electronic systems is causing electronic system producers to adopt a distributed system power architecture that requires a larger number of power management semiconductors to meet the varied power requirements throughout the system. We believe these trends exist across multiple electronic equipment markets and are driving demand for greater quantities of more sophisticated power management solutions, and we believe our products have the features and technological advantages to meet and address this demand.
As Moore’s Law suggests, the size of each transistor is decreasing as the number of transistors per semiconductor continues to increase. Smaller transistors generally require lower operating voltages that must be delivered with greater accuracy. At the same time, semiconductors are operating at faster speeds to achieve higher performance levels. More transistors and higher speeds generally require higher current and a more dynamic power supply. This means new power management solutions must be capable of supporting lower voltages with improved accuracy, higher currents, and faster dynamic response.
Today, high-performance computing, storage, and networking systems use advanced digital semiconductors with greater processing power and therefore require more sophisticated power management solutions. However, with advances in manufacturing process technology, more advanced digital semiconductors can be offered at lower prices and, therefore, are being used in a wider variety of higher-volume applications, such as consumer electronic devices that incorporate audio, image, video and data processing, and wireless communication capabilities. As a result, a broader variety of electronic equipment will require new power management solutions.
Our Solution
Our proprietary, high-performance analog and mixed-signal power management semiconductors target the computing, storage, networking, and consumer markets where power management requirements are particularly challenging. The benefits of our solution to our customers include:
| • | Small Form Factor. Our proprietary system architecture integrates the functions of controllers, power transistors, and drivers found in conventional solutions and significantly reduces the quantity and size of the remaining external components, such as inductors and capacitors; |
| • | High Performance. Our power management solutions are designed to meet or exceed the demanding power requirements of advanced digital semiconductors in a cost-competitive manner; |
2
Table of Contents
| • | Complete System-Level Solutions. Our highly-integrated products, extensive reference designs and system-level applications expertise enable our customers to incorporate our solutions into electronic systems quickly and easily; |
| • | Scalability. Our solutions are scalable and reduce the complexity, time and cost of system design for our customers; and |
| • | System Management. Our solutions provide system-level monitoring and control capabilities. |
While we believe that we compete favorably in the markets we serve, we face a variety of challenges as our competitors attempt to maintain or gain market share. New technologies may be developed to compete with our products, or our competitors may try to take advantage of the fact that they may have greater name recognition or greater resources than we do. In order to continue to grow our business, we must continue to develop new and innovative product offerings, provide high quality and reliable products, attract and retain qualified engineers, provide superior customer support and be able to manage our operations in an efficient and cost effective manner.
Our Strategy
We are a leading provider of high-performance, highly-integrated analog and mixed-signal power management solutions in the computing, storage, networking, and consumer markets and look to strengthen our market position by pursuing the following strategies:
| • | Extend Our Technology. We will continue to develop leading-edge power management technology by enhancing our proprietary power system architecture and advancing our analog and mixed-signal and system-level design capabilities; |
| • | Expand Our Presence in Our Existing Markets and Enter into New Markets. We will continue providing power management solutions in our current markets and in new markets where power management is critical; |
| • | Focus on Strategic Customers. We focus on developing relationships with strategic customers that are leaders in their respective markets; |
| • | Build Relationships with Leading Developers of Advanced Digital Semiconductors. We will continue building relationships with leading developers of advanced digital semiconductors that are driving demand for new power management solutions; and |
| • | Expand Our Engineering Team. We will continue to attract and retain qualified engineers with experience in the design of analog and mixed-signal semiconductors and expertise in power system and applications engineering. |
Our Products and Markets
Our analog and mixed signal power management semiconductor products are primarily used in computing, storage, networking, and consumer markets that require peak voltage regulating performance.
We offer integrated voltage regulator semiconductors, which include our VT200 and VT300 products, integrated power protection and distribution semiconductors, which include our VT500 products, and scalable voltage regulator semiconductor chipsets, which include our VT1000 and VT1300 products. We continually develop new products and new generations and versions of our existing products to improve product performance and features while reducing system cost and size.
The demand for our products depends on many factors, such as our ability to introduce new products in a timely manner, the introduction of competing products, our pricing strategies and the pricing strategies of our competitors, or demand for the electronic systems into which our products are incorporated, or macroeconomic factors, such as downturns in the economy or the semiconductor industry in general.
3
Table of Contents
Customers, Sales and Marketing
The electronics manufacturing industry is complex and disaggregated, with many electronic system producers utilizing distributors and outsourced suppliers to provide procurement, manufacturing, design, and other supply chain related services within the industry. We sell our products primarily to original equipment manufacturers, or OEMs, original design manufacturers, or ODMs, contract equipment manufacturers, or CEMs, and merchant power supply manufacturers, directly through our internal sales force and indirectly through distributors and outsourced suppliers.
Although our key customer base has grown and we expect it to continue to broaden, our sales are concentrated with a relatively small group of customers. In 2011, IBM Corp., Hon Hai Precision Industry Co., Silicon Application Corp., and Flextronics Manufacturing (Hong Kong) Ltd. each accounted for over 10% of our net revenue, and collectively accounted for 72% of our net revenue. In 2010, IBM Corp. and Hon Hai Precision Industry Co. each accounted for over 10% of our net revenue, and collectively accounted for 43% of our net revenue. In 2009, IBM Corp. Silicon Application Corp. and Promate Electronic Co. each accounted for over 10% of our net revenue, and collectively accounted for 65% of our net revenue. See Item 8 “Financial Statements and Supplementary Data” below for information on our net revenue, profit and loss, and total assets.
A significant portion of our revenue is derived from international sales. We sell our products to customers in North America directly through our internal sales force, and to international customers both directly through our internal sales force and indirectly through distributors. International sales accounted for 98% of our net revenue in 2011, 2010 and 2009. We report our net revenue by geographic areas according to the destination to which our products are shipped, although such geographic area may not be the same geographic area in which such product is ultimately used. A further description of this geographic breakdown is included in Note 2(f) to our consolidated financial statements included in Item 8 “Financial Statements and Supplementary Data” below.
Our products are generally incorporated into a customer’s product early in the design phase. Once our products have been designed to perform a specific power management function in our customer’s system, we typically are the sole source supplier for that function. Our applications engineers provide technical support and assistance to customers in designing, testing, and qualifying systems that incorporate our products. We invest significant time and resources in working with electronic system producers to get our products designed into their systems, but if such investment of time and money is unproductive and electronic system producers do not design our products into their systems, the amounts expended in this investment would be unrecoverable and our business would be materially and adversely affected. In addition, we often incur significant expenditures in the development of a new product line without any assurance that a market for such product will develop or that electronic system producers will select our product for use in their systems. If we incur such expenditures and fail to identify customers or applications for such product, our operating results will be adversely affected.
Although in general we do not view our business as being seasonal, our operating results could be negatively impacted during the first quarter of each year due to the lunar New Year holidays in Asia, during which time many of our customers, manufacturers, and subcontractors cease or significantly reduce their operations.
Manufacturing, Assembly and Test
We design and develop our proprietary products and utilize third-party foundries and assembly and test subcontractors to manufacture, assemble and test these products. By outsourcing our manufacturing, we believe that we are able to reduce our capital requirements, lower our fixed costs and product costs, and focus our resources on the design, development and marketing of our products. In addition, we benefit from our suppliers’ manufacturing expertise and from the flexibility to select those vendors that we believe offer the best capability and value.
Our mixed-signal power management semiconductors are manufactured on processes based on widely-available, mature, standard CMOS technologies. This enables us to produce cost-effective products and allows us to source our semiconductors from multiple foundries. Following fabrication, our production silicon wafers are
4
Table of Contents
shipped to our assembly and test subcontractors where they are assembled into packages and electronically tested. We have multiple sources for subcontract assembly and test services. In 2011, our principal foundries and assembly and test subcontractors were located in China, Malaysia, Philippines, Singapore, Taiwan and Thailand.
We have designed and implemented a structured product development process, which is consistent with ISO 9001 specifications, and a quality management system to provide the framework for quality, reliability, and manufacturability of our products. To ensure consistent product quality, reliability, and yield, we closely monitor the production cycle by reviewing electrical, parametric, and manufacturing process data from our foundries and assembly and test subcontractors. The manufacturing process of our products is technically challenging, however, and may create defects that are difficult to detect. If we deliver poor quality products, our operating results and financial position could be materially impacted if we suffer a reduction in or deferral of our revenue as a result of excessive product returns, if we incur substantial product replacement costs, if we are required to incur significant manufacturing or development costs to improve our quality, or if we have to rework or scrap returned inventory.
We believe we have the resources in place and sufficient manufacturing capacity at our subcontractors through our multiple sources of silicon wafer fabrication, assembly, and test to support our anticipated production requirements. However, none of these third-party vendors are obligated to perform services or supply products to us for any specific period, or in any specific quantities, except as may be provided in a particular purchase order. If we do not successfully manage these relationships, the quality and volume of products shipped to our customers may decline, which would damage our relationships with customers, decrease our net revenue and negatively impact our growth.
To ensure availability of our products for our customers, we typically start the manufacturing of our products based on forecasts provided by these customers in advance of receiving purchase orders. However, these forecasts do not represent binding purchase commitments. We do not recognize revenue from these products until they are shipped to the customer after receipt of a firm purchase order. In addition, because we sell a substantial portion of our products to distributors and outsourced suppliers and not directly to electronic system producers, we have more limited visibility into ultimate product demand, which makes forecasting more difficult for us. We incur inventory and manufacturing costs in advance of anticipated revenue. If the amount of inventory we are holding increases or our inventory turns decrease, the risk of a potential inventory write-down and adverse impact on our financial results increases. Similarly, if we underestimate demand, we may not have sufficient product inventory and may lose market share and damage customer relationships, which also could harm our business.
Research and Development
Our research and development efforts are focused on strengthening our market position by continually enhancing our proprietary power system architecture and expanding our mixed-signal and system-level design capabilities. We also look to advance our CMOS wafer fabrication process expertise and packaging technologies, and focus on the discovery of new markets for our core technological competencies. Through these efforts, we seek to introduce new products to address new market opportunities, to further reduce our design and manufacturing cost and to continue to improve the cost effectiveness, size, and performance of our solutions. If we are unable to identify and develop new products or new generations and versions of our existing products that achieve market acceptance on a timely and cost-effective basis, and to respond to changing requirements, our business, operating results and financial condition would be negatively affected.
We have assembled a team of highly skilled engineers who have expertise in analog and mixed-signal design, power system design, process engineering, and package engineering to collaborate on research and development efforts. We have established a separate, dedicated group within our research and development organization that maintains forward-looking focus on new product architectures and future technologies. This group works closely with our customers, partners, and suppliers to align technology roadmaps and conduct extensive research to enhance our future products.
5
Table of Contents
Research and development expense was $37.4 million, $35.0 million, and $26.6 million in 2011, 2010, and 2009, respectively. We intend to invest a significant amount of resources into research and development activities in the future, and expect to fund the cost of these activities from current cash balances and funds generated from operations.
Intellectual Property
We rely primarily on our patents, trade secret laws, contractual provisions, licenses, copyrights, trademarks, and other proprietary rights to protect our intellectual property. As of December 31, 2011, we had 81 issued patents and 64 patent applications pending in the United States, and one issued foreign patent and 43 foreign patent applications pending. These patents have expiration dates ranging from December 2017 to January 2030. We are currently pursuing additional patent applications. We cannot guarantee that our pending patent applications will be approved, that any issued patents will protect our intellectual property or will not be challenged by third parties, or that the patents of others will not have an adverse effect on our ability to do business.
Despite our efforts to protect our proprietary rights, unauthorized parties may attempt to obtain, copy, or use information that we regard as proprietary, such as product design and manufacturing process expertise. Competitors may also recruit our employees who currently have or had access to our proprietary technologies. Any efforts that we take or measures that we implement to prevent misappropriation or infringement of our intellectual property may not be successful.
As initially disclosed in our Annual Report on Form 10-K for the year ended December 31, 2008, and as updated in subsequent public filings, we filed a lawsuit in November 2008 in the United States District Court in the Northern District of California against Infineon Technologies AG, Infineon Technologies North America Corporation, and Primarion, Inc., (collectively, the “Defendants”) for infringement of several of our patents, seeking damages, enhanced damages for willful infringement and injunctive relief.
A trial related to our integrated power stage patents, U.S. Patent Nos. 6,278,264 and 6,462,522 was held in May 2011. The court had determined that Volterra’s asserted claims were infringed by Defendant’s accused products, and a unanimous jury found that all asserted claims were also valid and not obvious. The court agreed to move forward with Volterra’s claims against Defendants for damages and willful infringement, initially setting a trial date for June 2012. Following a hearing on December 22, 2011, the damages trial was re-scheduled to begin November 1, 2012.
As initially disclosed in our Annual Report on Form 10-K for the year ended December 2009 and as updated in subsequent public filings, Infineon Technologies AG filed a lawsuit against us in January 2010 in the United States District Court for the District of Delaware for infringement of four patents assigned to Infineon, seeking damages, enhanced damages for willful infringement and injunctive relief. On December 7, 2011, the Delaware Court granted Volterra’s motion to transfer the case back to the United Stated District Court, Northern District of California where an initial case management conference is pending.
For a more complete description of these legal matters, please read Item 3. Legal Proceedings. Such actions could consume significant financial and other resources, and although we strongly believe in the validity of our positions, there is no guarantee that any such proceedings would be successful on its merits.
The semiconductor industry is characterized by frequent claims of infringement and litigation regarding patent and intellectual property rights. Further litigation may be necessary to enforce our intellectual property rights, or we may have to defend ourselves against additional claims. Any such actions could subject us to significant expense or liability for damages, or could invalidate our proprietary rights, any of which could have a material adverse effect on our business.
6
Table of Contents
Competition
The markets for semiconductors generally, and power management semiconductors in particular, are intensely competitive. Increased competition may result in price pressure, reduced profitability, and loss of market share, any of which could seriously harm our business, revenue, and operating results. Our ability to compete effectively and to expand our business will depend on a number of factors, including but not limited to:
| • | our ability to continue to recruit and retain engineering talent; |
| • | our ability to introduce new products in a timely manner; |
| • | the pricing of components used in competing solutions; |
| • | the pace at which our customers incorporate our products into their systems; |
| • | availability of foundry, assembly, and test capacity; |
| • | protection of our products by effective utilization of intellectual property laws; and |
| • | general economic conditions. |
We consider our primary competitors to include Infineon Technologies, International Rectifier, Intersil, Linear Technology, Maxim Integrated Products and Texas Instruments. In addition, we compete with a number of other companies, some of which may become significant competitors. We may also face competition from new and emerging companies that may enter our existing or future markets. Many of our competitors and potential competitors have longer operating histories, greater name recognition, complementary product offerings, a larger customer base, longer relationships with customers and distributors, and significantly greater financial, sales, marketing, manufacturing, distribution, technical, and other resources than we do. We believe we compete favorably on the basis of performance, integration, form factor and cost.
Employees
As of December 31, 2011, we had 271 full-time employees. There were 149 employees in research and development, 57 in sales, marketing and field services, 32 in general, administration and finance and 33 in operations. We believe we have good relations with our employees.
About Volterra
We were incorporated in Delaware in August 1996. Our principal executive offices are located at 47467 Fremont Blvd., Fremont, California 94538, and our telephone number is (510) 743-1200. Our web site address is www.volterra.com. The information on, or that can be accessed through, our web site is not part of this report.
We file electronically with the SEC our annual report, quarterly reports on Form 10-Q, current reports on Form 8-K and amendments to those reports filed or furnished pursuant to Section 13(a) or 15(d) of the Securities Exchange Act of 1934. We make available free of charge on or through our website copies of these reports as soon as reasonably practicable after we electronically file such material with, or furnish it to, the SEC. The SEC maintains an internet site that contains reports, proxy and information statements, and other information regarding our filings at www.sec.gov. You may also read and copy any of our materials filed with the SEC at the SEC’s Public Reference Room at 100 F Street, NE, Washington, DC 20549. Information regarding the operation of the Public Reference Room can be obtained by calling the SEC at 1-800-SEC-0330.
7
Table of Contents
Executive Officers of the Registrant
Our executive officers, their ages, and their positions as of February 1, 2012, were as follows:
| Name |
Age | Position | ||||
| Jeffrey Staszak |
58 | President, Chief Executive Officer and Director | ||||
| Mike Burns |
45 | Senior Vice President, Chief Financial Officer and Treasurer | ||||
| William Numann |
55 | Senior Vice President, Server and Storage and Communications Product Groups | ||||
| Craig Teuscher |
44 | Senior Vice President, Notebook Product Group | ||||
| Thomas Truman |
44 | Vice President of Worldwide Sales | ||||
Jeffrey Staszak joined Volterra as our President and Chief Operating Officer in March 1999, and has been our Chief Executive Officer since August 2000 and a member of our board of directors since April 2000. Prior to joining Volterra, Mr. Staszak was Senior Vice President in the Storage Products Group of Texas Instruments Inc., a semiconductor company, from July 1996 to March 1999. From May 1993 to July 1996, Mr. Staszak served as Senior Vice President and General Manager of the Storage Products Division of Silicon Systems, Inc., a semiconductor company then affiliated with TDK Corporation. Mr. Staszak holds a B.S. in Industrial Technology from the University of Wisconsin, Stout and an M.B.A. from Pepperdine University.
Mike Burns joined Volterra in August 2007 as Vice President of Finance, Chief Financial Officer and Treasurer, and currently serves as our Senior Vice President of Finance, Chief Financial Officer and Treasurer. Prior to joining Volterra, Mr. Burns served in various capacities within the finance organization at Intel Corporation, a semiconductor manufacturer, from 1992 to August 2007, most recently as Finance Director and Controller of Intel Capital. Mr. Burns earned his B.A. in economics and M.S. in industrial engineering from Stanford University, and his M.B.A. from the University of California at Berkeley’s Haas School of Business.
William Numann joined Volterra in November 2000, and he currently serves as our Senior Vice President, Server and Storage and Communications Product Groups. Mr. Numann previously served as our Senior Vice President of New Product Development, and as our Vice President of Marketing. Prior to joining Volterra, Mr. Numann was Vice President of Standard Products of Supertex, Inc., a semiconductor company, from October 1997 to October 2000. From June 1985 to September 1997, Mr. Numann served as Product Marketing and Applications Director at Siliconix, Inc., a semiconductor company. Mr. Numann holds a B.S.E.E. and an M.B.A. from Rensselaer Polytechnic Institute.
Craig Teuscher co-founded Volterra in 1996, and he currently serves as our Senior Vice President, Notebook Product Group. Dr. Teuscher previously served as our Senior Vice President of Operations, Manufacturing Engineering and Quality Assurance, Vice President of Worldwide Sales and Applications Engineering, and Vice President of Sales and Applications Engineering. Dr. Teuscher holds a B.S.E.E. from Princeton University and an M.S.E.E. and Ph.D. in electrical engineering from the University of California at Berkeley.
Thomas Truman joined Volterra in 2004 and currently serves as our Vice President of Worldwide Sales. Dr. Truman previously served as our Vice President of North American and European Sales. Prior to joining Volterra, Dr. Truman worked in marketing and product management roles at Agere Systems and Internet Photonics, and was a Distinguished Member of Technical Staff at Bell Laboratories. Dr. Truman received a B.S. and M.S. in Electrical Engineering and Computer Science from the University of California at Berkeley, and a Ph.D. in Electrical Engineering and Computer Science, with a minor in Management of Technology from the University of California at Berkeley.
| Item 1A. | Risk Factors |
Included below is a description of risk factors related to our business to enable readers to assess, and be appropriately apprised of, many of the risks and uncertainties applicable to the forward-looking statements made in this annual report on Form 10-K. The risks and uncertainties set forth below are not all of the risks and uncertainties facing our business, but we do believe that they reflect important ones. You should carefully
8
Table of Contents
consider the risks described below and elsewhere in this report, which could materially and adversely affect our business, results of operations or financial condition. In those cases, the trading price of our common stock could decline and you may lose all or part of your investment. Given these risks and uncertainties, you are cautioned not to place undue reliance on forward-looking statements.
Risks Related to our Financial Performance
Our financial performance in the past has fluctuated and may continue to do so in the future.
We have been profitable on an annual basis since 2004, following annual net losses from 1996 through 2003. While we have historically experienced year over year revenue growth, the rate of revenue growth has fluctuated significantly over such periods. Between 2010 and 2011, our annual net revenue increased 2% from $153.6 million to $156.0 million. Between 2009 and 2010, our annual net revenue increased 46% from $104.9 million to $153.6 million. We expect our quarterly and annual revenue to continue to fluctuate. Our net revenue may decline on a period to period basis and we may not maintain profitability on a quarterly or annual basis. Accordingly, you should not rely on the results of any prior quarterly or annual periods as an indication of our future revenue growth or financial results. Our ability to maintain profitability on a quarterly or annual basis depends in part on the rate of growth of our target markets, the continued acceptance of our and our customers’ products, the competitive position of our products, our ability to develop new products, our ability to secure adequate manufacturing capacity and our ability to manage expenses. Because many of our expenses are fixed in the short term or incurred in advance of anticipated revenue, we may not be able to decrease our expenses in a timely manner or we may elect to not reduce expenses, to offset any shortfall in revenue.
Our operating results have fluctuated in the past, and we expect a number of factors to cause our operating results to fluctuate in the future, making it difficult for us to accurately forecast our operating results.
In the past, our net revenue and operating results have fluctuated from quarter to quarter and year to year, and we expect them to continue to do so in the future. A number of factors, many of which are beyond our control, are likely to cause our net revenue and operating results to fluctuate. These factors include, but are not limited to:
| • | varying order patterns in the markets in which we sell our products; |
| • | the loss of one or more key customers, or a significant reduction in sales to, or significant product returns by, one or more key customers; |
| • | our ability to develop new products or new generations and versions of our existing products that achieve market acceptance in a timely manner; |
| • | demand for our products or the electronic systems into which our products are incorporated and our ability to accurately forecast such demand; |
| • | our management of our own inventory levels to meet changes in demand; |
| • | changes in orders both received and shipped during the same quarter (our “turns business”); |
| • | the volatile nature of the semiconductor industry; |
| • | changes in the condition of the world economy; |
| • | the loss of one or more key distributors, or a significant reduction in orders from one or more key distributors, which we are unable to replace; |
| • | our customers’ failure to pay us on a timely basis, or at all; |
| • | the timing of introductions of competing products or technologies; |
| • | litigation involving us or our products; |
| • | disputes regarding intellectual property rights; |
9
Table of Contents
| • | changes in the prices of our products or the electronic systems into which our products are incorporated; |
| • | our ability to obtain sufficient capacity from foundries and other third-party subcontractors to manufacture, assemble and test our products on a timely and cost-effective basis; |
| • | the ability of our foundries and third-party subcontractors to achieve satisfactory yields or quality; |
| • | the ability of our manufacturing subcontractors to manufacture our products on a timely and cost-effective basis; |
| • | our ability to fulfill orders for our products in a timely manner, or at all; and |
| • | our ability to adequately support our future growth. |
Due to these and other factors discussed in this report, you should not rely upon the results of any prior quarter or year as an indication of our future operating performance.
Our stock price will fluctuate and may be volatile, which could result in substantial losses for investors and significant costs related to litigation.
The market price of our common stock may fluctuate significantly in response to a number of factors, some of which are beyond our control, which could result in substantial losses for investors. These factors include, but are not limited to:
| • | actual or anticipated fluctuations in our revenue, operating results or growth rate; |
| • | failure to meet the expectations of securities analysts or investors with respect to our financial performance; |
| • | actual or anticipated fluctuations in our competitors’ operating results or changes in their growth rates; |
| • | sales of our common stock or other securities in the future; |
| • | stock market price and trading volume fluctuations of publicly-traded companies in general and semiconductor companies in particular; |
| • | the trading volume of our common stock; |
| • | changes in financial estimates and ratings by securities analysts for us, our competitors or companies in the semiconductor industry generally; |
| • | changes in the condition of the financial markets, the economy as a whole, the semiconductor industry, our customers or our competitors; |
| • | publicity about the semiconductor industry, our competitors or our customers; and |
| • | changes in key personnel. |
For example, as reflected in Part II – Market Information and Stockholders, the high and low of our stock price during the fiscal year ended December 31, 2011 fluctuated significantly within each period. The stock market in general, and the Nasdaq Global Select Market in particular, has experienced extreme price and volume fluctuations in recent years that have often been unrelated or disproportionate to the operating performance of the listed companies. Broad market and industry factors may materially harm the market price of our common stock, regardless of our operating performance.
In the past, securities class action litigation has often been brought against companies following periods of volatility and decline in the market price of their securities. If our stock price is volatile or declines, we may be the target of similar litigation in the future. Securities litigation could result in significant costs and divert management’s attention and resources, which could seriously harm our business and operating results.
10
Table of Contents
Risks Related to our Markets and Customers
We target our sales and marketing efforts in particular markets, and in these markets we have experienced varying order patterns, and if demand for our products in these markets declines, or if we are unable to adjust to the varying order patterns in these markets or to expand into new markets, our business would be harmed.
In 2011, a significant portion of our net revenue was derived from the sale of our products in the server and storage and notebook markets. If the demand for our products in these markets declines, or if demand for products in the other markets we are targeting, such as the networking and communications markets, does not continue to develop, we may need to further diversify and expand our target markets. If we are unable to do so in a timely and cost-effective manner, our business and operating results could be harmed.
In addition, our business in these markets has been subject to varying order patterns, and we expect business in new markets we enter into will similarly be subject to varying order patterns. In particular, our operating results could be negatively impacted during the first quarter of each year due to the lunar New Year holidays in Asia, during which time many of our customers, manufacturers, and subcontractors cease or significantly reduce their operations. If we are unable to adjust production of our products or the levels of our operating expenses to address changes in demand, our operating results would be harmed.
We depend on a small number of customers for substantially all of our net revenue and the loss of, or a significant reduction in orders from, any of them could significantly reduce our net revenue and adversely affect our operating results.
We sell our products primarily to original equipment manufacturers, or OEMs, original design manufacturers, or ODMs, contract equipment manufacturers, or CEMs, and merchant power supply manufacturers, either directly through our internal sales force or indirectly through distributors and outsourced suppliers. Certain of these customers in turn sell more broadly to multiple companies that directly address consumer demand. The markets in which we sell products are prone to significant and unpredictable changes in demand, and our product sales are directly affected by the ability of our concentrated customer base to sell their products or electronic systems that incorporate our products. If these electronic systems are not commercially successful or if the development or commercial introduction of such electronic systems is delayed or fails to occur as planned or forecasted, or if our customers do not consistently manage their inventory of products we sell to them, our operating results will be adversely affected. We expect a significant amount of our revenue to continue to come from the commercial introduction of new systems making our revenue more difficult to forecast.
In 2011, four customers each accounted for more than 10% of our net revenue, and collectively accounted for at least 72% of our net revenue. In 2010, two customers each accounted for more than 10% of our net revenue, and collectively accounted for at least 43% of our net revenue. While we report revenue for direct sales to particular customers, our sales data may not accurately reflect the additional “indirect” demand from distributors and outsourced suppliers who purchase our products pursuant to their business relationships with such significant customers. Because we have less visibility into and are not able to quantify this “indirect” demand, we are unable to determine how much additional revenue these significant customers may affect. In addition, our sales data also may not identify customers who do not directly account for 10% of our net revenue, but may be significant in that such customers also generate significant “indirect” demand from distributors and outsourced suppliers. If any such significant customer were to stop incorporating our products or third party products containing our components into its designs, we would not only lose the direct revenue we receive from the significant customer, but we could also lose a portion of the revenue from third parties who do business with such significant customer. We expect demand from a small number of customers to continue to account for a substantial portion of our net revenue for the current fiscal year. In addition, our accounts receivable tend to be concentrated with a small group of customers and we expect this to continue. Consolidation among our customers may increase our customer concentration. The loss of any of our major customers could materially adversely impact our operating results and financial position.
11
Table of Contents
Our customers may be impacted by the recent natural disasters throughout the world, which may have an adverse impact on our business.
In 2011, parts of Japan and Thailand were hit with natural disasters that caused significant damage to the regions, the infrastructure and their economies. These types of natural disasters can affect important international customers, as our ability to manufacture products for, or ship products to these customers could be impacted. Similarly, the customers’ own supply chains, operations or facilities in such areas could be impacted, which could affect order patterns or activity. Both of these events could affect our financial condition and operating results.
If we are unable to timely develop new products or new generations and versions of our existing products that achieve market acceptance or comply with prevailing technological standards, our operating results and competitive position could be harmed.
Our industry is characterized by intense competition, rapidly evolving technology, and continually changing customer requirements. These factors could render our existing products obsolete. Accordingly, our ability to compete in the future will depend on our ability to successfully adapt to new technologies and requirements, and to continue to develop and market new products that achieve market acceptance on a timely and cost effective basis. For example, a significant number of our products are developed to operate in computing systems that are based on Intel CPU and chipset specifications or architectures, which may be modified from time to time. Some of the factors affecting our ability to compete successfully include, but are not limited to:
| • | our ability to effectively address new technologies, power architectures, industry standards or consumer preferences; |
| • | our accurate prediction of changing customer requirements; |
| • | timely development of new designs; |
| • | timely qualification and certification of our products for use in electronic systems; |
| • | commercial acceptance and production of the electronic systems into which our products are incorporated; |
| • | availability, quality, price, performance, and size of our products relative to competing products and technologies; |
| • | our customer service and support capabilities and responsiveness; |
| • | our ability to effectively recruit, motivate and retain skilled engineering and research and development staff; |
| • | successful development of relationships with existing and potential new customers; and |
| • | successful development of relationships with key developers of advanced digital semiconductors. |
Products we have recently developed or which we are currently developing may not achieve market acceptance. Many of these new products and processes require significant expenditures of company resources, and there is no guarantee that these expenditures will contribute to the development of commercially successful products. If these products fail to achieve market acceptance, or if we fail to timely develop new products that achieve market acceptance, our business, operating results, and competitive position could be adversely affected.
We sell a limited number of products and a reduction in demand for these products would harm our business and operating results.
We derive substantially all of our net revenue from the sale of integrated voltage regulator semiconductors, integrated power protection and distribution semiconductors, and scalable voltage regulator semiconductor chipsets, and we expect to continue to derive substantially all of our net revenue from these products for the current fiscal year. Factors that could cause the demand for our products to decline include downturns in the
12
Table of Contents
semiconductor industry or general economic conditions, the introduction of competing products, our pricing strategies and the pricing strategies of our competitors, or a decline in demand for the electronic systems into which our products are incorporated.
Because we often manufacture products in advance of receiving purchase orders, or if existing purchase orders are changed or cancelled, we are subject to inventory risks and manufacturing costs that could negatively impact our operating results.
To ensure availability of our products for our customers, we typically start the manufacturing of our products based on forecasts provided by these customers in advance of receiving purchase orders. However, these forecasts do not represent binding purchase commitments, and we do not recognize revenue from these products until they are shipped to the customer. In addition, because we sell our products to distributors and outsourced suppliers and not always directly to electronic system producers, we may have more limited visibility into ultimate product demand, which makes forecasting more difficult for us. We incur inventory and manufacturing costs in advance of anticipated revenue. Demand for our products may not materialize and if we overestimate customer demand for our products, manufacturing based on forecasts subjects us to risks of high inventory carrying costs and obsolescence and may increase our costs. Similarly, if we underestimate demand, we may not have sufficient product inventories and may lose market share and damage customer relationships, which also could harm our business.
In addition, our current sales practice generally allows customers to, and customers routinely do, revise and cancel orders and reschedule delivery dates on relatively short notice pursuant to changes in the customer’s requirements. If, after initial orders are placed, we change certain features of our product to accommodate customer requirements, we may create additional inventories that we may not be able to sell. If purchase orders are changed or cancelled, or if shipments are delayed, we may end up with excess inventories that we cannot sell, which could result in the loss of anticipated revenue and an increase in our costs due to excess inventory charges which could materially impact our financial results.
Our inventory levels were $14.7 million at December 31, 2011. Inventory turns, calculated as our annualized cost of revenue for the quarter divided by our inventory as of the end of such quarter, decreased to 4.4 turns in the fourth quarter of 2011 compared to 4.5 turns in the third quarter of 2011 and increased compared to 3.7 turns in the fourth quarter of 2010. If the amount of inventories we are holding increases or our inventory turns decrease, the risk of a potential inventory write-down and adverse impact on our financial results increases.
We are subject to the highly cyclical nature of the semiconductor industry and any future downturns could significantly harm our business.
Our business is heavily influenced by the cyclical nature of the semiconductor industry. The semiconductor industry has experienced significant downturns, often in connection with, or in anticipation of, maturing product cycles of both semiconductor companies and their customers and declines in general economic conditions. These downturns have been characterized by production overcapacity, high inventory levels, and accelerated erosion of average selling prices. Any future downturns could significantly harm our business or reduce our revenue from one period to the next or for a prolonged period of time. From time to time, the semiconductor industry also has experienced periods of increased demand and production capacity constraints. We may experience substantial changes in future operating results due to factors that affect the semiconductor industry generally.
We rely on a small number of distributors to market and distribute our products, and if we fail to manage these relationships, our net revenue may decline.
Many purchases of our products are made through a concentrated group of distributors, which group may change over time. Our sales to distributors accounted for 27% of our net revenue in 2011 and 2010. None of our distributors are required to purchase a specified minimum level of products from us. Currently, our sales to distributors are made pursuant to standard purchase orders rather than long-term contracts and although we do not grant them a right of return pursuant to these purchase orders, their orders may be cancelled or changed more readily than if we had long-term purchase commitments. In the event of a cancellation, reduction or delay of an
13
Table of Contents
order, we may not have enough time to reduce operating expenses to minimize the effect of the lost revenue on our business. We also rely on our distributors to provide certain support services and other customer service to our customers. If they fail to provide appropriate levels of support and service to our customers on a timely basis, our relationships with our customers will suffer.
We need to maintain our relationships with our distributors while expanding additional channels for the marketing and sale of our products. If we fail to manage these relationships, our distributors may decide not to include our products among those that they sell or they may not make marketing and selling our products a priority. In addition, our distributors may sell product lines that are competitive with ours. If we fail to successfully manage our relationships with distributors while we look for additional channels for marketing and selling our products, our business would be harmed.
We are exposed to credit risk and payment delinquencies on our accounts receivable.
None of our outstanding accounts receivables are covered by collateral or credit insurance. In addition, our standard terms and conditions permit payment within a specified number of days following shipment of product. While we have procedures to monitor and limit exposure to credit risk on our receivables, there can be no assurance such procedures will effectively limit our credit risk and avoid losses. As economic conditions change, certain of our customers may face liquidity issues and may be unable or unwilling to satisfy their payment obligations, which would have a material adverse effect on our financial condition and operating results.
Risks Related to Competition, Intellectual Property, Litigation and Regulation
We face significant competition and many of our competitors have greater resources than we have, and thus we may be unsuccessful in competing against current and future competitors.
The markets for semiconductors generally, and power management semiconductors in particular, are intensely competitive, and we expect competition to increase and intensify in the future as new or larger semiconductor manufacturers enter our market. Increased competition may result in price pressure, reduced profitability, and loss of market share, any of which could seriously harm our business, revenue, and operating results. Our ability to compete effectively and to expand our business will depend on a number of factors, including, but not limited to:
| • | our ability to continue to recruit and retain engineering talent; |
| • | our ability to introduce new products in a timely manner; |
| • | the pricing of components used in competing solutions; |
| • | the pace at which our customers incorporate our products into their systems; |
| • | the availability of foundry, assembly, and test capacity for our products; |
| • | protection of our products by effective utilization of intellectual property laws; and |
| • | general economic conditions. |
We consider our primary competitors to include Infineon Technologies, International Rectifier, Intersil, Linear Technology, Maxim Integrated Products and Texas Instruments. In addition, we compete with a number of other companies, some of which may become significant competitors. We may also face competition from new and emerging companies that may enter our existing or future markets. Many of our competitors and potential competitors have longer operating histories, greater name recognition, complementary product offerings, a larger customer base, longer relationships with customers and distributors, and significantly greater financial, sales, marketing, manufacturing, distribution, technical, and other resources than we do. As a result, they may be able to respond more quickly to customer requirements, to devote greater resources to the development, promotion, and sales of their products and to influence industry acceptance of their products better than we can. These competitors may also be able to adapt more quickly to new or emerging technologies or standards and may be able to deliver products with performance comparable or superior to that of our products at a lower cost.
14
Table of Contents
In addition, in the event of a manufacturing capacity shortage, these competitors may have or be able to obtain silicon wafer fabrication capacity when we are unable to obtain such capacity. We expect our competitors to continue to introduce new or enhanced products technologies with greater performance and improved pricing, which could cause our products to become obsolete or uncompetitive and harm our operating results.
Our ability to compete will be harmed if we are unable to adequately protect our intellectual property.
We rely primarily on a combination of patent, trademark, trade secret, and copyright law and contractual restrictions to protect our intellectual property. These afford only limited protection. Despite our efforts to protect our proprietary rights, unauthorized parties may attempt to obtain, copy, or use information that we regard as proprietary, such as product design and manufacturing process expertise. As disclosed in Item 1 of Part II – Legal Proceedings, we filed a patent infringement lawsuit in the United States District Court in the Northern District of California against Infineon Technologies AG, Infineon Technologies North America Corporation and Primarion, Inc. We are also involved in a patent infringement lawsuit in the United States District Court for the Northern District of California against Infineon Technologies AG in which we are accused of infringing four patents assigned to Infineon. These actions or any similar action could consume significant financial and other resources. In the twelve months ended December 31, 2011, our litigation related expenses were approximately $4.7 million. While we believe in the strength of our positions, we are unable to assess the possible outcome or possible losses relating to these cases, and there is no guarantee that any such proceedings would be successful on its merits or that we will receive monetary damages awards or recoup our legal expenses. Because of the nature and inherent uncertainties of litigation, should the outcome of these actions be unfavorable, our business, financial condition, results of operations or cash flows could be materially adversely affected.
As of December 31, 2011 we had 81 issued patents and 64 patent applications pending in the United States, and one issued foreign patent and 43 foreign patent applications pending. These patents have expiration dates ranging from December 2017 to January 2030. Our pending patent applications and any future applications may not result in issued patents or may not be sufficiently broad to protect our proprietary technologies. Moreover, policing any unauthorized use of our products is difficult and costly, and we cannot be certain that the measures we have implemented will prevent misappropriation or unauthorized use of our technologies, particularly in foreign jurisdictions where the laws may not protect our proprietary rights as fully as the laws of the United States. The enforcement of patents by others may harm our ability to conduct our business. Others may independently develop substantially equivalent intellectual property or otherwise gain access to our trade secrets or intellectual property. If we fail to effectively protect our intellectual property, our business could be harmed.
Assertions by third parties of infringement by us or our vendors of their intellectual property rights could result in significant costs and cause our operating results to suffer.
The semiconductor industry is characterized by vigorous protection and pursuit of intellectual property rights and positions, which has resulted in protracted and expensive litigation for many companies. In the future we may receive communications from various industry participants alleging infringement of patents, trade secrets or other intellectual property rights. Any lawsuits resulting from such allegations could subject us to significant liability for damages and invalidate our proprietary rights. These lawsuits, regardless of their success, would likely be time-consuming and expensive to resolve and would divert management’s time and attention. Any potential intellectual property litigation also could force us to take steps that may be harmful to our business, including, but not limited to:
| • | stop selling products or using technology that contain the allegedly infringing intellectual property; |
| • | pay damages to the party claiming infringement; |
| • | attempt to obtain a license to the relevant intellectual property, which may not be available on reasonable terms or at all; and |
| • | attempt to redesign those products that contain the allegedly infringing intellectual property. |
In addition, the third-party foundries or subcontractors that manufacture our products may also face litigation for claims of intellectual property. Although not directly creating liabilities for us, such litigation may
15
Table of Contents
cause such third parties to cease providing services to us, or may cause us to incur increased costs, either of which may harm our business. We may also initiate claims or litigation against third parties for infringement of our proprietary rights or to establish the validity of our proprietary rights. In some cases, we may have an existing direct or indirect relationship with these third parties, such as customers, vendors, partners or companies within the industry that generally affect our business. Such claims or litigation could not only affect our intellectual property or proprietary rights, but may also affect and disrupt our business relationship with such third parties, impairing our ability to conduct our business and adversely affecting our financial and operational results.
Any potential dispute involving our patents or other intellectual property could also include our customers, which could trigger our indemnification obligations to them and result in substantial expense to us.
In any potential dispute involving our patents or other intellectual property, our customers could also become the target of litigation. Because we indemnify our customers against claims made against them based on allegations that our products infringe intellectual property rights, such litigation could result in substantial expense for us. In addition to the time and expense required for us to indemnify our customers, any such litigation could hurt our relations with our customers and cause our operating results to be harmed.
The average selling prices of our products could decrease rapidly, which may negatively impact our net revenue and operating results.
The average selling prices for power management solutions have historically declined over time. Factors that we expect to cause downward pressure on the average selling price for our products include competitive pricing pressures, the cost sensitivity of our customers, particularly in the higher-volume markets, new product introductions by us or our competitors, and other factors. To maintain acceptable operating results, we will need to offset any reduction in the average selling prices of our products by developing and introducing new products and developing new generations and versions of existing products on a timely basis, increasing sales volume, and reducing costs. If the average selling prices for our products decline and we are unable to offset those reductions, our operating results will suffer.
Environmental laws and regulations could cause a disruption in our business and operations.
We are subject to various state, federal and international laws and regulations governing the environment, including those restricting the presence of certain substances in electronic products and making manufacturers of those products financially responsible for the collection, treatment, recycling and disposal of certain products. Such laws and regulations have been passed in several jurisdictions in which we operate, including various European Union member countries. We will need to ensure that we comply with such laws and regulations as they are enacted, and that our third-party semiconductor assembly subcontractors such as Advanced Semiconductor Engineering, Amkor Technology, Carsem, JCAP, SilTech, STATS ChipPAC Ltd. and UTAC, timely comply with such laws and regulations. Because we work with subcontractors to make specified modifications to their standard processes, transitioning the manufacturing of our products can require substantial lead time. Any future delay resulting from such transition could negatively affect product performance, delivery, and yields or increase manufacturing costs. If we, or the subcontractors that we use, fail to timely comply with such laws, our customers may refuse to purchase our products. Such refusal or delay could have a materially adverse effect on our business, financial condition and results of operations.
Risks Related to our Manufacturing and Development Activities
Our dependence on third-party semiconductor manufacturers, or foundries, reduces our control over the manufacture of our products and increases our exposure to third party solvency risks, which could harm our business.
We are a fabless semiconductor company and, as such, we rely on third-party semiconductor manufacturers, or foundries, such as GlobalFoundries and Taiwan Semiconductor Manufacturing Corporation (TSMC). The ability of
16
Table of Contents
these foundries to provide silicon wafers to us is limited by their available capacity. Moreover, the price of our silicon wafers has in the past fluctuated and is expected to continue to fluctuate, based on changes in available industry capacity. We do not have long-term supply contracts with any of our foundries. Therefore, our manufacturers could choose to prioritize capacity for other customers, particularly larger customers, reduce or eliminate deliveries to us on short notice or increase the prices they charge us. There are significant risks associated with our reliance on these third-party manufacturers, including, but not limited to:
| • | inability to increase production and achieve acceptable yields on a timely basis; |
| • | reduced control over delivery schedules and product quality; |
| • | inability of our foundries to obtain an adequate supply of the raw materials used in the manufacturing of our products on a timely and cost-effective basis; |
| • | increased exposure to potential misappropriation of our intellectual property; |
| • | limited warranties on silicon wafers or products supplied to us; |
| • | labor shortages or labor strikes; |
| • | natural disasters affecting countries in which we conduct our business or in which our products are manufactured; and |
| • | political instability in countries where our products are manufactured. |
In addition, these third party manufacturers may elect or may be forced to shut down particular facilities for reasons beyond our control, which may require us to transition the manufacturing of our products to other facilities of such third party manufacturer or to other third party manufacturers. Because we work with foundries to make specified modifications to their standard process technologies, transitioning the manufacturing of our products to other foundries or other facilities of an existing foundry can require process design changes and may require substantial lead time. Any such delay resulting from such transition could negatively affect product performance, delivery, and yields or increase manufacturing costs. If we are not able to obtain foundry capacity as required, our relationships with our customers would be harmed and our net revenue would likely decline. Deterioration of worldwide economic conditions and financial markets and tightening in credit markets may adversely impact the financial position of our third party manufacturers. If our third party manufacturers are unable to obtain the necessary capital to operate their business, this may also impact their ability to provide us with the foundry capacity we need, or may adversely affect their ability to provide timely services or to make timely deliveries of products to us. Any such result could adversely affect our operations and financial condition.
We rely on third-party subcontractors to assemble and test our products and our failure to successfully manage our relationships with these subcontractors could damage our relationships with our customers, decrease our net revenue, and limit our growth.
We rely on third-party subcontractors, such as Advanced Semiconductor Engineering, Amkor Technology, Carsem, JCAP, SilTech, STATS ChipPAC Ltd. and UTAC, to assemble and test our products. None of these third-party vendors are obligated to perform services or supply products to us for any specific period, or in any specific quantities, except as may be provided in a particular purchase order. Moreover, none of our assembly and test subcontractors has provided contractual assurances to us that adequate capacity will be available to us to meet future demand for our products. We are subject to many of the same risks with these vendors as with our foundries, including risks related to the ability of such vendors to continue to provide us with the agreed-upon services or products as needed, and our ability to control delivery schedules and product quality. If we do not successfully manage these relationships, the quality of products shipped to our customers may decline, which could damage our relationships with customers, decrease our net revenue, and negatively impact our growth.
17
Table of Contents
Our products are highly complex and may require modifications to resolve previously undetected design or process errors or defects and to meet our customers’ specifications, which could lead to an increase in our costs, a loss of revenue and customers, a delay in market acceptance of our products, or product liability claims.
Our power management products are highly complex and may contain previously undetected errors or defects in design that are discovered in the manufacturing or assembly process that may significantly affect yields or quality. If we deliver products with undiscovered errors or defects, these products may be the subject of a warranty claim and we may suffer a reduction in or deferral of our revenue as a result of significant product returns and our operating results and financial position could be materially impacted. We may incur product replacement costs, and we may have to rework or scrap inventory that is returned. In addition, we may incur additional manufacturing and/or development costs to fix the defect or error and may have to rework or scrap inventory that had been built with the error or defect resulting in additional costs. If we are unable to fully recover or be reimbursed for all or a portion of these costs, our financial position and operating results may be adversely impacted. Also as a result of shipping products with defects or errors, our credibility and the market acceptance of our products could be harmed. Defects could also lead to liability for defective products as a result of lawsuits against our customers or us. We have agreed to indemnify our customers in some circumstances against liability from defects in our products. In the future, as we increase the amount of business with any given customer, we may be expected to agree upon additional terms and conditions of sale regarding product quality or product defects which may increase our costs, obligations and liabilities in connection with our product sales. Although we maintain insurance coverage consistent with customary industry practice to defray potential costs from lawsuits, including lawsuits arising from product liability, if liabilities arise that are not effectively limited or covered by such insurance, a successful product liability claim could require us to pay a significant amount of damages, which could have a material adverse impact on our financial results and financial position.
Our products comprise only part of the complex electronic systems in which they are used. As a result, our products must operate according to specifications with the other components in the electronic system. If other components of the electronic system fail to operate properly with our products, we may be required to incur additional development time and costs to enable interoperability of our products with these other components and may not be able to sell our existing inventories resulting in additional cost of revenue and materially adversely affecting our financial results.
Any disruption to our operations or the operations of our foundries or assembly and test subcontractors resulting from earthquakes, droughts, or other natural disasters, public health issues or other catastrophic events beyond our control could significantly delay the production or shipment of our products.
Our principal offices are located in California and we rely on foundries and assembly and test subcontractors in China, Malaysia, Philippines, Singapore, Taiwan and Thailand. The risk of natural disasters in these Pacific Rim locations is significant. The occurrence of an earthquake, drought, floods, fires or other natural disaster near our principal offices or our subcontractors’ locations could result in damage, power outages, and other disruptions that impair our design, manufacturing, and assembly capacity and otherwise interfere with our ability to conduct our business. Any disruption resulting from such events could cause significant delays in the shipment of our products until we were able to shift our fabrication, assembling, testing or other operations from the affected subcontractor to another third-party vendor.
Because we rely on third party foundries and assembly and test subcontractors, we have experienced, and may in the future experience, delays in the manufacture, development and introduction of our new products, which may harm our business and operating results.
The development of our products is highly complex, costly and inherently risky. Because we rely on third party foundries and assembly and test subcontractors, we have experienced, and may in the future experience, delays in the manufacture, development and introduction of new products or new generations and versions of our existing products. If we are unable to manufacture, develop or introduce products on a timely basis, we may lose new or existing market and customer opportunities and our financial results or competitive position could be harmed. We cannot assure you that the procedures that we have implemented to minimize delays will be
18
Table of Contents
effective or that delays may not occur in the future. In particular, we expect to continue to bring new products to production in new manufacturing and assembly processes. Any future delays in the introduction of new products or new generations or versions of our existing products could materially harm our business and operating results.
The nature of the design process requires us to incur expenses prior to earning revenue associated with those expenses, and we will have difficulty selling our products and generating profits if electronic system producers do not design our products into their electronic systems.
We devote significant time and resources in working with electronic system producers to get our products designed into their systems. If the system producer chooses a competitor’s product for its electronic system, it becomes significantly more difficult for us to sell our products for use in that electronic system because changing suppliers involves significant cost, time, effort, and risk for electronic system producers. If electronic system producers do not design our products into their systems, our business would be materially adversely affected.
We often incur significant expenditures in the development of a new product without any assurance that electronic system producers will select our product for use in their electronic systems. If we incur such expenditures and fail to be selected, or if we are selected and subsequently excluded from such designs, our operating results will be adversely affected. Furthermore, even if electronic system producers use our products in their electronic systems, we cannot be assured that these systems will be commercially successful or that we will receive any associated revenue.
Even if our products are selected for design into a particular electronic system, a substantial period of time will elapse before we generate revenue related to the significant expenses we have incurred. The reasons for this delay generally include, but are not limited to, the following:
| • | it can typically take up to 12 months from the time our products are selected to complete the design process, and in some cases such design process may take substantially more time to complete; |
| • | it can typically take an additional 6 to 12 months to complete commercial introduction of the electronic systems that use our products, and in some cases such introduction may take substantially more time to complete, if they are introduced at all; |
| • | our customers usually require a comprehensive technical evaluation of our products before they incorporate them into their electronic systems, which may also result in our products being excluded from the system design for reasons other than our design specifications; |
| • | OEMs typically limit the initial release of their electronic systems to evaluate performance and consumer demand; and |
| • | the development and commercial introduction of products incorporating new technology are frequently delayed. |
As a result, we may be unable to accurately forecast the volume and timing of our orders and revenue. In addition, incurring research and development expenses prior to generating revenue may cause our operating results to fluctuate significantly from period to period.
Risks Related to our International Activities
We have significant international activities and customers, and plan to continue such efforts, which subjects us to additional business risks including increased logistical complexity, additional regulatory restrictions and political instability.
A number of our customers are multinational corporations, with operations located throughout the world. In 2011, 98% of our net revenue was attributable to customers, or customers’ operations, located outside of the United States, primarily in China and Singapore, and we anticipate that a significant portion of our future revenue will continue to be generated by sales to these customers or to the customers’ operations in China and Singapore. We have engineering, sales, and operations personnel in Japan, Singapore, Taiwan, China and the
19
Table of Contents
United Kingdom. Our foundries, assembly and test subcontractors, and distributors are also primarily located in Asia. Our international operations and sales are subject to a number of risks, including, but not limited to:
| • | cultural and language barriers; |
| • | increased complexity and costs of managing international operations; |
| • | protectionist laws and business practices that favor local competition in some countries; |
| • | multiple, conflicting and changing laws and regulatory and tax environments; |
| • | potentially longer and more difficult collection periods; |
| • | political instability, international terrorism, and anti-American sentiment, particularly in emerging markets; |
| • | highly volatile economies in Asia; |
| • | difficulty in hiring qualified management, technical sales personnel, and applications engineers; and |
| • | less effective protection of intellectual property than is afforded to us in the United States. |
Our inability to overcome these risks could adversely affect our foreign operations, and some of our customers and suppliers, and could harm our business and operating results.
We could be adversely affected by violations of the United States’ Foreign Corrupt Practices Act and similar worldwide anti-bribery laws.
The United States’ Foreign Corrupt Practices Act (“FCPA”) and similar anti-bribery laws in other jurisdictions generally prohibit companies, their subsidiaries and their intermediaries from making improper payments to government officials for the purpose of obtaining or retaining business. While our policies mandate compliance with the FCPA and these anti-bribery laws, there can be no assurance that our internal controls and procedures will protect us from improper acts committed by our employees or agents. If we are found to be liable for FCPA violations, we could suffer from criminal or civil penalties or other sanctions, which could have a material adverse effect on our business.
We do not hedge fluctuations in currency exchange rates, which could harm our financial results.
Substantially all sales to international customers and purchases of production materials and manufacturing services from international suppliers in 2011 were denominated in U.S. dollars. However, fluctuations in currency exchange rates could have an effect on our results of operations and financial condition. An increase in the value of the U.S. dollar relative to foreign currencies could make our products more expensive for our international customers to purchase, thus rendering the prices of our products less competitive. If the value of the U.S. dollar decreases relative to foreign currencies, this could result in an increase in the effective costs of working with our international vendors or suppliers, and our ability to control our cost structure and maintain our financial results could be harmed.
Risks Related to our Growth and Organization
We may undertake acquisitions to expand our business that may pose risks to our business and dilute the ownership of our existing stockholders.
We will evaluate opportunities to acquire other businesses, products or technologies that would complement our current offerings, expand the breadth of markets we can address or enhance our technical capabilities. Acquisitions that we may potentially make in the future entail a number of risks that could materially adversely affect our operating and financial results, including, but not limited to:
| • | our lack of experience acquiring other businesses; |
| • | problems integrating the acquired operations, technologies, or products with our existing business and products; |
20
Table of Contents
| • | diversion of management’s time and attention from our core business; |
| • | the need for financial resources above our planned investment levels; |
| • | overestimation of potential synergies or a delay in realizing those synergies; |
| • | difficulties in retaining business relationships with suppliers and customers of the acquired company; |
| • | risks associated with entering markets in which we lack prior experience; and |
| • | the potential loss of key employees of the acquired company. |
Future acquisitions also could cause us to incur debt or contingent liabilities or cause us to issue equity securities that would reduce the ownership percentages of existing stockholders. Furthermore, acquisitions could result in adverse tax consequences, substantial depreciation, deferred compensation charges, impairment of goodwill, or the amortization of amounts related to deferred compensation and to identifiable purchased intangible assets, any of which would negatively affect our operating results.
If we do not effectively manage our growth, our resources, systems, and controls may be strained and our operating results may suffer.
In recent periods, we have continued to increase the scope of our operations and the size of our workforce. This growth has placed, and any future growth of our operations will continue to place, a significant strain on our management personnel, systems, and resources. We anticipate that we will need to implement a variety of new and upgraded operational and financial systems, procedures, and controls, including the improvement of our accounting and other internal management systems. We also will need to continue to expand, train, manage, and motivate our workforce, and manage our customer and distributor relationships, develop our internal sales force, and manage our foundry and assembly and test subcontractors. All of these endeavors will require substantial management effort and skill, and we anticipate that we will require additional personnel and internal processes to manage these efforts. Our growth in recent years has also caused several key employees and members of management to take on new and greater responsibilities within our organization. If the transition to these new roles and responsibilities is not successful or completed on a timely basis, we may be unable to take full advantage of additional growth opportunities and our business could be adversely affected. We plan to fund the costs of our operational and financial systems, additional personnel, and internal processes from current cash balances and funds generated from operations. If we are unable to effectively manage our expanding operations, our revenue and operating results could be materially adversely affected.
We evaluate our internal controls over financial reporting in order to allow management to report on, and our independent auditors to attest to, our internal controls over financial reporting, as required by Section 404 of the Sarbanes-Oxley Act of 2002 and the rules and regulations of the SEC, which we collectively refer to as Section 404. As we grow and implement new and upgraded operational and financial systems, procedures, and controls, we will need to maintain effective internal controls over financial reporting. In addition, in the course of our Section 404 compliance, we may identify deficiencies in our internal controls, some of which may be categorized as a significant deficiency or a material weakness. If we fail to correct the deficiencies that we identify and to maintain the adequacy of our internal control over financial reporting, as such standards are modified, supplemented or amended from time to time, we may not be able to ensure that we can conclude on an ongoing basis that we have effective internal control over financial reporting in accordance with Section 404. If we cannot favorably assess, or our independent registered public accountants are unable to provide an unqualified report on the effectiveness of our internal control over financial reporting, investor confidence in the reliability of our financial reports may be adversely affected, which could have a material adverse effect on our stock price.
We rely on the services of our key personnel, and if we are unable to retain our current personnel and hire additional personnel, our ability to develop and successfully market our products could be harmed.
We rely upon the continued service and performance of a relatively small number of key technical and senior management personnel. If we are unable to retain any of our key technical or senior management
21
Table of Contents
personnel, such as Jeffrey Staszak, our President and Chief Executive Officer, or are unable to fill key positions, our business could be harmed. As a result, our future success depends on retaining our management team and other key employees. We rely on these individuals for the management of our company, development of our products and business strategy, and management of our strategic relationships, and for the reliability of our financial reporting and the design and maintenance of our internal controls over financial reporting. In addition, we rely on a relatively small number of analog and mixed-signal design engineers who have the training and experience to design our products. Any of these employees could leave our company with little or no prior notice and could work with our competitors, subject to their continuing confidentiality obligations to us. We do not have “key person” life insurance policies covering any of our employees. Additionally, there are a limited number of qualified technical personnel with significant experience in the design, development, manufacture, and sale of power management semiconductors, and we may face challenges in hiring and retaining these types of employees.
If our computer and communications hardware fails, our business, results of operations and financial condition would be harmed.
Our ability to successfully operate our business depends in part on the efficient and uninterrupted operation of our computer and communications systems. Substantially all of the computer and communications hardware necessary to operate our business is located at a single leased facility. Our systems and operations are vulnerable to damage or interruption from human error, fire, flood, power loss, telecommunications failure, terrorist attacks, acts of war, break-ins, computer viruses, earthquakes and similar events, any of which may result in interruptions, delays, loss of critical data, the inability to accept and fulfill customer orders or the unauthorized disclosure of confidential customer data or proprietary technical information. We do not presently have redundant systems in multiple locations or a formal disaster recovery plan, and our business interruption insurance may be insufficient to compensate us for losses that may occur. If any of these events or interruptions were to occur, our business and results of operations could be substantially harmed.
Our principal stockholders have significant voting power and may influence actions that may not be in the best interests of our other stockholders.
Our executive officers, directors, and principal stockholders collectively hold a significant portion of our outstanding common stock. As a result, these stockholders, acting together, may have the ability to exert substantial influence over matters requiring approval of our stockholders, including the election and removal of directors and the approval of mergers or other business combinations. This concentration of beneficial ownership could be disadvantageous to other stockholders whose interests are different from those of our executive officers, directors, and principal stockholders. For example, our executive officers, directors, and principal stockholders, acting together with stockholders owning a relatively small percentage of our outstanding stock, could delay or prevent an acquisition or merger even if the transaction would benefit other stockholders.
Anti-takeover provisions of our charter documents and Delaware law could prevent or delay transactions resulting in a change in control.
Our certificate of incorporation and our bylaws may make more difficult or discourage, delay or prevent a change in the ownership of our company or a change in our management or our board of directors. The following are examples of provisions that are included in our certificate of incorporation and bylaws that might have those effects:
| • | our board of directors is classified so that not all members of our board of directors may be elected at one time; |
| • | directors may only be removed “for cause” and only with the approval of stockholders holding a majority of our outstanding voting stock; |
| • | the ability of our stockholders to call a special meeting of stockholders is prohibited; |
| • | advance notice is required for nominations for election to our board of directors or for proposing matters that can be acted upon at stockholder meetings; |
22
Table of Contents
| • | stockholder action by written consent is prohibited, thereby requiring all stockholder actions to be taken at a meeting of our stockholders; and |
| • | our board of directors may designate the terms of and issue new series of preferred stock, commonly referred to as “blank check” preferred stock, with rights senior to those of common stock without stockholder approval. |
In addition, we are also subject to Section 203 of the Delaware General Corporation Law, which provides, subject to enumerated exceptions, that if a person acquires 15% or more of our voting stock, the person is an “interested stockholder” and may not engage in “business combinations” with us for a period of three years from the time the person acquired 15% or more of our voting stock.
These provisions may have the effect of entrenching our management team and may deprive you of the opportunity to sell your shares to potential acquirers at a premium over prevailing prices. This potential inability to obtain a premium could reduce the price of our common stock.
| Item 1B. | Unresolved Staff Comments |
Not applicable.
| Item 2. | Properties |
Our principal offices and primary research and development, operations management, and Western U.S. sales office occupy approximately 73,111 square feet in Fremont, California, under a lease that expires in 2015, with an option to renew in 2014. Our regional headquarters in Asia, research and development, operations management, and sales office, occupy approximately 9,000 square feet in Singapore under leases that expire in 2012. We also lease properties throughout the United States, Asia and in Europe for use as sales, research and development, business development or applications support offices. We may change the size and location of our facilities from time to time based on business requirements. We do not own any manufacturing facilities and we contract to third parties the production and distribution of our products. We believe our space is adequate for our current needs and that additional or substitute space will be available to accommodate any foreseeable expansion of our operations in the current fiscal year.
| Item 3. | Legal Proceedings |
From time to time we may become subject to legal proceedings in the ordinary course of our business. Except as set forth below, we are not currently involved in any legal proceedings that we believe will, either individually or in the aggregate, materially and adversely affect our business.
As initially disclosed in our Annual Report on Form 10-K for the year ended December 31, 2008, and as updated in subsequent public filings, we filed a lawsuit in November 2008 in the United States District Court in the Northern District of California against Infineon Technologies AG, Infineon Technologies North America Corporation, and Primarion, Inc., (collectively, the “Defendants”) for infringement of several of our patents, seeking damages, enhanced damages for willful infringement and injunctive relief.
A trial related to our integrated power stage patents, U.S. Patent Nos. 6,278,264 and 6,462,522 was held in May 2011. The court had determined that Volterra’s asserted claims were infringed by Defendant’s accused products, and a unanimous jury found that all asserted claims were also valid and not obvious. The court agreed to move forward with Volterra’s claims against Defendants for damages and willful infringement, initially setting a trial date for June 2012. Following a hearing on December 22, 2011, the damages trial was re-scheduled to begin November 1, 2012.
As initially disclosed in our Annual Report on Form 10-K for the year ended December 2009 and as updated in subsequent public filings, Infineon Technologies AG filed a lawsuit against us in January 2010 in the United States District Court for the District of Delaware for infringement of four patents assigned to Infineon, seeking damages, enhanced damages for willful infringement and injunctive relief. On December 7, 2011, the Delaware Court granted Volterra’s motion to transfer the case back to the United Stated District Court, Northern District of California where an initial case management conference is pending.
23
Table of Contents
While we believe in the strength of our positions, we are unable to assess the ultimate outcome or possible gains or losses relating to these cases, and there is no guarantee that any such proceedings would be successful on its merits or that we will receive monetary damages awards or recoup our legal expenses.
| Item 4. | Mine Safety Disclosures |
Not applicable.
| Item 5. | Market for Registrant’s Common Equity, Related Stockholder Matters and Issuer Purchases of Equity Securities |
Market Information and Stockholders
Our common stock is traded on the Nasdaq Global Select Market under the symbol “VLTR.” The following table sets forth the high and low sales prices (based on daily closing prices) of our common stock as reported on the Nasdaq Global Select Market for the periods indicated.
| High | Low | |||||||
| Year ended December 31, 2011: |
||||||||
| Fourth quarter ended December 31 |
$ | 25.74 | $ | 18.20 | ||||
| Third quarter ended September 30 |
$ | 26.42 | $ | 19.23 | ||||
| Second quarter ended June 30 |
$ | 26.40 | $ | 21.77 | ||||
| First quarter ended March 31 |
$ | 26.85 | $ | 22.20 | ||||
| Year ended December 31, 2010: |
||||||||
| Fourth quarter ended December 31 |
$ | 24.75 | $ | 18.74 | ||||
| Third quarter ended September 30 |
$ | 27.83 | $ | 18.86 | ||||
| Second quarter ended June 30 |
$ | 28.27 | $ | 20.69 | ||||
| First quarter ended March 31 |
$ | 26.19 | $ | 17.47 | ||||
The closing price for our common stock as reported by the Nasdaq Global Select Market on January 31, 2012 was $30.18 per share. As of January 31, 2012, there were approximately 362 registered stockholders of record of our common stock.
24
Table of Contents
The following graph compares the cumulative 60-month total return provided shareholders on our common stock relative to the cumulative total returns of the Nasdaq Composite Index and the Philadelphia Semiconductor Index. An investment of $100 (assuming reinvestment of all dividends) is assumed to have been made in our common stock on or in these indexes on December 31, 2006 and its relative performance is tracked through December 31, 2011. We have not paid any dividends on our common stock during this period. The stock price information shown on the graph below is not indicative of future price performance.
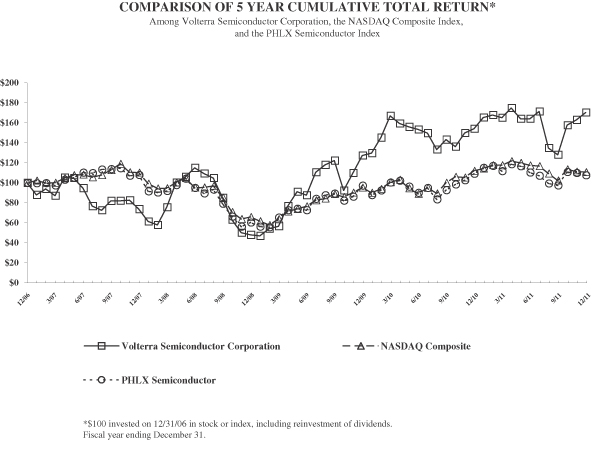
The information contained in the Stock Performance Graph section shall not be deemed to be “soliciting material” or “filed” or incorporated by reference in future filings with the SEC, or subject to the liabilities of Section 18 of the Exchange Act, except to the extent that we specifically incorporate it by reference into a document filed under the Securities Act of 1933, as amended, or the Securities Exchange Act of 1934, as amended.
Dividends
We have never declared or paid any cash dividends on our capital stock, and do not anticipate paying cash dividends on our common stock. Any future determination to pay dividends will be at the discretion of our board of directors. None of our outstanding capital stock is entitled to any dividends.
25
Table of Contents
ISSUER PURCHASES OF EQUITY SECURITIES
The following table provides information about our share repurchase activity for the three months ended December 31, 2011:
| Period |
Total Number of Shares Purchased |
Average Price Paid per Share2 |
Total Number of Shares Purchased as Part of Publicly Announced Program1 |
Approximate Dollar Value of Shares that May Yet Be Purchased Under the Program |
||||||||||||
| October 1, 2011 to October 31, 2011 |
109,686 | $ | 19.59 | 109,686 | $ | 9,071,450 | ||||||||||
| November 1, 2011 to November 30, 2011 |
13,081 | $ | 24.03 | 13,081 | $ | 8,757,110 | ||||||||||
| December 1, 2011 to December 31, 2011 |
17,057 | $ | 24.27 | 17,057 | $ | 8,343,169 | ||||||||||
|
|
|
|
|
|||||||||||||
| Total |
139,824 | $ | 20.57 | 139,824 | ||||||||||||
|
|
|
|
|
|||||||||||||
| 1 | Represents shares of Common Stock repurchased in the open market in connection with our share repurchase program, under which we may repurchase shares of our common stock from time to time in the open market subject to prevailing business and market conditions and other factors. Our board of directors authorized an initial $10 million and publicly announced such program on January 28, 2008, and further increased such authorization on October 20, 2008, April 24, 2009, May 20, 2010 and October 22, 2010, such that the total aggregate size of our program is $45 million. There is no expiration date associated with our share repurchase program. |
| 2 | Includes $0.02 per share broker commission. |
| Item 6. | Selected Financial Data |
You should read the following selected consolidated financial and operating information for Volterra together with “Management’s Discussion and Analysis of Financial Condition and Results of Operations” and our consolidated financial statements and notes thereto included elsewhere in this annual report on Form 10-K.
The consolidated statements of income data for the years ended December 31, 2011, 2010, and 2009, and the consolidated balance sheet data as of December 31, 2011 and 2010, are derived from the audited consolidated financial statements included elsewhere in this report. The consolidated statements of income data for the years ended December 31, 2008 and 2007, and the consolidated balance sheet data as of December 31, 2009, 2008 and 2007, are derived from audited consolidated financial statements not included in this report. Historical results for any prior or interim period are not necessarily indicative of the results to be expected for a full fiscal year or for any future period.
| Year Ended December 31, | ||||||||||||||||||||
| 2011 | 2010 | 2009 | 2008 | 2007 | ||||||||||||||||
| (in thousands except per share data) | ||||||||||||||||||||
| Statements of Income Data: |
||||||||||||||||||||
| Net revenue |
$ | 155,986 | $ | 153,634 | $ | 104,937 | $ | 104,155 | $ | 74,689 | ||||||||||
| Net income |
$ | 20,644 | $ | 28,440 | $ | 10,940 | $ | 14,258 | $ | 313 | ||||||||||
| Basic net income per share |
$ | 0.84 | $ | 1.18 | $ | 0.48 | $ | 0.60 | $ | 0.01 | ||||||||||
| Diluted net income per share |
$ | 0.79 | $ | 1.10 | $ | 0.45 | $ | 0.57 | $ | 0.01 | ||||||||||
| Weighted average shares outstanding, basic |
24,654 | 24,195 | 22,968 | 23,750 | 24,332 | |||||||||||||||
| Weighted average shares outstanding, diluted |
26,163 | 25,878 | 24,383 | 25,201 | 26,302 | |||||||||||||||
| December 31, | ||||||||||||||||||||
| 2011 | 2010 | 2009 | 2008 | 2007 | ||||||||||||||||
| (in thousands) | ||||||||||||||||||||
| Balance Sheets Data: |
||||||||||||||||||||
| Cash, cash equivalents and short-term investments |
$ | 126,733 | $ | 99,827 | $ | 73,776 | $ | 57,354 | $ | 47,414 | ||||||||||
| Current assets |
$ | 166,752 | $ | 137,348 | $ | 101,423 | $ | 85,602 | $ | 67,681 | ||||||||||
| Total assets |
$ | 175,716 | $ | 146,207 | $ | 106,442 | $ | 91,292 | $ | 74,095 | ||||||||||
| Total stockholders’ equity |
$ | 159,221 | $ | 128,409 | $ | 91,803 | $ | 75,913 | $ | 63,358 | ||||||||||
26
Table of Contents
| Item 7. | Management’s Discussion and Analysis of Financial Condition and Results of Operations |
The following discussion and analysis of our financial condition and results of our operations should be read in conjunction with the consolidated financial statements and the notes to those statements included elsewhere in this annual report on Form 10-K. This discussion contains forward-looking statements that involve risks and uncertainties. Our actual results could differ materially from those contained in these forward-looking statements due to a number of factors, including but not limited to those discussed in Item 1A “Risk Factors” and elsewhere in this report.
Overview
Our net revenue was $156.0, $153.6, and $104.9 million in 2011, 2010, and 2009, respectively. We generated net income of $20.6, $28.4, and $10.9 million in 2011, 2010 and 2009, respectively. As of December 31, 2011, we had retained earnings of $43.2 million.
Our net revenue consists primarily of sales of our power management semiconductor products. When evaluating our net revenue, we categorize our sales into three major markets: servers and storage; networking and communications; and consumer and portable. As disclosed in our annual report on Form 10-K for the fiscal year ended December 31, 2010, as filed with the SEC on March 8, 2011, we have simplified the number of markets we use to evaluate net revenue, and sales in the previously reported desktop and workstation market are now reported in our consumer and portable market. The electronics manufacturing industry is complex and disaggregated, and electronic system producers typically utilize distributors and outsourced suppliers to provide procurement, manufacturing, design, and other supply chain related services within the industry. We attempt to quantify the amount of sales within the major markets identified above, but such quantified amounts are approximations only, as we must rely upon estimates and assumptions regarding the incorporation of our products sold to distributors or other outsourced suppliers into the systems of the OEMs, ODMs, CEMs, or merchant power supply manufacturers for each particular market. In 2011, we estimate that 58% of our net revenue was derived from sales in the server and storage market, 35% from the consumer and portable market and 7% from the networking and communications market. We believe that the most significant portion of our revenues in the upcoming fiscal year will continue to be derived from sales in the server and storage market.
Our sales and accounts receivable are currently concentrated with a small group of customers, and we expect this to continue in the future. In 2011, IBM Corp., Hon Hai Precision Industry Co., Silicon Application Corp. and Flextronics Manufacturing (Hong Kong) LTD each accounted for more than 10% of our net revenue, and collectively accounted for 72% of our net revenue and 75% of our accounts receivable. In 2010, IBM Corp. and Hon Hai Precision Industry Co., each accounted for more than 10% of our net revenue, and collectively accounted for 43% of our net revenue and 49% of our accounts receivable. While we report revenue for direct sales to particular customers, our sales data may not accurately reflect the additional “indirect” demand from distributors and outsourced suppliers who purchase our products pursuant to their business relationships with these same customers. Because we have less visibility into and are not able to quantify this “indirect” demand, we are unable to determine how much additional revenue these customers may generate. In addition, our sales data also may not identify customers who do not directly account for 10% of our net revenue, but may be significant in that such customers also generate substantial “indirect” demand from distributors and outsourced suppliers. If any such customer were to stop incorporating our products or third party products containing our components into its designs, we would not only lose the direct revenue we receive from the customer, but we could also lose a portion of the indirect revenue from third parties who do business with such customer. If we were to lose or experience a significant reduction in demand from one or more of our key customers either to which we sell directly or which generates “indirect” demand or if we were to fail to collect our accounts receivable from one or more of our key customers, our operating results and financial position would be materially adversely impacted.
Because demand for our products is impacted by demand for our customers’ products, our revenue depends on the timing, size, and speed of commercial introductions of systems that use our products, and our customers’ ability to manage their inventory in relationship to such demand. We continue to expect a significant amount of
27
Table of Contents
our revenue to come from the commercial introduction of new systems, which is often more difficult to forecast than ongoing demand for previously introduced systems. A number of our customers’ applications, particularly in the consumer and portable market, are subject to short product cycles and prone to delays in development and commercial introduction or significant changes in demand, making it inherently difficult to accurately forecast demand for such applications in any period. A number of our customers, such as ODMs, CEMs, and merchant power supply manufacturers, also are dependent upon the demand of other companies, which makes sales to such parties more difficult to forecast accurately. These fluctuations in demand could materially affect our operating results on a period by period basis.
We recognize revenue on our sales upon shipment with a provision for estimated sales returns and allowances. A portion of our revenues comes from customer orders that are both received and shipped against within the same quarter, or “turns business,” which is inherently difficult to forecast. We estimate turns business as a percent of net revenue as the ratio of net revenue less beginning backlog to net revenue making adjustments for the effect of sales return reserves or other adjustments to net revenue not included in backlog. Turns business was between 10% and 20% in the fourth quarter of 2011 and 2010. If our turns business increases, forecasting revenue becomes more difficult. Generally, our current sales practice allows customers to, and customers routinely do, revise and cancel orders and reschedule delivery dates on relatively short notice pursuant to changes in the customer’s requirements. In addition, in circumstances where we have achieved our objectives in a period or when we have limited or insufficient inventory available, we may delay shipment of orders. For these reasons, backlog has limited value as a predictor of future revenues.
We typically sell directly through our internal sales force to customers in North America. We sell both directly and indirectly through distributors internationally, under agreements that generally do not provide for price adjustments after purchase and provide limited return rights in the event of product failure. We have made no sales to U.S. distributors. Sales to international distributors represented 27% of net revenue in 2011 and 2010. We expect the sales channels we use and the mix of business between distribution and direct sales to change as our product offerings and customers evolve.
Our cost of revenue consists primarily of purchases of silicon wafers and related costs of assembly, test and shipment of our products, and compensation and related costs of personnel and equipment associated with production management and quality assurance. Our gross margins have historically varied significantly, and may continue to vary, based on a variety of factors, including changes in the relative mix of the products we sell, the markets and geographies where we sell, the size and nature of our customers in these markets, the levels of sales to distributors, manufacturing volumes and yields, discounts or other financial incentives to customers and inventory and overhead costs. Generally, as we introduce new products, we initially incur higher unit production costs, and as the product ramp progresses, our overall unit production costs decrease as manufacturing efficiency improves. In addition, because our power management products are highly complex and the manufacturing process for our products is technically challenging, previously undetected design defects and minor deviations in the manufacturing process can cause substantial decreases in yields or quality. Such decreases in yields or quality can impact our gross margins due to a reduction in our revenue as a result of significant product returns, may cause us to incur product replacement costs, and may cause us to rework or scrap inventory that had been manufactured with the defect. If we are unable to manage these risks, our revenue and gross margins and financial position may be materially adversely impacted. Finally, consistent with the overall market for power management solutions, we expect to face price pressure over time. In order to maintain or improve our gross margins, we will need to introduce new, lower cost products, increase volumes, reduce unit costs or achieve a combination of these objectives.
We purchase our inventory pursuant to standard purchase orders. As lead times at our manufacturing vendors can be up to three months or more, we typically build inventory based on our sales forecasts rather than customers’ orders, subjecting us to inventory risk. If, after initial orders are placed, we change certain features of our product to accommodate customer requirements, we may create additional inventory that we may not be able to sell. In the event of an inventory write-down either because the inventory exceeds demand, becomes obsolete, or contains previously undetected defects and must be reworked or scrapped, our gross margins could be materially adversely impacted. On the other hand, because our manufacturing lead times tend to be longer than
28
Table of Contents
our order lead times and capacity at our manufacturing vendors may be constrained, our net revenue and relationship with our customers could be adversely impacted if we do not have adequate inventory available to meet customer demand. Our inventory levels were $14.7 million at the end of the fourth quarter of 2011, and inventory turns, calculated as our annualized cost of revenue for the quarter divided by our inventory as of the end of such quarter, decreased to 4.4 in the fourth quarter of 2011 compared to 4.5 turns in third quarter of 2011 and increased from 3.7 turns in the fourth quarter of 2010. If the amount of inventory we are holding increases or our inventory turns decrease, the risk of a potential inventory write-down and adverse impact on our gross margins increases.
Our research and development expense consists primarily of compensation and related costs for employees involved in the design and development of our products, prototyping and other development expense, and the depreciation costs related to equipment being used for research and development. All research and development costs are expensed as incurred. Research and development expenses can fluctuate as a result of long design cycles with periods of relatively low expenses punctuated with increased expenditures for prototypes and product development toward the end of the design cycle.
Selling, general and administrative expense consists primarily of compensation and related costs for employees involved in sales and marketing, applications engineering, general management, finance, human resources and information technology, as well as expenses related to professional services, insurance and business travel.
Litigation expenses consist primarily of attorneys’ fees and costs and expenses associated with our litigation matters described in Item 3. Legal Proceedings, and such legal proceedings may continue for the upcoming year and beyond. In 2011, our litigation expenses were approximately $4.7 million.
Our income tax provision is dependent on our estimated annual effective tax rate. Our annual effective tax rate has fluctuated and is dependent on the mix of income and losses between domestic and international operations. Additionally, our annual effective tax rate may also be impacted by any future utilization of available net operating loss carryforwards to offset taxable income, the utilization of tax credit carry forwards to offset income tax in the U.S. and changing statutory income tax rates. Our domestic deferred tax assets are fully offset by a valuation allowance because, based on the available objective evidence, we believe it is more likely than not that the net deferred tax assets will not be realized. If we later determine that it is more likely than not that the deferred tax assets would be realized, we may revise this assessment, which could result in a favorable adjustment to the reported income tax provision in the period of re-assessment followed by higher reported tax rates in subsequent periods. Our foreign income is typically subject to lower statutory rates than our domestic income. We expect that both our geographical mix of taxable income and losses as well as the statutory rates we are subject to internationally may change over time, resulting in changes to our effective tax rate and reported income tax provision.
Critical Accounting Policies and Estimates
Our discussion and analysis of our financial condition and results of operations are based upon our consolidated financial statements, which have been prepared in accordance with accounting principles generally accepted in the United States. The preparation of these consolidated financial statements requires us to make estimates and judgments that affect the reported amounts of assets, liabilities, revenue and expenses, and related disclosure of contingent assets and liabilities. On an ongoing basis, we evaluate our estimates, including those related to sales returns and allowances, inventory valuation, income taxes, and stock-based compensation. We base our estimates on historical experience and on various other assumptions that are believed to be reasonable under the circumstances and form the basis for making judgments about the carrying value of assets and liabilities that are not readily apparent from other sources. Actual results may differ from the estimates under different conditions.
29
Table of Contents
We believe the following critical accounting policies and estimates involve more significant judgments used in the preparation of our financial statements.
Revenue Recognition. We recognize revenue when four basic criteria are met. They are: (1) persuasive evidence of an arrangement exists; (2) delivery has occurred or service has been rendered; (3) collectability is reasonably assured, and (4) the fee is fixed or determinable. Determination of criterion (1) is based on a purchase order received from the customer. Determinations of criteria (2) and (3) are based on shipment when title transfers to the customer and management’s judgment regarding the collectability of the amounts billed. Determination of criterion (4) is based on the fixed price charged for products delivered adjusted for any applicable discounts. Should management determine that these criteria are not met for certain transactions, revenue recognized for any reporting period could be adversely impacted.
Revenue from product sales is recognized upon shipment when title passes and a provision is made for estimated returns and allowances. Our sales to distributors are made under agreements that do not provide for price adjustments after purchase and provide for limited return rights in the event of a product failure. Revenue on these sales is recognized upon shipment at which time title passes.
We track historical rates of return by identifying the period in which the returned products were originally shipped. We then compute a historical sales return rate for prior quarterly periods. To determine the estimated return rate for any period, this historical sales return rate may be adjusted for unusual past returns experience related to specific quality issues or other unusual circumstances that are not expected to recur, and consideration of any current information about known product failure rates or business developments. Based on this historical data as well as current business expectations, we estimate sales returns. While we believe our methodology enables us to make reasonable estimates of sales returns, because of the inherent nature of estimates and our limited historical experience, there is a risk that there could be significant differences between actual amounts and our estimates. A significant difference between actual amounts and our estimates could significantly impact our reported operating results.
Inventory Valuation. Inventory is valued at the lower of standard cost (which approximates actual cost on a first-in-first-out basis) or market. We record provisions for inventories for excess or obsolete work-in-process and finished goods. Newly developed products are generally not valued until they have been qualified for manufacturing and success in the marketplace has been demonstrated through sales and backlog, among other factors. Until products have been qualified for manufacturing and success in the marketplace has been demonstrated, costs associated with these products are generally considered period costs and expensed to research and development. In addition to provisions based on newly introduced parts, statistical and judgmental assessments are made for the remaining inventory based on assumptions about future demand. We identify excess and obsolete inventory by analyzing inventory aging, recent sales, order backlog, and demand forecasts. Based on these and other factors, we estimate on an individual product basis the net realizable value of our inventory. Net realizable value is determined as the forecast sales of the product less the estimated cost of disposal. We reduce the carrying value to estimated net realizable value if it is less than standard cost. While our estimates require us to make significant judgments and assumptions about future events, we believe our relationships with our customers, combined with our understanding of the markets we serve, provide us with the ability to make reliable estimates. If actual market conditions and resulting product sales were to be less favorable than our projections, additional inventory provisions may be required that could adversely affect our operating results.
Accounting for Income Taxes. We account for income taxes using the assets and liability method. Under this method, we determine deferred tax assets and liabilities based upon the differences between the financial statement carrying amounts of existing assets and liabilities reported in the financial statements and the tax basis of assets and liabilities using enacted tax rates in effect for the year in which the temporary differences are expected to affect taxable income.
The tax consequences of most events recognized in the current year’s financial statements are included in determining income taxes currently payable. However, because tax laws and financial accounting standards differ
30
Table of Contents
in their recognition and measurement of assets, liabilities, equity, revenue, expenses, gains, and losses, differences arise between the amount of taxable income and pretax financial income for a reporting period and between the tax basis of assets or liabilities and their reported amounts in the financial statements. It is assumed that the reported amounts of assets and liabilities will be recovered and settled, respectively. The difference between the tax basis of an asset or a liability and its reported amount in the consolidated balance sheet will result in a taxable or a deductible amount in some future years when the related liabilities are settled or the reported amounts of the assets are recovered. This gives rise to deferred tax assets and liabilities. We have established a full valuation allowance against our domestic deferred tax assets for all periods since inception.
We assess the likelihood that our deferred tax assets will be recovered from future taxable income, considering all available evidence such as historical levels of income or losses, expectations and risks associated with estimates of future taxable income and ongoing prudent and feasible tax strategies. We believe it is more likely than not that such assets will not be realized. Likewise, if we later determine that it is more likely than not that the deferred tax assets would be realized, the previously provided valuation allowance would be reversed, which would likely result in the recording of an income tax benefit in the period of reduction and increase our effective tax rate in subsequent periods. See Note 7, “Income Taxes” to Notes to the Consolidated Financial Statements for further discussion.
Stock-based Compensation. Stock-based compensation cost is calculated on the date of grant based on the estimated fair value of the award. For grants made prior to January 1, 2006, the compensation cost is recognized on an accelerated basis over the vesting period of each grant. For grants made on or after January 1, 2006, the compensation cost is recognized on a straight-line basis over the vesting period. In the absence of an actively traded market for similar financial instruments to those being granted, estimating the fair value of stock-based compensation is inherently difficult because the value of the financial instruments cannot be objectively verified.
We currently use the Black-Scholes option pricing model to estimate the fair value of our stock options under our stock option plans and rights granted under the 2004 Employee Stock Purchase Plan (ESPP). The determination of the fair value of share based payment awards utilizing the Black-Scholes option pricing model is affected by our stock price and a number of assumptions including expected term, and volatility. We estimate these key assumptions using historical information and judgment regarding Company-specific and market factors and trends. When estimating expected volatility, we consider the historical volatility of our stock and implied volatility on traded options on our stock. Prior to 2009, due to the limited history of trading and lack of liquidity in both the market for our stock and options on our stock, we also considered the implied volatility on a group of peer companies to develop our estimates as well as other factors. Option grants typically vest over four years to provide long-term compensation and a retention incentive to employees. To estimate the expected term of options granted, we consider the contractual life and vesting period of the option, historical exercise behavior of our employees, and other factors. After determination of the fair value of the awards, the amount of expense that we recognize is affected by the estimated award forfeiture rate. If the estimates for these key inputs are changed over time, the amounts recorded for future stock-based compensation arrangements may increase, which could materially adversely affect our results of operations.
To determine the compensation expense related to restricted stock unit awards under our 2004 Equity Incentive Plan, such expense is determined using the fair market value of our common stock on the date of the grant, and the compensation expense is recognized over the vesting period of such awards or upon the achievement of specified performance goals.
In some instances, performance based stock options may be granted and recognition of any related compensation expense may be dependent upon the achievement of specified performance goals.
31
Table of Contents
Results of Operations
The following table sets forth our results of operations as a percentage of net revenue for the periods indicated:
| Year Ended December 31, | ||||||||||||
| 2011 | 2010 | 2009 | ||||||||||
| Net revenue |
100 | % | 100 | % | 100 | % | ||||||
| Cost of revenue |
43 | 39 | 40 | |||||||||
|
|
|
|
|
|
|
|||||||
| Gross margin |
57 | 61 | 60 | |||||||||
|
|
|
|
|
|
|
|||||||
| Operating expenses: |
||||||||||||
| Research and development |
24 | 22 | 25 | |||||||||
| Selling, general and administrative |
17 | 16 | 19 | |||||||||
| Litigation |
3 | 4 | 5 | |||||||||
|
|
|
|
|
|
|
|||||||
| Total operating expenses |
44 | 42 | 49 | |||||||||
|
|
|
|
|
|
|
|||||||
| Income from operations |
13 | 19 | 11 | |||||||||
| Non-operating expense (income), net |
— | — | — | |||||||||
|
|
|
|
|
|
|
|||||||
| Income before income taxes |
13 | 19 | 11 | |||||||||
| Income tax expense |
— | — | — | |||||||||
|
|
|
|
|
|
|
|||||||
| Net income |
13 | % | 19 | % | 11 | % | ||||||
|
|
|
|
|
|
|
|||||||
Comparison of Year Ended December 31, 2011 to Year Ended December 31, 2010
Net Revenue. Net revenue was $156.0 million in 2011 and $153.6 million in 2010, an increase of 2%. The increase in net revenue was primarily due to increases of $21.9 million in the consumer and portable market, partially offset by decreases of $15.4 million and $4.1 million in sales to the server and storage market and networking and communications market, respectively.
Cost of Revenue and Gross Margin. Cost of revenue was $66.5 million in 2011 and $59.2 million in 2010, an increase of 12%. Gross margin was $89.5 million in 2011 and $94.4 million in 2010, a decrease of 5%. Gross margin as a percent of net revenue was 57% in 2011 and 61% in 2010. The decrease in gross margin as a percentage of revenue was primarily due to a shift in product mix towards the consumer and portable market, which products currently have somewhat lower gross margin percentage than products in our other markets. We partially mitigated the decrease in gross margin percentage with cost reductions.
Research and Development. Research and development expenses were $37.4 million in 2011 and $35.0 million in 2010, an increase of 7%. The increase in 2011 was primarily due to an increase in wages and other related expenses of $3.2 million, which was partially offset by lower performance based bonus expense of $1.0 million.
Selling, General and Administrative. Selling, general and administrative expenses were $26.6 million in 2011 and $24.7 million in 2010, an increase of 8%. The increase in 2011 was primarily due to increases in stock-based compensation of $1.5 million and intellectual property legal expenses of $1.1 million, which was partially offset by lower performance based bonus expense of $1.8 million.
Litigation. Litigation expenses were approximately $4.7 million in 2011 and $6.0 million in 2010, a decrease of 22%. The decrease in 2011 was primarily due to the decrease in activity related to our litigation brought in the United States District Court in the Northern District of California against the Defendants, as described in Item 3. Legal Proceedings.
Provision for Income Tax. Our annual income tax provision was $0.1 million and $0.4 million in fiscal years 2011 and 2010, respectively. Our effective tax rate for fiscal years 2011 and 2010 was 1%.
32
Table of Contents
Comparison of Year Ended December 31, 2010 to Year Ended December 31, 2009
Net Revenue. Net revenue was $153.6 million in 2010 and $104.9 million in 2009, an increase of 46%. Revenues increased approximately $36.2 million, $11.0 million and $3.7 million in the server and storage, consumer and portable, and networking and communications markets respectively, but these increases were offset by a decrease in revenue of approximately $2.3 million in the desktop and workstation market.
Cost of Revenue and Gross Margin. Cost of revenue was $59.2 million in 2010 and $42.3 million in 2009, an increase of 40%. Gross margin was $94.4 million in 2010 and $62.7 million in 2009, an increase of 51%. Gross margin as a percent of net revenue was 61% in 2010 and 60% in 2009. The increase in gross margin percentage was largely due to ongoing cost reduction activities.
Research and Development. Research and development expenses were $35.0 million in 2010 and $26.6 million in 2009, an increase of 32%. The increase in 2010 was primarily due to the increase in wages mainly related to the increase in headcount and annual merit raises, performance based accruals and related expenses of $4.9 million, intellectual property expense of $0.9 million and stock-based compensation of $0.7 million.
Selling, General and Administrative. Selling, general and administrative expenses were $24.7 million in 2010 and $19.7 million in 2009, an increase of 25%. The increase in 2010 was primarily due to the increase in wages mainly related to the increase in headcount and annual merit raises, performance based accruals and related expenses of $3.5 million and stock-based compensation of $0.3 million.
Litigation. Litigation expenses were approximately $6.0 million in 2010 and $5.2 million in 2009, an increase of 15%. The increase in 2010 was primarily due to the increase in activity related to our litigation brought in the United States District Court in the Northern District of California against the Defendants, as described in Item 3. Legal Proceedings.
Provision for Income Tax. Our annual income tax provision was $0.4 million and $0.2 million in fiscal years 2010 and 2009, respectively. Our effective tax rate for fiscal years 2010 and 2009 were 1% and 2%, respectively. The decrease in the effective tax rate in fiscal year 2010 was primarily due to the increase in income before taxes from international operations which are subject to lower statutory income tax rates.
Liquidity and Capital Resources
As of December 31, 2011, we had working capital of $152.8 million, including cash and cash equivalents of $126.7 million. Our cash and cash equivalents increased by $39.8 million in 2011. Our short-term investments decreased by $12.9 million in 2011. We currently have no debt and believe that our current cash and cash equivalents as well as cash flows from operations will be sufficient to continue to fund our operations and meet our capital needs for fiscal year 2012.
Cash provided by operating activities is net income adjusted for certain non-cash items and changes in operating assets and liabilities. Our operating activities provided net cash of $29.0 million, $30.7 million, and $18.2 million, in 2011, 2010, and 2009, respectively.
Cash provided from operating activities in 2011 was primarily due to net income of $20.6 million, adjustments for non-cash items of $11.3 million and an increase in accounts payable of $1.6 million due to the timing of goods and services received from suppliers. The primary non-cash items during 2011 were stock-based compensation expenses of $8.2 million and depreciation and amortization expenses of $2.9 million. The above increases in cash were partially offset by an increase in accounts receivables of $3.0 million and decreases in accrued liabilities and long-term liabilities of $2.6 million. The increase in accounts receivable was due primarily to the timing of customer payments. The decrease in accrued liabilities and long-term liabilities was primarily due to a decrease in profit-dependent accruals.
Cash provided from operating activities in 2010 was primarily due to net income of $28.4 million and increases in accrued liabilities and long-term liabilities of $2.5 million primarily due to wage accruals, other employment benefit related expense accruals, and profit-dependent accruals. The above increases in cash were partially offset by increases in accounts receivables and inventories of $4.0 million and $5.1 million,
33
Table of Contents
respectively. The increase in accounts receivable was due to increased revenues and the increase in inventories was primarily due to increased production levels. The primary sources of cash from operations in 2009 was primarily due to net income of $10.9 million and decreases in inventories of $3.4 million due to improvements in our inventory management practices and improving business conditions in the second half of 2009. There was additional cash generated from increases in accrued liabilities and long-term liabilities of $1.7 million related to higher wage accruals, other employment benefit related expense accruals and profit-dependent accruals. The above increases in cash were partially offset by an increase in accounts receivables of $3.3 million and decrease in accounts payable of $2.3 million. The increase in accounts receivable was due to increased shipments to our customers in the final quarter of 2009 and the decrease in accounts payable was primarily due to the timing of payments to our vendors.
Our investing activities provided net cash of $8.9 million in 2011, compared to net cash used of $14.5 million in 2010 and net cash provided of $4.6 million in 2009. The primary source of cash for investing in 2011 was the maturity of short-term investment of $29.9 million, partially offset by purchases of short-term investments of $17.0 million and purchases of property and equipment of $4.0 million. The primary use of cash from investing in 2010 was the purchase of short-term investments of $31.5 million and purchases of property and equipment of $6.1 million, partially offset by the maturity of short-term investments of $23.1 million. The primary source of cash from investing in 2009 was the maturity of short-term investments of $22.0 million partially offset by the purchase of short-term investments of $16.0 million and purchases of property and equipment of $1.4 million.
Our financing activities provided net cash of $1.9 million in 2011 and $1.5 million in 2010 and net cash used of $0.5 million in 2009. The primary source of cash from financing in 2011 was from the sales of securities under the stock option and employee stock purchase plans of $9.9 million, partially offset by repurchases of our common stock of $7.8 million. The primary source of cash from financing in 2010 was from the sales of securities under the stock option and employee stock purchase plans of $13.0 million, partially offset by repurchases of our common stock of $11.5 million. The primary use of cash from financing in 2009 was the repurchase of our common stock of $7.5 million, partially offset by sales of securities under the stock option and employee stock purchase plans of $7.0 million.
As of December 31, 2011, the cash and short-term investments held by our foreign subsidiaries was approximately $61.5 million. If these funds were repatriated to the U.S., under current tax law we could be required to accrue and pay U.S. taxes on a portion of these funds. Our current plan is to permanently reinvest these funds outside the U.S.
Contractual Obligations
The following table sets forth our contractual obligations as of December 31, 2011 (in thousands) and the periods in which such obligations are expected to be settled.
| Fiscal Year |
Purchase obligations |
Operating lease obligations |
||||||
| 2012 |
$ | 3,067 | $ | 1,602 | ||||
| 2013 |
51 | 1,212 | ||||||
| 2014 |
— | 1,032 | ||||||
| 2015 |
— | 217 | ||||||
| 2016 |
— | 53 | ||||||
|
|
|
|
|
|||||
| Total |
$ | 3,118 | $ | 4,116 | ||||
|
|
|
|
|
|||||
Operating lease obligations consist of the estimated obligations under our real property or facility leases. Purchase obligations are comprised of the estimated obligation for non-cancellable in-process silicon wafers. We depend entirely upon third-party foundries to manufacture our silicon wafers. Due to lengthy foundry lead times, we typically order these materials up to three months or more in advance of required delivery dates, and we are obligated to pay for the materials in accordance with the contractual payment terms, which typically require payment within one month.
34
Table of Contents
The amounts in the table above exclude $1.4 million of income tax liabilities as we are unable to reasonably estimate the timing of settlement. See Note 7, “Income Taxes” of Notes to the Consolidated Financial Statements for further discussion.
Recent Accounting Pronouncements
We have determined that there were no recent accounting pronouncements issued during the year ended December 31, 2011 that are expected to have a material impact on our financial position or results of operations.
| Item 7A. | Quantitative and Qualitative Disclosures About Market Risk |
The primary objective of our investment activities is to preserve principal while maximizing income without significantly increasing risk. Some of the securities in which we invest may be subject to interest rate risk. This means that a change in prevailing interest rates may cause the market value of the investment to fluctuate. To minimize this risk, we typically maintain our portfolio of cash equivalents and short-term investments in a variety of securities, including money market funds, government treasury and agency securities. The risk associated with fluctuating interest rates is limited to our investment portfolio. As of December 31, 2011 and 2010, our cash equivalents were held in checking and money market accounts. As of December 31, 2010, all of our short-term investments were U.S. treasury securities. If market interest rates were to increase or decline by 10% from interest rates as of December 31, 2011 and 2010, the impact on our portfolio on these dates would not have been material. We do not currently use derivative instruments in our investment portfolio.
Our sales outside the United States are transacted in U.S. dollars; accordingly, our reported sales are not impacted by foreign currency rate changes. As of December 31, 2011 and 2010, fluctuations in foreign currency exchange rates did not have a material impact on our results of operations.
35
Table of Contents
| Item 8. | Financial Statements and Supplementary Data |
INDEX TO CONSOLIDATED FINANCIAL STATEMENTS
36
Table of Contents
VOLTERRA SEMICONDUCTOR CORPORATION AND SUBSIDIARIES
CONSOLIDATED BALANCE SHEETS
(In thousands, except per share amounts)
| December 31, | ||||||||
| 2011 | 2010 | |||||||
| Assets | ||||||||
| Current assets: |
||||||||
| Cash and cash equivalents |
$ | 126,733 | $ | 86,931 | ||||
| Short-term investments |
— | 12,896 | ||||||
| Accounts receivable, net of allowances of $2,487 and $2,239, respectively |
22,399 | 19,437 | ||||||
| Inventories |
14,687 | 15,391 | ||||||
| Prepaid expenses and other current assets |
2,933 | 2,693 | ||||||
|
|
|
|
|
|||||
| Total current assets |
166,752 | 137,348 | ||||||
| Property and equipment, net |
7,905 | 7,125 | ||||||
| Other assets |
1,059 | 1,734 | ||||||
|
|
|
|
|
|||||
| Total assets |
$ | 175,716 | $ | 146,207 | ||||
|
|
|
|
|
|||||
| Liabilities and Stockholders’ Equity | ||||||||
| Current liabilities: |
||||||||
| Accounts payable |
$ | 5,643 | $ | 4,107 | ||||
| Accrued liabilities |
8,299 | 11,216 | ||||||
|
|
|
|
|
|||||
| Total current liabilities |
13,942 | 15,323 | ||||||
| Lease incentive |
339 | 528 | ||||||
| Other long-term liabilities |
2,214 | 1,947 | ||||||
|
|
|
|
|
|||||
| Total liabilities |
16,495 | 17,798 | ||||||
| Commitments and Contingencies (note 8) |
— | — | ||||||
| Stockholders’ equity: |
||||||||
| Preferred stock, $0.001 par value; 5,000 shares authorized; none issued and outstanding |
— | — | ||||||
| Common stock, $0.001 par value; 200,000 shares authorized; 27,847 and 27,038 shares issued, respectively 24,804 and 24,383 shares outstanding, respectively |
28 | 27 | ||||||
| Additional paid-in capital |
152,644 | 134,656 | ||||||
| Retained earnings |
43,206 | 22,562 | ||||||
| Treasury stock at cost, 3,043 and 2,655 shares, respectively |
(36,657 | ) | (28,836 | ) | ||||
|
|
|
|
|
|||||
| Total stockholders’ equity |
159,221 | 128,409 | ||||||
|
|
|
|
|
|||||
| Total liabilities and stockholders’ equity |
$ | 175,716 | $ | 146,207 | ||||
|
|
|
|
|
|||||
The accompanying notes are an integral part of these consolidated financial statements
37
Table of Contents
VOLTERRA SEMICONDUCTOR CORPORATION AND SUBSIDIARIES
CONSOLIDATED STATEMENTS OF INCOME
(In thousands, except per share amounts)
| Year Ended December 31, | ||||||||||||
| 2011 | 2010 | 2009 | ||||||||||
| Net revenue |
$ | 155,986 | $ | 153,634 | $ | 104,937 | ||||||
| Cost of revenue |
66,468 | 59,185 | 42,250 | |||||||||
|
|
|
|
|
|
|
|||||||
| Gross margin |
89,518 | 94,449 | 62,687 | |||||||||
|
|
|
|
|
|
|
|||||||
| Operating expenses: |
||||||||||||
| Research and development |
37,383 | 34,984 | 26,557 | |||||||||
| Selling, general and administrative |
26,646 | 24,664 | 19,731 | |||||||||
| Litigation |
4,679 | 6,026 | 5,225 | |||||||||
|
|
|
|
|
|
|
|||||||
| Total operating expenses |
68,708 | 65,674 | 51,513 | |||||||||
|
|
|
|
|
|
|
|||||||
| Income from operations |
20,810 | 28,775 | 11,174 | |||||||||
| Non-operating expense (income), net |
58 | (37 | ) | 5 | ||||||||
|
|
|
|
|
|
|
|||||||
| Income before income taxes |
20,752 | 28,812 | 11,169 | |||||||||
| Income tax expense |
108 | 372 | 229 | |||||||||
|
|
|
|
|
|
|
|||||||
| Net income |
$ | 20,644 | $ | 28,440 | $ | 10,940 | ||||||
|
|
|
|
|
|
|
|||||||
| Net income per share: |
||||||||||||
| Basic |
$ | 0.84 | $ | 1.18 | $ | 0.48 | ||||||
| Diluted |
$ | 0.79 | $ | 1.10 | $ | 0.45 | ||||||
| Weighted average shares outstanding: |
||||||||||||
| Basic |
24,654 | 24,195 | 22,968 | |||||||||
|
|
|
|
|
|
|
|||||||
| Diluted |
26,163 | 25,878 | 24,383 | |||||||||
|
|
|
|
|
|
|
|||||||
The accompanying notes are an integral part of these consolidated financial statements
38
Table of Contents
VOLTERRA SEMICONDUCTOR CORPORATION AND SUBSIDIARIES
CONSOLIDATED STATEMENTS OF CASH FLOWS
(In thousands)
| Year Ended December 31, | ||||||||||||
| 2011 | 2010 | 2009 | ||||||||||
| Cash flows from operating activities: |
||||||||||||
| Net income |
$ | 20,644 | $ | 28,440 | $ | 10,940 | ||||||
| Adjustments to reconcile net income to net cash provided by operating activities: |
||||||||||||
| Depreciation and amortization |
2,851 | 2,129 | 1,774 | |||||||||
| Accretion of discount on investments |
(4 | ) | (7 | ) | (43 | ) | ||||||
| Provision (release) of allowance for doubtful accounts |
74 | 90 | (192 | ) | ||||||||
| Loss on disposal of fixed assets and other |
35 | 1 | 48 | |||||||||
| Stock-based compensation |
8,233 | 6,618 | 5,433 | |||||||||
| Deferred taxes |
67 | (16 | ) | 247 | ||||||||
| Changes in operating assets and liabilities: |
||||||||||||
| Accounts receivable |
(3,036 | ) | (3,993 | ) | (3,269 | ) | ||||||
| Inventories |
752 | (5,059 | ) | 3,393 | ||||||||
| Prepaid expenses and other current assets |
434 | (573 | ) | 465 | ||||||||
| Accounts payable |
1,561 | 501 | (2,280 | ) | ||||||||
| Accrued liabilities and long-term liabilities |
(2,624 | ) | 2,524 | 1,716 | ||||||||
|
|
|
|
|
|
|
|||||||
| Net cash provided by operating activities |
28,987 | 30,655 | 18,232 | |||||||||
|
|
|
|
|
|
|
|||||||
| Cash flows from investing activities: |
||||||||||||
| Purchases of property and equipment |
(3,972 | ) | (6,111 | ) | (1,361 | ) | ||||||
| Purchases of short-term investments |
(16,996 | ) | (31,487 | ) | (16,043 | ) | ||||||
| Proceeds from maturity of short-term investments |
29,896 | 23,147 | 21,998 | |||||||||
|
|
|
|
|
|
|
|||||||
| Net cash provided by (used in) investing activities |
8,928 | (14,451 | ) | 4,594 | ||||||||
|
|
|
|
|
|
|
|||||||
| Cash flows from financing activities: |
||||||||||||
| Repurchase and retirement of common stock |
(7,821 | ) | (11,456 | ) | (7,475 | ) | ||||||
| Proceeds from issuance of common stock, net |
9,879 | 12,956 | 6,983 | |||||||||
| Taxes paid related to net share settlement of equity awards |
(171 | ) | — | — | ||||||||
|
|
|
|
|
|
|
|||||||
| Net cash provided by (used in) financing activities |
1,887 | 1,500 | (492 | ) | ||||||||
|
|
|
|
|
|
|
|||||||
| Net increase in cash and cash equivalents |
39,802 | 17,704 | 22,334 | |||||||||
| Cash and cash equivalents, beginning of year |
86,931 | 69,227 | 46,893 | |||||||||
|
|
|
|
|
|
|
|||||||
| Cash and cash equivalents, end of year |
$ | 126,733 | $ | 86,931 | $ | 69,227 | ||||||
|
|
|
|
|
|
|
|||||||
| Supplemental disclosure of cash flows: |
||||||||||||
| Cash (paid for) refunds of income taxes |
$ | (57 | ) | $ | 160 | $ | 46 | |||||
The accompanying notes are an integral part of these consolidated financial statements
39
Table of Contents
VOLTERRA SEMICONDUCTOR CORPORATION AND SUBSIDIARIES
CONSOLIDATED STATEMENTS OF STOCKHOLDERS’ EQUITY
Years Ended December 31, 2011, 2010, and 2009
(In thousands, except share amounts)
| Common Stock | Additional Paid-in Capital |
Retained Earnings (Accumulated Deficit) |
Treasury Stock |
Total Stockholders’ Equity |
||||||||||||||||||||
| Shares | Par Value | |||||||||||||||||||||||
| Balances as of December 31, 2008 |
23,103,727 | $ | 24 | $ | 102,612 | $ | (16,818 | ) | $ | (9,905 | ) | $ | 75,913 | |||||||||||
| Common stock issued for cash under stock option and employee stock purchase plans, net of repurchases |
1,045,763 | 2 | 6,981 | — | — | 6,983 | ||||||||||||||||||
| Stock-based compensation |
— | — | 5,442 | — | — | 5,442 | ||||||||||||||||||
| Treasury stock repurchases |
(820,772 | ) | — | — | — | (7,475 | ) | (7,475 | ) | |||||||||||||||
| Net income |
— | — | — | 10,940 | — | 10,940 | ||||||||||||||||||
|
|
|
|
|
|
|
|
|
|
|
|
|
|||||||||||||
| Balances as of December 31, 2009 |
23,328,718 | 26 | 115,035 | (5,878 | ) | (17,380 | ) | 91,803 | ||||||||||||||||
| Common stock issued for cash under stock option and employee stock purchase plans, net of repurchases |
1,616,556 | 1 | 12,955 | — | — | 12,956 | ||||||||||||||||||
| Stock-based compensation |
— | — | 6,666 | — | — | 6,666 | ||||||||||||||||||
| Treasury stock repurchases |
(562,520 | ) | — | — | — | (11,456 | ) | (11,456 | ) | |||||||||||||||
| Net income |
— | — | — | 28,440 | — | 28,440 | ||||||||||||||||||
|
|
|
|
|
|
|
|
|
|
|
|
|
|||||||||||||
| Balances as of December 31, 2010 |
24,382,754 | 27 | 134,656 | 22,562 | (28,836 | ) | 128,409 | |||||||||||||||||
| Common stock issued under stock plans, net of shares withheld for employee taxes |
809,145 | 1 | 9,707 | — | — | 9,708 | ||||||||||||||||||
| Stock-based compensation |
— | — | 8,281 | — | — | 8,281 | ||||||||||||||||||
| Treasury stock repurchases |
(387,708 | ) | — | — | — | (7,821 | ) | (7,821 | ) | |||||||||||||||
| Net income |
— | — | — | 20,644 | — | 20,644 | ||||||||||||||||||
|
|
|
|
|
|
|
|
|
|
|
|
|
|||||||||||||
| Balances as of December 31, 2011 |
24,804,191 | $ | 28 | $ | 152,644 | $ | 43,206 | $ | (36,657 | ) | $ | 159,221 | ||||||||||||
|
|
|
|
|
|
|
|
|
|
|
|
|
|||||||||||||
The accompanying notes are an integral part of these consolidated financial statements
40
Table of Contents
VOLTERRA SEMICONDUCTOR CORPORATION AND SUBSIDIARIES
NOTES TO CONSOLIDATED FINANCIAL STATEMENTS
(In thousands, except share and per share data)
1. Description of Business
Volterra Semiconductor Corporation (the “Company” or “Volterra”) was incorporated in Delaware in 1996, and its principal offices are located in Fremont, California. The Company designs, develops and markets proprietary, high-performance analog and mixed-signal power management semiconductors.
2. Summary of Significant Accounting Policies
(a) Principles of Consolidation
The accompanying consolidated financial statements include the accounts of the Company and its wholly owned subsidiaries. All significant inter-company balances and transactions have been eliminated in consolidation. The functional currency of foreign subsidiaries is the U.S. dollar and foreign currency transaction gains and losses are recorded in income. For all periods presented, there have been no material foreign currency transaction gains and losses. Certain prior period amounts have been reclassified to conform to the current presentation. These reclassifications did not impact any prior amounts of reported total assets, total liabilities, stockholders’ equity, results of operations, or cash flows.
(b) Risk and Uncertainties
The Company’s operations and performance depend significantly on worldwide economic conditions and their impact on purchases of the Company’s products as well as the ability of our suppliers to provide the Company with timely services. The impact of any of the matters described below could have an adverse effect on the Company’s business, results of operations and financial condition.
| • | The Company’s sales are concentrated with a relatively small group of customers as 72% of net revenue for the year ended December 31, 2011 is represented by four customers. Customers in any of the Company’s target market sectors may experience unexpected reductions in demand for their products and reduce their purchase orders from us, resulting in either the loss of a significant customer or a notable decrease in the level of sales to a significant customer. In addition, if any of these customers are unable to obtain the necessary capital to operate their business, they may be unable to satisfy their payment obligations to the Company. |
| • | The Company utilizes third-party foundries and assembly and test subcontractors to manufacture, assemble and test its products. The Company does not have long-term supply contracts with any of its foundries or suppliers. If one of these third-parties was unable to obtain the necessary capital to operate their business, they may be unable to provide the Company with timely services or to make timely deliveries of products. |
| • | Because a substantial portion of the Company’s sales are to distributors and outsourced suppliers and not directly to electronic system producers, we have limited visibility into ultimate product demand, which makes sales forecasting more difficult for the Company. Demand for our products may not materialize, subjecting the Company to risks of high inventory carrying costs and obsolescence. |
(c) Use of Estimates
The preparation of financial statements in conformity with generally accepted accounting principles in the United States of America requires management to make estimates and assumptions that affect the amounts reported in the financial statements and the accompanying notes.
The accounting estimates that require our most significant, difficult and subjective judgments include:
| • | determination of sales return allowances; |
41
Table of Contents
VOLTERRA SEMICONDUCTOR CORPORATION AND SUBSIDIARIES
NOTES TO CONSOLIDATED FINANCIAL STATEMENTS
(In thousands, except share and per share data)
| • | the recognition and measurement of current and deferred income taxes (including the measurement of uncertain tax positions); |
| • | the valuation of inventory; and |
| • | measurement of stock-based compensation |
Actual results could differ from those estimates.
(d) Financial Instruments and Concentrations of Credit Risk
Financial instruments consist of cash equivalents, short-term investments, accounts receivable, and accounts payable. The carrying value of the Company’s financial instruments approximates the respective fair value due to the relatively short maturities of these instruments. Financial instruments that potentially subject the Company to concentrations of credit risk consist principally of investments and trade accounts receivable.
The Company maintains cash, cash equivalents, and short-term investments with high credit quality financial institutions. Cash equivalents consist of highly liquid investments maturing in 90 days or less from the date of purchase. Short-term investments are comprised of U.S. Treasury and debt securities with remaining contractual maturities on the date of purchase greater than 90 days but less than one year. Investments in debt securities are classified as held-to-maturity and carried at amortized cost. The following table reconciles the amortized cost to the fair value of short-term investments:
| As of December 31, | ||||||||
| 2011 | 2010 | |||||||
| Amortized cost |
$ | — | $ | 12,896 | ||||
| Unrealized gains (losses) |
— | — | ||||||
|
|
|
|
|
|||||
| Fair value |
$ | — | $ | 12,896 | ||||
|
|
|
|
|
|||||
The Company sells its products to distributors and original equipment manufacturers (and their outsourced suppliers) in the computing, storage, networking, and consumer electronic industries. The Company performs credit evaluations of its customers’ financial condition and generally does not require collateral from its customers. An allowance is provided for bad debts when it is probable and estimable that accounts receivable will not be collected.
(e) Accounts Receivable
An allowance for doubtful accounts is recorded based on management’s judgments and estimates on the collectability of accounts receivable based on historical bad debt experience, customers’ creditworthiness, and recent changes in customers’ payment trends. If circumstances change adversely, additional bad debt allowances may be required.
(f) Segment Reporting and Significant Customers
The Company is organized and operates as a single business segment: analog and mixed-signal power management semiconductors. The Company’s chief operating decision maker, the Chief Executive Officer, reviews financial information presented on a consolidated basis for the purposes of making operating decisions and assessing financial performance.
42
Table of Contents
VOLTERRA SEMICONDUCTOR CORPORATION AND SUBSIDIARIES
NOTES TO CONSOLIDATED FINANCIAL STATEMENTS
(In thousands, except share and per share data)
Significant customers are those customers accounting for more than 10% of the Company’s total net revenue or accounts receivable. For each significant customer, net revenue as a percentage of total net revenue and accounts receivable as a percentage of total accounts receivable are as follows:
| Net Revenue | Accounts Receivable | |||||||||||||||||||
| Year Ended December 31, | As of December 31, | |||||||||||||||||||
| Customer |
2011 | 2010 | 2009 | 2011 | 2010 | |||||||||||||||
| A |
26 | % | 31 | % | 39 | % | 25 | % | 31 | % | ||||||||||
| B |
19 | % | 12 | % | * | 23 | % | 18 | % | |||||||||||
| C |
16 | % | * | 11 | % | 15 | % | * | ||||||||||||
| D |
11 | % | * | * | 12 | % | * | |||||||||||||
| E |
* | * | 15 | % | * | * | ||||||||||||||
| * | Less than 10% |
The Company reports its net revenue by geographic areas according to the destination to which the product was shipped. The geographic area to which a product was shipped is not necessarily the same location in which the product is ultimately used. In all periods, substantially all of the Company’s net revenue was denominated in U.S. dollars. Net revenue by geographic area was as follows:
| Year Ended December 31, | ||||||||||||
| Geographic Area |
2011 | 2010 | 2009 | |||||||||
| China |
57 | % | 50 | % | 42 | % | ||||||
| Singapore |
32 | 38 | 47 | |||||||||
| Japan |
4 | 4 | 2 | |||||||||
| Taiwan |
3 | 3 | 4 | |||||||||
| United States |
2 | 2 | 2 | |||||||||
| Germany |
1 | 2 | 2 | |||||||||
| Other |
1 | 1 | 1 | |||||||||
|
|
|
|
|
|
|
|||||||
| 100 | % | 100 | % | 100 | % | |||||||
|
|
|
|
|
|
|
|||||||
(g) Inventories
Inventories are stated at the lower of standard cost (which approximates actual cost on a first-in, first-out basis) or market. Provisions, when required, are made to reduce excess and obsolete inventories to their estimated net realizable values.
(h) Property and Equipment
Property and equipment are stated at cost and depreciated using the straight-line method over the estimated useful lives of the assets, which are three years for computer hardware and software, and five to seven years for equipment and furniture. Leasehold improvements are amortized over the shorter of the lease term or the estimated useful life of seven years. The Company’s long-lived assets are primarily located in the United States.
(i) Revenue Recognition
Revenue from the sale of semiconductor products is recognized upon shipment when title transfers to the customer provided that persuasive evidence of an arrangement exists, the price is fixed or determinable, and collection of the resulting receivable is reasonably assured. An allowance is recorded at the time of sale to
43
Table of Contents
VOLTERRA SEMICONDUCTOR CORPORATION AND SUBSIDIARIES
NOTES TO CONSOLIDATED FINANCIAL STATEMENTS
(In thousands, except share and per share data)
provide for estimated future sales returns. The allowance is based upon historical experience, current trends, and the Company’s expectations regarding future return activity. Sales returns must be authorized by Volterra and are generally limited to instances of product failure under the Company’s warranty that generally provides that products will be free from defects for a limited period of time, generally not longer than twelve months.
Volterra’s sales to distributors are made under agreements that do not provide for price adjustments after purchase and provide limited return rights under the Company’s standard warranty. Revenue on these sales is recognized upon shipment when title passes to the distributor. Volterra estimates future distributor sales returns based on historical data and current business expectations and reduces revenue for estimated future returns through the allowance for sales returns.
Revenue generally is recognized net of any taxes collected from customers and subsequently remitted to governmental authorities.
(j) Earnings Per Share
Basic net income per share is calculated by dividing net income by the weighted average shares of common stock outstanding during the period. Diluted net income per share is calculated by dividing the net income by the weighted average shares of common stock outstanding and dilutive potential common shares outstanding during the period. Dilutive potential common shares consist of dilutive shares issuable upon the exercise of outstanding stock options and the vesting of outstanding restricted stock units, computed using the treasury stock method. The sum of the quarterly net income per share will not necessarily equal the net income per share for the total period due to the effects of rounding.
The following table sets forth for all periods presented the computation of basic and diluted net income per share, including the reconciliation of the numerator and denominator used in the calculation:
| Year Ended December 31, | ||||||||||||
| 2011 | 2010 | 2009 | ||||||||||
| Numerator: |
||||||||||||
| Net income |
$ | 20,644 | $ | 28,440 | $ | 10,940 | ||||||
|
|
|
|
|
|
|
|||||||
| Denominator: |
||||||||||||
| Weighted average shares outstanding, basic |
24,654,326 | 24,195,259 | 22,968,017 | |||||||||
|
|
|
|
|
|
|
|||||||
| Effect of dilutive securities: |
||||||||||||
| Stock options and restricted stock units |
1,508,795 | 1,682,436 | 1,415,305 | |||||||||
|
|
|
|
|
|
|
|||||||
| Weighted average shares outstanding, diluted |
26,163,121 | 25,877,695 | 24,383,322 | |||||||||
|
|
|
|
|
|
|
|||||||
| Basic net income per share |
$ | 0.84 | $ | 1.18 | $ | 0.48 | ||||||
|
|
|
|
|
|
|
|||||||
| Diluted net income per share |
$ | 0.79 | $ | 1.10 | $ | 0.45 | ||||||
|
|
|
|
|
|
|
|||||||
Stock options and restricted stock units outstanding in the amount of 1,418,830, 962,609, and 2,742,579, shares for the year ended December 31, 2011, 2010, and 2009, respectively, were excluded from the computation of diluted earnings per share because they were anti-dilutive in the periods. These securities outstanding as of December 31, 2011 could dilute net income per share in the future.
(k) Income Taxes
Income taxes are accounted for under the asset and liability method. Deferred tax assets and liabilities are recognized for future tax consequences attributable to differences between the financial statement carrying
44
Table of Contents
VOLTERRA SEMICONDUCTOR CORPORATION AND SUBSIDIARIES
NOTES TO CONSOLIDATED FINANCIAL STATEMENTS
(In thousands, except share and per share data)
amounts of existing assets and liabilities and their respective tax bases, operating loss and tax credit carryforwards. Deferred tax assets and liabilities are measured using enacted income tax rates expected to apply to taxable income in the years in which those temporary differences are expected to be recovered or settled. The effect on deferred tax assets and liabilities of a change in income tax rates is recognized in income in the period that includes the enactment date. The Company has established a full valuation allowance against the domestic deferred tax assets for all periods since inception.
The Company assesses the likelihood that the deferred tax assets will be recovered from future taxable income, considering all available evidence such as historical levels of income or losses, expectations and risks associated with estimates of future taxable income on a jurisdiction by jurisdiction basis and ongoing prudent and feasible tax strategies. These assumptions require significant judgment about the forecasts of future taxable income and are consistent with the plans and estimates we are using to manage the underlying businesses. The Company believes it is more likely than not that such assets will not be realized. Likewise, if the Company later determines that it is more likely than not that the deferred tax assets would be realized, the previously provided valuation allowance would be reversed, which would likely result in the recognition of an income tax benefit in the period of reduction and increase the effective tax rate in subsequent periods.
The Company must make certain estimates and judgments about the application of complex tax laws, the expected resolution of uncertain tax positions and other matters. In the event that uncertain tax positions are resolved for amounts different than the Company’s estimates, or the related statutes of limitations expire without the assessment of additional income taxes, the Company will be required to adjust the amounts of the related assets and liabilities in the period in which such events occur. Note 7, “Income Taxes” of the Consolidated Financial Statements describes unrecognized tax benefits and the effects on the results of operations and financial position.
(l) Stock-Based Compensation
Stock-based compensation costs are calculated on the date of grant based on the estimated fair value of the award. For grants made prior to January 1, 2006, the compensation cost is recognized on an accelerated basis over the vesting period of each grant. For grants made on or after January 1, 2006, the compensation cost is recognized on a straight-line basis over the vesting period.
The effect of stock-based compensation was as follows:
| Year Ended December 31, | ||||||||||||
| 2011 | 2010 | 2009 | ||||||||||
| Stock-based compensation expense: |
||||||||||||
| Cost of revenue |
$ | 769 | $ | 568 | $ | 425 | ||||||
| Research and development |
3,368 | 3,454 | 2,705 | |||||||||
| Sales, general and administrative |
4,096 | 2,596 | 2,303 | |||||||||
|
|
|
|
|
|
|
|||||||
| Total stock-based compensation expense |
8,233 | 6,618 | 5,433 | |||||||||
| Tax effect of stock-based compensation |
— | — | — | |||||||||
|
|
|
|
|
|
|
|||||||
| Effect on net income |
$ | 8,233 | $ | 6,618 | $ | 5,433 | ||||||
|
|
|
|
|
|
|
|||||||
| Effect on basic net income per share |
$ | 0.33 | $ | 0.27 | $ | 0.24 | ||||||
|
|
|
|
|
|
|
|||||||
| Effect on diluted net income per share |
$ | 0.31 | $ | 0.26 | $ | 0.22 | ||||||
|
|
|
|
|
|
|
|||||||
45
Table of Contents
VOLTERRA SEMICONDUCTOR CORPORATION AND SUBSIDIARIES
NOTES TO CONSOLIDATED FINANCIAL STATEMENTS
(In thousands, except share and per share data)
In the absence of an actively traded market for similar financial instruments to those being granted, estimating the fair value of stock-based compensation is inherently difficult because the value of the financial instruments cannot be objectively verified even in retrospect. We currently use the Black-Scholes option pricing model to estimate the fair value of our stock options granted under the Company’s stock option plans and rights granted under the 2004 Employee Stock Purchase Plan (ESPP). The determination of the fair value of share based payment awards utilizing the Black-Scholes is affected by our stock price and a number of assumptions including expected term, and volatility. We estimate these key assumptions using historical information and judgment regarding Company-specific and market factors and trends. When estimating expected volatility, we consider the historical volatility of our stock and implied volatility on traded options on our stock. Prior to 2009, due to the limited history of trading and lack of liquidity in both the market for our stock and options on our stock, we also considered the implied volatility on a group of peer companies to develop our estimates as well as other factors. Option grants typically vest over four years to provide long-term compensation and a retention incentive to employees. To estimate the expected term of options granted, we consider the contractual life and vesting period of the option, historical exercise behavior of our employees, and other factors. After determination of the fair value of the award is made, the amount of expense that the Company recognizes is affected by the estimated forfeiture rate of the award by employees. If the estimates for these key inputs are changed over time, the amounts recorded for future stock-based compensation arrangements may increase or decrease, which could materially adversely affect our results of operations.
The following table summarizes the assumptions used in fair value calculations:
| Stock Options | ESPP | |||||||||||||||||||||||
| Year Ended December 31, | Year Ended December 31, | |||||||||||||||||||||||
| 2011 | 2010 | 2009 | 2011 | 2010 | 2009 | |||||||||||||||||||
| Expected life (in years) |
4.9 | 4.9 | 4.4 | 0.5 | 0.5 | 0.5 | ||||||||||||||||||
| Expected volatility |
48 | % | 52 | % | 49 | % | 44 | % | 52 | % | 55 | % | ||||||||||||
| Risk-free interest rates |
1.3 | % | 1.5 | % | 1.9 | % | 0.1 | % | 0.2 | % | 0.2 | % | ||||||||||||
| Expected dividend yield |
— | — | — | — | — | — | ||||||||||||||||||
The weighted-average grant-date fair value of stock options granted was $10.65, $9.88, and $5.03, during the years ended December 31, 2011, 2010 and 2009, respectively. The weighted-average grant-date fair value of rights granted under the ESPP was $6.75, $6.43 and $4.00, during the years ended December 31, 2011, 2010 and 2009, respectively.
During 2010, the Company began to grant restricted stock units under the 2004 Equity Incentive Plan. The restricted stock units are converted into shares of the Company’s common stock upon vesting on a one-for-one basis. Vesting of restricted stock units is subject to the grantee’s continued service with the Company and, in some cases, achievement of specified performance goals. The compensation expense related to these awards is determined using the fair market value of the Company’s common stock on the date of the grant, and the compensation expense is recognized over the vesting period. The weighted-average grant-date fair value of restricted stock units granted was $25.60 during the year ended December 31, 2011 and $23.96 during the year ended December 31, 2010.
(m) Comprehensive Income
Comprehensive income is defined as the changes in financial position of an enterprise excluding stockholder transactions. Elements of comprehensive income other than net income were immaterial for the years ended December 31, 2011, 2010 and 2009.
46
Table of Contents
VOLTERRA SEMICONDUCTOR CORPORATION AND SUBSIDIARIES
NOTES TO CONSOLIDATED FINANCIAL STATEMENTS
(In thousands, except share and per share data)
(n) Accounting for Lease Incentives
As part of the Company’s existing leased facilities, the Company has received various lease incentives which take the form of a fixed allowance towards lease improvements on the facility. The Company used the allowance to make leasehold improvements which are being depreciated over the useful life of the assets or the lease term, whichever is shorter. The offsetting lease incentives liability is being amortized on a straight-line basis over the term of the lease as an offset to rent expense.
3. Inventories
Inventories consisted of the following:
| As of December 31, | ||||||||
| 2011 | 2010 | |||||||
| Work-in-process |
$ | 7,471 | $ | 8,447 | ||||
| Finished goods |
7,216 | 6,944 | ||||||
|
|
|
|
|
|||||
| $ | 14,687 | $ | 15,391 | |||||
|
|
|
|
|
|||||
4. Property and Equipment
Property and equipment consisted of the following:
| As of December 31, | ||||||||
| 2011 | 2010 | |||||||
| Computer hardware |
$ | 2,056 | $ | 2,078 | ||||
| Computer software |
6,083 | 5,291 | ||||||
| Equipment |
10,296 | 7,862 | ||||||
| Furniture |
1,223 | 1,219 | ||||||
| Leasehold improvements |
3,546 | 3,247 | ||||||
|
|
|
|
|
|||||
| 23,204 | 19,697 | |||||||
| Less accumulated depreciation and amortization |
(15,299 | ) | (12,572 | ) | ||||
|
|
|
|
|
|||||
| $ | 7,905 | $ | 7,125 | |||||
|
|
|
|
|
|||||
Depreciation and amortization expense was $2,851, $2,129 and $1,774, for the year ended December 31, 2011, 2010 and 2009, respectively.
5. Accrued Liabilities
Accrued liabilities consisted of the following:
| As of December 31, | ||||||||
| 2011 | 2010 | |||||||
| Accrued compensation |
$ | 5,262 | $ | 7,855 | ||||
| Professional services |
881 | 1,169 | ||||||
| Other taxes payable |
921 | 942 | ||||||
| Income tax payable |
61 | 210 | ||||||
| Short-term lease incentives |
189 | 189 | ||||||
| Other accrued liabilities |
985 | 851 | ||||||
|
|
|
|
|
|||||
| $ | 8,299 | $ | 11,216 | |||||
|
|
|
|
|
|||||
47
Table of Contents
VOLTERRA SEMICONDUCTOR CORPORATION AND SUBSIDIARIES
NOTES TO CONSOLIDATED FINANCIAL STATEMENTS
(In thousands, except share and per share data)
6. Stockholders’ Equity
(a) Common and Preferred Stock
As of December 31, 2011, the Company is authorized to issue 200,000,000 shares of $0.001 par value common stock and 5,000,000 shares of $0.001 par value preferred stock. The Company has the authority to issue undesignated preferred stock in one or more series and to fix the rights, preferences, privileges, and restrictions thereof, including dividend rights, dividend rates, conversion rights, voting rights, terms of redemption, and liquidation preferences. As of December 31, 2011, 2010, and 2009, no shares of preferred stock were outstanding.
The Company has reserved shares of common stock for future issuance at December 31, 2011 as follows:
| Stock options outstanding |
5,401,329 | |||
| Equity incentive plans available for future grants |
6,130,017 | |||
| Employee stock purchase plan |
2,703,711 | |||
|
|
|
|||
| 14,235,057 | ||||
|
|
|
(b) Equity Incentive Plans
As of December 31, 2011, the Company had authorized 18,835,722 shares of common stock for issuance under the Company’s equity plans, the 2004 Equity Incentive Plan and the 2004 Non-Employee Director Plan. Options and Restricted Stock Units granted under the plans typically vest over a four year period. Options granted after May 18, 2006 expire seven years from the date of grant while previously issued options expire after ten years.
The following table summarizes stock option activity under the plans during the years 2009, 2010 and 2011:
| Options Outstanding | ||||||||
| Number of Shares |
Weighted Average Exercise Price |
|||||||
| Balance as of December 31, 2008 |
6,069,909 | $ | 10.47 | |||||
|
|
|
|||||||
| Granted |
1,018,305 | $ | 12.16 | |||||
| Exercised |
(855,511 | ) | $ | 6.47 | ||||
| Canceled |
(182,607 | ) | $ | 12.06 | ||||
|
|
|
|||||||
| Balance as of December 31, 2009 |
6,050,096 | $ | 11.27 | |||||
|
|
|
|||||||
| Granted |
951,358 | $ | 21.60 | |||||
| Exercised |
(1,479,363 | ) | $ | 7.32 | ||||
| Canceled |
(151,423 | ) | $ | 15.52 | ||||
|
|
|
|||||||
| Balance as of December 31, 2010 |
5,370,668 | $ | 14.06 | |||||
| Granted |
850,487 | $ | 25.16 | |||||
| Exercised |
(637,753 | ) | $ | 11.33 | ||||
| Canceled |
(182,073 | ) | $ | 18.34 | ||||
|
|
|
|||||||
| Balance as of December 31, 2011 |
5,401,329 | $ | 15.99 | |||||
|
|
|
|||||||
48
Table of Contents
VOLTERRA SEMICONDUCTOR CORPORATION AND SUBSIDIARIES
NOTES TO CONSOLIDATED FINANCIAL STATEMENTS
(In thousands, except share and per share data)
As of December 31, 2011, the weighted average remaining contractual life for options outstanding was 4.0 years. Additionally, there were 3,590,732 options exercisable with a weighted average exercise price of $13.44 per share, and the weighted-average remaining contractual life for exercisable options was 3.2 years. There were 1,731,446 options expected to vest with a weighted average exercise price of $20.92 per share, and the weighted-average remaining contractual life for options expected to vest was 5.5 years. The aggregate intrinsic value of options outstanding, exercisable and expected to vest was $52,275, $43,714 and $8,394, respectively. The total intrinsic value of options exercised in 2011, 2010 and 2009 was $8,464, $24,546, and $7,340, respectively.
There were no restricted stock units granted under the plans during 2009. The following table summarizes restricted stock unit activity under the plans during the year 2010 and 2011:
| Restricted Stock Units Outstanding | ||||||||
| Number of Shares |
Weighted Average Grant Date Fair Value |
|||||||
| Non-vested restricted stock units at December 31, 2009 |
— | $ | — | |||||
| Granted |
213,114 | $ | 23.96 | |||||
| Vested |
— | $ | — | |||||
| Canceled |
(1,028 | ) | $ | 22.05 | ||||
|
|
|
|||||||
| Balance as of December 31, 2010 |
212,086 | $ | 23.97 | |||||
| Granted |
106,254 | $ | 25.60 | |||||
| Vested |
(43,365 | ) | $ | 24.29 | ||||
| Canceled |
(13,116 | ) | $ | 23.45 | ||||
|
|
|
|||||||
| Balance as of December 31, 2011 |
261,859 | $ | 24.60 | |||||
|
|
|
|||||||
As of December 31, 2011, the weighted average remaining contractual life for non-vested restricted stock units was 3.1 years. As of December 31, 2011, there were 151,488 restricted stock units expected to vest and the aggregate intrinsic value of outstanding non-vested restricted stock units and restricted stock units expected to vest were $6,706 and $3,880, respectively. There were no restricted stock units vested during 2010.
As of December 31, 2011, there was $16,765 of total unrecognized compensation cost related to non-vested options and restricted stock units granted under both of the Company’s option plans. That cost is expected to be recognized over a weighted-average period of 1.5 years. The total fair value of options and restricted stock units vested was $7,092, $5,120, and $5,834 during 2011, 2010 and 2009, respectively.
(c) Employee Stock Purchase Plan
In June 2004, the Company authorized the 2004 Employee Stock Purchase Plan. In 2005, the initial offering under the ESPP began on February 21, 2005 and ended on May 15, 2005. Subsequent six month offering periods began on the first trading day on or after May 16 and November 16. The price of the Company’s common stock purchased pursuant to the offerings is 85% of the lesser of the fair market value of the common stock on the first and last day of the offering period. Participants must remain employed by the Company for the entire term of the offering in order to be eligible to purchase shares. As of December 31, 2011, the Company had authorized an aggregate total of 3,602,089 shares for issuance under the ESPP. The Company issued 147,861, 137,193 and 190,252 shares at a weighted-average price of $19.30, $15.54 and $7.60 per share pursuant to the ESPP during the years ended December 31, 2011, 2010 and 2009, respectively.
49
Table of Contents
VOLTERRA SEMICONDUCTOR CORPORATION AND SUBSIDIARIES
NOTES TO CONSOLIDATED FINANCIAL STATEMENTS
(In thousands, except share and per share data)
7. Income Taxes
The Company is incorporated in the U.S. and operates in various countries with differing tax laws and rates. A significant portion of the Company’s income before taxes and the provision for income taxes are generated from international operations.
Income before income taxes for the fiscal years ended December 31, 2011, 2010 and 2009, is summarized as follows:
| Year Ended December 31, | ||||||||||||
| 2011 | 2010 | 2009 | ||||||||||
| United States |
$ | 814 | $ | 8,611 | $ | 1,023 | ||||||
| Foreign |
19,938 | 20,201 | 10,146 | |||||||||
|
|
|
|
|
|
|
|||||||
| Income before income taxes |
$ | 20,752 | $ | 28,812 | $ | 11,169 | ||||||
|
|
|
|
|
|
|
|||||||
Income tax provision in 2011, 2010 and 2009 is comprised of federal, state, and foreign taxes.
The components of the provision for income taxes are summarized as follows:
| Year Ended December 31, | ||||||||||||
| 2011 | 2010 | 2009 | ||||||||||
| Current: |
||||||||||||
| Federal |
$ | — | $ | — | $ | (303 | ) | |||||
| State |
15 | 16 | 1 | |||||||||
| Foreign |
26 | 372 | 284 | |||||||||
|
|
|
|
|
|
|
|||||||
| 41 | 388 | (18 | ) | |||||||||
|
|
|
|
|
|
|
|||||||
| Deferred: |
||||||||||||
| Federal |
— | — | — | |||||||||
| State |
— | — | — | |||||||||
| Foreign |
67 | (16 | ) | 247 | ||||||||
|
|
|
|
|
|
|
|||||||
| 67 | (16 | ) | 247 | |||||||||
|
|
|
|
|
|
|
|||||||
| Provision for income taxes |
$ | 108 | $ | 372 | $ | 229 | ||||||
|
|
|
|
|
|
|
|||||||
The difference between the provision for income taxes and the expected tax provision at the statutory income tax rate is reconciled below:
| Year Ended December 31, | ||||||||||||
| 2011 | 2010 | 2009 | ||||||||||
| Expected income tax provision at statutory income tax rate |
$ | 7,263 | $ | 10,084 | $ | 3,909 | ||||||
| State taxes, net of federal tax benefit |
10 | 10 | 1 | |||||||||
| Foreign taxes at different rates |
(6,885 | ) | (6,714 | ) | (3,020 | ) | ||||||
| Non-deductible expenses |
85 | 83 | 59 | |||||||||
| Tax credits |
(1,829 | ) | (1,654 | ) | (1,603 | ) | ||||||
| Stock-based compensation |
(394 | ) | (2,538 | ) | (1,141 | ) | ||||||
| Valuation allowance related to net operating losses and other |
1,858 | 1,101 | 2,024 | |||||||||
|
|
|
|
|
|
|
|||||||
| Provision for income taxes |
$ | 108 | $ | 372 | $ | 229 | ||||||
|
|
|
|
|
|
|
|||||||
50
Table of Contents
VOLTERRA SEMICONDUCTOR CORPORATION AND SUBSIDIARIES
NOTES TO CONSOLIDATED FINANCIAL STATEMENTS
(In thousands, except share and per share data)
Effective from April 2005 through March 2015, the Company has negotiated a tax holiday on certain earnings in Singapore, which is conditional upon the Company meeting certain employment and investment thresholds. The tax holiday represents a tax benefit aimed to attract foreign investment in Singapore. The tax holiday decreased income tax expense by approximately $1,050, $1,511 and $2,261 for the fiscal years 2011, 2010 and 2009, respectively. The benefit of the tax holiday on net income per share (diluted) was approximately $0.04, $0.06 and $0.09, in fiscal years 2011, 2010 and 2009, respectively.
As of December 31, 2011, U.S. income taxes were not provided on a cumulative total of approximately $63,207 of undistributed earnings for certain foreign subsidiaries. Determination of the amount of unrecognized deferred tax liability for temporary differences related to investments in these foreign subsidiaries that are essentially permanent in duration is not practicable. The Company currently intends to reinvest these earnings in operations outside the U.S.
Deferred income tax assets and liabilities consist of the following:
| As of December 31, | ||||||||
| 2011 | 2010 | |||||||
| Deferred tax assets: |
||||||||
| Property and equipment |
$ | 332 | $ | 325 | ||||
| Accruals and reserves |
1,051 | 1,046 | ||||||
| Tax credits |
12,462 | 10,634 | ||||||
| Capitalized research and development costs |
226 | 809 | ||||||
| Net operating loss carryforwards |
3,904 | 3,604 | ||||||
|
|
|
|
|
|||||
| Gross deferred tax assets |
17,975 | 16,418 | ||||||
| Deferred tax liabilities: |
||||||||
| Property and equipment |
(95 | ) | — | |||||
|
|
|
|
|
|||||
| Net deferred tax assets |
17,880 | 16,418 | ||||||
| Valuation allowance |
(17,898 | ) | (16,369 | ) | ||||
|
|
|
|
|
|||||
| Net deferred tax (liabilities) assets |
$ | (18 | ) | $ | 49 | |||
|
|
|
|
|
|||||
The realization of the tax benefits of deferred tax assets is dependent on future levels of taxable income in the periods the items are deductible or creditable. Based on the available objective evidence, management believes it is more likely than not that the domestic net deferred tax assets will not be realizable. Accordingly, the Company has provided a full valuation allowance against its domestic net deferred tax assets as of December 31, 2011 and 2010.
As of December 31, 2011, the Company has net operating loss carryforwards of approximately $18,561 for federal and $16,267 for California state tax purposes. The cumulative amount related to stock options included in net operating loss carryforwards for federal and California state is $8,263 and $11,034. Upon realization of the tax benefit associated with stock options, the impact will be recorded in equity. If not utilized, these carryforwards will begin to expire in 2023 for federal tax purposes and 2012 for California state tax purposes.
As of December 31, 2011, the Company has research credit carryforwards of approximately $9,796 and $11,249 for federal and California state tax purposes. If not utilized, the federal carryforwards will expire in various amounts beginning in 2017. The California credit can be carried forward indefinitely.
Under the Tax Reform Act of 1986, the amount of benefit from net operating loss and tax credit carryforwards may be impaired or limited in certain circumstances. Events which cause limitations in the amount of net operating losses that the Company may utilize in any one year include, but are not limited to, a cumulative ownership change of more than 50%, as defined, over a three-year period.
51
Table of Contents
VOLTERRA SEMICONDUCTOR CORPORATION AND SUBSIDIARIES
NOTES TO CONSOLIDATED FINANCIAL STATEMENTS
(In thousands, except share and per share data)
The Company accounts for uncertainty in income taxes using a two-step approach to recognizing and measuring uncertain tax positions. The first step is to evaluate the tax position for recognition by determining if the weight of available evidence indicates it is more likely than not that the position will be sustained on audit, including resolution of related appeals or litigation processes, if any. The second step is to measure the tax benefit as the largest amount that is more than 50% likely of being realized upon ultimate settlement.
As of December 31, 2011 and 2010, the total gross unrecognized tax benefits, were $7,107 and $6,145, of which $6,084 and $5,275 would affect the effective tax rate if recognized. The Company classifies its unrecognized tax benefits as non-current income taxes payable, as no amounts are expected to be payable within the next 12 months. The Company recognizes interest and penalties related to uncertain tax positions in income tax expense. Cumulative interest and penalties through 2011 are immaterial.
The aggregate changes in gross unrecognized tax benefits for fiscal year 2011 are as follows:
| Balance at January 1, 2011 |
$ | 6,145 | ||
| Increases in balances related to tax positions taken during prior periods |
23 | |||
| Decreases in balances related to tax positions taken during prior periods |
(11 | ) | ||
| Increases in balances related to tax positions taken during current period |
950 | |||
|
|
|
|||
| Balance at December 31, 2011 |
$ | 7,107 | ||
|
|
|
The Company files U.S. federal, state, and foreign income tax returns and is subject to examination in these jurisdictions for all tax years since inception. Although timing of the resolution or closure on audits is highly uncertain, the Company believes it is reasonably possible that there would be immaterial changes in its currently unrecognized tax benefits in the next 12 months.
8. Commitments and Contingencies
The Company leases its facilities under non-cancelable operating lease agreements expiring between 2012 and 2015. Rent expense was $1,426, $1,196 and $1,024 for the years ended December 31, 2011, 2010, and 2009, respectively.
The following table sets forth the Company’s contractual obligations as of December 31, 2011 and the years in which such obligations are expected to be settled.
| Fiscal Year |
Purchase obligations |
Operating lease obligations |
||||||
| 2012 |
$ | 3,067 | $ | 1,602 | ||||
| 2013 |
51 | 1,212 | ||||||
| 2014 |
— | 1,032 | ||||||
| 2015 |
— | 217 | ||||||
| 2016 |
— | 53 | ||||||
|
|
|
|
|
|||||
| Total |
$ | 3,118 | $ | 4,116 | ||||
|
|
|
|
|
|||||
Purchase obligations are comprised of the estimated obligation for non-cancelable orders of in-process silicon wafers.
The amounts in the table above exclude $1.4 million of income tax liabilities as we are unable to reasonably estimate the timing of settlement. See Note 7, “Income Taxes”.
As initially disclosed in the Company’s Annual Report on Form 10-K for the year ended December 31, 2008, and as updated in subsequent public filings, we filed a lawsuit in November 2008 in the United States
52
Table of Contents
VOLTERRA SEMICONDUCTOR CORPORATION AND SUBSIDIARIES
NOTES TO CONSOLIDATED FINANCIAL STATEMENTS
(In thousands, except share and per share data)
District Court in the Northern District of California against Infineon Technologies AG, Infineon Technologies North America Corporation, and Primarion, Inc., (collectively, the “Defendants”) for infringement of several of our patents, seeking damages, enhanced damages for willful infringement and injunctive relief.
A trial related to our integrated power stage patents, U.S. Patent Nos. 6,278,264 and 6,462,522 was held in May 2011. The court had determined that Volterra’s asserted claims were infringed by Defendant’s accused products, and a unanimous jury found that all asserted claims were also valid and not obvious. The court agreed to move forward with Volterra’s claims against Defendants for damages and willful infringement, initially setting a trial date for June 2012. Following a hearing on December 22, 2011, the damages trial was re-scheduled to begin November 1, 2012.
As initially disclosed in the Company’s Annual Report on Form 10-K for the year ended December 2009 and as updated in subsequent public filings, Infineon Technologies AG filed a lawsuit against us in January 2010 in the United States District Court for the District of Delaware for infringement of four patents assigned to Infineon, seeking damages, enhanced damages for willful infringement and injunctive relief. On December 7, 2011, the Delaware Court granted Volterra’s motion to transfer the case back to the United Stated District Court, Northern District of California where an initial case management conference is pending.
While we believe in the strength of our positions, we are unable to assess the ultimate outcome and it is not possible to estimate a reasonably possible loss related to these cases. There is no guarantee that any such proceedings would be successful on its merits or that we will receive monetary damages awards or recoup our legal expenses.
9. Valuation and Qualifying Accounts
| Balance at Beginning of Year |
Additions | Deductions | Balance at End of Year |
|||||||||||||
| Year ended December 31, 2011: |
||||||||||||||||
| Allowance for doubtful accounts |
$ | 394 | $ | 74 | $ | — | $ | 468 | ||||||||
| Sales returns and allowances |
$ | 1,845 | $ | 1,957 | $ | (1,783 | ) | $ | 2,019 | |||||||
| Year ended December 31, 2010: |
||||||||||||||||
| Allowance for doubtful accounts |
$ | 304 | $ | 90 | $ | — | $ | 394 | ||||||||
| Sales returns and allowances |
$ | 1,492 | $ | 3,706 | $ | (3,353 | ) | $ | 1,845 | |||||||
| Year ended December 31, 2009: |
||||||||||||||||
| Allowance for doubtful accounts |
$ | 496 | $ | — | (192 | ) | $ | 304 | ||||||||
| Sales returns and allowances |
$ | 2,164 | $ | 1,946 | $ | (2,618 | ) | $ | 1,492 | |||||||
10. Stock Repurchases
Under the Company’s stock repurchase program announced on January 28, 2008 and further increased on October 20, 2008, April 24, 2009, May 20, 2010 and October 22, 2010, the Company repurchased 387,708 shares during the year ended December 31, 2011 for $7,821, at an average cost of $20.17 per share including commissions. The Company’s policy is to consider shares to have been repurchased upon the settlement date of the transaction, which is typically three days subsequent to the trading date. Shares repurchased during 2011 have been reported as treasury stock. As of December 31, 2011, this repurchase program has $8.3 million remaining under the Company’s repurchase authorization.
53
Table of Contents
VOLTERRA SEMICONDUCTOR CORPORATION AND SUBSIDIARIES
NOTES TO CONSOLIDATED FINANCIAL STATEMENTS
(In thousands, except share and per share data)
11. Fair Value Measurements
The accounting standard for fair value measurements provides a framework for measuring fair value and requires expanded disclosures regarding fair value measurements. Fair value is defined as the price that would be received for an asset or the exit price that would be paid to transfer a liability in the principal or most advantageous market in an orderly transaction between market participants on the measurement date. The accounting standard establishes a fair value hierarchy which requires an entity to maximize the use of observable inputs, where available. The following summarizes the three levels of inputs required as well as the assets and liabilities that we value using those levels of inputs.
The Company currently has only cash and cash equivalents held and used in the ordinary course of business that must be measured at fair value on a recurring basis. The Company does not have other financial or non-financial assets or liabilities that are required to be measured at fair value either on a recurring or non-recurring basis. The Company’s cash and cash equivalents and short-term investments are measured using inputs from Level 1 of the fair value hierarchy. The Company does not have any Level 2 or Level 3 investments and has historically never had any Level 3 investments. Level 1, Level 2 and Level 3 are described as follows:
Level 1—Inputs are unadjusted quoted prices in active markets for identical assets that the Company has the ability to access at the measurement date.
Level 2—Observable inputs other than Level 1 prices, such as quoted prices for similar assets or liabilities, quoted prices in markets with insufficient volume or infrequent transactions (less active markets), or model-derived valuations in which all significant inputs are observable or can be derived principally from or corroborated with observable market data for substantially the full term of the assets or liabilities.
Level 3—Unobservable inputs to the valuation methodology that are significant to the measurement of the fair value of assets or liabilities.
Based on the nature of cash and cash equivalents and the underlying securities, there are no realized or unrealized gains and losses recorded from holding these assets.
Short-term investments have remaining contractual maturities on the date of purchase greater than 90 days but less than one year. Investments in debt securities are classified as held-to-maturity. Unrealized gain and losses were not material at December 31, 2011 and 2010.
The fair value of financial assets measured at fair value on a recurring basis was determined using the following inputs:
| December 31, 2011 | ||||||||||||||||
| Fair value measurements at reporting date using | ||||||||||||||||
| Total | Quoted prices in active markets for identical assets (Level 1) |
Significant other observable inputs (Level 2) |
Significant unobservable inputs (Level 3) |
|||||||||||||
| Money market funds |
$ | 108,149 | $ | 108,149 | $ | — | $ | — | ||||||||
|
|
|
|
|
|
|
|
|
|||||||||
| Total |
$ | 108,149 | $ | 108,149 | $ | — | $ | — | ||||||||
|
|
|
|
|
|
|
|
|
|||||||||
54
Table of Contents
VOLTERRA SEMICONDUCTOR CORPORATION AND SUBSIDIARIES
NOTES TO CONSOLIDATED FINANCIAL STATEMENTS
(In thousands, except share and per share data)
| December 31, 2010 | ||||||||||||||||
| Total | Quoted prices in active markets for identical assets (Level 1) |
Significant other observable inputs (Level 2) |
Significant unobservable inputs (Level 3) |
|||||||||||||
| Money market funds |
$ | 78,930 | $ | 78,930 | $ | — | $ | — | ||||||||
| US treasury securities |
12,896 | 12,896 | — | — | ||||||||||||
|
|
|
|
|
|
|
|
|
|||||||||
| Total |
$ | 91,826 | $ | 91,826 | $ | — | $ | — | ||||||||
|
|
|
|
|
|
|
|
|
|||||||||
12. Selected Quarterly Financial Information (unaudited)
| Year Ended December 31, 2011 | ||||||||||||||||
| First Quarter |
Second Quarter |
Third Quarter |
Fourth Quarter |
|||||||||||||
| Net revenue |
$ | 34,157 | $ | 41,717 | $ | 41,336 | $ | 38,776 | ||||||||
| Gross margin |
19,678 | 23,669 | 23,560 | 22,611 | ||||||||||||
| Net income |
2,680 | 5,338 | 6,942 | 5,684 | ||||||||||||
| Net income per share: |
||||||||||||||||
| Basic |
$ | 0.11 | $ | 0.22 | $ | 0.28 | $ | 0.23 | ||||||||
| Diluted |
$ | 0.10 | $ | 0.20 | $ | 0.26 | $ | 0.22 | ||||||||
| Year Ended December 31, 2010 | ||||||||||||||||
| First Quarter |
Second Quarter |
Third Quarter |
Fourth Quarter |
|||||||||||||
| Net revenue |
$ | 36,293 | $ | 40,242 | $ | 41,556 | $ | 35,543 | ||||||||
| Gross margin |
22,311 | 25,354 | 25,503 | 21,281 | ||||||||||||
| Net income |
7,664 | 9,002 | 8,367 | 3,407 | ||||||||||||
| Net income per share: |
||||||||||||||||
| Basic |
$ | 0.32 | $ | 0.37 | $ | 0.34 | $ | 0.14 | ||||||||
| Diluted |
$ | 0.30 | $ | 0.34 | $ | 0.32 | $ | 0.13 | ||||||||
Basic and diluted net income per share are computed independently for each of the quarters presented. Therefore, the sum of quarterly basic and diluted net income per share information may not equal annual basic and diluted net income per share.
55
Table of Contents
Report of Independent Registered Public Accounting Firm
The Board of Directors and Stockholders
Volterra Semiconductor Corporation:
We have audited the accompanying consolidated balance sheets of Volterra Semiconductor Corporation and subsidiaries (the Company) as of December 31, 2011 and 2010, and the related consolidated statements of income, stockholders’ equity and cash flows for each of the years in the three-year period ended December 31, 2011. We also have audited Volterra Semiconductor Corporation’s internal control over financial reporting as of December 31, 2011, based on criteria established in Internal Control – Integrated Framework issued by the Committee of Sponsoring Organizations of the Treadway Commission (COSO). The Company’s management is responsible for these consolidated financial statements, for maintaining effective internal control over financial reporting, and for its assessment of the effectiveness of internal control over financial reporting, included in the accompanying Management’s Annual Report on Internal Control Over Financial Reporting. Our responsibility is to express an opinion on these consolidated financial statements and an opinion on the Company’s internal control over financial reporting based on our audits.
We conducted our audits in accordance with the standards of the Public Company Accounting Oversight Board (United States). Those standards require that we plan and perform the audits to obtain reasonable assurance about whether the financial statements are free of material misstatement and whether effective internal control over financial reporting was maintained in all material respects. Our audits of the consolidated financial statements included examining, on a test basis, evidence supporting the amounts and disclosures in the financial statements, assessing the accounting principles used and significant estimates made by management, and evaluating the overall financial statement presentation. Our audit of internal control over financial reporting included obtaining an understanding of internal control over financial reporting, assessing the risk that a material weakness exists, and testing and evaluating the design and operating effectiveness of internal control based on the assessed risk. Our audits also included performing such other procedures as we considered necessary in the circumstances. We believe that our audits provide a reasonable basis for our opinions.
A company’s internal control over financial reporting is a process designed to provide reasonable assurance regarding the reliability of financial reporting and the preparation of financial statements for external purposes in accordance with generally accepted accounting principles. A company’s internal control over financial reporting includes those policies and procedures that (1) pertain to the maintenance of records that, in reasonable detail, accurately and fairly reflect the transactions and dispositions of the assets of the company; (2) provide reasonable assurance that transactions are recorded as necessary to permit preparation of financial statements in accordance with generally accepted accounting principles, and that receipts and expenditures of the company are being made only in accordance with authorizations of management and directors of the company; and (3) provide reasonable assurance regarding prevention or timely detection of unauthorized acquisition, use, or disposition of the company’s assets that could have a material effect on the financial statements.
Because of its inherent limitations, internal control over financial reporting may not prevent or detect misstatements. Also, projections of any evaluation of effectiveness to future periods are subject to the risk that controls may become inadequate because of changes in conditions, or that the degree of compliance with the policies or procedures may deteriorate.
In our opinion, the consolidated financial statements referred to above present fairly, in all material respects, the financial position of Volterra Semiconductor Corporation and subsidiaries as of December 31, 2011 and 2010, and the results of their operations and their cash flows for each of the years in the three-year period ended December 31, 2011, in conformity with U.S. generally accepted accounting principles. Also in our opinion, Volterra Semiconductor Corporation maintained, in all material respects, effective internal control over financial reporting as of December 31, 2011, based on criteria established in Internal Control – Integrated Framework issued by the Committee of Sponsoring Organizations of the Treadway Commission.
/s/ KPMG LLP
Santa Clara, California
March 6, 2012
56
Table of Contents
| Item 9. | Changes in and Disagreements with Accountants on Accounting and Financial Disclosure |
Not applicable.
| Item 9A. | Controls and Procedures |
Evaluation of Disclosure Controls and Procedures
As of the end of the period covered by this report, an evaluation was performed under the supervision and with the participation of our management, including our chief executive officer and chief financial officer, or collectively, our certifying officers, of the effectiveness of the design and operation of our disclosure controls and procedures. Based on their evaluation, our certifying officers concluded that these disclosure controls and procedures, as defined in Rules 13a-15(e) and 15d-15(e) under the Exchange Act, were effective at the reasonable assurance level for the period covered by this report.
Management’s Annual Report on Internal Control Over Financial Reporting
Our management is responsible for establishing and maintaining adequate internal control over financial reporting, as such term is defined in Exchange Act Rules 13a-15(f) and 15d-15e. Under the supervision and with the participation of our management, including our principal executive officer and principal financial officer, we conducted an evaluation of the effectiveness of our internal control over financial reporting based on the framework set forth in Internal Control – Integrated Framework issued by the Committee of Sponsoring Organizations of the Treadway Commission. Based on our evaluation under the framework set forth in Internal Control – Integrated Framework, our management concluded that our internal control over financial reporting was effective as of December 31, 2011. KPMG LLP, an independent registered public accounting firm, has audited our financial statements included herein and has issued an audit report on the effectiveness of our internal control over financial reporting, which report is included herein.
Inherent Limitations of the Effectiveness of Internal Controls
We believe that a system of internal controls, no matter how well designed and operated, is based in part upon certain assumptions about the likelihood of future events, and can be affected by limitations inherent in all internal controls systems including the realities that human judgment in decision-making can be faulty, that persons responsible for establishing controls need to consider their relative costs and benefits, that breakdowns can occur because of human failures such as simple error or mistake, and that controls can be circumvented by collusion of two or more people. Accordingly, we believe that our system of internal controls, while effective, can only provide reasonable, not absolute, assurance that the objectives of the controls system are met, and no evaluation of controls can provide absolute assurance that all control issues and instances of fraud, if any, within our company have been detected.
Changes in Internal Control over Financial Reporting
We have reviewed our internal controls over financial reporting and have made no changes during the quarter ended December 31, 2011, that our certifying officers concluded materially affected, or are reasonably likely to materially affect, our internal control over financial reporting.
| Item 9B. | Other Information |
Not applicable.
57
Table of Contents
Certain information required by Part III of this Form 10-K is omitted from this report because the registrant will file a definitive Proxy Statement within 120 days after the end of its fiscal year pursuant to Regulation 14A for its 2012 Annual Meeting of Stockholders (the “Proxy Statement”), and certain information included therein is incorporated herein by reference.
| Item 10. | Directors, Executive Officers and Corporate Governance |
Information relating to our executive officers required by this item is set forth in Part I—Item 1 of this report under the caption “Executive Officers of the Registrant” and is incorporated herein by reference. The other information required by this item, including such information regarding our directors and executive officers, compliance with Section 16(a) of the Securities Exchange Act of 1934, our code of ethics and corporate governance, is incorporated herein by reference from the Proxy Statement.
| Item 11. | Executive Compensation |
The information required by this item is incorporated herein by reference from the section entitled “Executive Compensation” in the Proxy Statement.
| Item 12. | Security Ownership of Certain Beneficial Owners and Management and Related Stockholder Matters |
The information required by this item is incorporated herein by reference from the section entitled “Security Ownership of Certain Beneficial Owners and Management” in the Proxy Statement.
| Item 13. | Certain Relationships and Related Transactions, and Director Independence |
The information required by this item is incorporated herein by reference from the sections entitled “Certain Transactions,” “Equity Compensation Plan Information” and “Proposal 1—Election of Directors” in the Proxy Statement.
| Item 14. | Principal Accountant Fees and Services |
The information required by this item is incorporated herein by reference from the section entitled “Proposal 3—Ratification of Selection of Independent Registered Public Accounting Firm” in the Proxy Statement.
58
Table of Contents
| Item 15. | Exhibits, Financial Statement Schedules |
| (a) | 1. Financial Statements |
See Index to Consolidated Financial Statements in Item 8 of this annual report on Form 10-K, which is incorporated herein by reference.
| 2. Financial Statement Schedules |
See Note 9 in Notes to Consolidated Financial Statements.
| 3. Exhibits |
| Exhibit |
Description Of Documents | |
| 3.1(1) | Amended and Restated Certificate of Incorporation of Volterra Semiconductor Corporation. | |
| 3.2(2) | Amended and Restated Bylaws of Volterra Semiconductor Corporation. | |
| 4.1 | Reference is made to Exhibits 3.1 and 3.2. | |
| 4.2(3) | Specimen Stock Certificate. | |
| 10.1(3) | Amended and Restated Investor Rights Agreement, dated October 2, 2001, by and among the Registrant and certain holders of the Registrant’s securities. | |
| 10.2(3) | Amendment to Amended and Restated Investor Rights Agreement, dated January 17, 2002, by and among the Registrant and certain holders of the Registrant’s securities. | |
| 10.3(3)* | 1996 Stock Option Plan and forms of related agreements. | |
| 10.4(4)* | 2004 Equity Incentive Plan and forms of related agreements. | |
| 10.5(17)* | Amended and Restated 2004 Non-Employee Directors’ Stock Option Plan and form of related agreement. | |
| 10.6(5)* | 2004 Employee Stock Purchase Plan. | |
| 10.7(3)* | Form of Indemnity Agreement entered into between the Registrant and certain of its officers and directors. | |
| 10.8(3)* | Offer letter between the Registrant and Jeffrey Staszak, dated February 24, 1999. | |
| 10.9(3)* | Offer letter between the Registrant and William Numann, dated October 11, 2000. | |
| 10.10(6)* | Offer letter between the Registrant and Craig Teuscher, dated September 27, 1996. | |
| 10.11(7)* | Offer letter between the Registrant and Thomas Truman, dated August 25, 2004. | |
| 10.12(8)* | Offer letter between the Registrant and Mike Burns, dated August 5, 2007. | |
| 10.14(9) | Lease Agreement, dated May 9, 2007, and as amended, dated March 23, 2010, between ProLogis Limited Partnership — I and the Registrant (47451 Fremont Blvd.). | |
| 10.15(10) | Lease Agreement, dated May 9, 2007, and as amended, dated March 23, 2010, between ProLogis Limited Partnership — I and the Registrant (47467 Fremont Blvd.). | |
| 10.16(11)* | Management Bonus Plan (2011) | |
| 10.17(12)* | Management Bonus Plan (2012) | |
| 10.18(13)* | 2011 Non-Employee Director Compensation | |
| 10.19(13)* | 2011 Executive Officer Compensation | |
| 10.20(14)* | 2012 Executive Officer Compensation | |
| 10.21(15)* | Severance Benefit Plan | |
| 10.22(18)* | Equity Acceleration Policy for Non-Employee Directors | |
| 21.1 | Subsidiaries of the Registrant. | |
| 23.1 | Consent of KPMG LLP, Independent Registered Public Accounting Firm. | |
| 24.1 | Power of Attorney (included on the signature pages hereto). | |
| 31.1 | Certification of Chief Executive Officer required under Rule 13a-14(a) or Rule 15d-14(a) of the Securities Exchange Act of 1934, as amended. | |
| 31.2 | Certification of Chief Financial Officer required under Rule 13a-14(a) or Rule 15d-14(a) of the Securities Exchange Act of 1934, as amended. | |
| 32.1(16) | Certification of Chief Executive Officer required under Rule 13a-14(b) or Rule 15d-14(b) of the Securities Exchange Act of 1934, as amended, and 18 U.S.C. Section 1350. |
59
Table of Contents
| Exhibit |
Description Of Documents | |
| 32.2(16) | Certification of Chief Financial Officer required under Rule 13a-14(b) or Rule 15d-14(b) of the Securities Exchange Act of 1934, as amended, and 18 U.S.C. Section 1350. | |
| 101.INS** | XBRL Instance Document | |
| 101.SCH** | XBRL Taxonomy Extension Schema | |
| 101.CAL** | XBRL Taxonomy Extension Calculation Linkbase | |
| 101.DEF** | XBRL Taxonomy Extension Definition Linkbase | |
| 101.LAB** | XBRL Taxonomy Extension Label Linkbase | |
| 101.PRE** | XBRL Taxonomy Extension Presentation Linkbase |
| (1) | Previously filed as Exhibit 3.1 to Volterra Semiconductor Corporation’s Quarterly Report on Form 10-Q for the quarterly period ended June 30, 2004, as filed with the Securities and Exchange Commission on September 9, 2004, and incorporated by reference herein. |
| (2) | Previously filed as Exhibit 3.2 to Volterra Semiconductor Corporation’s Quarterly Report on Form 10-Q for the quarterly period ended September 30, 2007, as filed with the Securities and Exchange Commission on November 1, 2007, and incorporated by reference herein. |
| (3) | Previously filed as the correspondingly numbered exhibit to Volterra Semiconductor Corporation’s Registration Statement on Form S-1 (No. 333-115614), as filed with the Securities and Exchange Commission on May 19, 2004, as amended, and incorporated by reference herein. |
| (4) | Previously filed as Exhibit 10.4 to Volterra Semiconductor Corporation’s Annual Report on Form 10-K, as filed with the Securities and Exchange Commission on March 1, 2005, and incorporated by reference herein. |
| (5) | Previously filed as the correspondingly numbered exhibit to Volterra Semiconductor Corporation’s Annual Report on Form 10-K, as filed with the Securities and Exchange Commission on March 8, 2007, and incorporated by reference herein. |
| (6) | Previously filed as Exhibit 10.12 to Volterra Semiconductor Corporation’s Registration Statement on Form S-1 (No. 333-115614), as filed with the Securities and Exchange Commission on May 19, 2004, as amended, and incorporated by reference herein. |
| (7) | Previously filed as Exhibit 10.11 to Volterra Semiconductor Corporation’s Annual Report on Form 10-K, as filed with the Securities and Exchange Commission on March 8, 2011, and incorporated by reference herein. |
| (8) | Previously filed as Exhibit 10.1 to Volterra Semiconductor Corporation’s Current Report on Form 8-K, as filed with the Securities and Exchange Commission on August 15, 2007, and incorporated by reference herein. |
| (9) | Previously filed as Exhibit 10.1 to Volterra Semiconductor Corporation’s Current Report on Form 8-K, as filed with the Securities and Exchange Commission on March 29, 2010, and incorporated by reference herein. |
| (10) | Previously filed as Exhibit 10.2 to Volterra Semiconductor Corporation’s Current Report on Form 8-K as filed with the Securities and Exchange Commission on March 29, 2010, and incorporated by reference herein. |
| (11) | Previously filed as Exhibit 10.2 to Volterra Semiconductor Corporation’s Current Report on Form 8-K, as filed with the Securities and Exchange Commission on January 27, 2011, and incorporated by reference herein. |
| (12) | Previously filed as Exhibit 10.2 to Volterra Semiconductor Corporation’s Current Report on Form 8-K, as filed with the Securities and Exchange Commission on January 25, 2012, and incorporated by reference herein. |
| (13) | Previously filed as Exhibit 10.1 to Volterra Semiconductor Corporation’s Current Report on Form 8-K, as filed with the Securities and Exchange Commission on January 27, 2011, and incorporated by reference herein. |
| (14) | Previously filed as Exhibit 10.1 to Volterra Semiconductor Corporation’s Current Report on Form 8-K, as filed with the Securities and Exchange Commission on January 25, 2012, and incorporated by reference herein. |
60
Table of Contents
| (15) | Previously filed as Exhibit 10.3 to Volterra Semiconductor Corporation’s Current Report on Form 8-K, as filed with the Securities and Exchange Commission on January 28, 2010, and incorporated by reference herein. |
| (16) | The certifications attached as Exhibits 32.1 and 32.2 accompany this Annual Report on Form 10-K pursuant to Section 906 of the Sarbanes-Oxley Act of 2002 and shall not be deemed “filed” by Volterra Semiconductor Corporation for purposes of Section 18 of the Securities Exchange Act of 1934, as amended. |
| (17) | Previously filed as Exhibit 10.5 to Volterra Semiconductor Corporation’s Annual Report on Form 10-K, as filed with the Securities and Exchange Commission on March 8, 2011, and incorporated by reference herein. |
| (18) | Previously filed as Exhibit 10.1 to Volterra Semiconductor Corporation’s Quarterly Report on Form 10-Q, as filed with the Securities and Exchange Commission on August 2, 2010, and incorporated by reference herein. |
| * | Indicates a management contract or compensatory plan or arrangement. |
| ** | Pursuant to Rule 406T of Regulation S-T, these interactive data files are deemed not filed or part of a registration statement or prospectus for purpose of Section 11 or 12 of the Securities Act of 1933 or Section 18 of the Securities Exchange Act of 1934 and otherwise are not subject to liability. |
| (b) | Exhibits |
| See Item 15(a) above. |
| (c) | Financial Statement Schedules |
See Item 15(a) above.
61
Table of Contents
Pursuant to the requirements of Section 13 or 15(d) of the Securities Exchange Act of 1934, the registrant has duly caused this report to be signed on its behalf by the undersigned, thereunto duly authorized.
| VOLTERRA SEMICONDUCTOR CORPORATION
| ||
| By: | /S/ JEFFREY STASZAK | |
| Jeffrey Staszak President and Chief Executive Officer | ||
Dated: March 6, 2012
62
Table of Contents
POWER OF ATTORNEY
KNOW ALL PERSONS BY THESE PRESENTS, that each person whose signature appears below constitutes and appoints Jeffrey Staszak and Mike Burns, and each of them, acting individually, as his attorney-in-fact, each with full power of substitution and resubstitution, for him and in his name, place and stead, in any and all capacities, to sign any and all amendments to this annual report on Form 10-K, and to file the same, with all exhibits thereto, and other documents in connection therewith, with the Securities and Exchange Commission, granting unto said attorneys-in-fact and agents, and each of them, full power and authority to do and perform each and every act and thing requisite and necessary to be done in connection therewith and about the premises, as fully to all intents and purposes as he might or could do in person, hereby ratifying and confirming all that said attorneys-in-fact and agents, or any of them, or their or his substitute or substitutes, may lawfully do or cause to be done by virtue hereof.
Pursuant to the requirements of the Securities Exchange Act of 1934, this report has been signed below by the following persons on behalf of the registrant and in the capacities and on the dates indicated.
| Signature |
Title |
Date | ||
| /s/ JEFFREY STASZAK Jeffrey Staszak |
President, Chief Executive Officer and Director (Principal Executive Officer) |
March 6, 2012 | ||
| /s/ MIKE BURNS Mike Burns |
Senior Vice President and Chief Financial Officer (Principal Financial and Accounting Officer) |
March 6, 2012 | ||
| /s/ FU-TAI LIOU Fu-Tai Liou |
Director | March 6, 2012 | ||
| /s/ CHRIS PAISLEY Chris Paisley |
Director |
March 6, 2012 | ||
| /s/ RALPH QUINSEY Ralph Quinsey |
Director | March 6, 2012 | ||
| /s/ JEFF RICHARDSON Jeff Richardson |
Director | March 6, 2012 | ||
| /s/ EDWARD ROSS Edward Ross |
Director | March 6, 2012 | ||
| /s/ STEPHEN SMITH Stephen Smith |
Director | March 6, 2012 | ||
63
Table of Contents
EXHIBIT INDEX
| Exhibit |
Description Of Documents | |
| 3.1(1) | Amended and Restated Certificate of Incorporation of Volterra Semiconductor Corporation. | |
| 3.2(2) | Amended and Restated Bylaws of Volterra Semiconductor Corporation. | |
| 4.1 | Reference is made to Exhibits 3.1 and 3.2. | |
| 4.2(3) | Specimen Stock Certificate. | |
| 10.1(3) | Amended and Restated Investor Rights Agreement, dated October 2, 2001, by and among the Registrant and certain holders of the Registrant’s securities. | |
| 10.2(3) | Amendment to Amended and Restated Investor Rights Agreement, dated January 17, 2002, by and among the Registrant and certain holders of the Registrant’s securities. | |
| 10.3(3)* | 1996 Stock Option Plan and forms of related agreements. | |
| 10.4(4)* | 2004 Equity Incentive Plan and forms of related agreements. | |
| 10.5(17)* | Amended and Restated 2004 Non-Employee Directors’ Stock Option Plan and form of related agreement. | |
| 10.6(5)* | 2004 Employee Stock Purchase Plan. | |
| 10.7(3)* | Form of Indemnity Agreement entered into between the Registrant and certain of its officers and directors. | |
| 10.8(3)* | Offer letter between the Registrant and Jeffrey Staszak, dated February 24, 1999. | |
| 10.9(3)* | Offer letter between the Registrant and William Numann, dated October 11, 2000. | |
| 10.10(6)* | Offer letter between the Registrant and Craig Teuscher, dated September 27, 1996. | |
| 10.11(7)* | Offer letter between the Registrant and Thomas Truman, dated August 25, 2004. | |
| 10.12(8)* | Offer letter between the Registrant and Mike Burns, dated August 5, 2007. | |
| 10.14(9) | Lease Agreement, dated May 9, 2007, and as amended, dated March 23, 2010, between ProLogis Limited Partnership — I and the Registrant (47451 Fremont Blvd.). | |
| 10.15(10) | Lease Agreement, dated May 9, 2007, and as amended, dated March 23, 2010, between ProLogis Limited Partnership — I and the Registrant (47467 Fremont Blvd.). | |
| 10.16(11)* | Management Bonus Plan (2011) | |
| 10.17(12)* | Management Bonus Plan (2012) | |
| 10.18(13)* | 2011 Non-Employee Director Compensation | |
| 10.19(13)* | 2011 Executive Officer Compensation | |
| 10.20(14)* | 2012 Executive Officer Compensation | |
| 10.21(15)* | Severance Benefit Plan | |
| 10.22(18)* | Equity Acceleration Policy for Non-Employee Directors | |
| 21.1 | Subsidiaries of the Registrant. | |
| 23.1 | Consent of KPMG LLP, Independent Registered Public Accounting Firm. | |
| 24.1 | Power of Attorney (included on the signature pages hereto). | |
| 31.1 | Certification of Chief Executive Officer required under Rule 13a-14(a) or Rule 15d-14(a) of the Securities Exchange Act of 1934, as amended. | |
| 31.2 | Certification of Chief Financial Officer required under Rule 13a-14(a) or Rule 15d-14(a) of the Securities Exchange Act of 1934, as amended. | |
| 32.1(16) | Certification of Chief Executive Officer required under Rule 13a-14(b) or Rule 15d-14(b) of the Securities Exchange Act of 1934, as amended, and 18 U.S.C. Section 1350. | |
| 32.2(16) | Certification of Chief Financial Officer required under Rule 13a-14(b) or Rule 15d-14(b) of the Securities Exchange Act of 1934, as amended, and 18 U.S.C. Section 1350. | |
| 101.INS** | XBRL Instance Document | |
| 101.SCH** | XBRL Taxonomy Extension Schema | |
| 101.CAL** | XBRL Taxonomy Extension Calculation Linkbase | |
| 101.DEF** | XBRL Taxonomy Extension Definition Linkbase | |
| 101.LAB** | XBRL Taxonomy Extension Label Linkbase | |
| 101.PRE** | XBRL Taxonomy Extension Presentation Linkbase |
| (1) | Previously filed as Exhibit 3.1 to Volterra Semiconductor Corporation’s Quarterly Report on Form 10-Q for the quarterly period ended June 30, 2004, as filed with the Securities and Exchange Commission on September 9, 2004, and incorporated by reference herein. |
64
Table of Contents
| (2) | Previously filed as Exhibit 3.2 to Volterra Semiconductor Corporation’s Quarterly Report on Form 10-Q for the quarterly period ended September 30, 2007, as filed with the Securities and Exchange Commission on November 1, 2007, and incorporated by reference herein. |
| (3) | Previously filed as the correspondingly numbered exhibit to Volterra Semiconductor Corporation’s Registration Statement on Form S-1 (No. 333-115614), as filed with the Securities and Exchange Commission on May 19, 2004, as amended, and incorporated by reference herein. |
| (4) | Previously filed as Exhibit 10.4 to Volterra Semiconductor Corporation’s Annual Report on Form 10-K, as filed with the Securities and Exchange Commission on March 1, 2005, and incorporated by reference herein. |
| (5) | Previously filed as the correspondingly numbered exhibit to Volterra Semiconductor Corporation’s Annual Report on Form 10-K, as filed with the Securities and Exchange Commission on March 8, 2007, and incorporated by reference herein. |
| (6) | Previously filed as Exhibit 10.12 to Volterra Semiconductor Corporation’s Registration Statement on Form S-1 (No. 333-115614), as filed with the Securities and Exchange Commission on May 19, 2004, as amended, and incorporated by reference herein. |
| (7) | Previously filed as Exhibit 10.11 to Volterra Semiconductor Corporation’s Annual Report on Form 10-K, as filed with the Securities and Exchange Commission on March 8, 2011, and incorporated by reference herein. |
| (8) | Previously filed as Exhibit 10.1 to Volterra Semiconductor Corporation’s Current Report on Form 8-K, as filed with the Securities and Exchange Commission on August 15, 2007, and incorporated by reference herein. |
| (9) | Previously filed as Exhibit 10.1 to Volterra Semiconductor Corporation’s Current Report on Form 8-K, as filed with the Securities and Exchange Commission on March 29, 2010, and incorporated by reference herein. |
| (10) | Previously filed as Exhibit 10.2 to Volterra Semiconductor Corporation’s Current Report on Form 8-K as filed with the Securities and Exchange Commission on March 29, 2010, and incorporated by reference herein. |
| (11) | Previously filed as Exhibit 10.2 to Volterra Semiconductor Corporation’s Current Report on Form 8-K, as filed with the Securities and Exchange Commission on January 27, 2011, and incorporated by reference herein. |
| (12) | Previously filed as Exhibit 10.2 to Volterra Semiconductor Corporation’s Current Report on Form 8-K, as filed with the Securities and Exchange Commission on January 25, 2012, and incorporated by reference herein. |
| (13) | Previously filed as Exhibit 10.1 to Volterra Semiconductor Corporation’s Current Report on Form 8-K, as filed with the Securities and Exchange Commission on January 27, 2011, and incorporated by reference herein. |
| (14) | Previously filed as Exhibit 10.1 to Volterra Semiconductor Corporation’s Current Report on Form 8-K, as filed with the Securities and Exchange Commission on January 25, 2012, and incorporated by reference herein. |
| (15) | Previously filed as Exhibit 10.3 to Volterra Semiconductor Corporation’s Current Report on Form 8-K, as filed with the Securities and Exchange Commission on January 28, 2010, and incorporated by reference herein. |
| (16) | The certifications attached as Exhibits 32.1 and 32.2 accompany this Annual Report on Form 10-K pursuant to Section 906 of the Sarbanes-Oxley Act of 2002 and shall not be deemed “filed” by Volterra Semiconductor Corporation for purposes of Section 18 of the Securities Exchange Act of 1934, as amended. |
65
Table of Contents
| (17) | Previously filed as Exhibit 10.5 to Volterra Semiconductor Corporation’s Annual Report on Form 10-K, as filed with the Securities and Exchange Commission on March 8, 2011, and incorporated by reference herein. |
| (18) | Previously filed as Exhibit 10.1 to Volterra Semiconductor Corporation’s Quarterly Report on Form 10-Q, as filed with the Securities and Exchange Commission on August 2, 2010, and incorporated by reference herein. |
| * | Indicates a management contract or compensatory plan or arrangement. |
| ** | Pursuant to Rule 406T of Regulation S-T, these interactive data files are deemed not filed or part of a registration statement or prospectus for purpose of Section 11 or 12 of the Securities Act of 1933 or Section 18 of the Securities Exchange Act of 1934 and otherwise are not subject to liability. |
66