Attached files
| file | filename |
|---|---|
| 8-K - 8-K - TRUE RELIGION APPAREL INC | a12-6478_18k.htm |
Exhibit 99.1
|
|
TRLG Investor Presentation March 2012 |
|
|
Safe Harbor Statement This presentation contains forward-looking statements within the meaning of the "safe harbor" provisions of the Private Securities Litigation Reform Act of 1995. These statements are based upon our current expectations and speak only as of the date hereof. Our actual results may differ materially and adversely from those expressed in any forward-looking statements as a result of various factors and uncertainties, including uncertainties as to the nature of the apparel industry, including changing customer demand and tastes, seasonality, customer acceptance of new products, the impact of competitive products and pricing, dependence on existing management and general economic conditions. Our Annual Report on Form 10-K, recent and forthcoming Quarterly Reports on Form 10-Q, recent Current Reports on Form 8-K, and other SEC filings discuss some of the important risk factors that may affect our business, results of operations and financial condition. The Company undertakes no obligation to revise or update publicly any forward-looking statements for any reason. 1 |

|
|
Founded in 2002 by Jeffrey Lubell and based in Los Angeles County Product-driven company with a mix consisting of premium jeans, sportswear and licensed merchandise for women, men and children Wholesale Distribution in premium accounts worldwide 125 stores as of December 31, 2011, including 16 international Company stores Company Overview $ in millions 2 Net Sales Recap EPS Recap $419.8 $363.7 $27.7 $103.2 $140.5 $173.3 $270.0 $311.0 2004 2005 2006 2007 2008 2009 2010 2011 $0.19 $0.81 $0.92 $1.16 $1.83 $1.92 $1.75 $1.80 2004 2005 2006 2007 2008 2009 2010 2011 |
|
|
3 Premium Denim Sportswear Trendsetting Denim Brand 83% Made in America |
|
|
Evolving Distribution Model Anchored by profitable Direct to Consumer model and premium wholesale Specialty account distribution U.S. retail expansion complementing presence in premium wholesale accounts U.S. store base increased to 109 stores at 12/31/11 from 70 stores at 12/31/09 Diverse merchandise assortment and diversity among retailers help avoid sales cannibalization and channel conflict 4 2011 Segment Mix Net sales – $419.8 million 2010 Segment Mix Net sales – $363.7 million U.S. Wholesale 20 % International 19% U.S. Consumer Direct 60 % Core Services 1 % U.S. Consumer Direct 52 % U.S. Wholesale 29 % International 18 %
|
|
|
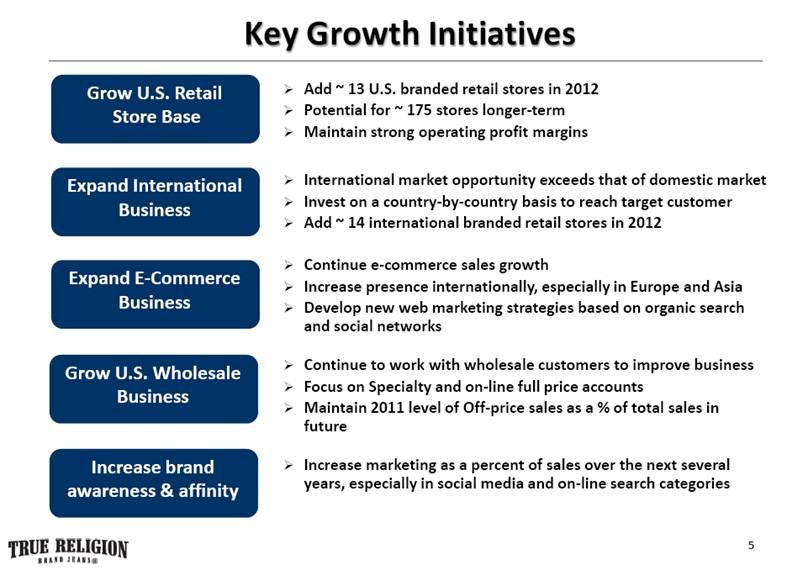
Key Growth Initiatives Expand International Business 5 Grow U.S. Retail Store Base Grow U.S. Wholesale Business Expand E-Commerce Business Increase brand awareness & affinity Add ~ 13 U.S. branded retail stores in 2012 Potential for ~ 175 stores longer-term Maintain strong operating profit margins International market opportunity exceeds that of domestic market Invest on a country-by-country basis to reach target customer Add ~ 14 international branded retail stores in 2012 Continue to work with wholesale customers to improve business Focus on Specialty and on-line full price accounts Maintain 2011 level of Off-price sales as a % of total sales in future Continue e-commerce sales growth Increase presence internationally, especially in Europe and Asia Develop new web marketing strategies based on organic search and social networks Increase marketing as a percent of sales over the next several years, especially in social media and on-line search categories |
|
|
Proven Ability to Manage Rapid Growth in Retail Store Base 6 Number of U.S. retail stores Direct to Consumer Operating Margin Annual Consumer Direct Net Sales ($’s in millions) $5.5 $29.3 $75.3 $129.0 $189.1 $251.3 4 15 42 70 94 109 2006 2007 2008 2009 2010 2011 43.8% 40.6% 36.9% 34.7% 34.2% 35.2% 2006 2007 2008 2009 2010 2011 |
|
|
7 Strong Brand Portability |
|
|
Compelling New U. S. Store Economics 8 Showcase for complete brand assortment Upholds full-price integrity Opportunity to increase the store base from 109 stores to ~ 175 Targeting new store openings in existing and new markets, in premium malls with existing wholesale presence at Majors Leveraging strong financial position to secure locations in top-performing U.S. centers at attractive lease rates Maintain full-price to outlet store ratio of 3:1 Plan to add ~ 13 new U.S. stores in 2012 Target Store Size (sq. ft.) ~ 1,500 Avg. CAPEX per store ~ $500,000 Avg. Inventory at Cost ~ $200,000 - $250,000 4-wall operating margin 30%+ Targeted return of cash is under 2 years Retail Growth Strategy Sportswear as a % of Consumer Direct Sales 24 % 26.1 % 28.3 % 30.9 % 2008 2009 2010 2011 New Store Targets
|
|
|
Recent Developments – U.S. Direct to Consumer Nets sales increased 32.9% in 2011 Opened 16 stores in 2011, reaching 109 stores at December 31, 2011 Same store sales (including e-commerce) increased 10.9% in 2011 and 9.6% 2010 Increased conversion and units per transaction in 2011 Improvements in planning, buying and allocating are leading the same store sales increase 9 |
|
|
U.S. Wholesale Update Sales decreased $18.6 million from ‘10 to ’11, driven by $10.0 million decrease in off-price sales Completed planned reduction in sales to the Off-price channel to place greater emphasis on regular price wholesale sales and preserve premium denim brand position Sales in the Specialty channel, including on-line accounts, increased for the seventh consecutive quarter Sales of Men’s merchandise to four largest Major accounts increased in ‘11 vs. ‘10 Key initiatives include: Leveraging retail floor space management skills with Major accounts Building shop-in-shops in key Major doors Most importantly, expanding our Specialty Account base: Currently ship to approximately 600 Specialty doors; potential of approximately >1,000 doors in this channel Sales growth from on-line accounts which focus on basic styles 10 |
|
|
International Growth Strategy Present merchandise in premium wholesale accounts and TRBJ branded retail stores. Multiple avenues for growth – Country-specific factors are key Create company-owned subsidiary to develop wholesale and retail trade (e.g. U.K.) Establish joint ventures in select markets with established premium-brand companies (e.g. Germany) Enter distributor relationships for wholesale and retail presentation in markets that have local knowledge requirements (e.g. China, Singapore) Upgrade distributor relationships where brand can grow via more established distributor’s capital or marketing expertise (e.g. Spain) Add distributors in new markets (e.g. Russia and India) In 2010 and 2011: Established regional management teams based in Hong Kong, Switzerland and Vernon to support distributors, coordinate brand building, and direct future investments (e.g. JV’s, franchises) Goal is to increase International sales as a % of total sales from 19% in 2011 to >30% over time, with operating profit increasing 11 |
|
|
Recent Developments – International Asia Pacific Established distribution Agreement for Hong Kong/Greater China – one store open Korea market is undergoing transition to premium position New leadership will be joining in 1H 2012 Europe, Middle East, Africa (EMEA) Opened 4 retail stores in German territory in 2011 Opened 4 retail stores in UK in 2011 New Milan showroom supports wholesale sales agents in Italy and region’s distributors (e.g. Spain, Middle East) Took over UK wholesale distribution in July, opened showroom in London Americas Opened 2 stores in Canada (Vaughan, Ontario and Calgary, Alberta) in 1H 2011 Overall International stores’ 4-wall operating margin is approximately 1/3 below U.S. target Improved merchandising and select Sportswear additions are planned for 2012 14 New TRBJ branded stores outside the U.S. are planned for 2012 12 |
|
|
Financial Overview |
|
|
2011 Financial Summary Year Ended December 31, 2011 Increase / 2011 2010 (decrease) Sales $419.8 $363.7 15.4% U.S. Consumer Direct U.S. Wholesale International 251.3 86.3 79.0 189.1 104.9 64.4 32.9% (17.7)% 22.5% Gross Profit $271.8 $230.0 18.2% Gross Margin 64.8% 63.2% +160 bps Operating Profit $74.6 $69.9 6.7% Operating Margin 17.8% 19.2% -140 bps EPS $1.80 $1.75 2.9% Adjusted Operating Margin 18.4% 20.5% -210bps Adjusted EPS $1.88 $1.87 0.5% ($’s in millions) 14 |
|
|
Financial Position Balance Sheet showing continued improvement across the board ($’s in millions) December 31, 2010 Cash & Equivalents $200.4 $153.8 A/R $24.0 $27.9 Inventory $53.3 $41.7 Current Liabilities $40.9 $31.4 Debt Stockholders’ Equity $299.8 $249.0 Cash per share $8.06 $6.28 15 December 31, 2011 |

|
|
2011 Financial Call-outs Net sales to Off-price accounts in 2010 were $10 million greater than the sales to those accounts in 2011 Sales to this channel were reduced to support long-term brand value Those additional sales contributed approximately $5 million of operating profit in 2010 and 70 bps of operating margin Licensing revenue was $2 million greater in 2010 than in 2011 Royalties decreased because we partnered with a licensee to reposition their merchandise into a higher, brand-appropriate category The additional licensing revenue in 2010 contributed $1 million to operating profit and 50 bps to operating margin 16 |
|
|
2012 Guidance Net sales: $450 million to $460 million EPS: $1.88 to $1.95, based on 25.2 millions shares o/s and tax rate of 38.1% Key assumptions: Net Sales – increase of $30 million to $40 million US Consumer direct up mid-teens due to 13 new stores in 2012, the full year impact of 16 stores opened in 2011, and same-store sales growth of 3 to 5 percent US Wholesale down 10% to 12%, driven by i) Majors’ women’s and ii)Specialty accounts closed due to diverting International up mid-teens based on 14 new stores in 2012 and the full year impact of 10 stores opened in 2011, offset by Korea sales decrease of $5 million SG&A – increase of $25 million to $27 million Driven by new retail stores and additional marketing, design/product development and HQ occupancy costs 17 |

|
|
Long-Term Net Sales Growth Drivers Growth in U.S. Direct to Consumer driven by increase in targeted store count from 15 at 2007 year end to approximately 121 by year end 2012 U.S. wholesale business is keyed on trendsetting merchandise and sales directed toward accounts that cater to fashionable consumers International growth driven by: Dedicated sales involvement in established markets (e.g. U.K., Germany) Opening branded retail stores in Canada, U.K. and Germany Established four international showrooms in the past 18 months to support wholesale sales growth Expanded presence in new or low volume markets via established distributors 18 |